Embed Size (px)
Citation preview

RESEARCH PAPER 5/2017
Entrepreneurship Dynamics in Australia: Lessons from Micro-data
Sasan Bakhtiari
December 2017
Abstract Using a large firm-level dataset covering the years 2002 to 2015, I explore the dynamics of entrepreneurship in Australia and their evolution over time. The short answer is that the Australian entrepreneurial landscape has become less dynamic and more hazardous over the observed period. With time passing, relatively fewer entrepreneurs are entering the market, and those that enter are more likely to exit than their counterparts that entered in earlier years. In particular, there is a seemingly permanent increase in exit probability starting from the cohort of 2005 entries, followed by a temporary spike after the Global Financial Crisis (GFC). Despite fewer firms entering, the share of young firms from job creation has been steadily high. I finish by offering a few thoughts to help understand these changes.
JEL Codes: C55, L26, M13, Q33 Keywords: Entrepreneurship, Survival, Job Creation, Competition, Growth.

For further information on this research paper please contact:
Sasan Bakhtiari Industry and Firm Analysis Department of Industry, Innovation and Science
GPO Box 9839 Canberra ACT 2601
Phone: +61 2 9397 1639 Email: [email protected]
Disclaimer The views expressed in this report are those of the author(s) and do not necessarily reflect those of the Australian Government or the Department of Industry, Innovation and Science.
Commonwealth of Australia 2017.
This work is copyright. Apart from use under Copyright Act 1968, no part may be reproduced or altered by any process without prior written permission from the Australian Government. Requests and inquiries concerning reproduction and rights should be addressed to [email protected]. For more information on Office of the Chief Economist research papers please access the Department’s website at: www.industry.gov.au/OCE
Creative Commons Licence
With the exception of the Coat of Arms, this publication is licensed under a Creative Commons Attribution 3.0 Australia Licence.
Creative Commons Attribution 3.0 Australia Licence is a standard form license agreement that allows you to copy, distribute, transmit and adapt this publication provided that you attribute the work. A summary of the licence terms is available from http://creativecommons.org/licenses/by/3.0/au/deed.en. The full licence terms are available from http://creativecommons.org/licenses/by/3.0/au/legalcode.
The Commonwealth’s preference is that you attribute this publication (and any material sourced from it) using the following wording:
Source: Licensed from the Commonwealth of Australia under a Creative Commons Attribution 3.0 Australia Licence. The Commonwealth of Australia does not necessarily endorse the content of this publication.
Entrepreneurship Dynamics in Australia: Lessons from Micro-data 1
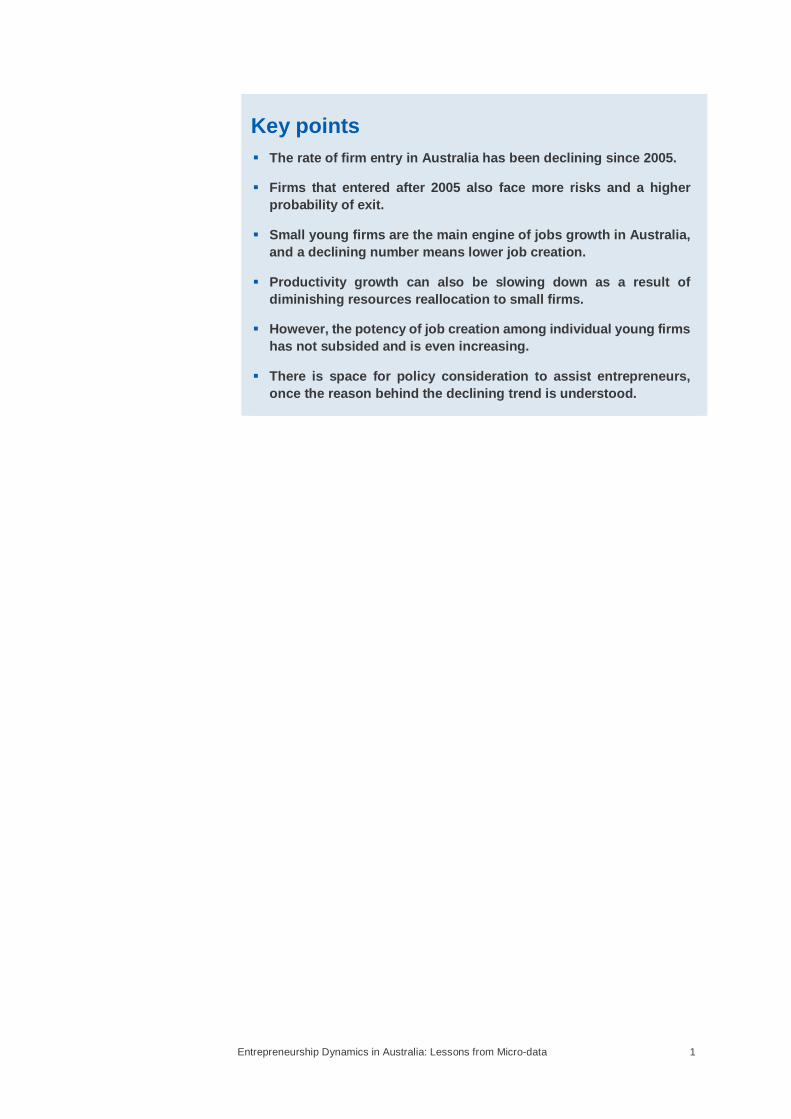
Key points The rate of firm entry in Australia has been declining since 2005.
Firms that entered after 2005 also face more risks and a higher probability of exit.
Small young firms are the main engine of jobs growth in Australia, and a declining number means lower job creation.
Productivity growth can also be slowing down as a result of diminishing resources reallocation to small firms.
However, the potency of job creation among individual young firms has not subsided and is even increasing.
There is space for policy consideration to assist entrepreneurs, once the reason behind the declining trend is understood.
Entrepreneurship Dynamics in Australia: Lessons from Micro-data 2
1. Introduction The common wisdom is that entrepreneurship and entry of new firms into the market are important drivers of job creation and long-term economic growth. In an economy with a constant influx of new firms, young firms that are more productive and more innovative are bound to grow fast and to create jobs. In turn, these firms intensify competition and displace less competitive incumbents in a process often referred to as creative destruction. New firms are also agents of economic flexibility by embodying the latest needs or even the future needs of the populace. Using this advantage, they can reshape the markets and replace firms that are unable or slow to adjust. An economy with high entrepreneurial dynamics, hence, tends to be more progressive and better adaptable.
Yet, the US economy has recently come under the spotlight for displaying a secular decline in the rate of entry of young firms as well as a diminishing share of job creation by young firms that has been going on for decades (Decker et al., 2014, 2016a). One implication of falling entrepreneurial dynamics is a slowdown in productivity-enhancing resource reallocation, in turn, a drop in productivity growth (Decker et al., 2016b). There are also repercussions for job creation, competition, and innovation. According to the Organisation for Economic Co-operation and Development (OECD), not all its member countries have had a similar experience; although entrepreneurship is on the decline in many industrial countries (OECD, 2016).
In this study, I investigate a few indicators of dynamism among Australian entrepreneurs and their time trends in a bid to highlight any long-term implications for the economy. To do so, I benefit from the newly available Business Longitudinal Analysis Data Environment (BLADE) from the Australian Bureau of Statistics (ABS). The data is arguably the largest source of information on Australian firms and covers all firms reporting for Goods and Services Tax (GST) from the fiscal year 2002 to (currently) 2015.1 The data offer a comprehensive platform to study economy-wide statistics that require building up from micro-level evidence.
Using these data, I construct measures of entry, exit and job creation and destruction as indicators of dynamism and vitality among entrepreneurs. For each measure, I first draw on different general statistics to characterise Australian entrepreneurs. The information provides the necessary background to discuss the observed trends in their right context. I then proceed to investigate the movements of these measures over time to the extent allowed by the data.
The general statistics establish that entrepreneurial experience in Australia is not that different from the experience in other countries. A large number of entrepreneurs fail early. Those that survive, however, grow fast and create
1 In Australia, fiscal years are from the first of July to the end of June the following year. Hence, the
fiscal year 2002 indicates the 2001–02 period. In the remainder, all years are fiscal years unless noted otherwise.
Entrepreneurship Dynamics in Australia: Lessons from Micro-data 3
jobs. Remarkably, four out of every five jobs added to the Australian economy has been traditionally created by a small young firm. The labour reallocation implied by this dynamic suggests a non-trivial impact from small firms on the productivity growth. There is also a general shift in entrepreneurship away from manufacturing and towards services, as is the case in most industrialised countries.
The changes in entrepreneurial dynamics over time, however, suggest deterioration. Fewer entrepreneurs are entering, and those that enter are increasingly likely to fail and exit. The trend is shared among almost all industries and sectors. The important exception is the mining sector, where survival chances for young firms actually improves.
Net job creation in Australia is also suffering as a result of this downturn, entrepreneurs being the engine of jobs growth. The slower reallocation of resources towards young firms could be contributing to the observed deterioration in Australian productivity growth the same way Decker et al. (2016b) find in the US. Granting all this, there is ground for optimism as the share of entrepreneurs from job creation has not subsided. Despite their lower numbers, entrepreneurs that enter are still as enthusiastic to create jobs as they used to be.
I finish by offering my thoughts on a few possible reasons behind the observed trends. On top of my list stands the impact of the resources boom, with the mining sector as the only industry to show immunity to the rising risks. I also discuss the merits of considering increasing lending costs, globalisation, changing demographics, and increasingly centralised industries as the other potential causes.
I start by describing the BLADE as the source of data in the next section and clarify my definitions of entry, exit and entrepreneurship in Section 3. In Sections 4 to 6, I study in details three measures of dynamism amongst entrepreneurs, namely, entry rate, survival probability, and job creation and destruction. In each case, I show how entrepreneurs in Australia are characterised and how that characterization has changed over time. Section 7 discusses some relevant thoughts. Section 8 concludes the paper.
2. BLADE The Business Longitudinal Analysis Data Environment or BLADE is a new firm-level data environment in the ABS that provides operational and financial information on Australian firms and enterprises. The database is in fact a collection of multiple firm-level data sourced from the ABS and the Australian Taxation Office (ATO). The core section of the data is the amalgamation of Business Income Tax (BIT) data, Business Activity Statement (BAS), and Pay-As-You-Go (PAYG) data. A series of surveys conducted by the ABS, such as the Business Characteristic Survey and the Business Expenditure on R&D, are also available as supplements to the core body.2
2 See ABS Cat.No.8171.0 for full details.
Entrepreneurship Dynamics in Australia: Lessons from Micro-data 4
The core part of the data covers the universe of all the Australian Business Numbers (ABNs) registered for GST purposes at some point in time. The variables cover information such as itemised income and expenditure as well as employment, wages, asset holdings and some financial obligations. Full-time equivalent employment (FTE) is modelled and added to the data from a combination of wages reported in PAYG and BAS and ancillary data sources. For this study, I only use the reported Australia and New Zealand Standard Industry Classification (ANZSIC), FTE, and turnover.
Data in the BLADE are available on an annual basis, where years are fiscal and not calendar years. Currently, the years for which the data is available is from 2002 to 2015. There are more than 48 million firm–year observations available in the dataset for these years, of which about 22 million firm–years pertain to newly formed firms. At the time of this study, the PAYG reports for the year 2015 are not added to the BLADE, therefore, employment information is missing for the last year of the data.
The ABS links different components of the BLADE through their ABN. However, the unit of observation in the BLADE is the Type of Activity Unit (TAU). The ABS defines TAU as “a producing unit comprising one or more legal entities, sub-entities or branches of a legal entity that can report productive and employment activities via a minimum set of data items” (ABS Cat.No.1292.0).
In most cases, the difference is only distinguishable among larger firms with diverse lines of activity. The subsidiaries in these firms often report taxes as part of a GST or a consolidated tax group in the form of one aggregated operation, even though each subsidiary appears a stand-alone firm owing to its nature of operation. Think of a holding company controlling firms A, B and C (possibly operating in different industries) and filing one consolidated tax report for the whole operation. The ABS decouples the operation of each seemingly independent firm (e.g. A or B) or each part of the operation within a certain industry (e.g. retail, construction, or mining) using their employment shares and according to their unique TAU assignment.
Note that for small firms and firms with simple corporate structures (the majority of firms), the TAU and ABN often have a one-to-one relationship. For firms with more complex corporate structures, it is possible that some TAUs correspond to one or multiple ABNs. In these cases, it is also possible that a one-to-one correspondence between TAUs and ABNs is missing altogether when, for instance, the operation of an ABN is shared by various TAUs.3
TAUs are consistent over time. TAUs are also consistent in the industry that they represent. In the remainder, I primarily use TAUs to track firms longitudinally.
I also notice that a large number of observations in the BLADE do not report employment. Most of the analysis in this paper does not depend on employment, but measures of job creation and job destruction will be affected. I will deal with the missing employments as follows: A substantial number of 3 In the version of the BLADE available for research, the ABN and the name of firms are censored
to mask the exact identity of firms. Duplicate identifiers for TAU are generated with one-to-one correspondences to further protect confidentiality.
Entrepreneurship Dynamics in Australia: Lessons from Micro-data 5
firms with missing employment are actually non-employers and do not have to report. The fix is applied where the firm reports zero wages.
For cases where non-zero wages are reported, I proceed as such: I notice that when I estimate a linear regression of log of employment on the log of wages, and industry and year controls, the R2 of the fit is 0.895. I then impute employment using this model where wage but not employment is reported, knowing that the imputation noise is going to be small.
With these fixes, there is still a sizable number of firms that report neither employment nor wages. A number of these firms seem to be non-employers or inactive (reporting zero turnover). To get more accurate employment counts, I compute the propensity that employment is known (including the imputed ones) by estimating the probability as a Probit function of the log of turnover, whether the firm is new, and year and industry controls. I then use the inverse of these propensities as weights in computing the employment-related statistics.
As a test that these weights are reliable, I compute the total annual FTE using the weights and compare the result to employment numbers reported by the ABS (Cat.No.6202.01). The weighted aggregate FTE from the BLADE is about 9.6 million in each year, whereas the ABS reports about 11 million employed persons annually of which about 3.5 million are part-time workers. Converting the part-time employment to full-time equivalent makes the numbers from the two sources comparable.
3. Measuring Entrepreneurship, Entry and Exit
Measuring entrepreneurship has certain challenges both in terms of a conceptual definition and data availability. Schoar (2010), in particular, makes distinction between subsistence and transformative entrepreneurs, as they respond differently to policies and business cycles. The former are those that enter the market to provide themselves — and maybe a few others — jobs and subsistence incomes. The latter are those that end up transforming markets and generating numerous jobs for others.
Her argument is mostly focused on the emerging economies, however, the descriptions resonate well with the Australian economy. Australia has been traditionally home to a large number of small and non-employing businesses often dubbed as mom-and-pop shops; entry of such firms conforms to the subsistence type of entrepreneurship. On the other hand, one occasionally hears about major success stories of Australian entrepreneurs, which surely means the country is not devoid of transformative entrepreneurs.
On the measurement side, the main obstacle is that most administrative datasets do not have explicit indicators of entrepreneurship, not the least whether the entrepreneur is of subsistence or transformative type. In the BLADE, I will rely on the first ever appearance of a TAU — excluding year 2002 which is the first year — as the indicator of entrepreneurship. The last ever appearance of a firm within the observed window of years — excluding year 2015 which is the last year — is considered an exit. I will make some inferences
Entrepreneurship Dynamics in Australia: Lessons from Micro-data 6
along the way using the growth rate and the industry of firms as clues as to whether the entrepreneur is acting in a subsistence or transformative capacity.
A few considerations are in order to improve the quality of identified entries and better associate them with entrepreneurship. First, some firms show time gaps in their longitudinal links. Some have been inactive for a few years. There are also cases of missing data. I do not consider these re-entries as new entrepreneurs.
Second, entries and exits in Financial Asset Investing (ANZSIC 6240) and Superannuation Funds (ANZSIC 6330) have very little to do with entrepreneurship and failure. They are mostly the result of investments maturing and being repackaged and reinvested. As a proof, more than 90 per cent of firms in each subdivision would qualify as a new or young firm. I do not classify any firm in these subdivisions as entries or young firms. To get the employment counts right, I still include them as ‘incumbents’.
Third, new firms can appear for reasons other than entrepreneurship. For instance, establishment of phoenix companies,4 a change of ownership or split in the ownership of a firm can spawn spurious entries. The BLADE does not provide any longitudinal link between these ‘new’ firms and their past existing identity. The suspicious cases are those new firms with more than a hundred or even thousands of employees in their first year, albeit the possibility that these firms might be super-apt entrepreneurs. On the positive side, the number of new firms with FTEs larger than 100 in their first year constitutes only about 0.05 per cent of all entries. Their relatively tiny number means that their classification either way will not have any statistical impact on most of the findings. I will, however, exclude them when discussing job creation and job destruction as they will dominate the numbers. In these cases, I only focus on small young firms.
Fourth, there are cases where the ABS identifies a firm as part of a larger company upon entry. These firms could be a new establishment of an already existing firm or a case of an acquisition/merger. Since the two types cannot be distinguished, I do not classify any of these firms as entries. The number of these cases is also tiny (0.17 per cent of all entries) and will have no statistical effect on most of the results. The absence of acquisitions and mergers from entries also means that in the remainder exits are mainly a sign of business failure.
Figure 3.1 illustrates the annual count of new entries defined above and incumbent firms. Only firms with non-zero turnover during a year (active firms) are shown in the figure. In this picture, all firms that are one year of age or older are classified as incumbents, considering that age zero is the year of entry.
4 By Australian Securities and Investments Commission’s description an “illegal phoenix activity
involves the intentional transfer of assets from an indebted company to a new company to avoid paying creditors, tax or employee entitlements.” More details can be found at http://www.asic.gov.au.
Entrepreneurship Dynamics in Australia: Lessons from Micro-data 7
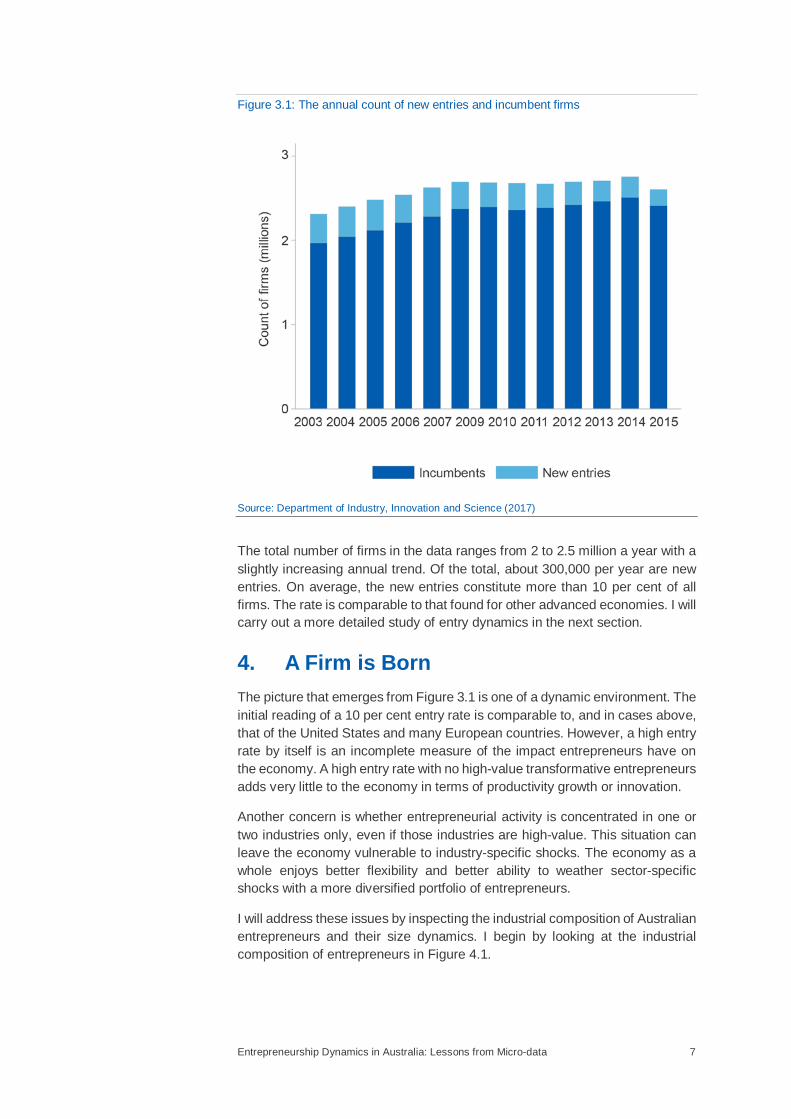
Figure 3.1: The annual count of new entries and incumbent firms
Source: Department of Industry, Innovation and Science (2017)
The total number of firms in the data ranges from 2 to 2.5 million a year with a slightly increasing annual trend. Of the total, about 300,000 per year are new entries. On average, the new entries constitute more than 10 per cent of all firms. The rate is comparable to that found for other advanced economies. I will carry out a more detailed study of entry dynamics in the next section.
4. A Firm is Born The picture that emerges from Figure 3.1 is one of a dynamic environment. The initial reading of a 10 per cent entry rate is comparable to, and in cases above, that of the United States and many European countries. However, a high entry rate by itself is an incomplete measure of the impact entrepreneurs have on the economy. A high entry rate with no high-value transformative entrepreneurs adds very little to the economy in terms of productivity growth or innovation.
Another concern is whether entrepreneurial activity is concentrated in one or two industries only, even if those industries are high-value. This situation can leave the economy vulnerable to industry-specific shocks. The economy as a whole enjoys better flexibility and better ability to weather sector-specific shocks with a more diversified portfolio of entrepreneurs.
I will address these issues by inspecting the industrial composition of Australian entrepreneurs and their size dynamics. I begin by looking at the industrial composition of entrepreneurs in Figure 4.1.
Entrepreneurship Dynamics in Australia: Lessons from Micro-data 8
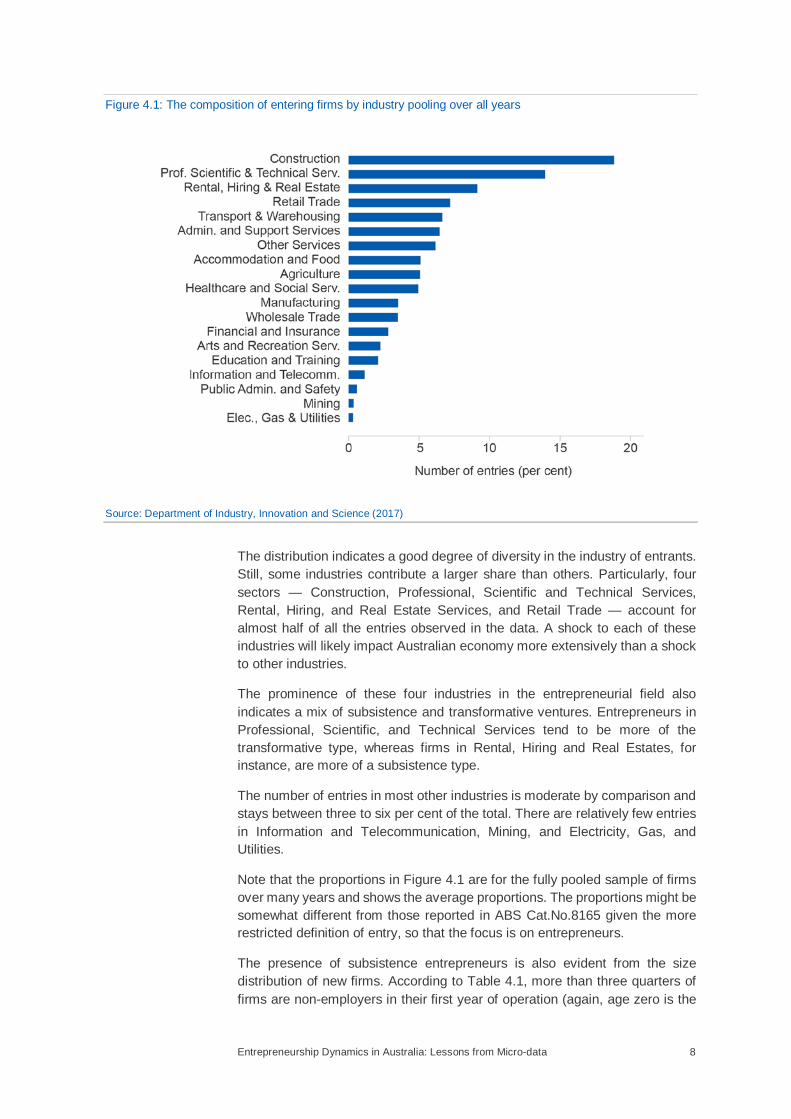
Figure 4.1: The composition of entering firms by industry pooling over all years
Source: Department of Industry, Innovation and Science (2017)
The distribution indicates a good degree of diversity in the industry of entrants. Still, some industries contribute a larger share than others. Particularly, four sectors — Construction, Professional, Scientific and Technical Services, Rental, Hiring, and Real Estate Services, and Retail Trade — account for almost half of all the entries observed in the data. A shock to each of these industries will likely impact Australian economy more extensively than a shock to other industries.
The prominence of these four industries in the entrepreneurial field also indicates a mix of subsistence and transformative ventures. Entrepreneurs in Professional, Scientific, and Technical Services tend to be more of the transformative type, whereas firms in Rental, Hiring and Real Estates, for instance, are more of a subsistence type.
The number of entries in most other industries is moderate by comparison and stays between three to six per cent of the total. There are relatively few entries in Information and Telecommunication, Mining, and Electricity, Gas, and Utilities.
Note that the proportions in Figure 4.1 are for the fully pooled sample of firms over many years and shows the average proportions. The proportions might be somewhat different from those reported in ABS Cat.No.8165 given the more restricted definition of entry, so that the focus is on entrepreneurs.
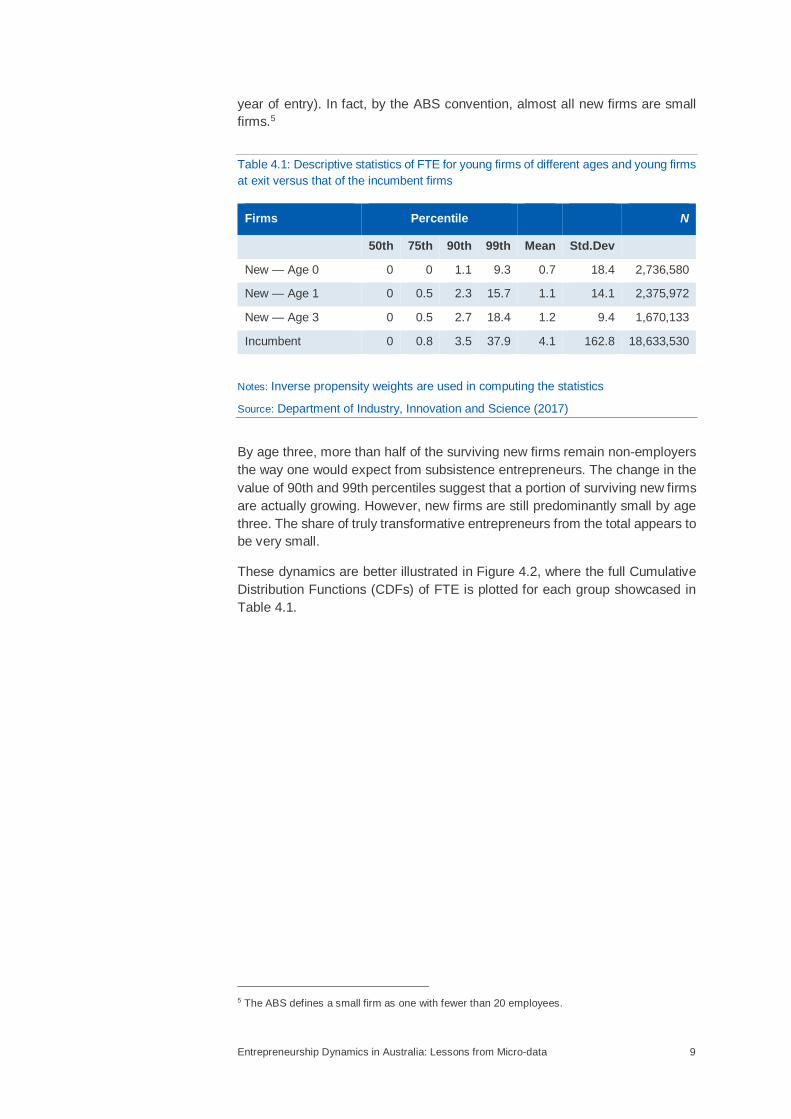
The presence of subsistence entrepreneurs is also evident from the size distribution of new firms. According to Table 4.1, more than three quarters of firms are non-employers in their first year of operation (again, age zero is the
Entrepreneurship Dynamics in Australia: Lessons from Micro-data 9
year of entry). In fact, by the ABS convention, almost all new firms are small firms.5
Table 4.1: Descriptive statistics of FTE for young firms of different ages and young firms at exit versus that of the incumbent firms
Firms Percentile N
50th 75th 90th 99th Mean Std.Dev
New — Age 0 0 0 1.1 9.3 0.7 18.4 2,736,580
New — Age 1 0 0.5 2.3 15.7 1.1 14.1 2,375,972
New — Age 3 0 0.5 2.7 18.4 1.2 9.4 1,670,133
Incumbent 0 0.8 3.5 37.9 4.1 162.8 18,633,530
Notes: Inverse propensity weights are used in computing the statistics
Source: Department of Industry, Innovation and Science (2017)
By age three, more than half of the surviving new firms remain non-employers the way one would expect from subsistence entrepreneurs. The change in the value of 90th and 99th percentiles suggest that a portion of surviving new firms are actually growing. However, new firms are still predominantly small by age three. The share of truly transformative entrepreneurs from the total appears to be very small.
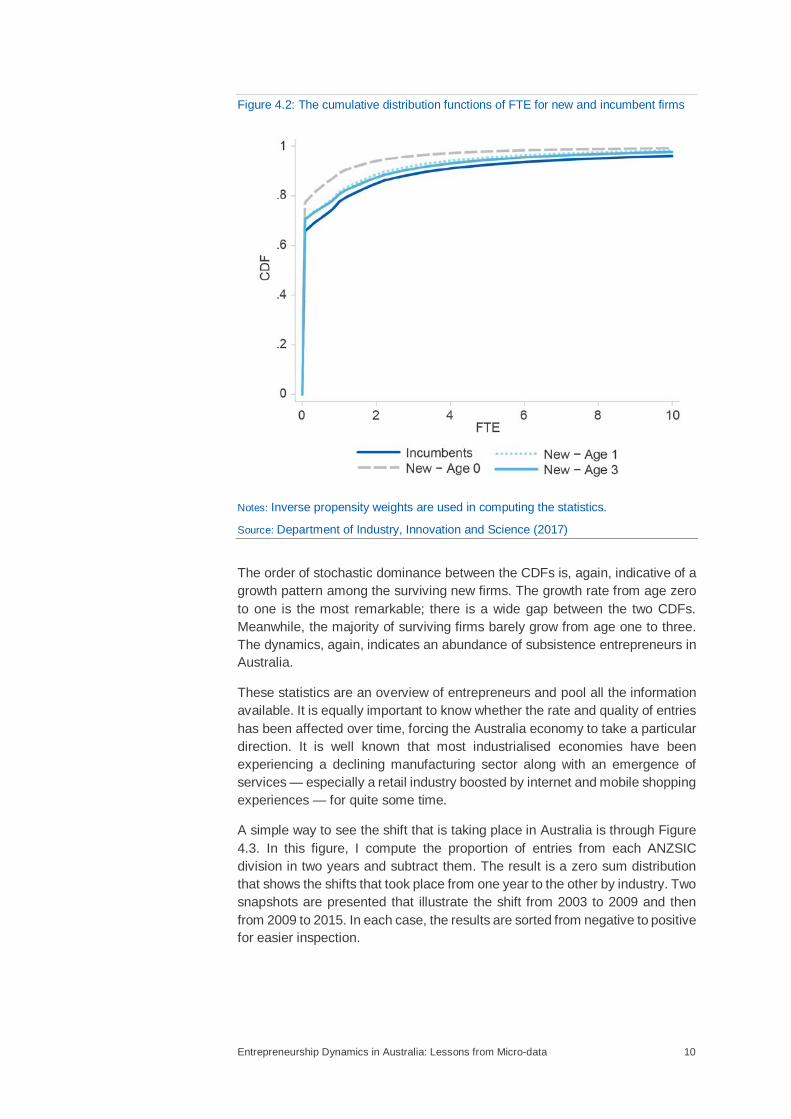
These dynamics are better illustrated in Figure 4.2, where the full Cumulative Distribution Functions (CDFs) of FTE is plotted for each group showcased in Table 4.1.
5 The ABS defines a small firm as one with fewer than 20 employees.
Entrepreneurship Dynamics in Australia: Lessons from Micro-data 10
Figure 4.2: The cumulative distribution functions of FTE for new and incumbent firms
Notes: Inverse propensity weights are used in computing the statistics.
Source: Department of Industry, Innovation and Science (2017)
The order of stochastic dominance between the CDFs is, again, indicative of a growth pattern among the surviving new firms. The growth rate from age zero to one is the most remarkable; there is a wide gap between the two CDFs. Meanwhile, the majority of surviving firms barely grow from age one to three. The dynamics, again, indicates an abundance of subsistence entrepreneurs in Australia.
These statistics are an overview of entrepreneurs and pool all the information available. It is equally important to know whether the rate and quality of entries has been affected over time, forcing the Australia economy to take a particular direction. It is well known that most industrialised economies have been experiencing a declining manufacturing sector along with an emergence of services — especially a retail industry boosted by internet and mobile shopping experiences — for quite some time.
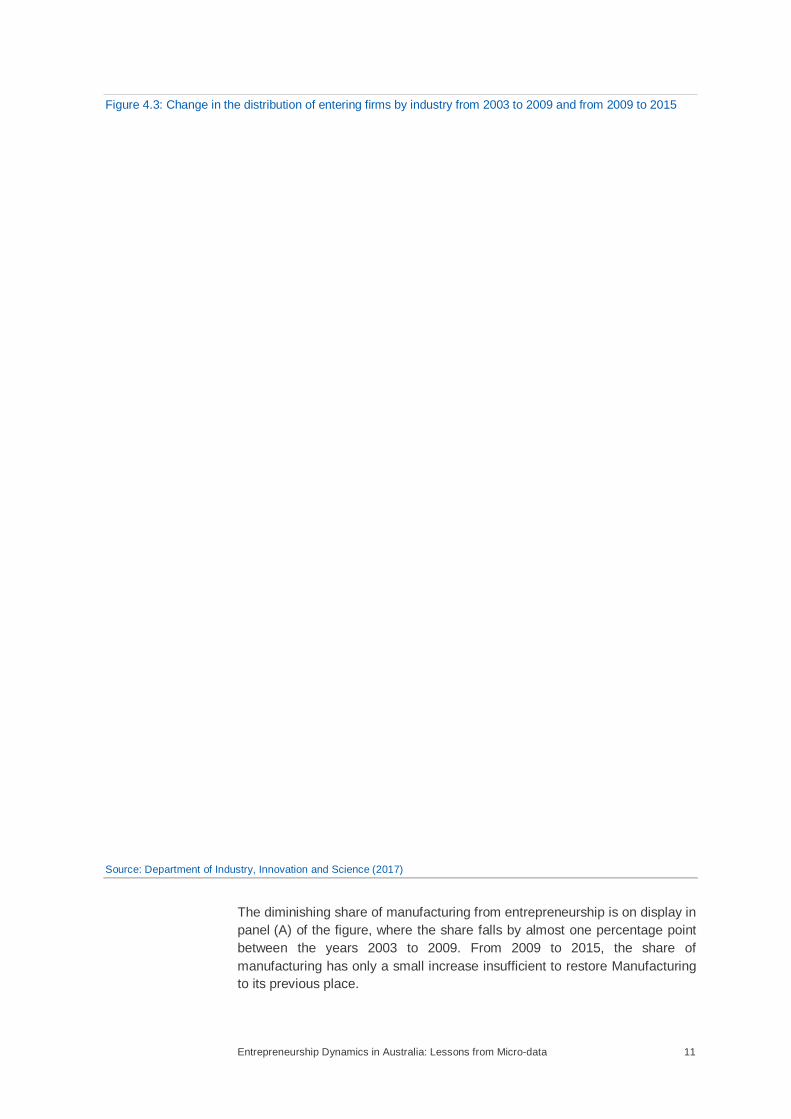
A simple way to see the shift that is taking place in Australia is through Figure 4.3. In this figure, I compute the proportion of entries from each ANZSIC division in two years and subtract them. The result is a zero sum distribution that shows the shifts that took place from one year to the other by industry. Two snapshots are presented that illustrate the shift from 2003 to 2009 and then from 2009 to 2015. In each case, the results are sorted from negative to positive for easier inspection.
Entrepreneurship Dynamics in Australia: Lessons from Micro-data 11
Figure 4.3: Change in the distribution of entering firms by industry from 2003 to 2009 and from 2009 to 2015
Source: Department of Industry, Innovation and Science (2017)
The diminishing share of manufacturing from entrepreneurship is on display in panel (A) of the figure, where the share falls by almost one percentage point between the years 2003 to 2009. From 2009 to 2015, the share of manufacturing has only a small increase insufficient to restore Manufacturing to its previous place.
Entrepreneurship Dynamics in Australia: Lessons from Micro-data 12
As expected, most of the industries with an increasing share of entrepreneurs are services. The increase in the shares of Healthcare and Social Services, and Accommodation and Food Services are more nuanced; both sectors have constantly increased their share of entrepreneurs over the full period stretching from 2003 to 2015. Each industry has increased its share of entrepreneurs by almost two percentage points during these years.
Professional, Scientific and Technical Services is associated with advanced technology and transformative entrepreneurs. This sector has especially experienced a rise of about 1.6 percentage points in its share of entrepreneurship in the course of 2009 to 2015. Its share stays almost unchanged between 2003 and 2009.
The other notable case is Rental, Hiring and Real Estate. The share of this sector was on the decline between 2003 and 2009. However, during the 2009 to 2015 period, the sector reverses direction and recovers all the share lost to other industries. This revival is likely brought by the real estate boom that took place during the later years in the data.
All in all, there is a general shift in entrepreneurship towards services and away from manufacturing. These shifts have been the hallmark of most advanced economies during the past two decades. The type of services in Australia that are being favoured at each point in time, however, varies and seems to be driven by temporal economic forces and the cycles of industrial boom and bust.
In tandem, another movement has been taking place. Figure 4.4 tracks the annual entry rate of new firms in Australia. The annual rate is simply the number of new firms that enter during the year divided by the total number of firms that are operational during that year (including the surviving new firms from the previous years). Only firms with non-zero turnover during a year (active firms) are used. The ABS reported entry rates are also shown (ABS Cat.No.8165.0). The rates computed from the BLADE are generally lower than those reported by the ABS mainly owing to the more restricted definition of entry and entrepreneurship applied in this paper (see Section 3). However, the movements are by and large in parallel.
For cross-country comparison, I am showing the annual entry rates from the United States (US) and the United Kingdom (UK) alongside that of Australia in panel (A). In panel (B), I show similar trends from Canada and New Zealand as two economies with better affinity to Australia in terms of size and composition.

Entrepreneurship Dynamics in Australia: Lessons from Micro-data 13
Figure 4.4: The annual entry rate of firms
Source: ABS BLADE and ABS Cat.No.8165 (Australia), Census Bureau’s Business Dynamics Statistics (US), and Office of
National Statistics’ Business Demography (UK), MacDonald (2014) and Statistics Canada’s CATSIM Table 527-0001
(Canada), Statistics New Zealand’s Business Demography Statistics (New Zealand).
Entrepreneurship Dynamics in Australia: Lessons from Micro-data 14
The data from the BLADE portents that the rate of entrepreneurs entering in Australia looks rather flat before 2005 but started declining from 2005. In 2005, Australia has an entry rate of 15 per cent, a rate that on its face is comparable to those from the other countries showcased.
By 2015, the entry rate in Australia sinks to about nine per cent, a drop of almost 40 per cent. The entry rate has also been falling in the US over the same period. However, the fall in Australia is much steeper by comparison. In contrast to both the US and Australia, the entry rate in the UK has stayed strong and only had a temporary slump during the GFC.
The entry rate in Canada is by comparison stable and only shows a slight drop over the period, though it has gone through a longer-term decline since 1983 (MacDonald, 2014). In New Zealand, one observes a trend similar to that of Australia. However, the drop practically comes to an end in 2010, while the entry rate in Australia keeps falling past this year. New Zealand experiences an upturn in the entry rate after 2012.
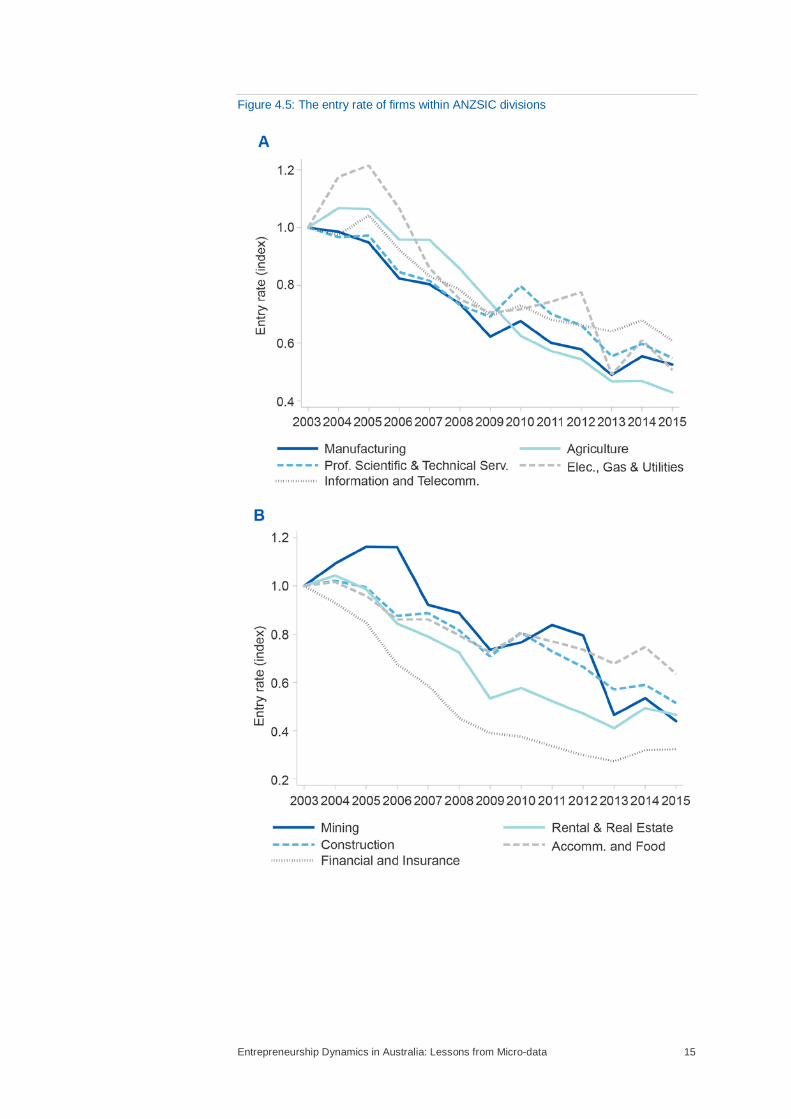
In view of this evidence, one immediately wonders whether sector-specific movements are behind this trend. This notion is strengthened by the observations made in Figure 4.3. This hypothesis can be quickly refuted by noticing that the trend is shared by all industries. This pattern can be observed in Figure 4.5 where the entry rate for each ANZSIC division is plotted individually. The entry rates in 2003 are normalised to one for all divisions, so that the emphasis is on the change in the rates rather than on the levels.
Entrepreneurship Dynamics in Australia: Lessons from Micro-data 15
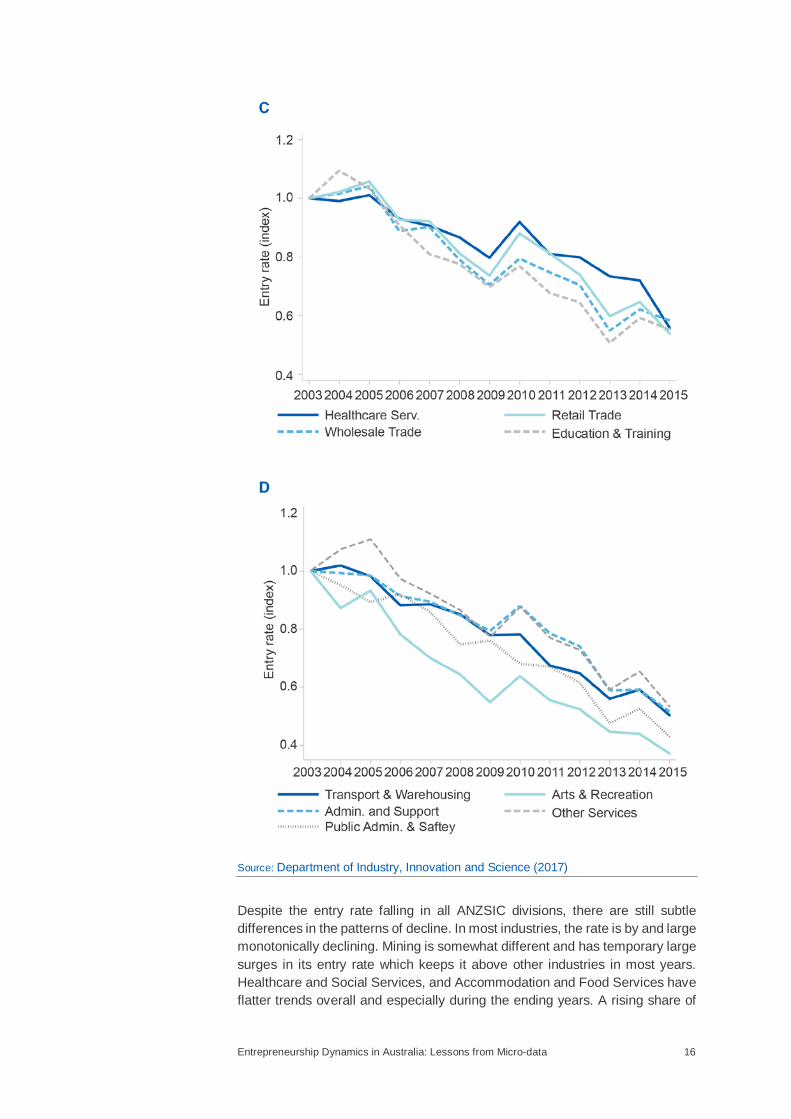
Figure 4.5: The entry rate of firms within ANZSIC divisions
Entrepreneurship Dynamics in Australia: Lessons from Micro-data 16
Source: Department of Industry, Innovation and Science (2017)
Despite the entry rate falling in all ANZSIC divisions, there are still subtle differences in the patterns of decline. In most industries, the rate is by and large monotonically declining. Mining is somewhat different and has temporary large surges in its entry rate which keeps it above other industries in most years. Healthcare and Social Services, and Accommodation and Food Services have flatter trends overall and especially during the ending years. A rising share of
Entrepreneurship Dynamics in Australia: Lessons from Micro-data 17
entrepreneurship in these two industries explains their stronger performance (Figure 4.3).
5. Survival and Exit For entrepreneurs to have an impact on the economy, the mere entry of firms is not the decisive factor; a fair share of them need to survive and grow. Rampant failure not only diminishes the impact of entrepreneurs but also dissuades potential entrepreneurs from entering the market in the first place.
Having said that, it is quite natural to expect a large number of new and very young firms to fail. This phenomenon is attributed to entrepreneurs not being able to accurately evaluate their own productivity or profitability prior to entry and realizing it only after all the entry costs are sunk (see Foster et al., 2008, for instance).
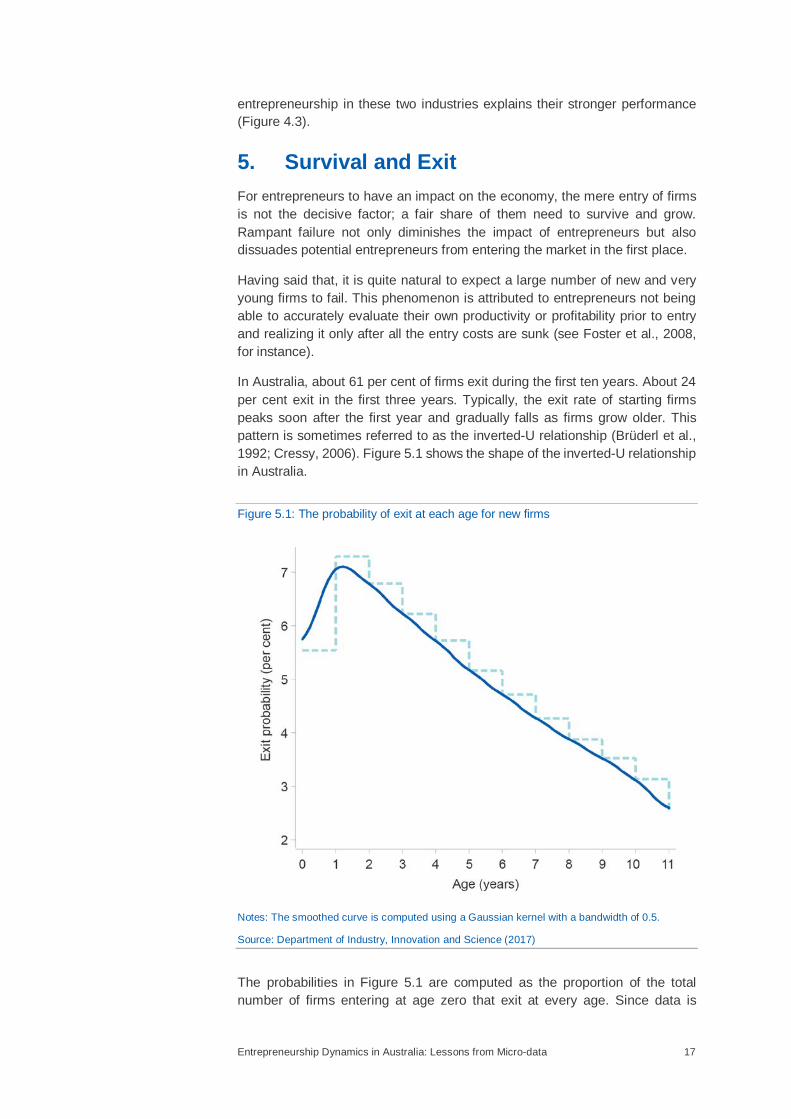
In Australia, about 61 per cent of firms exit during the first ten years. About 24 per cent exit in the first three years. Typically, the exit rate of starting firms peaks soon after the first year and gradually falls as firms grow older. This pattern is sometimes referred to as the inverted-U relationship (Brüderl et al., 1992; Cressy, 2006). Figure 5.1 shows the shape of the inverted-U relationship in Australia.
Figure 5.1: The probability of exit at each age for new firms
Notes: The smoothed curve is computed using a Gaussian kernel with a bandwidth of 0.5.
Source: Department of Industry, Innovation and Science (2017)
The probabilities in Figure 5.1 are computed as the proportion of the total number of firms entering at age zero that exit at every age. Since data is
Entrepreneurship Dynamics in Australia: Lessons from Micro-data 18
truncated at the year 2015, firms entering in later years cannot be observed at older ages. To be consistent, at each age I aggregate only over the cohorts that entered early enough to be observed at that age.
The exit probability reaches its peak of 7.3 per cent at the age of one. The probability gradually but constantly drops afterwards. By age ten, the probability is slightly more than three per cent. At this stage, a large fraction of new firms have already left the market.
The size distribution of firms that exit is a further sign that these exits are the result of failure. Table 5.1 evinces a lack of growth among new firms that eventually exit. More than 90 per cent of new and young firms that exit are non-employers. The rest are very small even compared to the age-zero firms.
Table 5.1: Descriptive statistics of FTE for young firms at ages zero and one and for exiting young firms
Firms Percentile N
50th 75th 90th 99th Mean Std.Dev
New — Exits 0 0 0 3.6 0.4 12.7 497,344
New — Age 0 0 0 1.1 9.3 0.7 18.4 2,736,580
New — Age 1 0 0.5 2.3 15.7 1.1 14.1 2,375,972
Notes: Inverse propensity weights are used in computing the statistics.
Source: Department of Industry, Innovation and Science (2017)
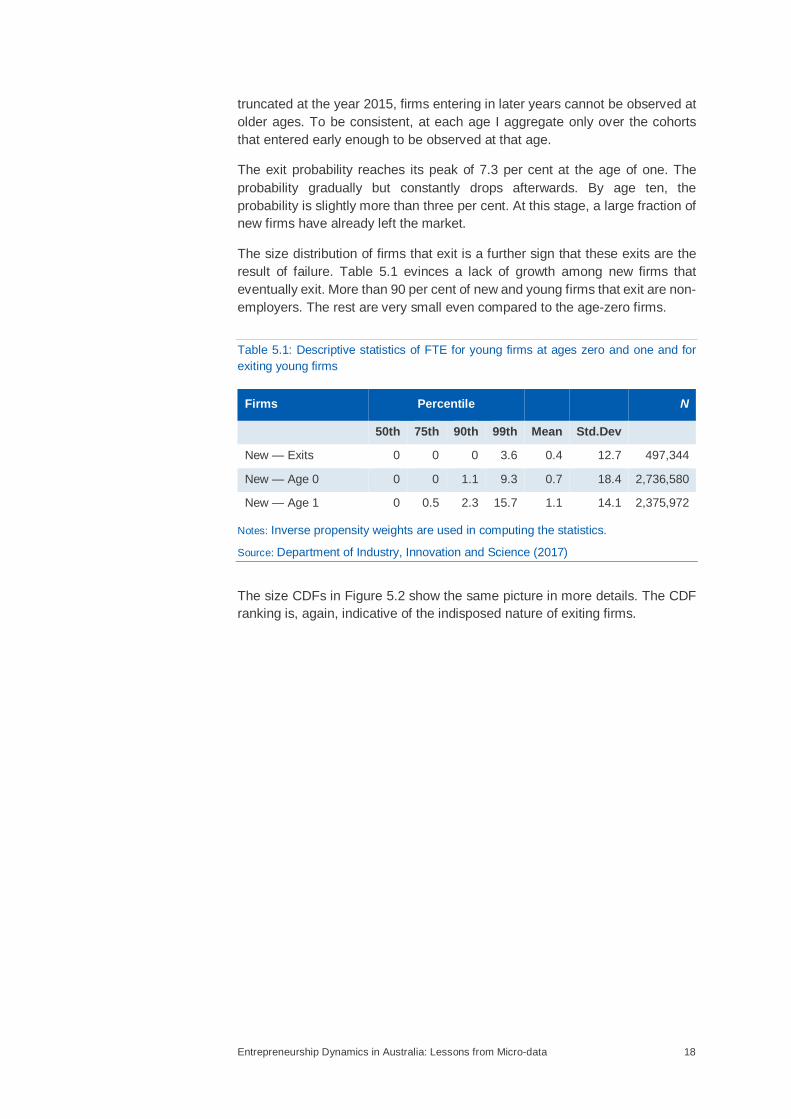
The size CDFs in Figure 5.2 show the same picture in more details. The CDF ranking is, again, indicative of the indisposed nature of exiting firms.
Entrepreneurship Dynamics in Australia: Lessons from Micro-data 19
Figure 5.2: The cumulative distribution functions of FTE for surviving and exiting young firms
Notes: Inverse propensity weights are used in computing the statistics.
Source: Department of Industry, Innovation and Science (2017)
The inverted-U relationship in Figure 5.1 underlines the pivotal role early stage conditions play in the survival of entrepreneurs. Any rise in risk levels will especially jeopardise early stage entrepreneurs and lead to a surge in their exits. Conversely, monitoring exit probabilities in the early ages provides clues about changes in the underlying level of risks.
I will explore the time evolution of these dynamics by comparing cohorts of entrepreneurs. A cohort in this context consists of all firms that start in a certain year. Classifying firms by cohort allows me to study firms in groups where the type, level and duration of risks that individuals in the group are exposed to is by and large homogenised. Some heterogeneity in risk exposure still persists within the cohort in case, for instance, risks are industry-specific.
For a first impression, I compare the survival probabilities of a few cohorts using the Kaplan & Meier (1958) survival functions. The survival function in this case is the probability that a firm belonging to a certain cohort survives beyond a certain age. Empirically, the survival function for cohort c at age T is estimated as
(1)
In the above, Fc(T) is the CDF at age T, and NcT and Xc
T are the numbers of operational and exiting firms at age T, respectively. Note that, owing to the data
Entrepreneurship Dynamics in Australia: Lessons from Micro-data 20
being truncated at the year 2015, survival function for cohort c can only be estimated up to the age of 2015−c.
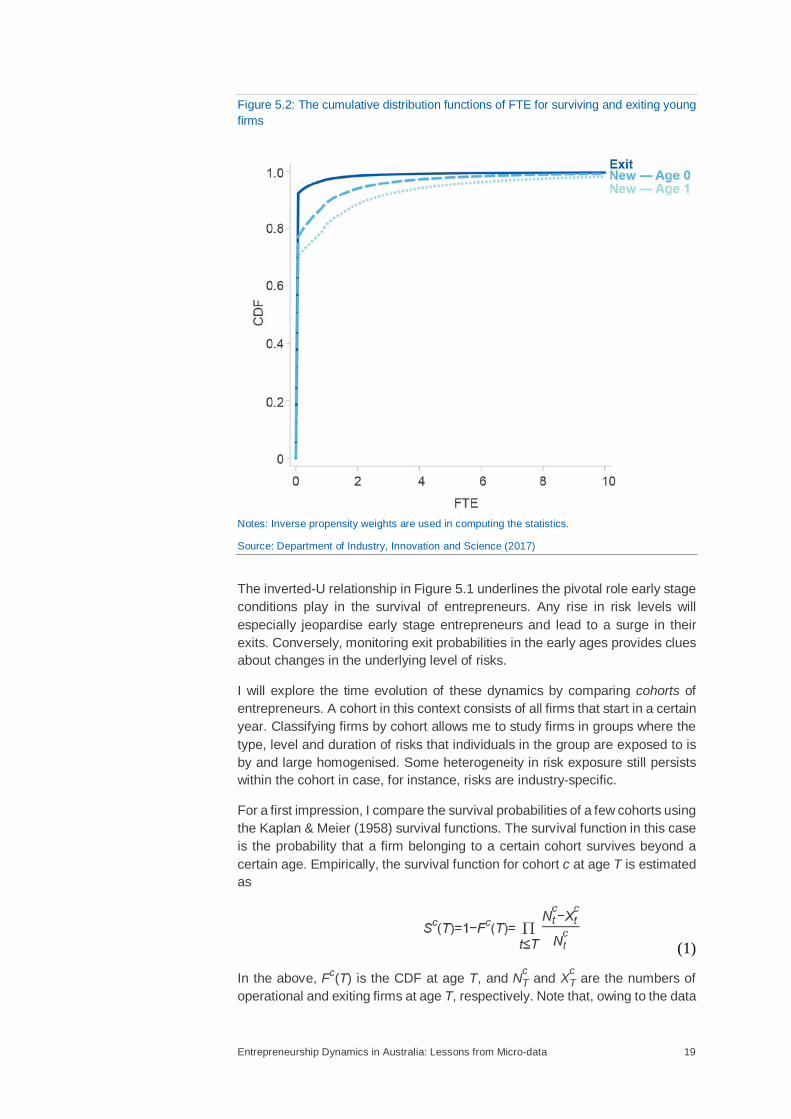
The estimates for the three cohorts of 2003, 2007, and 2011 are shown in Figure 5.3. The first two cohorts reflect the pre-GFC change in risks, whereas the cohorts 2007 and 2011 signify the post-GFC changes in risk. The equal time intervals between the two periods makes the comparison more consistent.
Figure 5.3: Kaplan-Meier survival function estimates for entering firms of cohorts 2003, 2007 and 2011
Source: Department of Industry, Innovation and Science (2017)
The survival functions exhibit a distinct ranking. Specifically, the function for each cohort falls below that of the earlier cohorts. This ranking implies that firms that entered in 2003 have had better chances of survival than those firms that entered in 2007 at every observed age. In turn, firms that enter in 2007 also have had better chances of surviving than those entering in 2011 at every observed age. In each case, the drop in the survival function is statistically significant as tested by the log-rank test of equality (Table 5.2).
Table 5.2: The log-rank test of equality for the survival functions of different cohorts
Test Cohort 2003 to 2007 Cohort 2007 to 2011
Log-Rank χ2 467.4 274.3
p-value [0.000] [0.000]
Source: Department of Industry, Innovation and Science (2017)
Entrepreneurship Dynamics in Australia: Lessons from Micro-data 21
The drop in the survival function from 2007 to 2011 looks especially steep and signals a major deterioration during the course of 2007 to 2011. This period overlaps with the aftermath of the GFC, and the deterioration is quite likely caused by the financial stress that followed.
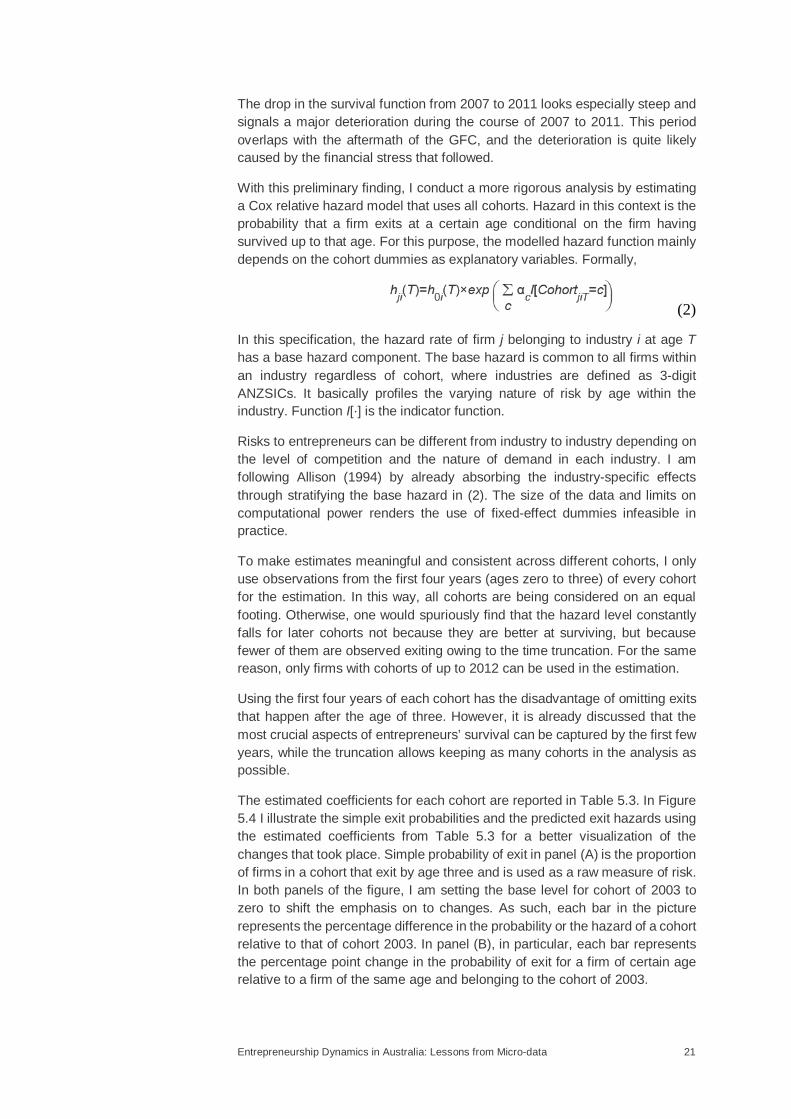
With this preliminary finding, I conduct a more rigorous analysis by estimating a Cox relative hazard model that uses all cohorts. Hazard in this context is the probability that a firm exits at a certain age conditional on the firm having survived up to that age. For this purpose, the modelled hazard function mainly depends on the cohort dummies as explanatory variables. Formally,
(2)
In this specification, the hazard rate of firm j belonging to industry i at age T has a base hazard component. The base hazard is common to all firms within an industry regardless of cohort, where industries are defined as 3-digit ANZSICs. It basically profiles the varying nature of risk by age within the industry. Function I[⋅] is the indicator function.
Risks to entrepreneurs can be different from industry to industry depending on the level of competition and the nature of demand in each industry. I am following Allison (1994) by already absorbing the industry-specific effects through stratifying the base hazard in (2). The size of the data and limits on computational power renders the use of fixed-effect dummies infeasible in practice.
To make estimates meaningful and consistent across different cohorts, I only use observations from the first four years (ages zero to three) of every cohort for the estimation. In this way, all cohorts are being considered on an equal footing. Otherwise, one would spuriously find that the hazard level constantly falls for later cohorts not because they are better at surviving, but because fewer of them are observed exiting owing to the time truncation. For the same reason, only firms with cohorts of up to 2012 can be used in the estimation.
Using the first four years of each cohort has the disadvantage of omitting exits that happen after the age of three. However, it is already discussed that the most crucial aspects of entrepreneurs’ survival can be captured by the first few years, while the truncation allows keeping as many cohorts in the analysis as possible.
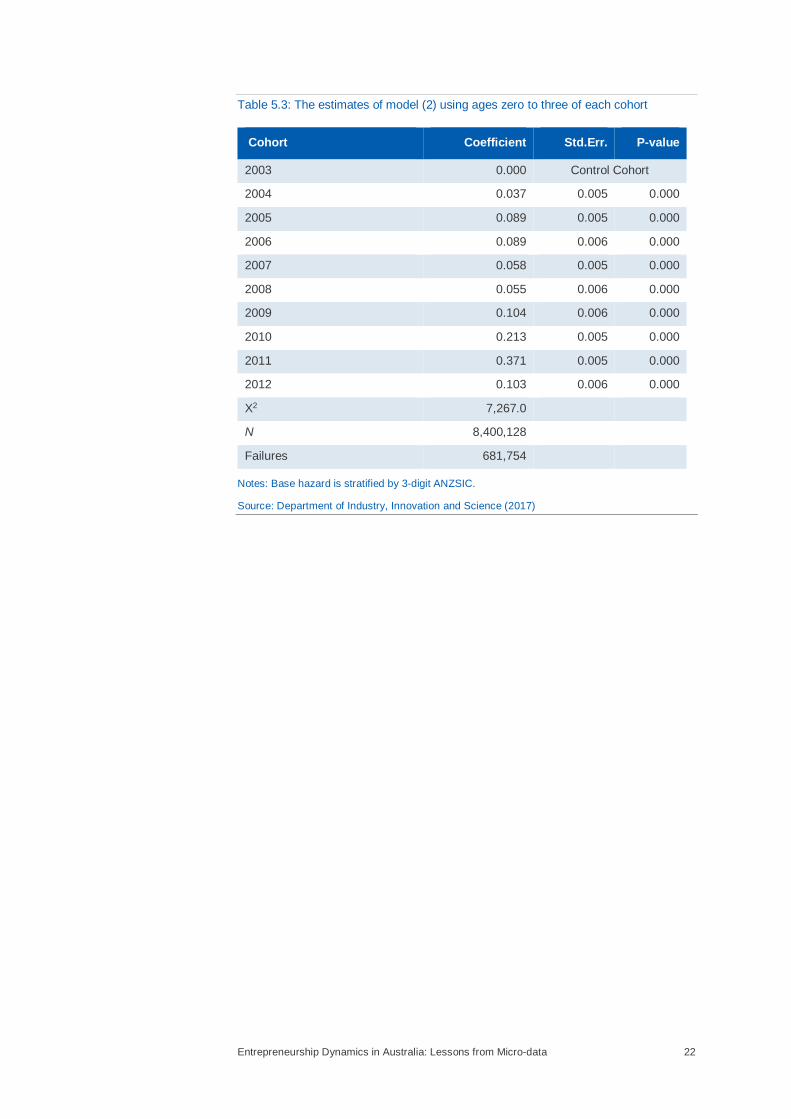
The estimated coefficients for each cohort are reported in Table 5.3. In Figure 5.4 I illustrate the simple exit probabilities and the predicted exit hazards using the estimated coefficients from Table 5.3 for a better visualization of the changes that took place. Simple probability of exit in panel (A) is the proportion of firms in a cohort that exit by age three and is used as a raw measure of risk. In both panels of the figure, I am setting the base level for cohort of 2003 to zero to shift the emphasis on to changes. As such, each bar in the picture represents the percentage difference in the probability or the hazard of a cohort relative to that of cohort 2003. In panel (B), in particular, each bar represents the percentage point change in the probability of exit for a firm of certain age relative to a firm of the same age and belonging to the cohort of 2003.
Entrepreneurship Dynamics in Australia: Lessons from Micro-data 22
Table 5.3: The estimates of model (2) using ages zero to three of each cohort
Cohort Coefficient Std.Err. P-value
2003 0.000 Control Cohort
2004 0.037 0.005 0.000
2005 0.089 0.005 0.000
2006 0.089 0.006 0.000
2007 0.058 0.005 0.000
2008 0.055 0.006 0.000
2009 0.104 0.006 0.000
2010 0.213 0.005 0.000
2011 0.371 0.005 0.000
2012 0.103 0.006 0.000
X2 7,267.0
N 8,400,128
Failures 681,754
Notes: Base hazard is stratified by 3-digit ANZSIC.
Source: Department of Industry, Innovation and Science (2017)
Entrepreneurship Dynamics in Australia: Lessons from Micro-data 23
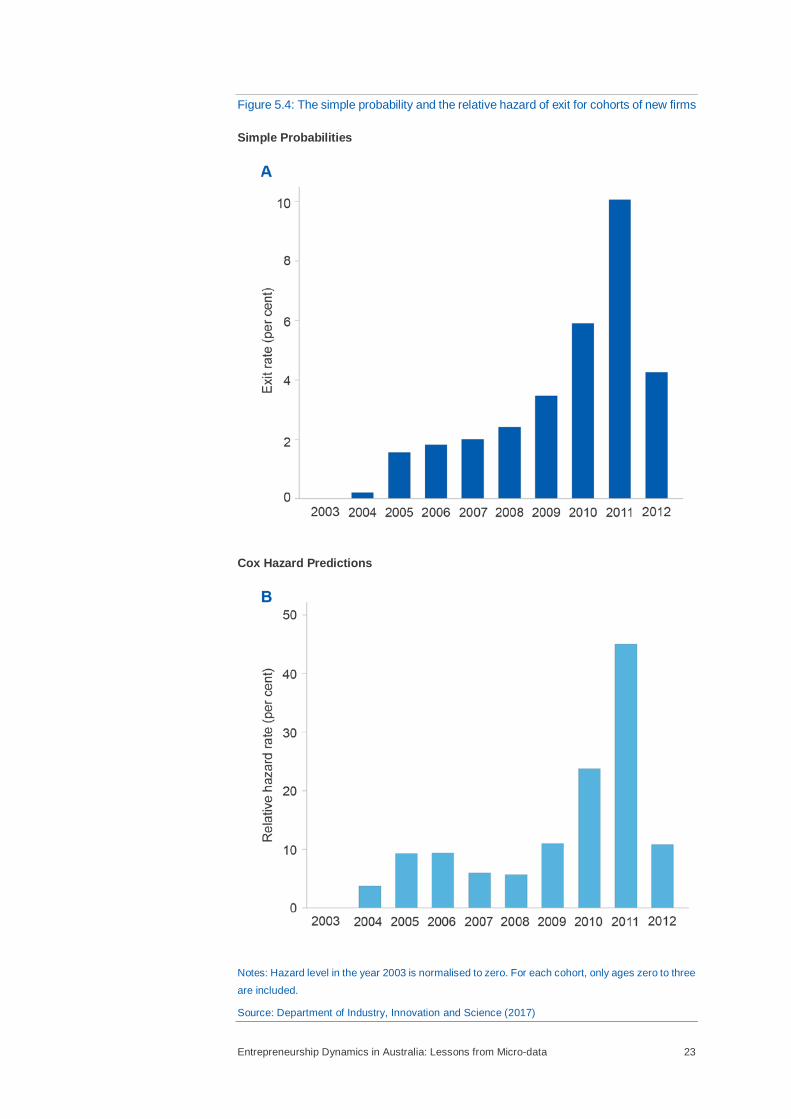
Figure 5.4: The simple probability and the relative hazard of exit for cohorts of new firms
Simple Probabilities
Cox Hazard Predictions
Notes: Hazard level in the year 2003 is normalised to zero. For each cohort, only ages zero to three
are included.
Source: Department of Industry, Innovation and Science (2017)
Entrepreneurship Dynamics in Australia: Lessons from Micro-data 24
There is a correlation between the probabilities and hazard rates shown in Figure 5.4.
Nevertheless, the hazard rates are a more accurate measure of risk, having controlled for age and industry effects. In particular, there are three main features regarding the changing hazard levels. First, there has been a substantial and rather permanent increase in the hazard level of exit starting with the cohort of 2005. This increase in hazard sustains to the extent observed by the available years. At the onset, the hazard level jumps by about 10 percentage points for the cohort of 2005 relative to the cohort of 2003 and never reverts to the levels observed for the cohorts before 2005.
Second, there is a dramatic increase in hazard levels for the cohorts entering between 2009 and 2011. The hazard level reaches a peak for the cohort from 2011. This cohort experiences about 50 percentage point rise in the hazard level of exit relative to the cohort from 2003 and about 40 percentage point increase in the hazard level relative to the cohorts from 2005 and 2006.
Third, the latter jump in hazard rate appears temporary. For the cohort from 2012, the hazard level drops and gets closer to the longer-term trend.
Even after associating the temporary rise in hazard levels that took place from 2009 and 2011 to the GFC and factoring it out, one is still confronted with a permanent increase in hazard level that is in the order of five to 10 percentage point higher than that of the cohort from 2003. In view of Figure 4.3, it is again judicious to ask whether the change in risk is driven by sector-specific shifts in entrepreneurship. For one thing, the use of industry-specific base hazards in (2) absorbs most of the industry effect and greatly mitigates the influence of sector-related factors.
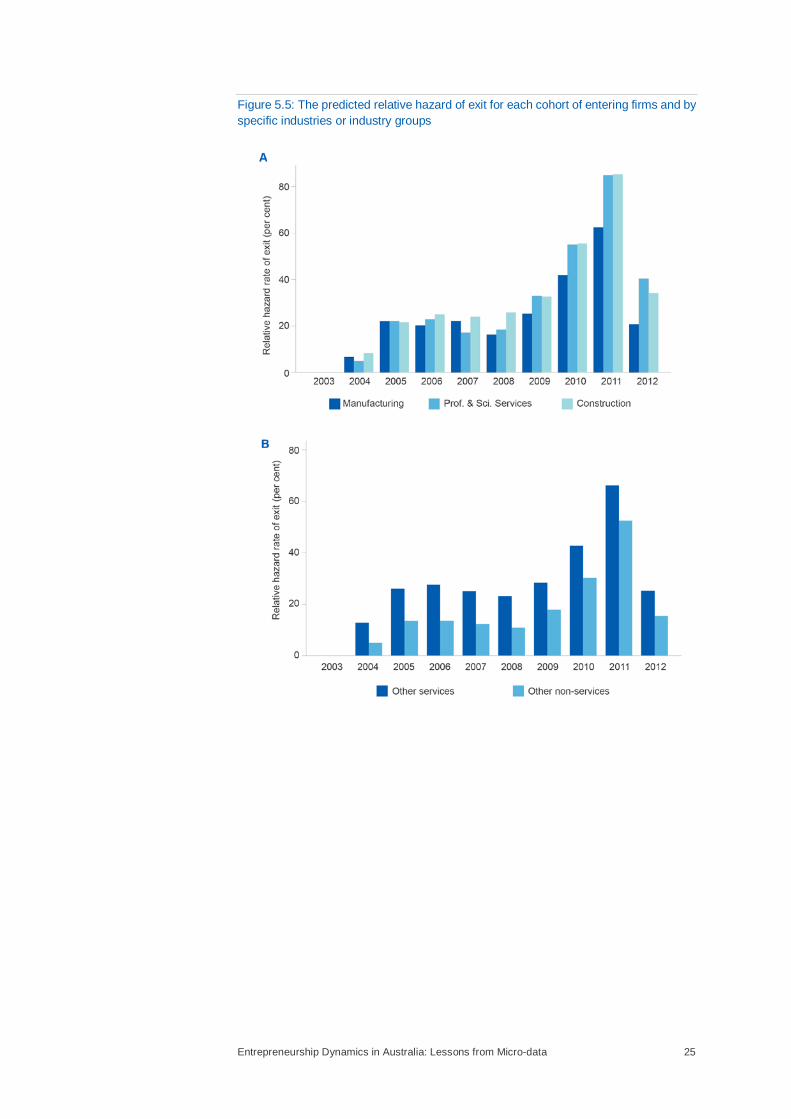
To make a more concrete case, I will also estimate model (2) by industry or by a group of similar industries. In doing so, I additionally intend to single out those industries in which hazard levels do not follow the general trend. The predicted relative hazard levels for different industries are illustrated in Figure 5.5. The hazard levels, again, are set to zero for the cohort of 2003 in each series.
Entrepreneurship Dynamics in Australia: Lessons from Micro-data 25
Figure 5.5: The predicted relative hazard of exit for each cohort of entering firms and by specific industries or industry groups
Entrepreneurship Dynamics in Australia: Lessons from Micro-data 26
Finance and Insurance Services
Mining
Notes: Base hazard is stratified by 3-digit ANZSIC. For each cohort ages zero to three are only
included.
Source: Department of Industry, Innovation and Science (2017)
In panel (A), I am showing the time trend for three individual industries that are often the focus of policy debates, namely, Manufacturing, Construction, and Professional, Scientific and Technical services. The first two industries are important sources of employment and the latter is considered a high-tech and productivity boosting sector. Within these three industries one observes a similar trend to that of
The main difference is that the rise in hazard levels of these industries is even more nuanced. The cohort of 2005 and the later cohorts in these industries are experiencing about 20 percentage point increase in their hazard levels relative to the base.
In panel (B), I group the remaining industries (with the exclusion of Mining, and Financial and Insurance Services) into two groups of services and non-services
Entrepreneurship Dynamics in Australia: Lessons from Micro-data 27
industries. Individual estimates were carried out for industries in these two groups to make sure the trends are similar within each group. I am reporting them in two groups only for brevity. The time trend in hazard levels is, again, the same as before. The only difference is that non-services industries are experiencing smaller increases in the hazard level than services industries.
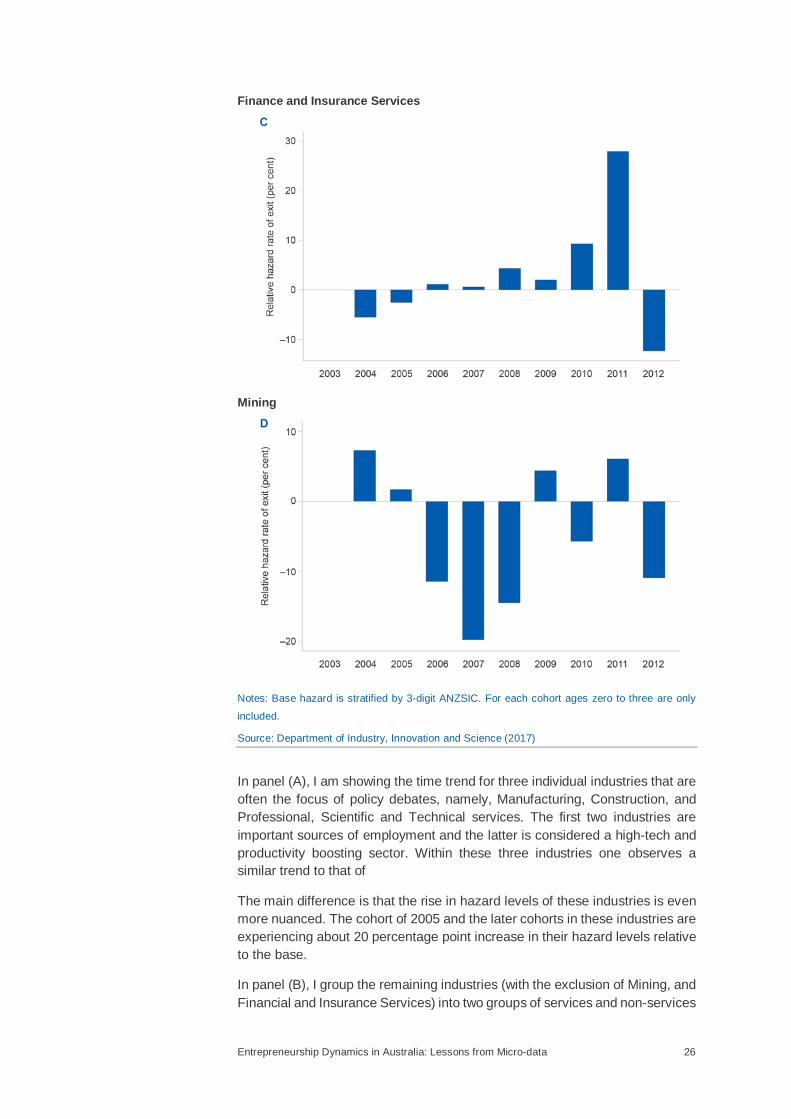
Overall, I find only two industries that show a trend that is qualitatively different to those observed in other industries. These two industries are the Financial and Insurance Services and Mining. The corresponding trends are shown in panels (C) and (D) of Figure 5.5, respectively.
Finance and Insurance Services do not show any notable increase in hazard until the cohort of 2008. It can be argued that the only force affecting this sector has been the GFC, whose effect has also been temporary and wore off after 2011.
Mining shows the most distinctive pattern. Mining is the only industry where new firms go through the whole period practically unscathed. For most of the cohorts observed, the hazard level is substantially lower than the base level. I will come back to this issue in Section 7 when discussing possible drivers of the observed trends.
6. Job Creation and Destruction One important, and probably the most tangible, economic impact of entrepreneurs and young firms is their contribution to job creation. Entrepreneurs and small young firms that survive and thrive are indeed a potent source of job creation and labour reallocation (Haltiwanger et al., 2013). By the same token, any drop in entrepreneurial activity raises concerns about the ability of an economy to create jobs and support its increasing working age population. The observations of the previous two sections add a sense of urgency to these concerns.
To understand where Australia stands on these issues, I begin by quantifying the jobs contribution of entrepreneurs. In the remainder of this section, I especially focus on job creation and destruction by small young firms. These are the young firms with a FTE of less than 20 employees in their first year. For the next exercises, I am reclassifying new firms with FTEs of 20 or higher in their first year as large. This reclassification prevents the statistics for new firms from being dominated by the size of these latter firms.
Define job creation and destruction in a firm as (Davis, Haltiwanger, and Schuh, 1997)
𝐽𝐽𝐽𝐽𝑗𝑗𝑗𝑗 = 𝑚𝑚𝑚𝑚𝑚𝑚�𝐹𝐹𝐹𝐹𝐹𝐹𝑗𝑗,𝑗𝑗 − 𝐹𝐹𝐹𝐹𝐹𝐹𝑗𝑗,𝑗𝑗−1, 0�,
Error! Bookmark not defined.𝐽𝐽𝐽𝐽𝑗𝑗𝑗𝑗 =−𝑚𝑚𝑚𝑚𝑚𝑚�𝐹𝐹𝐹𝐹𝐹𝐹𝑗𝑗,𝑗𝑗 − 𝐹𝐹𝐹𝐹𝐹𝐹𝑗𝑗,𝑗𝑗−1, 0�, (3)
where FTEj,t is the full-time equivalent employment in firm j in year t. If a firm enters in t, then FTEj,t−1=0 . If a firm exits in t, then FTEj,t=0 . Economy-wide job creation and job destruction in year t is the aggregate sum of individual
Entrepreneurship Dynamics in Australia: Lessons from Micro-data 28
terms. Net job creation or the number of jobs added to the economy in year t is the difference of the two, or
(4)
Note that job creation and destruction are computed using FTEs. Consequently, the counts of jobs created and destroyed in this section are akin to quality adjusted measures accounting for the replacement of full-time jobs with part-time ones for instance.6
Applying these definitions to the firms in the BLADE shows that approximately 15.1 million full-time jobs have been created in Australia between the years 2004 and 2014, of which more than 3.1 million jobs are created by small young firms alone. Over the same period, about 12.6 million full-time jobs have been destroyed in Australia. Almost 1.1 million of those jobs destroyed can be tracked to small young firms.
Put together, the numbers imply that of the 2.5 million full-time jobs added to the economy during this period, 2.0 million of them originated from small young firms. In other words, around 80 per cent of net jobs growth in Australia over the past decade is attributed to entrepreneurs and small young firms. In an earlier study, Hendrickson et al. (2015) find similar evidence. This revelation puts the spotlight on entrepreneurship as the most important engine of jobs growth in Australia.
To further anatomise the contribution of small young firms, I compute job creation and destruction within these firms by age. The results are shown in Figure 6.1(A).
6 The ABS, in fact, reports an increase in the proportion of part-time jobs created in Australia over
the past several years. See ABS.Cat.No.6202.
Entrepreneurship Dynamics in Australia: Lessons from Micro-data 29
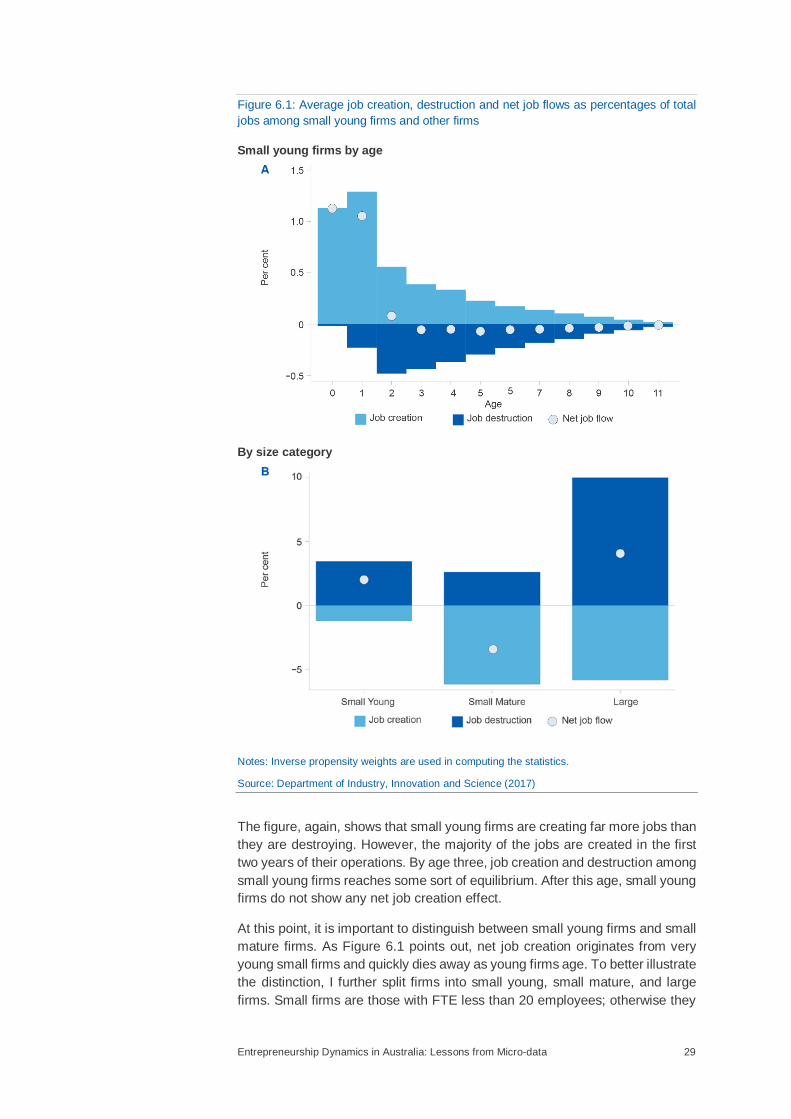
Figure 6.1: Average job creation, destruction and net job flows as percentages of total jobs among small young firms and other firms
Small young firms by age
By size category
Notes: Inverse propensity weights are used in computing the statistics.
Source: Department of Industry, Innovation and Science (2017)
The figure, again, shows that small young firms are creating far more jobs than they are destroying. However, the majority of the jobs are created in the first two years of their operations. By age three, job creation and destruction among small young firms reaches some sort of equilibrium. After this age, small young firms do not show any net job creation effect.
At this point, it is important to distinguish between small young firms and small mature firms. As Figure 6.1 points out, net job creation originates from very young small firms and quickly dies away as young firms age. To better illustrate the distinction, I further split firms into small young, small mature, and large firms. Small firms are those with FTE less than 20 employees; otherwise they
Entrepreneurship Dynamics in Australia: Lessons from Micro-data 30
are large. In view of Figure 6.1(A), I am reclassifying any entrant firm older than three years of age as small mature. Job creation and destruction levels by each group are shown in Figure 6.1(B).
According to this picture, two groups of firms have a net job creation effect on the economy, namely, small young firms and large firms. Unlike small young firms, large firms demonstrates large job creation and destruction dynamics, but they still manage to create a lot more jobs than they destroy. In contrast, the net job effect of small mature firms is negative. The level of net job destruction among small mature firms in fact offsets a large number of net jobs created by larger firms. In the end, the majority of the jobs added to the economy are those created by small young firms.
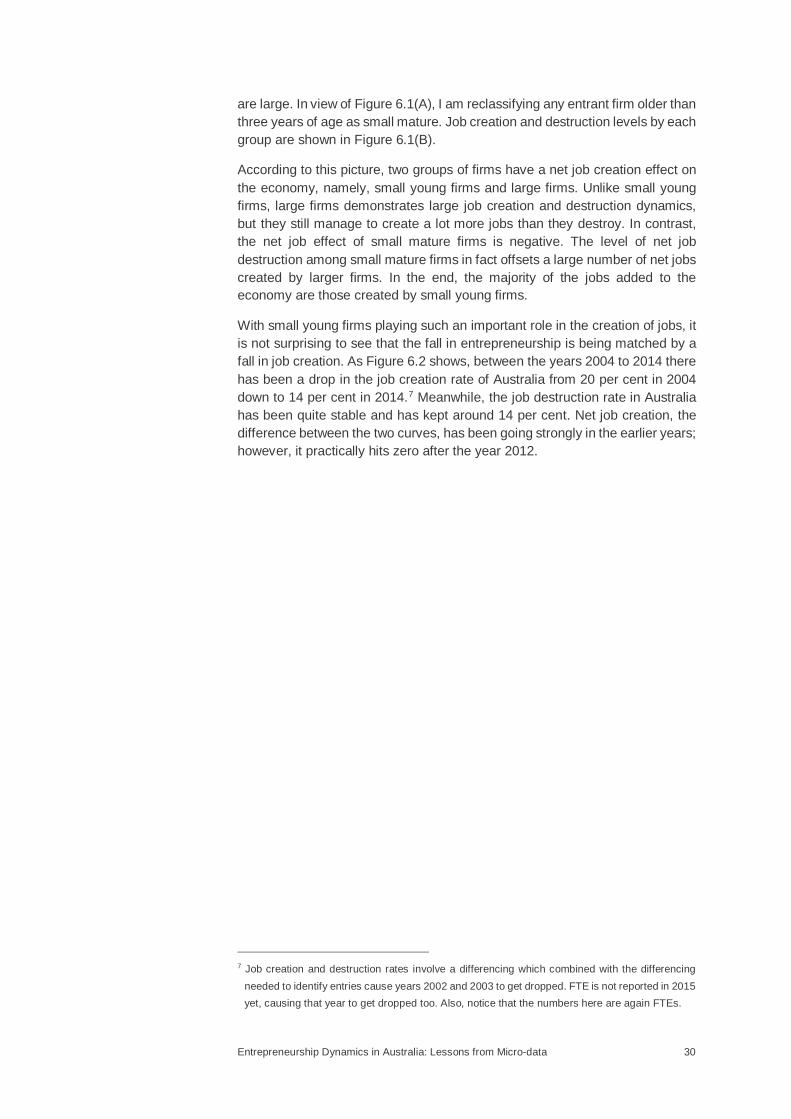
With small young firms playing such an important role in the creation of jobs, it is not surprising to see that the fall in entrepreneurship is being matched by a fall in job creation. As Figure 6.2 shows, between the years 2004 to 2014 there has been a drop in the job creation rate of Australia from 20 per cent in 2004 down to 14 per cent in 2014.7 Meanwhile, the job destruction rate in Australia has been quite stable and has kept around 14 per cent. Net job creation, the difference between the two curves, has been going strongly in the earlier years; however, it practically hits zero after the year 2012.
7 Job creation and destruction rates involve a differencing which combined with the differencing
needed to identify entries cause years 2002 and 2003 to get dropped. FTE is not reported in 2015 yet, causing that year to get dropped too. Also, notice that the numbers here are again FTEs.
Entrepreneurship Dynamics in Australia: Lessons from Micro-data 31
Figure 6.2: The annual job creation and destruction rates in Australia
Notes: Inverse propensity weights are used in computing the statistics.
Source: Department of Industry, Innovation and Science (2017)
The drop in job creation could be driven by two changes. The first one is the decline in the number of entrepreneurs which has been spoken of extensively this far. It can also be the case that those entrepreneurs that enter are not actively creating jobs as they used to. The latter is the situation in the US (Decker et al., 2014). I do a few checks by computing the annual share of small young firms of ages zero to three from the total job creation and destruction and also by finding the average number of jobs created and destroyed by these young firms. These statistics are plotted in Figure 6.3.
Entrepreneurship Dynamics in Australia: Lessons from Micro-data 32
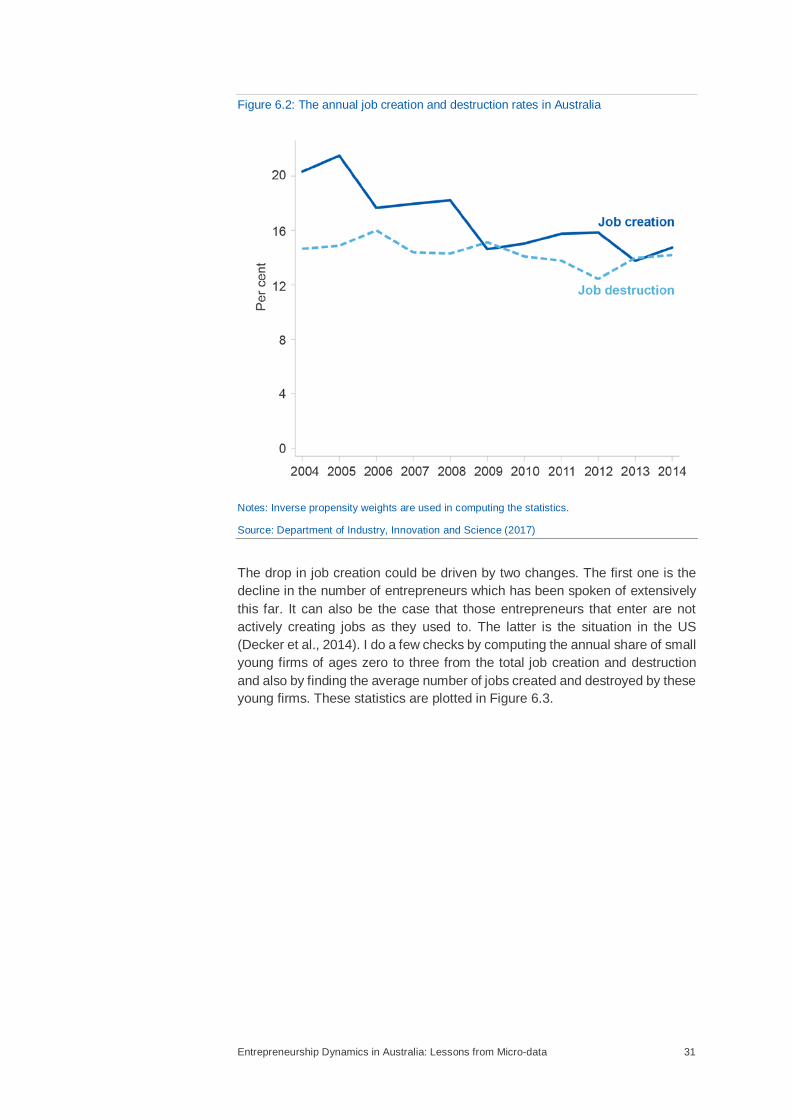
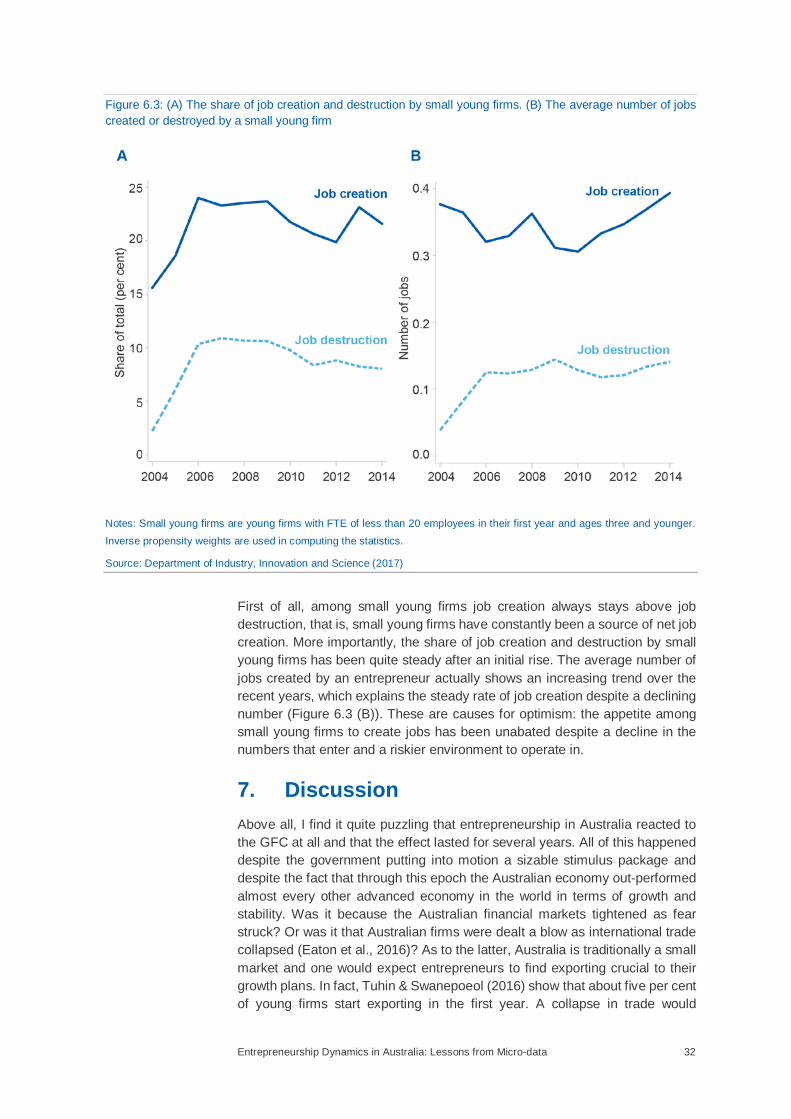
Figure 6.3: (A) The share of job creation and destruction by small young firms. (B) The average number of jobs created or destroyed by a small young firm
Notes: Small young firms are young firms with FTE of less than 20 employees in their first year and ages three and younger.
Inverse propensity weights are used in computing the statistics.
Source: Department of Industry, Innovation and Science (2017)
First of all, among small young firms job creation always stays above job destruction, that is, small young firms have constantly been a source of net job creation. More importantly, the share of job creation and destruction by small young firms has been quite steady after an initial rise. The average number of jobs created by an entrepreneur actually shows an increasing trend over the recent years, which explains the steady rate of job creation despite a declining number (Figure 6.3 (B)). These are causes for optimism: the appetite among small young firms to create jobs has been unabated despite a decline in the numbers that enter and a riskier environment to operate in.
7. Discussion Above all, I find it quite puzzling that entrepreneurship in Australia reacted to the GFC at all and that the effect lasted for several years. All of this happened despite the government putting into motion a sizable stimulus package and despite the fact that through this epoch the Australian economy out-performed almost every other advanced economy in the world in terms of growth and stability. Was it because the Australian financial markets tightened as fear struck? Or was it that Australian firms were dealt a blow as international trade collapsed (Eaton et al., 2016)? As to the latter, Australia is traditionally a small market and one would expect entrepreneurs to find exporting crucial to their growth plans. In fact, Tuhin & Swanepoeol (2016) show that about five per cent of young firms start exporting in the first year. A collapse in trade would
Entrepreneurship Dynamics in Australia: Lessons from Micro-data 33
extinguish that hope. The appreciation of the Australian dollar during this time could have exacerbated the situation.
Despite its magnitude, the effect of the GFC on new and young firms appears temporary. The answer to these questions can set a guideline for future policies dealing with prospective global crises when they happen. The more urgent issue facing the Australian economy is that even after factoring out the impact of the GFC, the entry rate and survival of entrepreneurs is still declining at a considerable pace. Given that these firms are the very reason behind jobs growth in Australia, there is much to worry about the future of job market and unemployment.
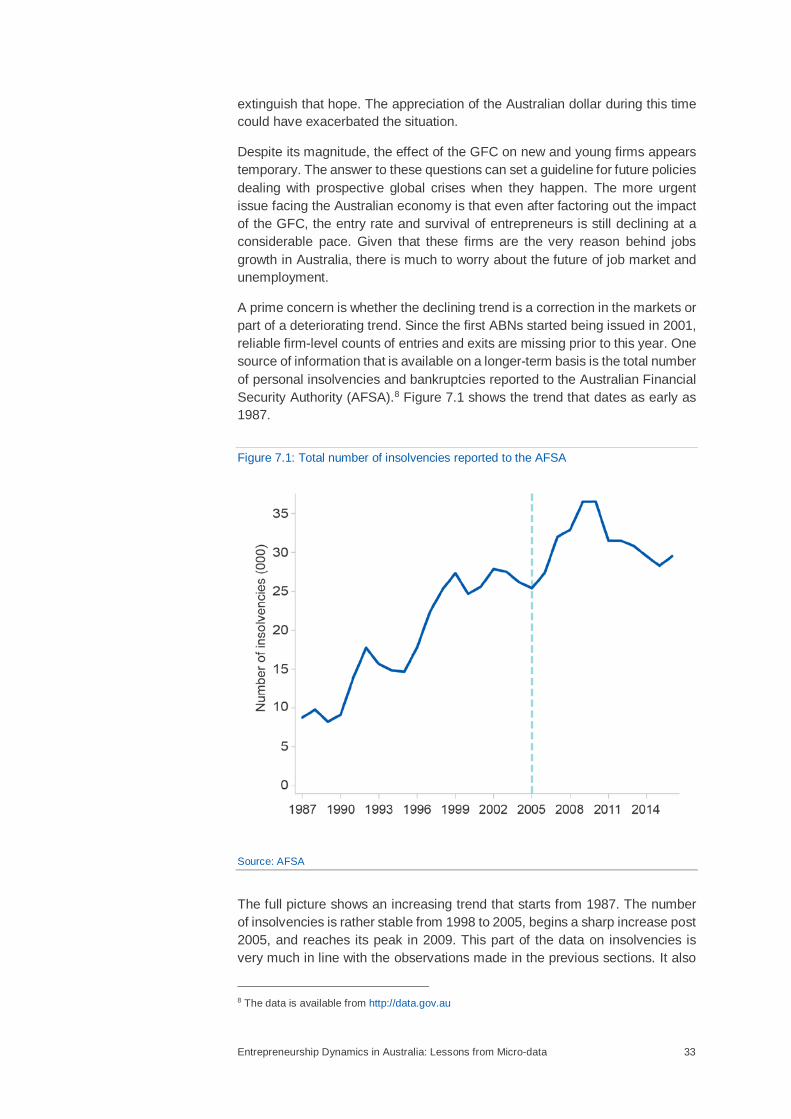
A prime concern is whether the declining trend is a correction in the markets or part of a deteriorating trend. Since the first ABNs started being issued in 2001, reliable firm-level counts of entries and exits are missing prior to this year. One source of information that is available on a longer-term basis is the total number of personal insolvencies and bankruptcies reported to the Australian Financial Security Authority (AFSA).8 Figure 7.1 shows the trend that dates as early as 1987.
Figure 7.1: Total number of insolvencies reported to the AFSA
Source: AFSA
The full picture shows an increasing trend that starts from 1987. The number of insolvencies is rather stable from 1998 to 2005, begins a sharp increase post 2005, and reaches its peak in 2009. This part of the data on insolvencies is very much in line with the observations made in the previous sections. It also
8 The data is available from http://data.gov.au
Entrepreneurship Dynamics in Australia: Lessons from Micro-data 34
suggests that the risks are now higher even relative to the levels observed pre 2005, hence, one is not looking at a correction in the market but at a deteriorating situation.
In what follows, I make a list of potential factors that I believe might be playing a role and state my reasons why it is so. A very detailed analysis of each is beyond the scope of this paper and is left for future research.
7.1 Resources Boom
The downturn in entrepreneurship comes amidst a major resources boom in Australia which saw the price of coal and other minerals increase dramatically. A booming mining sector has the potential to divert a substantial share of financial resources away from entrepreneurs and towards itself. The drought in funding that follows could drive many young firms to their death regardless of their competitiveness. The fact that mining entrepreneurs are the only ones not facing increased hazard further strengthens the link.
7.2 Increasing Lending Costs
An increasing cost of borrowing puts pressure on small and young firms and could drive them to exit the market in larger numbers. The Reserve Bank of Australia reports that the lending rate for small firms has indeed increased relative to that of the larger firms over the years and the gap is increasing.
7.3 Globalisation
As trade barriers disappear and global value chains become more of the norm, Australian firms feel added competitive pressure. The competition posed by Asian countries and particularly China is especially acute. Evidence found for the US already points to a drop in innovation activity, sales and employment within those industries where there has been a larger penetration of Chinese imports (Autor et al., 2017). Given that the share of trade between Australia and the East Asian nations is constantly increasing, a similar trend can be expected in Australia.
7.4 Changing Demographics
Hathaway & Litan (2014) argue that a falling population growth rate can affect entrepreneurship in two ways: on the supply side there will be fewer potential entrepreneurs, and on the demand side there will be fewer consumers. The latter does not seem to be the case in Australia as population growth in Australia has not fallen substantially. However, Australia is becoming an older country and a decline in the number of people in the prime entrepreneurial age can have an adverse effect on the number of entering entrepreneurs.
7.5 Increasing Monopolism
An increasing concentration of economic activity in the hand of a few large firms corrodes the entrepreneurs’ ability to compete and to protect their rights. In fact, the appearance of mega-firms such as Amazon, Apple, and Google in the US might actually be the real reason behind the declining dynamism in that
Entrepreneurship Dynamics in Australia: Lessons from Micro-data 35
country. In case, Australian industries are getting more concentrated, there are reasons to believe that entrepreneurship should also fall.
8. Conclusion Entrepreneurship is the backbone of any progressive economy. Entrepreneurs that survive and thrive create jobs, introduce new products, and provide the required flexibility for an economy to cope with a changing world. It thus raises some concern that entrepreneurship prospects are deteriorating in Australia. The first warning sign is a declining rate of entry and a rather steep one. This trend is quite likely a consequence of perceiving an entrepreneurial environment that has become riskier. The jump in the risks facing entrepreneurs has been especially abrupt in 2005 and has not subsided over time unlike the impact of the GFC. The good news is that entrepreneurs are still as vibrant as before in creating jobs regardless of the risks. A portion of these entrepreneurs are transformative. The focus should still not be taken away from subsistence entrepreneurs that provide incomes and jobs for the owners. With advances in automation and artificial intelligence making more and more occupations obsolete, subsistence entrepreneurship holds the key to autonomous job creations for the displaced workers.
The downturn in Australian entrepreneurship follows a similar trend to that of the US; however, it is not matched with the same trend in every other country. The country-specific nature of the problem means that it is being driven by domestic factors. Once the cause is known, it can be remedied by proper planning and effective policy making. To stimulate the discussion, I put forth a series of possible explanations, each offering its own merits. Extensive and detailed research is required in each case to refute or to affirm the culpability.
Entrepreneurship Dynamics in Australia: Lessons from Micro-data 36
ABS Disclaimer The results of this study is based, in part, on ABR data supplied by the Registrar to the ABS under A New Tax System (Australian Business Number) Act 1999 and tax data supplied by the ATO to the ABS under the Taxation Administration Act 1953. These require that such data is only used for the purpose of carrying out functions of the ABS. No individual information collected under the Census and Statistics Act 1905 is provided back to the Registrar or ATO for administrative or regulatory purposes. Any discussion of data limitations or weaknesses is in the context of using the data for statistical purposes, and is not related to the ability of the data to support the ABR or ATO’s core operational requirements. Legislative requirements to ensure privacy and secrecy of this data have been followed. Only people authorised under the Australian Bureau of Statistics Act 1975 have been allowed to view data about any particular firm in conducting these analyses. In accordance with the Census and Statistics Act 1905, results have been confidentialised to ensure that they are not likely to enable identification of a particular person or organisation.
Entrepreneurship Dynamics in Australia: Lessons from Micro-data 37
References Allison, Paul D. (1996) “Fixed-Effects Partial Likelihood for Repeated Events,” Sociological Methods and Research, 25(2), 207–222.
Autor, David, David Dorn, Gordon H. Hanson, Gary Pisano, and Pian Shu (2017) “Foreign Competition and Domestic Innovation: Evidence from U.S. Patents,” National Bureau of Economic Research, Working Paper 22879.
Brüderl, Josef, Peter Preisendörfer, and Rolf Ziegler (1992) “Survival Chances of Newly Founded Business Organizations,” American Sociological Review, 57(2), 227–242.
Cressy, Robert (2006) “Why Do Most Firms Die Young,” Small Business Economics, 26(2), 103–116.
Davis, Steven J., John C. Haltiwanger, and Scott Schuh (1997) Job Creation and Destruction, MIT Press, Cambridge, Massachusetts.
Decker, Ryan A., John Haltiwanger, Ron S. Jarmin, and Javier Miranda (2014), “The role of entrepreneurship in U.S. job creation and economic dynamism”, Journal of Economic Perspectives 28, 3–24.
Decker, Ryan A., John Haltiwanger, Ron S. Jarmin, and Javier Miranda (2016a), “Where Has All the Skewness Gone? The Decline in High-Growth (Young) Firms in the U.S,” European Economic Review 86, 4–23.
Decker, Ryan A., John Haltiwanger, Ron S. Jarmin, and Javier Miranda (2016b) “Declining Business Dynamism: Implications for Productivity?,” Center for Economic Studies, US Census Bureau, Working Paper.
Eaton, Jonathan, Samuel Kortum, Brent Neiman, and John Romalis (2016) “Trade and the Global Recession,” American Economic Review, 106(11), 3401–3438.
Foster, Lucia, John Haltiwanger, and Chad Syverson (2008) “Reallocation, Firm Turnover, and Efficiency: Selection on Productivity or Profitability?,” American Economic Review, 98(1), 394–425.
Haltiwanger, John, Ron S. Jarmin, and Javier Miranda (2013) “Who Creates Jobs? Small vs. Large vs. Young,” Review of Economics and Statistics, 95(2), 347–361.
Hathaway, Ian, and Robert E. Litan (2014) “What’s Driving the Decline in the Firm Formation Rate? A Partial Explanation,” Brookings Institution, Economic Studies.
Hendrickson, Luke, Stan Bucifal, Antonio Balaguer, and David Hansell (2015) “The employment dynamics of Australian entrepreneurship,” Department of Industry, Innovation and Science, Reasearch Paper 4/2015.
Kalbfleisch, John D., and Ross L. Prentice (2002) The Statistical Analysis of Failure Time Data, John Wiley & Sons, 2nd Edition, New Jersey.
Entrepreneurship Dynamics in Australia: Lessons from Micro-data 38
Kaplan, E.L., and Paul Meier (1958) “Nonparametric Estimation from Incomplete Observations,” Journal of American Statistical Association, 53(282), 457–481.
MacDonald, Ryan (2014) “Business Entry and Exit Rates in Canada: A 30-year Perspective,” Statistics Canada, Cat.No.11-626-X, No.038.
OECD (2016) Entrepreneurship at a Glance 2016, OECD Publishing, Paris.
Schoar, Antoinette (2010) The Divide between Subsistence and Transformational Entrepreneurship, In Innovation Policy and the Economy, 10(1), Edited by Joshua Lerner and Scott Stern, Chp.3, 57–81, National Bureau of Economic Research.
Tuhin, Razib, and Jan A. Swanepoel (2016) “Export Behaviour and Business Performance: Evidence from Australian Microdata,” Department of Industry, Innovation and Science, Research Paper 7/2016.