Embed Size (px)
Citation preview
Health Workforce Research Center
on Long-Term Care
Research Report
This project was supported by the Health Resources and Services Administration (HRSA) of the U.S. Department of Health and Human Services (HHS) under grant number U81HP26494, Cooperative Agreement for a Regional Center for Health Workforce Studies. This information or content and conclusions are those of the authors and should not be construed as the official position or policy of, nor should any endorsements be inferred by HRSA, HHS or the U.S. Government.
Please cite as: Frogner, B. and Spetz, J. (2015). Entry and Exit of Workers in Long-Term Care. San Francisco, CA: UCSF Health Workforce Research Center on Long-Term Care.
UCSF Health Workforce Research Center on Long-Term Care, 3333 California Street, Suite 265, San Francisco, CA, 94118
Copyright © 2015 The Regents of the University of California
Contact: Bianca Frogner, PhD, Associate Professor, University of Washington School of Medicine, [email protected], 206-616-9657, or Joanne Spetz, PhD, Director, UCSF Health Workforce Research Center on Long-Term Care, [email protected]
Entry and Exit of Workers
in Long-Term Care
Bianca Frogner, PhD
Joanne Spetz, PhD
January 20, 2015

UCSF Health Workforce Research Center on Long-Term Care Research Report
2
Entry and Exit of Workers in Long-Term Care
Table of Contents
Table of Contents ........................................................................................ 2
Table of Tables ........................................................................................... 4
Table of Figures .......................................................................................... 5
Executive Summary ..................................................................................... 6
Methods .................................................................................................. 6
Results ................................................................................................... 6
Recommendations .................................................................................... 7
Background ................................................................................................ 8
Methods..................................................................................................... 9
Data ....................................................................................................... 9
Defining Sector and Occupation .................................................................. 9
Defining Transitions ................................................................................ 10
Results .................................................................................................... 11
Prevalence of Occupations by Long-Term Care Sector ................................... 11
Entrant and Leaver Rates by Long-Term Care Sector .................................... 13
Demographic and Socioeconomic Characteristics of the Long-Term Care
Workforce ............................................................................................. 15
Sector Movements among Long-Term Care Entrants and Leavers ................... 17
Demographic and Socioeconomic Characteristics of Select Long-Term Care
Occupations ........................................................................................... 20
Sector Movements among Select Long-Term Care Occupations ...................... 25
Occupational Movement among Long-Term Care Entrants and Leavers by Select
Occupations ........................................................................................... 27
Conclusions .............................................................................................. 30
Limitations ............................................................................................ 30
Implications and Future Directions ............................................................... 31
References ............................................................................................... 32

UCSF Health Workforce Research Center on Long-Term Care Research Report
3
Acronyms Used in this Report ...................................................................... 34
Appendix ................................................................................................. 35

UCSF Health Workforce Research Center on Long-Term Care Research Report
4
Table of Tables
Table 1. Five Most Common Occupations within Six Long-Term Care Sectors, 2013
.............................................................................................................. 12
Table 2. Demographic Characteristics of Entrants, Stayers, and Leavers by Long-
Term Care Sector, Pooled 2003-2013 ........................................................... 16
Table 3. Socioeconomic Characteristics of Entrants, Stayers, and Leavers by Long-
Term Care Sector, Pooled 2003-2013 ........................................................... 17
Table 4. Two Most Common Sectors and Occupations of Long-Term Care Entrants
and Leavers, Pooled 2003-2013 ................................................................... 19
Table 5. Demographic Characteristics of Entrants, Stayers, and Leavers by Select
Long-Term Care Occupations, Pooled 2003-2013 ............................................ 22
Table 6. Socioeconomic Characteristics of Entrants, Stayers, and Leavers in Select
Long-Term Care Occupations, Pooled 2003-2013 ............................................ 24
Table 7. Sector Transition Trends by Select Long-Term Care Occupations, Pooled
2003-2013 ............................................................................................... 26
Table 8. Occupation Transition Trends among Select Long-Term Care Occupations,
Pooled 2003-2013 ..................................................................................... 29
Appendix Table 1: Census and NAICS Crosswalk for Selected Long-Term Care
Sectors .................................................................................................... 35
Appendix Table 2: Census and SOC Crosswalk for Selected Long-term Care
Occupations ............................................................................................. 35
UCSF Health Workforce Research Center on Long-Term Care Research Report
5
Table of Figures
Figure 1. Share of Total Occupation for Select Occupations Found in the Long-Term
Care Industry, 2013 .................................................................................. 13
Figure 2. Average Annual Transition Rates for All U.S. Industries compared with
Entrant versus Leaver Rates for the Overall Long-Term Care Industry, 2003-2013 14
Figure 3. Share of Entrants versus Leavers in Six Long-Term Care Sectors, Pooled
2003-2013 ............................................................................................... 15
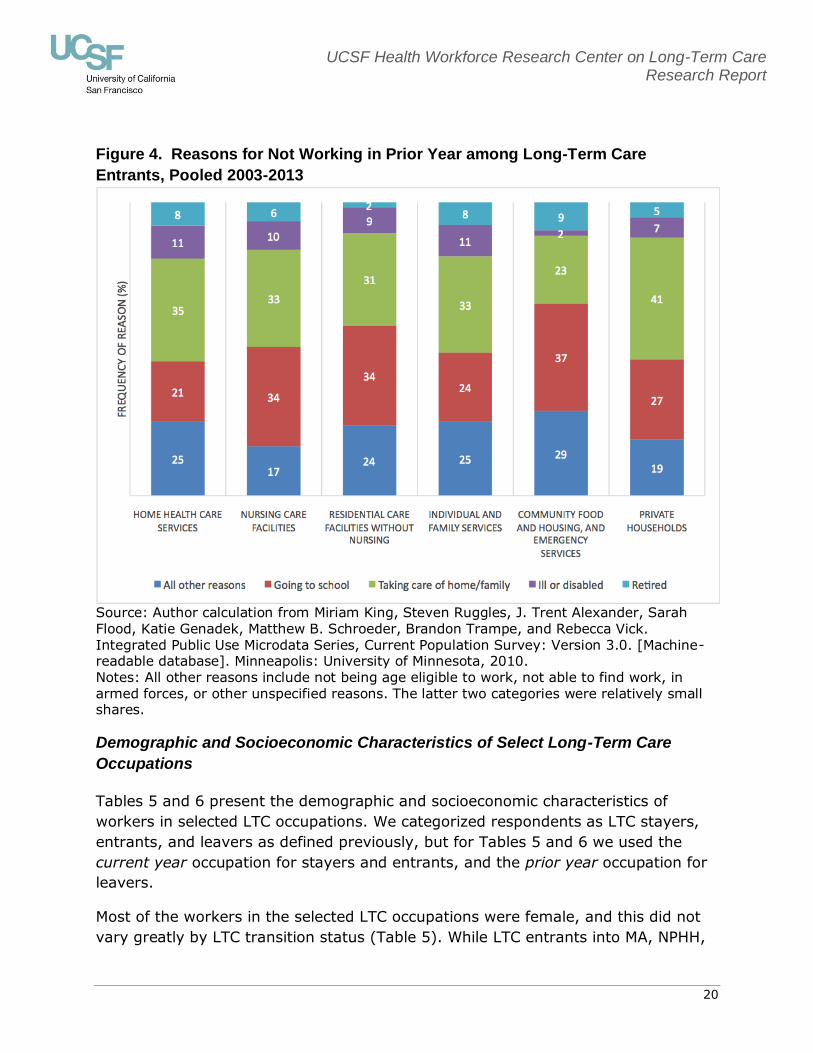
Figure 4. Reasons for Not Working in Prior Year among Long-Term Care Entrants,
Pooled 2003-2013 ..................................................................................... 20
Figure 5. Reasons for Not Working in Prior Year among Long-Term Care Entrants by
Select Long-Term Care Occupations, Pooled 2003-2013................................... 27

UCSF Health Workforce Research Center on Long-Term Care Research Report
6
Entry and Exit of Workers in Long-Term Care
Executive Summary
In the past decade, the health care industry, and long-term care (LTC) in particular,
saw substantial job growth. In anticipation of growing demand for LTC due to an
aging demographic, employment opportunities in LTC are expected to surpass those
of other U.S. sectors. Workforce planners are concerned about ensuring an
adequate pipeline of appropriately trained workers for LTC jobs.
This study examines the demographics, socioeconomic status, and job mobility of
workers by LTC sector and occupation. The goal of the study is to identify the
characteristics associated with job mobility and turnover of LTC workers, and the
pathways to LTC jobs these workers utilize.
Methods
We pooled data from 2003 to 2013 of the Annual Social and Economic Supplement
(“March Supplement”) of the Current Population Survey. We defined LTC as the
aggregate of six sectors defined by Census industry codes: 1) home health care
services, 2) nursing care facilities, 3) residential care services, without nursing, 4)
individual and family services, 5) community food and housing/emergency services,
and 6) private households. We created worker categories of entrants, stayers, and
leavers based on the changes in these workers’ employment sectors reported
between the current and prior year.
We defined “LTC occupations” according to nine Census occupation codes, which we
identified as either highly prevalent in, or relevant to, LTC delivery: 1) registered
nurse (RN), 2) licensed practical nurse/licensed vocation nurse (LPN/LVN), 3)
nursing, psychiatric, and home health aide (NPHH), 4) medical assistant and other
health care support occupation (MA), 5) personal and home care aide (PCA), 6)
social and community service manager, 7) social worker, 8) miscellaneous
community and social service specialist, and 9) physical therapist.
Results
LTC employs a high share of low-skilled workers, and many jobs in LTC are not
associated with direct health care. Despite the expected increases in demand for
LTC services as Baby Boomers age, the rate at which workers leave LTC is
outpacing the entry rate across all LTC sectors. LTC entrants and leavers were
generally younger than those who remained in the industry. Nursing care facilities

UCSF Health Workforce Research Center on Long-Term Care Research Report
7
tended to draw workers from hospitals, while individual and family services tended
to draw workers from leisure and hospitality. A large share of LTC entrants was not
in the labor force in the prior year; of these, a dominant portion reported previously
being in school or taking care of the home or family. Most LTC leavers -- especially
those with lower skill levels -- found themselves unemployed or out of the labor
force, and these LTC leavers tended to report higher rates of work disability and to
have higher rates of poverty.
Recommendations
Future research should explore the longer-term employment paths of LTC workers
who become unemployed or leave the labor market. It is not known if these
transitions provide opportunities to obtain higher-paying jobs or develop new skills,
or if they increase the likelihood that LTC workers will live in poverty.
In order to improve recruitment and retention of LTC workers, as well as address
the high rate of poverty and lack of upward mobility of many LTC occupations,
employers, educators, and policymakers should consider investments in education
and training. Such investments will help to ensure an adequately trained workforce
in LTC, as well as support improved retention of LTC workers.

UCSF Health Workforce Research Center on Long-Term Care Research Report
8
Sources of Workers and Job Mobility in Long-Term Care
In the past decade, the health care industry, and long-term care (LTC) in particular,
saw substantial job growth. In anticipation of growing demand for LTC due to an
aging demographic, employment opportunities in LTC are expected to surpass those
of other U.S. sectors, for example, with 23.8% growth projected in nursing care
facilities and 59.7% growth projected in home health care between 2012 and
2022.1 As LTC employment grows, workforce planners are concerned about
ensuring an adequate pipeline of appropriately trained workers.
This study examines the demographics, socioeconomic status, and job mobility of
workers within six sectors that we identify as providing LTC services: nursing care
facilities, residential care without skilled nursing, home health care, individual and
family services, community food and housing/emergency services, and private
households. We collectively refer to these six sectors as the LTC industry. We also
examine the demographics, socioeconomic status, and job mobility of a select
number of occupations that are commonly involved in delivering LTC. The goal of
this study is to identify the characteristics associated with job mobility and turnover
of LTC workers, and the job pathways of LTC workers.
Background
Within LTC, physicians and registered nurses (RNs) provide less than 10% of care.2
On the other hand, certified nursing assistants (CNAs), home health aides (HHAs),
personal care aides (PCAs), and licensed practical nurses/licensed vocational nurses
(LPNs/LVNs) play a substantial role in providing LTC. A recent study on LTC found
that LPNs/LVNs constituted about a fifth of the nursing staff in home health
agencies and nursing homes.3 In this same study, aides (including CNAs, HHAs, and
PCAs) comprised over two-thirds of the nursing staff in nursing homes as well as
adult day services, and over 80% of the staff in residential care facilities.3
The U.S. Bureau of Labor Statistics (BLS) projects a 60% increase in employment in
the home health care services sector, 30% increase in residential care facilities, and
20% increase in nursing care facilities over the next decade.1 At the same time, it is
well-documented that high rates of staff turnover are common in LTC.4 Median
turnover in skilled nursing facilities was 44% in 2012, and median CNA turnover
within these facilities was 52%.5 The combination of rapid job growth and high
rates of turnover requires LTC employers to constantly recruit employees.

UCSF Health Workforce Research Center on Long-Term Care Research Report
9
High turnover rates are of concern because they may negatively impact quality of
care in LTC settings.6, 7, 8 Research suggests, however, that turnover rates may be
tempered. For example, nursing homes with higher staffing levels tend to have
lower turnover rates than those with lower staffing levels, as do nursing homes that
pay higher wages and offer more generous benefits, such as health insurance.4
Home health care and hospice agencies have much lower turnover rates than do
nursing homes, at 10% for RNs, 13% for HHAs, and 14% for LPNs in 2007.9
Further work is necessary to understand which employees may be at highest risk of
turnover. Existing literature, however, provides limited guidance on the pathways
through which workers enter and leave LTC jobs. This study identifies the industries
and sectors from which the LTC industry draws workers, and to which sectors LTC
loses workers. We also identify the demographic and socioeconomic characteristics
associated with LTC job changes, and examine the extent to which LTC workers
appear to advance into higher-paying jobs. The findings from this study will allow
workforce planners to better target initiatives to recruit and retain LTC workers.
Methods
Data
We pooled data from 2003 to 2013 of the Annual Social and Economic Supplement
(“March Supplement”) of the Current Population Survey (CPS).10 The CPS is a
monthly household survey of approximately 100,000 households, or 200,000
individuals, conducted by the BLS and the U.S. Census. The CPS collects self-
reported data on household and individual demographics and socioeconomic status.
The March Supplement is a well-recognized source to examine job transitions
because respondents self-report both their current industry of employment, as well
as their industry of employment in the prior year. We restricted our analysis to
respondents age 16 years or older, and those who reported being in the labor force
in either the current or prior year. We used survey weights to generalize the results
to the civilian non-institutionalized U.S. adult population.
Defining Sector and Occupation
We defined the “LTC industry” as the aggregate of six sectors defined by Census
industry codes, using four-digit codes that are the most disaggregated level
available and align with the North American Industry Classification System (see
Appendix Table 1 for crosswalk). When referencing other non-LTC health care
sectors we use four-digit codes, and use two-digit higher level aggregations for all
other sectors. Sectors may be defined by either type of service provided or locale
(note: we may use sector and industry interchangeably). Three of the six LTC

UCSF Health Workforce Research Center on Long-Term Care Research Report
10
sectors are typically identified as health care-related LTC: “home health care
services,” “nursing care facilities (including skilled nursing),” and “residential care
services, without nursing.” The remaining three sectors are non-health care support
services that are often, but not exclusively, involved as part of LTC: “individual and
family services,” “community food and housing/emergency services,” and “private
households.”
We defined “LTC occupations” to include both occupations that provide direct care
to patients (including care management) and occupations that are indirectly
associated with patient care and are either highly prevalent or otherwise relevant to
LTC. For example, large numbers of food service preparation workers are employed
in nursing homes and thus are included in the analysis. For all direct care
occupations, we use four-digit Census occupation codes, which are the most
disaggregated level available and align with the Standard Occupational
Classification System (see Appendix Table 2 for crosswalk). We used two-digit
aggregations for all other occupations. We focused on nine direct care occupations:
1) registered nurse (RN), 2) licensed practical nurse/licensed vocation nurse
(LPN/LVN), 3) nursing, psychiatric, and home health aide (NPHH), 4) medical
assistant and other health care support occupation (MA), 5) personal and home
care aide (PCA), 6) social and community service manager, 7) social worker, 8)
miscellaneous community and social service specialist, and 9) physical therapist.
Defining Transitions
We classified respondents into stayers, entrants, and leavers based on their
reported sectors of employment from the current to prior year. Stayers reported
the same employment sector in the current year as in the prior year. We created a
separate category of LTC stayers that includes those who reported any one of the
six LTC sectors in the current as well as in the prior year. Entrants and leavers
reported different sectors in the current and prior year. We further categorized
entrants into LTC entrants who reported one of the six LTC sectors in the current
year and did not report any LTC sector in the prior year. Similarly, we categorized
leavers into LTC leavers who reported one of the six LTC sectors in the prior year
and did not report any LTC sector in the current year.
We also looked at transitions by LTC occupation. Among respondents in LTC
occupations, we identified the sector and/or occupation from which a LTC worker
entered and to which sector and/or occupation they left. Given the number of
permutations of sector and occupation transitions, we focused on movement into
and out of LTC sectors rather than into and out of LTC occupations.

UCSF Health Workforce Research Center on Long-Term Care Research Report
11
Finally, although the CPS assigns unemployed individuals to the sector of their most
recent occupation, we coded them into a separate group to indicate their
unemployed status. This enabled us to analyze transitions into and out of
employment. We also examined transitions into and out of the labor force. For
those who transitioned into LTC from being out of the labor force, we created
separate categories for transitions from the armed forces, school, illness or
disability, family care, and retirement; however, we could not make these same
distinctions when individuals left the labor force.
Results
Prevalence of Occupations by Long-Term Care Sector
Table 1 presents total LTC employment and the five most common occupations (job
titles as defined by the Census occupation codes) within each of the six LTC sectors
in 2013. These five occupations accounted for the majority of jobs in each sector
and nearly all of the jobs within home health care services, nursing care facilities,
and private households. PCA was among the most commonly reported occupations
in four of the six LTC sectors, the exceptions being nursing care facilities and
community food and housing/emergency services. NPHHs were also consistently
prevalent across four of the six LTC sectors, with a particular dominance in home
health care services and nursing care facilities.

UCSF Health Workforce Research Center on Long-Term Care Research Report
12
Table 1. Five Most Common Occupations within Six Long-Term Care Sectors, 2013
Sector Home Health Care Services
Nursing Care Facilities
Residential Care Facilities
Individual and Family
Services
Community Food and Housing/ Emergency
Services
Private Households
Total Employment
1,111,737 1,719,845 779,961 1,445,790 120,393 652,564
1st Most Common
Occupation
41% NPHH 37% NPHH 20% PCA 21% PCA 19% Social worker
40% Bldg & grounds cleaning and maintenance
2nd 28% PCA 12% RN 13% Food prep & service-related
18% Social worker
13% Office & admin support
36% Personal care & services
(excluding PCAs)
3rd 11% RN 9% LPN/LVN 9% Office & admin support
11% Office & admin support
11% Counselor 17% PCA
4th 6% Office & admin support
8% Food prep & service-related
9% Management 8% Social & community
service managers
9% Food prep & service-related
2% Transportation & material moving
5th 4% LPN/LVN 6% Bldg & grounds cleaning and maintenance
7% Bldg & grounds cleaning and maintenance
8% Counselor 8% Transportation & material moving
2% NPHH
Total 90% 73% 58% 66% 60% 97%
Source: Author calculation from Miriam King, Steven Ruggles, J. Trent Alexander, Sarah Flood, Katie Genadek, Matthew B. Schroeder, Brandon Trampe, and Rebecca Vick. Integrated Public Use Microdata Series, Current Population Survey: Version 3.0. [Machine-readable database]. Minneapolis: University of Minnesota, 2010. Notes: LPN/LVN = Licensed Practical Nurse/Licensed Vocational Nurse; NPHH = Nursing, Psychiatric, and Home Health Aide; PCA = Personal and Home Care Aide; RN = Registered Nurse

UCSF Health Workforce Research Center on Long-Term Care Research Report
13
Figure 1 shows the percent of workers employed in the LTC sector for each of nine
occupations that are highly prevalent or otherwise relevant to LTC. The majority of
PCAs and NPHHs worked in the LTC sector versus in another health care sector or
non-health care sector. About one-third to one-half of social and community related
workers were employed in the LTC sector. A large share of LPNs/LVNs was
employed in LTC, but only 10% of RNs worked in the LTC sector. Similarly, less
than 10% of PTs and MAs worked in LTC.
Figure 1. Share of Total Occupation for Select Occupations Found in the Long-
Term Care Industry, 2013
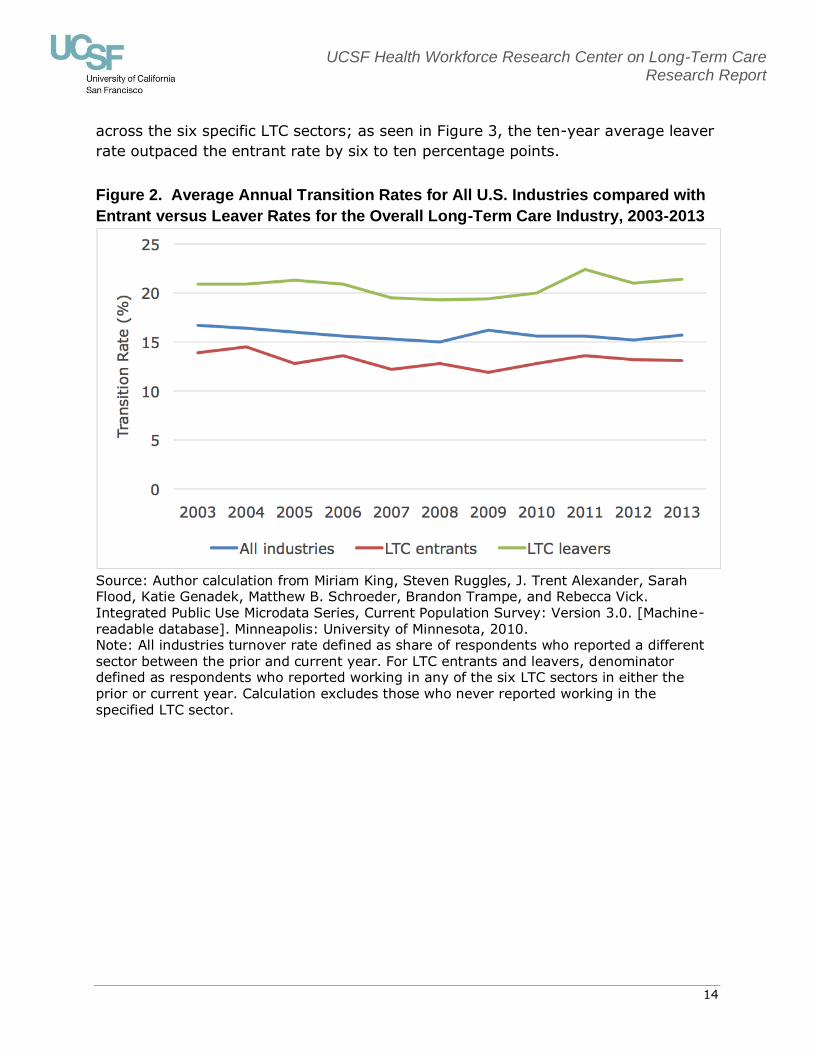
Entrant and Leaver Rates by Long-Term Care Sector
Among respondents who reported working in any of the six LTC sectors in either the
prior or current year, 13% of the respondents were LTC sector entrants while 21%
were LTC sector leavers (Figure 2); the remaining respondents stayed in LTC
between the prior and current years. Across all U.S. industries, the rate of year-to-
year sector change averaged 16% between 2003 and 2013. The rate of leaving LTC
jobs outpaced the rate of entry, and the gap between the two has grown by about
1.3 percentage point over the last decade. During the 2007-2009 recession, the
LTC leaver and entrant rates were at their lowest levels, while the rest of the
economy saw a high rate of movement across sectors. These trends are consistent
UCSF Health Workforce Research Center on Long-Term Care Research Report
14
across the six specific LTC sectors; as seen in Figure 3, the ten-year average leaver
rate outpaced the entrant rate by six to ten percentage points.
Figure 2. Average Annual Transition Rates for All U.S. Industries compared with
Entrant versus Leaver Rates for the Overall Long-Term Care Industry, 2003-2013
Source: Author calculation from Miriam King, Steven Ruggles, J. Trent Alexander, Sarah Flood, Katie Genadek, Matthew B. Schroeder, Brandon Trampe, and Rebecca Vick. Integrated Public Use Microdata Series, Current Population Survey: Version 3.0. [Machine-readable database]. Minneapolis: University of Minnesota, 2010. Note: All industries turnover rate defined as share of respondents who reported a different
sector between the prior and current year. For LTC entrants and leavers, denominator defined as respondents who reported working in any of the six LTC sectors in either the prior or current year. Calculation excludes those who never reported working in the specified LTC sector.

UCSF Health Workforce Research Center on Long-Term Care Research Report
15
Figure 3. Share of Entrants versus Leavers in Six Long-Term Care Sectors,
Pooled 2003-2013
Source: Author calculation from Miriam King, Steven Ruggles, J. Trent Alexander, Sarah Flood, Katie Genadek, Matthew B. Schroeder, Brandon Trampe, and Rebecca Vick. Integrated Public Use Microdata Series, Current Population Survey: Version 3.0. [Machine-readable database]. Minneapolis: University of Minnesota, 2010. Note: Denominator defined as respondents who reported working within each of the
specified LTC sectors in either the prior or current year. Calculation excludes those who never reported working in the specified LTC sector.
Demographic and Socioeconomic Characteristics of the Long-Term Care
Workforce
Table 2 summarizes the demographics of entrants, stayers, and leavers in each LTC
sector for the pooled data from 2003 to 2013. Nearly all workers in each LTC sector
were female, with a slightly lower proportion of females in community food and
housing services, and emergency services. Entrants were generally younger than
leavers, and leavers were younger than stayers. The racial/ethnic mix of entrants,
leavers, and stayers did not significantly differ from each other, although stayers
tended to be slightly less diverse. Across all LTC sectors, minorities represented
about 40% of the workforce, which is higher than the national average of 21% of
the labor force in 2013.11 Stayers were more likely to be married than leavers or

UCSF Health Workforce Research Center on Long-Term Care Research Report
16
entrants. The proportion of workers with young children in the household was
slightly higher for leavers compared with entrants and stayers.
Table 2. Demographic Characteristics of Entrants, Stayers, and Leavers by Long-
Term Care Sector, Pooled 2003-2013
Sector Female Age 16-24 Years
Age 55-64 Years
White Married Child under Age 5 in
Household
Home Health Care Services Entrants 88% 14% 15% 49% 45% 15% Stayers 90% 7% 18% 51% 47% 11%
Leavers 90% 11% 17% 54% 44% 15% Nursing Care Facilities
Entrants 85% 23% 10% 59% 42% 14% Stayers 86% 13% 17% 60% 48% 13% Leavers 86% 21% 13% 58% 42% 17%
Residential Care Services Entrants 73% 24% 10% 60% 39% 11%
Stayers 71% 14% 16% 65% 46% 12% Leavers 73% 23% 13% 61% 40% 12%
Individual & Family Services Entrants 76% 15% 15% 58% 43% 11% Stayers 78% 7% 19% 60% 52% 11% Leavers 76% 18% 14% 54% 41% 11%
Community Food & Housing/Emergency Services Entrants 63% 10% 15% 52% 39% 6% Stayers 73% 5% 18% 60% 46% 12% Leavers 67% 8% 18% 60% 45% 13%
Private Households Entrants 90% 34% 11% 56% 37% 11%
Stayers 92% 16% 15% 48% 44% 8% Leavers 88% 36% 11% 59% 34% 11%
Source: Author calculation from Miriam King, Steven Ruggles, J. Trent Alexander, Sarah Flood, Katie Genadek, Matthew B. Schroeder, Brandon Trampe, and Rebecca Vick. Integrated Public Use Microdata Series, Current Population Survey: Version 3.0. [Machine-readable database]. Minneapolis: University of Minnesota, 2010.
Table 3 summarizes the socioeconomic characteristics of LTC entrants, stayers, and
leavers in the decade from 2003 to 2013. Across most sectors, leavers were slightly
more likely to be U.S. citizens. There was a large share of non-U.S. citizens in
private households – two to three times higher than in other LTC sectors. LTC
sector transitions did not seem to be associated with whether or not the individual
lived in a rural area. Entrants and stayers had similar work disability rates, while
leavers were more likely to report a work disability compared with entrants and
stayers. Stayers were more likely to be employed full-time, while leavers were least
likely to have worked full-time. Stayers in each of the LTC sectors were

UCSF Health Workforce Research Center on Long-Term Care Research Report
17
considerably less likely to have a household income below the poverty line than
entrants and leavers. The rate of poverty was relatively high among entrants and
leavers across all LTC sectors, especially workers in the home health care services
sector and private households. Stayers tended to have higher average annual
wages, and leavers tended to have the lowest average wages (note: earnings are
averaged over the ten-year period and adjusted for inflation).
Table 3. Socioeconomic Characteristics of Entrants, Stayers, and Leavers by
Long-Term Care Sector, Pooled 2003-2013
Sector Not a Citizen
Rural Residence
Work Disabled
Full-Time Below Poverty
Earnings from Prior Year
(2013 dollars)
Home Health Care Services Entrants 10% 20% 4% 74% 18% $27,499 Stayers 11% 19% 4% 66% 14% $27,685 Leavers 9% 20% 10% 59% 22% $21,379
Nursing Care Facilities
Entrants 8% 24% 2% 75% 16% $28,913 Stayers 8% 26% 2% 78% 8% $31,500
Leavers 7% 25% 8% 72% 16% $24,343 Residential Care Services Entrants 6% 17% 4% 74% 14% $27,291 Stayers 6% 19% 3% 79% 5% $29,648
Leavers 7% 17% 8% 73% 13% $22,545 Individual & Family Services Entrants 6% 17% 5% 78% 13% $27,898 Stayers 6% 17% 5% 77% 6% $35,559 Leavers 6% 17% 9% 64% 15% $24,618
Community Food & Housing/Emergency Services
Entrants 6% 17% 5% 68% 19% $32,894 Stayers 3% 17% 5% 77% 5% $38,348 Leavers 4% 18% 8% 70% 12% $19,585
Private Households Entrants 26% 15% 5% 65% 26% $10,203 Stayers 34% 12% 4% 50% 20% $16,107
Leavers 18% 17% 10% 37% 21% $9,458
Source: Author calculation from Miriam King, Steven Ruggles, J. Trent Alexander, Sarah Flood, Katie Genadek, Matthew B. Schroeder, Brandon Trampe, and Rebecca Vick. Integrated Public Use Microdata Series, Current Population Survey: Version 3.0. [Machine-readable database]. Minneapolis: University of Minnesota, 2010.
Sector Movements among Long-Term Care Entrants and Leavers
Table 4 presents the two most common sources from which each LTC sector drew
workers. Home health care services most frequently drew entrants from nursing
care facilities, while nursing care facilities most often drew entrants from hospitals.

UCSF Health Workforce Research Center on Long-Term Care Research Report
18
Residential care services and private households both drew entrants from the
leisure and hospitality sector. Individual and family services and community food
and housing/emergency services both drew entrants from those who had previously
worked in the education sector. Across all LTC sectors, many entrants were
previously not in the labor force or were unemployed (note: given the data coding,
we were unable to separate these two categories accurately). Of these, one-quarter
to one-third of respondents entered from school and approximately another one-
third had previously been taking care of the home and/or family (Figure 4).
PCA was the most common occupation held by entrants across half of the LTC
sectors – home health care services, residential care services, and individual and
family services (Table 4). Over one-third of entrants held positions as NPHHs once
they entered home health care services and nursing care facilities. Many of those
who entered LTC sectors occupied non-direct care jobs. For example, about one in
eight entrants into residential care facilities were employed in food preparation.
About one in seven entrants to community food and housing/emergency services
took office and administrative support jobs. Over 40% of the entrants to the private
household sector were in building and grounds maintenance occupations; this is
likely reflective of the fact that the private household sector involves a wide range
of non-health care related services.
Leavers of LTC jobs often became unemployed or were no longer in the labor force
(Table 4). We are not able to determine the reasons for leaving the labor force, or
whether these exits were voluntary or involuntary. The unemployment rate
reported by leavers across all LTC sectors is double to triple the national
unemployment rate, which averaged around 7% over the last decade.12 Given that
the unemployment rate is calculated only among those in the labor force, the
unemployment rate among leavers is actually much higher.

UCSF Health Workforce Research Center on Long-Term Care Research Report
19
Table 4. Two Most Common Sectors and Occupations of Long-Term Care
Entrants and Leavers, Pooled 2003-2013
Sector Entrants:
Prior Year
Sector
Entrants:
Current Year Occupation
Leavers:
Current Year Sector
Home Health Care Services
19% NILF/ unemployed 14% Nursing care facilities
42% NPHH 23% PCA
33% NILF 18% Unemployed
Nursing Care Facilities
18% Hospitals 15% NILF/
unemployed
37% NPHH 10% RN
27% NILF 19% Unemployed
Residential Care Services
15% NILF/ unemployed 14% Leisure & hospitality
21% PCA 13% Food preparation
25% NILF 16% Unemployed
Individual & Family Services
18% NILF/ unemployed
9% Education
22% PCA 16% Social worker
30% NILF 16% Unemployed
Community Food & Housing/ Emergency Services
17% NILF/ unemployed 10% Education
15% Office & admin support occupations 11% Social worker
22% Unemployed 21% NILF
Private Households 35% NILF/
unemployed 14% Leisure & hospitality
43% Bldg & grounds
cleaning & maintenance occupations 39% Personal care and services occupations (excluding
PCAs)
50% NILF
16% Unemployed
Source: Author calculation from Miriam King, Steven Ruggles, J. Trent Alexander, Sarah Flood, Katie Genadek, Matthew B. Schroeder, Brandon Trampe, and Rebecca Vick. Integrated Public Use Microdata Series, Current Population Survey: Version 3.0. [Machine-readable database]. Minneapolis: University of Minnesota, 2010. Notes: For entrants, we are not able to distinguish unemployment from not in labor force
with regard to prior year work activity. NILF = Not in labor force; NPHH = Nursing, Psychiatric, and Home Health Aide; PCA = Personal and Home Care Aide; RN = Registered Nurse
UCSF Health Workforce Research Center on Long-Term Care Research Report
20
Figure 4. Reasons for Not Working in Prior Year among Long-Term Care
Entrants, Pooled 2003-2013
Source: Author calculation from Miriam King, Steven Ruggles, J. Trent Alexander, Sarah Flood, Katie Genadek, Matthew B. Schroeder, Brandon Trampe, and Rebecca Vick. Integrated Public Use Microdata Series, Current Population Survey: Version 3.0. [Machine-readable database]. Minneapolis: University of Minnesota, 2010. Notes: All other reasons include not being age eligible to work, not able to find work, in armed forces, or other unspecified reasons. The latter two categories were relatively small shares.
Demographic and Socioeconomic Characteristics of Select Long-Term Care
Occupations
Tables 5 and 6 present the demographic and socioeconomic characteristics of
workers in selected LTC occupations. We categorized respondents as LTC stayers,
entrants, and leavers as defined previously, but for Tables 5 and 6 we used the
current year occupation for stayers and entrants, and the prior year occupation for
leavers.
Most of the workers in the selected LTC occupations were female, and this did not
vary greatly by LTC transition status (Table 5). While LTC entrants into MA, NPHH,

UCSF Health Workforce Research Center on Long-Term Care Research Report
21
and PCA positions were more likely to be younger than stayers, LTC occupation
leavers were almost equally as likely to be young. The racial/ethnic mix of entrants,
stayers, and leavers was considerably different, with the exception of MAs entering
LTC, who were less diverse, and social and community services managers entering
LTC, who were more diverse. For all occupations, stayers were more likely to be
married. Leavers in these occupations were more than, or just as likely to have a
child under age five in the household as were entrants.

UCSF Health Workforce Research Center on Long-Term Care Research Report
22
Table 5. Demographic Characteristics of Entrants, Stayers, and Leavers by Select
Long-Term Care Occupations, Pooled 2003-2013
Female Age 16-24 Years
Age 55-64 Years
White Married Child under Age 5 in
Household
Registered Nurse Entrants 90% 4% 30% 70% 53% 11% Stayers 93% 2% 28% 70% 60% 12% Leavers 92% 2% 21% 72% 58% 11%
Licensed Practical Nurse/Licensed Vocational Nurse Entrants 95% 14% 11% 61% 48% 14% Stayers 93% 5% 17% 63% 53% 13% Leavers 95% 4% 17% 65% 52% 15%
Nursing, Psychiatric and Home Health Aide Entrants 90% 26% 8% 48% 37% 18% Stayers 92% 15% 14% 45% 40% 14% Leavers 92% 25% 10% 50% 36% 20%
Medical Assistant and Other Health Aide
Entrants 88% 46% 3% 65% 22% 11% Stayers 80% 31% 11% 58% 32% 13% Leavers 73% 45% 11% 62% 27% 14%
Personal and Home Care Aide Entrants 83% 24% 13% 50% 35% 15% Stayers 88% 11% 18% 52% 41% 10%
Leavers 87% 16% 17% 50% 37% 15% Social and Community Services Manager
Entrants 74% 5% 24% 65% 50% 6% Stayers 75% 2% 21% 74% 64% 9% Leavers 70% 5% 20% 74% 54% 8%
Social Worker
Entrants 75% 11% 13% 56% 45% 13% Stayers 82% 5% 16% 61% 54% 15% Leavers 78% 8% 13% 57% 50% 15%
Misc. Community and Social Services Specialist Entrants 77% 4% 15% 56% 43% 7% Stayers 76% 12% 15% 53% 48% 11% Leavers 75% 17% 11% 54% 38% 13%
Physical Therapist Entrants 73% 9% 2% 71% 73% 18% Stayers 74% 0% 9% 78% 75% 30% Leavers 73% 0% 12% 65% 65% 23%
Note: Entrants to LTC could have held a different occupation prior to entry; Leavers to LTC could have held a different occupation upon leaving. Source: Author calculation from Miriam King, Steven Ruggles, J. Trent Alexander, Sarah Flood, Katie Genadek, Matthew B. Schroeder, Brandon Trampe, and Rebecca Vick. Integrated Public Use Microdata Series, Current Population Survey: Version 3.0. [Machine-readable database]. Minneapolis: University of Minnesota, 2010.

UCSF Health Workforce Research Center on Long-Term Care Research Report
23
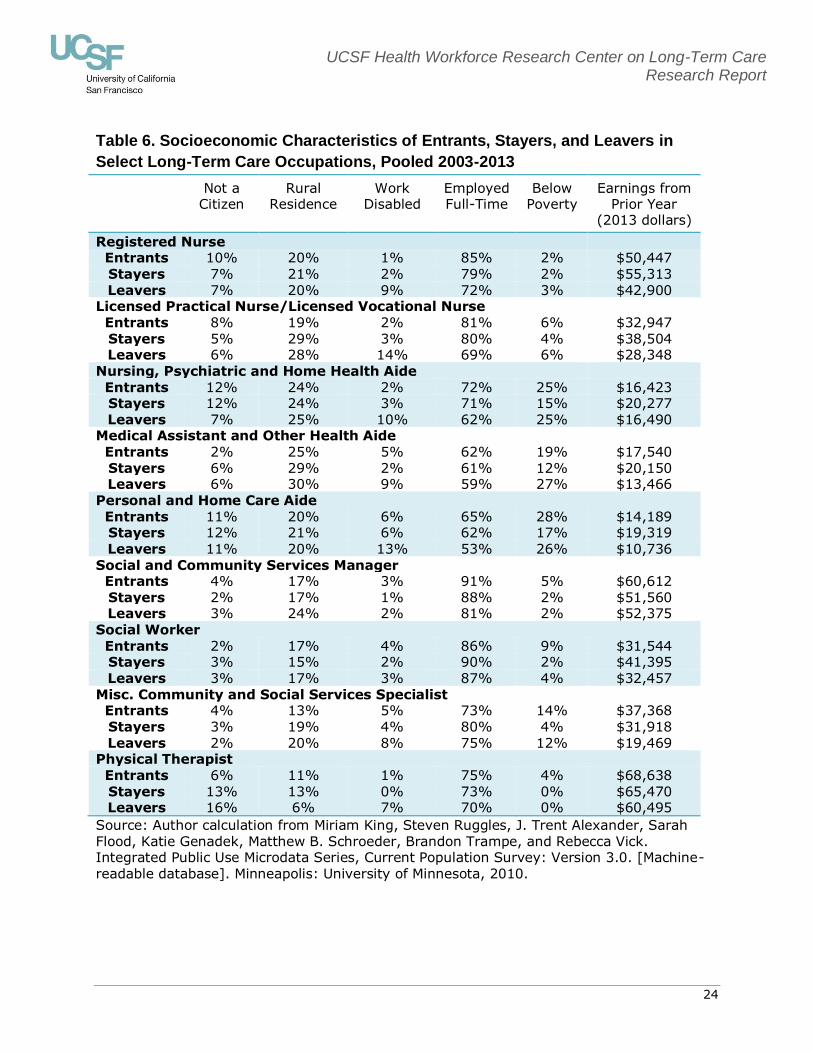
LTC entrants who were RNs, LPNs/LVNs, NPHHs, PCAs, and social and community
services managers were less likely to be U.S. citizens compared with stayers and
leavers, while LTC entrants who were MAs, social workers, and PTs were more likely
to be U.S. citizens (Table 6). LTC leavers were more likely to live in rural areas
compared with LTC entrants and/or stayers, with the exception of leavers who were
PTs. For all occupations except social and community services managers and social
workers, LTC leavers were more likely to report a work disability. Of particular note
is the high level of work disability reported among some types of workers, such as
LPNs/LVNs and PCAs. LTC leavers more often worked part-time, compared with
entrants and stayers. The share of workers below poverty was particularly high
among NPHHs, MAs, PCAs, and miscellaneous community and social services
specialists. The rate of poverty among entrants and leavers was similar across
these four occupations, as compared with stayers, which suggests that those
changing jobs were not necessarily transitioning to a better economic state. This
pattern is emphasized by LTC leavers having lower earnings than both LTC entrants
and stayers.
UCSF Health Workforce Research Center on Long-Term Care Research Report
24
Table 6. Socioeconomic Characteristics of Entrants, Stayers, and Leavers in
Select Long-Term Care Occupations, Pooled 2003-2013
Not a Citizen
Rural Residence
Work Disabled
Employed Full-Time
Below Poverty
Earnings from Prior Year
(2013 dollars)
Registered Nurse Entrants 10% 20% 1% 85% 2% $50,447 Stayers 7% 21% 2% 79% 2% $55,313 Leavers 7% 20% 9% 72% 3% $42,900
Licensed Practical Nurse/Licensed Vocational Nurse Entrants 8% 19% 2% 81% 6% $32,947 Stayers 5% 29% 3% 80% 4% $38,504 Leavers 6% 28% 14% 69% 6% $28,348
Nursing, Psychiatric and Home Health Aide Entrants 12% 24% 2% 72% 25% $16,423 Stayers 12% 24% 3% 71% 15% $20,277 Leavers 7% 25% 10% 62% 25% $16,490
Medical Assistant and Other Health Aide
Entrants 2% 25% 5% 62% 19% $17,540 Stayers 6% 29% 2% 61% 12% $20,150 Leavers 6% 30% 9% 59% 27% $13,466
Personal and Home Care Aide Entrants 11% 20% 6% 65% 28% $14,189 Stayers 12% 21% 6% 62% 17% $19,319
Leavers 11% 20% 13% 53% 26% $10,736 Social and Community Services Manager Entrants 4% 17% 3% 91% 5% $60,612 Stayers 2% 17% 1% 88% 2% $51,560 Leavers 3% 24% 2% 81% 2% $52,375
Social Worker
Entrants 2% 17% 4% 86% 9% $31,544 Stayers 3% 15% 2% 90% 2% $41,395 Leavers 3% 17% 3% 87% 4% $32,457
Misc. Community and Social Services Specialist Entrants 4% 13% 5% 73% 14% $37,368 Stayers 3% 19% 4% 80% 4% $31,918 Leavers 2% 20% 8% 75% 12% $19,469
Physical Therapist Entrants 6% 11% 1% 75% 4% $68,638 Stayers 13% 13% 0% 73% 0% $65,470 Leavers 16% 6% 7% 70% 0% $60,495
Source: Author calculation from Miriam King, Steven Ruggles, J. Trent Alexander, Sarah Flood, Katie Genadek, Matthew B. Schroeder, Brandon Trampe, and Rebecca Vick. Integrated Public Use Microdata Series, Current Population Survey: Version 3.0. [Machine-readable database]. Minneapolis: University of Minnesota, 2010.

UCSF Health Workforce Research Center on Long-Term Care Research Report
25
Sector Movements among Select Long-Term Care Occupations
For all occupations except physical therapy, the share of LTC leavers was higher
than the share of LTC entrants, which is consistent with the aggregate level LTC
sector trends (Table 7). The gap ranged from 1% to as high as 9% among PCAs.
Hospitals were a common source of RNs, LPNs/LVNs, NPHHs, and PTs who entered
LTC. Leisure and hospitality were a common sector from which MAs, PCAs, and
social and community service managers entered the LTC industry. Many LTC
entrants were previously unemployed or not in the labor force. (We were unable to
distinguish these due to the way the data were coded.) Figure 5 presents the
reasons LTC entrants reported being out of the labor force or unemployed in the
year prior to entering LTC. Going to school or taking care of the home and/or family
were among the most common reasons for not working.
PTs, RNs, LPNs/LVNs, NPHHs, and MAs most often entered the LTC sector of
nursing care facilities (Table 7). PCAs, social and community service managers,
social workers, and the miscellaneous community and social service specialists
most commonly entered into the individual and family services sectors.
For nearly all occupations, about one-half to two-thirds of the respondents who left
LTC either became unemployed or left the labor force. As noted, we are not able to
determine why a respondent left the labor force and whether the decision was
voluntary or not. One-third of RNs and one-fifth of PTs, however, left to work in
hospitals.

UCSF Health Workforce Research Center on Long-Term Care Research Report
26
Table 7. Sector Transition Trends by Select Long-Term Care Occupations, Pooled 2003-2013
Occupation
LTC Entrant*
LTC Leaver*
LTC Entrant: Prior Year Sector (Top 2)**
LTC Entrant: Current Year LTC Sector (Top 2)
LTC Leaver: Current Year Sector (Top 2)**
Registered Nurse 13% 19% 56% Hospitals 10% NILF/unemployed
59% Nursing care facilities 36% Home health care services
38% Hospitals 21% NILF
Licensed Practical Nurse/Licensed Vocational Nurse
15% 16% 38% Hospitals 11% NILF/unemployed
82% Nursing care facilities 14% Home health care services
28% NILF 24% Hospitals
Nursing, Psychiatric, & Home Health Aide
13% 21% 27% NILF/unemployed 20% Hospitals
59% Nursing care facilities 32% Home health care services
37% NILF 24% Unemployed
Medical Assistant & Other Health Aide
17% 20% 17% NILF/unemployed 17% Leisure & hospitality
81% Nursing care facilities 14% Residential care facilities
32% NILF 22% Unemployed
Personal and Home Care Aide
17% 26% 32% NILF/unemployed 15% Leisure & hospitality
32% Individual & family services 30% Home health care services
43% NILF 21% Unemployed
Social & Community Service Manager
10% 13% 24% Other services 7% Leisure & hospitality
77% Individual and family services 10% Residential care facilities
24% NILF 15% Unemployed
Social Worker 11% 15% 24% Public administration 17% Education
75% Individuals and family services 12% Residential care facilities
21% Unemployed 20% NILF
Misc. Community and Social Service Specialist
13% 21% 17% NILF/unemployed 14% Other services
85% Individual and family services 7% Community food and housing/emergency services
34% NILF 20% Unemployed
Physical Therapist 13% 11% 44% Hospitals 24% Outpatient care centers
45% Nursing care facilities 41% Home health care services
36% Outpatient care centers 21% Hospitals
Source: Author calculation from Miriam King, Steven Ruggles, J. Trent Alexander, Sarah Flood, Katie Genadek, Matthew B. Schroeder, Brandon Trampe, and Rebecca Vick. Integrated Public Use Microdata Series, Current Population Survey: Version
3.0. [Machine-readable database]. Minneapolis: University of Minnesota, 2010. Notes: *Entry/exit rate is into/out of any of the six LTC sectors **Entry/exit to non-LTC sectors NILF = Not in labor force

UCSF Health Workforce Research Center on Long-Term Care Research Report
27
Figure 5. Reasons for Not Working in Prior Year among Long-Term Care Entrants
by Select Long-Term Care Occupations, Pooled 2003-2013
Source: Author calculation from Miriam King, Steven Ruggles, J. Trent Alexander, Sarah Flood, Katie Genadek, Matthew B. Schroeder, Brandon Trampe, and Rebecca Vick. Integrated Public Use Microdata Series, Current Population Survey: Version 3.0. [Machine-
readable database]. Minneapolis: University of Minnesota, 2010. Notes: LPN/LVN = Licensed Practical Nurse/Licensed Vocational Nurse; MA = Medical Assistant; NPHH = Nursing, Psychiatric, and Home Health Aide; PCA = Personal and Home Care Aide; PT = Physical Therapist; RN = Registered Nurse
Occupational Movement among Long-Term Care Entrants and Leavers by Select
Occupations
Job changes can be associated with opportunities for increased responsibilities and
pay, and may indicate upward mobility of workers. In the ten-year pooled sample
of the CPS, 12% of the respondents reported a job change between the prior and
the current year. Similarly, among those who reported working in the LTC industry
in the current year, 11% reported a job change.
Table 8 explores occupational changes among LTC sector entrants and leavers for
selected LTC occupations. In general, the rates of occupation change were higher

UCSF Health Workforce Research Center on Long-Term Care Research Report
28
among LTC leavers than LTC entrants for each occupation except PTs. If a
respondent stayed in the LTC sector, the likelihood that they changed occupations
was low. Among LTC entrants who also changed occupations, many of the
respondents were not in the labor force in the prior year. There appears to be some
level of hierarchy among the occupations: MAs moved into NPHH occupations,
LPNs/LVNs moved into RN occupations, and RNs moved into PT occupations. Among
social and community services managers, there appears to have been lateral
movement across management-level positions. Among LTC leavers who changed
their occupation, most left the labor force or were unemployed in the year after
leaving LTC.

UCSF Health Workforce Research Center on Long-Term Care Research Report
29
Table 8. Occupation Transition Trends among Select Long-Term Care Occupations, Pooled 2003-2013
LTC Occupation LTC Entrant: Rate of
Occupation Change
LTC Stayer: Rate of
Occupation Change
LTC Leaver: Rate of
Occupation Change
LTC Entrant: Job Prior to LTC Entry if Job
Changed (Top 2)
LTC Leaver: Job After Leaving LTC if
Job Changed (Top 2)
Registered Nurse 25% 7% 47% 40% NILF 17% LPN/LVN
45% NILF 28% Unemployed
Licensed Practical Nurse/Licensed Vocational Nurse
55% 1% 68% 27% Health diagnosing and treating practitioner support technician 20% NILF
40% NILF 24% Unemployed
Nursing, Psychiatric, and Home Health Aide
67% 1% 82% 39% NILF 11% Medical assistant and other health aide
45% NILF 29% Unemployed
Medical Assistant and Other Health Aide
70% 7% 86% 24% NILF 18% Food preparation and service related
37% NILF 25% Unemployed
Personal and Home Care Aide
94% 2% 96% 50% NILF 28% Personal care and services occupations (excl. PCAs)
45% NILF 22% Unemployed
Social and Community Service Manager
78% 2% 87% 50% Management occupations 8% Medical and health services manager
30% Management occupations 27% NILF
Social Worker 68% 2% 75% 17% NILF 15% Counselors
28% Unemployed 26% NILF
Misc. Community and Social Services Specialist
86% 4% 91% 21% NILF 16% Social worker
28% NILF 22% Unemployed
Physical Therapist 55% 2% 53% 74% RN 13% NILF
31% NILF 13% Occupational therapist
Source: Author calculation from Miriam King, Steven Ruggles, J. Trent Alexander, Sarah Flood, Katie Genadek, Matthew B. Schroeder, Brandon Trampe, and Rebecca Vick. Integrated Public Use Microdata Series, Current Population Survey: Version 3.0. [Machine-readable database]. Minneapolis: University of Minnesota, 2010.
Notes: *Excludes counselors, social workers, misc. community and social service specialists LPN/LVN = Licensed Practical Nurse/Licensed Vocational Nurse; NILF = Not in labor force; NPHH = Nursing, Psychiatric, and Home Health Aide; PCA = Personal and Home Care Aide; RN = Registered Nurse

UCSF Health Workforce Research Center on Long-Term Care Research Report
30
Conclusions
LTC employs a high share of low-skilled workers. Many common LTC occupations,
however, are not associated with direct health care, such as building and grounds
cleaning and maintenance, office and administrative support, food preparation and
food service, management, and transportation and material moving. Despite
expected increases in demand for LTC services as Baby Boomers age, the leave
rate is outpacing the entry rate across all LTC sectors. The LTC industry saw a slight
slowdown in sectoral movement during the 2007-2009 recession, when other
sectors in the U.S. saw greater movement.
LTC sector entrants and leavers were generally younger than those who stayed in
LTC. There were no noticeable differences in the racial/ethnic mix of LTC sector
entrants, stayers, and leavers. LTC leavers were more likely to report a work
disability than were LTC entrants or stayers. LTC stayers were less likely to be in
poverty, and had higher average annual wages. These patterns were even more
pronounced when focusing on LTC workers in lower-skilled aide positions.
A large share of LTC entrants were not in the labor force in the prior year, with a
dominant share of those reporting being engaged in school or taking care of the
home or family. Nursing care facilities often drew LTC workers from hospitals, while
individual and family services tended to draw LTC workers from leisure and
hospitality.
Few LTC stayers changed occupations, which suggests there is limited opportunity
for upward mobility in the LTC industry. On the other hand, some evidence of a
career ladder appears when looking at job changes among LTC entrants. However,
most LTC leavers found themselves unemployed or out of the labor force. The trend
was consistent across sectors and occupations with the exception of the more
highly skilled jobs such as PTs and social and community service managers.
Limitations
This analysis has several limitations, the most important of which are linked to
limitations of the CPS. Respondents to the CPS self-report the sector and
occupation of their employment, and respondents may not report these accurately.
In addition, the CPS does not enable us to identify job transitions that do not
involve a change in occupation or sector.
Because LTC is provided in both institutional and home- and community-based
settings, we included three home- and community-based industries in this analysis
that are not exclusive to LTC services. For example, the sector of community food
UCSF Health Workforce Research Center on Long-Term Care Research Report
31
and housing/emergency services includes homeless shelters, food banks, and other
services that are unrelated to LTC. The individual and family services sector
includes services such as housekeeping and meal delivery, which are often
purchased without LTC needs. Private households can employ housekeepers
(separately from a housekeeping service) and child care providers, as well as
personal aides, which again, may not be related to LTC needs.
Implications and Future Directions
Our analysis indicates that there is reason to be concerned about sector and
occupational turnover in LTC. First, the rate of leaving LTC is greater than the entry
rate. Second, LTC entrants are increasingly younger, low skilled, and low income
with no clear career ladder or evidence of job mobility. Third, LTC leavers report
greater levels of work disability, have high levels of poverty, and are often
unemployed. These patterns suggest that there may be challenges to maintaining
an adequate and well-trained workforce as the demand for LTC workers grows.
A large share of those who left the LTC industry was subsequently out of the labor
force or unemployed. This, combined with the high rate of poverty observed among
those who work in LTC occupations, raises concerns about the economic condition
of LTC workers. LTC occupations can be demanding and, as found in our analysis,
often do not offer high wages. One longitudinal study of Pennsylvania CNAs found
that workers who left the LTC industry had lower job satisfaction and emotional
well-being, and many left for health reasons.13 Future research should explore the
long-term employment paths of LTC workers who became unemployed or leave the
labor market. It is not known if these transitions provide opportunities to obtain
higher-paying jobs or develop new skills, or if they increase the likelihood that LTC
workers will live in poverty.
In order to improve recruitment and retention of LTC workers, as well as address
the high rate of poverty and lack of upward mobility of many LTC occupations,
employers, educators, and policymakers should consider investments in education
and training. Well-crafted training programs not only can improve the job skills of
direct-care workers but also reduce occupational injury rates and job turnover.14, 15,
16 Most states regulate the training of home health aides and certified nursing
assistants, but few states have well-developed training requirements for personal
care aides.17 The ACA authorized funds to provide new training opportunities for
direct-care workers who are employed in assisted living facilities, skilled nursing
facilities, intermediate care facilities for individuals with developmental disabilities,
and home and community-based settings.18 Investments in training for workers in
these occupations will likely help to ensure an adequately trained workforce in LTC,
as well as support improved retention of LTC workers.

UCSF Health Workforce Research Center on Long-Term Care Research Report
32
References
1. Bureau of Labor Statistics (BLS). 2014. Employment Projections Program.
Washington DC: U.S. Department of Labor, U.S. Bureau of Labor Statistics.
2. Department of Health and Human Services (DHHS). 2003. The Future Supply
of Long-Term Care Workers in Relation to the Aging Baby Boom Generation.
Washington DC: U.S. Department of Health and Human Services.
3. Harris-Kojetin, L., M. Sengupta, E. Park-Lee, and R. Valverde. 2013. Long-
Term Care Services in the United States: 2013 Overview. Hyattsville, MD: National
Center for Health Statistics.
4. Temple, A., D. Dobbs, and R. Andel. 2009. Exploring correlates of turnover
among nursing assistants in the National Nursing Home Survey. Health Care
Management Review, 34 (2): 182-190.
5. American Health Care Association. 2012. American Health Care Association
2012 Staffing Report. Washington DC: American Health Care Association.
http://www.ahcancal.org/research_data/staffing/Documents/2012_Staffing_Report.
6. Castle, N.G., and J. Engberg. 2005. Staff turnover and quality of care in
nursing homes. Medical Care Research and Review, 43: 616–626.
7. Castle, N.G., and J. Engberg. 2006. Organizational characteristics associated
with staff turnover in nursing homes. The Gerontologist, 46: 62–73.
8. Trinkoff, A.M., K. Han, C.L. Storr, N. Lerner, M. Johantgen, and K. Gartrell.
2013. Turnover, staffing, skill mix, and resident outcomes in a national sample of
US nursing homes. Journal of Nursing Administration, 43 (12): 630-636.
9. Luo, H., M. Lin, and N.G. Castle. 2012. The correlates of nursing staff
turnover in home and hospice agencies: 2007 national home and hospice care
survey. Research on Aging, online 16 April 2012.
10. King, M., S. Ruggles, J.T. Alexander, S. Flood, K. Genadek, M.B. Schroeder,
B. Trampe, and R. Vick. 2010. Integrated Public Use Microdata Series, Current
Population Survey: Version 3.0. [Machine-readable database]. Minneapolis:
University of Minnesota.
11. Bureau of Labor Statistics (BLS). 2014b. Labor Force Characteristics by Race
and Ethnicity, 2013. Washington DC: U.S. Department of Labor, U.S. Bureau of
Labor Statistics. http://www.bls.gov/cps/cpsrace2013.pdf

UCSF Health Workforce Research Center on Long-Term Care Research Report
33
12. Bureau of Labor Statistics. 2015. Databases, Tables & Calculators by
Subject: Labor Force Statistics from the Current Population Survey. Washington
DC: U.S. Department of Labor, U.S. Bureau of Labor Statistics.
http://data.bls.gov/timeseries/LNS14000000
13. Rosen, J., E.M. Stiehl, V. Mittal, and C.R. Leana. 2011. Stayers, leavers, and
switchers among certified nursing assistants in nursing homes: A longitudinal
investigation of turnover intent, staff retention, and turnover. The Gerontologist, 51
(5): 597–609.
14. Benjamin, A. and R. Matthias. 2005. “Intent to Stay" among home care
workers in California. Home Care Services Quarterly, 24 (3): 39-56.
15. Faul, A.C., T.J. Schapmire, et al. 2010. Promoting sustainability in frontline
home care aides: Understanding factors affecting job retention in the home care
workforce. Home Health Care Management & Practice, 22 (6): 408-416.
16. McCaughey, D., J. Kim, et al. 2012. Workforce implications of injury among
home health workers: Evidence from the National Home Health Aide Survey. The
Gerontologist, 52 (4): 493-505.
17. Marquand, A. and S.A. Chapman. 2014. The National Landscape of Personal
Care Aide Training Standards. San Francisco, CA: UCSF Health Workforce Research
Center.
18. Spetz, J., B. Frogner, L. Lucia, and K. Jacobs. 2014. New Jobs in the
Affordable Care Act. Berkeley, CA: Institute for Research on Labor and
Employment.

UCSF Health Workforce Research Center on Long-Term Care Research Report
34
Acronyms Used in this Report
BLS Bureau of Labor Statistics
CNA Certified nursing assistant
CPS Current Population Survey
LTC Long-term care
LVN/LPN Licensed vocational nurse/licensed practical nurse
MA Medical assistants and other health aide
NILF Not in labor force
NPHH Nursing, psychiatric, and home health aide
PCA Personal and home care aide
PT Physical therapist
RN Registered nurse
US United States

UCSF Health Workforce Research Center on Long-Term Care Research Report
35
Appendix
Appendix Table 1: Census and NAICS Crosswalk for Selected Long-Term Care
Sectors
Census Code NAICS Sector Description
8170 6216 Home health care services
8270 6231 Nursing care facilities
8290 6232, 6233, 6239 Residential care facilities, without nursing
8370 6241 Individual and family services
8380 6242 Community food and housing, and emergency services
9290 8140 Private households
Source: IPUMS USA. Codes for Industry (IND) and NAICS Industry (INDNAICS) in the 2000-2002 ACS Samples. Minnesota Population Center, University of Minnesota. https://usa.ipums.org/usa/volii/indcross.shtml
Appendix Table 2: Census and SOC Crosswalk for Selected Long-term Care
Occupations
Census Code SOC Occupation Description
0420 119151 Social and community service managers
2010 211020 Social workers
2020 211090 Miscellaneous community and social service specialists
(including community health workers)
3130 291111 Registered nurses
3160 291123 Physical therapists
3500 292061 Licensed practical nurses or licensed vocational nurses
3600 311010 Nursing, psychiatric, and home health aides
3650 31909X Medical assistants and other health care support occupations
4610 399021 Personal care and home care aides
Source: IPUMS USA. Occupation Crosswalk – OCC and OCCSOC 2000 Census Samples. Minnesota Population Center, University of Minnesota. https://usa.ipums.org/usa/volii/census_occtooccsoc.shtml


![Untitled-1 [] · gurgaon site layout plan entry / exit for residential exit for residential entry for e.ws. exit for e.w.s. house commercial nursery school primary ew.s.apartments](https://img.pdfslide.net/doc/110x75/5e7b32ef2ad65a0a4843abe9/untitled-1-gurgaon-site-layout-plan-entry-exit-for-residential-exit-for-residential.jpg)