Embed Size (px)
Citation preview
Environment and Landscape Change in Protected Areasof mainland Southeast Asia
Objectives:- Characterize landscape in protected areas
- Analyse patterns of land cover change
- Examine role of conservation in shaping landscape across scales
This study employs data at several scales to examine the influenceof conservation efforts on land use and land cover change inmainland Southeast Asia. A regional assessment of landscapeconditions in national parks and wilderness areas is discussed inconjunction with more detailed case studies located in Lao PDRand Thailand.
High temporal-resolution AVHRR data and other information
are used at the regional scale to evaluate the influence of protectedarea boundaries on vegetation pattern and environmental seasonality.Results are linked with measures of land use pattern and land coverchange at the landscape- to local-scales, derived from field surveys,air photographs, and Landsat TM data.
Keywords: land use, scale, conservation
Abstract:
Sources
landscape in protected areas
patterns of land cover change
role of conservation in shaping landscape
Protected areas: the World Conservation Monitoring Center, 2000.Land Cover: 1 km resolution Global Ecosystem classification from GlobalLand Cover Characteristics database, version 1. USGS EROS Data Center.Elevation: 1 km resolution GTOPO30 data set. USGS EROS Data Center.Population: Landscan Global Population 1998 database. Dr. Jerome Dobson,Oak Ridge National Laboratory.
NDVI and Surface Temperature: derived from Global AVHRR 10-daycomposites data. USGS EROS Data Center. Processed using IDRISI,ArcView, and ENVI.Landsat TM and Forest Change: Tropical Rain Forest Information Center(TRFIC).Topographic Map: Map ND48-08, 1:250,000, Muang Mai, Laos. 1972.
Nicholas P. KohlerDepartment of Geography
University of [email protected]
Protected areas of mainlandSoutheast Asia
8 percent of the land area ofmainland Southeast Asia --over 210,000 squarekilometers -- is in some formof protected status (IUCNcategories I - VI).
In 1999 there were 258protected areas in thecountries of Cambodia (18%land area protected), LaoPDR (16% protected),
Thailand (12% protected),and Vietnam (6% protected).
Many of the areas wereestablished during and afterthe Vietnam War, and thereis a wealth of detailedinformation for the past 30years to assess the influenceof protected status onlandscape and land coverchange.
Case Study 1 - ThailandCase Study 2 - Lao PDR and Cambodia
Countries
other
V - Protected Landscape/SeascapeVI - Managed Resource Protected Area
II - National ParkIII - National MonumentIV - Habitat/Species Management Area
Ia - Strict Nature Reserve
200 0 200 400 600 800 km
Tropical Rainforest10 100 10000 sq. km
Cambodia
Vietnam
Lao PDR
Thailand
Tropical degraded forest10 100 10000 sq.km
The area shown here, including partsof Myanmar, Bangladesh, China,
Taiwan, Indonesia, and Brunei hasover 430 area with some form of
conservation status.
Amount of rainforest perprotected area
Thailand
Lao PDR
Vietnam
Cambodia
N
S
EW
Land CoverThe dominant land cover inprotected areas is tropicalrainforest, with substantialportions of croplands and mixedforest as well.At the local/landscape scale, the
broad classifications of theregional land cover data showimportant internal differencesin vegetation and land use.
This Eucalyptus plantation near Phu Pa Man NPin Thailand is in an area classified as “Crops andtown” in the regional land cover data. The same
area is classified and newly forested in the Thailandcase study.
tropical rainforestrice paddy and field fields and woodysavannah
Major types of protected land cover
100000
10000
1000 km sq.
100
10
1 percent
1000000 Square km total land cover type
percent of vegetation type protected
Square km protected land cover type
tropicalrainforest
rice paddyand field
mixedforest
rain greentropical forest
seasonal tropical������
fields and woodysavannah
tropical degradedforest
Percent of regional protected land areatropical rainforest 28.8%rice paddyand field 16.8%mixed forest 11.0%rain greentropical forest 10.9%
seasonaltropical forest 8.0%fields andwoody savannah 6.2%tropicaldegraded forest 3.8%
SeasonalityInfluenced by the Asianmonsoon system, the climate inmainland Southeast Asia isstrongly seasonal.
In the case study areas, rainy
season begins around May-Juneand lasts until October-November, followed by a coolseason (November - February),and a hot dry season (February- May).
cooler -------------------------------------- warmerPCA band 1 of monthly Surface Temperature
PCA
band
1 o
f mon
thly
ND
VIle
ss g
reen
--
------
----
mor
e gr
een
white points = NDVI / Surface Temperature space all landgreen points = protected areas
Protected areas contain asubstantial portion of the greenbiomass during the dry season.A principal components analysisof seasonal AVHRR data showsprotected areas concentrated intwo clumps in the seasonaltemperature and greenness space.
Surface TemperaturePCA band 1
Greenness (NDVI)PCA band 1
Elevation, roughness of terrain,and remoteness influence thesiting of protected areas andenvironmental conditionswithin.These same factors create
demands for resource extraction,infrastructure development, andsecurity measures.
Topography The steep eastern flanks of theBolovens Plateau in Lao PDR are
covered with tropical seasonalrainforest. Hydropower (shown here) development impinges upon land in
many protected areas.
Parks in seasonal biomass andtemperature space
0-50 meters 200-300 meters above 800 meters
Cambodia
Vietnam
Lao PDR
Thailand
0 30 60 celsius
500000
0 sq. km
250000
SurfaceTemperature
total
SurfaceTemperature
protected
25000
0 sq. km
1000000
500000
0 sq. kmNDVI total
50000
25000
0 sq. km
NDVIprotected
0 30 60 celsius 0 30 60 celsius 0 30 60 celsius
June 1993
June 1993 NDVI
June 1993 Surf Temp
April 1993
April 1993 NDVI
April 1993 Surf Temp
February 1993
Feb. 1993 Surf Temp
December1992
Dec. 1992 Surf Temp
October 1992
Oct. 1992 Surf Temp
August 1992
August 1992 Surf Temp
June 1992
June 1992 Surf Temp
April 1992
April 1992 Surf Temp
April 1992 NDVI Feb. 1993 NDVIDec. 1992 NDVIOct. 1992 NDVIAug. 1992 NDVIJune 1992 NDVI
2-month intervals of surface temperature and vegetation index
PopulationSparsely inhabited comparedto other regions of Asia,populations are concentratedalong river valleys, with sizableportions of minority groupsdistributed throughout the
uplands and disproportionatelyeffected by protected areas.Based on 1-km resolutiondata, over 5 million people arein or near protected areas --just under 2% of the regionspopulation.
This village in northeasternThailand of about 300 inhabitantslies within a designated national
park. many of the inhabitantssetlled the area well before the
park was established.
5000+ persons per square km0 - 4 persons per square km
1000 m 2000 m0 km sq.
300000
600000 Elevation distributionin mainland southeast
asia
1000 m 2000 m
Elevation distributionin protected areas
30000
15000
0 km sq.
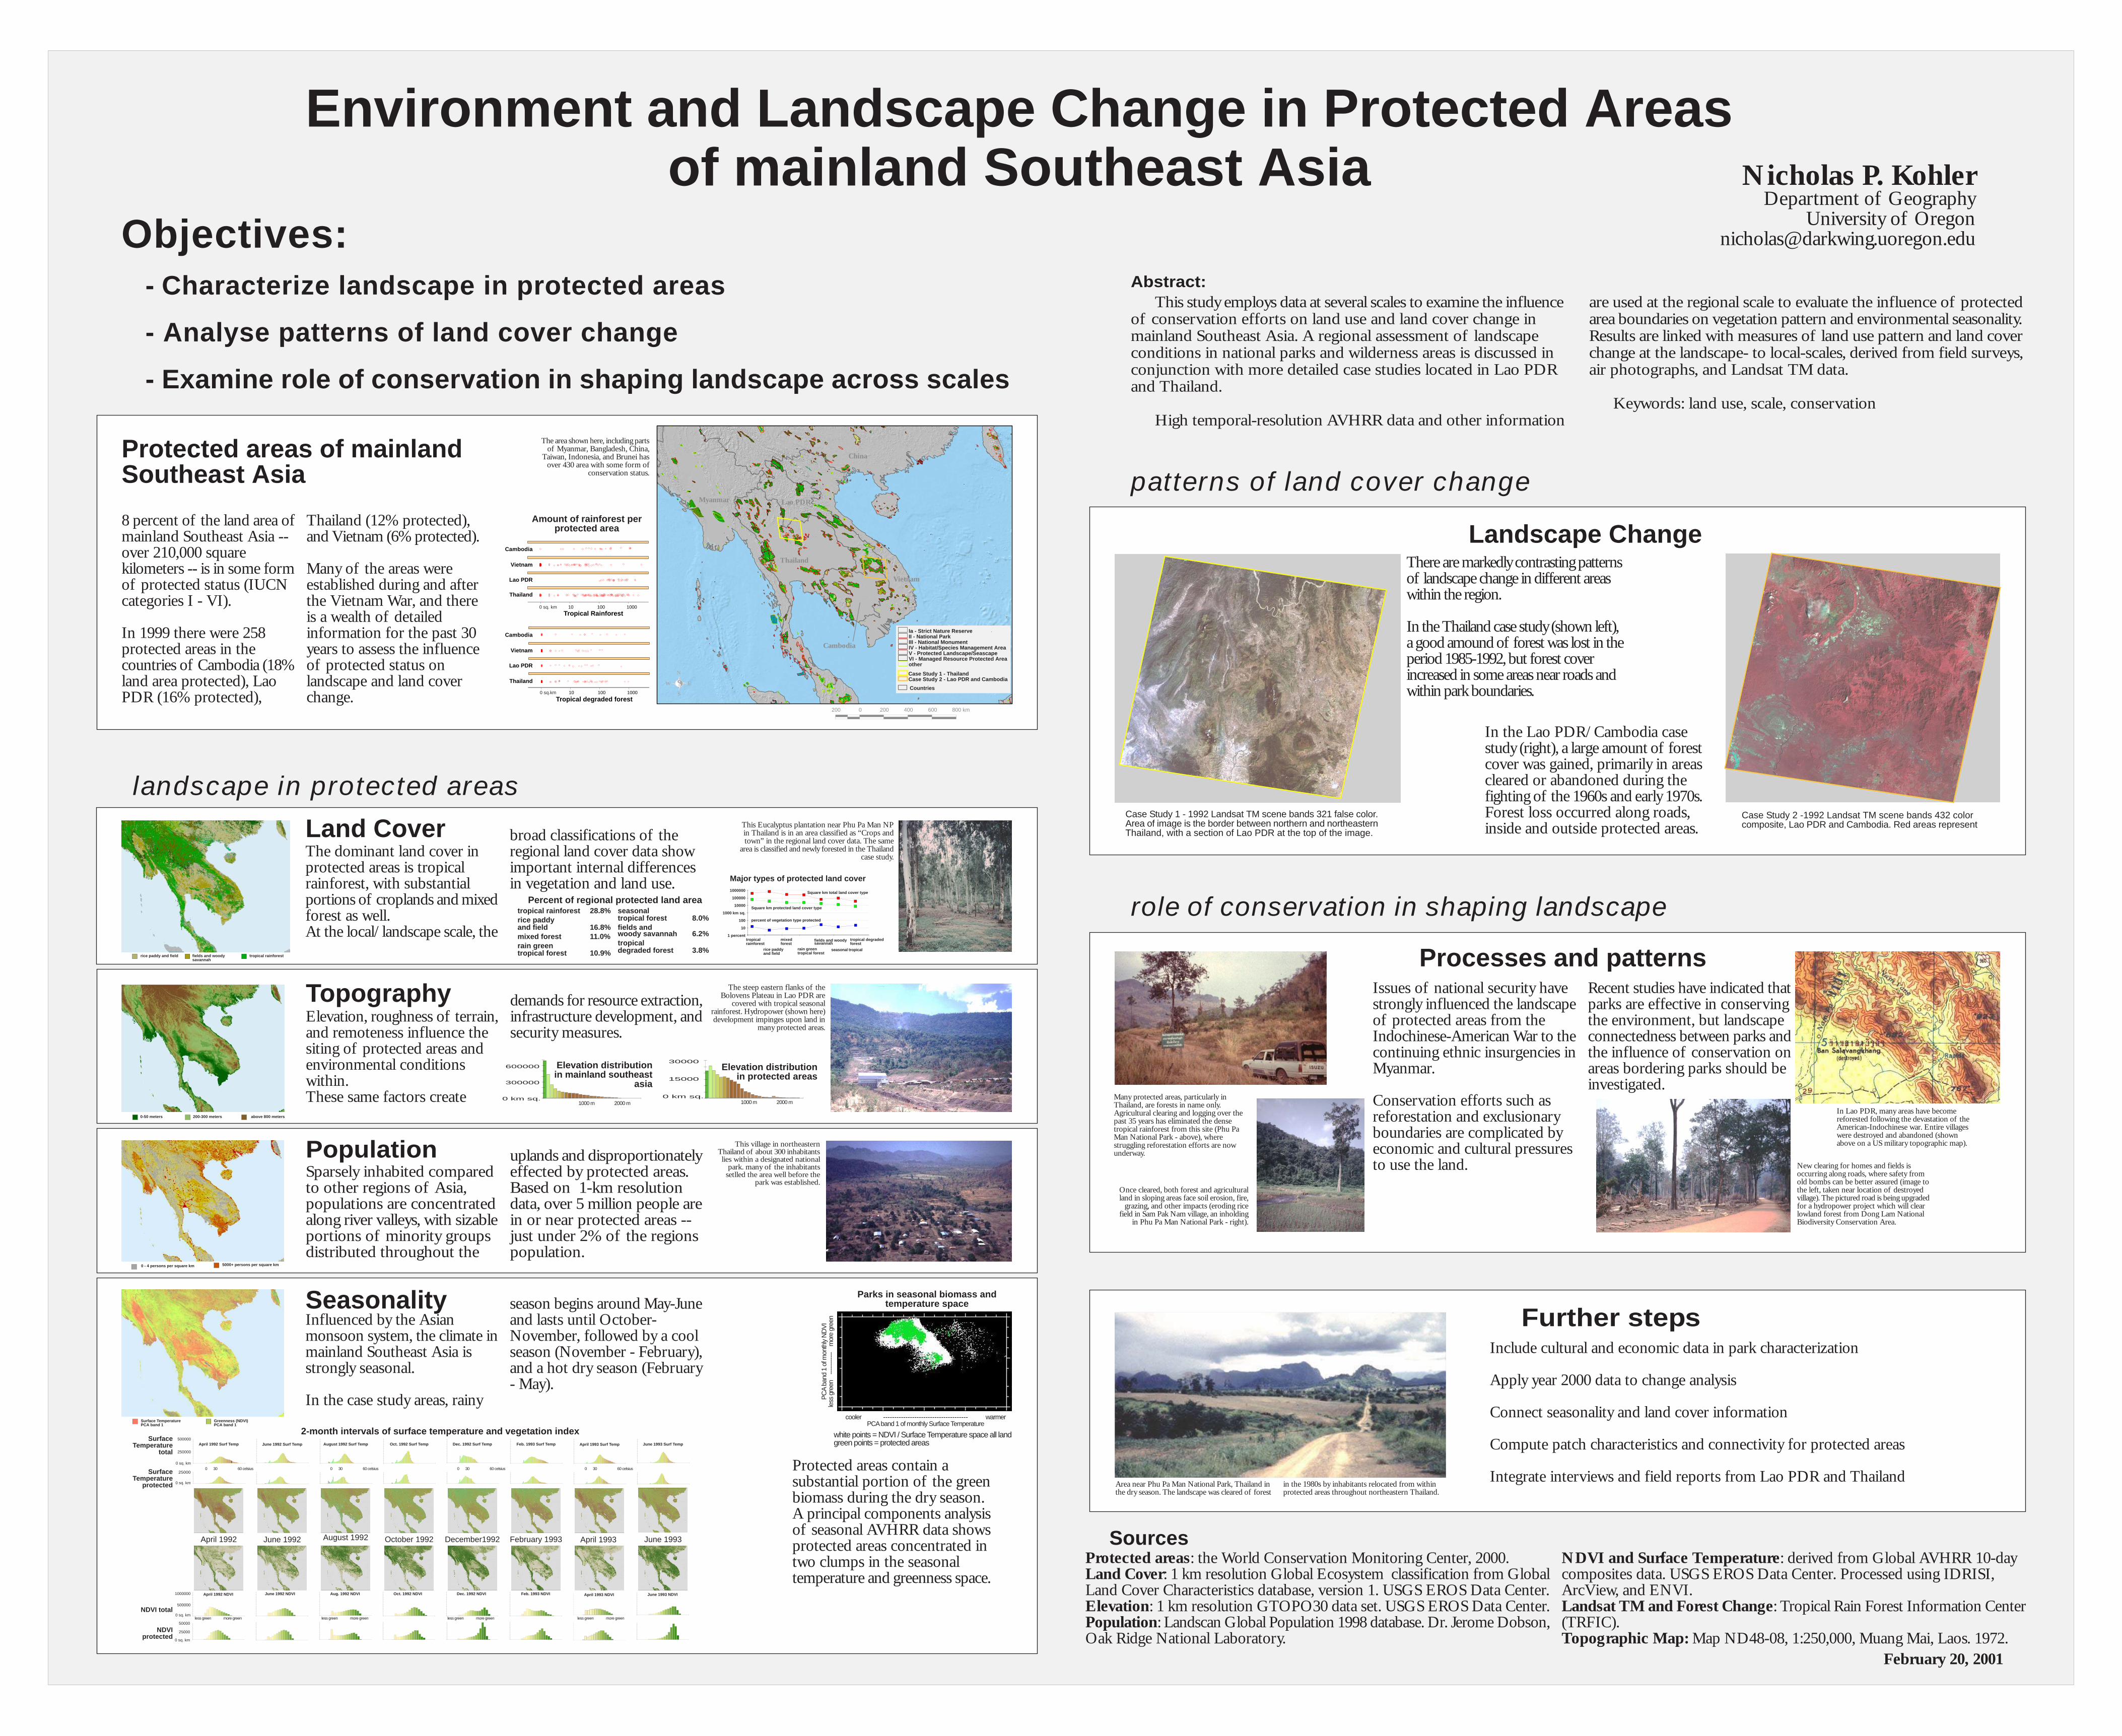
Landscape ChangeThere are markedly contrasting patternsof landscape change in different areaswithin the region.
In the Thailand case study (shown left),a good amound of forest was lost in theperiod 1985-1992, but forest coverincreased in some areas near roads andwithin park boundaries.
Case Study 1 - 1992 Landsat TM scene bands 321 false color.Area of image is the border between northern and northeasternThailand, with a section of Lao PDR at the top of the image.
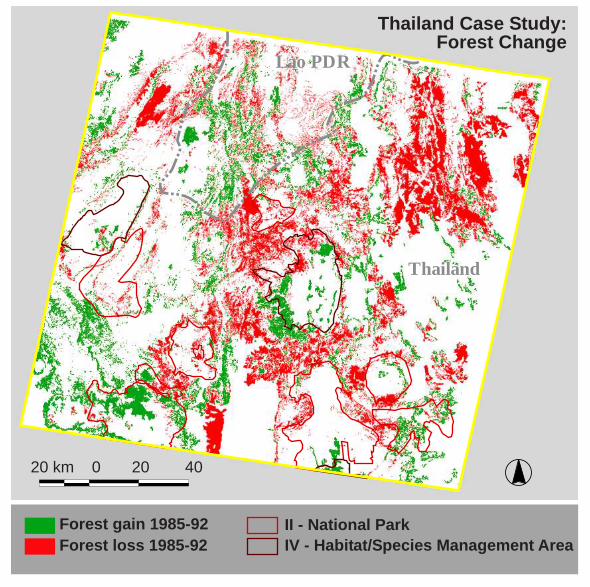
Case Study 2 -1992 Landsat TM scene bands 432 colorcomposite, Lao PDR and Cambodia. Red areas represent�����������
In the Lao PDR/Cambodia casestudy (right), a large amount of forestcover was gained, primarily in areascleared or abandoned during thefighting of the 1960s and early 1970s.Forest loss occurred along roads,inside and outside protected areas.
Processes and patternsIssues of national security havestrongly influenced the landscapeof protected areas from theIndochinese-American War to thecontinuing ethnic insurgencies inMyanmar.
Conservation efforts such asreforestation and exclusionaryboundaries are complicated byeconomic and cultural pressuresto use the land.
Recent studies have indicated thatparks are effective in conservingthe environment, but landscapeconnectedness between parks andthe influence of conservation onareas bordering parks should beinvestigated.
Many protected areas, particularly inThailand, are forests in name only.Agricultural clearing and logging over thepast 35 years has eliminated the densetropical rainforest from this site (Phu PaMan National Park - above), wherestruggling reforestation efforts are nowunderway.
New clearing for homes and fields isoccurring along roads, where safety fromold bombs can be better assured (image tothe left, taken near location of destroyedvillage). The pictured road is being upgradedfor a hydropower project which will clearlowland forest from Dong Lam NationalBiodiversity Conservation Area.
Once cleared, both forest and agriculturalland in sloping areas face soil erosion, fire,
grazing, and other impacts (eroding ricefield in Sam Pak Nam village, an inholding
in Phu Pa Man National Park - right).
In Lao PDR, many areas have becomereforested following the devastation of theAmerican-Indochinese war. Entire villageswere destroyed and abandoned (shownabove on a US military topographic map).
Further steps
Area near Phu Pa Man National Park, Thailand inthe dry season. The landscape was cleared of forest
in the 1980s by inhabitants relocated from withinprotected areas throughout northeastern Thailand.
February 20, 2001
less green more green less green more green less green more greenless green more green
Include cultural and economic data in park characterization
Apply year 2000 data to change analysis
Connect seasonality and land cover information
Compute patch characteristics and connectivity for protected areas
Integrate interviews and field reports from Lao PDR and Thailand
China
Myanmar
20 km 0 20 40
Thailand Case Study:Forest Change
Forest loss 1985-92Forest gain 1985-92 II - National Park
IV - Habitat/Species Management Area
Lao PDR
Thailand
Lao PDR
Vietnam
No
D
at
a
Forest loss 1985-92Forest gain 1985-92 II - National Park
IV - Habitat/Species Management AreaVI - Managed Resource Protected Area
20 km 0 20 40
Lao PDR Case Study:Forest Change
Cambodia


![r( [email protected] [email protected] [email protected]`L](https://img.pdfslide.net/doc/110x75/6207318949d709492c2edac3/r-emailprotected-emailprotected-emailprotectedl.jpg)