Embed Size (px)
Citation preview

1939-1374 (c) 2013 IEEE. Personal use is permitted, but republication/redistribution requires IEEE permission. Seehttp://www.ieee.org/publications_standards/publications/rights/index.html for more information.
This article has been accepted for publication in a future issue of this journal, but has not been fully edited. Content may change prior to final publication. Citationinformation: DOI 10.1109/TSC.2014.2362544, IEEE Transactions on Services Computing
IEEE TRANSACTIONS ON SERVICE COMPUTING, TSCSI-2013-12-0200 1
Environment-aware Virtual Slice Provisioning in Green Cloud Environment
Kim Khoa Nguyen and Mohamed Cheriet
Ecole de Technologie Superieure, University of Quebec, Canada
Abstract— Environmental footprint resulting from datacenters activities can be reduced by both energy efficiency and
renewable energy in a complementary fashion thanks to cloud computing paradigms. In a cloud hosting multi-tenant
applications, virtual service providers can be provided with real-time recommendation techniques to allocate their virtual
resources in edge, core, or access layers in an optimal way to minimize costs and footprint. Such a dynamic technique requires
a flexible and optimized networking scheme to enable elastic virtual tenants spanning multiple physical nodes. In this paper, we
investigate an environment-aware paradigm for virtual slices that allows improving energy efficiency and dealing with
intermittent renewable power sources. A virtual slice consists of optimal flows assigned to virtual machines (VMs) in a virtual
data center taking into account traffic requirements, VM locations, physical network capacity, and renewable energy availability.
Considering various cloud consolidation schemes, we formulate and then propose an optimal solution for virtual slice
assignment problem. Simulations on the GSN showed that the proposed model achieves better performance than the existing
methods with respect to network footprint reductions.
Index Terms—Energy-aware cloud, virtual slice allocation, multi-tenant cloud, cloud computing, virtual network embedding
—————————— ——————————
1 INTRODUCTION
ecently, many giant Information and Communica-tions Technology (ICT) corporations, like Amazon
and Google, have established data centers for hosting cloud applications. These data centers are energy-intensive, and constitute one of the largest consumers of electrical power in the economy. They are therefore one of the key sources of greenhouse gas (GHG) emissions. Growing constraints on power, cooling and distribution costs further compound the challenges faced by both data center operators and service providers who are heavily data center-dependent. New paradigms are required to power the data centers, as well as new approaches to data center design and management. The current approach to dealing with the green data center problem is improving energy efficiency, which is an attempt to reduce energy consumption at the micro level. However, an uncon-strained micro-level energy efficiency approach most like-ly leads to an overall increase in energy consumption ac-cording to the Khazzoom-Brookes postulates (also known as Jevon’s paradox) [1]. Powering data center services by a renewable energy should therefore be considered in parallel with energy efficiency efforts. As losses incurred in electricity transmission over power utility infrastruc-tures are much higher than those caused by data trans-mission, relocating ICT facilities, especially power-greedy data centers, near renewable energy sources is a more efficient solution than trying to bring electricity to an ex-isting given location. Moreover, such a solution is well aligned with the greening ICT movement that is aimed to
mitigate Global Warming progression resulting from the booming electrical consumption of ICT equipment, in particular connected personal devices which are respon-sible for more than 10.5% of the global energy consump-tion [2]. Developing distributed computing architectures to maximize the utilization of renewable energy for ICT services is therefore one of the most promising ICT strat-egies to mitigate Global Warming progression.
As renewable energy sources, such as solar and wind, are often intermittent, fine grained monitoring and con-trol, as well as highly flexible internetworking mecha-nisms are crucial. Recently, virtualization paradigms have attracted considerable attention for building such a com-plex data center network. It enables convenient, on-demand network access to a shared pool of configurable computing resources (e.g., networks, servers, storage, applications, and services) that can be rapidly provi-sioned and released with minimal management effort or service provider interaction. Virtualization allows maxim-izing the delivery of services and hence revenue, at the same time minimizing the costs of support and mainte-nance, rack space, head load, and power consumption. Virtualized data centers provide the abstraction of com-puting resources and electrical controls through the elas-tic use of consolidated resources pools, and provide op-portunities for higher utilization and energy savings. However, maximizing renewable energy utilization and cost effectiveness while ensuring performance and other Quality of Service (QoS) guarantees requires leveraging
R
1939-1374 (c) 2013 IEEE. Personal use is permitted, but republication/redistribution requires IEEE permission. Seehttp://www.ieee.org/publications_standards/publications/rights/index.html for more information.
This article has been accepted for publication in a future issue of this journal, but has not been fully edited. Content may change prior to final publication. Citationinformation: DOI 10.1109/TSC.2014.2362544, IEEE Transactions on Services Computing
2
important and extremely challenging trade-offs. So far, building large-scale distributed networks serving multi-ple cloud service providers with various performance requirements and while taking into account environmen-tal impacts has been an emerging research realm.
Due to high scalability and dynamicity of resources, users, protocols and architecture, virtual network provi-sioning with energy efficiency and renewable energy awareness is emerging for next generation clouds. A key challenge resides in the ability of altering virtual network topologies and routing schemes dynamically and flexibly according to traffic requirements and the availability of renewable energy sources. As shown in [3], a “follow the sun, follow the wind” algorithm might allocate/relocate virtual machines (VMs) of a virtual data center (so called slice) across multiple nodes, which results in various vir-tual topologies, and so network capacity and slice power consumption would also be different. Mapping virtual slice to underlying infrastructure accurately and optimal-ly in real-time is substantial to achieve a green cloud net-work. Unfortunately, recent research on virtual network mapping solutions has not yet paid attention to unique characteristics of cloud computing, such as workload consolidation and multipath forwarding in Layer 2 (or link layer in the TCP/IP network model) flat network, so far. This may result in inefficient resource allocation schemes. This paper is, therefore, dedicated to improving the existing virtual network mappings, and to provide a realistic implementation model for the problem.
The advent of software-define networking (SDN) pro-vides a unique opportunity to effectively implement such a mapping solution. Especially, the OpenFlow framework [4] that supports programmability of network functions and protocols is the cornerstone to build a flexible and environment-aware network management framework. Based on unified cloud management framework of power control devices, electrical consumers and software appli-cations, the green ICT service provisioning solution that we developed [5] allows achieving energy efficiency in data centers, and more importantly harvesting renewable energy sources with minimal battery or grid backup in order to power a network of geographically distributed small data centers. This strategy is complementary to tra-ditional energy efficiency approaches, which focus on micro-processor design, computer design, and power-on-demand architectures.
The contribution of this paper is two-fold: i) we formu-late and proposed an algorithm to resolve the problem of virtual slice assignment with respect to minimal footprint emissions in a neutral-carbon network taking into account both VM consolidation and multipath networking in data centers, and ii) we provide an implementation model to recommend the optimized resource allocation schemes to virtual data center service providers based on software-defined techniques.
Solutions presented in this paper have been deployed in the GreenStar Network (GSN) project [6], the first worldwide initiative for ICT service provision based en-
tirely on renewable energy sources across Canada and around the world. The testbed has successfully demon-strated the ability of transporting user service applica-tions to be processed in data centers located in proximity to green energy sources in an optimal fashion. This paper presents virtual networking paradigms that we have im-plemented in the GSN in order to keep the testbed pow-ered entirely by intermittent renewable energy while maintaining data center service. Regarding our prior pub-lications on carbon emission reduction [7][8], energy re-newable provisioning [3], this paper rather focuses on the architecture of virtual data center designed to support optimal VM placement in the GSN, as presented in [7][5].
The rest of this paper is organized as follows. In the next section, we recall the architecture and working prin-ciples of the GSN, followed by its virtual network archi-tecture. Next, we review related work, and then model the optimal virtual slice allocation problem, together with a heuristic solution. We then discuss an implementation models, and outline experiments on the GSN to validate the proposed solution. Finally, we conclude the paper and present our future work.
2 RELATED WORK
It is worth noting that, most of prior research in the field of greening ICT has focuses on data centers, in particular computing resources such as servers and storage [5][7]. Research in greening network is rather interested in ener-gy efficiency and power reduction in traffic processing. For example, various projects undertaken at Berkeley Labs deal with greening Ethernet through adapting link rate to effective traffic level as higher data rates require dramatically more power [35]. The ECONET project of Europe [36] aims at aggressively modulating power con-sumption of network devices according to actual work-loads and service requirements. However, the portion of power consumed by network is indeed much smaller than data centers as a result from the deployment of opti-cal devices, which consume much less power than elec-tronic devices.
In a prior paper [5], an optimized VM placement and migration model for minimizing carbon footprint has been proposed, taking into account CPU and memory resources. The model, called server-centric model, tried to optimize energy consumption of a set of VMs regardless of the links between VMs. In other words, the model places VMs onto physical servers with minimal footprint, given that each server has specific energy consumption. VMs consolidation is taken into account to allocate as many VMs as possible in greenest servers (e.g., the serv-ers consume least energy). While computing resources are crucial for Internet-based services, the consumption of network would also be important regarding network-oriented services such as massive data downloading or telecommunications applications. In addition, the paper does not consider inter VMs or intra virtual data center traffic, which is responsible for a large amount of energy

1939-1374 (c) 2013 IEEE. Personal use is permitted, but republication/redistribution requires IEEE permission. Seehttp://www.ieee.org/publications_standards/publications/rights/index.html for more information.
This article has been accepted for publication in a future issue of this journal, but has not been fully edited. Content may change prior to final publication. Citationinformation: DOI 10.1109/TSC.2014.2362544, IEEE Transactions on Services Computing
3
consumed by networking devices. In [16] and [17], implementation models for power-
saving flow assignment have been presented. However, they all focused on flow assignment for hosts in a tree-based intra data center interconnect. No attention has been paid to VMs requirements and traffic patterns among VMs. In addition, inter data center connections have not been taken into account so far, in particular with respect to virtual data centers spanning geographically distributed nodes in a large-scale “follow the sun, follow the wind” network.
In [32], the virtual network embedding (VNE) problem has been presented using nodes and links coordination. Mapping virtual networks into physical infrastructure is decomposed into node mapping and link mapping, and a set of algorithms are proposed to coordinate these two problems in order to find optimal mapping of an entire virtual slice. The node mapping problem is resolved by a Mixed Integer Programming (MIP) formulation, and the link mapping problem is resolved using solutions for Multicommodity Flow Problem (MFP) presented in [37]. The MIP formulation also considers link mapping, which facilitates the coordination between two problems. Alt-hough it is an efficient method to map virtual networks into substrate networks, the coordinated VNE problem does not consider cloud computing techniques, such as virtual machine consolidation and data center multipath network. It is the same for [33] and [34], in which consoli-dation technique has been used to combine different vir-tual slices instead of rescaling an existing slice.
Figure 1: Multipath connection among hosts in a BCube data center and
mapping a virtual slice of VMs onto BCube infrastructure
Recently proposed intra data center networks, e.g., Fat-tree [11], BCube [12], DCell [23] are based particularly on symmetric port commodity switches and uses symmetric link capacity to interconnect switches and servers. In BCube, servers are connected to switches only and vice versa, and thus servers play active role in routing. In DCell, servers are connected to switches only in the low-est level of the architecture; higher levels are constructed with server to server connection, and thus servers play active role in routing. In Fat-tree, server connects only to edge switch and edge switch connects to aggregate switches and aggregate switch further connects to core
switches and thus network fabric itself play role in rout-ing. In [13], authors have compared bandwidth provided by Fat-tree, BCube and DCell; however, power consump-tion of these topologies has not been accurately estimated so far.
Figure 1 gives an example of a data center based on BCube architecture with three layers: edge hosts, aggrega-tion and core switches. Each rack contains four servers and an aggregation switch. As shown, each host has two network interfaces, one connecting to an aggregation switch and the other connecting to a core switch, and so hosts may relay traffic for each other. It is worth noting that BCube has not been designed with SDN-enabled fea-ture in mind, and this architecture is aimed principally at improving fault-tolerance of data center interconnect. For example, two paths (e.g., Path 1 and Path 2) in Figure 1 can be used in parallel to link hosts 1 and 6.
Recent developments in data center interconnect fea-tured multipath forwarding paradigms which spread traffic among different paths in order to improve load balancing and fault-tolerance. Multipath techniques, such as ECMP (Equal Cost Multipath) [30] and VLB (Valiant Load Balancing) [31] have been deployed in both com-mercial products [29] and research testbeds [17]. Unfor-tunately, these techniques have yet been taken into ac-count when addressing cloud resource allocation prob-lems so far. In [14], the authors present a problem of op-timizing network power consumption with respect to end-users demand, in which VM placement is optimized taking into account link power consumption. Similarly, [15] proposes an optimization model to aggregate traffic on alternated links, hence turning off idle switches and links in a data center. Both articles present theoretical work and do not consider multipath forwarding.
In this paper, we investigate the problem of optimal locations for VMs and their connection on a physical un-derlying infrastructure, and propose networking architec-ture to support such optimized scheme. In particular, we emphasize on intra virtual slice traffic, which is responsi-ble for an important amount of footprint with regard to other kinds of traffic in the whole data center network. In a federated cloud like the GSN, a virtual slice may contain VMs located in distributed data centers. Indeed, virtual slice service is required to host large-scale network appli-cations composed of distributed components. For exam-ple, an IMS (Internet Multimedia Service) system [19] involves multiple CSPF (Call Session Control Function) proxies, HSS (Home Subscriber Server) databases, and several gateways; each component can be run on one or several VMs. A user request sent to the IMS system will therefore be processed by multiple components. Such a system can be hosted by a slice of VMs. A virtual link between two VMs can go across multiple physical serv-ers, switches and routers, depending on the locations of the VMs. As each physical link has limited capacity, de-termining an optimal connection scheme which can ac-commodate user requirements and save power consump-tion of the network plane is challenging, in particular

1939-1374 (c) 2013 IEEE. Personal use is permitted, but republication/redistribution requires IEEE permission. Seehttp://www.ieee.org/publications_standards/publications/rights/index.html for more information.
This article has been accepted for publication in a future issue of this journal, but has not been fully edited. Content may change prior to final publication. Citationinformation: DOI 10.1109/TSC.2014.2362544, IEEE Transactions on Services Computing
4
when there is a large number of nodes and links. As shown in Figure 1, a possible mapping of such a virtual slice of IMS can be achieved taking advantage of VM con-solidation and multipath features. Given three VMs in the slice, each having 2-CPU requirement, and the bandwidth among each pair of VMs is 2 Gbps, two VMs (namely CSCFs and HSS) can be consolidated into host 6, the GW VM can be mapped onto host 1, and the virtual link be-tween CSCFs and GW is mapped onto two physical links (Path 1 and Path 2). As two VMs are hosted by a single physical server, the footprint of the virtual slice can be lower than the footprint of a different mapping which allocates two VMs in two different servers. The virtual link between these two VMs is no longer required be-cause they can communicate to each other via internal memory of the server. In addition, a 2 Gbps bandwidth requirement can be affordable using multiple 1 Gbps physical links. This general mapping principle can be ap-plied without any modification for various intra data cen-ter topologies, such as Tree, Fat-tree or BCube.
3 PROBLEM FORMULATION AND SOLUTION
The problem of optimized flow assignment results in an optimal virtual network of VMs allocated on physical hosts distributed across a network of data centers. We assume a data center model having an aggregation switch that plays the role of a gateway grooming all traffic and then sending to external. In reality, a host may contain multiple VMs, and communications between two VMs located on the same host do not consume network re-source.
Figure 2: Example of a mapping from a virtual slice request to underlying
infrastructure resources
The problem recurs to a set of flow assignment and node assignment problems in an undirected graph which result in an optimal virtual network of VMs allocated on physical hosts distributed across a network of data cen-ters, satisfying resource requirements of VMs and flows
between them. Unlike the traditional substrate network mapping problem which deals only with link capacity, there is new constraints on computing power on a set of nodes in the graph (c.f. the set of hosts).
Figure 2 illustrates an example of mapping a virtual slice into underlying infrastructure. Four VMs a, b, c, d with the same computing requirement (5) are mapped to an infrastructure having five servers A, B, C, D, E with the same computing capacity (10). Each virtual link be-tween a pair of VMs is 10 Mbps, and each physical link between a pair of servers is 20 Mbps. A possible mapping, as given in Figure 2-C is: (a ̶ > A, b ̶ > B, c ̶ > C, d ̶ > D, ab ̶ > AB, bc ̶ > BC, ac ̶ > AC, cd ̶ > CD). The notation X/Y in the figure means a capacity X is allocated over the total capacity Y. Assume the emissions of each computing unit (i.e., 1 CPU) and each bandwidth unit (i.e., 1 Mbps link) are both 1g CO2. The total footprint of the virtual slice is therefore:
𝑓 = 𝑓 + 𝑓 + 𝑓 + 𝑓 + 𝑓 + 𝑓 + 𝑓 + 𝑓 = 5 + 5 + 5 + 5 + 10 + 10 + 10 + 10 = 60 (1)
In order to formulate the problem, the entire network of data centers can be modeled as an undirected graph 𝐺(𝑉, 𝐸), in which V is the set of vertices and 𝐸 ∈ 𝑉 × 𝑉 is the set of edges. 𝑉 = 𝐻 ∪ 𝑆, in which 𝐻 is the set of hosts and 𝑆 is the set of switches (including the gateways). Each edge (𝑖, 𝑗) ∈ 𝐸 represents a communication link between two nodes 𝑖 and 𝑗 which are hosts or switches (including the gateways). The available bandwidth capacity of an edge is denoted by 𝑐(𝑖, 𝑗). If there is no physical link be-tween 𝑖 and 𝑗, we assign 𝑐(𝑖, 𝑗) = 0.
Let 𝑝 (𝑖, 𝑗) refer to the power consumed on the physi-cal link when sending a bit from 𝑖 to 𝑗 and vise versa. In other words, 𝑝 (𝑖, 𝑗) is the total energy consumed by two ports of the nodes; 𝑝 (𝑖, 𝑗) = 0 if there is no link (i.e., 𝑐(𝑖, 𝑗) = 0). Considering a virtual slice having 𝑁 VMs, and there are 𝑀 virtual links among these VMs; power con-sumption of the ith VM hosted by server 𝑗, 𝑝 (𝑗), can be calculated from VM requirements and the power con-sumption of the host as described in [9]. As two or more VMs running on the same host communicate to each oth-er without using any physical link, we consider the flow(s) between them has zero capacity. Therefore, with-out any loss of generality, we assume that each server initially hosts only a single VM belonging to a given slice. This VM represents all VMs actually hosted by the server; its processing capacity is the sum of all actual VMs, and its links is the set of outgoing links of all actual VMs. A virtual link (or a flow) between each pair of VMs in 𝑁 hosts is denoted by 𝐹 (𝑠 , 𝑡 , 𝑑 ), in which 𝑠 and 𝑡 are respectively source and destination hosts of the mth flow, 𝑠 , 𝑡 ∈ 𝑁; and 𝑑 is the demanded bandwidth of the flow.
Let 𝐷 be the number of data centers in the network. Each data center 𝑑 ∈ 𝐷 is accessible through a gateway 𝑔 which is considered as a special node. As any external request has to go through the gateway to a VM, we model external traffic going to a slice by 𝑁 flows from the gate-way to 𝑁 VMs of the slice. If there is no external traffic to

1939-1374 (c) 2013 IEEE. Personal use is permitted, but republication/redistribution requires IEEE permission. Seehttp://www.ieee.org/publications_standards/publications/rights/index.html for more information.
This article has been accepted for publication in a future issue of this journal, but has not been fully edited. Content may change prior to final publication. Citationinformation: DOI 10.1109/TSC.2014.2362544, IEEE Transactions on Services Computing
5
kth VM, the demanded bandwidth of the kth flow is 0. The slice will, therefore, contains 𝑀 = 𝑀 + 𝐷 × 𝑁 flows, in which 𝑀 is the number of flows among VMs, and 𝐷 × 𝑁 is the number of flows from the gateways to VMs in the slice (note that some flows in the set of 𝐷 × 𝑁 flows may be zero-bandwidth, e.g., a flow between a gateway and a VM located in two different data centers).
As stated in [3], each data center 𝑑 in the network is powered by a renewable energy source, with a green fac-tor 𝑟 defined in [18]. Therefore, each link (𝑖, 𝑗) is associat-ed with a green factor 𝑟 (𝑖, 𝑗) which is determined by the locations of two heads of the link and the green factors of
data centers 𝑟 (𝑖, 𝑗) =
. The green factor of a link be-
tween two data center gateways is the mean of the green factors of two data centers.
The problem is to determine a set of vertices 𝐻 ∈ 𝐻 hosting the VMs, and a set of edges 𝐸 ∈ 𝐸 linking VMs in the slice, satisfying computing and traffic demand, and minimizing the total footprint of the slice. We use two matrices to represent the results:
𝑥 (𝑖, 𝑗) = {𝑏𝑎𝑛𝑑𝑤𝑖𝑑𝑡ℎ 𝑜𝑛 𝑙𝑖𝑛𝑘 (𝑖, 𝑗) 𝑟𝑒𝑠𝑒𝑟𝑣𝑒𝑑 𝑓𝑜𝑟 𝑓𝑙𝑜𝑤 𝑚0 𝑖𝑓 𝑓𝑙𝑜𝑤 𝑚 𝑖𝑠 𝑛𝑜𝑡 𝑟𝑜𝑢𝑡𝑒𝑑 𝑡ℎ𝑟𝑜𝑢𝑔ℎ 𝑙𝑖𝑛𝑘 (𝑖, 𝑗)
(2)
𝑦(𝑖, 𝑗) = {1 𝑉𝑀 𝑖 𝑖𝑠 ℎ𝑜𝑠𝑡𝑒𝑑 𝑏𝑦 𝑡ℎ𝑒 𝑝ℎ𝑦𝑠𝑖𝑐𝑎𝑙 𝑠𝑒𝑟𝑣𝑒𝑟 𝑗0 𝑜𝑡ℎ𝑒𝑟𝑤𝑖𝑠𝑒
(3)
So, the problem formulation is follows.
𝑀𝑖𝑛𝑖𝑚𝑖𝑧𝑒 ∑ 𝑥 (𝑖, 𝑗) × , ∈ , ∈ 𝑝 (𝑖, 𝑗) × 𝑟 (𝑖, 𝑗) +
∑ 𝑦(𝑖, 𝑗) ∈ , ∈ × 𝑝 (𝑗) (4)
such:
∑ 𝑥 (𝑖, 𝑗) ∈ ≤ 𝑐(𝑖, 𝑗), ∀𝑖, 𝑗 ∈ 𝑉 (5)
∑ 𝑥 (𝑠 , 𝑘) ∈ = ∑ 𝑥 (𝑘, 𝑡 ) ∈ = 𝑑 , ∀𝑚 ∈ 𝑀′ (6)
∑ 𝑥 (𝑖, 𝑘) ∈ = ∑ 𝑥 (𝑘, 𝑖) ∈ , ∀𝑚 ∈ 𝑀′, ∀𝑖 ∈ 𝑉\{𝑠 , 𝑡 } (7)
Equation (4) defines the objective function that is the minimal footprint of the virtual slice of 𝑁 VMs and 𝑀 flows. Equations (5), (6) and (7) state the constraints of the problem. (5) states that the total bandwidth allocated for 𝑀 flows on any link (𝑖, 𝑗) does not exceed the available bandwidth capacity of (𝑖, 𝑗). (6) states the demand satis-faction constraint, i.e. for any flow, the outgoing traffic at the source or the incoming traffic at the destination equal to the demand of the flow. (7) states that for any interme-diate node of a flow, the incoming traffic is equal to the outgoing traffic.
The aforementioned integer linear programming (ILP) multipath routing problem is NP-complete [20]. A solu-tion for such problem can be obtained with a mathemati-cal solver, however, it does not return results in a timely manner as required by of slice establishment operation. In reality, as the “follow the sun, follow the wind” algorithm is triggered only a few times in a day, a mathematical solver can be used to obtain the optimal result when the network has a relatively small number of nodes (order of fifty). When the number of variables increases, a heuristic algorithm is required to reduce calculation space, which
can be defined based on following theorems and lemmas.
Theorem 1. The optimization problem (3) results in the mini-mum value if and only if all 1-degree virtual nodes (VMs) are optimally consolidated with their adjacent nodes. A 1-degree node is a node which is connected to only one other node in the slice.
Proof: Assuming an optimal mapping in which there is still a 1-degree virtual node X which is not optimally consolidated. As X can be consolidated with the node Y which is directly linked, consolidating X and Y will eliminate a virtual link between them. Without any loss of generality, we assume that the degree of Y is greater than 1, and the green factor is 1 for all servers and links. If the optimal consolidation moves X toward Y, the total power consumption will be reduced an amount 𝑝 = (𝑝 (𝑖, 𝑗) × 𝑥(𝑖, 𝑗)) + (𝑝 (𝑋) − 𝑝 (𝑋)) in
which 𝑖 and j are two servers hosting X and Y respec-tively. If the optimal consolidation moves Y toward X, the total power consumption will be reduced an amount 𝑝 = 𝑝 (𝑖, 𝑗) × (𝑥(𝑖, 𝑗) − 𝑚𝑎𝑥𝑓𝑙𝑜𝑤(𝑌)) +(𝑝 (𝑌) − 𝑝 (𝑌)) in which 𝑚𝑎𝑥𝑓𝑙𝑜𝑤(𝑌) is the total ca-
pacity of flows going through Y. This is because when Y moves toward X, the flow XY may need to be in-creased to afford existing flows going through Y. The consolidation does not affect bandwidth allocation other nodes because X is a 1-degree node, so its unique link is to Y; and as the consolidation is supposed to be optimal, eliminating a virtual link does not create a bottleneck. As well, the optimal consolidation of X and Y effectively reduce the power consumption (and indi-rectly footprint) of the network, either by an amount 𝑝 or 𝑝 . In other words, a mapping without the con-solidation XY is not optimal.
Figure 3: Mappings with and without 1-degree virtual node consolidation
Figure 3 illustrates two mappings with and without 1-degree virtual node consolidation, using input request and infrastructure presented in Figure 2-A and Figure 2-B respectively. Assume all nodes and links having the same green factor 1, and their power consumption is propor-tional to the requirements, the total footprint of the map-ping with virtual node consolidation (Figure 3-A) is:
𝑓 = 𝑓 + 𝑓 + 𝑓 + 𝑓 + 𝑓 + 𝑓 = 5 + 5 + 10 + 10 + 10 + 10 = 50 (8)
Server D and link CD are not involved in this equation because VM d is consolidated in server C. The footprint of the mapping without consolidation (Figure 3-B) is 60 (see

1939-1374 (c) 2013 IEEE. Personal use is permitted, but republication/redistribution requires IEEE permission. Seehttp://www.ieee.org/publications_standards/publications/rights/index.html for more information.
This article has been accepted for publication in a future issue of this journal, but has not been fully edited. Content may change prior to final publication. Citationinformation: DOI 10.1109/TSC.2014.2362544, IEEE Transactions on Services Computing
6
Eq. 1). The differecene in terms of footprint of two map-ping schemes is therefore: 60 – 50 = 10. This example shows emission reduction resulting from a consolidation of a 1-degree virtual node.
We use Lemma 1 to calculate the footprint reduction of two consolidation scheme:
Lemma 1: Emissions change resulting from a consolidation of a 1-degree node X with an N-degree adjacent node Y (N > 1) is:
𝑓 = (𝑟 (𝑖, 𝑗) × 𝑝 (𝑖, 𝑗) × 𝑥(𝑖, 𝑗)) + (𝑟 × 𝑝 (𝑋)) − (𝑟 ×
𝑝 (𝑋)) if X is moved toward Y, or (9)
𝑓 = (𝑟 × 𝑝 (𝑌)) − (𝑟 × 𝑝 (𝑌)) + 𝑟 (𝑖, 𝑗) × (𝑥(𝑖, 𝑗) −
𝑚𝑎𝑥𝑓𝑙𝑜𝑤(𝑌)) if Y is moved toward X (10)
in which 𝑖 and j are two servers hosting X and Y respective-ly, and 𝑥(𝑖, 𝑗)is bandwidth of the flow between X and Y.
Proof: This is straightforward calculations.
From Theorem 1 and Lemma 1, we design an algo-rithm to eliminate 1-degree virtual nodes, as follows.
Line 1 in Algorithm 1 walks through all 1-degree vir-
tual nodes. Line 2 determines an adjacent node. Line 3 computes footprints of two consolidation scheme (X to Y and Y to X). Line 4 compares two schemes. Line 5 checks if two virtual nodes can be consolidated based on availa-ble computing resources on host j. Line 6 moves X toward Y if it is possible. Line 7 checks if the link capacity (X,Y) is greater than the total capacity of the flows going through Y. Line 8 checks if two virtual nodes can be consolidated based on available computing resources on host i. Line 9 moves Y toward X if it is possible.
As Algorithm 1 walks through all the virtual node, its complexity is 𝑂(𝑁) in which 𝑁 is the number of VMs.
Theorem 2: A consolidation of an N-degree (N > 1) virtual node X toward a virtual node Y only reduces the overall footprint when the footprint of their direct links is greater than the sum of the total footprint of links toward X and the difference of footprints of X when running in the new and old locations.
Proof: Consider two virtual nodes X and Y, both having a degree greater than 1, and hosted by two servers i and j. When X is consolidated toward Y, a link with capaci-
ty 𝑥(𝑖, 𝑗) is eliminated. However, as the degree of X is greater than 1, there are more than one link leading to X. These links will be added to Y after the consolida-tion. As a result, the consumption of links to Y will be increased a corresponding amount. As each link has a unique power consumption and green factor, the total footprint will only be reduced when the new capacity added to Y results in a footprint being smaller than the footprint produced by the relocation of X.
Figure 4: Mappings with and without 4-degree virtual node consolidation
Figure 4 illustrates a mapping with a 3-degree virtual node consolidation (i.e. c and a nodes) compared to a mapping with no consolidation. With the same assump-tion as in Figure 3, the total footprint of the mapping with 3-degree node consolidation (c is consolidated with a, Figure 4-A) is
𝑓 = 𝑓 + 𝑓 + 𝑓 + 𝑓 + 𝑓 + 𝑓 = 10 + 5 + 5 + 20 + 10 + 10 = 60 (11)
and of the mapping without consolidation (Figure 3-B) is also 60. This demonstrates such a consolidation does not reduce any footprint.
We use Lemma 2 to determine if an N-degree virtual node consolidation is possible and to calculate the foot-print reduction resulting from the consolidation.
Lemma 2: An N-degree virtual node X can be consolidated with a virtual node Y if and only if with any Z node adja-cent to X (Z ≠ Y), the sum of available bandwidth of all flows from Z to Y is greater or equal to the capacity of the virtual link (Z, X).
Proof: When X is moved toward Y, all flows from Z to-ward X will go directly to Y. Therefore, the total capac-ity of all flows from Z to Y will be augmented an amount of 𝑐 . If this amount is greater than the total available capacity of all flows from Z to Y, communica-tions requirements between Z and X will not be af-fordable. In other words, the sum of available band-width of all flows from Z to Y must be greater or equal to the capacity of the virtual link (Z, X).
From Theorem 2 and Lemma 2, we design an algo-rithm to determine whether a consolidation of two N-degree virtual nodes can be done, and the emissions changes resulting from such consolidation.
Algorithm 1 Eliminating 1-degree VMs
1. for each 1-degree virtual node X hosted by
server i in the list of 1-degree nodes L1 do
2. Determine virtual node Y directly linked to X and
server j hosting Y
3. Compute 𝑓 and 𝑓 using (9) and (10)
4. if 𝑓 𝑓 then
5. if capacity of j < requirements of X and Y
then continue
6. else Move X toward Y
7. elseif 𝑥(𝑖, 𝑖) 𝑚𝑎𝑥𝑓𝑙𝑜𝑤(𝑌) then
8. if capacity of i < requirements of X and Y
then continue
9. else Move Y toward X
1939-1374 (c) 2013 IEEE. Personal use is permitted, but republication/redistribution requires IEEE permission. Seehttp://www.ieee.org/publications_standards/publications/rights/index.html for more information.
This article has been accepted for publication in a future issue of this journal, but has not been fully edited. Content may change prior to final publication. Citationinformation: DOI 10.1109/TSC.2014.2362544, IEEE Transactions on Services Computing
7
Line 1 in Algorithm 2 walks through all adjacent nodes Z of X. Line 2 determines all flows from Z to Y. Line 3 sorts all flows in ascending order of green factors; if a flow goes through multiple links, its green factor is the sum of all green factors of these links. Line 4 loops until the capacity of the virtual link (Z, X) is entirely assigned to flows from Z to Y. Line 5 caculates the available capaci-ty of each flow from Z to Y. Lines 6 and 7 augments the flow. Line 8 continues the loop. In line 9, the algorithm fails (i.e., two VMs cannot be consolidated) if all flows from Z to Y are visited and the capacity of the virtual link (Z, X) is not entirely assigned to them. Otherwise, the al-gorithm returns the new footprint resulting from flow change.
The complexity of Algorithm 2 is 𝑂(𝑑𝑒𝑔𝑟𝑒𝑒(𝑋)).
Theorem 3: When all optimal consolidations are done, the problem (3) recurs to regular virtual network embedding problem.
Proof: When there is no VM consolidation, the problem (3) seeks only to optimize a static virtual network on a physical underlying infrastructure. It is entirely the virtual network embedding problem with coordinated node and link mapping as described in [32].
Our final algorithm to resolve the optimization prob-lem is follows.
Algorithm 3 is straightforward as a result from algo-rithms 1 and 2. In general, as the algorithm has to execute the network embedding algorithm, and then walkthrough all nodes and links, the complexity of the algorithm is 𝑂(𝑁 + N × 𝑀).
It is worth noting that consolidation can reduce overall
reliability of a virtual slice when it is mapped, as a single server or link failure could shutdown multiple VMs or virtual links. A possible solution for this issue is to assign a reliability parameter to each server and link, and define a scalar function of footprint and reliability. The optimi-zation process will then try to allocate VMs and virtual links based on this function instead of individual parame-ters (i.e., footprint or reliability). As well, consolidation has no impact on QoS as long as physical servers have enough resource to afford VM requirements and over-head generated by hypervisors. Determining the relation-ship among virtualization overhead, reliability and foot-print is out of the scope of this paper, which is dedicated to footprint optimization, and will be part of our future work.
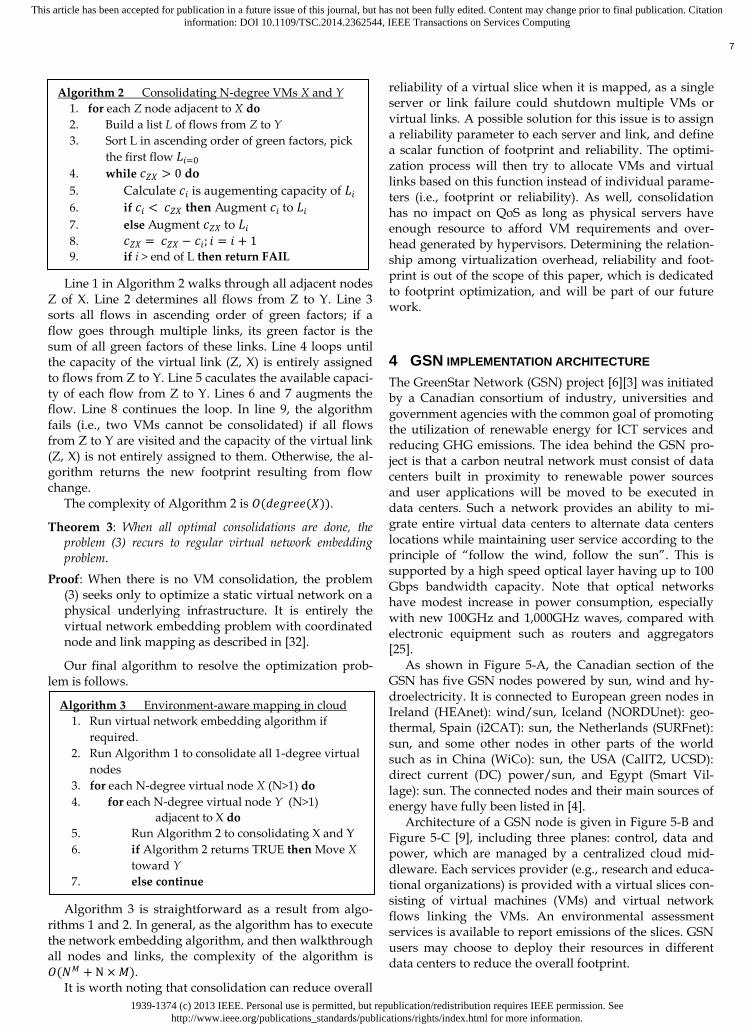
4 GSN IMPLEMENTATION ARCHITECTURE
The GreenStar Network (GSN) project [6][3] was initiated by a Canadian consortium of industry, universities and government agencies with the common goal of promoting the utilization of renewable energy for ICT services and reducing GHG emissions. The idea behind the GSN pro-ject is that a carbon neutral network must consist of data centers built in proximity to renewable power sources and user applications will be moved to be executed in data centers. Such a network provides an ability to mi-grate entire virtual data centers to alternate data centers locations while maintaining user service according to the principle of “follow the wind, follow the sun”. This is supported by a high speed optical layer having up to 100 Gbps bandwidth capacity. Note that optical networks have modest increase in power consumption, especially with new 100GHz and 1,000GHz waves, compared with electronic equipment such as routers and aggregators [25].
As shown in Figure 5-A, the Canadian section of the GSN has five GSN nodes powered by sun, wind and hy-droelectricity. It is connected to European green nodes in Ireland (HEAnet): wind/sun, Iceland (NORDUnet): geo-thermal, Spain (i2CAT): sun, the Netherlands (SURFnet): sun, and some other nodes in other parts of the world such as in China (WiCo): sun, the USA (CalIT2, UCSD): direct current (DC) power/sun, and Egypt (Smart Vil-lage): sun. The connected nodes and their main sources of energy have fully been listed in [4].
Architecture of a GSN node is given in Figure 5-B and Figure 5-C [9], including three planes: control, data and power, which are managed by a centralized cloud mid-dleware. Each services provider (e.g., research and educa-tional organizations) is provided with a virtual slices con-sisting of virtual machines (VMs) and virtual network flows linking the VMs. An environmental assessment services is available to report emissions of the slices. GSN users may choose to deploy their resources in different data centers to reduce the overall footprint.
Algorithm 3 Environment-aware mapping in cloud
1. Run virtual network embedding algorithm if
required.
2. Run Algorithm 1 to consolidate all 1-degree virtual
nodes
3. for each N-degree virtual node X (N>1) do
4. for each N-degree virtual node Y (N>1)
adjacent to X do
5. Run Algorithm 2 to consolidating X and Y
6. if Algorithm 2 returns TRUE then Move X
toward Y
7. else continue
Algorithm 2 Consolidating N-degree VMs X and Y
1. for each Z node adjacent to X do
2. Build a list L of flows from Z to Y
3. Sort L in ascending order of green factors, pick
the first flow 𝑖=0
4. while 𝑐 𝑋 0 do
5. Calculate 𝑐𝑖 is augementing capacity of 𝑖
6. if 𝑐𝑖 < 𝑐 𝑋 then Augment 𝑐𝑖 to 𝑖
7. else Augment 𝑐 𝑋 to 𝑖
8. 𝑐 𝑋 = 𝑐 𝑋 − 𝑐𝑖; 𝑖 = 𝑖 + 1
9. if i > end of L then return FAIL

1939-1374 (c) 2013 IEEE. Personal use is permitted, but republication/redistribution requires IEEE permission. Seehttp://www.ieee.org/publications_standards/publications/rights/index.html for more information.
This article has been accepted for publication in a future issue of this journal, but has not been fully edited. Content may change prior to final publication. Citationinformation: DOI 10.1109/TSC.2014.2362544, IEEE Transactions on Services Computing
8
Figure 5: The GSN map and a green node powered by solar energy at the
Communication Research Centre, Ottawa, Canada
All servers in the GSN are virtualized by hypervisors, and end-users rent computing power through VMs. GSN network slice service allows users to actively create and manage their networks of VMs (Figure 6). A similar con-cept, called Virtual Private Cloud (VPC), is also offered in the market (e.g., by Amazon [10]). However, links in a VPC are fixed when it is created, whilst a slice in the GSN is scalable and flexible thanks to a software-defined net-working architecture using OpenFlow technology. Unlike the clouds where the hypervisor directly links VMs to a physical network interface (NIC) of their server, which then connects to a physical switch of the data center, each server in the GSN is equipped with a built-in virtual smart switch (called vSwitch), and hence VMs are con-nected to their vSwitch before the physical switch. A vSwitch allows isolating or grouping VMs running on a server according to users demand. An OpenFlow control-ler running on a dedicated VM handles the control plane of the entire network. It controls the vSwitche’s flow ta-bles in such a way that all VMs belonging to a user slice will be put in a VLAN which may span multiple vSwitch-es. Users configure their slices through a web-based graphical interface [6] that translates and then relays user requests to the OpenFlow controller through the GSN cloud middleware. When a VM is moved around servers,
vSwitches are dynamically reconfigured by the controller so that the VM network slice remains unchanged (e.g., in Figure 6, slice 1 is added to the vSwitch in Host 3 after a migration). Dynamic tunnels can be configured by virtual routers when moving VMs between data centers. Flow classification algorithms are also developed for the con-troller to provide QoS levels to different categories of us-ers.
Figure 6: Virtual user slice migration in the GreenStar network
With a software-defined capability, GSN users (i.e., virtual service operators) are provided with a dynamic recommendation service allowing them to allo-cate/relocate their virtual tenants on physical servers and network equipment with the lowest environmental im-pact. The features of such a dynamic service include:
Simplifying definition of virtual tenant. Rather than defining an entirely virtual network, the service al-lows redefining and/or changing virtual “flows” linking the VMs. The VMs can also be dynamically migrated to optimal locations.
Enabling a variety of actions. In addition to regular VM consolidation as in traditional data centers, flow redirection, path splitting, virtual tenant rescaling, power source selection and other actions can be indi-cated.

1939-1374 (c) 2013 IEEE. Personal use is permitted, but republication/redistribution requires IEEE permission. Seehttp://www.ieee.org/publications_standards/publications/rights/index.html for more information.
This article has been accepted for publication in a future issue of this journal, but has not been fully edited. Content may change prior to final publication. Citationinformation: DOI 10.1109/TSC.2014.2362544, IEEE Transactions on Services Computing
9
Flexible behavior. A virtual slice can be modified in a reactive way, so that new resources are dynamically added to the tenant when there is computing need. Or, it can be proactive so that the entire tenant is cre-ated in advance to computing tasks.
The entire network operates according to its targets which can be, for example, the minimization of the power consumption, minimization of GHG emissions, and max-imization of the profits (in terms of traffic circulating on the network). In order to achieve such targets the GSN needs to collect information about the status of each ele-ment (at the granularity of VM) on the one hand, and on the other hand calculate precisely the power consumption and emissions, as well as produce real-time optimal allo-cation schemes of virtual resources. When VMs are mi-grated or consolidated on servers, rebuilding optimal slices is key element to successful achievement of the GSN.
As presented in [4], the GSN is controlled by a computing and power management middleware including three lay-ers (Figure 7):
Figure 7: GSN middleware with focus on network resource management
Physical layer: contains all physical devices, such as servers (hosts), switch, routers, PDU, power generators, power meters, climate control. In gen-eral, there are many hosts and switches per data center.
Virtual Resource layer: contains the drivers of each physical device. Each resource controls a device and offers services to a higher layer. Compute Re-sources control physical servers. Power Source Re-sources manage energy generators (e.g., wind tur-bines or solar panels). PDU Resources control pow-er consumption. Climate Resources monitor envi-ronmental condition and humidity. Network re-sources are responsible for virtual and physical switches. A Facility Resource links Power Source, PDU, Climate, Compute and Network resources. It determines the power consumed by each server
and sends notifications to managers when the power or environmental condition changes.
Management layer: includes a Controller and a set of managers. Each manager is responsible for its individual resources. For example, the Cloud Man-ager manages Compute resources, the Facility Manager manages the Facility resources, and the Network Manager handles data center connectivi-ty. The Controller is the brain of the network, re-sponsible for determining the optimized location of each VM. It computes the action plans to be execut-ed on each set of resources, and then orders the managers to perform them. Based on information provided by the Controller, these managers execute allocation and migration tasks.
In the GSN, each data center is managed by a middle-ware instance running on a VM, so called domain (Figure 7). Each domain contains a Facility resource and all com-puting, networking, power and climate resources of the data centers. The Facility resource can make decisions by itself to optimize workload and power consumption of the data center. A middleware instance is hosted by a dedicated VM, called Virtual Organization (VO), contain-ing the managers and Controller. Managers communicate with domains through JMS (Java Message Service) chan-nels. Two schemes are implemented or triggering the power optimization process:
Periodical: The Controller periodically (i.e., each 30 minutes) examines all the domains to get up-to-date data. It then computes the locations of all VMs and their asso-ciated flows to build an optimized migration plan in the network. An empty plan means that no relocation is re-quired. Event-driven: When the Facility resource in a domain
detects an abnormal condition, it will immediately send a notification to the VO to trigger the re-computation which will result in relocation of VMs and virtual flows.
In the GSN, a virtual slice is established by the Net-work Manager following a user request. The Network Manager interacts with an OpenFlow controller, which is running on a dedicated VM, to inject the optimal flow assignment plan to the flow table. In the implementation of GSN, a NOX controller [21] has been deployed. The Network Manager also learns the overall network topolo-gy through the OpenFlow controller, which is then served for calculating the optimal flow assignment plan. Each VM in a virtual slice is identified by a combination of MAC address, IP address, and a slice ID. When a VM in a slice is migrated to a new location, the Network Manager will recomputed all flows in the slice using Algorithm 3 and then update all virtual and physical switches involv-ing in the flows.
When a service provider requests a virtual slice, the Controller computes an optimal plan based on data in the cloud knowledge database. If available resources can af-ford user’s request, the Controller will send command to Cloud Manager, and through Network Manager to the
1939-1374 (c) 2013 IEEE. Personal use is permitted, but republication/redistribution requires IEEE permission. Seehttp://www.ieee.org/publications_standards/publications/rights/index.html for more information.
This article has been accepted for publication in a future issue of this journal, but has not been fully edited. Content may change prior to final publication. Citationinformation: DOI 10.1109/TSC.2014.2362544, IEEE Transactions on Services Computing
10
OpenFlow controller, to allocate required resources.
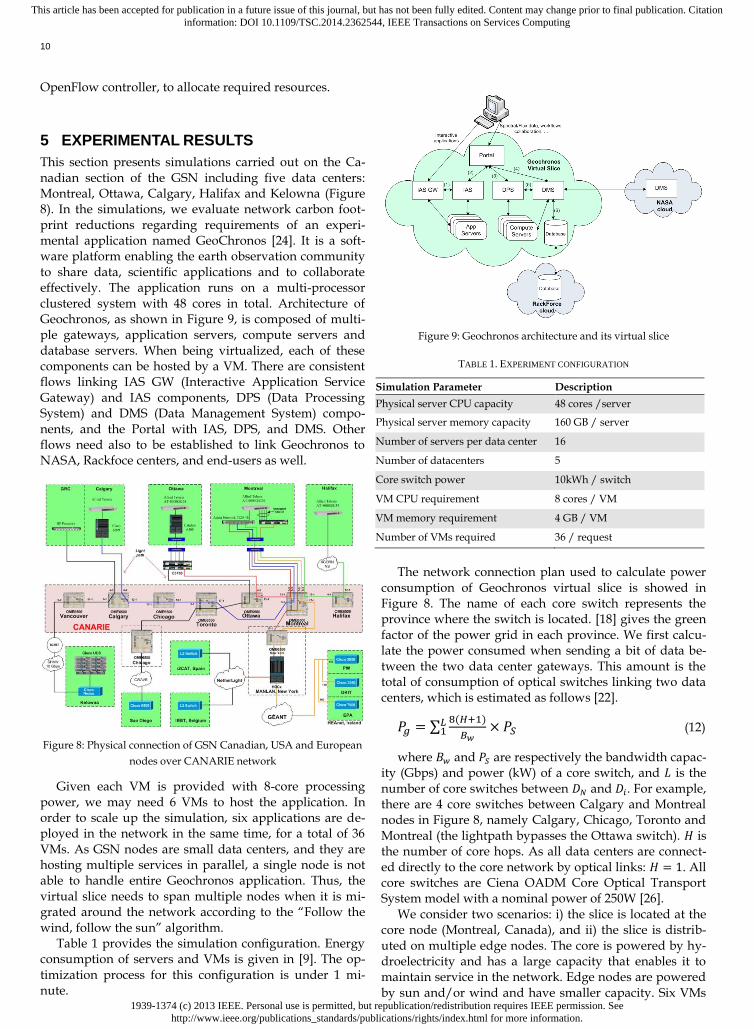
5 EXPERIMENTAL RESULTS
This section presents simulations carried out on the Ca-nadian section of the GSN including five data centers: Montreal, Ottawa, Calgary, Halifax and Kelowna (Figure 8). In the simulations, we evaluate network carbon foot-print reductions regarding requirements of an experi-mental application named GeoChronos [24]. It is a soft-ware platform enabling the earth observation community to share data, scientific applications and to collaborate effectively. The application runs on a multi-processor clustered system with 48 cores in total. Architecture of Geochronos, as shown in Figure 9, is composed of multi-ple gateways, application servers, compute servers and database servers. When being virtualized, each of these components can be hosted by a VM. There are consistent flows linking IAS GW (Interactive Application Service Gateway) and IAS components, DPS (Data Processing System) and DMS (Data Management System) compo-nents, and the Portal with IAS, DPS, and DMS. Other flows need also to be established to link Geochronos to NASA, Rackfoce centers, and end-users as well.
Figure 8: Physical connection of GSN Canadian, USA and European
nodes over CANARIE network
Given each VM is provided with 8-core processing power, we may need 6 VMs to host the application. In order to scale up the simulation, six applications are de-ployed in the network in the same time, for a total of 36 VMs. As GSN nodes are small data centers, and they are hosting multiple services in parallel, a single node is not able to handle entire Geochronos application. Thus, the virtual slice needs to span multiple nodes when it is mi-grated around the network according to the “Follow the wind, follow the sun” algorithm.
Table 1 provides the simulation configuration. Energy consumption of servers and VMs is given in [9]. The op-timization process for this configuration is under 1 mi-nute.
Figure 9: Geochronos architecture and its virtual slice
TABLE 1. EXPERIMENT CONFIGURATION
Simulation Parameter Description
Physical server CPU capacity 48 cores /server
Physical server memory capacity 160 GB / server
Number of servers per data center 16
Number of datacenters 5
Core switch power 10kWh / switch
VM CPU requirement 8 cores / VM
VM memory requirement 4 GB / VM
Number of VMs required 36 / request
The network connection plan used to calculate power
consumption of Geochronos virtual slice is showed in Figure 8. The name of each core switch represents the province where the switch is located. [18] gives the green factor of the power grid in each province. We first calcu-late the power consumed when sending a bit of data be-tween the two data center gateways. This amount is the total of consumption of optical switches linking two data centers, which is estimated as follows [22].
𝑃𝑔 = ∑8( 1)
1 × 𝑃𝑆 (12)
where 𝐵 and 𝑃𝑆 are respectively the bandwidth capac-ity (Gbps) and power (kW) of a core switch, and is the number of core switches between 𝐷 and 𝐷 . For example, there are 4 core switches between Calgary and Montreal nodes in Figure 8, namely Calgary, Chicago, Toronto and Montreal (the lightpath bypasses the Ottawa switch). 𝐻 is the number of core hops. As all data centers are connect-ed directly to the core network by optical links: 𝐻 = 1. All core switches are Ciena OADM Core Optical Transport System model with a nominal power of 250W [26].
We consider two scenarios: i) the slice is located at the core node (Montreal, Canada), and ii) the slice is distrib-uted on multiple edge nodes. The core is powered by hy-droelectricity and has a large capacity that enables it to maintain service in the network. Edge nodes are powered by sun and/or wind and have smaller capacity. Six VMs

1939-1374 (c) 2013 IEEE. Personal use is permitted, but republication/redistribution requires IEEE permission. Seehttp://www.ieee.org/publications_standards/publications/rights/index.html for more information.
This article has been accepted for publication in a future issue of this journal, but has not been fully edited. Content may change prior to final publication. Citationinformation: DOI 10.1109/TSC.2014.2362544, IEEE Transactions on Services Computing
11
are allocated for Geochronos slice, together with six flows among them (see the numbered arrows in Figure 9) and two external flows.
All local links in each data center have the same bandwidth capacity of 1Gbps, and a connection between each pair of data centers is 10Gbps. Assuming that all links (server-server or server-switch) consumes the same power 𝜕 whose value is estimated to be about 20W [27].
Figure 10: Tree, Fat-tree and BCube architecture
Three connection schemes are used for node architec-ture: Tree, Fat-tree and BCube, as shown in Figure 10 in which the red squares represent the hosts and the blue rounds represent the switches. Note that there is a gate-way in Figure 10-B and Figure 10-C (Fat-tree and BCube) connecting to all top-level switches. The power consump-tion 𝑝(𝑖, 𝑗) of each link is calculated as follows [28].
For Tree architecture with two layers (Figure 10-A):
𝑝(𝑖, 𝑗) = {
0 𝑖𝑓 𝑖 = 𝑗
𝜕 𝑖𝑓 ⌊
⌋ = ⌊
⌋
3𝜕 𝑒𝑙𝑠𝑒
(13)
Where p is the number of switch ports (4 ports in Fig-ure 10-A).
For Fat-tree architecture with 4-port switches (Figure 10-B):
𝑝(𝑖, 𝑗) =
{
0 𝑖𝑓 𝑖 = 𝑗
𝜕 𝑖𝑓 ⌊
⌋ = ⌊
⌋
3𝜕 𝑖𝑓 ⌊
⌋ ≠ ⌊
⌋ 𝑎𝑛𝑑 ⌊
⌋ = ⌊
⌋
5𝜕 ⌊
⌋ ≠ ⌊
⌋
(14)
For BCube architecture (Figure 10-C):
𝑝(𝑖, 𝑗) = {0 𝑖𝑓 𝑖 = 𝑗
2𝜕 × ℎ𝑎𝑚𝑚𝑖𝑛𝑔 (𝑎𝑑𝑑𝑟(𝑖), 𝑎𝑑𝑑𝑟(𝑗)) − 1 𝑖𝑓 𝑖 ≠ 𝑗 (15)
Figure 11 presents a comparison of three edge nodes in terms of carbon emissions (and indirectly power con-sumption) when the Geochronos slice is mapped to un-derlying infrastructure using the traditional virtual net-work embedding algorithm [32]. Indeed, a number of heuristic algorithms have been proposed to resolve the virtual network mapping problem, such as hierarchical node mapping [38], survival mapping [39], and distribut-ed mapping [40], among the others (a nearly complete list of existing algorithms can be found in [41]). However the coordinated mapping algorithm proposed in [32] is the
widest used and strongest in terms of node and link mapping coordination, which is often used as a building block to establish the other algorithms.
As shown, the Fat-tree architecture consumes the larg-est amount of energy since it has the largest number of network levels and intermediate switches. The BCube architecture achieves the best performance in terms of energy consumption as a result of its multipath routing feature.
Figure 11: Carbon emissions resulting from Geochronos flows assignment
for three intra data center interconnect architectures (1st scenario)
Table 2 depicts the average number of virtual node consolidation operations (over 36 allocations) on the three architectures. The actual number of consolidations is case-by-case dependent, following the availability capacity of physical servers and links. The highest node degree in the slice is of the portal VM (3-degree). Table 2 suggests that BCube may allow the largest number of consolidation, which is explained by the highest degree of its physical nodes among these three architectures (Figure 10).
TABLE 2. SUMMARY OF VIRTUAL NODE CONSOLIDATION
Architecture 1-Degree
consolida-
tion
2-Degree
consolida-
tion
3-Degree
consolida-
tion
Tree 11.3 6 0
Fat-tree 10.6 5.4 0
BCube 12 9.7 3.3
Figure 12 gives a comparison of the proposed solution
and the traditional virtual network embedding algorithm when assigning Geochronos flows in a data center having Tree and Fat-tree architectures respectively. In the Tree architecture, the proposed solution may reduce about 40% of network power consumption compared to the traditional algorithm. This number may increase up to 60% in the Fat-tree architecture. In reality, if only 1-degree virtual nodes are considered in the consolidation process, network power consumption is reduced about 26% in

1939-1374 (c) 2013 IEEE. Personal use is permitted, but republication/redistribution requires IEEE permission. Seehttp://www.ieee.org/publications_standards/publications/rights/index.html for more information.
This article has been accepted for publication in a future issue of this journal, but has not been fully edited. Content may change prior to final publication. Citationinformation: DOI 10.1109/TSC.2014.2362544, IEEE Transactions on Services Computing
12
Tree architecture, and about 40% in Fat-tree architecture. If only N-degree (N > 1) virtual nodes are consolidated, network power consumption is reduced about 13% in Tree architecture, and about 20% in Fat-tree architecture.
A) Tree architecture
B) Fat-tree architecture
Figure 12: Carbon emissions resulting from Geochronos flow assignment
using traditional IP routing and the proposed solution (1st scenario)
Figure 13 shows carbon emissions of the traditional mapping algorithm and the proposed solution when the Geochronos slice is distributed across multiple data cen-ters in the network (the 2nd scenario). It is worth noting that all data centers in the network use the same intra interconnect architecture. Similarly to Figure 12, the pro-posed solution clearly achieves a better performance compared to the traditional algorithm in the Tree and Fat-tree architecture. It is worth noting that this improvement could still increase when we compare these two algo-rithms in a larger scale network. Indeed, the number of data centers involved in our experiment is still small (five nodes) and the number of links between these data cen-ters is also small (six lighpaths).
A) Tree architecture
B) Fat-tree architecture
Figure 13: Carbon emissions resulting from Geochronos flow assignment
using traditional IP routing and the proposed solution (2nd scenario)
7 CONCLUSION
In this paper we faced a problem of optimal flow assign-ment for virtual slice based on software-defined para-digms, in order to provide environment-aware recom-mendation services for cloud operators. This is a piece of work in our global green cloud optimization framework taking into account computing, network, and storage re-sources. Simulations show that the proposed solution achieves different performance when intra data center network topology is considered in our optimization mod-el. In other words, having a good intra data center net-work topology plays an important role in reducing net-work carbon footprint.
To simplify the calculation in our experiments, we have assumed that all local links have the same power, which is not necessarily true in reality. However, it does not change the problem formulation as each link is asso-ciated with a variable representing power consumption when sending a bit. Also, the power consumption of each local switch may not be proportional with processing ca-pacity.
The synchronization of Network Manager and GSN Controller is also an issue to be investigated, in order to prevent situations in which a flow would be established when VMs had been migrated.

1939-1374 (c) 2013 IEEE. Personal use is permitted, but republication/redistribution requires IEEE permission. Seehttp://www.ieee.org/publications_standards/publications/rights/index.html for more information.
This article has been accepted for publication in a future issue of this journal, but has not been fully edited. Content may change prior to final publication. Citationinformation: DOI 10.1109/TSC.2014.2362544, IEEE Transactions on Services Computing
13
Our future work will address the global optimization problem and quality of services hosted by the GSN.
ACKNOWLEDGMENT
We thank CANARIE for funding the GSN project, and all GSN partners for their contribution in this project. Re-search on Telco-grade cloud applications is supported by Ericsson, Inocybe Technologies and NSERC.
REFERENCES
[1] F Schneider, “The Jevons paradox and the myth of resource efficiency improvements,” Journal of Cleaner Production, 18(6), pp. 600-602, 2010.
[2] The Climate Group, “SMART2020: Enabling the low carbon economy in the information age,” Report on behalf of the Global eSustainability Initiative (GeSI), 2008.
[3] M Lemay, KK Nguyen, B St Arnaud, M Cheriet, “Toward a Zero-Carbon Network: Converging Cloud Computing and Network Virtualization,” IEEE Internet Computing, 16(6), pp. 51–59, 2012.
[4] N McKeown, T Anderson, H Balakrishnan, “OpenFlow: enabling innovation in campus networks,” ACM SIGCOMM CCR, 38(2), pp. 69-74, 2008.
[5] KK Nguyen, M Cheriet, M Lemay, V Reijs, A Mackarel, A Pastrama, "Environmental-aware virtual data center network," Journal of Computer Networks, 56(10), pp. 2538-2550, Elsevier, 2012.
[6] The GreenStar Network Project. http://greenstarnetwork.com
[7] FF Moghaddam, M Cheriet, KK Nguyen “Low Carbon Virtual Private Clouds,” Proceedings of IEEE CloudCom, pp. 259-266, 2011.
[8] A Daouadji, KK Nguyen, M Lemay, M Cheriet, "Ontology-based resource description and discovery framework for low carbon grid networks," Proceedings of IEEE SmartGridComm, pp. 477-482, 2010.
[9] KK Nguyen, M Cheriet, M Lemay, “Powering a Data Center Network via Renewable Energy: A Green Testbed,” IEEE Internet Computing, 17(1), pp. 40-49, 2013.
[10] Amazon Inc. “Amazon Virtual Private Cloud (Amazon VPC),” http://aws.amazon.com/vpc
[11] R Niranjan Mysore, A Pamboris, N Farrington, N Huang, P Miri, S Radhakrishnan, V Subramanya, A Vahdat, “PortLand: a scalable fault-tolerant layer 2 data center network fabric,” Proceedings of ACM SIGCOMM ’09, pp. 39-50, 2009.
[12] C Guo, G Lu, D Li, H Wu, X Zhang, Y Shi, C Tian, Y Zhang, S Lu, “Bcube: a high performance, server-centric network architecture for modular data centers,” Proceedings of SIGCOMM ’09, pp. 63–74, 2009.
[13] L Gyarmati, TA Trinh, “Scafida: A scale-free network inspired data center architecture,” ACM SIGCOMM Computer Communication Review, 40(5), pp. 4-12, 2010.
[14] V Mann, A Kumar, P Dutta, S Kalyanaraman, “VMFlow: leveraging VM mobility to reduce network power costs in data centers,” Proceedings of the 10th international IFIP TC 6 conference on Networking, pp. 198-211, 2011.
[15] W Fang, X Liang, S Li, L Chiaraviglio, N Xiong, “VMPlanner: Optimizing virtual machine placement and traffic flow routing to reduce network power costs in cloud data centers,” Journal of Computer Networks, 57(1), pp. 179-196, Elsevier, 2013.
[16] B Heller, S Seetharaman, P Mahadevan, “ElasticTree: saving energy in data center networks,” Proceedings of the 7th USENIX Symprosium on Networked Systems Design and Implementation, 2010.
[17] M Al-Fares, S Radhakrishnan, B Raghavan, “Hedera: Dynamic flow scheduling for data center networks,” Proceedings of the 7th USENIX Symprosium on Networked Systems Design and Implementation, 2010.
[18] “Emission Factors from Canada’s Greenhouse Gas Inventory,” Environment Canada, 2010. http://ec.gc.ca.
[19] M Poikselkä, G Mayer, “The IMS: IP Multimedia Concepts and Services,” John Wiley and Sons Ltd., 2009.
[20] R Banner, A Orda, “Multipath routing algorithms for congestion minimization,” IEEE/ACM Transactions on Networking (TON), 15(2), 2007.
[21] N Gude, T Koponen, J Pettit, B Pfaff, M Casado, “NOX: towards an operating system for networks,” ACM SIGCOMM Computer Communication Review, 38(3), pp. 105-110, 2008.
[22] J Baliga, R Ayre, K Hinton, WV Sorin, “Energy consumption in optical IP networks,” J. Lightwave Technology, 27(13), pp. 2391-2403, 2009.
[23] C Guo, H Wu, K Tan, L Shi, Y Zhang, S. Lu, “Dcell: a scalable and fault-tolerant network structure for data centers,” Proceedings of SIGCOMM ’08, pp. 75–86, 2008.
[24] R Curry, C Kiddle, R Simmonds, “An on-line collaborative data management system,” Proceedings of IEEE Gateway Computing Environments Workshop (GCE), pp. 1-10, 2010.
[25] S Figuerola, M Lemay, V Reijs, M Savoie, B.St Arnaud, “Converged Optical Network Infrastructures in Support of Future Internet and Grid Services Using IaaS to Reduce GHG Emissions,” Journal of Lightwave Technology, 27(12), pp. 1941-1946, 2009.
[26] Product data sheet. Ciena Configurable OADM for CoreStream Agility Optical Transport System. http://www.ciena.com/files/Configurable_OADM_A4_DS.pdf, 2008.
[27] C Gunaratne, K Christensen, B Nordman, “Managing energy consumption costs in desktop PCs and LAN switches with proxying, split TCP connections, and scaling of link speed,” International Journal of Network Management, 15(5), John Wiley & Sons, Ltd., 2005.
[28] X Meng, V Pappas, L Zhang, “Improving the scalability of data center networks with traffic-aware virtual machine placement,” Proceedings of IEEE INFOCOM, pp. 1-9, 2010.
[29] Cisco Data Center Infrastructure 2.5 Design Guide. http://www.cisco.com/univercd/cc/td/doc/solution/dcidg21.pdf.
[30] C Hopps, “Analysis of an Equal-Cost Multi-Path Algorithm,” IETF RFC 2992, 2000.
[31] R Zhang-Shen, N McKeown, “Designing a Predictable Internet Backbone Network,” Proceedings of ACM HotNets, 2004.
[32] M Chowdhury, MR Rahman, R Boutaba, “ViNEYard: Virtual network embedding algorithms with coordinated node and link mapping,” IEEE/ACM Transactions on Networking, 20(1), pp. 206-219, 2012.
[33] S Su, Z Zhang, X Cheng, Y Wang, “Energy-aware virtual network embedding through consolidation,” Proceedings of the IEEE INFOCOM Workshop on Computer Communications Workshops, pp. 127 - 132, 2012.
[34] MF Zhani, Q Zhang, G Simon, R Boutaba, “VDC Planner: Dynamic Migration-Aware Virtual Data Center Embedding for Clouds,” Proc. of the IFIP/IEEE Integrated Network Management Symposium (IM). Ghent (Belgium), 2013.
[35] AP Bianzino, C Chaudet, D Rossi, et al. "A survey of green networking research." IEEE Communications Surveys & Tutorials, 14(1), pp. 3-20, 2012.
[36] R Bolla, F Davoli, R Bruschi, et al. "The potential impact of green technologies in next-generation wireline networks: Is there room for energy saving optimization?." IEEE Communications Magazine, 49(8), pp. 80-86, 2011.
[37] Yu, Minlan, et al. "Rethinking virtual network embedding: substrate support for path splitting and migration." ACM SIGCOMM Computer Communication Review 38(2), pp. 17-29, 2008.
[38] T. Ghazar, N. Samaan, “A hierarchical approach for efficient virtual network embedding based on exact subgraph matching,” in IEEE Global Telecommunications Conference (GLOBECOM 2011), pp. 1–6, 2011.
[39] G. Sun, H. Di, H. Yu, L. Li, V. Anand, “The Framework and Algorithms for the Survivable Mapping of Virtual Network onto a Substrate Network,” IETE Technical Review, 28(5), pp. 381–391, 2011.
[40] I. Houidi, W. Louati, D. Zeghlache, “A distributed virtual network mapping algorithm,” in Proceeding of IEEE Inter-national Conference on Communication (ICC), pp. 5634 –5640, 2008.

1939-1374 (c) 2013 IEEE. Personal use is permitted, but republication/redistribution requires IEEE permission. Seehttp://www.ieee.org/publications_standards/publications/rights/index.html for more information.
This article has been accepted for publication in a future issue of this journal, but has not been fully edited. Content may change prior to final publication. Citationinformation: DOI 10.1109/TSC.2014.2362544, IEEE Transactions on Services Computing
14
[41] A Fischer, JF Botero, M Till Beck, et al. "Virtual network embedding: A survey." IEEE Communications Surveys & Tutorials, 15(4), pp. 1888-1906, 2013.
Kim Khoa Nguyen is a Research Fellow at the École de Technolo-gie Supérieure (University of Quebec). He is key architect of the GreenStar Network project and leading R&D in Ericsson’s Green Sustainable Telco Cloud project. His expertise includes green ICT, cloud computing, smart grid, router architecture, and wireless net-working. He has published more than 30 papers, and holds a num-ber of patents in the in the field. Nguyen has a PhD in electrical and computer engineering from Concordia University. Contact him at [email protected].
Mohamed Cheriet is a Full Professor in the Automated Production Engineering Department at École de Technologie Supérieure, Uni-versity of Quebec. He is a Canada Research Chair, Tier 1 on Smart Sustainable Eco-Cloud. His expertise includes cloud computing, green ICT, document image analysis, OCR, mathematical models for data processing, pattern classification models, and learning algo-rithms, as well as perception in computer vision. Prof. Cheriet has a PhD in computer science from the University of Pierre et Marie Cu-rie. He cofounded the Laboratory for Imagery, Vision, and Artificial Intelligence (LIVIA) and founded and directs the Synchromedia Con-sortium (Multimedia Communication in Telepresence) at the Univer-sity of Quebec. Contact him at [email protected].