Embed Size (px)
Citation preview
R E S EARCH ART I C L E
AN IMAL ECOLOGY
1Molecular Epidemiology and Public Health Laboratory, Hopkirk Research Institute, MasseyUniversity, Private Bag, 11 222, Palmerston North 4442, New Zealand. 2Department ofBiology, University of Florida, Gainesville, FL 32611, USA. 3Emerging Pathogens Institute,University of Florida, Gainesville, FL 32611, USA. 4Fogarty International Center, NationalInstitutes of Health, Bethesda, MD 20892, USA. 5Institute of Fundamental Sciences, MasseyUniversity, Private Bag, 11 222, Palmerston North 4442, New Zealand. 6U.S. GeologicalSurvey, Fort Collins Science Center, Fort Collins, CO 80526, USA. 7Department of Biology,Colorado State University, Fort Collins, CO 80523, USA.*Corresponding author. E-mail: [email protected]
Hayman et al. Sci. Adv. 2016; 2 : e1500831 29 January 2016
2016 © The Authors, some rights reserved;
exclusive licensee American Association for
the Advancement of Science. Distributed
under a Creative Commons Attribution
NonCommercial License 4.0 (CC BY-NC).
10.1126/sciadv.1500831
Environment, host, and fungal traitspredict continental-scale white-nosesyndrome in bats
David T. S. Hayman,1* Juliet R. C. Pulliam,2,3,4 Jonathan C. Marshall,1,5 Paul M. Cryan,6 Colleen T. Webb7White-nose syndrome is a fungal disease killing bats in eastern North America, but disease is not seen in Eu-ropean bats and is less severe in some North American species. We show that how bats use energy duringhibernation and fungal growth rates under different environmental conditions can explain how some batsare able to survive winter with infection and others are not. Our study shows how simple but nonlinear inter-actions between fungal growth and bat energetics result in decreased survival times at more humid hiberna-tion sites; however, differences between species such as body size and metabolic rates determine the impact offungal infection on bat survival, allowing European bat species to survive, whereas North American species canexperience dramatic decline.
Do
on May 6, 2018
http://advances.sciencemag.org/
wnloaded from
INTRODUCTION
Central questions in disease and evolutionary ecology relate to howinteractions among hosts, their parasites, and the environment affecthost-parasite dynamics and why pathogenicity may differ among in-dividuals and species. Wildlife diseases can have major impacts on hu-man, animal, and ecosystem health. Epizootics of rinderpest affectedAfrican ecosystems for decades (1), and chytridiomycosis and ranavirushave caused worldwide decline of amphibian populations and speciesextinctions (2, 3). Of similar magnitude and potential for long-term im-pacts, white-nose syndrome (WNS) is one of the most rapidly spread-ing wildlife diseases ever recorded (Fig. 1) (4, 5). WNS is caused by thepsychrophilic (cold-growing) fungus Pseudogymnoascus destructans(Pd; previously Geomyces destructans) (6–8), which grows at approx-imately 0° to 19.7°C (9) and invades the skin tissues of hibernatingbats (10, 11). European bats infected with Pd can hibernate without ob-vious mortality (12); however, since the discovery of WNS in NorthAmerica during 2007, WNS has been diagnosed in seven speciesspanning 26 U.S. states and 5 Canadian provinces (Fig. 1) and haskilled millions of bats. Genetic evidence suggests that Pd was intro-duced to North America from Europe (7, 13–15).
Hibernating bats spend the majority of winter in deep torpor (bodytemperature <10°C) with intermittent arousals to euthermia (35° to38°C) (16). Euthermic arousals at low ambient temperature consumethe majority of overwinter energy reserves, and bats require specificand narrow ranges of hibernaculum temperatures to survive winteron their limited energy budgets (16, 17). Studies show that WNS mor-tality begins approximately 3 months into hibernation, and diseasedbats typically become emaciated by late winter as arousal frequencyfrom torpor increases (8, 18). Thus, a common hypothesis for whybats die from WNS is that Pd infection causes them to arouse withincreasing frequency and deplete their required fat reserves (8, 18, 19).
However, support for how this hypothesis plays out in nature is largelycircumstantial, and a mechanistic understanding that would allow pre-diction of how the WNS epidemic will spread and which species willbe most affected is lacking. Few studies explicitly integrate feedback onbat arousal from temperature-dependent fungal growth (20), despiteclear patterns in how temperature influences Pd growth (9) and howPd infection increases arousal frequency (8, 18). Furthermore, empir-ical evidence indicates that relative humidity (RH) influences WNSpopulation declines (21), yet humidity-dependent fungal growth hasnot successfully been integrated into bat survival models. Species ofbats in the northeastern United States showing greatest susceptibilityto WNS are known to consistently use the wettest hibernacula (10), andconidial fungi are more likely to germinate on wet surfaces (22), sug-gesting that Pd may be more infectious in humid sites. Humidity hasbeen integrated into bat hibernation models (20, 23), but only as afactor influencing evaporative water loss (EWL) in the bat hosts andnot accounting for potentially nonlinear interactions among tempera-ture, RH, and growth of the fungus in bat skin.
We model the growth dynamics of Pd and energetic requirementsof WNS-affected hibernating bats under a range of environmentalconditions. Populations of the little brown bat (Myotis lucifugus) inthe northeastern United States and Canada have been more affectedbyWNS than any other species (5). We compare model outcomes fromM. lucifugus to another species less affected by WNS in North America,the big brown bat (Eptesicus fuscus), and to two apparently unaffectedEuropean species, the serotine (Eptesicus serotinus) and greater mouse-eared bats (Myotis myotis). We model Pd growth as a function of bodytemperature and RH and incorporate this into an energetic modelacross a range of ambient temperatures. We predict mortality times,based on critical depletion of stored body fat, for specific combinationsof environmental conditions. We then use climate data from withinthe distributions of each species to predict survival times of each spe-cies compared to spatially varying winter durations within its range,with and without fungal infection.
RESULTS AND DISCUSSION
Our modified energetic model (16) is generalizable across speciesthat prevent their body temperatures from dropping below (defend)
1 of 12

R E S EARCH ART I C L E
on May 6, 2018
http://advances.sciencemag.org/
Dow
nloaded from
different temperatures (Ttor-min) during overwinter hibernation. Ourgeneralization ensures that if the temperature is at the optimal torportemperature (Ttor-min), then energy use is minimized [minimum torpormetabolic rate (TMRmin)] so that time in torpor (ttor) is maximized,whereas if the temperature is away from Ttor-min, ttor is reduced suchthat it is equal for given TMR above and below Ttor-min (fig. S1). Ourresults demonstrate that bats are energetically constrained to narrowranges of cold temperatures for surviving long winters (for example,6 months) even in the absence of fungal infection (fig. S2). We addi-tionally model fungal growth dynamics and incorporate these dynam-ics into the energetic model by assuming that Pd infection affects batsby increasing the consumption of stored fat with increasing frequencyof arousal from deep torpor.
Higher arousal frequency increases overwinter mortality in theenvironmental conditions within which Pd grows well, especiallywarmer and wetter hibernacula (Fig. 2). The model predicts that hi-bernating M. lucifugus infected with Pd can make energy reserves last6 months at both ambient temperatures (Ta) between 1° and 6°C and<98% RH. However, bats that defend different minimum temperatures(Ttor-min) have different optimal torpor temperatures, and this and otherhost traits affect the duration of winters they can survive (Fig. 2).
Support for our model predictions includes independent experi-mental observations, in which M. lucifugus experimentally infected
Hayman et al. Sci. Adv. 2016; 2 : e1500831 29 January 2016
with European and North American isolates of Pd died within 70 to120 days at 7°C and 97% RH (8). Under those conditions, our modelpredicts thatM. lucifugus can survive 100 days, matching the experimentalresults (Fig. 2). The model predicts survival to 185 days (6 months) underthese same conditions without Pd infection (fig. S2). Additional evi-dence of model validity includes predicted surface areas infected (fig.S3) and maps of predicted overwinter survival across the distributionsof affected species (Fig. 3) that qualitatively match observed diseasepatterns, as well as observations of greater mortality in hibernaculawith warmer temperatures (21).
The modeled mechanism of feedback between increased fungalgrowth, decreased torpor time, and bat energetics driven by temper-ature and RH seems reasonably supported for M. lucifugus, but therobustness of this mechanism is further supported across multiple spe-cies. For example, our model predicts that E. fuscus can hibernate for>6 months in the absence of Pd infection (fig. S2) and over a largerrange of environmental conditions than M. lucifugus. This trend isreflected in the extended survival times for E. fuscus when Pd infec-tion is incorporated into the model (Fig. 2). We find that EuropeanM. myotis is limited to a smaller environmental parameter space thanthe other species analyzed (Fig. 2). However, when we compare pre-dicted potential hibernation duration to estimated winter duration(hereafter “survival capacity”) of each of the four species across their
Fig. 1. Spread of WNS over eight winters. The annual spread of the fungus that causes WNS, Pd, in North America. Shaded land units representcounties in the United States and voting subdistricts in Canada. Red counties show where the disease is believed to have started during the winter
of 2006–2007.2 of 12

R E S EARCH ART I C L E
http://advanceD
ownloaded from
A
0 5 10 15
8890
9294
9698
0
2
4
6
8
10
12 2 4
6
8 %
Hum
idity
Temperature (°C)
Pre
dict
ed s
urvi
val t
ime
(mon
ths) B
0 5 10 15
8890
9294
9698
0
2
4
6
8
10
122 4 4 6
8
10
% H
umid
ity
Temperature (°C)
Pre
dict
ed s
urvi
val t
ime
(mon
ths)
C
0 5 10 15
8890
9294
9698
0
2
4
6
8
10
12
3
3
4
5
6
7 % H
umid
ity
Temperature (°C)
Pre
dict
ed s
urvi
val t
ime
(mon
ths) D
0 5 10 1588
9092
9496
98
0
2
4
6
8
10
12
4
6
8
10
% H
umid
ity
Temperature (°C)
Pre
dict
ed s
urvi
val t
ime
(mon
ths)
Fig. 2. Predicted times to deplete overwinter energy reserves for bats infected with Pd. (A to D) Model predictions in months (surface colors andcontours) are shown for a range of RH percentages (88 to 99%) and ambient hibernacula temperatures (0° to 19.4°C) at which Pd grows for M. lucifugus
s.s
(A), E. fuscus (B), M. myotis (C), and E. serotinus (D). The arrow in (A) shows 3.3 months at 7°C and 97% RH for M. lucifugus.on May 6, 2018
ciencemag.org/
A
0
20
40
60
80
−150 −100 −50Longitude
Latit
ude
−8
−4
0
4
8Months
B
0
20
40
60
80
−150 −100 −50Longitude
Latit
ude
−8
−4
0
4
8Months
C
0
10
20
30
−10 −5 0 5 10Months
Cou
nt
WNS
MyLuPost
MyLuPre
D
0
20
40
60
80
−150 −100 −50Longitude
Latit
ude
−8
−4
0
4
8Months
E
0
20
40
60
80
−150 −100 −50Longitude
Latit
ude
−8
−4
0
4
8Months
F
0
10
20
30
−10 −5 0 5 10Months
Cou
nt
WNS
EpFuPost
EpFuPre
Fig. 3. Comparison of winter fat depletion in North American bats. (A to F) Difference between winter duration and predicted time to depleteoverwinter energy reserves for M. lucifugus (A to C) and E. fuscus (D to F) within their distributions. Differences in months are shown before (A and D)
and after (B and E) the arrival of the fungus Pd, the cause of WNS. Blue indicates that bats are predicted to have more than enough energy reserves tosurvive a typical winter (+ values), with white (no difference, all energy reserves used) and red (− values) indicating that bats are unable to survive winterswith enough energy reserves to survive through hibernation. Dark gray indicates that energy reserves are greater than an 8-month upper limit in (D).Distributions of the difference between winter duration and the model’s predicted overwinter survival times are in the histograms (C and F), with medianvalues (dashed lines) for pre-Pd (blue) and post-Pd (pink) infection and zero difference (black line) shown.Hayman et al. Sci. Adv. 2016; 2 : e1500831 29 January 2016 3 of 12

R E S EARCH ART I C L E
distributional ranges using climate data (Figs. 3 and 4), results indi-cate that although M. myotis has a lower median survival capacity(+3.2 months) than E. serotinus (+4.3 months), the median survivalcapacities of both infected European species are higher than thosepredicted for both infected North American species (M. lucifugus,−1.2 months; E. fuscus, +2.2 months). Modeled survival capacitiesof M. lucifugus and E. fuscus without Pd infection were +1.5 and+4.9 months, respectively (Fig. 3), again indicating substantially higheroverwinter survival in the absence of the fungus. Bootstrapped Harrell-Davis quantiles of predicted survival capacity times are statistically higherfor E. fuscus than M. lucifugus (+0.6 month versus −3.2 months, P <0.001; +2.1 months versus −1.0 month, P < 0.001; +3.3 months versus+0.9 month, P < 0.001).
We assumed that European bat parameters were measured frompopulations with Pd infection. Given this assumption, our model sug-gests that behavioral and/or physiological traits may have evolved or
Hayman et al. Sci. Adv. 2016; 2 : e1500831 29 January 2016
been preadapted in the European species to increase survival with Pdinfection, whereas in M. lucifugus and E. fuscus, such traits have notevolved. Predictions suggest that E. fuscus may be better suited to sur-vive WNS infection than M. lucifugus. Our findings suggest that en-vironmental conditions and basic host traits alone may explain muchof the variability in disease outcomes among species of bats infected byPd in North America and Europe.
Our results show how incorporating temperature- and humidity-dependent fungal growth into models to predict bat hibernation en-ergetics, and thus overwinter survival, is critical because these keyfeatures of fungal ecology are inextricably linked to bat mortality fromWNS. Sensitivity analysis assessing that the proportion of examinedparameter space survival is predicted over after 6-month winters(16) reveals that survival is significantly affected by numerous param-eters, but that our model is most responsive to fungal growth changesrelated to RH (Fig. 5).
on May 6, 2018
http://advances.sciencemag.org/
Dow
nloaded from
20
40
60
−20 0 20 40
−20 0 20 40
Longitude
Latit
ude
−8
−4
0
4
8Months
20
40
60
Longitude
Latit
ude
−8
−4
0
4
8Months
0
5
10
0 5
Months
Cou
nt
0
5
10
15
0 5Months
Cou
nt
A
B
C
D
Fig. 4. Comparison of winter fat depletion in European bats. (A to D) Difference between winter duration and predicted time to deplete overwinter
energy reserves for M. myotis (A and C) and E. serotinus (B and D) within their distributions. Results in months are shown with the fungus Pd, the cause ofWNS in American bats. Blue indicates that bats are predicted to have more than enough energy reserves to survive a typical winter (+ values), with white(no difference, all energy reserves used) and red (− values) indicating that bats are unable to survive winters with enough energy reserves to survivethrough hibernation. Distributions of the difference between winter duration and model’s predicted overwinter survival times are in the histograms (C andD), with median values (dashed red lines) and zero difference (black line) shown.4 of 12

R E S EARCH ART I C L E
ohttp://advances.sciencem
ag.org/D
ownloaded from
The importance of RH to Pd growth is plausible, because conidialfungi such as Pd are more likely to germinate and degrade nutrientsubstrates in the presence of high moisture levels in their environ-ments (22). These observations and results suggest that individuals,colonies, or species of bats that use microhabitats with lower RH willbe less susceptible to WNS. In most caves, RH reaches 100% far fromentrances but can vary throughout, and RH is affected by Ta, airflow,and atmospheric pressure (24). Typically, bats use hibernation siteswith 90 to 100% RH (25); however, three North American species thatseem less severely affected by WNS—Myotis sodalis, Myotis leibii, andE. fuscus—tend to select drier areas within hibernacula, whereas the threespecies most dramatically affected by WNS—M. lucifugus, Myotisseptentrionalis, and Perimyotis subflavus—consistently roost in themost humid locations within hibernacula and are regularly observedwith condensation on their fur (10, 21). Changes in RH are predictedto affect bat survival independent of Pd infection [for example, Cryanet al. (10) and Willis et al. (23)]. We have not incorporated RH intothe bat energetic model to allow for a parsimonious modeling ap-proach; however, we predict that increased RH will likely improvethe survival of M. lucifugus in the absence of Pd by reducingEWL (26, 27), whereas our model predicts that increasing humidityin hibernacula with Pd generally decreases bat survival through WNS,a result supported by field data (21). The single most affected species,M. lucifugus, is in positive water balance at 2° and 4°C only at ≥99%RH (25), which is the ideal growing conditions for Pd. Monitoring RHand understanding the interactions between water vapor pressure andEWL (26, 27) in bat hibernacula may be a key element of future diseasesurveillance and research efforts, because this environmental variablemight explain a considerable amount of the variability in Pd pathogenic-ity observed among species, hibernation environments, and continents.
Sensitivity analyses revealed that host traits had smaller effects onsurvival than changes in humidity-dependent growth parameters(Table 2 and Fig. 5). However, torpor is already constrained thermally(fig. S2) (16), and host traits and species distributions interact to explain
Hayman et al. Sci. Adv. 2016; 2 : e1500831 29 January 2016
n May 6, 2018
species-specific differences observed in survival times (Figs. 2 and 3).Decreasing time in torpor and increasing euthermic times also increasedmortality in the sensitivity analysis as expected. With respect to hosttraits, survival was most sensitive to changes in body mass (BM), withincreasing mass decreasing mortality (possibly due to increased fatavailable and decreased thermal conductance), followed by the lowertemperature at and above which bats are thermally neutral (Ttor-min)and minimal resting metabolic rate (RMR) occurs, Tlc. However, therewas little natural variation in Tlc [coefficient of variation (CV), 0.01]among species (Table 1), and greater variation in other parametersthat significantly affected the model results (Fig. 5) [for example, TMRmin
(CV, 1.21) and Ttor-min (CV, 0.66)] suggests that these may be higherpriority for study because they might provide greater predictive abilityregarding differences in survival between species. Attempts to predictthe necessary host trait parameters (for example, Tlc and TMRmin) frommore frequently measured parameters (for example, BM and Ttor-min)were unsuccessful (r2 = 0.01 to 0.84), highlighting a more general needto study bats further.
Our model results predict that those species more likely to survivePd in North America will have a combination of physical and behav-ioral traits, including larger body sizes and hibernation in drier sitesand/or colder sites. The results suggest that within populations, therewill be strong selection pressure for these traits.
Our results indicate that we can predict bat mortality using amodel that incorporates bat traits, fungal growth components, andenvironmental conditions. We recognize, however, that other factorscan play a role in the disease process. Increased metabolic rates mayoccur through alternative mechanisms in the absence of increasedarousal frequency (28). In addition to energy expenditure, othermechanisms that may lead to decreased survival of WNS-affected batsinclude altered physiological processes during winter, such as fungaldamage to wing membranes potentially disrupting blood circulation,water and electrolyte balance, or immune function (10, 29–32). All orsome of these processes may influence arousals from torpor, but wewere able to explain and predict bat mortality using a parsimonioushost energetic model, and some of these additional aspects may becaptured phenomenologically in our model, because Pd growth iswhat influences arousal (8, 18). The overwhelming effect of increasedarousals depleting energy reserves is persuasive given that one arousalbout ofM. lucifugus hibernating at 5°C consumes the same amount offat energy as 67 days spent in torpor (17).
Previous studies have modeled the temporal dynamics of WNS asit spreads (33). We assume that because Pd is a saprobic fungus, it canpersist in the underground environments inhabited by overwinteringbats. Therefore, we did not model transmission dynamics within thebat population itself. Host density and social behaviors likely influencethe transmission dynamics of WNS (21) and could be incorporatedinto modeling frameworks along with host-specific fungal growth asmore data become available (34). Our mechanistic model may providea framework for potentially integrating species distribution modeling(16), climate change, and the impacts of WNS (for example, fig. S4).However, such efforts may require a better understanding of how toscale macroscale environmental changes, such as climate change, tomicroscale environmental change within caves—our analyses suggestthat simple scaling (for example, fig. S4) may not be representative(35, 36).
The results of our model paint a bleak picture for the American batspecies M. lucifugus, as predicted increased arousal frequency across
RM
RT
MR
mi n
Teu Tlc
Tto
r-m
in
Ceu C
t St to
r-m
ax t ar
t eu
Mas
s β 1 β 2 β 3 µ 1 µ 2
PR
CC
−1.0
−0.5
0.0
0.5
1.0
Fig. 5. Sensitivity analysis of model parameters. Sensitivity analysis re-sults using partial rank correlation coefficients (PRCCs) for the output var-
iable predicted mortality after 6 months for a range of RH percentages(88 to 99%) and ambient hibernacula temperatures (0° to 19.4°C) forM. lucifugus. Positive PRCCs indicate that increasing a parameter increasesmortality. Parameter definitions and PRCC values are in Table 2. Bat param-eters are light gray, temperature-related fungal growth parameters aremid-gray, and humidity-related fungal growth parameters are dark gray.Significance at a = 0.05 is demarcated by the dashed line.5 of 12

R E S EARCH ART I C L E
Table 1. Winter energy expenditure model and parameters related to fungal growth. Data are given for little brown (M. lucifugus), big brown(E. fuscus), greater mouse eared (M. myotis), and serotine (E. serotinus) bats with the calculated CV for each parameter that was varied.
Parameter name
Hayman et al. Sci. Adv. 20
Parameter
16;2 : e1500831
M. lucifugus
29 January 201
E. fuscus
6
M. myotis
E. serotinus CV Units ReferencesRestingmetabolic rate
RMR
2.6 1.13 1 1.596 0.46 ml O2 g−1 hour−1 (83–87)Torpor metabolicrate (minimum)
TMRmin
0.03 0.028 0.2 0.0264 1.21 ml O2 g−1 hour−1 (83, 85, 87, 88)Euthermic bodytemperature
Teu
35 35.8 35 35 0.011 °C (17, 83–85, 87)Lower criticaltemperature
Tlc
32 31.35 32 32 0.01 °C (83, 85, 87, 88)Dow
Lower ambientset-pointtemperature(defended)
Ttor-min
2 3.5 10 6 0.659 °C (83, 85, 87, 88)nload
Euthermic thermalconductance
Ceu
0.2638 0.2638 0.2638 0.2638 — ml O2 g−1 °C−1 (86)hed from
Change intorpormetabolism
Q10
1.6 + 0.26 Ta −0.006 Ta2
1.6 + 0.26 Ta −0.006 Ta2
1.6 + 0.26 Ta −0.006 Ta
2
1.6 + 0.26 Ta −0.006 Ta2
—
(88)ttp://
Torpor conductance Ct 0.055 0.055 0.055 0.055 — ml O2 g−1 °C−1 (88)advanc
Tissue-specificheat capacity
S
0.131 0.131 0.131 0.131 — ml O2 g−1 °C−1 (17)es.scie
Maximum torporduration
ttor-max
792 792 792 792 — Hour (89)nce
Arousal time tar 0.75 0.75 0.75 0.75 — Hour (17)mag
Euthermic duration teu 3 3 3 3 — Hour (90).org/
Winter duration twinter 1–5040 1–5040 1–5040 1–5040 — Hour (91)on M
Body mass Mass 9 15 25 22.7 0.41 Grams (47, 83, 85, 87)ay 6, 20
Humidity-dependentfungal growthparameter
m1
1.51 × 10⁻⁴ 1.51 × 10⁻⁴ 1.51 × 10⁻⁴ 1.51 × 10⁻⁴ — This study18
Humidity-dependentfungal growthparameter
m2
−9.92 × 10⁻³ −9.92 × 10⁻³ −9.92 × 10⁻³ −9.92 × 10⁻³ — This studyMinimumtemperature atwhich fungalgrowth ceases
Tmin
0 0 0 0 — °C (9, 37)Temperature-dependentfungal growthparameter
b1
1.15 × 10−3* 1.15 × 10−3* 1.15 × 10−3* 1.15 × 10−3* — This studyTemperature-dependentfungal growthparameter
b2
0.27† 0.27† 0.27† 0.27† — This studyMaximumtemperature atwhich fungalgrowth ceases
Tmax
19.7† 19.7† 19.7† 19.7† — °C This study*Growth rate parameters are from Chaturvedi et al.’s study (37). †Functional shape parameters are from Verant et al.’s study (9).
6 of 12
R E S EARCH ART I C L E
on May 6, 2018
http://advances.sciencemag.org/
Dow
nloaded from
most of their distribution suggests that they will struggle to survive(Fig. 3). In conclusion, our model results allow us to understand theinteractions between host and pathogen at the individual level, andtheir interaction with the environment, as well as allow us to scalethese up to regional levels to understand and predict widespread spe-cies survival or decline. These results are important steps toward in-tegrating knowledge gained through infection traits, host biology, andclimate to increase understanding of WNS disease outcomes in bats,and they demonstrate the value of modeling dynamics of the “epide-miologic triad” (environment, pathogen, and host) to predict species-specific differences in infection outcome.
MATERIALS AND METHODS
Fungal growth modelWe assume that Pd infection occurs at the beginning of the hiberna-tion period, and we modeled Pd growth as a function of bat bodytemperature, Tb, and ambient RH through a series of torpor-arousalbouts during winter hibernation.
Two independent studies report the growth of Pd over time fordifferent temperatures in culture (9, 37). We used one that culturedthe fungus across more temperatures and reported the thermalperformance function results to obtain the temperature-dependentfunction shape (9). To obtain temperature-dependent Pd growth rates,we first simulated the expected growth (Gweek) of Pd over 5 weeks fora range of temperatures (9). We simulated the growth using the
Hayman et al. Sci. Adv. 2016; 2 : e1500831 29 January 2016
thermal performance equation (Eq. 1) (9)
Gweek ¼ a1 ⋅ Tb ⋅ ðTb − a2Þ ⋅ ða3 − TbÞ1=a4 ð1Þ
to obtain the predicted temperature-dependent Pd growth at each week for5 weeks using reported estimates of (a1 to a4) (fig. S5A) (9).
We used the results of these simulations to calculate the relation-ship between Pd growth rates and temperature through time. The in-crease in colony area was a linear function of time (fig. S5B), so weused linear model coefficients to estimate the rate of change in Pdcolony area per week. Calculated maximum Pd growth from thetwo temperatures in Chaturvedi et al.’s study (37) was fourfold greaterthan that in Verant et al.’s study (9) (fig. S5C), and we increased the maxi-mum Pd growth under optimal conditions to match Chaturvedi et al.’sstudy. To use a single function for Pd temperature-dependent growthin themodel, we then fit a nonlinear function to the different temperature-dependent linear model coefficients to model temperature-dependentgrowth (GT) with the functional form
GT ¼ b1 ⋅ ðT − TminÞ ⋅ 1 − eb2ðT−TmaxÞ� �
ð2Þ
where T is temperature, Tmin is the minimum temperature at whichthe fungus grows (fixed at 0°C) (9, 37), b1 and b2 are shape parameters,and Tmax is the maximum temperature at which Pd grows (fig. S4D).The model was fit and parameters were estimated by nonlinear(weighted) least-squares estimates [nls function in R (38)] and convertedto an hourly rate to match the parameter units for hibernating bats.
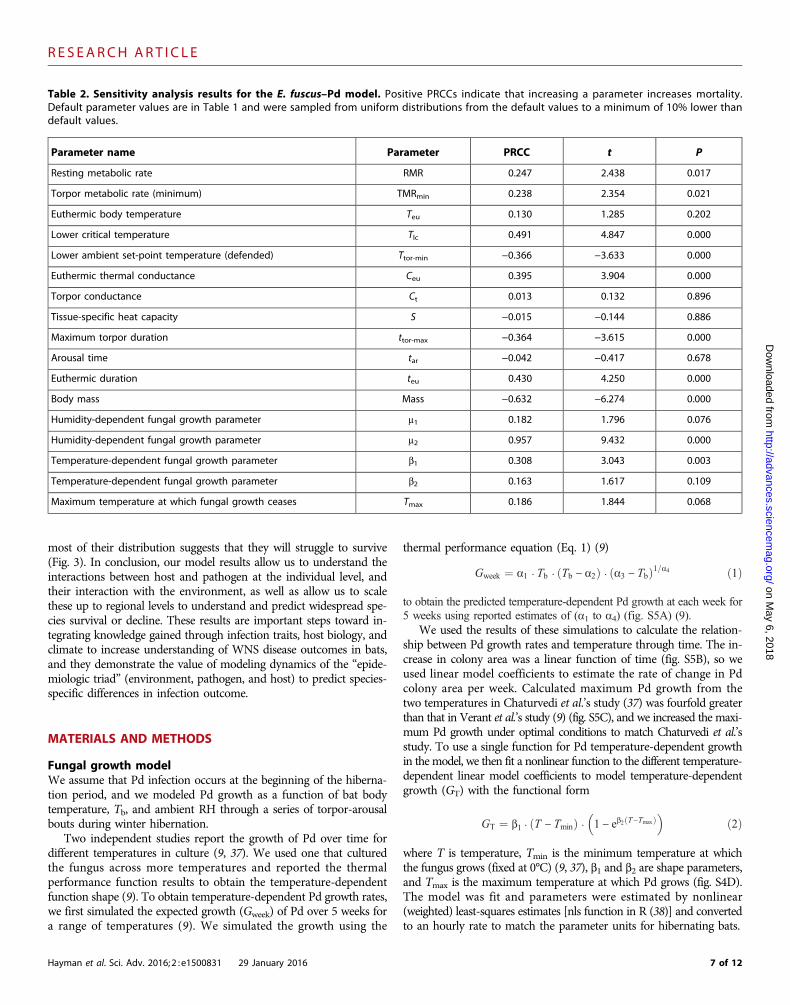
Table 2. Sensitivity analysis results for the E. fuscus–Pd model. Positive PRCCs indicate that increasing a parameter increases mortality.Default parameter values are in Table 1 and were sampled from uniform distributions from the default values to a minimum of 10% lower thandefault values.
Parameter name
Parameter PRCC t PResting metabolic rate
RMR 0.247 2.438 0.017Torpor metabolic rate (minimum)
TMRmin 0.238 2.354 0.021Euthermic body temperature
Teu 0.130 1.285 0.202Lower critical temperature
Tlc 0.491 4.847 0.000Lower ambient set-point temperature (defended)
Ttor-min −0.366 −3.633 0.000Euthermic thermal conductance
Ceu 0.395 3.904 0.000Torpor conductance
Ct 0.013 0.132 0.896Tissue-specific heat capacity
S −0.015 −0.144 0.886Maximum torpor duration
ttor-max −0.364 −3.615 0.000Arousal time
tar −0.042 −0.417 0.678Euthermic duration
teu 0.430 4.250 0.000Body mass
Mass −0.632 −6.274 0.000Humidity-dependent fungal growth parameter
m1 0.182 1.796 0.076Humidity-dependent fungal growth parameter
m2 0.957 9.432 0.000Temperature-dependent fungal growth parameter
b1 0.308 3.043 0.003Temperature-dependent fungal growth parameter
b2 0.163 1.617 0.109Maximum temperature at which fungal growth ceases
Tmax 0.186 1.844 0.0687 of 12

R E S EARCH ART I C L E
on May 6, 2018
http://advances.sciencemag.org/
Dow
nloaded from
RH rates >80% are usually necessary for fungal growth, though thisranges from 76 to 96% depending on temperature, substrate, and spe-cies (39–42), and this requirement is true for Geomyces, close relativesof Pseudogymnoascus, even in extreme conditions (43). In the absenceof experimental data from which to estimate humidity-dependent param-eters, we estimated the effect of RH on Pd growth by assuming therate of bat colony declines from WNS at different RH directly corre-lates to the effect of RH on Pd growth. M. sodalis is the only speciesfor which data were reported, and the most dramatic declines oc-curred at high RH (21). We use the data from M. sodalis and assumethat Pd colonizes and grows in the same way across all species. Weextracted the data for our analyses using the digitize function (44)in R. To model the effect of RH on Pd growth, we fit a saturatingMichaelis-Menton (MM; Eq. 3) function to the data using nls toobtain the Pd growth rate and humidity relationship
GRH ¼ m1 ⋅ RH=ð1þ m2 ⋅ RHÞ ð3Þwhere m1 and m2 are the MM shape parameters. We set maximumgrowth to occur at maximum RH, which corresponded with greatestpopulation declines. We did not constrain the MM function to gothrough zero at lower levels of RH because one colony of M. sodalisstill experienced a decline at the lower RH levels we modeled. We fitthe MM function to the log10 (l) (21) (l, the finite rate of populationchange), which is similar to the instantaneous rate of populationchange (r, the natural log of l) (fig. S5E). To integrate temperatureand humidity relationships with growth, we assumed that the greatestgrowth in culture media (37) represented maximum growth at satu-ration (100% RH) and scaled our estimated Pd growth for each tem-perature as a function of RH (fig. S4E).
Thus, to incorporate the effects of Tb and RH on fungal growth, wemodeled hourly Pd growth as a function of Tb (GT, Eq. 2), scaled by theeffects of humidity (GRH, Eq. 3), for the duration of winter (twinter) as
Pd ¼ GTðTbÞ ⋅GRH ⋅ twinter ð4Þ
Hibernation energetic modelTomodel the energetic requirements of a hibernating bat withWNS in away that allowed us to incorporate a reduction in the time in torpor (ttor)due to increased arousal frequency, we adapted a bat energeticmodel (16).
The energy required per torpor bout (Ebout) is a function of botheuthermic energy costs (Eeu) and duration (teu) and torpor energy cost(Etor) and duration (ttor,Pd), plus the additional energy usage requiredto arouse from torpor (Ear) for the arousal duration (tar)
Ebout ¼ Eeu ⋅ teu þ Etor ⋅ ttor;Pd þ Ear ⋅ tar ð5ÞEnergy costs during euthermic periods (Eeu) are RMRs plus energycost due to euthermic thermal conductance (Ceu) at hibernacula tem-peratures (Ta) below the lower critical temperatures (Tlc, Eq. 6). The Tlcis the temperature at and above which bats are thermally neutral andminimal RMR occurs, and below which additional cost occurs (16) [notethat in the parameter ranges we explore, Tlc (32°C) is always >Ta]. Thus
Eeu ¼ RMR þ ðTlc − TaÞ ⋅ Ceu ð6ÞDuring torpor, TMR is substantially lower than RMR, and meta-
bolic processes during torpor (Etor) decrease exponentially as a func-tion of the hibernacula temperature (the Q10 effect) until a temperatureat which the bats defend their body temperature (Ttor-min) is reached.
Hayman et al. Sci. Adv. 2016; 2 : e1500831 29 January 2016
At this point, Etor is analogous to Eeu and depends on TMR and thethermal conductance at torpid temperatures (Ct) below Ttor-min. Wemodel the energy use per unit time in torpor, Etor, as
Etor ¼ TMRmin ⋅QðTa − Ttor‐minÞ=1010 ; if Ta > Ttor‐min ð7Þ
Etor ¼ TMRmin þ ðTtor‐min − TaÞ ⋅Ct; if Ta ≥ Ttor‐min ð8Þwhere TMRmin is the minimummetabolic rate in torpor that occurs attemperature Ttor-min. Q10 is a quadratic in temperature (Table 1).
Experiments have recently demonstrated that EWL is a key driver indetermining arousal frequency in hibernating bats (26, 27), but we usedTa to drive ttor phenomenologically because Ta and RH are highly cor-related andonly below2°C (andperhaps as lowas−2°C) is EWLabetterpredictor of torpor duration (25). Although EWL is thought to ultimatelydrive arousal during torpor, and so ttor, Pd does not grow below freezing,and above freezing, the duration of ttor can be predicted equallywell usingTa [R
2 = 0.53 forTa andR2 =0.5 forEWL(25,45)]. Thus, wemodel ttor,Pd
(torpor timewith Pd infection) as a function ofTa. Because Pd infectiondecreases the duration of bat torpor (ttor) (8, 18), wemodel the reductionin ttor due to Pd growth (ttor,Pd) as ttor/Pd (Eqs. 9 and 10). We further ex-plored this relationship using sensitivity analysis, as described below.
Given Etor, we suppose that ttor is such that the total energy ex-pended over time is constant, that is, if the temperature Ta is at theminimum temperature that the bat defends (Ttor-min), then the energyuse is minimized so that the duration of ttor is maximized, whereas ifthe temperature is away from this optimal time, energy use is higherand thus ttor declines. In the original model, the authors include a param-eter, k, an analytical constant that attempts to yield equal values of ttorfor a given TMR above and below Ttor-min. However, this works forsingle values below Ttor-min only (fig. S1). To generalize the model andremove this scaling parameter, which would need to be reestimatedfor every point below Ttor-min, we let Etorttor = W for some constantW. Thus, ttor = W/Etor, and with Pd, ttor,Pd may be given as
ttor;Pd ¼ ttor‐max=Q
ðTa − Ttor‐minÞ10
� �10
0BB@
1CCA=Pd; if Ta > Ttor‐min ð9Þ
ttor;Pd ¼ ttor‐max
1þ Ttor‐min − Tað Þ ⋅ CtTMRmin
� �0@
1A=Pd; if Ta≤Ttor‐min ð10Þ
where ttor-max is the maximum time in torpor that occurs at Ttor-min
(that is, ttor-max = W/Etor) (fig. S1). Removing k means no constantneed be estimated and the model is free to be used for any speciesfor which the parameters in Eqs. 9 and 10 are available. RemovingPd from Eqs. 9 and 10 gives ttor with no Pd infection.
The energy costs of arousal (Ear) are modeled as a function of Tb andtissue-specific heat capacity (S) of hibernating bats (16), andwemodelEar as
Ear ¼ ðTeu − TtorÞ ⋅ S ð11Þwhere the change in Tb during arousal from torpid body temperature(Ttor) to euthermic temperatures (Teu) is
Ttor ¼ Ta; if Ta > Ttor‐min ð12Þ
else; Ttor ¼ Ttor‐min; if Ta ≤ Ttor‐min ð13Þ
8 of 12

R E S EARCH ART I C L E
To model Pd growth as a function of Tb, we modeled Tb as torpidbody temperature (Ttor) (Eq. 13), unless the bat arouses to euthermic
on May 6, 2018
http://advances.sciencemag.org/
Dow
nloaded from
temperatures (Teu) (Eq. 14); thus
Tb ¼ Ttor; if Ttor < Teu ð14Þ
else; Tb ¼ Teu ð15ÞThe total energy requirement for the winter, Ewinter, is modeled as a
function of the duration of winter (twinter), the expected duration ofeach torpor bout including arousal time (ttor,Pd + teu + tar), and theenergy required for each torpor bout (Ebout)
Ewinter ¼ Ebout ⋅ twinter=ðttor;Pd þ teu þ teuÞ� � ð16Þ
To convert energy requirements, Ewinter, to g fat required for winterhibernation, we used g fat = Ewinter × 20.1/(39.3 × 100) (46). To cal-culate species-specific survival times for a hibernating bat, we then ranthe parameterized model for a species for a range of Ta and RH toestimate the length of winter that animals could survive given theirprehibernation fat reserves. We assumed that the proportion of bodyfat available for hibernation was a general feature of bats (17, 47–50),which report means of 25 to 30% BM as fat deposits for hibernatingbats, and so we used 30% as a conservative metric and assume thatthis trait scales with body size.
Basic parameters for four species—M. lucifugus, E. fuscus,M. myotis,and E. serotinus—are in Table 1. We note that E. serotinus has recentlybeen subdivided into multiple species (51); however, we treat it as asingle species here given that its parameters are reported in the literaturefrom when it was recognized as a single species and are from the cur-rent distribution (51). To obtain the necessary host trait parameters typ-ically not reported for other species (for example, Tlc and Ttor-min) frommore frequently measured parameters (for example, BM) reported inthe literature, we used linear regression for prediction.
Model validationWe validate our model by comparing the results of our model predic-tions for M. lucifugus to experimental study results (the only speciesfor which such data were available), comparing the predictions forfour species against observations on two continents (see Predicting sur-vival times within species distributions) and by modeling the percentsurface area (SA) of the bat infected. We calculated the percent SA ofthe bat covered by the predicted Pd infection by calculating thetotal cm2 Pd grew to ensure the predicted percent SA infected withPd was plausible (that is, ≥0 and ≤100%). To estimate the SA inm2 for bats, we estimated the wing (w) SA using (52)
SAw ¼ 0:187 ⋅ BM0:618 ð17ÞTotal SA was then estimated given that wings are approximately
85% of a bat’s total SA (53). We model a single introduction of Pd anddo not account for increased SA enabling increased infection; thus, themodeled percentage of skin SA infected by Pd ranged from 0 to 40% ex-cludingwing SAand from0 to 6% includingwing SA forM. lucifugus (fig.S3), generally corresponding to observed proportions of affected wing area[see figures andhistological sectionswithin previous studies (4, 5, 10, 18)].
Sensitivity analysisTo assess the response to variation in parameters, we defined our re-sponse as the proportional change in g fat required to overwinter overthe complete environmental parameter space forM. lucifugus. We con-
Hayman et al. Sci. Adv. 2016; 2 : e1500831 29 January 2016
verted model-derived g fat required to survive hibernation into prob-abilities, using the mean and SD (47), such that if >~34% BM wasrequired, then survival (S) was zero, and if <~26% BM was required,then survival was assured (S = 1) (fig. S5F). We assigned intermediatevalues based on the cumulative probability of bats being those weights(47). To compare the changes in g fat required to overwinter given thechange in temperature-dependent growth and the overall effect of Pdon ttor,Pd, we then compared the proportion of environmental param-eter space for the combined ranges of hibernacula Ta and percent RHfor which survival was certain (S = 1).
For our sensitivity analyses, we present results for survival pre-dicted after a 6-month winter. We chose 6 months because hibernationdurations up to 6.4 months are reported in Canada (16), suggesting thatthese are upper limits, but model results for 5 months are qualitativelysimilar. We present the results as the change in survival over the wholeenvironmental parameter space relative to our default environmentalvalues for changes to host- and fungal-related parameters (Table 1).
For the sensitivity analysis, we used a multiparameter sensitivityanalysis proposed by Blower and Dowlatabadi (54). We constructed100 random parameter sets using stratified random samples from uni-form distributions extracted with Latin hypercube sampling [lhs packagein R (55)] spanning a range of potential values from the default (oftenmaximum values) to 10% lower than default values (see Table 1). Notethat increasing the MM function parameter m2 in the fungal growthmodel (Eq. 3) led to asymptotic behavior, and so for comparisonvalues for all, parameters were sampled between the default and 10%lower values only for constancy. PRCCs between each parameter andmodel output determined the relative importance of each parameter.In a K + 1 by K + 1 symmetric matrix, C, where K is the number ofparameters, and 1 to N is the rank of each column defined by the set(r1i, r2i, … rki, Ri), where i is the run number and t is the average rank[(1 + N)/2], the matrix C is defined with elements Cij, such that
Cij ¼ ∑Nt¼1ðrit − tÞ ⋅ ðrjt − tÞ
∑Nt¼1ðrit − tÞ2∑N
s¼1ðrjs − tÞ2i; j ¼ 1; 2;…K ð19Þ
Ri replaces rij and ris for the Cj, K+1 elements, and the inverse of Cbecomes bij for matrix B. The PRCC between the ith parameter andyth variable is then
PRCCiy ¼ −bi;Kþ1ffiffiffiffiffiffiffiffiffiffiffiffiffiffiffiffiffiffiffiffiffibibKþ1;Kþ1
p ð20Þ
In the PRCC analysis, a positive PRCC indicates that as the param-eter increases, the output variable of interest increases, and a negativePRCC indicates that the variable decreases with increasing parametervalues (54, 56). Significance (tiy) of PRCCiy is determined by a Student’s tdistribution with N − 2 degrees of freedom; thus
tiy ¼ PRCCiy
ffiffiffiffiffiffiffiffiffiffiffiffiffiffiffiffiffiffiffiffiffiffiN − 2
1 − PRCCiy
sð21Þ
Because some parameters were not statistically independent, wecompared the PRCC results to univariate analyses and results were quali-tatively similar, so only PRCC results are presented. We checked fornonlinear, nonmonotonic relationships among the output and theLHS parameter inputs (fig. S6) (57).
Predicting survival times within species distributionsFinally, to predict the survival times of hibernating bat species acrosstheir ranges, we obtained climate data from the U.S. National Oceanic
9 of 12
R E S EARCH ART I C L E
http://advances.sciencemag
Dow
nloaded from
and Atmospheric Administration Earth System Research Laboratorysite using the RNCEP R package (58) and species distributions fromthe International Union for Conservation of Nature (www.iucnredlist.org/technical-documents/spatial-data). We used these species distribu-tions in the absence of good winter hibernacula data (16). We usedmean maximum winter (January to April, 2001–2002) RH, as a proxyfor cave RH, and mean annual surface temperatures, which predict cavetemperatures (24). Because of the revised phylogeny of E. serotinusand thus geographic range, we created a new coverage file based onthe new distribution (fig. S7) (51). To ensure that Pd remains positiveas mean annual surface temperatures exceed the maximum or min-imum required for Pd growth, we fixed ttor beyond Tmax and Tmin. Weestimated the difference between predicted survival time given en-vironmental conditions within a species range and average winter length,determined by the period of the year where mean nightly temperaturefrom 12 a.m. to 6 a.m. was below freezing. This method of winter du-ration was determined a priori (fig. S8). The differences between win-ter duration and predicted survival times were then plotted withinspecies distributions (Figs. 3 and 4).
To assess the significance of the changes in the distributions of thewinter durations between North American species, we used a Harrell-Davisdistribution free estimator with a percentile bootstrap (59) to test fordifferences between quantiles of the different distributions of survivaltimes.
We coded all analyses in R (38). For data manipulation, interpola-tion, and plotting, we used the RNCEP (58), lattice (60), MASS (61), plyr(62), tgp (63), akima (64), maptools (65), raster (66), sp (67), adehabitat(68), maps (69), rgdal (70), shape (71), maptools (72), ggplot2 (73),rgeos (74), ggmap (75), mapdata (76), mapproj (77), grid (38), gridExtra(78), PBSmapping (79), data.table (80), deSolve (81), andWRS (82) pack-ages in R. Code and data files are available at http://www.pulliamlab.org/WhiteNoseSyndrome/.
on May 6, 2018
.org/
SUPPLEMENTARY MATERIALSSupplementary material for this article is available at http://advances.sciencemag.org/cgi/content/full/2/1/e1500831/DC1Fig. S1. We generalized the energetic model by revising the time in torpor (ttor) such thatenergy use is equal for values of ttor for a given minimum TMR above and below a lowerminimum set-point temperature that is defended (Ttor-min).Fig. S2. Predicted times to deplete overwinter energy reserves for bats without infection bythe fungus Pd.Fig. S3. Predicted percent of the SA of hibernating M. lucifugus infected by the fungus Pdbased on a single introduction of Pd.Fig. S4. Histograms of the difference between the predicted winter duration and the modeledhibernation durations within the two North American (A and B) and two European (C and D)bat species’ distributions under different climate change scenarios.Fig. S5. Summary of model fitting and parameter estimation.Fig. S6. Parameter input values plotted against the output values used in our sensitivity analysis.Fig. S7. The distribution of serotine bats (E. serotinus) (51) used in this study.Fig. S8. The predicted winter duration in months within the two North American and twoEuropean bat species distributions that underlie the model predictions.
REFERENCES AND NOTES1. R. M. Holdo, A. R. E. Sinclair, A. P. Dobson, K. L. Metzger, B. M. Bolker, M. E. Ritchie, R. D. Holt,
A disease-mediated trophic cascade in the Serengeti and its implications for ecosystem C.PLOS Biol. 7, e1000210 (2009).
2. K. R. Lips, F. Brem, R. Brenes, J. D. Reeve, R. A. Alford, J. Voyles, C. Carey, L. Livo, A. P. Pessier,J. P. Collins, Emerging infectious disease and the loss of biodiversity in a Neotropical am-phibian community. Proc. Natl. Acad. Sci. U.S.A. 103, 3165–3170 (2006).
Hayman et al. Sci. Adv. 2016; 2 : e1500831 29 January 2016
3. V. T. Vredenburg, R. A. Knapp, T. S. Tunstall, C. J. Briggs, Dynamics of an emerging diseasedrive large-scale amphibian population extinctions. Proc. Natl. Acad. Sci. U.S.A. 107, 9689–9694(2010).
4. D. S. Blehert, A. C. Hicks, M. Behr, C. U. Meteyer, B. M. Berlowski-Zier, E. L. Buckles, J. T. H. Coleman,S. R. Darling, A. Gargas, R. Niver, J. C. Okoniewski, R. J. Rudd, W. B. Stone, Bat white-nosesyndrome: An emerging fungal pathogen? Science 323, 227 (2009).
5. W. F. Frick, J. F. Pollock, A. C. Hicks, K. E. Langwig, D. S. Reynolds, G. G. Turner, C. M. Butchkoski,T. H. Kunz, An emerging disease causes regional population collapse of a common NorthAmerican bat species. Science 329, 679–682 (2010).
6. J. M. Lorch, C. U. Meteyer, M. J. Behr, J. G. Boyles, P. M. Cryan, A. C. Hicks, A. E. Ballmann, J. T. Coleman,D. N. Redell, D. M. Reeder, D. S. Blehert, Experimental infection of bats with Geomyces destructanscauses white-nose syndrome. Nature 480, 376–378 (2011).
7. A. M. Minnis, D. L. Lindner, Phylogenetic evaluation of Geomyces and allies reveals no closerelatives of Pseudogymnoascus destructans, comb. nov., in bat hibernacula of eastern NorthAmerica. Fungal Biol. 117, 638–649 (2013).
8. L. Warnecke, J. M. Turner, T. K. Bollinger, J. M. Lorch, V. Misra, P. M. Cryan, G. Wibbelt, D. S. Blehert,C. K. R. Willis, Inoculation of bats with European Geomyces destructans supports the novelpathogen hypothesis for the origin of white-nose syndrome. Proc. Natl. Acad. Sci. U.S.A.109, 6999–7003 (2012).
9. M. L. Verant, J. G. Boyles, W. Waldrep Jr., G. Wibbelt, D. S. Blehert, Temperature-dependentgrowth of Geomyces destructans, the fungus that causes bat white-nose syndrome. PLOSOne 7, e46280 (2012).
10. P. M. Cryan, C. U. Meteyer, J. G. Boyles, D. S. Blehert, Wing pathology of white-nose syn-drome in bats suggests life-threatening disruption of physiology. BMC Biol. 8, 135 (2010).
11. C. U. Meteyer, E. L. Buckles, D. S. Blehert, A. C. Hicks, D. E. Green, V. Shearn-Bochsler, N. J. Thomas,A. Gargas, M. J. Behr, Histopathologic criteria to confirm white-nose syndrome in bats. J. Vet.Diagn. Invest. 21, 411–414 (2009).
12. S. J. Puechmaille, G. Wibbelt, V. Korn, H. Fuller, F. Forget, K. Mühldorfer, A. Kurth, W. Bogdanowicz,C. Borel, T. Bosch, T. Cherezy, M. Drebet, T. Görföl, A.-J. Haarsma, F. Herhaus, G. Hallart, M. Hammer,C. Jungmann, Y. Le Bris, L. Lutsar, M. Masing, B. Mulkens, K. Passior, M. Starrach, A. Wojtaszewski,U. Zöphel, E. C. Teeling, Pan-European distribution of white-nose syndrome fungus (Geomycesdestructans) not associated with mass mortality. PLOS One 6, e19167 (2011).
13. P. Ren, K. H. Haman, L. A. Last, S. S. Rajkumar, M. K. Keel, V. Chaturvedi, Clonal spread ofGeomyces destructans among bats, midwestern and southern United States. Emerg. Infect. Dis.18, 883–885 (2012).
14. J. M. Lorch, L. K. Muller, R. E. Russell, M. O’Connor, D. L. Lindner, D. S. Blehert, Distributionand environmental persistence of the causative agent of white-nose syndrome, Geomycesdestructans, in bat hibernacula of the eastern United States. Appl. Environ. Microbiol. 79,1293–1301 (2012).
15. G. Wibbelt, A. Kurth, D. Hellmann, M. Weishaar, A. Barlow, M. Veith, J. Prüger, T. Görföl, L. Grosche,F. Bontadina, U. Zöphel, H.-P. Seidl, P. M. Cryan, D. S. Blehert, White-nose syndrome fungus(Geomyces destructans) in bats, Europe. Emerg. Infect. Dis. 16, 1237–1243 (2010).
16. M. M. Humphries, D. W. Thomas, J. R. Speakman, Climate-mediated energetic constraintson the distribution of hibernating mammals. Nature 418, 313–316 (2002).
17. D. W. Thomas, M. Dorais, J.-M. Bergeron, Winter energy budgets and cost of arousals forhibernating little brown bats, Myotis lucifugus. J. Mammal. 71, 475–479 (1990).
18. D. M. Reeder, C. L. Frank, G. G. Turner, C. U. Meteyer, A. Kurta, E. R. Britzke, M. E. Vodzak,S. R. Darling, C. W. Stihler, A. C. Hicks, R. Jacob, L. E. Grieneisen, S. A. Brownlee, L. K. Muller,D. S. Blehert, Frequent arousal from hibernation linked to severity of infection and mortality inbats with white-nose syndrome. PLOS One 7, e38920 (2012).
19. J. G. Boyles, C. K. R. Willis, Could localized warm areas inside cold caves reduce mortality ofhibernating bats affected by white-nose syndrome? Front. Ecol. Environ. 8, 92–98 (2010).
20. S. M. Ehlman, J. J. Cox, P. H. Crowley, Evaporative water loss, spatial distributions, andsurvival in white-nose-syndrome-affected little brown myotis: A model. J. Mammal. 94,572–583 (2013).
21. K. E. Langwig, W. F. Frick, J. T. Bried, A. C. Hicks, T. H. Kunz, A. M. Kilpatrick, Sociality, density-dependence and microclimates determine the persistence of populations suffering from anovel fungal disease, white-nose syndrome. Ecol. Lett. 15, 1050–1057 (2012).
22. A. E. Hajek, R. I. Carruthers, R. S. Soper, Temperature and moisture relations of sporulationand germination by Entomophaga maimaiga (Zygomycetes: Entomophthoraceae), a fungalpathogen of Lymantria dispar (Lepidoptera: Lymantriidae). Environ. Entomol. 19, 85–90(1990).
23. C. K. R. Willis, A. K. Menzies, J. G. Boyles, M. S. Wojciechowski, Evaporative water loss is aplausible explanation for mortality of bats from white-nose syndrome. Integr. Comp. Biol.51, 364–373 (2011).
24. R. W. Perry, A review of factors affecting cave climates for hibernating bats in temperateNorth America. Environ. Rev. 21, 28–39 (2013).
25. D. W. Thomas, D. Cloutier, Evaporative water loss by hibernating little brown bats, Myotislucifugus. Physiol. Zool. 65, 443–456 (1992).
26. M. Ben-Hamo, A. Muñoz-Garcia, C. Korine, B. Pinshow, Hydration state of bats may explainfrequency of arousals from torpor. FASEB J. 26, 886.11 (2012).
10 of 12

R E S EARCH ART I C L E
on May 6, 2018
http://advances.sciencemag.org/
Dow
nloaded from
27. M. Ben-Hamo, A. Muñoz-Garcia, J. B. Williams, C. Korine, B. Pinshow, Waking to drink: Ratesof evaporative water loss determine arousal frequency in hibernating bats. J. Exp. Biol. 216,573–577 (2013).
28. M. L. Verant, C. U. Meteyer, J. R. Speakman, P. M. Cryan, J. M. Lorch, D. S. Blehert, White-nosesyndrome initiates a cascade of physiologic disturbances in the hibernating bat host. BMCPhysiol. 14, 10 (2014).
29. P. M. Cryan, C. U. Meteyer, D. S. Blehert, J. M. Lorch, D. M. Reeder, G. G. Turner, J. Webb, M. Behr,M. Verant, R. E. Russell, K. T. Castle, Electrolyte depletion in white-nose syndrome bats. J. Wildl.Dis. 49, 398–402 (2013)
30. L. Warnecke, J. M. Turner, T. K. Bollinger, V. Misra, P. M. Cryan, D. S. Blehert, G. Wibbelt, C. K. R. Willis,Pathophysiology of white-nose syndrome in bats: A mechanistic model linking wing damageto mortality. Biol. Lett. 9, 20130177 (2013).
31. H. R. Bouma, R. H. Henning, F. G. M. Kroese, H. V. Carey, Hibernation is associated withdepression of T-cell independent humoral immune responses in the 13-lined groundsquirrel. Dev. Comp. Immunol. 39, 154–160 (2013).
32. C. U. Meteyer, D. Barber, J. N. Mandl, Pathology in euthermic bats with white nose syndromesuggests a natural manifestation of immune reconstitution inflammatory syndrome. Virulence3, 583–588 (2012).
33. S. P. Maher, A. M. Kramer, J. T. Pulliam, M. A. Zokan, S. E. Bowden, H. D. Barton, K. Magori, J. M. Drake,Spread of white-nose syndrome on a network regulated by geography and climate. Nat. Commun.3, 1306 (2012).
34. K. E. Langwig, W. F. Frick, R. Reynolds, K. L. Parise, K. P. Drees, J. R. Hoyt, T. L. Cheng, T. H. Kunz,J. T. Foster, A. M. Kilpatrick, Host and pathogen ecology drive the seasonal dynamics of afungal disease, white-nose syndrome. Proc. R. Soc. London B Biol. Sci. 282, 20142335(2015).
35. P. R. Elsen, M. W. Tingley, Global mountain topography and the fate of montane speciesunder climate change. Nat. Clim. Change 5, 772–776 (2015).
36. E. M. Fischer, R. Knutti, Robust projections of combined humidity and temperatureextremes. Nat. Clim. Change 3, 126–130 (2012).
37. V. Chaturvedi, D. J. Springer, M. J. Behr, R. Ramani, X. Li, M. K. Peck, P. Ren, D. J. Bopp,B. Wood, W. A. Samsonoff, C. M. Butchkoski, A. C. Hicks, W. B. Stone, R. J. Rudd, S. Chaturvedi,Morphological and molecular characterizations of psychrophilic fungus Geomycesdestructans from New York bats with white nose syndrome (WNS). PLOS One 5, e10783(2010).
38. R Core Team, R: A Language and Environment for Statistical Computing (R Foundation forStatistical Computing, Vienna, Austria, 2013).
39. S. S. Block, Humidity requirements for mold growth. Appl. Microbiol. 1, 287–293 (1953).40. J. B. M. Coppock, E. D. Cookson, The effect of humidity on mould growth on constructional
materials. J. Sci. Food Agric. 2, 534–537 (1951).41. C. Grant, C. A. Hunter, B. Flannigan, A. F. Bravery, The moisture requirements of moulds
isolated from domestic dwellings. Int. Biodeterior. 25, 259–284 (1989).42. A.-L. Pasanen, T. Juutinen, M. J. Jantunen, P. Kalliokoski, Occurrence and moisture re-
quirements of microbial growth in building-materials. Int. Biodeter. Biodegr. 30, 273–283(1992).
43. B. W. Held, J. A. Jurgens, B. E. Arenz, S. M. Duncan, R. L. Farrell, R. A. Blanchette, Environmentalfactors influencing microbial growth inside the historic expedition huts of Ross Island, Antarctica.Int. Biodeter. Biodegr. 55, 45–53 (2005).
44. T. Poisot, R. Sachse, Digitize: A Plot Digitizer in R (2013).45. D. W. Thomas, F. Geiser, Periodic arousals in hibernating mammals: Is evaporative water
loss involved? Funct. Ecol. 11, 585–591 (1997).46. J. G. Boyles, V. Brack Jr., Modeling survival rates of hibernating mammals with individual-
based models of energy expenditure. J. Mammal. 90, 9–16 (2009).47. T. H. Kunz, J. A. Wrazen, C. D. Burnett, Changes in body mass and fat reserves in pre-hibernating
little brown bats (Myotis lucifugus). Ecoscience 5, 8–17 (1998).48. W. Wilson, S. G. Marshall, V. B. Baker, Autumn fat deposition in the evening bat (Nycticeius
humeralis). J. Mammal. 49, 314–317 (1968).49. W. G. Ewing, E. H. Studier, M. J. Ofarrell, Autumn fat deposition and gross body composition in
three species of Myotis. Comp. Biochem. Physiol. 36, 119–129 (1970).50. G. S. Krulin, J. A. Sealander, Annual lipid cycle of the gray bat, Myotis grisescens. Comp.
Biochem. Physiol. A Comp. Physiol. 42, 537–549 (1972).51. J. Juste, P. Benda, J. L. Garcia-Mudarra, C. Ibáñez, Phylogeny and systematics of old world
serotine bats (genus Eptesicus, Vespertilionidae, Chiroptera): An integrative approach. Zool.Scr. 42, 441–457 (2013).
52. U. M. Norberg, J. M. V. Rayner, Ecological morphology and flight in bats (Mammalia; Chiroptera):Wing adaptations, flight performance, foraging strategy and echolocation. Philos. Trans. R. Soc. BBiol. Sci. 316, 337–419 (1987).
53. R. E. Baker, MSc thesis, Purdue University (1966).54. S. M. Blower, H. Dowlatabadi, Sensitivity and uncertainty analysis of complex models
of disease transmission: An HIV Model, as an example. Int. Stat. Rev. 62, 229–243(1994).
55. R. Carnell, Lhs: Latin Hypercube Samples. R Package (2009).
Hayman et al. Sci. Adv. 2016; 2 : e1500831 29 January 2016
56. M. G. Buhnerkempe, R. J. Eisen, B. Goodell, K. L. Gage, M. F. Antolin, C. T. Webb, Transmissionshifts underlie variability in population responses to Yersinia pestis infection. PLOS One 6,e22498 (2011).
57. S. Marino, I. B. Hogue, C. J. Ray, D. E. Kirschner, A methodology for performing globaluncertainty and sensitivity analysis in systems biology. J. Theor. Biol. 254, 178–196(2008).
58. M. U. Kemp, E. E. van Loon, J. Shamoun-Baranes, W. Bouten, RNCEP: Global weather andclimate data at your fingertips. Methods Ecol. Evol. 3, 65–70 (2012).
59. R. R. Wilcox, D. M. Erceg-Hurn, F. Clark, M. Carlson, Comparing two independent groups viathe lower and upper quantiles. J. Stat. Comput. Sim. 84, 1543–1551 (2013).
60. D. Sarkar, Lattice: Multivariate Data Visualization with R (Springer-Verlag, New York,2008).
61. W. N. Venables, B. D. Ripley, Modern Applied Statistics with S (Statistics and Computing)(Springer, New York, ed. 4, 2002), p. xi, 495 pp.
62. H. Wickham, The split-apply-combine Ssrategy for data analysis. J. Stat. Softw. 40, 1–29(2011).
63. R. B. Gramacy, M. A. Taddy, Categorical inputs, sensitivity analysis, optimization and impor-tance tempering with tgp version 2, an R package for treed Gaussian process models. J. Stat.Softw. 33, 1–48 (2010).
64. Fortran code by H. Akima R port by Albrecht Gebhardt aspline function by Thomas Petzoldt<[email protected]> interp2xyz and {enhancements} and corrections by MartinMaechler, Akima: Interpolation of Irregularly Spaced Data (2013).
65. R. Bivand, N. Lewin-Koh, maptools: Tools for Reading and Handling Spatial Objects(2014).
66. R. J. Hijmans, J. van Etten, Raster: Geographic Data Analysis and Modeling (2014).67. R. S. Bivand, E. Pebesma, V. Gómez-Rubio, Applied Spatial Data Analysis with R. Use R!
(Springer, New York, ed. 2, 2013), p. XVIII, 405 S.68. C. Calenge, The package “adehabitat” for the R software: A tool for the analysis of space
and habitat use by animals. Ecol. Model. 197, 516–519 (2006).69. Original S code by Richard A Becker and Allan R Wilks R version by Ray Brownrigg En-
hancements by Thomas P Minka <[email protected]>, Maps: Draw Geographical Maps(2013).
70. R. Bivand, T. Keitt, B. Rowlingson, rgdal: Bindings for the Geospatial Data Abstraction Library(2014).
71. K. Soetaert, Shape: Functions for Plotting Graphical Shapes, Colors (2014).72. R. Bivand, N. Lewin-Koh, maptools: Tools for Reading and Handling Spatial Objects. R
Package Version 0.8-23 (2013).73. H. Wickham, ggplot2: Elegant Graphics for Data Analysis (Springer, New York, 2009).74. R. S. Bivand, C. Rundel, rgeos: Interface to Geometry Engine—Open Source (GEOS) (2014).75. D. Kahle, H. Wickham, ggmap: Spatial visualization with ggplot2. R J. 5, 144–161 (2013).76. R. Brownrigg, T. P. Minka, R. A. Becker, A. R. Wilks, Mapdata: Extra Map Databases
(2013).77. D. McIlroy, R. Brownrigg, T. P. Minka, R. Bivand, mapproj: Map Projections (2014).78. B. Auguie, gridExtra: Functions in Grid Graphics (2012).79. J. T. Schnute, N. Boers, R. Haigh, C. Grandin, A. Johnson, P. Wessel, F. Antonio, PBSmapping:
Mapping Fisheries Data and Spatial Analysis Tools. R Package Version 2.67.60 (2014).80. M. Dowle, T. Short, S. Lianoglou, A. Srinivasan, R. Saporta, E. Antonyan, Data.Table:
Extension of Data.Frame. R Package Version 1.9.2 (2014).81. K. Soetaert, T. Petzoldt, R. W. Setzer, Solving differential equations in R: Package deSolve.
J. Stat. Softw. 33, 1–25 (2010).82. R. R. Wilcox, F. D. Schönbrodt, The WRS Package for Robust Statistics in R (2014).83. K. Hanus, Body temperatures and metabolism of bats at different environmental tempera-
tures. Physiol. Bohemoslov. 8, 250–259 (1959).84. A. Kurta, T. H. Kunz, Roosting metabolic rate and body temperature of male little brown
bats (Myotis lucifugus) in summer. J. Mammal. 69, 645–651 (1988).85. J. R. Speakman, P. I. Webb, P. A. Racey, Effects of disturbance on the energy expenditure of
hibernating bats. J. Appl. Ecol. 28, 1087–1104 (1991).86. R. C. Stones, J. E. Wiebers, in Mammalian Hibernation III, K. C. Fisher, A. R. Dawe, C. P. Lyman,
F. E. South, Eds. (American Elsevier, New York, 1967), pp. 97–109.87. J. R. Speakman, W. C. Lancaster, W. Ward, G. Jones, K. C. Cole, in Echolocation in Bats and
Dolphins, J. Thomas, C. F. Moss, M. Vater, Eds. (University of Chicago Press, Chicago, 2003),pp. 361–365.
88. R. J. Hock, The metabolic rates and body temperatures of bats. Biol. Bull. 101, 289–299(1951).
89. V. Brack, J. W. Twente, The duration of the period of hibernation of three species of vespertilionidbats. I. Field studies. Can. J. Zool. 63, 2952–2954 (1985).
90. A. R. French, Allometries of the durations of torpid and euthermic intervals during mam-malian hibernation: A test of the theory of metabolic control of the timing of changes inbody temperature. J. Comp. Physiol. B 156, 13–19 (1985).
91. M. B. Fenton, Population Studies of Myotis lucifugus (Chiroptera: Vespertilionidae) in Ontario.Life Sci. Contr. R. Ontario Mus. 77, 1–34 (1970).
11 of 12

R E S EARCH ART I C L E
Acknowledgments: We thank the Webb and Pulliam laboratories, especially A. Luis, C. Leach,and C. Pearson, for useful discussions. M. Verant (USGS National Wildlife Health Center) offeredhelpful input on earlier versions of this manuscript, and J. Juste (Estación Biológica de Doñana,Spain) confirmed the distribution of serotine bats. Any use of trade, firm, or product names isfor descriptive purposes only and does not imply endorsement by the U.S. Government. Althoughsoftware programs have been used by the U.S. Geological Survey (USGS), no warranty, expressedor implied, is made by the USGS or the U.S. Government as to the accuracy and functioningof the programs and related program materials nor shall the fact of distribution constituteany such warranty, and no responsibility is assumed by the USGS in connection therewith.Funding: D.T.S.H. acknowledges funding from a David H. Smith Fellowship in ConservationResearch from the Cedar Tree Foundation and Society of Conservation Biology. D.T.S.H., J.R.C.P.,and C.T.W. have support from the Research and Policy for Infectious Disease Dynamics (RAPIDD)program of the Science and Technology Directorate (U.S. Department of Homeland Security)and the Fogarty International Center of the U.S. NIH. Author contributions: D.T.S.H., J.R.C.P.,P.M.C., and C.T.W. designed the study; D.T.S.H., J.R.C.P., J.C.M., and C.T.W. developed the model,
Hayman et al. Sci. Adv. 2016; 2 : e1500831 29 January 2016
code, and statistical analyses; D.T.S.H. analyzed the data and led the writing with contributionsfrom all authors. Competing interests: The authors declare that they have no competing in-terests. Data and materials availability: All data needed to evaluate the conclusions in thepaper are present in the paper and/or the Supplementary Materials. Additional data relatedto this paper may be requested from the authors. Code and data files are available at https://github.com/PulliamLab-UFL/WhiteNoseSyndrome.
Submitted 23 June 2015Accepted 30 November 2015Published 29 January 201610.1126/sciadv.1500831
Citation: D. T. S. Hayman, J. R. C. Pulliam, J. C. Marshall, P. M. Cryan, C. T. Webb, Environment,host, and fungal traits predict continental-scale white-nose syndrome in bats. Sci. Adv. 2,e1500831 (2016).
12 of 12
on May 6, 2018
http://advances.sciencemag.org/
Dow
nloaded from

Environment, host, and fungal traits predict continental-scale white-nose syndrome in batsDavid T. S. Hayman, Juliet R. C. Pulliam, Jonathan C. Marshall, Paul M. Cryan and Colleen T. Webb
DOI: 10.1126/sciadv.1500831 (1), e1500831.2Sci Adv
ARTICLE TOOLS http://advances.sciencemag.org/content/2/1/e1500831
MATERIALSSUPPLEMENTARY http://advances.sciencemag.org/content/suppl/2016/01/26/2.1.e1500831.DC1
REFERENCES
http://advances.sciencemag.org/content/2/1/e1500831#BIBLThis article cites 67 articles, 9 of which you can access for free
PERMISSIONS http://www.sciencemag.org/help/reprints-and-permissions
Terms of ServiceUse of this article is subject to the
registered trademark of AAAS.is aScience Advances Association for the Advancement of Science. No claim to original U.S. Government Works. The title
York Avenue NW, Washington, DC 20005. 2017 © The Authors, some rights reserved; exclusive licensee American (ISSN 2375-2548) is published by the American Association for the Advancement of Science, 1200 NewScience Advances
on May 6, 2018
http://advances.sciencemag.org/
Dow
nloaded from