Embed Size (px)
DESCRIPTION
Environment, Land-use and Well-being. Finbarr Brereton, J Peter Clinch and Harut Shahumyan UCD Dublin. - PowerPoint PPT Presentation
Citation preview

1
Environment, Land-use and Well-being
Finbarr Brereton, J Peter Clinch and Harut Shahumyan UCD Dublin

2
HAPPINESS(Happiness, Political Institutions, Natural
Environment and Space)
A Comparative Analysis of the influence of environmental conditions, environmental regimes and political context on
subjective well-being

3
• Motivation– Background
• Environment and Well-being– The Economics of Happiness– Environment and Happiness
• Methodology– European Social Survey and CORINE land cover– Geographical Information Systems
• Results and conclusions
Outline

4
Motivation
• Advance the understanding of the influence of land use and environment on welfare and the implications for policy
• Quality of life and land use are mutually inter-related (MEA, 2005)
• In large central cities, the literature shows that environmental and urban conditions operate jointly to reduce welfare (e.g. MacKerron and Mourato, 2009)

5
Background
• Urbanization, expressed as the proportion of people living in urban places shows a value around 80% in most European countries. There is concern about the impacts of current patterns of urban development on environmental conditions and quality of life within urban-regions (Antrop, 2004).
• European Environment Agency (EEA) studies showed a significant increase of built surface at the expense of open space (EEA 2002; 2006)
• Green space is under pressure from various urban development processes such as densification and urban regeneration programmes (Pauleit et al. 2003).

6
Environment and Well-being
• Environment is found to influence well-being – Increases recovery rates among hospital patients with
natural views (Ulrich, 1984)
– Noise is found to affect health (Haralabidis et al., 2008)
– Air Pollution: lead, particulate matter (Cifuentes et al., 2001)
• Long tradition in the Hedonic literature (Rosen, 1974, Roback, 1982 and Bloomquist et al., 1988).
– Constructing quality of life indices as the weighted averages of amenities in a particular area, usually a city
region

7
The Economics of Happiness
• Happiness (categorical) data have been used to understand the determinants of Subjective Well Being (SWB)
– Socio-demographic characteristics
– Socioeconomic and macroeconomic characteristics
(Clark and Oswald, EJ 1994; Easterlin, JEBO 1995; Oswald, EJ 1997; Di Tella et al., AER 2001; Stutzer and Frey, EJ 2001; Blanchflower and Oswald, JoPE 2004; Stutzer, JEBO 2004; Clark et al., 2008 JoEL)…………..

8
The Economics of Happiness
• LS functions, some examples (from Alesina et al. JoPE 2001 and from van Praag and Baarsma, EJ 2005)

9
Environment and Happiness
• A more recent literature on the economics of happiness has begun examining the effect of environmental amenities on human welfare directly
– Frey and Stutzer, 2004
– Van Praag and Baarsma, 2005
– Welsch, 2002; 2006
– Rehdanz and Maddison, 2005
– Ferrer-i-Carbonell and Gowdy 2007
– Luechinger 2009 etc…
• Using subjective well-being data to construct quality-of-life indices as an alternative to the conventional indices using weights derived from hedonic regressions,
– Moro et al. 2008

10
Environment and Happiness
• Data constraints– Previous studies were hindered by a lack of adequately
disaggregrated data (Welsch, 2006; Rehdanz and
Maddison, 2002), where data constraints at the local and regional levels restricted analysis to aggregated data at the national level, or to focusing on a particular localised
area where richer data was available.
– Only a few papers to date have been able to capture the effects of environmental factors at the geographical level (local or regional) at which individuals actually experience them

11
Environment and Happiness
• Luenchinger 2009– Air Quality in Germany
– Valuing Flood disasters
• MacKerron and Mourato 2009– Air quality in London city centre
• Brereton et al. 2008– Local amenities in Ireland
These papers use Geographical Information Systems (GIS)

12
Methodology
• Data– LS scores, individual, social and economic data
provided by Rounds 1-3 of the European Social Survey
– Land use data provided by CORINE land use dataset
• Question types
– “How satisfied are you with your life as a whole these days?”
– “Taken all together, how would you say things are these days - would you say that you are very happy, pretty happy, or not too happy?”
9 105 6 7 81 2 3 4
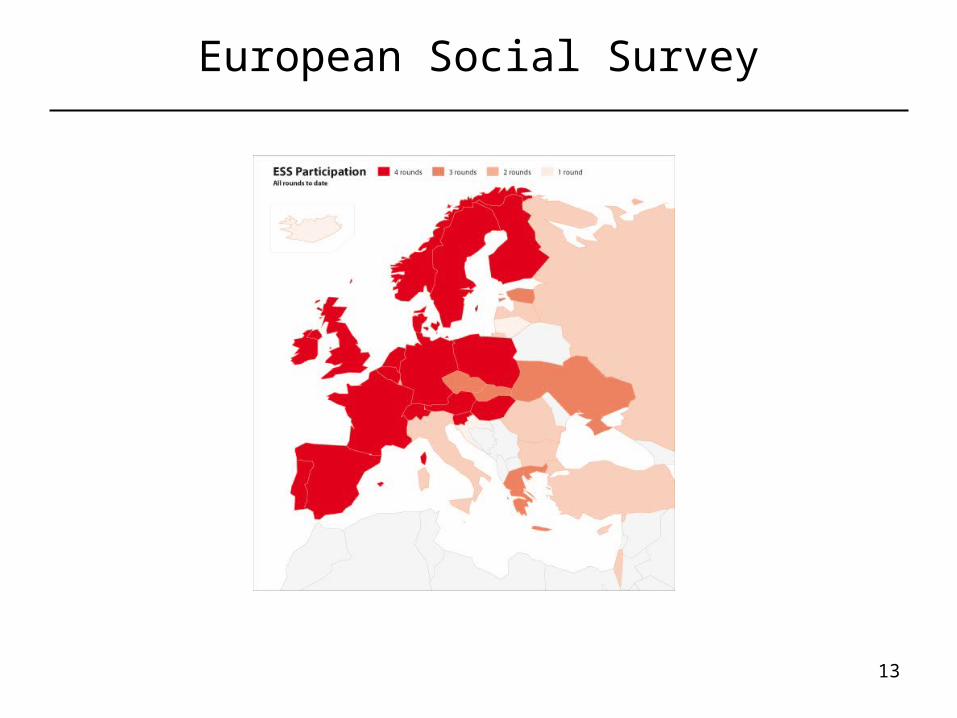
13
European Social Survey

14
Life Satisfaction in Europe
05
1015
2025
Per
cent
0 2 4 6 8 10How satisfied with life as a whole

15
Life Satisfaction in Europe

16
CORINE Land cover
• Pan-European land cover database carried out within each European member state;
– Vector spatial dataset– Land cover digitized based on the interpretation of medium
resolution satellite imagery and assigned a land use class based on a standardized land cover nomenclature defined by the EEA.
– The minimum area mapped in the dataset is 25 hectares.

17
CORINE Land coverGRID CLC LABEL1 LABEL2 LABEL3
1 111 Artificial surfaces Urban fabric Continuous urban fabric
2 112 Artificial surfaces Urban fabric Discontinuous urban fabric
3 121 Artificial surfaces Industrial, commercial and transport units Industrial or commercial units
4 122 Artificial surfaces Industrial, commercial and transport units Road and rail networks
5 123 Artificial surfaces Industrial, commercial and transport units Port areas
6 124 Artificial surfaces Industrial, commercial and transport units Airports
7 131 Artificial surfaces Mine, dump and construction sites Mineral extraction sites
8 132 Artificial surfaces Mine, dump and construction sites Dump sites
9 133 Artificial surfaces Mine, dump and construction sites Construction sites
10 141 Artificial surfaces Artificial, non-agricultural vegetated areas Green urban areas
11 142 Artificial surfaces Artificial, non-agricultural vegetated areas Sport and leisure facilities
12 211 Agricultural areas Arable land Non-irrigated arable land
13 212 Agricultural areas Arable land Permanently irrigated land
14 213 Agricultural areas Arable land Rice fields
15 221 Agricultural areas Permanent crops Vineyards
16 222 Agricultural areas Permanent crops Fruit trees and berry plantations
17 223 Agricultural areas Permanent crops Olive groves
18 231 Agricultural areas Pastures Pastures
19 241 Agricultural areas Heterogeneous agricultural areas Annual crops
20 242 Agricultural areas Heterogeneous agricultural areas Complex cultivation patterns
21 243 Agricultural areas Heterogeneous agricultural areas Significant areas of natural vegetation
22 244 Agricultural areas Heterogeneous agricultural areas Agro-forestry areas

18
CORINE Land coverGRID CLC LABEL1 LABEL2 LABEL3
23 311 Forest and semi natural areas Forests Broad-leaved forest
24 312 Forest and semi natural areas Forests Coniferous forest
25 313 Forest and semi natural areas Forests Mixed forest
26 321 Forest and semi natural areas Scrub/herbaceous vegetation associations Natural grasslands
27 322 Forest and semi natural areas Scrub/herbaceous vegetation associations Moors and heathland
28 323 Forest and semi natural areas Scrub/herbaceous vegetation associations Sclerophyllous vegetation
29 324 Forest and semi natural areas Scrub/herbaceous vegetation associations Transitional woodland-shrub
30 331 Forest and semi natural areas Open spaces with little or no vegetation Beaches, dunes, sands
31 332 Forest and semi natural areas Open spaces with little or no vegetation Bare rocks
32 333 Forest and semi natural areas Open spaces with little or no vegetation Sparsely vegetated areas
33 334 Forest and semi natural areas Open spaces with little or no vegetation Burnt areas
34 335 Forest and semi natural areas Open spaces with little or no vegetation Glaciers and perpetual snow
35 411 Wetlands Inland wetlands Inland marshes
36 412 Wetlands Inland wetlands Peat bogs
37 421 Wetlands Maritime wetlands Salt marshes
38 422 Wetlands Maritime wetlands Salines
39 423 Wetlands Maritime wetlands Intertidal flats
40 511 Water bodies Inland waters Water courses
41 512 Water bodies Inland waters Water bodies
42 521 Water bodies Marine waters Coastal lagoons
43 522 Water bodies Marine waters Estuaries
44 523 Water bodies Marine waters Sea and ocean

19
CORINE Land cover - 2000

20
CORINE Land cover - 2006

21
CORINE Land cover
• For the purposes of this study, the original 44 land use categories of the CORINE nomenclature were re-categorised for the regression analysis into the following classes:
– Residential– Commercial and Industrial– Mines and Dumps– Green Urban Spaces– Agricultural Land– Forestry– Natural Areas– Water bodies

22
Geographic Information Systems (GIS)
• GIS is a powerful computing tool that allows the visual representation of spatially referenced data. – Represents data as countable numbers of points, lines and
polygons in two-dimensional space (Goodchild and Haining, 2004)
– Link various datasets using spatial identifiers (Bond and Devine, 1991).
– It represents a base for spatial data analysis and provides a range of techniques for analysis and visualisation of spatial data.
– It provides tools for integrating, querying and analysing a wide variety of data types, such as scientific and cultural data, satellite imagery and aerial photography, as well as data collected by individuals, into projects, with geographic locations providing the integral link between all the data.
• GIS is widely-used as a planning and analysis tool and provides a powerful set of tools for spatial analysis and modelling.

23
Geographic Information Systems (GIS)
• GIS requirements– Collection, assimilation and pre-processing of
spatial datasets
• GIS data layers– Land use; Administrative boundaries
• Constructed variables at NUTS level• European Nomenclature of Territorial Units for
Statistics (NUTS) is a geocode standard for referencing administrative divisions of countries for statistical purposes developed by the European Union.

24
Preliminary Results
Significance Level: *** = 1%, ** = 5%, * = 10%
Variable Model 1 Model 2 Model 3
Location City suburb 0.3576***
Large city Town 0.2116***
Village 0.3565***
Countryside 0.8244***
Land uses Agriculture -0.0021*** -0.003***
Water bodies 0.0005*** 0.0004***
Green Urban 0.001* -0.002**

25
• Land use influences well-being– Well-being is lower in more urbanised, central city locations and
increases as the typology becomes more rural
• Green areas + sig.• Agricultural areas - sig.• Water bodies + sig.
Conclusions

26
• Minimum mapping area in the CORINE land cover database is 25 hectares
• Low sample size in some NUTS regions
• Ongoing Work– Aggregate the NUTS based on local association– More disaggregated land use classes– Country models– Multi-level modelling
Caveats

27
Thank you