Embed Size (px)
Citation preview
Environment Statistics Data Collection Programme
Tenth meeting of the UNCEEA (New York, 24-26 June 2015)
Reena ShahChief, Environment Statistics Section
United Nations Statistics Division
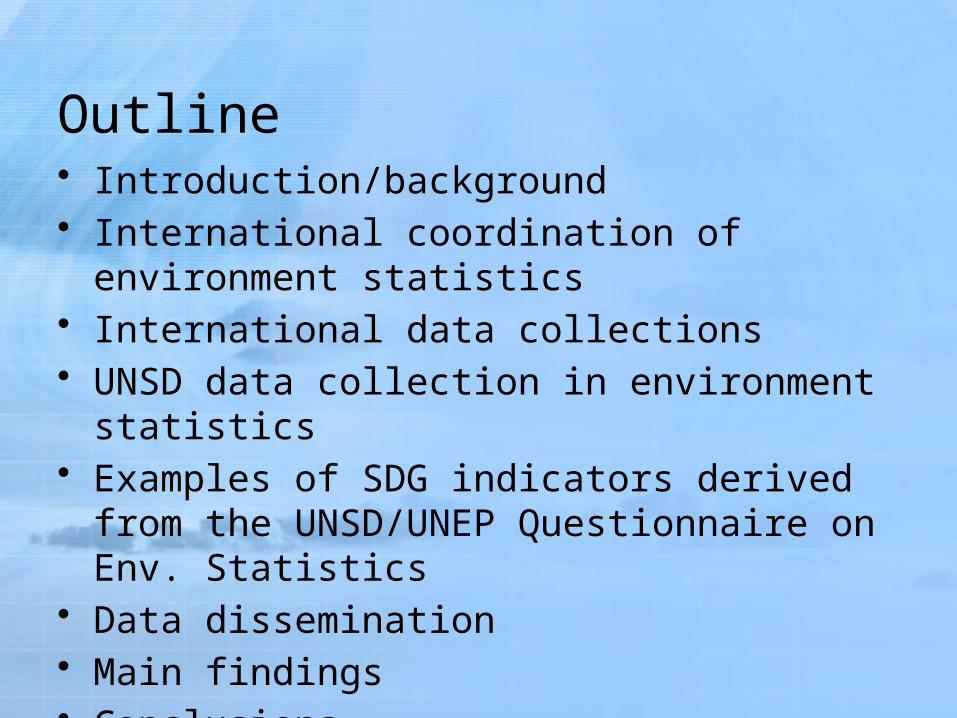
Outline• Introduction/background• International coordination of environment
statistics• International data collections• UNSD data collection in environment statistics• Examples of SDG indicators derived from the
UNSD/UNEP Questionnaire on Env. Statistics• Data dissemination• Main findings• Conclusions

Introduction/background• Environment Statistics Section, UNSD is responsible for the collection
of environment statistics from all non-OECD/Eurostat member states upon the request of the Statistical Commission in 1999.
• UNSD/UNEP Questionnaire on Environment Statistics is sent biennially to National Statistical Offices and Ministries of Environment. The Questionnaire started with just UNSD but since 2004 it has been conducted jointly with UNEP.
• Until 2006, air, water, land and waste were covered but since 2006 the focus has been only on water and waste.
• UNSD also compiles other indicators from other international organizations on air and climate, biodiversity, energy and minerals, forests, governance, land and agriculture, marine and coastal areas, and natural disasters.

International Coordination of Environment Statistics
• UNSD promotes coordination between international and regional organizations through the Inter-secretariat Working Group on Environment Statistics (IWG-ENV).
• The main objective of the IWG-ENV is the harmonization of international data and their collection. It focuses on:– development and harmonization of
methods concepts, definitions and classifications
– coordination of data collection – coordination of trainingMembers include: UNSD, UN-ECE, UNEP, FAO, OECD,
Eurostat

International data collections: environment statistics • Objective: to provide internationally comparable statistics
on environmental issues based on standard questionnaires and methodology.• UNSD/UNEP Questionnaire on Environment Statistics – about
172 member states and areas in 5 languages• OECD/Eurostat Joint Questionnaire on the State of the
Environment – their member states• UNSD/UNEP Questionnaire is consistent and
harmonized with the OECD/Eurostat Questionnaire. Close collaboration is maintained on conceptual issues, validation procedures and data validation.
• Collaboration is also maintained with, inter alia, FAO/Aquastat (water statistics), the Basel Convention (hazardous waste), ECE and ESCWA on similar issues, including translation.

International data collections: thematic/topical
Objective: provide internationally comparable data based on standard questionnaires and methodology. The aim is not directly environmental but the data are used in environment statistics.
Examples:• UNSD
- Energy statistics, industrial statistics, trade statistics, national accounts, demographic statistics
• FAO• AQUASTAT (water)• FAOSTAT (agriculture, nutrition, fisheries, forestry, food aid, land use and
population)• FISHSTAT (fisheries)• FORIS (forests)• GLIPHA (Global Livestock Production and Health Atlas)
• UNEP• World Conservation Monitoring Centre (protected areas)• GEMS-Water (water quality)

UNSD data collection in env. statistics• UNSD/UNEP Questionnaire 2013 on Environment Statistics – 7th
round sent out in 2014 (water and waste statistics)
• Water statistics – The tables cover renewable freshwater resources, freshwater abstraction and use, water supply industry, wastewater generation and treatment, and population connected to waste water treatment.
• Waste statistics – The tables cover the generation of waste, the generation and treatment of hazardous waste, and the generation, collection, treatment, and composition of municipal waste.
• UNSD/UNEP Questionnaire is linked to economic statistics through the use of ISIC Rev. 4 in several tables, and contains:• time series tables• detailed guidance section as well as relevant definitions to assist the
user to complete the Questionnaire• extensive built-in validation procedures• notes section for footnotes or other references• supplementary sheets for additional information
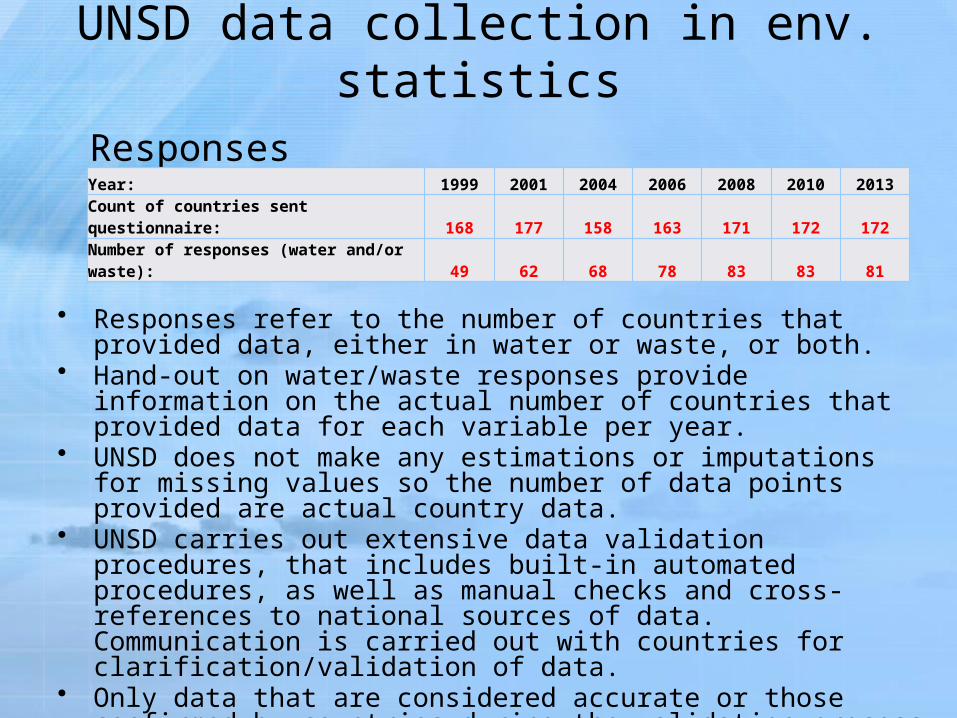
UNSD data collection in env. statisticsResponsesYear: 1999 2001 2004 2006 2008 2010 2013
Count of countries sent questionnaire: 168 177 158 163 171 172 172
Number of responses (water and/or waste): 49 62 68 78 83 83 81
• Responses refer to the number of countries that provided data, either in water or waste, or both.
• Hand-out on water/waste responses provide information on the actual number of countries that provided data for each variable per year.
• UNSD does not make any estimations or imputations for missing values so the number of data points provided are actual country data.
• UNSD carries out extensive data validation procedures, that includes built-in automated procedures, as well as manual checks and cross-references to national sources of data. Communication is carried out with countries for clarification/validation of data.
• Only data that are considered accurate or those confirmed by countries during the validation process are included in the ENVSTATS database and disseminated on the website.

Tables W2, W3 and W4 are linked to economic statistics through the use of ISIC Rev. 4
• Water• W1 Renewable Freshwater Resources• W2 Freshwater Abstraction and Use • W3 Water Supply Industry (ISIC 36)• W4 Wastewater Generation and Treatment• W5 Population Connected to Wastewater Treatment• W6 Supplementary information sheet
http://unstats.un.org/unsd/environment/questionnaire.htm
UNSD data collection in env. statistics

Households(W2,17)
Other economic activities (W2,22)
Electricity industry (ISIC 351) (W2,21)
Manufacturing(ISIC 10-33) (W2,20)
Agriculture, forestry and fishing (ISIC 01-03) (W2,18)
of which used by:
Freshwater abstracted (W2)
Losses duringtransport (W2,15)
Total freshwateravailable for use
(W2,14)
Imports of water-Exports of water
(=W2,12)-(W2,13)
Reused water (W2,11)
Desalinated water(W2,10) Total freshwater
use(W2,16)
of which abstracted by
Water supply industry(W2,4)
Households (W2,5)
Agriculture,forestry and
fishing (ISIC 01-03)(W2,6)
Manufacturing(ISIC 10-33)
(W2,7)
Electricityindustry
(ISIC 351)(W2,8)
Other economicactivities (W2,9)
Precipitation (W1,1)
Actual evapotranspiration
(W1,2)
Internal flow(W1,3)
Inflow of surface andgroundwaters from neighbouring
countries (W1,4)
Renewable freshwaterresources(W1,5)
Outflow of surfaceand groundwaters to neighbouring
countries (W1,6)
W1
W2
Outflow of surfaceand groundwaters to the sea
(W1,9)

Table W1: Renewable Freshwater Resources
Line Category Unit 2012
1 Precipitation mio m3/y
2 Actual evapotranspiration mio m3/y
3 Internal flow (=1-2) mio m3/y
4 Inflow of surface and groundwaters from neighbouring countries
mio m3/y
5 Renewable freshwater resources (=3+4) mio m3/y
6 Outflow of surface and groundwaters to neighbouring countries
mio m3/y
7 Of which: Secured by treaties
mio m3/y
8 Not secured by treaties mio m3/y
9 Outflow of surface and groundwaters to the sea mio m3/y

Precipitation (W1,1)
Actual evapotranspiration
(W1,2)
Internal flow (W1,3)
Inflow of surface andgroundwaters from
neighbouring countries (W1,4)
Renewable freshwaterresources(W1,5)
Outflow of surfaceand groundwaters to
neighbouring countries (W1,6)
Chart W1: Renewable Freshwater Resources
Outflow of surfaceand groundwatersto the sea (W1,9)

Table W2: Freshwater Abstraction and UseLine Category Unit 2012
1 Fresh surface water abstracted mio m3/y2 Fresh groundwater abstracted mio m3/y3 Freshwater abstracted (=1+2) mio m3/y of which abstracted by: 4 Water supply industry (ISIC 36) mio m3/y5 Households mio m3/y6 Agriculture, forestry and fishing (ISIC 01-03) mio m3/y7 Manufacturing (ISIC 10-33) mio m3/y8 Electricity industry (ISIC 351) mio m3/y9 Other economic activities mio m3/y
10 Desalinated water mio m3/y11 Reused water mio m3/y12 Imports of water mio m3/y13 Exports of water mio m3/y
14 Total freshwater available for use (=3+10+11+12-13) mio m3/y
15 Losses during transport mio m3/y16 Total freshwater use (=14-15) mio m3/y of which used by:
17 Households mio m3/y18 Agriculture, forestry and fishing (ISIC 01-03) mio m3/y19 of which for:
Irrigation in agriculturemio m3/y
20 Manufacturing (ISIC 10-33) mio m3/y21 Electricity industry (ISIC 351) mio m3/y22 Other economic activities mio m3/y

Totalfreshwateravailablefor use
(W2,14)
Losses duringtransport (W2,15)
Chart W2: Freshwater Abstraction and Use
Other economicactivities (W2,9)
Agriculture, forestryand fishing (ISIC 01-03)
(W2,6)
Water supplyIndustry (ISIC 36)
(W2,4)
Households(W2,5)
Electricity Industry(ISIC 351) (W2,8)
Manufacturing(ISIC 10-33) (W2,7)
Freshwater abstracted(W2)
Desalinated water(W2,10)
Reused water(W2,11)
Imports of waterminus exports of
water=(W2,12)-(W2,13)
of which abstracted by:
Totalfreshwater
use(W2,16)
Other economicactivities(W2,22)
Manufacturing(ISIC 10-33)
(W2,20)
Agriculture, forestryand fishing
(ISIC 01-03) (W2,18)
Households (W2,17)
Electricity Industry(ISIC 351)(W2,21)
of which used by

Table W3: Water Supply Industry (ISIC 36)Line Category Unit 2012
1 Gross freshwater supplied by water supply industry (ISIC 36) mio m3/y
2 Losses during transport by ISIC 36 mio m3/y
3 Net freshwater supplied by water supply industry (ISIC 36) (=1-2) (=4+5+6+7+8) mio m3/y
of which supplied to: 4 Households mio m3/y5 Agriculture, forestry and fishing (ISIC 01-03) mio m3/y6 Manufacturing (ISIC 10-33) mio m3/y7 Electricity industry (ISIC 351) mio m3/y8 Other economic activities mio m3/y
Population supplied by water supply industry (ISIC 36)
9 Total population supplied by water supply industry (ISIC 36) %
10 Urban population supplied by water supply industry (ISIC 36) %
11 Rural population supplied by water supply industry (ISIC 36) %

Gross freshwater supplied by water
supply industry(ISIC 36) (W3,1)
Net freshwater supplied by watersupply industry
(ISIC 36) (W3,3)
Losses during transport by ISIC 36
(W3,2)
Households (W3,4)
Other economic activities (W3,8)
Electricity industry (ISIC 351) (W3,7)
Manufacturing (ISIC 10-33) (W3,6)
Agriculture, forestry and fishery (ISIC 01-03) (W3,5)
of which supplied to:
Chart W3: Water Supply Industry (ISIC 36)

Table W4: Wastewater Generation and Treatment
Line Category Unit 2001
1 Total wastewater generated 1000 m3/d
2by: Agriculture, forestry and fishing ISIC (01-03)
1000 m3/d
3 Manufacturing (ISIC 10-33) 1000 m3/d
4 Electricity industry (ISIC 351) 1000 m3/d
5 Other economic activities 1000 m3/d
6 Households 1000 m3/d
7 Wastewater treated in urban wastewater treatment plants 1000 m3/d
8Of which: Primary treatment
1000 m3/d
9 Secondary treatment 1000 m3/d
10 Tertiary treatment 1000 m3/d
11 Wastewater treated in other treatment plants 1000 m3/d
12Of which: Primary treatment
1000 m3/d
13 Secondary treatment 1000 m3/d
14 Tertiary treatment 1000 m3/d
15 Wastewater treated in independent treatment facilities 1000 m3/d
16 Non-treated wastewater 1000 m3/d
17 Sewage sludge production (dry matter) 1000 t
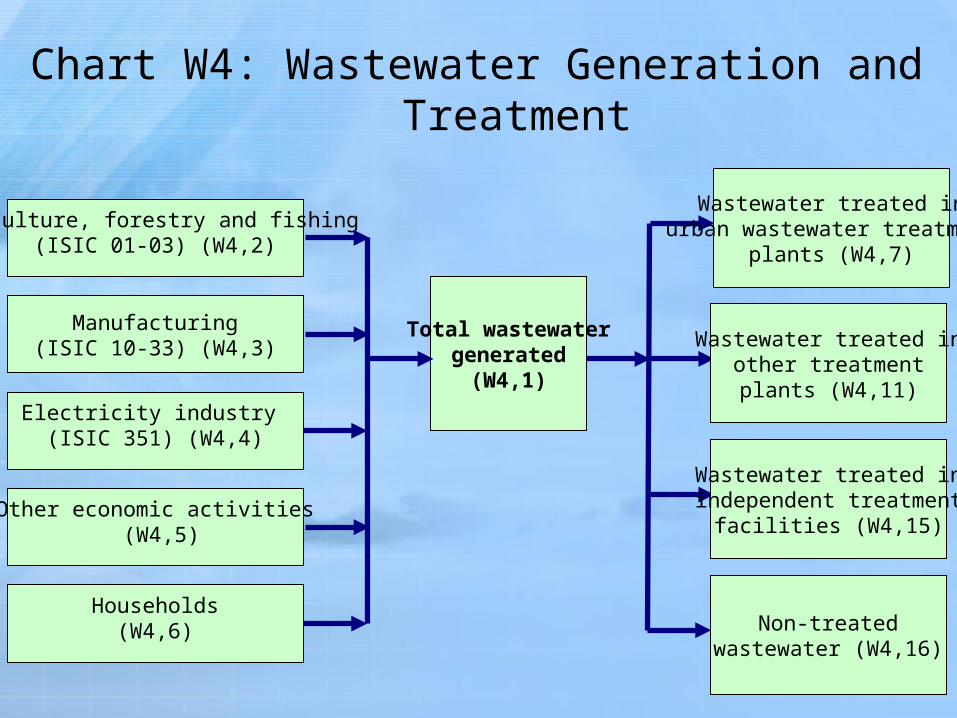
Chart W4: Wastewater Generation and Treatment
Total wastewatergenerated
(W4,1)
Agriculture, forestry and fishing (ISIC 01-03) (W4,2)
Households(W4,6)
Other economic activities (W4,5)
Electricity industry (ISIC 351) (W4,4)
Manufacturing(ISIC 10-33) (W4,3)
Wastewater treated inurban wastewater treatment
plants (W4,7)
Wastewater treated inother treatmentplants (W4,11)
Wastewater treated inindependent treatment
facilities (W4,15)
Non-treatedwastewater (W4,16)

Table W5: Population Connected to Wastewater Treatment
Line Category Unit
1Population connected to wastewater collecting
system%
2 Population connected to wastewater treatment %
3 of which at least secondary treatment %
4 Population with independent wastewater treatment (e.g., septic tanks)
%
5 Population not connected to wastewater treatment (100% - (2) - (4))
%

UNSD/UNEP 2013 Questionnaire Content• Waste
• R1: Generation of Waste by Source• R2: Management of Hazardous Waste• R3: Management of Municipal Waste• R4: Composition of Municipal Waste• R5: Management of Municipal Waste – City Data• R6: Supplementary information sheet
http://unstats.un.org/unsd/environment/questionnaire.htm
Table R1 is linked to economic statistics through the use of ISIC Rev. 4
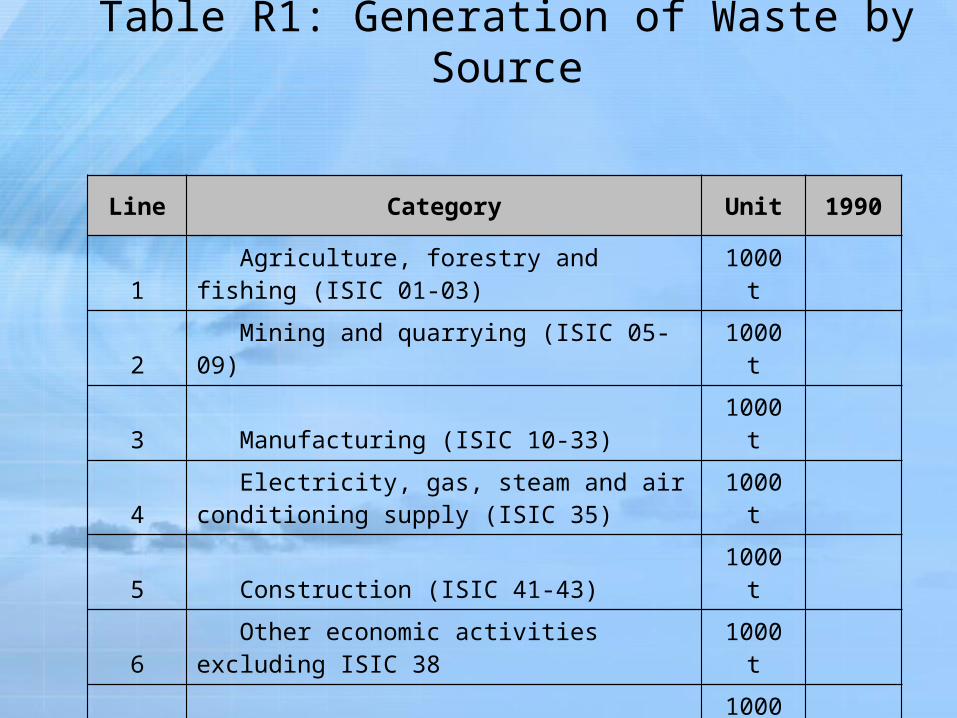
Table R1: Generation of Waste by Source
Line Category Unit 1990
1 Agriculture, forestry and fishing (ISIC 01-03) 1000 t
2 Mining and quarrying (ISIC 05-09) 1000 t
3 Manufacturing (ISIC 10-33) 1000 t
4 Electricity, gas, steam and air conditioning supply (ISIC 35) 1000 t
5 Construction (ISIC 41-43) 1000 t
6 Other economic activities excluding ISIC 38 1000 t
7 Households 1000 t
8 Total waste generation (=1+2+3+4+5+6+7) 1000 t

Table R2: Management of Hazardous Waste
Line Category Unit
1 Stock of hazardous waste at the beginning of the year tonnes
2 Hazardous waste generated during the year tonnes
3 Hazardous waste imported during the year tonnes
4 Hazardous waste exported during the year tonnes
5Hazardous waste treated or disposed of during the year
(=6+7+9+10) tonnes
6Amounts going to:
Recycling tonnes
7 Incineration tonnes
8 of which: with energy recovery tonnes
9 Landfilling tonnes
10 Other, please specify in the footnote tonnes
11 Stock of hazardous waste at the end of the year (=1+2+3-4-5) tonnes

Chart R2: Management of Hazardous Waste
Hazardous wastegenerated during
the year (R2,2) [+]
Stock of hazardous waste at the beginning of the year (R2,1)
Hazardous wasteimported during
the year (R2,3) [+]
Stock of hazardous waste at the end of the year (=1+2+3-4-5) (R2,11)
Hazardous waste treated ordisposed of during the year(=6+7+8+9+10) (R2,5) [-]
Hazardous waste exportedduring the year (R2,4) (-)

Table R3: Management of Municipal Waste
Line Category Unit 1990
1 Municipal waste collected from households 1000 t
2 Municipal waste collected from other origins 1000 t
3 Total amount of municipal waste collected (=1+2) 1000 t
4 Municipal waste imported for treatment/disposal 1000 t
5 Municipal waste exported for treatment/disposal 1000 t
6 Municipal waste managed in the country (=3+4-5) 1000 t
7Amounts going to: Recycling 1000 t
8 Composting 1000 t
9 Incineration 1000 t
10 of which: with energy recovery 1000 t
11 Landfilling 1000 t
12 of which: controlled landfilling 1000 t
13 Other, please specify in the footnote 1000 t
14 Total population served by municipal waste collection %
15 Urban population served by municipal waste collection %
16 Rural population served by municipal waste collection %

Table R4: Composition of Municipal Waste
Line Category Unit 1990
1 Paper, paperboard %
2 Textiles %
3 Plastics %
4 Glass %
5 Metals %
6 Other inorganic material %
7 Organic material %
8 of which: food and garden waste %
9 TOTAL % 100
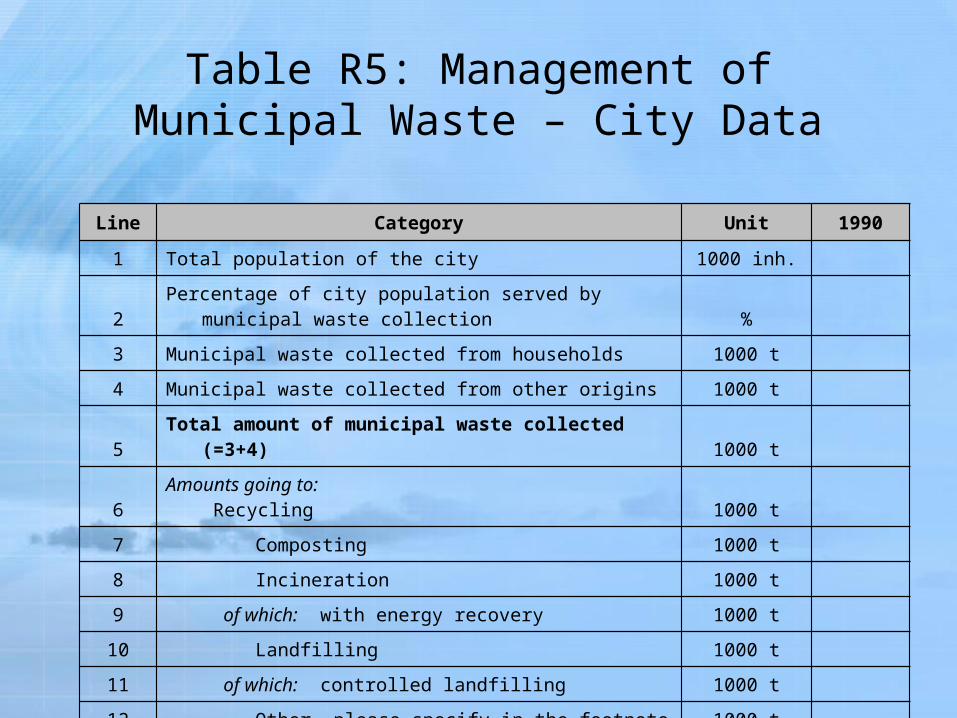
Table R5: Management of Municipal Waste – City Data
Line Category Unit 1990
1 Total population of the city 1000 inh.
2Percentage of city population served by municipal waste
collection %
3 Municipal waste collected from households 1000 t
4 Municipal waste collected from other origins 1000 t
5 Total amount of municipal waste collected (=3+4) 1000 t
6Amounts going to:
Recycling 1000 t
7 Composting 1000 t
8 Incineration 1000 t
9 of which: with energy recovery 1000 t
10 Landfilling 1000 t
11 of which: controlled landfilling 1000 t
12 Other, please specify in the footnote 1000 t
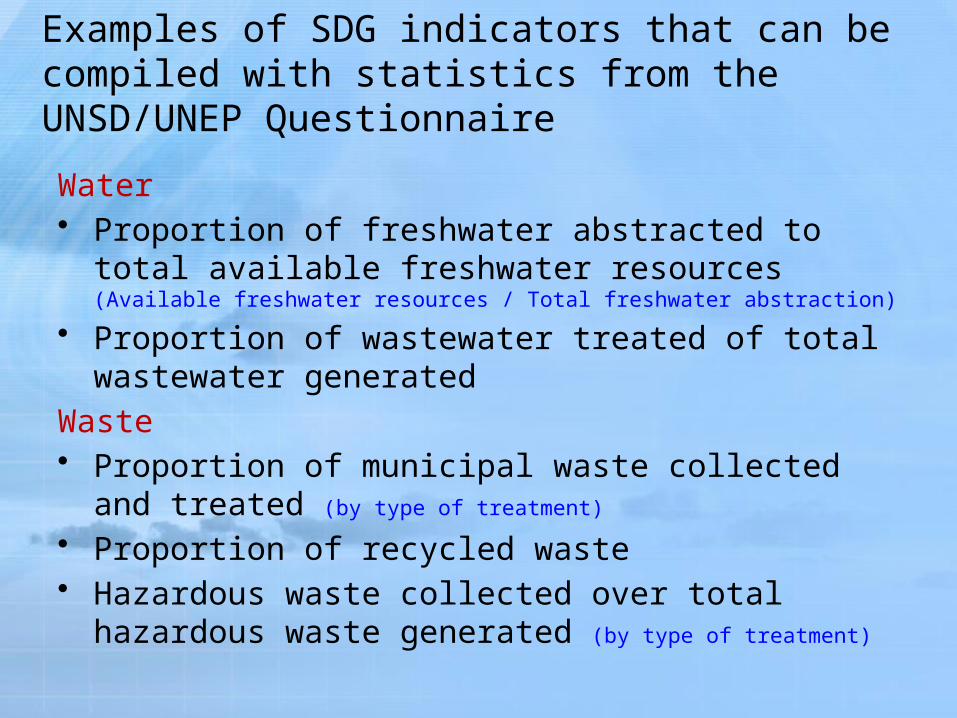
Examples of SDG indicators that can be compiled with statistics from the UNSD/UNEP Questionnaire
Water• Proportion of freshwater abstracted to total available
freshwater resources (Available freshwater resources / Total freshwater abstraction)
• Proportion of wastewater treated of total wastewater generated
Waste• Proportion of municipal waste collected and treated (by
type of treatment)
• Proportion of recycled waste• Hazardous waste collected over total hazardous waste
generated (by type of treatment)

UNSD Data Dissemination
UNSD disseminates data through:
• UNSD Environmental Indicators (Air and climate, Biodiversity, Energy and minerals, Forests, Governance, Inland water resources, Land and agriculture, Marine and coastal areas, Natural disasters, and Waste) (http://unstats.un.org/unsd/environment/qindicators.htm)
• Country Files (access to country files is restricted to countries and international organizations that participate in the data collection (http://unstats.un.org/unsd/environment/Questionnaires/index.asp)
• Country Snapshots ( these include UNSD environmental indicators and other economic/demographic data
(http://unstats.un.org/unsd/environment/Questionnaires/country_snapshots.htm)• Environment statistics in UNData (http://data.un.org/)

UNSD Environmental Indicators

Environmental Indicators – Forest area

Country Snapshot – Mauritius
http://unstats.un.org/unsd/environment/Questionnaires/country_snapshots.htm

Snapshot – Mauritius

Environment statistics - UN Data

Main findings
• Environment statistics is still a relatively new domain which relates to the environmental pillar being the weakest of the 3 pillars in sustainable development in terms of monitoring and measurability.
• Issue of data completeness and data quality remain a challenge (in particular for developing countries.
• National capacity constraints (financial, human, technical) continue to be a concern.
• Inadequate institutional set-up and collaboration in environment statistics.
Conclusions• Environment statistics are multi-purpose and serve many
fundamental needs and uses, including environmental indicators (MDG, SDG indicators) and env.-econ. accounts so we must persevere.
• Capacity building is key to improving environment statistics and Env. Statistics Section is assisting countries in strengthening their statistical capacity through training workshops and direct country assistance.
• Focus should be given to developing/strengthening underlying or basic environment statistics before expanding further.
• More emphasis on the implementation of the FDES 2013 endorsed by 44th session of the Statistical Commission in 2013 as the framework for strengthening environment statistics programmes in countries. The Commission also recognized the FDES 2013 as a useful tool in the context of SDGs and the post-2015 development agenda.

36
Thanks for your attention!
Please contact us: Environment Statistics Section of the United Nations Statistics DivisionE-mail: [email protected]: http://unstats.un.org/unsd/ENVIRONMENT/