Embed Size (px)
Citation preview

Environmental Environmental Assessment of IT ProductsDevelopment of the PAIA Tool
El A Oli tti1 M li L Z l 1
Development of the PAIA Tool
Elsa A. Olivetti1, Melissa L. Zgola1, Christopher Weber2, Sarah Boyd3, Ramzy Kahhat4, Eric Williams4, Randolph E. Kirchain1
1Massachusetts Institute of Technology, 2Carnegie Mellon University, 3University of California at Berkeley and 4Arizona State University
Slide 1
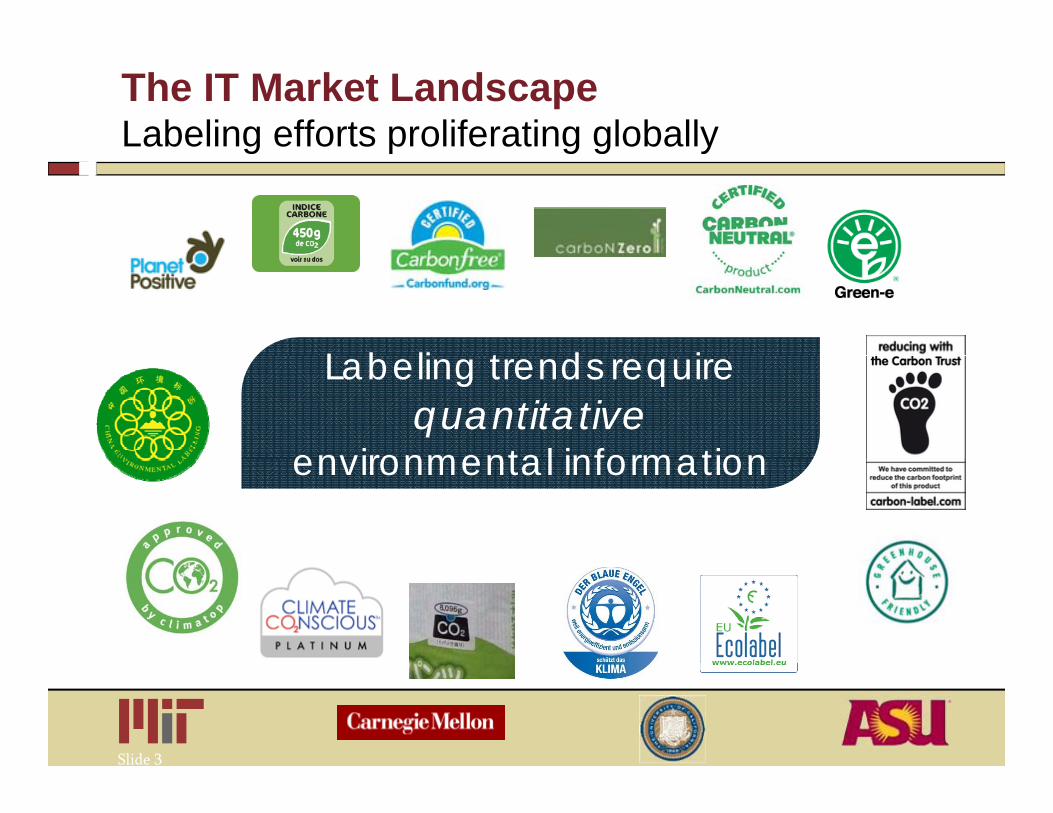
The IT Market LandscapeLabeling efforts proliferating globallyg p g g y
L b li t d i L b li t d i Labeling trends require quantitative
environmental information
Labeling trends require quantitative
environmental informationenvironmental informationenvironmental information
Slide 3Slide 3
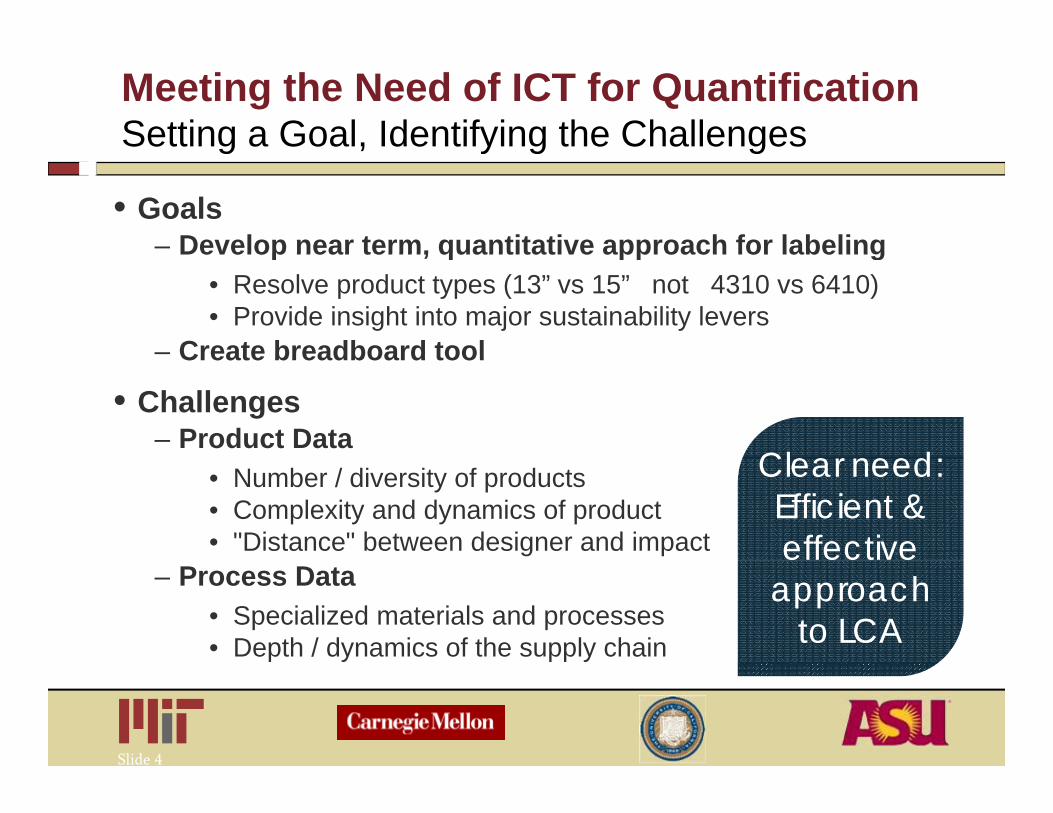
Meeting the Need of ICT for QuantificationSetting a Goal, Identifying the Challengesg , y g g
• Goals– Develop near term, quantitative approach for labelingDevelop near term, quantitative approach for labeling
• Resolve product types (13” vs 15” not 4310 vs 6410)• Provide insight into major sustainability levers
– Create breadboard toolCreate breadboard tool
• Challenges– Product Data
Clear need: Clear need: • Number / diversity of products • Complexity and dynamics of product • "Distance" between designer and impact
Clear need: Efficient & effective
Clear need: Efficient & effective
– Process Data• Specialized materials and processes • Depth / dynamics of the supply chain
approach to LCA
approach to LCA
Slide 4Slide 4

Meeting the Need of ICT for QuantificationTranslating the Goal to Objectivesg j
• Goals– Develop near term, quantitative approach for labelingDevelop near term, quantitative approach for labeling
• Resolve product types (13” vs 15” not 4310 vs 6410)• Provide insight into major sustainability levers
– Create breadboard toolCreate breadboard tool
• Objectives for approach / tool– Efficient
Clear need: Clear need: • Minimum user input• Minimum data collection
– Effective
Clear need: Efficient & effective
Clear need: Efficient & effective
• Resolve product type• Provide actionable insight• Transparent & Flexible
approach to LCA
approach to LCA
Slide 5Slide 5

Project Strategy:Realizing Efficient / Effective IT LCAg
Two major strategies to meet goals1. Product Attribute to Impact Algorithm (PAIA)
– An approach that maps product attributes to their environmental impactp
2. Probabilistic Triage and Targeted Refinementg g
Initial focus– Product: Laptop– Impacts: Energy & carbon
Slide 8Slide 8

Product Attribute to Impact Algorithm (PAIA): The Basic PAIA Conceptp
Inputs Results
Product Type Product Type Product Type Attributes
Laptop15 “ Screen250 GB Hard drive
ypImpacts
MJ EnergyKg CO2
Gal H2O
Product Attribute to
I t Al ith6 Layer PWB…
…Impact Algorithm
• Minimum user input, attributes which are– Important
• Significant effect on results• Viewed as critical by stakeholder
– Knowable (Measurable at “low” cost)
Slide 9Slide 9
Knowable (Measurable at low cost)

Realizing the Product Attribute to Impact AlgorithmIncorporating Engineering Models with Existing Tools
Existing LC tools
p g g g g
Inputs Results
Product Type Product Type
Attribute-to-ActivityM d l
ImpactAssessmentM d l
BOA
LCI
InventoryDatabase
ypAttributes
Laptop15 “ Screen250 GB Hard drive6 L
ypImpacts
MJ EnergyKg CO2
Gal H2O
Model ModelA IDatabase6 Layer PWB…
…
Activity AmountAluminum 20 g
Electricity 140 KWh
Activity AmountAnhydrite, in ground 0.1 kg
Carbon dioxide, in air 1.2 kg
Total g Al = a*LCDsize + b*HDD capacity
Total g PC = c*Chassis + d*PWB area
g Lithography = e* layers PWB + y
Lithography 0.5 g
Inj. molding 40 g
Transport 4 tkm
g
Oil crude, in ground 3.6 g
Land Transformation 40 km2
Zinc, in ground 0.2 kg
g g p y yd*Ictype
Etc…
Slide 10Slide 10
Numbers are for illustration only
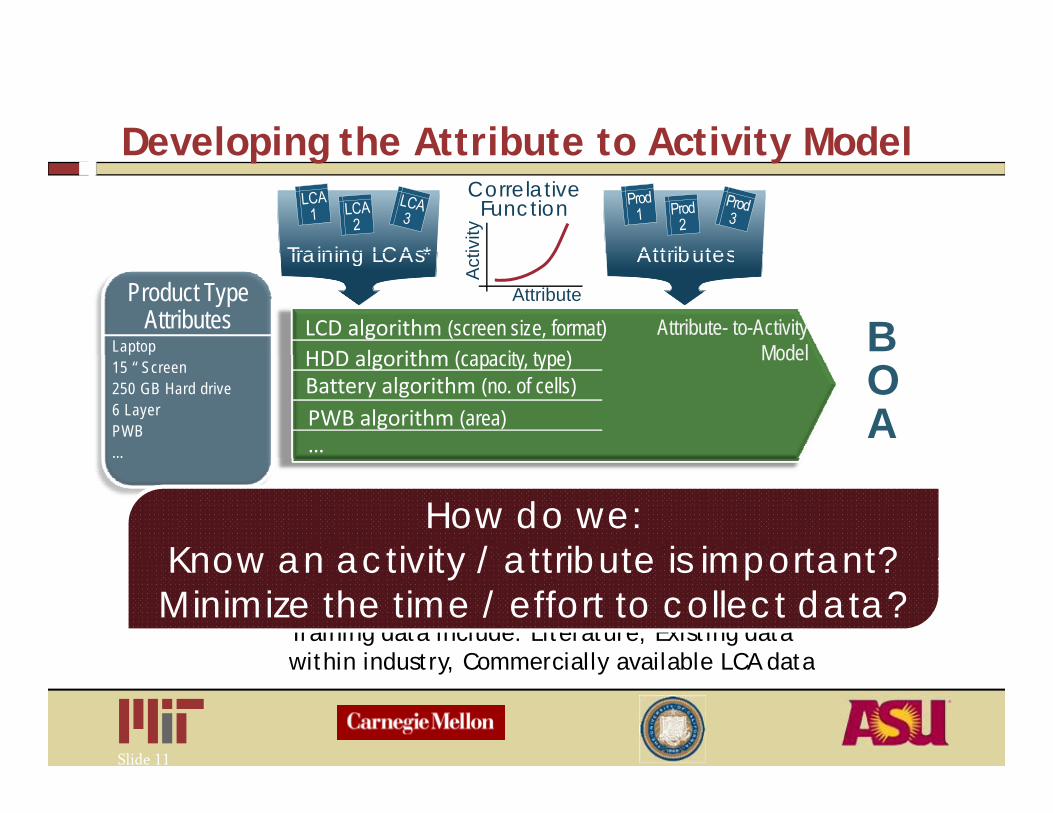
Developing the Attribute to Activity Model
Training LCAs*
Developing the Attribute to Activity Model
Attributesivity
CorrelativeFunction
Attribute- to-ActivityModel B
Training LCAs*
HDD algorithm (capacity type)LCD algorithm (screen size, format)
Product Type Attributes
Laptop
Attributes
Attribute
Act
ModelOA
HDD algorithm (capacity, type)Battery algorithm (no. of cells)PWB algorithm (area)…
15 “ Screen250 GB Hard drive6 Layer PWB…
*Training data enables development of parametric How do we:
Know an activity / attribute is important?algorithms by component
Training data include: Literature, Existing data within industry Commercially available LCA data
Know an activity / attribute is important?Minimize the time / effort to collect data?
Slide 11Slide 11
within industry, Commercially available LCA data
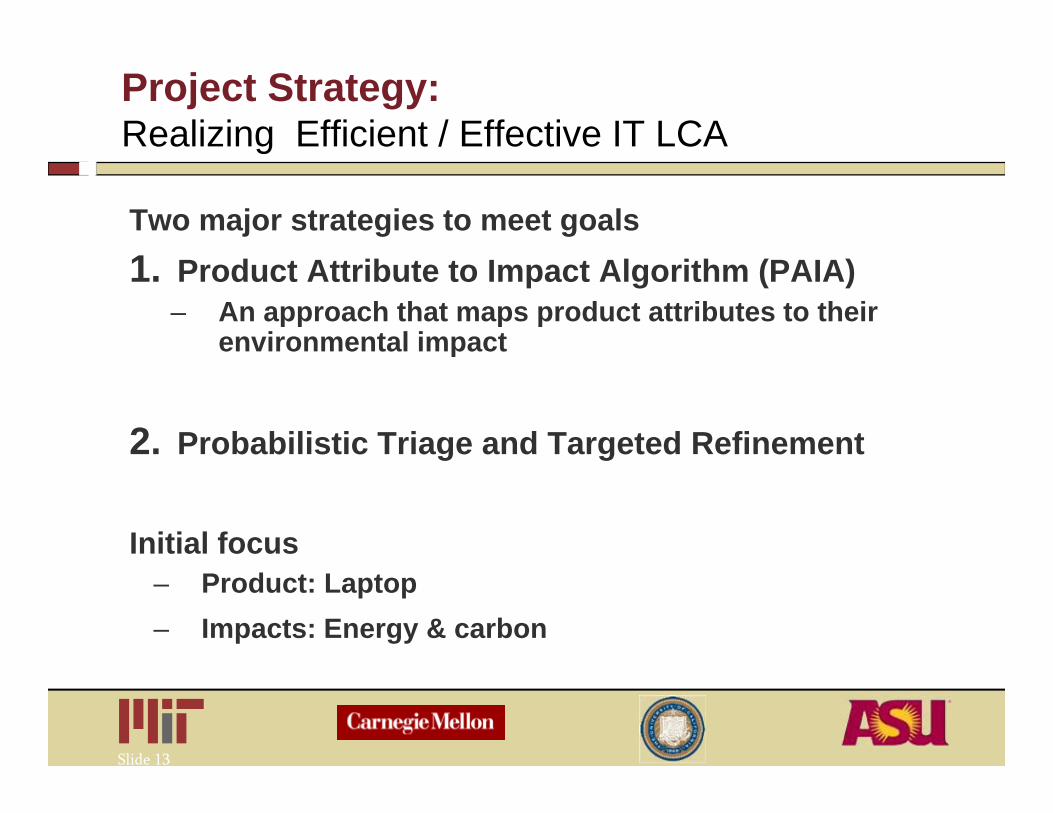
Project Strategy:Realizing Efficient / Effective IT LCAg
Two major strategies to meet goals1. Product Attribute to Impact Algorithm (PAIA)
– An approach that maps product attributes to their environmental impactp
2. Probabilistic Triage and Targeted Refinementg g
Initial focus– Product: Laptop– Impacts: Energy & carbon
Slide 13Slide 13

Realizing Quantitative Streamlined LCA:Tradeoff between Comprehensiveness and Specificityp p y
Comprehensiveness Idealized
GoalGoal
Results accurate
Screening
Targeted resources
Significant uncertainty
Results precise
Resource intensive
Specificity
Omissions indefensible
Slide 14Slide 14
Specificity

Realizing Quantitative Streamlined LCA:Even with high uncertainty, targeted data & input meets goalg y, g p g
Comprehensive, uncertain assessment
Comprehensive, uncertain assessment
Comprehensive, uncertain assessment ul
t Initial Result
uncertain assessmentuncertain assessment
y in
Res
u
Bulb technology
Printed wiring boards
ncer
tain
ty
Targeted Data Refinement
Targeted User Input
Capacitors Un
Sufficiency
Data Refinement Priorities Specificity
Slide 15Slide 15
p y

Examples of Sources of Uncertaintyp y
• Data availability concerning– Bill of materials (laptop vs. particular model)– Suppliers practices and location
• Representativeness of secondary data– Variation in supplier technology
G hi i ti– Geographic variation• Grid mix, efficiency, transportation
– Temporal variationTemporal variation• Process and process evolution
Uncertainty may be resolvable at an acceptable cost
Slide 16Slide 16
Uncertainty may be resolvable at an acceptable cost
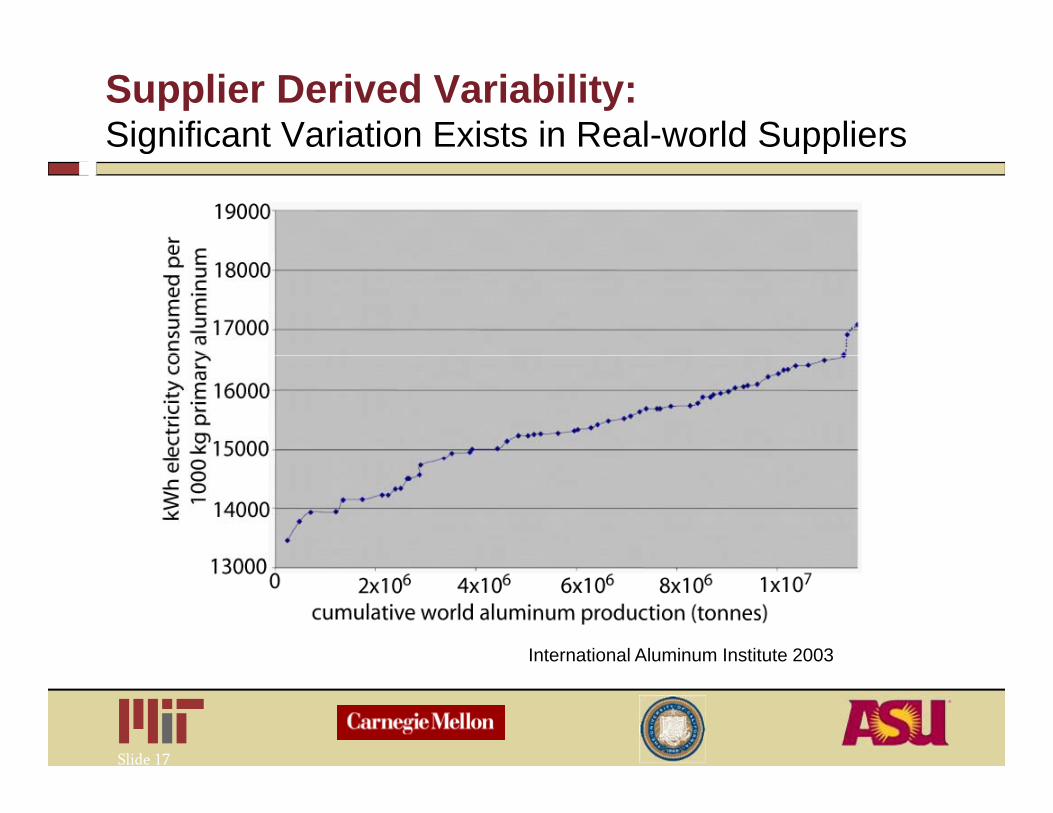
Supplier Derived Variability:Significant Variation Exists in Real-world Suppliersg pp
International Aluminum Institute 2003
Slide 17Slide 17

Overall Triage Approach to Creating PAIAg pp g
1. Leverage existing data to create best available estimateGather existing BOA and LCI data– Gather existing BOA and LCI data
– Assemble uncertainty information• LCI database mining and data reduction• Manufacturing and grid market data• Government or third party usage studies• Extreme conditions(e.g., rail vs. truck)
22. Develop & execute LCI simulation (Monte Carlo) model3. Triage (screen) for high impact activities4 Develop PAIA modules to relate attributes to activities4. Develop PAIA modules to relate attributes to activities
– Assemble training LCAs– Create correlative models
Slide 22Slide 22

Developing the Laptop PAIAp g p p
ManufacturingManufacturing
LogisticsEoL
PackagingUse
Slide 24Slide 24

Comprehensive Probabilistic Screening:Analysis breakdown by LC phasey y p
Overall Overall 450.0
q) Overall
Coefficient of Variation
30%
Overall Coefficient of Variation
30%250 0
350.0
kg CO
2‐e
q
~30%~30%150.0
250.0
GWP (k
‐50 0
50.0
95% of statistical trials indicate that 90% of the impact attributed to M tl & Mf d U h
‐50.0
Slide 25Slide 25
Matls & Mfg and Use phase * transport phase

Comprehensive Probabilistic Screening:Analysis of Components (Matls & Mfg.)y p ( g )
300.0
)
200.0
250.0
CO2‐e
q)
100.0
150.0
WP (kg C
0.0
50.0GW
95% of trials indicate that 75% of the impact attributed to
LCD M i b d d Ch i
Slide 26Slide 26
LCD, Mainboard, and Chassis

Supply Chain Characterization & Screening Identifies Major Levers for LCDsj
• Consumer Perceivable Performance Attributes
• Use drivers –addressed at productPerformance Attributes
– Screen size– Resolution*
addressed at product level
– LifetimeUse location• Product Attributes
– Backlight technology*– ICs/PWB
– Use location– Profile (duty cycle,
power in idle, sleep off) ICs/PWB
• Manufacturing context– Location– Efficiency– PFC emission
abatement*Not fully quantified
Slide 27Slide 27
*Not fully quantified

Targeted analysis around LCD:Each resolved driver lowers COV
0.5
0 3
0.4
Varia
tion
0.2
0.3
ficie
nt o
f V
0
0.1
Coe
ff
0Unresolved Screen
sizePFC
abatementLocation Energy
efficiencyIC/PWB
Slide 28Slide 28

Current set of overall model inputs:Main drivers of impactp
• Manufacturing Context– Location and efficiency
• Hard drive– CapacityLocation and efficiency
• LCD– Size – PFC abatement
Capacity– Technology (SSD-future tech)
• Battery – Number of cells– PFC abatement
– Bulb technology– IC/PWBs
• M i b d
– Number of cells
• Transportation –assembly to customer
– Mode, distance• Mainboard– IC impact node, chip area,
yield, PFC abatement,Integration
Mode, distance
• Packaging*– Mass and recycled content
U h– PWB impact area
• Chassis– Materials
• Use phase– Duty cycle, power, grid,
lifetime
*M h t b tt i th h t t
Slide 29Slide 29
*More a hot button issue than a hot spot

Targeted assessment:Results in lower overall variation
350.00450.0
eq)
150.00
250.00
250.0
350.0
(kg CO
2‐e
50.0050.0
150.0
GWP (
‐50.00‐50.0
Targetedassessment
Overall COV <10%
Targetedassessment
Overall COV <10%
Comprehensive assessment
Overall COV ~ 30%
Comprehensive assessment
Overall COV ~ 30%
Slide 30Slide 30
Overall COV 10%Overall COV 10%Overall COV 30%Overall COV 30%

Project Accomplishmentsj p
• Project accomplishmentsT i d t t d fi t id tifi– Triage and targeted refinement identifies
• important inputs for user• Important focus for data refinement
– Mapping attributes to impacts is possible / promising• Limited levers account for majority of variation
C ti i k• Continuing work– Revise/update proxy and data– Harmonize with existing and emerging effortsg g g– Correlation between uncertainty factors not well
accounted
Slide 31Slide 31

Lessons learned
• Uncertainty is significant• Triage (screening) is still possible
– Limited levers account for much variation
C ll b ti i k• Collaboration is key– Leverage on suppliers– Knowledgebase is not present in any one firmKnowledgebase is not present in any one firm
• Data collection still a challenge and necessary– Characterize the product– Characterizing specialized process– Projecting the future (technology is dynamic)
Slide 32Slide 32

Thanks to our sponsorsp
Randolph KirchainMaterials Systems Laboratory
Massachusetts Institute of Technology
kirchain@mit edu
Slide 33