Embed Size (px)
Citation preview

Environmental Considerationsfor theIndustrial Development Sector
34023
MC12
MGC01 0283
Pub
lic D
iscl
osur
e A
utho
rized
Pub
lic D
iscl
osur
e A
utho
rized
Pub
lic D
iscl
osur
e A
utho
rized
Pub
lic D
iscl
osur
e A
utho
rized


EnvironmentalConsiderations
for the IndustrialDevelopment Sector
World Bank/August 1978


ForewordCritical to any nation's economic development is its growth in the industrialsector, generally accompanied by a shift of population from rural to urbanareas and by the creation of new environmental hazards.
With the rapid technological progress which has occurred, and continues tooccur, and the increasing concentration of populations into larger and largermetropolitan areas, the protection and maintenance of a safe and healthy en-vironment becomes a major concern.
Industry is attracted by the availability of water and land. Unless steps aretaken to protect the environment in parallel with industrial growth, then thewater, air, and land resources will generally suffer substantial degradation. Ad-vance consideration and planning by developers and environmentalists, work-ing jointly, can minimize and frequently prevent these deleterious effects.
The purpose of this document is to provide guidelines for consideration andattention as an integral part of the industrial expansion and growth process.Past experience in many of the developed countries has shown that where littleor no consideration was given to environmental protection during the industrialdevelopment period the correction of damages to the environment has beenboth slow and costly.
The principles presented in this document are intended as general guidelinesonly. Since no two situations are exactly alike, modification may be necessaryfor application of these guidelines to specific circumstances.
While the material has been prepared primarily for use by the staff of TheWorld Bank, its use by other institutions and agencies is both welcomed and en-couraged. It is hoped that the document will be particularly helpful to adminis-trators, managers, planners, environmentalists, and other officials-both publicand private-concerned with industrial development. It is further hoped thatfor them the document will provide a useful orientation and guidance.
For further information concerning the environmental and health activitiesof The World Bank, write:
Office of Environmental and Health AffairsThe World Bank1818 H Street, N.W.Washington, D.C. 20433, U.S.A.

Table of ContentsPage
Foreword................................................ iI: Sources and Effects of Industrial Pollution ................. .1
A ir . . . . . . . . .. . . .. . . . . .. . . . . . . . . . . . . . . .. . . . . .. . .. . . . . . 1W ater................................................ 6L an d ................................................. 7R eferences ........................................... 8
II: Governmental Structures for Environmental Management ... 9Local Governments.................................... 10State (Provincial) Governments ......................... 11Regional Agencies..................................... 11National (Federal) Governments ........................ 12International Agencies ................................. 12R eferences ........................................... 13
III: Criteria and Standards................................... 14A ir .. . . . . . . . . . . . . . . . . . . . . . . . . . . .. . . . . . . . .. . . . . . . . .. . . 14
Effluent Standards................................... 14Ambient Standards .................................. 15Application of Standards ............................. 16
W ater................................................ 17Stream Standards.................................... 18Effluent Standards................................... 19Application of Standards ............................. 19
L an d ................................................. 20R eferences ........................................... 21
IV: Sampling and Analytical Procedures ....................... 22A ir .... ...................................... ........ 2 2
Source Monitoring ................................. 22Atmospheric Monitoring............................ 24

Analysis of Air Contaminants........................ 26Mass Quantity Computations........................ 26
Water............................................ 27
Sample Collection ................................. 27Flow Measurements ............................... 28
Analysis of Water Contaminants ...................... 30Mass Quantity Computations......................... 32
Land .......................................... 33
Monitoring of Land Contaminants ..................... 33Analysis of Land Contaminants ....................... 33
Mass Quantity Computations......................... 34
References ........................................ 34
V: Treatment Technology .................................. 36
A ir .................................................. 36
Meteorological Factors.............................. 36
Stack H eights....................................... 37
Computation of Required Treatment ................... 38
Treatm ent M ethods.................................. 39
Gas Removal Techniques........................... 39Removal by Adsorption .......................... 39
Removal by Absorption .......................... 40
Gaseous Chemical Conversion .................... 40
Particulate Removal Systems........................ 41
F ilters ......................................... 4 1
Sedim entation .................................. 41
Centrifugal Separators........................... 41
Electrostatic Precipitators........................ 42
W et Scrubbers.................................. 42
Generally Achieved and Acceptable RemovalEfficiencies .. ................................. 42
Redesign of Production Systems .................... 43
Change of Raw Materials ........................ 43
Change of Process or Operation ................... 43
Reuse of Wastes............................... 43
Increase in Stack Height.......................... 44
Water............................................ 44
Treatment Techniques ............................. 44
Change of Process or Operation .................... 44
Wastewater Volume Reduction................... 44
Waste Strength Reduction ....................... 45
Neutralization. ............................... 46
Equalization and Proportioning................... 46
Joint Treatment of Industrial and Municipal Wastes .... 46
Suspended Solids Removal ........................ 49

Sedim entation .................................. 50F lotation ....................................... 50Screening ...................................... 50
Colloidal Solids Removal........................... 50Chemical Coagulation............................ 50A dsorption ..................................... 51
Inorganic Dissolved Solids Removal.................. 51In-plant Control................................. 51Treatment for Dissolved Materials................. 52
N eutralization................................. 52pH C ontrol................................... 52Oxidation-Reduction........................... 52Precipitation.................................. 54Ion Exchange ................................. 55Carbon Adsorption ............................ 55Reverse Osm osis .............................. 55Evaporation .................................. 55
Organic Dissolved Solids Removal................... 56L agooning ...................................... 56Activated Sludge ................................ 57Trickling Filters................................. 58Biodisc Treatm ent............................... 58Spray Irrigation ................................. 58O ther System s .................................. 59
Wet Combustion Technique .................... 59Anaerobic Digestion........................... 59Deep W ell Injection ........................... 59Foam-Phase Separation ........................ 59
Stream Assimilative Capacity ..................... 59Treatment and Disposal of Sludge Solids .............. 60
D igestion ....................................... 60Vacuum Filtration ............................... 60D rying Beds .................................... 60C entrifuging .................................... 61Lagooning ...................................... 61Sludge Barging or Pumping ....................... 61Drying and Incineration.......................... 62Atomized Suspension ............................ 62W et Com bustion ................................ 62O ther M ethods.................................. 63
Bacteria or Microorganism Removal ................. 63C hlorination .................................... 63O zonation ...................................... 63Ultraviolet Radiation............................. 63

L and ................................................. 64Collection and Delivery.............................. 64Sanitary Landfill..................................... 64
Leachate Control.................................. 65G as C ontrol....................................... 66
Refuse Treatm ent ................................... 66Grinding (Shredding) .............................. 66Incineration: Central and Individual ................. 67
R eferences ........................................... 68
VI: Economic Aspects and Considerations ..................... 69A ir .................................................. 7 0W ater................................................ 72
Benefit/Cost Considerations........................... 77L and ................................................. 78
Benefit/Cost Considerations.......................... 79R eferences ........................................... 79
VII: Sociological, Planning, and Political Aspects ................ 81Planning for Environmental Protection................... 81
A dvantages......................................... 82D isadvantages ...................................... 83
Considerations in Locating Industrial Plants............... 84Environmental Impact Assessment ....................... 84Enforcement for Environmental Protection............... 85Governmental Controls ................................ 85R eferences ........................................... 86
AppendicesA: Criteria and Standards.................................... 89B: Glossary of Term s........................................ 103C : Conversion Factors....................................... 117D: Institutional Resources . ................................ 123
List of Tables1-1: Characteristics and Effects of Major Air Pollutants........... 2111-1: U.S. National Ambient Air Quality Standards............... 16V-1: Major Components of a Basic Incineration System .......... 68VI-I: Summary of Selected Studies on Health Damage Costs
from Air Pollution . ................................. 73VI-2: Summary of Selected Studies Relating Air Pollution to
Land Values . ...................................... 74VI-3: Summary of Selected Studies on Health Damage Costs
from Water Pollution ................................ 76A-1: Standards of Performance for New Stationary Sources of
Air Pollution... .................................... 90

A-2: Ranges of Uncontaminated and Hazardous Air QualityLevels . ........................................... 98
A-3: New York State Classification and Standards for SurfaceWaters. .......................................... 99
A-4: Pennsylvania State Effluent Standards for Pulp and PaperMills............................................ 101
A-5: Typical Mineral Concentrations for UncontaminatedWaters. .......................................... 102
List of FiguresV-1: Typical Effect of Reducing Strength of Wastes ............. 45V-2: Typical Effect of Equalizing Waste Discharge.............. 47V-3: Typical Effect of Proportioning Waste Discharge........... 48V-4: Solubility of Copper, Nickel, Chromium and Zinc as a
Function of pH. .................................... 53VI-1: Pollution Control Allocations: Society vs. Industry .......... 70VI-2: Effects of Sulfur Dioxide on Vegetation ................... 71VI-3: Effects of Sulfur Dioxide on Health ...................... 75


Chapter I:Sources and Effects ofIndustrial PollutionWith the growing concern for protection of the environment which has rapidlydeveloped on a worldwide scale, during the past ten years in particular, themanagement and disposal of residues from industrial operations has assumed acritical role in today's society.
This is particularly important in the developing countries, many of which areundergoing rapid growth in their economies. Since the industrial sector is fre-quently the major element in such growth, the early consideration of the totalenvironment as one entity will permit the coordinated management and protec-tion of the air, water, and land resources affected by such development.
Pollution is defined as the addition, from either natural or man-made sources,of any foreign substance to the air, water, or land media in such quantities as torender that resource unsuitable for specific or established uses. The most com-mon sources and the specific substances (or contaminants) involved are discussedbelow.
AIRAir pollution is the presence in the atmosphere of one or more contaminants insuch quantities, characteristics, and duration as to make them actually or poten-tially injurious to human, plant, or animal life or to property, or which unreason-ably interfere with the comfortable enjoyment of life and property.
Industrial air contaminants may originate from a number of sources, of whichthe principal ones are:
1. The mining or manufacturing of products for commercial purposes.2. The production of power, steam, or water, involving the combustion of
either fossil fuel or use of radioactive materials.3. The burning of industrial refuse.4. The construction or demolition of buildings.5. The transfer of materials to or within an industrial property.6. The treatment of liquid wastes resulting in the release of gaseous by-
products.

TABLE 1-1: Characteristics and Effects of Major Air Pollutants
National ambient standards 2.3Pollutant Characteristics Principal sources Principal effects Controls (in micrograms per
cubic meter)
Total sus- Any solid or liquid par- Natural events such as Health: Directly toxic ef- Cleaning of flue gases Primary: Annual=75pended tides dispersed in the forest fires, wind ero- fects or aggravation of with inertial separators, 24-hour=260particulates atmosphere, such as sion, volcanic erup- the effects of gaseous fabric filters, scrub- Secondary: Annual=60(TSP) dust, pollen, ash, soot, tions; stationary com- pollutants; aggravation bers, or electrostatic 24-hour=150
metals, and various bustion, especially of of asthma or other res- precipitators; alterna- Alert: 24-hour=375chemicals; the parti- solid fuels; construc- piratory or cardiorespi- tive means for solidclesare often classified tion activities; indus- ratory symptoms; in- waste reduction; im-according to size as trial processes; atmos- creased cough and proved control proce-settleable particles: pheric chemical reac- chest discomfort; in- dures for constructionlarger than 50 microns- tions creased mortality and industrial proc-aerosols: smaller than Other: Soiling and dete- esses50 microns; and fine rioration of buildingparticulates: smaller materials and otherthan 3 microns surfaces, impairment
of visibility, cloud for-mation, interferencewith plant photosyn-thesis
Sulfur diox- A colorless gas with a Combustion of sulfur- Health: Aggravation of Use of low-sulfur fuels; Primary: Annual=80ide (SO2) pungent odor; SO2 can containing fossil fuels, respiratory diseases, removal of sulfur frdm 24-hour=365
oxidize to form sulfur smelting of sulfur-bear- including asthma.* fuels before use; scrub- Alert: 24-hour=800trioxide (SOO), which ing metal ores, indus- chronic bronchitis, and bing of flue gases withforms sulfuric acid with trial processes, natural emphysema; reduced lime or catalytic con-water events such as volcanic lung function; irritation version
eruptions of eyes and respiratorytract; increased mor-tality

Other: Corrosion ofmetals; deterioration ofelectrical contacts, pa-per, textiles, leather,finishes and coatings,and building stone; for-mation of acid rain;leaf injury and reducedgrowth in plants
Carbon mon- A colorless, odorless gas Incomplete combustion Health: Reduced toler- Automobile engine mod- Primary: 8-hour=1,000oxide (CO) with a strong chemical of fuels and other ance for exercise, im- ifications (proper tun- 1-hour=40,000
affinity for hemoglobin carbon-containing sub- pairment of mental ing, exhaust gas recir- Alert: 8-hour=17,000in blood stances, such as in function, impairmentof culation, redesign of
motorvehicleexhausts; fetal development, ag- combustion chamber);natural events such as gravation of cardiovas- control of automobileforest fires or decom- cular diseases exhaust gases (cata-position of organic Other: Unknown lytic or thermal de-matter vices); improved de-
sign, operation, andmaintenance of station-ary furnaces (use offinely dispersed fuels,proper mixing with air,high combustion tem-perature)
See footnotes at end of table.

TABLE 1-1: Characteristics and Effects of Major Air Pollutants (continued)
National ambient standardsPollutant Characteristics Principal sources Principal effects Controls (in micrograms per
cubic meter)
Photochemi- Colorless, gaseous com- Atmospheric reactions of Health: Aggravation of Reduced emissions of ni. Primary: 1-hour=160
cal oxidants pounds which can com- chemical precursors respiratory and cardio- trogen oxides, hydro- Alert: 1-hour=200
(Ox) prise photochemical under the influence of vascular illnesses, irri- carbons, possibly sul-smog, e.g., ozone (0), sunlight tation of eyes and res- fur oxidesperoxyacetyl nitrate piratory tract, impair-(PAN), aldehydes, and ment of cardiopulmo-other compounds nary function
Other: Deterioration ofrubber, textiles, andpaints; impairment ofvisibility; leaf injury,reduced growth, andpremature fruit andleaf drop in plants
Nitrogen di- A brownish-red gas with a Motor vehicle exhausts, Health: Aggravation of Catalytic control of auto- Primary: Annual=100
oxide (NO3) pungent odor, often high-temperature sta- respiratory and cardio- mobile exhaust gases, Alert: 24-hour=282formed from oxidation tionary combustion, at- vascular illnesses and modification of auto- 1-hour=1,130of nitric oxide (NO) mospheric reactions chronic nephritis mobile engines to re-
Other: Fading of paints duce combustion tem-and dyes, impairment perature, scrubbingof visibility, reduced flue gases with causticgrowth and premature substances or urealeaf drop in plants
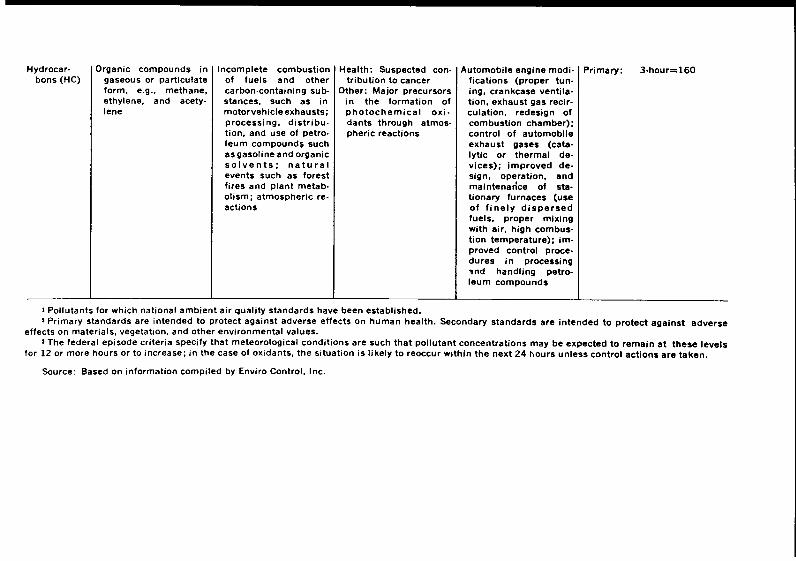
Hydrocar- Organic compounds in Incomplete combustion Health: Suspected con- Automobile engine modi- Primary: 3-hour=160bons (HC) gaseous or particulate of fuels and other tribution to cancer fications (proper tun-
form, e.g., methane, carbon-containing sub- Other: Major precursors ing, crankcase ventila-ethylene, and acety- stances, such as in in the formation of tion, exhaust gas recir-lene motorvehicleexhausts; photochemical oxi- culation, redesign of
processing, distribu- dants through atmos- combustion chamber);tion, and use of petro- pheric reactions control of automobileleum compounds such exhaust gases (cata-as gasoline and organic lytic or thermal de-solvents; natural vices); improved de-events such as forest sign, operation, andfires and plant metab- maintenarice of sta-olism; atmospheric re- tionary furnaces (useactions of finely dispersed
fuels, proper mixingwith air, high combus-tion temperature); im-proved control proce-dures in processingdad handling petro-leum compounds
I Pollutants for which national ambient air quality standards have been established.3 Primary standards are intended to protect against adverse effects on human health. Secondary standards are intended to protect against adverse
effects on materials, vegetation, and other environmental values.3 The federal episode criteria specify that meteorological conditions are such that pollutant concentrations may be expected to remain at these levels
for 12 or more hours or to increase; in the case of oxidants, the situation is likely to reoccur within the next 24 hours unless control actions are taken.
Source: Based on information compiled by Enviro Control, Inc.

Specific substances produced by the above sources are numerous, and will de-pend upon the individual operation or activity involved. The more common con-taminants originating from industrial operations are:
1. Ammonia-NH32. Sulfur oxides-SOx3. Nitrogen oxides-NOx4. Hydrogen sulfide-H2S5. Mercaptans6. Methyl amines7. Carbon monoxide8. Particulate matter of carbon origin9. Particulate matter of dust origin
10. Radioactive gases11. Methane12. Chlorine13. Various organic solvents
The release of substances to the atmosphere from industrial operations canresult in a number of effects. Table I-1, following, lists the characteristics, prin-cipal sources, principal effects, control methods, and standards for several of themajor air pollutants.
WATERWater pollutants consist not only of the natural or man-made physical contami-nants but also of heat and radiation which have the same origins and aremeasurable in spite of not having physical form.
Major sources of industrial contaminants include, but are not limited to:
1. The mining or manufacturing of goods for commerce, either as an inter-mediate or final product.
2. The production of power, steam or water involving either the combus-tion of fossil fuels or use of radioactive materials.
3. The production of potable water from surface or groundwater supplies.4. The maintenance, cleaning, or general housekeeping of fixed surfaces of
machines, buildings, and other physical facilities used in manufacturingproducts or maintaining equipment.
5. The transportation of persons and products by water, such as by boatsand ships.
6. The leaching of contaminants from industrial refuse.7. The condensation and/or absorption of gaseous wastes by water.
The categories of contaminants which could have a deleterious effect onwater quality include:
1. Alkalinity and acidity2. Colored matter3. Heated liquids4. Toxic chemicals5. Detergents6. Floating materials7. Nonbiodegradable organic materials8. Organic matter

9. Suspended solids10. Mineral salts11. Algal nutrients12. Foaming agents13. Bacteria and viruses
The discharge of industrial contaminants to the water medium can be ex-pected to:
1. Produce a general effect such as causing water to appear aestheticallyundesirable or to smell. Water which appears polluted is never fullyused, resulting in a degradation of the general area. Unsightliness givesthe appearance of pollution regardless of the degree of pollution, andtherefore is harmful to the environment.
2. Kill fish and other aquatic life.3. Cause or increase corrosion of all types of surfaces with which the water
comes into contact.4. Lower land use and monetary values of the land surrounding the water.5. Encourage the growth of undesirable biological life, often in excessive
quantities.6. Cause disease in persons who may drink the water or who may consume
life forms grown in the water.7. Interfere with the recreational uses of the water for bathing, boating,
etc.8. Render the water unsuitable for irrigation purposes.9. Make the water unsuitable for industrial use.
LANDLand may become polluted not only through the addition of specific contami-nants but also through alteration to such a degree and/or in such a manner as torender it unsuitable for its best zoned use, as determined by the local govern-ment. The land could also become a hazard or nuisance to the adjacent popula-tion under conditions of uncontrolled use.
Industrially-connected sources of land pollution include:1. The disposal of industrial solid wastes by improper landfill operations.2. The burning of industrial solid wastes on land sites.3. The mining of minerals.4. The demolition of existing land-based structures yielding residual debris.5. The storing either temporarily or permanently of materials which may
create nuisances, either visual or sensual (such as old autos or wastewatersludges).
6. The damming or draining of lands to impound or to remove excess water.Among the more common contaminants contributing to land pollution are:
1. Packing materials, such as paper, cartons, boxes, and plastics.2. Tire residuals, cans, and ash resulting from burning.3. Rubble from demolition, such as lumber, bricks, stones, concrete and
cinder block, and other discarded building materials.4. Unusable stripped soil, exposed erodable soil, and rock from mining
operations.

5. Slag heaps from smelting operations.6. Tailings from mineral ore concentration operations.7. Organic residuals from cannery operations, such as pulp, pits, culls, and
vines.8. Partially concentrated organic sludges from pulp and paper mills, tex-
tile plants, and potable water production.9. Stored or discarded unusable materials such as junked vehicles and
parts, oil drums, and similar items.10. Waste oils, both as sludges and as contaminated oils from garages or oil
reprocessing plants.11. Soil cutting resulting from quarrying operations for stone, gravel, or
sand.12. Waste deposits caused by damming of flowing streams.
The discharge or deposition of waste materials on land areas will result in a
number of effects, such as:
1. Producing a general unsightliness such as is caused by changing the landfrom a forested area to one of denuded soil, or by storing on any type of
previously used land such undesirable materials as junk metal, rubble
and tires. Unsightliness also results from residual tires, cans and ash left
on a barren area following the burning of industrial waste products.2. Producing a general aesthetic effect of bad odors such as are caused by
decomposing organic matter from stored sludges or oil.3. Increasing runoff erosion, and flooding which can occur from stripping
land of its vegetation and cover material.4. Killing valuable and/or rare vegetation and wildlife by dumping of tail-
ings, oil, rubble, and similar materials.5. Killing grasses and causing siltation of soil by inundating the land with
runoff water.6. Killing rare birds, animals, and wildlife by draining swamp-like lands for
water supply or for other purposes.7. Causing fires or explosions by improperly stored building materials, oil,
etc.8. Breeding disease carriers (rats, mosquitoes, flies) by storing decomposing
organic matter and liquid sludges.9. Contaminating groundwaters and surface waters by leaching and runoff
during rains from accumulations of stored metals, organic matter and tox-ic sludges.
Soil and mineral erosion which follows certain poor mining practices can lead
to both water and air pollution and a loss of valuable soil materials. For example,siltation of water and dust infestation of air are typical environmental conse-
quences of mining operations.
REFERENCES1. U.S. Council on Environmental Quality, Sixth Annual Report. U.S. Government Print-
ing Office, Washington, D.C. 20402 (December 1975) (pp. 300-303).

Chapter II:Governmental Structures forEnvironmental ManagementPollution recognizes no man-made, governmentally constituted boundaries buttransgresses across city, state, and country borders without regard to its origin orman-made interferences. No method has yet been devised within the given con-ventional structure of political boundaries to control this type of environmentalviolation. It is of great importance to have a good understanding of the variousgovernmental bodies, interests, viewpoints, and potential for solving given prob-lems.
There is a definite need for some form of governmental control of the environ-ment for two major reasons: (a) the environment belongs to no man or industrybut to all mankind and biological life, and (b) mankind has proven unable to con-trol pollution simply on a voluntary or individual basis but has shown depen-dence upon larger groups represented by some form of government for bothguidance and enforcement.
The conventional forms of government can be classified into five (5) catego-ries: local, state (or provincial), regional, national, and international. All of theseforms are based upon some type of well-defined physically-established bound-ary(ies). They are based also on groups of people who are obligated to performin accordance with laws and regulations established within those well-definedboundaries. For example, they are served by separate governmental representa-tives; they pay separate taxation for separate governmental services; and theyare obligated to respond to separate and often quite different laws for operation.As the geographical scopes of these governments broaden from local to world-wide the customs, laws, taxes, and indeed peoples themselves exhibit greaterdifferences. And, lastly, the thinking and ideas of people also differ from govern-ment to government. For example, what one government might deem to be grosspollution another government might consider a normal environmental condition.
Some insight into the general nature and thinking of each type of governmentis necessary in order to understand the problems associated with control of en-vironmental quality. Better understanding will lead to earlier and easier-to-enact governmental regulations and a more effective input to the management
process. This chapter will discuss the various governmental levels involved, aswell as their principal characteristics and roles. In general practice, the adminis-tration of industrial pollution control programs is carried out under the organiza-tion or agency responsible for protection of the environment.
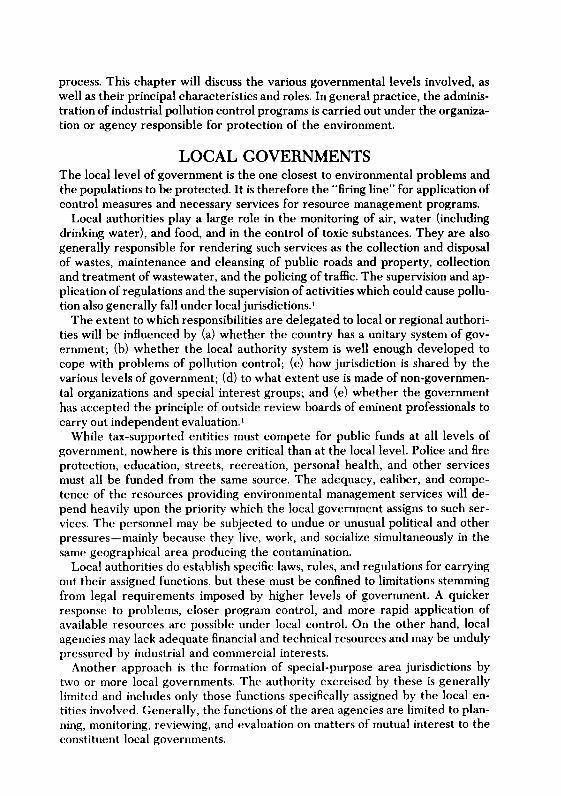
LOCAL GOVERNMENTSThe local level of government is the one closest to environmental problems andthe populations to be protected. It is therefore the "firing line" for application ofcontrol measures and necessary services for resource management programs.
Local authorities play a large role in the monitoring of air, water (includingdrinking water), and food, and in the control of toxic substances. They are alsogenerally responsible for rendering such services as the collection and disposalof wastes, maintenance and cleansing of public roads and property, collectionand treatment of wastewater, and the policing of traffic. The supervision and ap-plication of regulations and the supervision of activities which could cause pollu-tion also generally fall under local jurisdictions.'
The extent to which responsibilities are delegated to local or regional authori-ties will be influenced by (a) whether the country has a unitary system of gov-ernment; (b) whether the local authority system is well enough developed tocope with problems of pollution control; (c) how jurisdiction is shared by thevarious levels of government; (d) to what extent use is made of non-governmen-tal organizations and special interest groups; and (e) whether the governmenthas accepted the principle of outside review boards of eminent professionals tocarry out independent evaluation.'
While tax-supported entities must compete for public funds at all levels ofgovernment, nowhere is this more critical than at the local level. Police and fireprotection, education, streets, recreation, personal health, and other servicesmust all be funded from the same source. The adequacy, caliber, and compe-tence of the resources providing environmental management services will de-pend heavily upon the priority which the local government assigns to such ser-vices. The personnel may be subjected to undue or unusual political and otherpressures-mainly because they live, work, and socialize simultaneously in thesame geographical area producing the contamination.
Local authorities do establish specific laws, rules, and regulations for carryingout their assigned functions, but these must be confined to limitations stemmingfrom legal requirements imposed by higher levels of government. A quickerresponse to problems, closer program control, and more rapid application ofavailable resources are possible under local control. On the other hand, localagencies may lack adequate financial and technical resources and may be undulypressured by industrial and commercial interests.
Another approach is the formation of special-purpose area jurisdictions bytwo or more local governments. The authority exercised by these is generallylimited and includes only those functions specifically assigned by the local en-tities involved. Generally, the functions of the area agencies are limited to plan-ning, monitoring, reviewing, and evaluation on matters of mutual interest to theconstituent local governments.
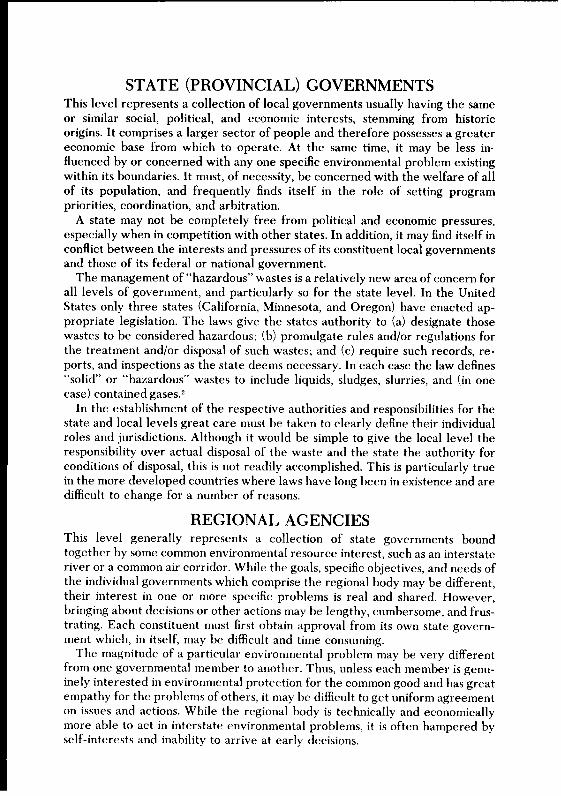
STATE (PROVINCIAL) GOVERNMENTSThis level represents a collection of local governments usually having the sameor similar social, political, and economic interests, stemming from historicorigins. It comprises a larger sector of people and therefore possesses a greatereconomic base from which to operate. At the same time, it may be less in-fluenced by or concerned with any one specific environmental problem existingwithin its boundaries. It must, of necessity, be concerned with the welfare of allof its population, and frequently finds itself in the role of setting programpriorities, coordination, and arbitration.
A state may not be completely free from political and economic pressures,especially when in competition with other states. In addition, it may find itself inconflict between the interests and pressures of its constituent local governmentsand those of its federal or national government.
The management of "hazardous" wastes is a relatively new area of concern forall levels of government, and particularly so for the state level. In the UnitedStates only three states (California, Minnesota, and Oregon) have enacted ap-propriate legislation. The laws give the states authority to (a) designate thosewastes to be considered hazardous; (b) promulgate rules and/or regulations forthe treatment and/or disposal of such wastes; and (c) require such records, re-ports, and inspections as the state deems necessary. In each case the law defines"solid" or "hazardous" wastes to include liquids, sludges, slurries, and (in onecase) contained gases.,
In the establishment of the respective authorities and responsibilities for thestate and local levels great care must be taken to clearly define their individualroles and jurisdictions. Although it would be simple to give the local level theresponsibility over actual disposal of the waste and the state the authority forconditions of disposal, this is not readily accomplished. This is particularly truein the more developed countries where laws have long been in existence and aredifficult to change for a number of reasons.
REGIONAL AGENCIESThis level generally represents a collection of state governments boundtogether by some common environmental resource interest, such as an interstateriver or a common air corridor. While the goals, specific objectives, and needs ofthe individual governments which comprise the regional body may be different,their interest in one or more specific problems is real and shared. However,bringing about decisions or other actions may be lengthy, cumbersome, and frus-trating. Each constituent must first obtain approval from its own state govern-ment which, in itself, may be difficult and time consuming.
The magnitude of a particular environmental problem may be very differentfrom one governmental member to another. Thus, unless each member is genu-inely interested in environmental protection for the common good and has greatempathy for the problems of others, it may be difficult to get uniform agreementon issues and actions. While the regional body is technically and economicallymore able to act in interstate environmental problems, it is often hampered byself-interests and inability to arrive at early decisions.

NATIONAL (FEDERAL) GOVERNMENTSThe role of the national government, vis-a-vis the state and local levels, will varybetween countries. Such role is influenced to a large degree by political andsocial factors, constitutional provisions, existing laws, economic and other con-siderations.
Taking individual circumstances into account, therefore, the function of thenational level agency(ies) should be to: 3
1. Advise the government on pollution control policies, particularly in rela-tion to industrial production, energy conversion, transportation, wastedisposal, and urban planning.
2. Develop and propose to the government the environmental quality anddischarge standards that may be applicable on a nationwide scale.
3. Designate environmental quality control regions and approve implemen-tation plans for such regions.
4. Review periodically the categories of substances which are consideredhazardous and whose discharge should be regulated and controlled.Publish manuals and codes of practice for these sources.
5. Establish and administer a permit system for significant sources of en-vironmental contaminants.
6. Establish laboratories and national centers for standardizing analyticaland sampling techniques, evaluating measurement techniques, trainingpersonnel, transferring new technology, and providing the expertise notavailable at state or local levels for solution of specific problems.
7. Conduct, support, and coordinate research and development programs inaccordance with national needs and priorities.
8. Conduct public information programs and publish pertinent annual re-ports.
The need to improve and strengthen all levels within a country for the man-agement of its environment is now readily acknowledged by most nations. En-vironmental policies and measures need to be more closely coordinated withother measures, particularly economic. The balance between central controland decentralization is particularly important in situations where the problemsare local but require support and integration through strong national policies.'
The participation of outside interests at all levels is highly desirable. It is par-ticularly important at the national level, since the policies, laws, regulations, andother aspects will affect the entire national structure, as well as bearing on inter-national agreements and treaties.
INTERNATIONAL AGENCIESJust as uncontrolled pollution does not respect state boundaries, as mentionedearlier, in a similar way it does not respect national boundaries. Over the yearsthis has led to the formation or involvement of organizations or agencies repre-senting two or more nations for the purpose of combining forces in addressingspecific issues.
Several international agencies are currently involved with environmentalissues, either as a principal function or as an important element of their principalmissions. Among these can be included the World Health Organization (WHO),

the United Nations Environment Programme (UNEP), The World Bank, the In-
ternational Atomic Energy Agency (IAEA), and the Organization for European
Cooperation and Development (OECD). Matters relating to location of bound-aries of sea, air, and land in regard to contaminants, origin of contaminants, and
joint means of control are of major importance to these organizations. These andother agencies also involve themselves in such issues as agriculture and food pro-
duction, population control, labor, and meteorology., Appendix D lists several ofthe international agencies from which assistance may be available on problemsrelated to the environment.
These bodies concern themselves with environmental problems common tothe countries involved. Because international diplomacy and politics play a ma-jor role in their actions, matters considered by these organizations are usuallyquite general in nature. Any agreements reached by them must be ratified byeach national government before becoming operative.
Solutions to common problems are developed in general terms, with specificprocedures and quality standards being developed by the countries themselves.Through this approach a higher level of resources can be focused upon prob-lems of sufficient magnitude to jointly affect one or more countries. Because ofindividual national politics and economic interests, the decisions made by theseorganizations can be slow, cautious, and quite conservative.
REFERENCES1. World Health Organization, Health Aspects of Environmental Pollution Control:Planning and Implementation of National Programmes. Technical Report Series 554,Geneva (1974).
2. Newton, M., "Hazardous Waste Management in the States," in Proc. National Con-ference on Management and Disposal of Residues from the Treatment of IndustrialWastewaters, (February 3-5, 1975, pp. 13-16). Available from U.S. Environmental Protec-tion Agency, Washington, D.C. 20460, U.S.A.
3. Parsson, G.A., "Legal and Administrative Aspects," in Manual on Urban Air QualityManagement, ed. by M.J. Suess and S.R. Crawford. World Health Organization RegionalPublication, European Series, No. 1. Copenhagen (1976, pp. 25-33).
4. Science, Technology, and Diplomacy in the Age of Interdependence. Prepared by Li-brary of Congress for Committee on International Relations U.S. House of Representatives,U.S. Government Printing Office, Washington, D.C. 20402 (June 1976).

Chapter III:Criteria and Standards
In order to provide for a safe environment the air, water, and land resourcesmust be maintained at acceptable levels with reference to the discharge of sub-stances or materials which could be termed "hazardous or "toxic." To maintainthese levels will require the installation of treatment devices designed to reduceconcentrations of emissions or discharges to established "safe" levels.
The levels at which specific materials can be safely discharged are designatedas "standards." These will differ from country to country, depending upon ex-posure conditions, the socioeconomic situation, and the priority of the varioushealth problems.
This chapter will present the acceptable levels of specific contaminants, as es-tablished by the international agencies, as well as by one or more specific coun-tries.
AIRIndustrial activities, along with combustion of fuels for heating and energy pro-duction, are the major sources of air pollutants in most locations. The effects ofstationary (or point sources) of pollutants-such as industrial plants-depend ona number of local factors. Among these are topography, weather conditions,stack heights, location, control equipment, raw materials used, and type of pro-cess.
Standards specifying allowable emissions can either be related to industrialproduction or to the quality of the air in the atmosphere surrounding the indus-try. In the former case they are referred to as effluent standards or standards ofperformance, whereas in the latter case they are called ambient air quality stan-dards. The former are more useful for design and control whereas the latter arepreferable for environmental quality measurement and protection. Both areuseful and important in the operation of environmental protection systems.
Effluent StandardsEmission standards provide an allowable level for specified contaminants relatedto specific industries. The allowable level is generally based on the use of en-

vironmental control equipment, good process control, and manufacturing in amodernly designed plant. The omission or absence of any one of these three ele-ments will place undue strain on the other two-often resulting in exceeding theallowable standard. The standard is related to a unit of feed or production froma given industry or in many cases is based upon the volume of gas generated. Ta-ble A-1, Appendix A, presents a summary of emission standards established bythe U.S. Environmental Protection Agency for several industries and pollutants.'
It must be recognized that this type of standard will not necessarily protectthe air from becoming polluted. Nor will it give any direct indication of the levelof contamination existing at any time in the air. It simply provides a working toolfor satisfactory design and operation of abatement programs with the optimummethods available today for these plants.
Certain industrial operations such as power plants, cement production, and in-cinerators which are known to be large contributors to air contamination,regardless of their location, should be required to control their gaseous and par-ticulate emissions to some established level. That level can be ascertained on aplant-by-plant, country-by-country basis, but minimum degrees of emissionsshould be attainable by all plants in any country. Allowable emissions can be ex-pressed in either a quantity of contaminant per unit of production or on an ex-haust gas basis.
In addition to sulfur dioxide (SO2), suspended particulate matter, and oxides ofnitrogen (NOx), industrial air pollutants include lead, cadmium, mercury,beryllium, the mercaptans and hydrogen sulfide, fluorides, chlorine, asbestos,and many other wastes and by-products of technological processes. These sub-stances and/or compounds are the principal ones of interest in any set of estab-lished standards. However, additional substances may be of interest, dependingupon the specific sources.
Ambient StandardsAmbient air standards are designed to limit the final air concentration surround-ing an industrial area or existing in a community. The limit for each type of con-taminant should be based upon the physical, health and other effects of thepollutant as well as the practicability of attaining the level desired. It provideslittle clue for the design for remedial works except when exact mixing ratios ofgas volumes of industry and diluting atmosphere are accurately known. Thelevel of contaminant measured in the atmosphere at any one time is directly re-lated to the method used for sample collection and analysis. Sampling andanalytical procedures are discussed in Chapter IV.
Table III-1 presents the national ambient air quality standards currently inforce in the United States., The U.S. Clean Air Acts requires the setting of bothprimary and secondary standards. Primary standards are based on the healtheffects of the contaminants indicated. Secondary standards are based on so-called welfare effects-ecological, vegetation, visibility, and other similareffects.
It should be noted that the allowable concentration for each contaminantvaries with the exposure time. Shorter exposure times may permit higher con-centrations under selected conditions, but this will need to be determined on acase-by-case basis.

TABLE 1i1-1: U.S. National Ambient Air Quality Standards
Pollutant Averaging Primary Secondarytime standards standards
Particulate matter Annual (geometric 75 Ag/ma 60 pg/mmean)
24 hourb 260 pg/m 150 pg/mSSulfur oxides Annual (arithmetic 80 pg/ma -
mean) (0.03 ppm)24 hourb 365 pg/m3
(0.14 ppm) -3 hourb - 1300;pg/ms
(0.5 ppm)Carbon monoxide 8 hourb 10 mg/m 10 mg/ms
(9 ppm) (9 ppm)1 hourb 40 mg/m3 40 mg/ma
(35 ppm) (35 ppm)Nitrogen dioxide Annual (arithmetic 100 pg/M 100 Ag/ma
mean) (0.05 ppm) (0.05 ppm)Photochemical oxidants 1 hourb 160 pg/M 3 160 pg/ma
(0.08 ppm) (0.08 ppm)Hydrocarbons (nonmethane) 3 hour 160 pg/m 160 pg/ma
(6 to 9 a.m.) (0.24 ppm) (0.24 ppm)
* The air quality standards and a description of the reference methods werepublished on April 30, 1971, in 42 C.F.R. 410, recodified to 40 C.F.R. 50 on July 1,1975.
b Not to be exceeded more than once per year.
Application of StandardsEffluent standards, while quite useful for enforcement purposes and for plant
and equipment operational checks, may often provide environmental quality in-
equities. For example, two similar steam power plants, both discharging the
maximum allowable levels of S02 per million BTU of heat energy, would pro-
duce drastically different effects on the environment if one were located in Los
Angeles, California, and the other in New York City.Although both are large metropolitan areas, Los Angeles is located in a bowl
surrounded by mountains, and subjected to numerous and almost continuous
daily inversions. This limits the vertical mixing and thus the amount of dilution
air available. The high pressure atmosphere which is usually present near Los
Angeles also helps to bring in and hold warm air currents which keep a "lid" on
the contaminating city gas vapors. New York City gases, while just as con-
taminating, generally rise unimpeded and are diluted with ample fresh air. Since
these power plants are needed equally in both cities, it is obvious that local stan-
dards would be desirable to supplement national standards in order to protect
the air quality in specific locations. In effect, this is done in many cases. For ex-
ample, Los Angeles and New York City have their own air quality control stan-
dards, which provide limits of industrial operation at certain predetermined
levels of contaminant concentration.In cases where air crosses international boundaries, it may be necessary to
make special provisions in the effluent standards in one or both of the countries
involved in order to coordinate ambient air quality level requirements for the
common border. This can only be determined by examining the standards of

each country, studying the meteorological conditions which prevail on theborder, and either mathematically computing or physically measuring (em-pirically) the resulting border-crossing contaminant levels in the air at variousgiven effluent standard levels.
It is extremely important in the application of standards to be aware of con-taminant levels prior to the introduction of new sources, particularly in situationswhere there is little or no pollution of the air from man-made sources. For thispurpose a background survey, covering at least six months of sampling and anal-ysis, should be conducted before new sources are added to a particular area orregion. This information will also prove useful in enforcement procedures. TableA-2, Appendix A, lists ranges in levels of selected contaminants which can be ex-pected in uncontaminated areas, as well as levels which may be hazardous tohumans.,
WATERIn general, the water quality can be controlled by either or both of two meth-ods: (a) stream standards or (b) effluent standards. Although the ultimate goal isto raise the quality of the receiving waters to the optimum for its best usage, it issometimes easier to accomplish this by requiring each polluter to discharge onlya given quantity of contaminant or a given concentration with a stipulated totalvolume of wastewater. Many agencies, particularly at the state level, ascertainthe best uses of a stream and assign certain quality standards to each use. Anypolluter found adding contaminants in such quantities as to contravene thesestream standards is cited as a violator and must then abate the pollution.
A more recent trend is to establish the receiving water quality desired and at-tempt to maintain this quality by controlling each waste discharge to the mini-mum contaminant units per unit of production or per capita. The latter is gener-ally determined industry-wide from an analysis of effective treatment potentialon an economically feasible basis. An example of a stream standards system, asused in New York State, is shown in Table A-3, Appendix A. An illustration of aneffluent standards system, as used by the State of Pennsylvania, is shown in TableA-4, Appendix A.
Nearly all natural waters are "contaminated" in some form or another. Whencompared to a control such as pure or distilled water they could be consideredsubstantially "contaminated." Certain amounts of such substances as calcium,magnesium and iron, are essential to man as well as to aquatic life, and pure ordistilled water does not contain any of these nutrients. The discharge of wastesgenerally raises these levels and may add other substances, thus interfering withthe use of the waters for water supply and other legitimate purposes. Uncon-taminated waters are generally classified as soft or hard, depending upon theconcentrations of dissolved minerals. "Typical" analyses of such waters are pre-sented in Table A-5, Appendix A.
It should be emphasized that the terms "typical" and "contaminated" are rel-ative and will vary greatly depending upon local conditions and other relatedfactors. The levels given in Table A-5 should be considered only as order-of-magnitude levels for waters receiving no substantial waste loads from man-madesources.
Caution should be exercised when categorizing natural waters as contami-nated or uncontaminated. The characteristics of natural waters vary widely with

location and other influencing factors such as climatic conditions, topographyand geological formation.
Stream StandardsThe main advantage of the stream standards system is the prevention of ex-
cessive pollution regardless of the type of industry or other factors, such as the
location of industrial areas and municipalities. It also allows the public to estab-lish goals for present and future water quality. Loading is limited to what thestream can assimilate, and this may impose a hardship on an industrial plant lo-cated at a critical position on the stream. On the other hand, pollution abate-ment should be as carefully considered in decisions concerning the location of
the plant as those on labor, transportation, market, and other elements.The distinction between criteria and standards is important, and the words
are not interchangeable nor are they synonyms for such commonly used terms as
objectives or goals. The definition of criteria may be considered to be "the scien-
tific data evaluated to derive recommendations for characteristics of water forspecific uses."
As a first step in the development of standards it is essential to establish scien-
tifically based recommendations for each assignable water use. Establishment ofrecommendations implies access to practical methods for detecting and measur-ing the specified physical, chemical, biological, and aesthetic characteristics. In
some cases, however, less than satisfactory methods are available, and in other
cases, less than adequate methods or procedures are used. Monitoring the essen-
tial characteristics can be an operation concurrent with the identification step. Ifadequate criteria for recommendations are available, and the identification and
monitoring procedures are sound, the fundamentals are available for the estab-
lishment of effective standards. It is again at this step that political, social, and
economic factors enter into the decision-making process to establish standards.,Internationally applicable water quality standards exist only for drinking
water. These have been developed by the World Health Organization, and have
been adopted in whole or in part by a number of countries as a basis for formula-
tion of national standards., These standards represent minimum acceptablelevels and are considered to be within the reach of all countries throughout the
world. They identify five classes of water quality parameters-biological pollu-
tants, radioactive pollutants, toxic substances, specific chemical substances that
may affect health, and characteristics that may affect the acceptability of water.In addition the WHO has also issued guidelines for surveillance of drinking
water quality in developing countries.'As to stream standards for drinking water and other uses a very useful and
comprehensive compilation of relevant information has been developed by theU.S. Environmental Protection Agency., Recommended criteria are presentedfor recreation and wildlife, public water supplies, freshwater aquatic life and
wildlife, marine aquatic life and wildlife, agricultural uses of water, and in-
dustrial water supplies. The report covers a very wide range of physical condi-
tions and contaminants, and includes extensive background information on thebases used in arriving at the recommendations presented. The 1972 edition hasrecently been updated for those contaminants on which new information hasbecome available.
Effluent StandardsThe effluent standards system is easier to control. No detailed stream analysesare needed to determine the exact amount of waste treatment required. On theother hand, unless the effluent standards are periodically upgraded this systemdoes not provide long-term effective protection for an overloaded stream.Effluent standards are frequently based more on economics and predictability oftreatment than on absolute protection of the stream; the best usage of thestream is not always the primary consideration. Rather, the usage of the streamwill depend on its condition after effluent standards have been satisfied. In suchcases, upgrading and conservation of natural resources are somewhat neglectedin favor of industrial economics.
Under its statutory authority, the U.S. Environmental Protection Agency is de-veloping effluent limitation guidelines and standards for various industrialcategories., These will govern the amount, and the chemical, physical, and bio-logical characteristics of effluents that industry may discharge to the nation'swaterways.
Initially, 28 industrial categories were designated for development of stan-dards. Another 18 categories were added later. Economic impact analysescovering each category, based on the established limitations, are being includedas part of the studies. Regulations have been promulgated to cover most of thedesignated categories. 0
As an aid to enforcement of the law, the Environmental Protection Agency hasestablished a National Pollutant Discharge Elimination System (NPDES). Underthe system, all manufacturers, among other dischargers, are required to obtainpermits for release of their wastes into watercourses based on the guidelines es-tablished by the agency for each major industry.
It is often appropriate to use a combination of effluent and stream standards-effluent standards to aid in measurement and assist industry in operation, andstream standards to protect receiving waters for their best usage. The latterstandards should govern the level of effluent standards for industry.
Application of StandardsBecause of the nature of each type of industrial process, a different quantity andcharacteristic waste will be produced. The degree of contamination caused byeach industry will be a function not only of the nature of the waste but also ofthe character and intended use of the receiving body of water. As defined pre-viously, water pollution is simply the addition to water of contaminant(s) in suchquantities as to render the water unsuitable for its classified and established bestuse.
The more localized the governmental domain, the more the governmentprefers standards in order to protect the quality of its own nearby watercourses.For international purposes, governments are interested largely in uniformity andease of administration of systems to effect the same protection, and hence tendto prefer some type of effluent standard. Once again, since all levels of govern-ment must be satisfied in matters of pollution control, industry should plan onmeeting both types of standards during manufacture of any product.
It is not the intent of this publication to quantify acceptable levels of industrialeffluents for each specific industrial product. For this information, the reader is

referred to specific data in the literature for the particular industry of interest,such as the EPA effluent standards previously cited.
LANDSolid waste disposal standards or resulting land use standards are extremelyvariable from one locality to the next, depending mostly upon the availability ofsufficient land, density of the population, and concern of the citizens for protec-tion of environmental quality. Although national codes and requirements to ahigh degree influence performance standards in local operations, the latter aredominated by municipal laws. Municipal laws often are confusing, unenforce-able, and conflicting.
No system of guidelines is known to date which would provide predictions ofquantity and quality of solid wastes produced by specific industries. Certainbasic considerations should be evaluated, as discussed below.
There exist no actual qualitative values for "uncontaminated" land. There areonly generalizations for land specifications for various uses, and these are gener-ally suitable for application to the disposal of solid wastes from industry. Suchland should have the following characteristics to be considered as being in anuncontaminated state:
1. Relatively close to the industrial plant and reached by wide roads whichpreferably only pass through industrial areas.
2. Soil of the sandy or silty loam type with only small (less than six inches indiameter) rocks.
3. Ample depth to bedrock.4. Unfractured bedrock which would allow leachate to escape under the
filled area.5. Ample depth to groundwater.6. Uncontaminated groundwater flowing under the filled land in a direction
away from habitation and critical water uses such as drinking, recreationor fishing.
7. No detectable odors from decomposing matter.8. No leachate from the land regardless of the quality.9. No open burning, and firebox burning only after a permit which validates
compliance with air quality standards.
Although experts do not agree on the specific definition of an uncontaminatedland suitable for use as a landfill site for solid wastes, some parameters of boththe land and the industrial solid waste to be placed on it have been suggested forconsideration. They include:
1. Infiltration potential2. Bottom leakage potential3. Bottom soil filtration capacity4. Adsorptive capacity within the soil5. Organic content of the groundwater6. Buffering capacity of groundwater7. Travel distance (leachate to the sea)8. Groundwater velocity9. Prevailing wind direction, and

10. Population near site.
All of the above parameters should be evaluated, and either an objective or sub-jective measure of the land's status as related to its use for solid waste disposalpurposes should be made.
REFERENCES1. Chaput, L.S., Federal Standards of Performance for New Stationary Sources of AirPollution-A Summary of Regulations. J. Air Pollution Control Association, 26, 11,1055-1060 (November 1976).
2. U.S. Council on Environmental Quality, Seventh Annual Report. U.S. GovernmentPrinting Office, Washington, D.C. 20402 (September 1976) (p. 215).3. Public Law 90-148, Air Quality Act of 1967 (November 21, 1967). U.S. GovernmentPrinting Office, Washington, D.C. 20402.
4. Pollution Control Technology. Research and Education Association, 342 MadisonAvenue, New York, 1.Y. (1973).
5. U.S. Environmental Protection Agency, Water Quality Criteria-1972. PublicationEPA-R3-73-033. U.S. Government Printing Office, Washington, D.C. 20402 (March 1973).6. World Health Organization, International Standards for Drinking Water. 3rd Edi-tion. Geneva (1971).
7. World Health Organization, Surveillance of Drinking Water Quality. Geneva (1976).8. U.S. Environmental Protection Agency, Quality Criteria for Water. U.S. GovernmentPrinting Office, Washington, D.C. 20402 (July 1976).9. Public Law 92-500, Federal Water Pollution Control Act Amendments of 1972. (86Stat 816). U.S. Government Printing Office, Washington, D.C. 20402.
10. U.S. Environmental Protection Agency, No Small Task: Establishing NationalEffluent Limitation Guidelines and Standards. U.S. Government Printing Office, Wash-ington, D.C. 20402 (June 1976).

Chapter IV:Sampling and AnalyticalProceduresA major element of any program for management of the environment is the basic
information on the source, nature, levels, and the concentrations resulting in the
medium to which discharged, following mixing and absorption.
This chapter will discuss sample collection and scheduling, collection and
measuring equipment, and analytical methods commonly used to identify and
quantify individual pollutants.
AIRThere are two general applications in monitoring air contaminants-emission
source testing and atmospheric monitoring. In both cases the location of moni-
toring devices, the type of equipment, the duration of sampling, and pollutant
discrimination are of paramount importance in quantitatively appraising air
quality. Furthermore, these considerations require an intimate knowledge of the
emission source(s), background pollution, meteorology and topography of the
area under study, and other pertinent factors.
Source MonitoringSource testing requires a relatively elaborate set of measurements to establish a
starting or final contaminant condition. Because industrial processes involve fre-
quent cyclic changes, the timing of source testing or monitoring must be planned
accordingly. Process operations should be carefully reviewed so that individual
polluting substances and classes of pollutants can be identified. Fluctuations of
peak loadings must be determined and thus predictions of process peculiarities,
such as equipment-caused effluent and temperature variations, are possible. All
the variables of source testing must be accounted for so that the final pollutant
analysis will be representative of the entire source process.
Most sampling devices consist of a vacuum source, a metering device for
measuring air volume, an inlet tube, a collection device (usually a filter or
cyclone followed by impingers), an overflow trap, a manometer and ther-
mometer. All of these essential components must be constructed of materials

which are chemically resistant or abrasion-resistant to the composite air volumebeing sampled. The types of collection devices vary, depending on the collec-tion efficiency needed and the type of contaminant being sampled.
The first step in source sampling is the determination of the gas flow ratethrough a stack or the exhaust port where pollutant monitoring will take place.The approximate range of air velocity must be known before sampling pro-cedures can be instituted. To accomplish this, a wide variety of instruments areused, the standard pitot tube being the most common. Other instruments usedfor measuring flow rates are the rotating vane anemometer, swinging vaneanemometer, double pitot tube heated thermometer anemometer, and the ther-mal anemometer. However, all of these instruments have limited application,depending on the type of source to be monitored.
The methods most commonly used in particulate contaminant sampling are:Principle Collection Device
Filtration Fiber filtersSalicylic acid, naphthalene-
packed containersGranular filters
Controlled pore filtersHigh-volume samplers
Impingement Wet impingersCascade impactors
Dry impingersSingle-jet impactors
Sedimentation Sedimentation in stagnant airThermal precipitators
Centrifugal Force Cyclones
Precipitation Electrostatic precipitatorsThermal precipitators
For gaseous contaminant sampling the collection methods most commonlyused are:
Principle Collection Device GasAbsorption Midget impinger (Water) Ammonia
(Chemical)
Impinger (Water) Sulfur dioxide
Fritted Glass Scrubber Hydrogen sulfide(Sulfanilic acid, etc.)
Adsorption Carbon Column NitrogenCarbon dioxideHydrogen sulfideSulfur dioxide
Condensation or Gross sample ofSuccessive Cold all the pollutingTraps Freeze-out gas constituents
The most common method of emission source sampling is by taking grab sam-ples, using a sampling train. Continuous sampling is usually done only on selectprocesses where the potential emissions are very substantial, such as largepower plants. More recently, automatic optical smoke density meters have been

developed to collect and quantitatively analyze particulates in a combined pro-cedure. In short, an instrument, such as the bolometer, measures the extinctionof a light beam across a fixed distance within the stack or vent itself. This methodhas essentially replaced, in some locations, the use of opacity estimates byRingleman Charts. However, these charts are still useful for developing coun-tries. Gas sampling requires separation of the gas or gases being sampled fromother gases present in the air stream. The temperature and pressure conditionsunder which the sample is collected must be accurately noted.
In summary, gases emitted from stacks are collected by suitable absorbents, orin a freeze-out trap, or by bubbling them through a suitable absorbing fluid. Thegases more commonly analyzed include carbon dioxide, sulfur oxides, nitrogenoxides, organic vapors, and halogen compounds. In recent years the use of opti-cal systems has permitted in situ or remote analysis by infrared absorption forparticular gases. This makes the analysis of gas compositions from emittingsources practical because gas sampling procedures are eliminated and gas con-centrations are thus determined under optimum conditions.
As indicated above, there are numerous approaches to quantitatively collect-ing source samples of air contaminants. A review of the various combinations ofdevices and techniques and their inherent limitations in current literature is re-quired. This will assure the application of the optimum sampling method for ageneral range of factors, such as greatest reliability, minimum cost, minimizationof required personnel skills, ease of access and duration of sampling for eachspecific sampling situation.
Atmospheric MonitoringMonitoring of the atmosphere requires the establishment of an air monitoringnetwork to supply the aerometric data necessary to support air pollution pre-vention, control and abatement activities. At the same time, it should consumethe minimum amount of financial and manpower resources. The first step in es-tablishing an air monitoring network is to determine the use of the aerometricdata, collection devices available, the limitations of the sampling procedures andequipment, what pollutants must be monitored, location of pollutant monitors,and the duration of monitoring. The very nature of the air pollution problemvaries widely from area to area, depending upon the peculiarities ofmeteorology, topography, source characteristics, and legal and administrativesituations.
The location of atmospheric monitors is determined from the use to be madeof the data or the specific contaminants under scrutiny. In every case, the ap-proximate location of a monitoring site is decided on the basis of meteorologicalconsiderations, a rough source inventory, location accessibility, availability ofspace, and needs for electric power and security. Site selections should be madeon the basis of (a) source-oriented monitoring for enforcement purposes; (b)zone of highest actual or projected pollutant concentrations; (c) backgroundstudies where industrial development is imminent; (d) areas of high populationdensity; and (e) background studies in areas where further industrial develop-ment is not imminent.
The decision as to which pollutants must be monitored depends on the dataneeds as defined by the source inventory. In most cases, it is necessary to set

priorities because of resource limitations. Pollutants to be monitored should beselected on the basis of their (a) representing a definite hazard; (b) possibility ofbecoming hazardous to the public health and welfare at some time in the nearfuture; and (c) being controlled by existing or proposed standards. A monitoringnetwork is normally continuous. However, the monitoring duration is usuallygoverned by the use to be made of the data, financial resources and statisticalvalidation.
The instrumentation which should be employed for air monitoring consistssimply of variations of the devices described above in the discussion on sourcemonitoring. The recommended choice of instruments for the indicated pollu-tants are:
Pollutant Sampling DeviceTotal suspended particulates High volume samplerHeavy metals Dust fall jarsCarbon dioxide Non-dispersive infrared analyzerHydrocarbons Flame ionization monitorsSulfur oxides Chemical absorption method or
flame ionization monitorNitrogen oxides Chemical absorption method
Instruments which employ these techniques are frequently specified inpublished standards. Wet chemical methods should be avoided wherever andwhenever possible in the case of pollutants for which standards have not beenestablished. Instruments which are commercially available should be purchasedon the basis of reliability rather than cost.
As a guide, a typical atmospheric monitoring program would include:* Monthly Samples (all stations)
0 Dustfall: trace substancesO Composited daily high-volume sampler filters: trace sub-
stances and total suspended particlesEl Sulfation plates
* Twenty-four Hour Samples (all stations)O High-volume sampler: suspended sulfates and nitratesO Cyclone sampler: respirable particulates and trace substancesEl Integrated gas bubbler: sulfur dioxide
* Continuous SamplesO Automatic data acquisition with magnetic tape storage:
S02 (coulometric method)NO and N02 (coulometric method)Hydrocarbons (flame ionization)Ozone (chemiluminescent method)
* Meteorological SamplesO Hygrothermograph (temperature and relative humidity)l Wind speed and direction

Analysis of Air ContaminantsIn general, the methods of analysis for sootfall and dustfall, suspended particu-
late matter, gaseous pollutants and organic pollutants fall within some or all of
the following categories:
* Chemical methods: A sample pollutant collected by chemical ab-
sorption is analyzed by appropriate titrimetry.
* Physical methods:
O Spectrophotometry-A sample of pollutant is collected bychemical absorption and an appropriate reaction is allowed to
occur which produces a solution color change. This solution isthen measured colorimetrically or spectrophotometrically and
compared to standards of the same solution.
O Thermal Conductivity-The concentration of gases can bedetermined by measuring the thermal conductivity of the sam-ple gas as compared to that of a known reference gas.
O Chromatographic Analysis-Essentially all of the pollutinggases may be collected in a chromatographic column. Thedifference in the mobility or the diffusion rate of the compo-nent gases in the mixture is a function of the molecular struc-
ture of the gas. Selection of a suitable detector from thermalconductivity, flame ionization, and electron capture methodsdepends on the composition of the gases to be analyzed.
O Mass Spectrometry-The instrumental technique is the bom-bardment of atoms or molecules to be analyzed with electrons,ions or ultraviolet light, causing ionization. The instrumentthen measures the quantitative dissociation by spectral analy-
sis.
El Biological methods: Bacterial cultures of organic contaminants
and monitoring of respiration rates as a correlation of the
quantity of organic pollutant.
O Gravimetric methods: Weighing or counting particulates.
There are many variations to these basic methods, depending on the specific
atom or molecule of interest. Consequently, the most recent literature on
laboratory methods covering the contaminants of interest should be carefully
reviewed and evaluated for application to the problem at hand.
Mass Quantity ComputationsIn order to achieve international standardization and comparability, the results
of air pollution measurements should be expressed in CGS units. Under this
system, the concentration of pollutants is reported in terms of mass per unit vol-
ume at a standard temperature and pressure. The standard pressure of 760 mm
of mercury (Hg) and the temperature of 00 Centigrade (Celsius) should be
employed. Normally, the concentration of air contaminants is expressed in terms
of micrograms per cubic meter (A g/m').In order to facilitate comparison and coordination of atmospheric sampling
and analysis, both nationally and internationally, the results are generally ex-
pressed as follows:

Alternative orResult Recommended Units Derived Units
Concentration of particle Milligrams per cubic Micrograms per cubiccontaminants (liquid or solid) meter meterof known composition
Concentration of suspended Milligrams per cubic Micrograms per cubicor airborne particulate meter metermatter
Concentration of gases or Milligrams per cubic Micrograms per cubicvapors meter meter
Gas volumes Cubic meters at standardconditions
Volume emission rates Cubic meters per second
Mass emission rates Cubic meters per second
Velocity Meters per second
Air sampling rates Cubic meters per second Liters per minuteor cubic centimetersper minute
Temperature Degrees Celsius ('C)
Pressure Millibars (mb) ormillimeters of mercury
Visibility Kilometers
Light transmission Percentage transmittance(% T)
Light reflection Percentage reflections(% R)
Particle Size MicronsWavelength of light Millimicrons Angstroms (A)
WATERThe composition of industrial wastewaters varies widely, and no truly satisfacto-ry classification system has yet been devised. Hence, the importance of industrialwastewater monitoring cannot be overstressed. Flows are measured to deter-mine the quantity of wastewater being discharged. The combination of flow ratedata with analytical data obtained from laboratory analysis permits the calcula-tion of weight of contaminants being discharged into the receiving stream. Thenext logical step after the amount of contaminants is known is to determine whateffect these contaminants have on the receiving body of water and then finallyestablish some acceptable level of contaminant discharge. Monitoring ofwastewater also facilitates locating major sources of wastes.
Sample CollectionThe location of a monitoring station should he selected such that the flow condi-tions will have achieved, as closely as possible, a homogenous mixture. Thevelocity of flow at the sampling point should, at all times, be sufficient to preventthe deposition of solids, thus assuring the collection of a well mixed representa-tive sample. Homogenous flow conditions normally exist after channeling all flowat a weir, Parshall flume or hydraulic pump. A free-falling discharge from a pipe

is also an excellent sampling location. A sampling point of approximately one-
third the wastewater depth from the bottom and as near to the center of flow as
possible is recommended for monitoring flows in sewers and channels.Types of equipment for the monitoring of industrial wastewater contaminants
vary from manual to automatic type devices. The selection of the appropriate
sampling equipment is dependent mainly upon the type of sample desired,
either "grab" or "composite."A "grab," also known as a "catch," sample consists of a portion of wastewater
taken at one time in a random fashion. Such samples are generally collected
manually, and reflect the conditions and characteristics existing at the time of
collection."Composite" or integrated samples consist of portions of wastewater taken at
regular intervals of time and combined to produce one final volume of sample.
Composite samples tend to level off peaks and represent average conditions
over the sampling period. A common sampling time interval is hourly during
operations. Shorter time intervals may be required if plant operations are ex-
tremely variable.Samples may be composited on the basis of time or flow. Those composited on
the basis of time are made up of constant volumes collected at even time inter-
vals, regardless of the rate of flow. Those composited on the basis of flow consist
of portions proportional to the flow rate at the time of collection, but at even
time intervals. Thus, high flows would demand a higher proportion of sample,
and vice versa. Composite samples are either collected manually or auto-
matically. Automatic sampling equipment is available commercially for collect-
ing samples on the basis of flow or time. Detailed information on automatic sam-
pling devices is available in published literature.'The duration of sampling will be governed by the objectives of the monitoring
program and the operating schedule of the industry. Samples should be col-
lected over the entire day's operations, and continuous monitoring may be desir-
able. An industrial waste survey should be conducted for at least five consecu-
tive days, but a two-week period is often recommended. Seasonal variations in
production levels should be considered.The quantity of samples to be collected varies with the extent of laboratory
analysis to be performed. A sample volume between two and three liters is nor-
mally sufficient for a fairly complete analysis. The total number of samples will
depend upon the objectives of the monitoring program. The use of a few
strategic locations and enough samples to define the results in terms of statistical
significance is usually much more reliable than using many stations with only a
few samples from each.
Flow MeasurementsFlow measurements play an integral part in the monitoring of wastewater con-
taminants. The selection of a method for measuring flow will depend upon the
facilities available, the degree of precision required, and the conditions under
which the waste is discharged. Some of the more common methods for deter-
mining rates of flow include:
* Container and Stopwatch-The time required to obtain a knownvolume of wastewater in a container is measured and thus calcula-

tions of volume per unit of time can be made. This method appliesbest to sewers or outfalls where free fall occurs and where flowsare small.
* Weirs-A weir acts like a dam or obstruction, with the waterflowing over the dam or through a notch cut in the dam. Thenotch is normally rectangular or V-shaped. The crest on the weiris defined as the level to which the water must rise before it cango over the weir and is either the top of the dam or the bottom ofthe notch cut into the dam. The head on the weir is the height ofthe water surface in the pool upstream from the weir above thecrest. Knowing the type of weir (rectangular or V-notched) andthe head upstream from the weir, calculations of rate of flow involumes per second are a relatively easy task with the appropri-ate formula. The triangular or V-notch weir gives greater headsfor a given discharge than does the rectangular notch of the samewidth of water surface. This greater sensitivity of the V-notch isuseful in measuring relatively small rates of discharge. For dis-charges above 900 gallons per minute (3.35 m3/min) rectangularweirs should be used. Both rectangular and V-notch weirs aremost commonly constructed of steel.
* Parshall Flumes-A Parshall flume is useful when there is a needfor continuous measurement of open channel wastewater flows ator near the ground surface. The Parshall flume is a permanentstructure made of metal, concrete or wood. It-consists of a con-verging section, a throat and a diverging section. The floor of theconverging section is level but the floor of the throat is inclineddownward from the horizontal and the floor of the diverging sec-tion is inclined upward at a definite slope from the horizontal.Because the throat width is constant, the discharge can be ob-tained from a single upstream measurement of depth under freeflowing conditions. Flow under submerged conditions requiresseveral measurements of head at various locations for the deter-mination of flow rate. Maintenance of the unit is minimal due to itsinherent ability to clean itself. The hydraulic head loss is alsominimal. It is not recommended for small flows. More detaileddiscussions on weirs and Parshall flumes will be found in varioustexts and handbooks, such as Lund, and Metcalf & Eddy.2
* Venturi Meters-This type of flow measuring device is installed inclosed conduits or pipelines under pressure. It consists of a throatcarefully machined to a specific diameter, a converging sectionwhich tapers from the pipeline to the throat and a diverging sec-tion from the throat to the pipeline. Taps are provided formeasuring the pressure head. The only measurements necessaryto compute the rate of flow, by formula, is the difference inpressure head between two tap points. Considerable loss of headis experienced through the Venturi meter. For additional infor-mation on the theory and operation of Venturi meters see Mancy3
and others.

* Orifice Meters-These are often used to measure flows in closed
pipes. They have a sudden reduction in the pipe diameter, caus-ing a change in pressure which is equated to the flow. These
meters result in significant head loss in the system and therefore
their use is limited.
* Velocity Meters-These are also known as current meters. They
are usually used to measure stream flows but may be employedfor the determination of the velocity of flow in large sewers or
open channels. They consist of a rotating vane and cup arrange-ment, with a sounding component by which velocity is measured
according to the revolutions of the submerged cups. Combining
the velocity measurement with a calculation of cross-sectionalarea results in the rate of flow or discharge per unit of time.
* Magnetic Flow Meters-These consist of a non-magnetic tube of
the same diameter as the pipe in which the water or wastewater is
flowing and across which a magnetic field is established. Water or
wastewater flowing through the magnetic field produces a
voltage proportional to the velocity and is converted by electrical
and mechanical means to indicate rate of flow.
Analysis of Water ContaminantsOne of the basic objectives in the monitoring of industrial wastewaters is to
determine the loading or quantity of contaminants discharged into the receiving
body of water. Two essential components for computing contaminant loadings
are the rate of flow and the concentration of contaminants in the wastewater.
Some of the more common techniques for determining flow rates have been dis-
cussed above.Techniques and methods for the qualitative analysis of wastewater contami-
nants are of four basic categories: chemical, physical, biological and biochemi-
cal.
* Chemical techniques generally utilize titration, precipitation or
chemical reaction.
O Titration involves the measurement of a volume (volumetric
analysis) of a known concentration (standard solution) that isrequired to interact exactly with the desired chemical compo-
nent or another substance chemically equivalent to it. Titra-tion proceeds to a definitive end point, normally to either a
color change or some electrical meter response. For example,acidity and alkalinity are determined by titration with a stan-
dard basic or acidic solution, respectively.
O Precipitation techniques are applied by converting the desired
chemical component to an insoluble product. Probably the
best example of a precipitation determination is the chloride
ion (Cl) determination with silver nitrate as the standard
titrant, converting the chloride ion to an insoluble white pre-
cipitate which is then weighed for quantitative analysis.
O Chemical reaction techniques vary in complexities, rangingfrom the addition of simply one chemical reagent to the com-bination of many compounds to produce the desired chemicalcomponent. For example, the dissolved oxygen determinationcalls for the addition of three reagents followed by a titrationwith standardized sodium thiosulfate. The addition of thereagents converts the oxygen to an equal amount of iodine andthen becomes appropriately titrated.
* Two commonly-used types of physical methods of analysis ofwastewater are filtration and adsorption.l Filtration of precipitates and solids is accomplished by passing
the wastewater through a standard size filter mat (asbestos orglass fil7ms are commonly used). The suspended solids determi-nation is an example of this filtration principle. A known vol-ume of sample is passed through a special crucible, with thefilter mat placed inside the crucible. The filter retains sus-pended particles and allows for the passage of liquid. The re-tained particles are weighed and thus a calculation of weightper unit volume (milligrams per liter) can be made.
O Adsorption techniques using activated carbon for the detec-tion of low but significant quantities of organic compounds arefrequently used. The determination of phenols by the carbonchloroform extract (CCE) technique calls for the passing of acolumn of water through a carbon adsorption unit; the carbonis then removed, dried, and the contaminants are extracted bywashing the unit with chloroform and collecting the washingsfor weighing or further instrumental analysis. Another adsorp-tion technique, which is a relatively new method of analysis, isatomic adsorption spectrophotometry. A sample solution isatomized into a flame, producing atomic vapors of the elementin question. These are measured by passing a monochromaticlight of the same wavelength through the vapor in the flame.Atomic adsorption spectrophotometers are relatively expen-sive instruments but are excellent for the determination oftrue quantities of elements such as copper, iron, magnesium,nickel and zinc.
* Biological methods for wastewater analysis include culturingtechniques for bacteria and microscopic analysis. Pathogenic (dis-ease-carrying) organisms may originate not only from humanswho are infected but also from industrial plants such asslaughterhouses and tanneries.
Because the number of pathogens present in a wastewater arefew and difficult to isolate, the coliform organism is used as the in-dicator organism. There are two accepted methods of testing forthis group: the Most Probable Number (MPN) test and theMembrane Filter (MF) technique.4

The MPN method is based on a statistical analysis of the num-ber of positive and negative results obtained by inoculating multi-ple portions of equal volume of culture medium with portions ofsample, to constitute a geometric series. The result is a statisticalestimate of the concentration of organisms present in the sample.
The MF technique is accomplished by passing a known volumeof sample through a membrane having microscopic pore size,such that the bacteria are not passed through and are retained onthe filter. The membrane containing the bacteria is next con-tacted with a moist agar medium, and incubated for a specifiedtime under prescribed conditions of temperature and humidity.The resulting culture is then examined, and a direct count is ob-tained of the bacteria present in the sample.
For developing countries the membrane filter has three majoradvantages: (1) results are obtained by a direct reading; (2)results are available within 24 hours, versus 48 hours or more byother methods; and (3) portable field kits are available for com-plete sampling and testing on site.
0 Probably the most important biochemical method of analysis isthe biochemical oxygen demand (BOD) determination. This testis used for determining the oxygen requirements for the decom-position of organic matter in trial wastewaters under specifiedconditions of time (normally five days) and temperature (nor-mally 20 0C). The BOD analysis is a biochemical method becausethe analysis involves the oxygen consumed by aerobic bacteriaand by the chemical oxidation of reduced compounds such as H2S,N02, and Fe++ that can be oxidized by molecular 02.
Finally, it should be noted that the analysis made on any specific wastewatersample will depend upon the nature of the industrial operation. Determinationsthat may be conducted include:
pH PhenolsAlkalinity and Acidity CyanideTotal hardness CopperChloride ZincSulfate IronPhosphate ManganeseSuspended solids ChromiumVolatile solids NickelTotal solids LeadSettleable solids Biochemical Oxygen Demand (BOD)Total Nitrogen Chemical Oxygen Demand (COD)
For detailed procedures on analytical techniques concerning waters andwastewaters, see Standard Methods,, Mancy and Weber,, U.S. EPA Methodologyand Handbooks,- and others.'.
Mass Quantity ComputationsOne of the objectives of monitoring wastewater flows is to measure the load ofcontaminants discharged per day or per unit of production. To determine these

loadings, the rates of flow and concentrations of contaminants must be known.Methods for determining both of these parameters have been discussed above.Concentrations of contaminants are expressed as parts per million, or kilogramsof contaminant in a million kilograms of water. Milligrams per liter areequivalent to parts per million. Rates of flow are expressed as cubic meters ofwater per day. Computations of waste loadings are made relatively simple bymultiplying the concentration of contaminant times the rate of flow with the ap-propriate conversion factor (i.e., 8.34 when rate of flow = MGD and concentra-tion = ppm or mg/1). Some of the more common units for expressing loadings arekilograms of contaminants per day or kilograms of contaminant per unit(s) ofproduction.
LANDThe production and composition of solid waste has changed substantially in re-cent years because of changing patterns of living, population shifts, and otherreasons. Where once solid wastes were mostly domestic, they are now producedin substantial quantities by industry as well. Solid wastes from industry may posespecial problems such as nondegradability (plastics) and toxicity (chemicalresidues).
Because of the increased importance of solid wastes from the industrial sector,monitoring and analytical methods have been developed for control purposes.The major considerations are discussed briefly below.
Monitoring of Land ContaminantsThe environmental and other impacts on the land disposal site and its environsshould be monitored and complete records maintained at all times. Data to bekept for each disposal site should include:
* Quantitative measurements of the solid wastes handled;* Description of solid waste materials received, identified by source
of material;* Major operational problems, complaints or difficulties;* Vector (a carrier that is capable of transmitting a pathogen from
one organism to another) control efforts;* Dust and litter control efforts; and* Quantitative and qualitative evaluation of the environmental im-
pact of the land disposal site with regard to the effectiveness ofgas and leachate control, including data from leachate samplingand analyses, gas sampling and analyses, ground and surfacewater quality sampling and analyses upstream and downstream ofthe site.
Upon complete filling of the site, a detailed description (including a plan shouldbe recorded with the area's land recording authority. The description should in-clude general types and location of wastes, depth of fill, and other information ofinterest to potential future users or owners of the land.
Analysis of Land ContaminantsChemical, physical, and biological methods previously described are generallyused to analyze the air and water effluents from solid wastes disposal land areas.

In addition, consideration should be given to an analysis of hazardous materialsin landfill areas. Hazardous wastes can usually be classified into four generalcategories:
* Radioactive-such as laboratory wastes, power generationwastes;
* Toxic chemicals-such as metals, pesticides, pharmaceuticals;* Biological-such as antibiotics, pathogens, enzymes; and
* Miscellaneous-such as flammables, explosives, irritants, cor-rosives.
Land disposal of most of these categories should not be permitted in the nor-mal manner with other industrial solid waste. Because it is often difficult toclassify all of the above wastes as definitely hazardous in a landfill operation,some type of waste rating system can be used. The system may include evalua-tion of the waste in terms of (a) human toxicity; (b) groundwater contamination;(c) disease transmission potential; (d) biodegradability; and (e) mobility.
Mass Quantity ComputationsSolid waste quantities are measured in terms of both volume (in) and weight (kgor ktons). The volume is significant from a transportation standpoint and alsofrom a land-occupation consideration when compacted. Volume is measured byrecording the number of a fixed volume hauler while weights of solid wastes arecomputed by scale readings of the hauler loaded weights minus the emptyweights.
Leachates are measured by collecting all drainings from the land area, passingthem through single or multiple weirs to compute the flow and to select samplesfor analyses, and multiplying by the contaminant concentrations to obtain totalweight (kg or kt) of contaminants in a fixed time period. The computations aresimilar to those made on industrial liquid wastewaters.
Land area air contaminant mass quantities are made exactly like those deter-mined in land areas surrounding any industrial plant emitting stack gases.
REFERENCES1. Industrial Pollution Control Handbook, Edited by H.F. Lund, Mc-Graw-Hill BookCo., New York, N.Y. (1971).
2. Metcalf & Eddy, Inc. Wastewater Engineering: Collection, Treatment, Disposal.McGraw-Hill Book Co., New York, N.Y. (1972).
3. Mancy, K.H. Instrumental Analysis for Water Pollution Control, Ann Arbor SciencePublications Inc., Ann Arbor, Mich. (1971).
4. APHA, AWWA, and WPCF, Standard Methods for the Examination of Water andWastewater, 14th ed. American Public Health Association, New York, N.Y. (1975).
5. Mancy, K.H., and Weber, W.J., Jr. Analysis of Industrial Waste Waters, IntersciencePublishers, Inc., New York, N.Y. (1971).
6. Handbook for Analytical Quality Control in Water and Wastewater Laboratories,U.S. Environmental Protection Agency, Washington, D.C. 20460 (June 1972).
7. Handbook for Monitoring Industrial Wastewater, U.S. Environmental ProtectionAgency, Washington, D.C. 20460 (August 1973).

8. Standard Methods for the Water Quality Examination for the Member Countries ofthe Council for Mutual Economic Assistance. Ministry of Forestry and Water Management,in cooperation with the Hydraulic Research Institute. Prague (1968).
9. Analysis of Raw, Potable, and Waste Waters. United Kingdom Department of theEnvironment, H.M. Stationery Office, London (1972).

Chapter V:Treatment Technology
Controlling the discharge of contaminants may be accomplished through a num-ber of techniques, ranging from in-plant changes in production methods to theinstallation of equipment designed to remove or reduce specific pollutants orotherwise change the characteristics of the waste. This chapter will discuss themore commonly used principles and practices applied to the treatment of in-dustrial wastes.
AIRPrior to selection of the technique for removal of contaminants from stationarysource discharges it is necessary to apply certain principles of meteorology andto determine the effect of stack heights on the degree of treatment required.
Meteorological FactorsIn order for air to be put in motion a force is required-thus producing a windeffect. The wind developed is a result of an equilibrium condition between thepressure, rotation of the earth on its axis (Coriolis), and friction forces. Thepressure is created by high or low pressure regions existing in the atmosphere. Inhigh pressure areas, the air moves clockwise while in low pressure areas it movescounterclockwise, both in northern latitudes only. The reverse is true insouthern latitudes. Also, in the northern hemisphere the rotation of the earthcauses a turning of this air flow to the right rather than along lines of equalpressure (isobars). Resultant wind speeds are greater as the distance from theearth's surface increases as a consequence of freedom from the earth's frictioneffect.
The motion of air will exhibit some degree of turbulence-although some-times very slight-depending upon both the character of the ground surface andthe time of the day. The ground surface causes mechanical turbulence and theheating of the earth at different times of the day causes thermal turbulence.Turbulence produces eddies in the atmosphere and eddies are very important inthe dilution of air contaminants. Turbulence will diffuse air contaminants risingfrom the earth in both horizontal and vertical directions. Large eddies oftenresult in large plume motion but little plume dispersion, while the opposite may

be true for small eddies. An eddy about the same size as the plume will cause itsmaximum dispersion and thus reduce air contaminant concentration to a mini-mum.
Wind roses (plots of predominant wind directions and speeds) indicate to theanalyst from which direction the predominant winds are blowing during a givenperiod of time and hence to which direction air contaminants will be carried ini-tially after emission.
Winds created at the ground surface causing mechanical turbulence can begenerated largely by either (a) a mountain-valley or (b) a sea-land situation. Inboth cases, wind currents are caused by unequal heating of the surfaces. As aresult a temperature differential exists between the air over each surface, caus-ing the cooler air to flow toward the rising warmer air. Daytime wind directionsare usually opposite to nighttime ones because of changes in temperature anddifferential cooling rates. The direction of the wind will affect people and matterlocated downwind from sources of air contamination.
Separated flows-caused by physical structures impeding the movement of aplume of air contaminants-often result in a cavity on the downwind side of thestructure. The cavity is an area of little air movement and often contains an in-creased concentration of contaminants.
The temperature change which occurs with altitude plays a great part in themovement of ground air contaminants. As a "normal" occurrence both pressureand temperature decrease with height above ground level. The normal decreasein temperature with height (lapse rate) is -3.5*F/1000 ft or -0.65*C/100meters. For isoentropic cases (atmosphere with a constant heat value as a func-tion of height): the change is -5.4'F/1000 ft or -l 0 C/100 meters.
As the contaminated air rises and encounters lower pressures, it expands, andas it expands it does work on the surroundings. The central air temperature ofthe contaminants then reduces slightly. However, the work process occurs fastand it can be presumed to occur adiabatically (i.e., without heat transfer). Acomparison of the adiabatic lapse rates of both the contaminated rising and ex-isting air temperature will determine the future vertical position and hence con-taminant concentration at any level.
If the two adiabatic lapse rates are exactly the same then the contaminated airwould be at the same temperature, pressure, and density as the surroundings andexhibit no buoyant force (tendency to rise) or gravitational force (tendency toreturn downward). If the contaminated air arrives at an upper elevation at atemperature lower than its surroundings but at the same pressure, it will beheavier than its surroundings and it will sink to a lower level (stable condition).If, on the other hand, it arrives at a higher temperature, it will continue to rise toa higher level (unsteady condition). A stable condition will result in an inversionwhich, in effect, limits the dilution of contaminants with more air. The height towhich mixing of air contaminants with relatively cleaner atmosphere is effectiveis very significant and is often referred to as mixing height.
Stack HeightsA trace of the smoke or other gaseous contaminants emanating from an industrialplant point source is known as a plume. The dimensions (vertical and horizontal)of the plume dictate the relative position and concentration of contaminants at

any time and are directly related to the vertical temperature gradient.Therefore, plume conditions for any stack depend on where the stack is situatedrelative to the local topography and to its position on a national or internationalbasis. In general, stacks in warm, dry climates may result in some inversion con-
ditions in the early morning hours whereas in a damp, cloudy climate inversionsare less frequent. The width of the plume will vary with the time of observation.For short periods it will have a narrow band diffusion, whereas the band widens
over longer periods. However, the maximum concentration still exists at the cen-terline of the plume.
The general problem of the air pollution analyst is to compute the concentra-tion of a given contaminant at some one or more points downwind from the stack
discharge. This can be accomplished by the use of mathematical dispersionequations, based on contaminant discharge level, average wind speed, and effec-
tive stack height.There are, however, limitations to the use of the equations: (1) the diffusion
coefficients are probably only accurate to values of - 50%; (2) the Coriolis effect
has been omitted from the calculations; (3) any deposition or absorption of con-
taminants by physical structures or the ground have been neglected; (4) winddirection and velocity may shift during the plume dispersion time used; and (5)use of diffusion coefficients derived from short-term studies for longer termcomputations leads to some error.
Computation of Required TreatmentTreatment required by any industry must be based upon a comparison of what is
currently being emitted from the plant and what is an allowable emission, based
upon standards for a specific type of plant. If no emission standard for the indus-try has been adopted or recommended, it is necessary to compare once again the
plant's emission with the allowable air standard generally accepted for each
contaminant. The downwind ground level concentrations of contaminants shouldbe computed for every possible wind speed, stability class and downwind dis-
tance. This may require a computer program. However, it is the only means for
determining potentially harmful concentrations under specific atmospheric con-
ditions. If the resulting contamination at ground level exceeds the allowablelimits, some combination of plant process correction, stack height increase, or
treatment must be used to control the excess contaminant.For example, if a copper mining plant emits sufficient S02 from its roasting
operation such that the S02 level downwind at ground level concentration is 490
,Ug/m3 on a daily average under given atmospheric conditions, remedial action
must be taken so as to reduce this concentration to below the allowable 365 g g/
m3 . Background and projected increases in S02 must also be considered.
The percent removal of contaminants depends upon the relationship between
the present and allowable emission. In the above case, the percent removal will
be 490-365/490 = about 25.5%. If a process change is made to accomplish the
25% removal, an exact percentage usually cannot be predicted beforehand. It
can only be estimated and then verified empirically, following the process
modification. If treatment systems such as scrubbers or oxidizers are selected to
solve the excess contaminant problem, the equipment's rated efficiency, at the
maximum plant output, must be compared with that required. The equipment

selected should yield a stated greater efficiency of removal than that required inorder to protect the industry and the environment from unpredictable occur-rences.
Treatment MethodsIt is normally desirable, from a cost standpoint, to remove contaminants bychanging a process or by heightening the stack where emission is occurring. Inmost cases, however, the extent to which the former can be accomplished islimited because of prior commitment of plant capacity, equipment, and labor. Innew plants some improvements in operation can usually be made to minimize oreliminate completely the final treatment of emissions. These are more fullydescribed in a later section. Heightening of the stack is a question of reviewingthe structures and economics involved. More description on the use of this meth-od is given later in this section. When final treatment is needed to meet air stan-dards, gas and/or particulate removal devices are selected. The basic principlesupon which the design and operation of these devices are based are presentedbelow. However, the reader is referred to industrial manuals, specific to each in-dustry, for details pertaining to their use for each particular waste air stream.
Gas Removal TechniquesGases can be purified to remove contaminants by either adsorption, absorption,or some type of chemical process, usually catalytic conversion. When gaseouscontaminants are removed by enmeshing on some surface the phenomenon is re-ferred to as adsorption. This is a physical process depending primarily upon theamount and type of surface exposed to the gaseous vapor contaminant. Sinceodors are generally removed in this manner, the reader may be familiar with ac-tivated carbon filters used in gas masks. When gaseous contaminants areremoved by solution in a liquid, or by soaking up in a solid material, the processused is referred to as chemical absorption. The gaseous contaminants are dis-solved in an excess of ever-present liquid. The efficiency of removal dependsprimarily upon the relative quantities of liquid absorbent and gaseous contami-nant and the means of contact between the two media. The third process is onewhich chemically changes the contaminant, usually in the presence of a catalyst,to an innocuous material which is harmless to the environment. Such a system isgenerally referred to as a chemical conversion or catalytic conversion. Typicalgaseous contaminants which could be removed by the above processes includeS02, N02, and NH3, as well as CO or C02 when necessary. Probably the removalof S02 is currently most important and more common. However, this maychange, and the same general type of processes may be used to remove the othernamed contaminants.
Removal by AdsorptionThe gas to be purified comes into contact with the adsorbent, where selectivecombination of solid and solute occurs on the pore surfaces. The best known ad-sorbents include activated carbon, silica or alumina gel, fuller's earth and otherclays. Usually this can be done by changing the equilibrium conditions and couldinvolve a change in temperature, in carrier fluid, or both. Particulate mattersuch as dust or soot will also be removed from the gas by the absorbent, but itwill plug the pores on the adsorbent surface and be a physical barrier against ad-

sorption. For this reason, the gas should be free of solid particles. A typical reac-tion is:
Activated Carbon + NH3 - Carbon NH3It must be realized that, if this technique is highly successful for removing im-purities with small concentrations in the fluid, it becomes less economical in thepercentage range. It also leaves the operator with the disposal of the same im-purity in the carrier fluid after regeneration.
Removal by AbsorptionGases such as S02 commonly are soluble in alkaline solutions such as Na2CO3,NA2SO3, or NaOH. The absorbed S02 can then be removed in a more concen-trated stream. For example, one system uses the Wellman-Power gas process, asfollows:
H20SO2 + Na2SO3 - 2 NaHSO3
For removal of CO2 from the gas, the following reactions can be used:K2CO3 + H20 + C02 - 2KHCO3C02 + KOH - KHCO3
The regeneration will proceed as follows:heat
2KHCO3 -K2CO3 + H2CO3heat
H2COs -H20 + C02
The sodium acid sulfite is quite soluble and serves to concentrate the S02 from adilute stream (generally only 0.3% maximum in power plant stack gases). Ifdesired, the S02 can be liberated at a later time from the NaHSO by heating it.This results in a concentrated S02 stream of about 10%, suitable to manufacturesulfuric acid. In this way, no S02 wastes contaminate the atmosphere.
Other scrubbing solutions can be utilized, depending upon the gaseous con-taminant being removed and the subsequent disposition of the concentrated andfully exhausted absorbent. The rate of gaseous flow, the quantity of absorbent,and the contact surface exposed to the gas per unit of time are all important con-siderations in the design and selection of equipment of this absorbent type.These processes will give a concentrated flow of gas after regeneration. In thepreceding examples, SO2 can be the raw material for sulfuric acid production,and C02 one of the raw materials for urea manufacturing.
Gaseous Chemical Conversion
The conversion can be a straight chemical reaction, as in the case of removal ofS02 from a flue gas by lime or magnesia. This process is used extensively in theUSA for cleaning the power station stack gases. The problem of solid waste dis-posal remains, however, and is difficult to solve. Sometimes, the reaction willonly proceed at commercial rates if a catalyst is present. This is the case inautomobile catalytic converters where the reaction of NOx with hydrocarbonson a platinum base catalyst produces nitrogen, C02 and H20. The same tech-nique could be applied to a stream of SO2 to produce sulfuric acid. Even more sothan for adsorbents, the gas in contact with the catalyst must be clean physically(no particulates) and chemically (no chemical poisons) to prevent poisoning ofthe catalyst.

Particulate Removal SystemsIt can be expected that there will beparticulates in emissions from vehicles andregional refuse "dump" areas as well as from any industry, as for example, ce-ment, mining, and steel mill industrial operations. Particulate matter in the air isgenerally accepted to be larger than 0.0002A but smaller than 500tt indiameter. Depending upon their size, concentration, and distribution in the air,they result in mists, smokes, dusts, etc. Because of the great range of sizes in par-ticulates and their specific characteristics, there are many potential types ofremoval systems. All depend upon the differential size, density, and electrostaticcharge of particles and their accompanying air molecules. There are five majorremoval systems now in most common use: (1) filters; (2) sedimentation; (3)centrifugal separation; (4) electrostatic precipitation; and (5) wet scrubbers.
FiltersThese are fine-meshed media purposely designed to "trap" or "screen" the par-ticles as they move with the air stream. A typical type of filter is one known as abaghouse. It consists of a number of filter bags very similar to those used in thehousehold vacuum cleaner. Since these filters must be operated continuously, itis necessary to shake loose and remove the mass of particulates which have beenfiltered out. This is accomplished by either vibration of the filters or by scrapingthe filter surface periodically and automatically by a moving surface or by rever-sal of airflow. If the solids are not removed regularly, excessive head loss will de-velop with subsequent reduction in quantities of air emissions which can betreated by the system. The baghouse is an efficient air pollution control deviceand can be used for very small particles.
SedimentationFor emissions which possess a large percentage of particles greater than50 - 7 5 /A, simple gravimetric units can be used for their removal. Sometimes,simple settling is also desirable when preceding other types of treatment such aschemical conversion. This affords protection against malfunctioning or overload-ing of subsequent units designed primarily to remove much smaller particles.The efficiency of gravitational units decreases quite measurably as the size of theparticle diminishes. The diameter of the largest size particle which can beremoved completely by this method is directly proportional to the viscosity ofthe air, the mass velocity of the emission, and the height of the settling chamber,and is inversely proportional to the length of the settling chamber, accelerationof gravity, and the particle density. Settling chambers are only recommendedwhen a better grade of collection, such as a cyclone, is not economically feasibleor when only very large particles are generated.
Centrifugal SeparatorsBy designing a chamber so that peripheral velocities of air and its particles areincreased, it is possible to effect a differential separation leading to subsequentremoval of the separated fractions. Heavier particles tend to be thrown to oneside of such a device while lighter particles and free air molecules move veryrapidly in the center stream and pass in and out of such units without being sepa-rated. Units of this type are commonly called cyclone separators. In order toeffect maximum particle separation in a cyclone unit, the tangential velocity

must be accelerated, which in turn calls for relatively small diameter units. The
use of small diameters leads to magnified pressure drops. This is the major objec-
tion to the use of cyclones, for the high pressure drops require excessive pump-
ing and power costs and/or a multitude of units to handle a given quantity of
emission. The smallest practical diameter of cyclone appears to be about 24 cm.
To obtain efficiencies of greater than 80%, the particle size should not be much
less than 5 - 2 0A in diameter. In general, reducing the diameter of a cyclone by
half will result in about a tenfold increase in head loss. Maximum typical head
loss values are about 1.5 cm of mercury.
Electrostatic Precipitators
When a current is made to flow by a negatively charged center wire and a
positively charged wall collector, the gas near the wire is ionized and the parti-
cles in turn become charged. Once the particles are charged they are drawn by
the electric field surrounding them towards the wall or collector. From there
they are removed by hitting the collector or inclining the collector downward if
the material is to be removed in the form of a liquid. A DC voltage, somewhere
between 20 kv and 110 kv is applied to ionize the particles. For high efficiencies
of removal one must utilize low flow rates of gas, high particulate matter
velocity, and large collector surface areas. These units are quite useful where
particles to be removed are relatively small (in the categories of mists) and
where pressure drops are a major concern. The pressure drop is generally in the
area of about 15% of that of a cyclone separator. However, decrease in efficien-
cy and excessive power costs can develop if solids are not properly removed
from the collector.
Wet Scrubbers
When it is desired to remove particles in the 1-51A size range, either as a
pretreatment for subsequent treatment systems or as the sole treatment, with
high efficiencies, of small particles in gas streams, liquid scrubbing of the gas is
recommended. Although there are a multitude of varieties of design for scrub-
bers, essentially they all consist of a liquid spray (usually water) in contact with
the gaseous emission so as to entrap the particles in the liquid. The simplest form
of a scrubber uses a downward flow of water spray or drops contacting an up-
ward flow of the gas emission.Many types of surfaces, such as spheres, rings, plates, etc., are used to enhance
the contact and subsequent removal of particulates. Sometimes head loss
systems such as venturis are used to increase the turbulence and hence contact
of the gaseous and liquid phases. However, the velocity increase results in in-
creased power costs which must be balanced against the increase in particulate
removal achieved.
Generally Achieved and Acceptable Removal Efficiencies
Many factors must be taken into consideration when selecting equipment for
removal of particulates and chemical gases. Economics or some measure of cost
per unit of contaminant removal is generally the most important criterion used in
arriving at the ultimate decision. However, other parameters which influence
that decision include: particulate or gaseous size distribution; required efficien-
cy; allowable pressure drop at various emission flows; concentration of particles
of gas; capital and operating cost of treatment systems; chemical properties of

gases in emission; final contaminant disposition; and the ability to maintain theequipment operation with reliability.
Redesign of Production Systems
Serious consideration should be given to making industrial processes more en-vironmentally sound before installing costly contaminant removal systems. Thiscan be accomplished by changing raw materials or processes of manufacturing orby reusing materials formerly wasted to the stack emission.
Change of Raw MaterialsThe substitution of oil or natural gas for coal as a fuel for boilers for industrialsteam production or for power production will serve to lessen, if not eliminateentirely, the need for sulfur dioxide removal systems on the waste gas stream.The change is dictated by air quality criteria and local environmentalmeteorological conditions. However, one should balance the normal increase infuel cost against the lower cost of air stream waste treatment required. Some-times it might be necessary only to change from a high contaminant type of fuelto the same fuel with a lower contaminant level. This would eliminate the extracapital cost of the changeover from one type of fuel storage, feeding and com-bustion system. Once again, it may be necessary to pay premium prices for thehigher raw quality of fuels which must be compared to the resultant abatementcosts. In light of recent scarcities of oil and gas this system should be carefullyscrutinized before installation.
Change of Process or OperationIf the possibility exists to alter manufacturing of a product in order to ameliorateenvironmental effects, this should be attempted prior to or in place of final treat-ment. For example, an increase in temperature of combustion of power plants orincinerators will ensure more complete combustion of organic matter. In thisway particulate (unburned) organics can usually be eliminated from smokestackemissions. Nitrogen oxides emitted from the open burning of refuse can bereduced by about 80% by burning the same refuse in a properly designed andoperated incinerator. Also, the utilization of larger chemical operations ratherthan small-batch-type operations will result in greater efficiencies and much lessrelease of by-products in the waste gases unit weight of acid produced, for ex-ample.
Reuse of WastesInstead of discharging stack gases directly to the atmosphere considerationshould be given to the possibility of reusing the gases for a useful purpose. Thismay also make the gases less contaminating to the environment. An example ofthis can be found in the cement industry where shale or limestone is calcined atvery high temperatures to release the C02, impurities, and all forms of boundwater. The gas emissions contain S02 from the fuel combustion as well as someunburned limestone particles (dust). When this gaseous emission is reused to aidin the initial drying of the mineral rock, the amount of S02 and dust can bereduced in the waste gas per ton of cement produced. This is one way in whichheat generated can be conserved and at the same time air pollutants reduced.Reuse may be limited in some cases by the product requirements. Most cements,

for example, have an upper limit of sulfates. Once again, the potential for reusefrom an economic as well as technical basis should be thoroughly investigated.
Increase in Stack HeightAs described earlier in this section, the contaminant concentration at a givenground point downwind from an emission can be reduced considerably by raisingthe point of discharge above the ground. This can be accomplished by construct-ing a higher smokestack. The higher stack costs more money and may also inter-fere with air vehicle traffic and render the environment aesthetically undesir-able. Again, it is necessary to balance the tangible and aesthetic costs of higherstacks against the benefits of lower air contamination resulting from the stackheight increase.
If lower contamination is mandated by law, then it becomes a question ofdeciding between a higher stack or utilizing one or more of the other methodspreviously described for abating air contamination. Economics should play a sig-nificant role.
WATERFor the industrialized countries wastewater treatment and disposal technologiesare well developed. To a considerable degree this is also true of treatment anddisposal of industrial wastewaters. In many instances the techniques suitable fortreatment of domestic or household liquid wastes are also applicable to in-dustrial wastes.
This section will discuss the more commonly used techniques, many of whichare utilized for or have been adapted from municipal processes.
Treatment TechniquesIndustrial waste concentrations may be reduced through in-plant processchanges, discharge to municipal treatment systems, or by on-site treatment de-signed to handle specific contaminants.
Change of Process or Operation
This generally involves a reduction in the volume or strength of a waste throughchanges in the manufacturing process.
Wastewater Volume Reduction
Although reduction of waste volume per se may not result in any less total loadof contaminants in wastewater, it will contain the pollution in a smaller volume.Usually this means less capital expense for waste treatment. Sometimes whenreducing the volume of wastes, the total quantity of contaminants will also bereduced. This is accomplished by incorporating more waste matter in the finalmanufacturing product rather than allowing it to be discharged to streams.Another procedure for accomplishing the same result is to "dry-collect" as muchwaste material as possible from manufacturing machines and operating floorsrather than "hosing" down the same matter into drains. However, this results inan increase of the solid waste disposal problem. Likewise, burning of reclaimedwastes may create an air pollution situation. It is essential to consider all environ-mental impacts of manufacturing and process change decisions such as those in-volved with a reduction of wastewater volume. Most beneficial changes to effectthis reduction can be achieved by a careful study and evaluation of manufactur-ing processes.

Waste Strength ReductionThis usually makes a wastewater effluent stream less pollution-oriented innature. It can be accomplished by: (1) changing mechanics or operation of theprocess; (2) eliminating a step in the (or an entire) process; and/or (3) substitut-ing a lesser contaminating material or chemical for the original raw material orprocess chemical. Segregating small volumes of "strong" wastes will give an in-dustry a large volume of relatively weak waste and a very small volume of strongwaste. Both may be treated by different methods and sometimes more econom-ically and effectively than when combined as one waste. Unless either costs ortotal pollution are reduced by waste strength reduction, this step as an aid inwaste treatment should be omitted. Figure V-1 illustrates the result of wastestrength reduction in both waste treatment cost and the amount of contaminantremaining.
FIGURE V-1: Typical Effect of Reducing Strength of Wastes
Before FollowingWaste Strength Waste StrengthReduction Reduction
SNo B.O.D. (or other contaminant) per day
EJUS$ per day for waste treatment (capital and operating costs)

Neutralization
Neutralization of wastes serves a number of purposes, such as:
-Protecting sewer lines and plant structures from corrosion;
-Reducing the quantity of chemicals needed for coagulation as a
treatment method;
-Protecting and promoting optimum bacterial activity in biological
treatment;
-Preventing odors which could develop at low or high pH values;
and
-Protecting receiving waters from detrimental effects of wastes
with either less than 6.0 or greater than 9.5 pH values.
Adjustment of pH to correct values can be obtained by (1) adding acid (usually
sulfuric) or base (usually sodium hydroxide or lime); (2) mixing acid wastes with
alkaline wastes in proper proportion; (3) acidifying with flue gas; (4) acidifying
with submerged combustion (burning of fuel under water); or (5) passing acid
wastes through limestone beds.
Equalization and Proportioning
Often when industrial wastes are introduced into a domestic sewage treatment
system in a uniform volume and strength in accordance with sewage flows, more
effective combined treatment results.Equalization involves the holding or retention of industrial wastes for a period
of time sufficient to produce at the discharge end a waste more uniform in quali-
ty. This treatment is illustrated in terms of BOD in Figure V-2. The optimum re-
tention time depends upon the nature and repetition of various industrial
manufacturing processes. For example, a process resulting in a high BOD waste
occurring at 12 noon and only once every 24 hours may require a 24-hour hold-
ing period, as shown in Figure V-2.The plant waste may also be released in proportion to the sewage flow at the
treatment plant or to the river flow into which the waste is discharged. Propor-
tioning wastes assures that neither treatment plants nor receiving streams are
overloaded with "slug" loads. Proportioning can be accomplished by pumping or
discharging industrial plant wastes at previously projected or at instantly sig-
naled rates. The system requires flow measurement, signal transmission, and
valve responses at plant waste pumping devices. An example of the effects of
one type of proper proportioning is shown in Figure V-3.
Proportioning of plant wastes can also be practiced to prevent overloading of
a contaminant in the system at any one time. This often means revising previous
concepts and reducing industrial plant waste flows when municipal flows and
contaminants are high.
Joint Treatment of Industrial and Municipal Wastes
It is often advantageous to an industrial manufacturing plant to deliver its entire
wastewater-under control-to a municipal sewer and sewerage systems., The
many advantages of joint treatment of municipal and industrial wastes are as fol-
lows:

FIGURE V-2: Typical Effect of Equalizing Waste Discharge
B.O.D.
Instantaneous Dischargeof Plant Waste
EqualizedWaste Discharge
TimeI I I6 12 6 12
AM PM
O Responsibility is placed with one owner, while at the same timethe cooperative spirit between industry and municipality is in-creased, particularly if division of costs is mutually satisfactory.
C Only one chief operator is required, whose sole obligation is themanagement of the treatment plant; i.e., he is not encumbered bythe miscellaneous duties often given to the industrial employee incharge of waste disposal, and the chances of mismanagement andneglect, which may result if industrial production staff operatewaste treatment plants, are eliminated.
O Since the operator of such a large treatment plant usually re-ceives higher pay than separate domestic plant operators, bettertrained people are available.

FIGURE V-3: Typical Effect of Proportioning Waste Discharge
Flow(GPM)
/ 0Non-ProportionedPlant Wastes
Domestic SewageFlow
ProportionedPlantWastes
I I Time
6 12 6 12
AM Noon PM Midnight
0 Even if identical equipment is required, construction costs are
less for a single plant than for two or more.
O1 The land required for plant construction and for disposal of waste
products may be obtained more easily by the municipality.
l Operating costs are lower, since more waste is treated at a lower
rate per unit of volume.
O Possible cost advantages resulting from lower municipal financing
costs, federal grants, and municipal operation can be passed on to
the users and may permit higher degrees of treatment at lower
removal costs.
O3 Some wastes may add valuable nutrients for biological activity to
counteract other industrial wastes that are nutrient deficient.
Thus, bacteria in the sewage are added to organic industrial
wastes as seeding material. These microorganisms are vital to
biological treatment when the necessary BOD reduction exceeds
approximately 70%. Similarly, acids from one industry may help
neutralize alkaline wastes from another industry.

0 The treatment of all wastewater generated in the community in amunicipal plant or plants enables the municipality to assure auniform level of treatment to all users of the river and even to in-crease the degree of treatment given to all wastewater to a max-imum level obtainable with technological advances.
O Acceptance of the joint treatment concept and relinquishment ofindividual allocations would give the municipality full control ofthe river's resources and permit it to use the capacity of the riverto the best advantage for the public at large. The municipality hasgreater assurance of stream protection, since it has the oppor-tunity for closer monitoring of effluent quality.
Among the many problems arising from combined treatment, the most importantis the character of the industrial wastewater reaching the disposal plant.Equalization and regulation of discharge of industrial wastes are sometimes nec-essary to prevent rapid change in the environmental conditions of the bacteriaand other organisms which act as purifying agents, to ensure ample chemicaldosage in coagulating basins, and to ensure adequate chlorination to kill harmfulbacteria before the effluent is discharged to a stream.2 .3
In recent years, two factors in particular have focused attention on the subjectof combined treatment for sewage and industrial wastes in the industrializedcountries. These are the increased interest in stream pollution abatement andthe phenomenal growth of industry, with the subsequent increase in demand forwater.
Since most municipal treatment plants use some form of biological treatment,it is essential for satisfactory operation that extremes in industrial waste charac-teristics be avoided and the waste mixture be:
o As homogeneous in composition and uniform in flow rate as possi-ble and free from sudden dumpings (shock loads) of the moredeleterious industrial wastes;
0 Not highly loaded with suspended matter;0 Free of excessive acidity or alkalinity and not high in content of
chemicals which precipitate on neutralization or oxidation;0 Practically free of antiseptic materials and toxic trace metals;O Low in potential sources of high BOD, such as carbohydrates,
sugar, starch, and cellulose; andO Low in oil and grease content.
If the industrial waste characteristics are such that the waste can be treatedsafely and effectively in the municipal sewage plant, there still remain two majorconsiderations: a municipal ordinance which protects the treatment plant fromany individual or industrial violation and sewer rental charges which enable themunicipality to defray the increased costs of construction and operation result-ing from acceptance of the industrial wastes. Sewer rental charges are discussedlater under economic considerations.Suspended Solids RemovalSolids are most frequently removed by utilizing their ability to settle or float,and physically with screens.

SedimentationMany industrial wastes such as those from canneries, pulp and paper mills, and
tanneries contain suspended matter. Frequently, these solids are removed by
differential sedimentation. Since suspended matter in wastes is generally more
dense than water, it can be separated by providing ample retention time to set-
tle. An otpimum retention time of one to three hours is generally required for
this method. The solids content is reduced by 70% to 90%.
FlotationFlotation involves the conversion of a portion of the suspended, colloidal, and
other substances to floating matter. The term may be applied to violently agi-
tated froth flotation, as used for ore separation in the mining industry, or to
quiescent flotation used for removal of a broad variety of suspensions. For in-
dustrial wastes the "vacuum" and "pressure flotation" techniques are those most
widely used.Some of the advantages of flotation techniques are that:
-Greases and light solids rise to the top, while grit and heavy solids
settle to the bottom, thus permitting their removal in the same
tank unit.
-The high overflow rates and short detention periods utilized gen-
erally reduce space requirements and construction costs.
-Short detention periods and the presence of dissolved oxygen
tend to reduce odor problems.
-Thicker scums and sludges are produced by flotation than is the
case with gravity settling and skimming.
Some of the disadvantages of this process are that:
-Operating costs are higher because of the additional equipment
and large power requirements.
-While the efficiency depends upon the specific waste, gravity-set-
tling units are generally more efficient than flotation units.
-More skilled maintenance is required for flotation than for gravi-
ty-settling units.
ScreeningScreening of industrial wastes is generally practiced on wastes ontaining larger
suspended solids of variable sizfs. Units are categorized as rotary, self-cleaning,
gravity-type or circular, overhead-fed, or vibrating type. The screen sizes vary
from coarse (10-20 mesh) to fine (120-320 mesh). Screening generally removes
60% to 95% of the larger suspended solids.
Colloidal Solids RemovalChemical CoagulationThese solids may vary in size from 1 mu to 200 mtL and border in charac-
teristics between the suspended and dissolved solids. They are small enough to
exhibit stability by virtue of the slight residual electrical charge (generally
negative), but large enough to interfere with the passage of light and therefore
cause turbidity. They will not settle physically unless destabilized, coagulated
and flocculated into larger masses with sufficiently greater densities than water.Generally, it follows that this is precisely the treatment that is used to removethem from industrial wastewater. Coagulants employed are normally thoseelectrolytes possessing strong positive charges when dissolved in waters; for ex-ample, salts of Fe+++ or Al+++. The coagulants appear to react simultaneouslywith the negative hydroxyl ions and the negative colloidal impurities in thewastewaters. Both are reduced substantially by the reaction. In many instancescolloidal solids may represent from 1/3 to 1/2 of the total oxygen demand of in-dustrial wastewater. On the other hand, little benefit will be gained by attempt-ing to employ chemical coagulation to remove solids which are not truly colloi-dal-for larger ones could be removed by settling and smaller ones will not beaffected by this method of treatment.
Adsorption
A large number of compounds which are not amenable to other types of treat-ment may be removed from wastes by adsorption. For example, pesticides, her-bicides, and insecticides may be removed by adsorption on powdered activatedcarbon. Clays are also used for some long-chain but relatively small colloids.Removal is effected by either passing the waste through packed columns of ad-sorbent or by mixing the waste with the adsorbent and agitating to cause adsorp-tion. The mixture is then generally filtered. The adsorbent with the impuritiesstops on the filter and the purified waste liquid is the filtrate.
Inorganic Dissolved Solids RemovalThe major portion of water-borne wastes discharged by industries producing orutilizing inorganic chemicals consists of dissolved solids. These are generally ma-terials of low value, such as sodium chloride, calcium chloride, and sodium sul-fate, along with smaller quantities of hazardous or toxic substances. Since theisolation and recovery of dissolved solids is basic to the production of inorganicchemicals control and treatment, the technologies for most of these substancesare highly developed.
Concentrations of inorganic chemicals can be reduced either through in-plantcontrol measures or by treatment of effluents. Various in-plant control measuresapplicable to several waste categories have been previously discussed, and theseare generally applicable to reducing concentrations of inorganic chemicals.More specific in-plant control procedures, as well as effluent treatment methods,are discussed below. While these measures are best suited to the inorganicchemicals industries, they can be modified and applied to a number of situationsin other industries.'
In-plant Control
Purity of the raw materials used in the manufacturing process influences thewaste load, since inert or unusable components are discharged as waste. Theseimpurities can be controlled in many ways. For example, ores can be washed,purified, separated, or otherwise treated to reduce the waste entering and leav-ing a process. Frequently such treatment can be accomplished at the mining site,where such operations may be carried out with little or no wastewater dis-charges.

With rare exceptions, chemical reactions are involved in the production of in-
organic chemicals. In many instances an excess of one or more of the reactants is
used for a number of reasons. Excess reactants should be recovered for recycling
and not allowed to become a part of the waste load.
In a manufacturing operation the products, by-products, impurities, and other
materials must be separated, purified, and recovered following process mixing
and reactions. Maximum separation into these components is extremely impor-
tant in order to minimize the waste loads. The degree of separation actually
achieved in the process depends upon physical, chemical, and economic con-
siderations.Incoming process water will pick up contaminants from various sources in the
plant. If wastes from these sources are carefully segregated, their treatment and
disposal can often be reduced or entirely eliminated. Treatment costs, complex-
ity, and energy needs may also be significantly reduced.
Good housekeeping practices, constant monitoring, containment of major and
minor spills and leaks, and emergency provisions for handling upsets and failures
are also important elements for in-plant control of waste discharges.
Treatment for Dissolved Materials
Treatment for dissolved materials consists of modifying or removing undesirable
components. Substances such as acids, alkalines, cyanides, chromates, sulfides
and other toxic or hazardous materials may be reduced through chemical tech-
niques such as neutralization, pH control, and oxidation-reduction. Removal of
dissolved solids can be accomplished by such methods as chemical precipitation,
ion exchange, carbon adsorption, reverse osmosis, and evaporation.
Neutralization-Many wastes are either acid or alkaline, and thus should be
controlled prior to discharge. Generally, acidic discharges are treated with
alkaline materials such as limestone, lime, soda ash, or sodium hydroxide.
Alkaline discharges are treated with sulfuric or other acids. Quite often, acid
wastes are available to neutralize alkaline wastes in-plant, and vice versa.
Neutralization often produces suspended solids which must be removed prior to
final effluent disposal.pH Control-The control of pH may be equivalent to neutralization if the con-
trol point is at or near a pH value of 7. However, chemicals are sometimes added
to waste streams to maintain an acidic or alkaline pH level for the purpose of
controlling the solubility of specific substances, and accomplishing their removal
by precipitation. Some typical reactions are as follows:
Cr+++ + 30H- - Cr (OH)aFe+++ + 30H- -Fe (OH)3Mn++ + 20H- - Mn (OH)2Zn++ + 20H- - Zn (OH)2
Ni+++ + 30H- - Ni (OH) 3Cu++ + 20H- Cu (OH)2
The effects of pH on the solubility of copper, nickel, chromium, and zinc are
shown in Figure V-4.
Oxidation-Reduction-The modification or destruction of many hazardous
wastes can be accomplished by chemical oxidation or reduction. Chlorine or
ozone can be used to oxidize cyanides to less hazardous cyanates or to com-

FIGURE V-4: Solubility of Copper, Nickel, Chromium and Zinc as aFunction of pH 4
10
1.0 ZINC
0.1
E
CHROMIUMM
NICKEL
0.01
COPPER
0.001
6 7 8 9 10 11 12
SOLUTION, pH

pletely destroy them into innocuous materials. Hexavalent chromium is reduced
to the less hazardous trivalent form with sulfur dioxide or bisulfites. Sulfites,
which exert a high COD, can be oxidized with air to inert sulfates. These and
similar reactions are basically those used to modify troublesome inorganic com-
ponents in wastes.Cyanides are most commonly treated by single or two-stage chlorination and
by hypochlorite oxidation. For chlorination:
STAGE 1(pH 11.5)
Na CN + C12 + 2 NAOH - Na CNO + 2 Na Cl + H20
STAGE 2(pH 7.5-9.0)
2NaCNO+3C12+4NaOH - N2+2CO2+6NaCl+H20
Chlorination is considered to be the best practicable method for control of total
and oxidizable cyanide.
For hypochlorite oxidation:2 Na CN + Ca (OC1)2 - 2 Na CNO + Ca C12
2 Na CN + 2 Na OCl - 2 Na CNO + 2 Na Cl
Either calcium or sodium hypochlorite may be used, depending upon economics
and availability.Chromates are reduced to less toxic Cr+++ compounds by such chemicals as
sulfur dioxide, sodium metabisulfite, sodium bisulfite, sodium sulfite, ferrous sul-
fate, and ferrous chloride. The reactions involved in each instance go to virtual
completion, with limits of approximately 0.01 mg/I of residual chromate.
Removal of the less toxic but still undesirable Cr+++ compounds is ac-
complished with pH control or precipitation on the alkaline side.
Inorganic sulfur compounds discharged in waste flows range from the very
harmful hydrogen sulfide to the relatively harmless sulfate salts such as sodium
sulfate, depending upon the degree of oxidation. Oxidation may be ac-
complished with air, hydrogen peroxide, chlorine and other oxidizing agents.
Sulfides are readily oxidizable with air up to the thiosulfate level, the latter
being less harmful than sulfides (as much as 1000 to 1). Thiosulfates are difficult
to oxidize further with air, but may be oxidized with chlorine, peroxides, or
other powerful agents.Hydrosulfites can also be oxidized by such agents as chlorine and peroxide;
and at times with catalized air oxidation. Sulfites are readily oxidized to sulfates
with air, as well as with chlorine and peroxides.
Precipitation-Undesirable dissolved solids can be removed from solution by
the reaction of two soluble chemicals to produce insoluble or precipitated prod-
ucts. Application of this technique varies from lime treatment for removal of sul-
fates, fluorides, hydroxides, and carbonates, to sodium or ferrous sulfide pre-
cipitation of copper, lead, and other toxic heavy metals. These reactions will
contribute substantial quantities of suspended solids to the waste loadings. Such
solids can be removed by use of settling ponds, clarifiers, thickeners, filters, and
centrifuges.
Typical of the reactions for removal by precipitation are the following:SO4_ + Ca (OH)2 - Ca S04 + 2 0H-2F- + Ca (OH)2 Ca F2 + 2 OH-Cu++ + Na2S - Cu S + 2 Na+
Ion Exchange-The removal of dissolved solids in the ionized form is ac-complished by exchange with less objectionable ions present in a contact bed ofion exchange resins. A widely used example of this technique is in water soften-ing, where calcium and magnesium ions are removed and replaced with sodiumions. The dissolved ions are replaced by hydrogen and hydroxyl ions containedin the ion exchange resins, thus rendering the water " demineralized" of all dis-solved solids. When the resins have become "loaded" with the exchange ionsthey must be regenerated with salt, acid, base, or other regenerating agent andthus returned to their original state. Wastes from the regeneration process canbe substantial and may require treatment before final disposal.
Ion exchange techniques are also used for the removal of chromates, metallicions, ammonia, nitrates, and other objectionable dissolved materials. Since thematerials removed by this procedure are in highly concentrated form (as high as10 percent by weight), they can often be recovered for reuse or sale.
Demineralized water contains a very low concentration of dissolved solids(less than 2 to 3 mg/1) thus making it suitable for boilers, cooling towers, criticalprocesses, and other applications requiring waters of this quality.
Carbon Adsorption-This technique is applicable to the removal of organiccomponents from waste flows. Many effluents will contain a mixture of organicand inorganic substances. The wastes are passed through activated carbon beds,during which the organic materials are adsorbed. When the carbon beds havebecome saturated they can be regenerated by burning the adsorbed organicsand returned to use.
Reverse Osmosis-In this procedure, a pure liquid and a solution of dissolvedmaterial in the same liquid are separated by a semi-permeable membrane,resulting in a net migration of the pure liquid to the solution. This migration isdue to the free energy difference between the two sides of the membrane.Equilibrium is reached when the liquids on each side are of the same composi-tion, or sufficient additional pressure is applied on the solution side to counter-balance the osmotic driving force. Application of additional pressure on thesolution side reverses the direction of osmotic flow through the membrane andresults in concentration of the solution and migration of additional pure liquid tothe pure liquid side. Reverse osmosis may be considered as the equivalent topressure filtration through a molecular pore-sized filter.
The membranes normally used in this procedure are generally of the flat sheetor hollow filter type. Various configurations are used in order to provide themaximum membrane area in the minimum space-tubes, spiral windings, sand-wich-type, and others. Sheet membranes are generally of cellulose acetatewhile hollow fibers are largely polyamides. The type of membrane selected de-pends upon the specific application.
Evaporation-This is considered to be the most generally useful method forremoval of dissolved solids in water. It is well established in the inorganic chemi-cal industry, since many of the production processes utilize evaporative tech-niques.

Evaporation technologies are widely used for treatment of dissolved solids in
wastewaters from the soda ash, salt, calcium chloride, and sea water chemical in-
dustries. These are also used at a number of desalination plants producing fresh
water from sea or brackish waters. Sea water contains about 35,000 mg/1 dis-
solved solids (3.5 percent by weight), while brackish waters vary from 2,000 to
25,000 mg/l, depending upon location.Evaporation can be a relatively expensive process. About 550 kilogram-calo-
ries of energy are required to evaporate one kilogram of water. To this must be
added the capital cost of the evaporating equipment. Hence, evaporation tech-
niques have been used to only a limited degree by the industrial sector. As the
cost of pure water has increased in various parts of the world, this technique has
become increasingly attractive.Generally, evaporation procedures have employed the principle of multi-
effects in order to reduce the amount of steam or energy required. Multi-effect
units utilize the heat content of the evaporated vapor steam from each preced-
ing stage to efficiently (at low temperature difference) evaporate more vapor at
the succeeding stage. However, a large capital investment in heat transfer sur-
face and pumps is required. The balance between capital equipment costs and
energy on operating costs must be carefully analyzed prior to reaching a deci-
sion on utilizing this procedure.
Organic Dissolved Solids Removal
Manufacturing of textiles, paper, canned goods, leather, as well as preparing
many food products such as milk, cheese, and meat results in the discharge of
certain amounts of dissolved organic matter. This matter is readily available to
microorganisms ever present in streams, as a source of food, resulting in a
diminution of dissolved oxygen in the watercourses. Because these solids are
amenable to bacterial degradation, waste treatment methods frequently utilize
biological processes. In effect, biological treatment is that which is occurring in
streams but only differs in the waste treatment system in that it is accelerated by
creation of optimum environmental conditions for bacterial growth. Some types
of biological treatment used on industrial wastes containing a relatively high
percentage of dissolved organic solids include oxidation ponds or lagooning, acti-
vated sludge and its many modifications, and trickling filtration and its variations.
Lagooning
Lagooning in oxidation ponds is a common means of both removing and oxidizing
organic matter and wastewater. Stabilization of wastewater in ponds results
from several natural self-purification phenomena. The first phase is sedimenta-
tion; some suspended and colloidal matter is precipitated by the action of solu-
ble salts; decomposition occurs by microorganisms in both the settled solids and
soluble organic matter, converting it to mineral matter, with the mineral matter
and carbon dioxide being utilized by algae and other larger plant life to assimi-
late the inert matter and to produce oxygen and organic growth which, in turn,
serves the bacterial population. All the microorganisms (bacteria, protozoans,
and algae) live in equilibrium and harmony with each other in properly designed
and operated lagoons.Two versions of ponds: one deep (8 ft to 20 ft), one shallow (4 ft) are used. The
first permits anaerobic decomposition in the bottom and aerobic completion of

the oxidation in the surface layer. Under some conditions it is desirable to followthe deep pond with a very shallow one (2 ft or less) to enhance algal growth andoxygen production. In the second, the objective is to keep the entire pond depthaerobic; thus these are not used when there are settleable solids. Oxidation pondtreatment is recommended when land is available at a low cost, where popula-tion density is low, and where the receiving water can assimilate a variableamount of residual organic matter.
Oxidation pond treatment is less effective, requires much land area and reten-tion time, can yield odors unless properly designed or aerated, but is much lessexpensive to build and to operate. Some ponds develop an algal growth,especially in shallow basins, which assists in providing oxygen to the bacteria aswell as in removing inorganic nutrients. Some 50% to 75% BOD reduction canusually be easily obtained with these wastes, allowing one to three days reten-tion.Activated SludgeActivated sludge treatment consists of aerating biological flocculant growthswithin the industrial wastes. Surface for biological oxidation to occur is providedby the flocculant growths (floc). With sufficient retention time for biologicalreaction, an ample supply of oxygen, and readily degradable organic matter toserve as bacterial food, activated sludge treatment can be very effective. Normaldesign loadings for activated sludge units are in the range of 35 pounds of BODper 1000 ft3 (565 kg/1000 ma) of aeration basin and about 1000 ft3 (61.8 m3/kg)of air is provided per pound of BOD removed. Air is provided either from com-pressors or by mechanical means as a result of high-speed rotation of submergedrotors. Retention times vary from 6 to 24 hours. Various degrees of efficiency canbe obtained by controlling the contact period and/or the concentration of activefloc. The desired concentration of active floc is maintained by recirculating aspecific volume of secondary settled sludge, normally about 20% of the rawwastewater flow. A well-operated activated sludge system is capable of BODremovals in the 80% to 90% range.
There are many biological aeration systems somewhat similar but neverthe-less significantly different from the conventional activated sludge treatment pro-cess. They are each designed specifically either for certain types of waste or fora certain quality of effluent, or both. Some of the major ones include: (a)modified (tapered) aeration, which supplies air at points where the organic ox-ygen demand is greatest and decreases the supply at points where the demand isless; (b) dispersed growth aeration, which recirculates secondary effluent ratherthan sludge and utilizes longer aeration retention times. It is especially useful fororganic wastes in which the solids are highly dissolved instead of colloidal; (c)contact stabilization, which uses a shorter period of aeration with recirculationsludge and a longer, separate sludge reaeration period; (d) total or extendedaeration, which provides a long -usually 24 to 36 hours-aeration period so as to"use up" the organic cell growths formed during oxidation. This system is usefulfor smaller industrial plants where final sludge solids handling would be burden-some; and (e) brush aeration, which accomplishes the aeration by a rotatingcylinder partially submerged and fixed across the width of an elliptical channel.Settling and sludge recirculation (if used) occur in subsequent segments of theelliptical channel systems.

Trickling FiltersThis treatment process is one which utilizes fixed surface areas for biological
growth and oxidation over which the organic wastes are fed. The fixed biological
units are usually some form of erosion-resistant rock material such as granite or
traprock. However, other equally resistant surface material, such as glass or
plastic, can be used provided it has the structural stability required in deep beds
of six feet (1.83 meters), the surface area needed for growth, and pore capacity
to filter wastewater rapidly and hold ample oxygen. The surfaces readily and
rapidly become coated with a gelatinous slime growth after repeated and con-
tinuous dosing with the wastewater. These growths absorb and oxidize dissolved
and colloidal organic matter from the wastes applied to them. A flocculent
humus-like residue of sludge accumulates on the surface and when it gets too
heavy it will slough off and resettle in the secondary settling basin. Trickling
filters when loaded at about 35 pounds of BOD per 1000 ft3 (565 kg/1000m3) of
filter bed will also remove 85% of the BOD load applied when followed by sec-
ondary sedimentation and when utilizing either some recirculation in beds of
depths of 4 ft (1.22 meters) or no recirculation in beds of depths of 6 ft to 7 ft
(1.83 to 2.13 meters). Variation in removal efficiencies of this process may be ob-
tained by increasing the recirculation rate and/or adding a series of filters and
varying the flow sequence arrangement.
Biodisc TreatmentThis is a rotating biological disc system consisting of a number of large-diameter,
light-weight plastic discs, which are mounted on a horizontal shaft and placed in
a semicircular-shaped tank. The system has all the advantages of an activated
sludge unit, although with much less power required and the advantages of a
trickling filter unit but with more efficient utilization of the surface area. The use
of closely spaced parallel discs achieves a high concentration of active biological
surface area. This high concentration of active organisms and the ability to
achieve the required aeration rate by adjusting the rotational speed of the discs
enables this process to give effective treatment to highly concentrated wastes.
Loadings in the range of 5 to 15 pounds of BOD per day per 1000 square feet (50
kg/1000m2) of surface area will result usually in over 75% BOD removal.
Spray IrrigationSpray irrigation is an adaptation of the method of watering agricultural crops by
portable sprinkling-irrigation systems. Wastes are pumped through portable
pipes to self-activated sprinkler heads. Light-weight alu-minum or galvanized
piping equipped with quick-assembly pipe joints can be easily moved to areas to
be irrigated and quickly assembled. Wastes are applied as a rain to the surface of
the soil, with the objective of applying the maximum amount that can be ab-
sorbed without surface runoff or damage to the cover crops. A spray irrigation
system is usually composed of the following units: (a) the land on which to spray;
(b) a vegetative cover crop to aid absorption and prevent erosion; (c) a
mechanically operated screening unit; (d) a surge tank or pit; (e) auxiliary sta-
tionary screens; (f) a pump which develops the required sprinkler-nozzle
pressure; (g) a main line; (h) lateral lines; and (i) self-activated revolving
sprinklers operating under 35 to 100 psi (2.38-6.8 atm) nozzle pressure. With
good cover crops of dense, low-growing grasses and fairly level areas, waste to a

depth of 3 to 4 inches (7.62-10.16 cm) can be applied at a rate of 0.4 to 0.6 inchper hour (1.02-1.52 cm per hour). The potential for the dual-purpose system ofdisposing of wastewater and growing crops for food makes spray irrigation a de-sirable system for both developing and developed countries.
Other Systems
The removal of organic dissolved solids can also be accomplished by moresophisticated and specially designed treatment systems. Some of them include:
Wet Combustion Technique, which burns wastewater at elevated pressures(1200 psi-81.6 atm). It is an excellent process for rapid oxidation of organic mat-ter when steam is essential and inexpensive enough to justify the cost of theequipment. Wet combustion can maintain itself only when the waste has a mini-mum of 5% solids of which at least 70% are organic. The potential exists for re-covery of expensive inorganics.
Anaerobic Digestion is a bacteriological process for oxidizing organic matterin closed vessels in the absence of air. Generally, anaerobic processes are lesseffective than aerobic processes, mainly because of the small amount of energythat results when anaerobic bacteria oxidize organic matter. Anaerobic pro-cesses are therefore slow and require low daily loadings and/or long retentionperiods. However, since little or no power need be added, operating costs arevery low. When liquid waste volumes are small and contain no toxic matter andthere are high percentages of readily oxidizable dissolved organic matter, thisprocess has definite advantages over aerobic systems.
Deep Well Injection of wastes containing dissolved organic matter by dis-charging them into deep wells has been successful in areas of low or nonexistentstreamflow, especially when wastes are malodorous or toxic and contain little orno suspended matter. To be effective, the wastes must be placed in a geologicalformation which prevents the migration of the wastes to the surface or togroundwater supplies. Other factors to be considered in addition to geology aredepth and diameter of wells, injection pressures, and the volume and charac-teristics of the wastes.
Foam-Phase Separation can be used on concentrated organic wastes whichpossess a high degree of foamability. A sparger produces small gas bubbles(usually air) on a tank bottom and when these bubbles rise through the liquidthey adsorb surface-active solutes and suspended matter. When the bubblesreach the surface, a foam forms, which is forced out of the foamer, collapsed,and discharged as a concentrated waste.
Stream Assimilative CapacityIf the regulatory agency permits an industry to use a portion of the assimilativecapacity of the receiving water, the agency must resort to some method of pre-dicting an acceptable organic loading. The agency makes a decision usuallybased upon preservation of a certain minimum concentration of dissolved oxygenin the stream. Many factors determine the consumption of dissolved oxygen, in-cluding (a) nature of the organic matter-whether easily decomposable by nor-mal stream biota; (b) amount of receiving water-as a diluting effect as well asan oxygen provider; (c) physical nature of the stream-swift or sluggish, pools orriffles; (d) biological nature of the stream-whether containing adapted flow,slime growths, benthal deposits, algae growth; (e) chemical nature of the

stream-whether containing toxic chemicals, nutrients for promoting biological
growth; and (f) environmental character of the stream-temperature and pH of
the water. It is not possible to discuss all of these parameters in this document.
The reader is therefore referred to the literature for a more complete coverage
of the subject.5,6
Treatment and Disposal of Sludge Solids
Of prime importance in the treatment of all liquid wastes is the removal of
solids, both suspended and dissolved. Once these solids are removed from the
liquids, however, their disposal becomes a major problem. When the solids-dis-
posal system is poor, the solids tend to build up on the flow-through treatment
units, and overall removal efficiencies then begin to decrease. Therefore, proper
sludge handling enhances the overall treatment of all wastes. Sludges are usually
anaerobically digested, concentrated and lagooned or returned to the land, or
dried on specially designed drying beds. Other sludge treatment systems such as
centrifuging, barging, incineration, etc., are also used in specific circumstances.
Digestion
Digestion is commonly used for sludge solids which are relatively high in organic
matter. It is a convenient method to use when the volumes of sludge would
otherwise be expensive to handle from a labor standpoint and where initial
capital expense is not a major deterrent. Digestion is a slow microbiological pro-
cess carried out in a sealed reaction vessel for 20 to 60 days. Products of diges-
tion include combustible gases such as methane, organic acids remaining in the
supernatant liquor, and digested solids of about the same solids content as the
raw solids (5% to 10%) but much lower organic matter (35% to 65%). After
digestion, the sludge is dried and/or burned, or returned to the land for soil con-
ditioner. The pH (7-7.4), organic solids loading (0.1 to 0.3 pounds per ft3
[1.60-4.8 kg/m3] per day), mixing of tank contents (mechanical, sludge recir-
culation, or gas recirculation), and tank contents temperature (90*F-32.2'C)
are carefully controlled in order to ensure efficient digestion.
Vacuum Filtration
Vacuum filtration is a means of dewatering sludge solids in order to reduce the
solids volume and to facilitate its handling. In a typical unit, a porous cylinder
overlying a series of cells revolves slowly about its axis with its lower portion
passing through a trough containing the sludge to be dried. A vacuum applied
from inside the cylinder piL-ks up a layer of sludge as the filter surface passes
through the trough. When the cylinder has completed 3/4ths of a revolution, a
slight air pressure is produced on the appropriate cells, which aids a knife edge
to dislodge the sludge in a thin layer. Sometimes, chemicals are added to the
sludge to enhance the filtration rate, which should be from two to ten pounds of
dry solids per square foot per hour. When space is limited and good
mechanically trained personnel and shop equipment are available, vacuum
filtration is recommended for sludge concentration (to about 70% water).
Drying BedsThese remove moisture from sludge, thereby decreasing its volume and chang-
ing its physicochemical characteristics so that sludge containing about 25%
solids can be moved with a shovel or garden fork and transported in watertight

containers. Sludge filter beds are usually made up of 21 to 24 inches(53.34-60.96 cm) of coarse sand, and about 12 inches (30.48 cm) of coarsegravel beneath the sand. Below the gravel, the earth floor of the bed is pitchedto a light grade into open-joint tile underdrains 6 or 8 inches (15.24 or 20.32 cm)in diameter. Disposing of the underdrain liquid sometimes is a problem; thisshould never be discharged without an analysis of its constituents and usuallysome form of treatment. Drying time is dependent on dosing depth (8 inches-20.32 cm) being generally accepted as most desirable for rapid drying) as well ason climate. This form of sludge solids treatment is recommended for regions ofplentiful land and sunshine, scant rainfall, low relative humidity, and more thanaverage wind velocity since water is separated from the solids by both evapora-tion and draining.
Centrifuging
This is a method of concentrating sludge to enhance final disposal. Installationsnow using 20 hp (14.9 kw) built-in drive motors can handle 3000 to 4000 gallons(11.36 to 15.14 M) per hour of waste sludge containing 0.5% to 0.75% solids on adry basis. Speeds of bowl revolution reach 6100 rpm. The resulting sludge canbe concentrated to about 5% solids. The centrifugal force throws the densersolid material to the wall of the bowl, where it is discharged through nozzles lo-cated in the periphery. The effluent from which the solids are separated travelstowards the center of the bowl. This form of sludge concentration is recom-mended when electrical power is available at a reasonable price and both spaceand labor for other sludge concentration systems are lacking.Lagooning
Lagooning (storage) in natural or artificial earth basins is practiced when suit-able land is available and the cost of other ultimate means of disposal is prohibi-tive. Factors to be considered when using this method include:
-Nature and topography of the disposal area.-Proximity of the site to population area.-Meteorological conditions, especially whether prevailing winds
blow toward or away from populated areas.-Soil conditions.-Chemical composition of sludge (toxicity and odor-producing con-
stituents).
-Proximity to surface or groundwater supplies.-Effect of waste materials on the porosity of the soil.-Means of draining off the supernatant liquid to provide more space
in the lagoon.-Fencing and other safety measures when the lagoons are deeper
than five feet (1.52 m).-Nuisances, such as weed growth, odors, and insect breeding.
Sludge Barging or PumpingBarging and pumping are means of final disposal of sludge. They are applicablemainly to coastal industries and are especially useful where there is little or noland space for sludge storage. There are no recommended standard design tech-

niques or procedures for such systems. The system selection for solving each in-
dustrial sludge problem of this type is based upon specific and special considera-
tions of any one plant. It should be recognized that no resource to which the
sludge is being transferred is unlimited in capacity. Oceans have become con-
taminated with sludge products. Recreation and fishing uses of these waters
have been violated in certain cases. Ocean dumping by barging or pumping
should be considered only as a temporary method of ultimate disposal and one
which must be selected after evaluation of the capital expense involved in pur-
chasing ships or pumps and long pipelines.
Drying and Incineration
A large volume of sludge can be reduced to a small volume of ash which is free
from organic matter and therefore easily disposable, by a combination of heat
drying and incineration. Usually sludges are "flash" dried by passing the sludge
through a stream of hot gases, which ensures practically instantaneous removal
of moisture. When hot gases created by the drying and oxidation of the sludge it-
self are used directly for drying, there are no conversion losses. After the flash
drying, the gas containing sludge particles usually passes to cyclone separators,
where the dried sludge is separated from the moisture carrying cooler gases.
This sludge can be returned to the land for agricultural purposes or reused by an
industry as a starting raw material-depending upon its dried solids content.
Unused dried sludge is incinerated by blowing it through a duct to a burner in
the combustion chamber of a furnace. The sludge blower simultaneously sup-
plies air for combustion. Combusted gases are recirculated and returned to the
furnace to eliminate their odors. Ash is removed from the furnace bottom either
manually or by sluicing with water. Furnaces should provide for the release of
about 12,000 BTU per cubic foot (108 x 106 cal/M3 ) of furnace volume per hour.
When small volumes of irregularly produced industrial sludges are dis-
charged, they can be burned in "pit-type" incinerators consisting of a rectangu-
lar pit lined with firebrick. Air is supplied and distributed so as to retain particu-
lates. It is less efficient than the larger flash drier-incinerators and should be
used only after considering the plant location relative to the prevailing wind and
nearby development.
Atomized Suspension
With certain high solids concentration type of industrial sludges, it is possible to
spray the slurry in the top of a tower, the walls of which are maintained at an
elevated temperature (by hot gases). No external gases mix with the drying
sludge solids which are recovered by cyclone separation for reuse or further
treatment at the bottom of the drier. The hot gases released (usually only water
vapor) are taken off the top of the cyclone separator and cooled by passing
through a condenser or are recirculated directly to the drier for heating the
walls.
Wet Combustion
In this process oxidation of sludge solids with at least 5% to 10% solids content,
of which most (60% to 90%) are organic, is brought about by continuously pump-ing the sludge and air at elevated temperatures and pressures into a reactor
vessel. Combustion occurs as the oxygen in the compressed air combines with
the organic matter in the sludge to form C02 and N2 and steam while the ash re-

mains in the residual water. The characteristics of the final products of ash, con-densate and gases depend upon the operating temperatures and pressures aswell as upon the sludge character and flow-through rate. Typical pressures of500 to 600 psi (34 to 40.8 atm) and temperatures of 400-500*F (204-260*C) areused. The process is recommended where other means of ultimate disposal oflarge sludge volumes are either unavailable or unacceptable and where initialcapital costs are not a major concern.Other MethodsOther systems which are sometimes used for further sludge concentration in-clude:
-Flotation and thickening;-Chemical coagulation;-Mechanical concentration by rotating paddle contactors; and-Composting.
All of these provide a sludge after treatment which is of lesser volume and ofmore use for some ultimate purpose (usually for land disposal). All are recom-mended for consideration where transportation costs to the land areas are rela-tively high but where land utilization as a means of ultimate disposal is called forand where a certain moisture content may be desirable.
Bacteria or Microorganism RemovalSome industrial wastewaters such as tannery, slaughterhouse, and canneryeffluents may contain undesirable microorganisms which either interfere withtheir reuse or with their introduction into the environment. Removal of microor-ganisms is recommended when the wastewater is being discharged into a receiv-ing stream used for drinking water or swimming or being reused within a plantand coming into contact with an edible or deteriorative product. In these casesthey can be disinfected generally by the use of chlorination, ozonation,ultraviolet radiation or other means.ChlorinationThis involves bringing wastewater thoroughly in contact with liquid chlorine forsufficient time (usually 15 to 30 minutes) to provide a residual chlorine contentof about 0.5 parts per million (mg/1). The contact time and quantity of chlorinerequired will vary with the nature of the wastewater and the organic mattercontent. For this reason chlorination is generally used as a final process afterorganic matter has been removed from the wastewater.OzonationAir is passed over a hot wire system and the liberated ozone (03) is conveyedinto the wastewater in sufficient amounts for sufficient time as to render thewastewater essentially free from bacterial contamination and thus permit dis-charge or reuse. Free ozone is difficult to measure or maintain in the effluent andis often more costly to produce, but has been shown to be quite effective.Ultraviolet RadiationThis method can be used in certain cases where the suspended and colloidalsolids content of the wastewater is relatively low and where a drinking watersupply is not involved. Wastewater is simply passed slowly in a relatively shallow

layer under a bank of ultraviolet lights during which time microorganisms are
killed.LAND
Solid waste handling and disposal programs must concern themselves not only
with collection and delivery, but also with the effects of various disposal opera-
tions on the environment. Attention must be given to the land used for disposal,
as well as to the effect of disposal methods on the air and water resources.
Collection and DeliveryIndustrial refuse can be collected and delivered for final disposal by one of three
methods:* Collected by the plant itself and disposed of on the plant proper-
ty;
* Collected by a private contractor and disposed of outside the
plant property; or
* Collected by a local government and disposed of in municipally
owned or leased facilities.
In the United States about 30% of all industrial refuse is handled on-site, about
57% by private contractors, and only 13% by municipal facilities. The form of
the refuse from any plant may be a liquid, semi-liquid, as well as packaging,
films, sheets, granules, shavings, turnings, powders, and defectively manufac-
tured products of all shapes and sizes. The least expensive and most efficient col-
lection system should be used. It should provide for continuous, complete, and
clean removal of solid waste from the industrial plant site.
Sanitary LandfillThis method is in essence an engineered method of disposing of solid wastes on
land by spreading them in thin layers, compacting them to the smallest practical
volume, and covering them with soil each working day in a manner that protects
the environment. The selection of a site and the operation and design should be
based on a systematic, integrated study and an evaluation of all physical condi-
tions, economics, and social/political constraints.
If the industrial refuse is largely organic in nature, it will degrade biologically
in the fill and yield solid, liquid, and gaseous products. The liquid and gases must
be handled as described below. The solid residue remains quite inert and
porous. Each type of organic waste degrades to a different extent and at a
different rate. For example, canning plant residues decompose quite readily and
completely while plastics, rubber, and glass decompose very slowly, if at all.
Initial decomposition is aerobic and will yield products such as C02, water,
and NO while subsequent biological breakdown products will be anaerobic,
such as CH4, organic acids, NHa, and sulfides, as well as some C02 and water. By
a knowledge of the composition of the industrial refuse and the porosity of the
soil, it is possible to predict the type and amount of degradation products, in-
cluding the final refuse volume remaining. This is especially helpful in ascertain-
ing the life of a given fill area and in predicting the extent of gas and leachate
problems to be encountered.Most of the information currently available relates to municipal refuse, but
since this normally contains a considerable percentage of industrial waste, some

of the data can be extrapolated. For example, Merz and Stone7 found that 40 ft 3
of gas were produced per cubic yard of solid waste over a 907-day period.Theoretically, complete decomposition of a 75% organic matter residue willyield up to 6.6 ft (2.01 m) of gas for each pound (0.45 kg) of refuse. It is goodpractice to minimize excessive landfill water infiltration by (a) diverting incom-ing drainage; (b) draining and grading the daily soil cover to enhance runoff; and(c) adding clay to the soil cover in order to decrease permeability.
Daily soil cover serves a number of purposes such as (a) controlling flies androdents; (b) preventing feeding by scavenger birds; (c) reducing moisture; (d)minimizing gases emerging through the cover; (e) preventing erosion andpreserving good appearance; and (f) growing vegetation.
Six inches (15.2 cm) of compacted sandy loam is recommended for daily addi-tion and two feet (61.96 cm) of final soil is recommended to grow vegetationafter fill is ended. The soil cover used will depend upon the final desired use ofthe filled land. Peat and highly organic soils are not recommended for soil coverbecause of compaction difficulties.
Refuse can usually be compacted in the fill to 1000 pounds per cubic yard(592.7 kg/M3 ). If the volume of refuse collected daily and its weight are known itis possible to compute the volume of fill required daily. The life of the fill areacan then be predicted by establishing the final height and area of the fill.
Site improvements are usually necessary to allow for freer flow of truck trafficin and out of the area, construction of buildings, fencing, and utilities necessaryto carry out efficient landfill operations.
The two basic landfilling methods are trench and area types. In general, thetrench method-where waste is spread and compacted in an excavated trench-is used when the groundwater is low and the soil is more than 6 ft (1.83 m) deep.It is best employed on flat or gently rolling land. The area method can be usedon most topographies and is often used if large quantities of solid waste must behandled. In the area method, the waste is spread and compacted on the naturalsurface of the ground and cover material is spread and compacted over it. It isrecommended on all types of land but especially in natural land depressions.
Usually all fills are done in almost square cell units so that a cell can be com-pleted daily and covered immediately with a minimum of fill. Therefore, the cellshould be as deep as practical so as to minimize the surface area involved (andthus use less cover). Trenches can be as deep as soil and groundwater conditionssafely allow, and should be at least twice as wide as any compacting equipmentthat will work in it. Final slopes of the fill should be graded to at least 3 to 1 to in-duce drainage away from the fill and to prevent erosion of the cover.
The disposal of industrial solid or liquid wastes in landfills should be con-tingent upon whether they will be hazardous to the environment. If they aredeemed hazardous-such as radioactive or explosive wastes-they should not beaccepted unless special provisions are made for environmental protection.Because every landfill settles to some extent, the surface should be periodicallyinspected and soil added and regraded when necessary.
Leachate ControlThe chance of leachate groundwater pollution exists in solid waste landfill dis-posal sites which become supersaturated because of artificial wetting, inade-

quate drainage of surface runoff from the site, or inundation by high ground
water. Most landfills will eventually produce leachate, the first appearance of
which depends on site conditions, including surface grading, vegetation and soil
parameters such as soil type, thickness, density, permeability, field capacity and
initial moisture content. The leachate produced by solid wastes in a sanitary
landfill may be highly polluted, especially in the relatively early life of the fill.
The composition of the leachate depends greatly upon the industrial solid waste
itself. In general, it tends to be acidic and contain great quantities of dissolved
minerals and suspended matter.
Leachate which impairs groundwater can be prevented if the landfill is so lo-
cated and constructed that no portion of it intercepts groundwater. A minimum
distance of two feet (0.608 m) is recommended between the maximum ground-
water level and solid waste depth. A natural or artificial layer of one foot to
three feet (0.304-0.912 m) of clay or a sheet of synthetic liner will help ensure
separation of the water and solid waste. The intercepted water should be
drained away from the site by gravity or pumped intermittently by a well-point
system. Surface water streams should be diverted away from the landfill disposal
sites by either regrading or collection and redirection of streams expected to
flood at least once in 50 years.
Gas Control
When industrial refuse, such as cannery residues, contains considerable quan-
tities of organic matter, decomposition gases result in the landfill. These gases
are mainly C02 and CH4 but may also contain some NH3 and H2S, depending
upon the composition of the industrial refuse. Some gases are explosive (CH4)
and others are odorous and poisonous (NHa and H2S). In general, no extensive
damage to persons in the immediate landfill area occurs when the gases can dis-
perse slowly, continuously, and completely into the atmosphere.
When the soil and/or refuse type are impermeable, gases can be vented to the
atmosphere by the construction of gravel vents or gravel-filled trenches. A moist
clay barrier can also be used to contain all the gas in a certain section of the land-
fill which is then vented through a pipe collection system to the atmosphere.
Refuse TreatmentWhere facilities are not available or limited for direct disposal of solid wastes by
sanitary landfill, other means must be found. This generally involves some meth-
od of reducing volumes prior to final disposal.
Grinding (Shredding)
In situations where the type of plant refuse is variable in size, shape, and consis-
tency, grinding can be used to make the waste more uniform. This is especially
effective when using incineration or landfilling as major final treatment methods.
Firing a uniform product into an incinerator is desirable from an operating effi-
ciency standpoint. Landfilling a ground solid waste enhances compaction (both
in transfer trucks and in the landfill), decomposition, and rodent and odor con-
trol. It minimizes the amount of cover soil required. Grinding requires increased
power despite the fact that little additional labor cost is needed. However, in
many instances, the increased power costs have been more than offset by lower
and more efficient subsequent treatment costs.

Incineration: Central and IndividualIncinerators are power plant-like structures designed to burn solid wastes undercontrolled, nuisance-free conditions, and at relatively high temperatures(I500*F-1900*F) for the purpose of reducing the combustible components to aninert residue which can then be readily disposed of by landfilling or, afterfurther treatment, as a roadway or construction material.
Incinerators for solid wastes are generally purchased as a "package" from anequipment manufacturer. To assure maximum operating efficiency, the incinera-tor should be designed for high temperature combustion to prevent odors, forcomplete combustion of all solid waste to minimize residue for ultimate disposal,and for reuse of the combustion products for energy production to minimizetreatment costs.
In addition, it is extremely important to know when to select incineration as aprime method of refuse treatment. Some of the major factors favoring a decisionfor selection of incineration are: (1) lack of abundant land for disposal; (2) avail-ability of an ideal central station site to minimize transportation costs and opti-mize environmental (aesthetic) appearances; (3) production of a very small vol-ume residue of organic-matter-free ash; (4) availability of a site relativelyunaffected by local weather conditions.
This treatment can handle a variable daily load with great efficiency and canprovide many by-product potentials, including waste heat, salvageable metalsand ash. It is equally important to be aware of situations which may dictateagainst incineration. For example: (1) a suitable central site in a densely built-uparea at a reasonable cost is often difficult to find; (2) management and opera-tional skills required are of a relatively high order; and (3) a large capital invest-ment with relatively high operating costs may be required. Incineration must berecognized not as an ultimate disposal system in that a disposable ash still re-mains.
The major components of a basic incineration system and their functions aresummarized briefly in Table V-1, below.
In addition, fragmentizers, pathological incinerators, electrostatic precipita-tors for stack gases, complete particulate matter removal, and various means ofresidual handling are often utilized when and if economic and environmentalconditions justify the expenditure.
Incinerators, whether local or central, should be located so as to be readily ac-cessible to existing main highways; to utilities such as water, electricity andtelephone; should not pose any sanitary or health problems in general or toneighborhood communities in particular. Specifically, it may be desirable tolocate central incinerators (1) near to a power station for zoning and trafficenhancement and for utilization of the excess heat obtained from burningrefuse; (2) near to an ocean, bay or large river to be used as cooling waters forspent steam and condensation; (3) near to the refuse-generating industries tominimize transportation costs; (4) on favorable subsurface foundation condi-tions; and (5) near to inexpensive lands to allow for the disposal of residues fromthe incinerator.

TABLE V-1: Major Components of a Basic Incineration System
Component Function
1-Truck scale Weighing, indicating, and recording of solids
2-Tipping floor Maneuvering, positioning and dumping of collec-tion trucks and trailers
3-Storage pit Providing about 24 hours feed storage
4-Cranes Charging the furnace via grapples
5-Furnace system Burning with proper air supplied to refuse
6-Residual (ash) removal Quenching bath and conveyorbeltforcontinuousremoval of flyash and undergrate siftings
7-Gas cleaning system Cooling and scrubbing (or precipitating) the par-ticulate matter from the stack gas
8-Exhaust stack Providing properpositive airdraftflow (enhancedby induced draft fans) of combustion gases
9-Building Providing space for administration, washroomstorage, and all services excluding tipping and airpollution control
10-Exterior treatment Providing parking and transportation services inas aesthetically pleasing a setting as possible
REFERENCES1. joint Treatment of Industrial and Municipal Wastewaters. Technical Practice Com-
mittee, Water Pollution Control Federation, Washington, D.C. 20037 (1976).
2. Federal Guidelines: Pretreatment of Pollutants Introduced into Publicly Owned
Treatment Works. U.S. Environmental Protection Agency, Washington, D.C. 20460 (Octo-
her 1973).
3. Federal Guidelines: State and Local Pretreatment Programs. (Pub. MCO-44), U.S.
Environmental Protection Agency, Washington, D.C. 20460 (January 1977).
4. Development Document for Interim Final Effluent Limitations Guidelines and Pro-
posed New Source Performance Standardsfor the Significant Inorganic Products-Segment
of the Inorganic Chemicals Manufacturing Point Source Category. Document
EPA-440/1-75/037. U.S. Environmental Protection Agency, Washington, D.C. 20460
(1975).
5. Fair, G.M., Geyer, J.C. & Okun, DA., Water and Wastewater Engineering, Vol. 2,
John Wiley & Sons, Inc., New York, N.Y. (1968).
6. Nemerow, N.L., Liquid Wastes of Industry-Theories, Practices, and Treatment. Ad-
dison-Wesley Publishing Co., Reading, Mass. (1971).
7. Merz, R.C. & Stone, R., Special Studies of a Sanitary Landfill, U.S. Department of
Health, Education, and Welfare, Washington, D.C. (1970). Available from National Techni-
cal Information Services, Springfield, Virginia 22161. Report PB-196.

Chapter VI:Economic Aspects andConsiderations
Assessing the costs and economic impact of environmental pollution is extremelydifficult, because of the many intangibles involved. Such costs may be dividedinto four categories, as follows:'
1. Damage costs-the costs from direct damages such as blighted crops, illhealth, higher death rates, etc.
2. Avoidance costs-the economic and social costs of attempts to avoiddamages caused by pollution. These could run from expenditures forhome air filtering equipment to the moving away from areas subject todamages by pollution.
3. Abatement costs-the costs of the resources devoted to reducing theamount of pollution. Also includes any adverse effects on economicgrowth, employment, and production.
4. Transactions costs-the costs for the resources used in the research,planning, administration and monitoring for pollution control.As is readily evident, many of these costs are not quantifiable because of thegaps in our knowledge as to their magnitude. Many of them cannot be expressedin monetary terms, and hence the traditional cost/benefit analytical procedures
cannot be applied.In the industrial sector costs must be allocated between society and industry.As pollution control measures are applied, costs to society decrease and costs toindustry increase. There is an optimum point at which these two are properlyallocated, as shown in Figure VI-1, below. Since industry generally passes itscosts on to the consumer, this may be considered to be the point at which society
begins to assume indirect payment of such costs. In certain competitive situa-tions, however, these costs are not passed on to the consumer.This chapter discusses these costs and their economic impacts. Examples arepresented which roughly relate monetary values to costs. However, in view of

FIGURE VI-1: Pollution Control Allocations: Society vs. Industry
TotalCosts
Cost Private
to Optimum (Industrial)
Society Cost
0 50 100
Treatment for Control (%)
past and anticipated inflationary trends, all figures should be adjusted to the
period when they are being applied to a specific problem.
AIRThe readily identifiable sufferers from the effects of air pollution are (1) human
beings-through effect on health, visibility, and aesthetics; (2) physical struc-
tures-through corrosion and deterioration of clothing, art and other treasures,
metals, rubber and paint and (3) agricultural plants.
The chemical components S02 and N02 bleach leaves and suppress growth of
some plants, including fruits and vegetables. The component S02 is largely
responsible for corrosion of metals, building materials, and fabrics when it is
converted into the acid form (H2SO4). Particulate matter, especially dust and
unburned carbon or ash, can cause clothes, fabric and household dirtying that
requires a great deal of both measurable and immeasurable cleaning costs. The
wearing and cracking of rubber, the fading and coloring of fabrics, the blacken-
ing of painted buildings, the staining of stone, as well as the deterioration of rails,
wire, electrical contacts, etc., are just a few of the examples of difficult to assess
depreciation of materials by air contaminants. Even more difficult to measure
and assess are the disintegrations to leather and paper and valuable pieces of art
by the gases and gritty particulates. Damages to the Roman Coliseum or the
Parthenon in Athens are examples of long-term, intangible costs resulting from
air pollution. In the United States figures of about US$60 to US$80 per person

per year have been quoted as arising from the measurable (excluding health)effects of air contaminants. Typical effects of sulfur dioxide on vegetation areshown in Figure VI-2.1
FIGURE VI-2: Effects of Sulfur Dioxide on Vegetation
3%of gardens injured
1 year Growth retardation and chlorosis ofwhite pine; 89% of gardn nue
81 % of pine trees1 monthhad no cones
4 days - Premature abscission of4 o ld e r le a v e s o f a lfa lfa 5 0 % le a f A d e str u c ti o
0
x Acute injury to leaves
a
Traces of leaf destruction in alfalfa1 Th
5min -
30 s -
3s0.01 0.02 0.05 0.1 0.2 0.5 1.0 2.0
Sulfur dioxide (ppm)
Range of concentrations and exposure times in which injury to vegetation hasbeen reported.
O Range of concentrations and exposure times of undetermined significance tovegetation.
1 ppm SO2 2.86 mg S02/m3
.

Table VI-1 presents a summary of selected studies on health damage costs
resulting from air pollution., Table VI-2 presents a summary of related studies
relating air pollution to damages to land values.I
The health effects of air pollution to humans largely affect the respiratory
system and mostly of those weakened persons already suffering from respiratory
or cardiovascular disease. Disasters, generally caused by a combination of air in-
versions and high industrial and auto outputs, accentuate the health effect. Nor-
mally inhaled gaseous pollutants can be absorbed along the pharynx of
bronchioles, and inhaled particulates can be deposited in the mucus layer sur-
rounding the bronchial cilia. In many persons these may already be damaged by
smoking or other irritants. Hence these people are much more sensitive to even
low levels of air contaminants. Figure VI-3 illustrates the effects of various sulfur
dioxide levels and exposures on human health.,
Accidents and additional operational costs of airplanes, trucks and autos are
caused by reduced visibility as a result of dust or smog caused by industrial air
emissions. These costs can be identified in some instances by case studies and
must be estimated in others.Air emission control must be included as a part of the cost of production by an
industrial plant. The extra cost-normally from 1% to 10% of the capital ex-
pense of a plant-can generally be passed on to the consumer in the price of the
product or deducted from the gross profits of the plant when it is not possible to
raise the product cost.Recent studies by the U.S. Environmental Protection Agency have identified
and quantified the capital and operating costs of a variety of air pollution control
systems.'4
WATERAt each level of receiving water quality there exists a given cost and also associ-
ated total benefits to society. Many of the damages and benefits are measurable
while others definitely exist but at present no method of their quantitative
evaluation is available. As long as the measurable benefits equal or exceed the
direct cost of industrial pollution control, waste treatment facilities should be
provided. Table VI-3 presents some typical health damage estimates attributa-
ble to water pollution.The cost of industrial pollution control varies from one industry to another and
even in the same industry within plants. The major reasons for these variations
within a given industry are: (a) extent of treatment used; (b) inclusion or exclu-
sion of costs which are designed to aid production as well as pollution abate-
ment; (3) difference in treatment units selected to accomplish similar objectives;
(4) amount of design or construction which is actually done "in house" and not
considered on a uniform basis as part of the cost; and (5) size of the treatment fa-
cility.In general, a conventional secondary treatment facility for an organ-laden in-
dustrial waste can cost in the range of $50 to $150 per pound (0.454 kg) of BOD
per day for capital expenses. Less conventional, more innovative treatment
systems can cost less than $50 per pound (0.454 kg) per day. For canneries, poul-
try processing, and tanneries, it is possible to design and construct treatment fa-
cilities yielding 85% BOD removal for the cost of about 1% of production or

TABLE VI-1: Summary of Selected Studies on Health Damage Costs fromAir Pollution
Estimated cost ofStudy Pollutants Diseases studied Effects observed effects for U.S. in Method of estimationmillions of dollarsper year
Ridker (1967) General air pollution Lung cancer, chronic Higher urban 360-400 Total costs of these diseases computedbronchitis, acute mortality rates for to include lost earnings, early burial,bronchitis, these diseases treatment, and absenteeism; basedemphysema, on urban-rural mortality differen-asthma. tials, 18-20 percent of costs attrib-pneumonia uted to air pollutionLave and Seskin Particulates,sulfates Bronchitis, lung Increased mortality 2,080 (mortality and Multiple regression analysis across U.S.(1970) cancer, other morbidity) and British cities; various othercancer, pneumonia, variables used to explain mortalityinfant mortality rates, including temperature-humid-ity, age, and raceJustus, Williams, Particulates, sulfur Respiratory disease Mortality and 62-311 Respiratory disease costs taken fromand Clement dioxide, nitrogen (nonrespiratory morbidity Ridker (1967); based on literature(1973) dioxide, oxidants, diseases assumed search, 95-99 percent of costs as-carbon monoxide to be unaffected signed to nonpollution factors such asby pollution) smokingJaksch and Airborne suspended Statistically signifi- (1) Multiple regression analysis; 14 otherStoevener (1974) particulates (other cant increase in variables included, such as age, sex,pollutants not number of hospital and temperature-humidity; overallmeasured) outpatients during explanatory power (R
2) of equationsand immediately is low
after highpollution daysI No national estimate.
Sources: R. G. Ridker, Economic Costs of Air Pollution: Studies in Measurement (New York: Frederick A. Praeger, 1967): L. B. Lave and E. P. Seskin, "'AirPollution and Human Health," Science, 169 (August 21. 1970) pp. 723-33; C. G. Justus, J. R. Williams, and J. 0. Clement, Economic Costs ofAir PolluionDamage, prepared for Southern Services. Inc., Birmingham, Alabama, by Science Technology and Research. Inc., Atlanta. May 1973; John A. Jaksch andHerbert H. Stoevener, Outpatient Medical Costs Related to Air Pollution in the Portland, Oregon Areat EPA 600/5-74-017 (Washington: Government PrintingOffice, 1974); J. Edward Singley et al., "A Benefit/Cost Evaluation of Drinking Water Hygiene Programs." prepared for the Environmental Protection Agency(preliminary, 1974); Fred H. Abel, Dennis P. Tihansky, and Richard G. Walsh, ''National Benefits of Water Pollution Control," Environmental ProtectionAgency (1975); Talbot Page, Robert H. Harris. and Samuel P. Epstein, ''Relation between Cancer Mortality and Drinking Water in Louisiana" (mimeo, 1975).
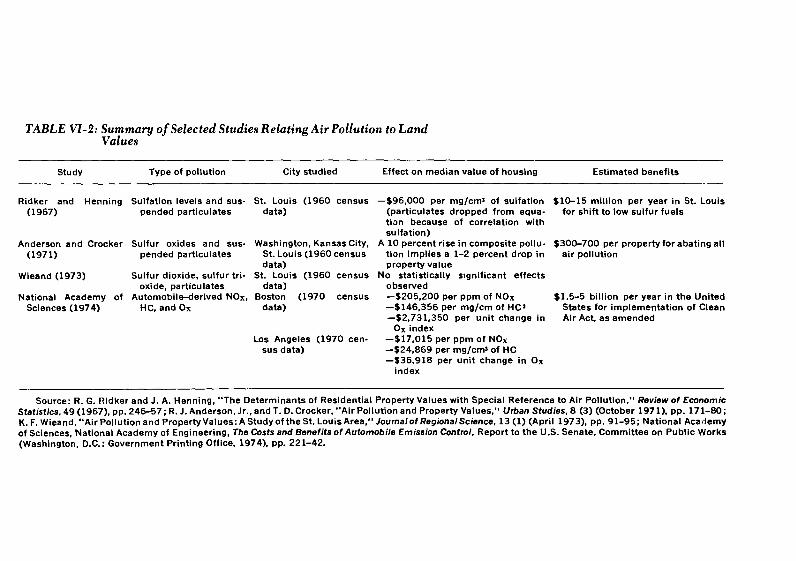
TABLE VI-2: Summary of Selected Studies Relating Air Pollution to Land
Values
Study Type of pollution City studied Effect on median value of housing Estimated benefits
Ridker and Henning Sulfation levels and sus- St. Louis (1960 census -$96,000 per mg/cm, of sulfation $10-15 million per year in St. Louis
(1967) pended particulates data) (particulates dropped from equa- for shift to low sulfur fuels
tion because of correlation withsulfation)
Anderson and Crocker Sulfur oxides and sus- Washington, Kansas City, A 10 percent rise in composite pollu- $300-700 per property for abating all
(1971) pended particulates St. Louis (1960 census tion implies a 1-2 percent drop in air pollution
data) property value
Wieand (1973) Sulfur dioxide, sulfur tri- St. Louis (1960 census No statistically significant effects
oxide, particulates data) observed
National Academy of Automobile-derived NOx, Boston (1970 census -$205,200 per ppm of NOx $1.5-5 billion per year in the United
Sciences (1974) HC, and Ox data) -$146,356 per mg/cm of HC3 States for implementation of Clean
-$2,731,350 per unit change in Air Act, as amended
Ox index
Los Angeles (1970 cen- -$17,015 per ppm of NOx
sus data) -$24,869 per mg/cm$ of HC-$36,918 per unit change in Ox
index
Source: R. G. Ridker and J. A. Henning, "The Determinants of Residential Property Values with Special Reference to Air Pollution," Review of Economic
Statistics' 49 (1967), pp. 246-57; R. J. Anderson, Jr., and T. D. Crocker, "Air Pollution and Property Values," Urban Studies, 8 (3) (October 1971), pp. 171-80;
K. F. Wieand, "Air Pollution and Property Values: A Study of the St. Louis Area," Journalof Regional Science, 13 (1) (April 1973), pp. 91-95; National Academy
of Sciences, National Academy of Engineering, The Costs and Benefits of Automobile Emission Control, Report to the U.S. Senate, Committee on Public Works
(Washington, D.C.: Government Printing Office, 1974), pp. 221-42.

FIGURE VI-3: Effects of Sulfur Dioxide on Health
10 years
Incesedcadoac rmobit
1 year
1 month - Increased hospitaladmissions
4days Increased incidence ofcardiorespiratory disease
In
1day Deterioration in health7 8 h of bronchitis patients
lh
o MORBIDITY IN MAN5min
* MORTALITY IN MAN
A MORBIDITY IN ANIMALS
30s - A MORTALITY IN ANIMALS30s \Increased airway
O at resistanceTaste threshold
O ,Odour threshold3 s I I m l I l I I I I I I l I 10.01 0.02 0.05 0.1 0.2 0.5 1.0 2.0 5.0 10.0
Sulfur dioxide (ppm) wHo 75351
Range of concentrations and exposure times in which deaths have been reported in excessof normal expectation.Range of concentrations and exposure times in which significant health effects have
hC been reported.
Ranges of concentrations and exposure times in which health effects are suspected.
1 ppm SO2 2.86 mg SO2/M3.

TABLE VI-3: Summary of Selected Studies on Health Damage Costs fromWater Pollution
Estimated cost ofStudy Pollutants Diseases studied Effects observed effects for U.S. in Method of estimation
millions of dollarsper year
Singley et al. (1974) Bacteria in drinking Salmonellosis, Bacteria count in 145 Multiple regression analysis across
water shigellosis, water supply has counties of reported diseases that
hepatitis statistically could be caused by water; other
significant effect explanatory variables include popula-
on reported cases tion density, age distribution, andincome; dollar cost assigned to eachcase-i.e., $184 for one case ofsalmonellosis
Abel, Tihansky, and Diseases carried in Various Mortality and 644 Tabulated reported cases attributed to
Walsh (1975) drinking water morbidity water, estimated number of unre-ported cases, assigned a dollar valueto each case, i.e., $1,250 for one caseof salmonellosis
Page, Harris, and Chlorinated hydro- Cancer Statistically signifi- (1) Multiple regression analysis across
Epstein (1975) carbons in drinking cant relationship Louisiana parishes; other explanatory
water between use of variables include median family in-
chlorinated come and fraction of work force in
Mississippi water petroleum and coal products indus-
and various triescancers
INo national estimate.
Sources: R. G. Ridker, Economic Costs of Air Pollution: Studies in Measurement (New York: Frederick A. Praeger, 1967); L. B. Lave and E. P. Seskin, "'Air
Pollution and Human Health," Science, 169 (August 21, 1970) pp. 723-33; C. G. Justus, J. R. Williams, and J. D. Clement, Economic Costs of Air Pollution
Damage, prepared for Southern Services, Inc., Birmingham, Alabama, by Science Technology and Research, Inc., Atlanta, May 1973; John A. Jaksch and
Herbert H. Stoevener, Outpatient Medical Costs Related to Air Pollution in the Portland, Oregon Area, EPA 600/5-74-017 (Washington: Government Printing
Officd, 1974); J. Edward Singley etal., "A Benefit/Cost Evaluation of Drinking Water Hygiene Programs," prepared for the Environmental Protection Agency
(preliminary, 1974); Fred H. Abel, Dennis P. Tihansky, and Richard G. Walsh, "National Benefits of Water Pollution Control," Environmental Protection
Agency (1975); Talbot Page, Robert H. Harris, and Samuel P. Epstein, ''Relation between Cancer Mortality and Drinking Water in Louisiana" (mimeo, 1975).

value added costs, which is equivalent to about 24 cents per 1000 gallons (3.78mi) of wastewater treated.
Benefit/Cost ConsiderationsBenefits accruing from industrial pollution abatement measures fall into threeclassifications:
* Primary benefits accumulate to those who benefit as a result ofproducts and services originating directly from the operation.These benefits are largely savings to the industrial plant as aresult of wastewater reuse as well as compliance with regulatoryagencies, thus avoiding legal, expert, and management costs.
* Secondary (indirect) benefits tend to accrue to those who do notuse the output of the product and services directly. Many readily-understood benefits of waste treatment fit into this category, suchas a community's recreational use of clean water downstreamafter waste treatment by an industry. The people of the com-munity in which the industry is located (or of a nearby communityto a lesser extent) benefit indirectly. This situation can be re-ferred to as a "technical external economy" for the community.
* Intangible benefits are irreducible since no direct monetary valuecan be easily assigned to them, although it is readily apparent thatthey exist. For example, waste treatment might improve themorale of the community by virtue of its possession of a cleanriver: a sort of mental well-being which, although real, defiesquantification. These benefits are necessarily subjective and re-ceive variable quantitative emphasis, depending on the positionof the beneficiaries in society. Other examples of intangible bene-fits which are frequently realized include:O1 Good public relations and an improved industrial image after
installation of pollution abatement devices;o Improved mental health of citizens in the area who will be
confident of having adequate waste treatment and cleanwaters;
El Improved conservation practices, which will eventually yieldbenefits in the form of more clean water for more people formore years;
El Renewal and preservation of scenic beauty and historical sites;O1 Residential development potential for land areas nearby
because of the presence of clean recreational waters;E] Elimination of relocation costs (of persons, groups, and estab-
lishments) because of impure waters;E: Removal of potential health hazards which could result from
using polluted water for recreation;El Industrial capital investment assuring permanence of the plant
in the area, thus lending confidence to other firms and citizensdepending on the output produced by the industry;

O Technological progress, resulting from the conception, design,
construction and operation of industrial waste treatment facil-
ities.
From a practical standpoint, waste treatment benefits are directly related to
the value of the downstream water and land resources affected by the facilities.
They should therefore include an allowance for (a) the lowered true cost of the
downstream waters; (b) reduced damages for consumers utilizing downstream
waters; and (c) increased opportunities for associated land and water usage
downstream resulting from quality improvement.
Costs of wastewater treatment can either be paid for directly by an industrial
plant, included in production costs and subsequently passed on to the consumer
(purchaser of the industry's products) or be subsidized either wholly or partly
by a local or national government in whose jurisdiction the plant is located. In
the first case the product buyers and users would pay only for the costs of pollu-
tion abatement. The risk capital or initial startup costs must be borne by the in-
dustrial plant which would anticipate reimbursement at a later date by product
purchases. In the second case, all residents of the local community or country
would assume their proportionate share of the costs at the onset of the abate-
ment program. These same people may or may not be recipients or purchasers of
the industrial product. In any event, they would be shouldering the burden of
pollution abatement costs in order to allow the industry to operate in an environ-
mentally safe manner and at a subsidized (artificial) lowered production cost.
In cases where industrial wastes can be discharged to a publicly-owned mu-
nicipal treatment plant the community will usually impose a charge on each in-
dustry for handling the wastes, either with or without pretreatment as the
character of the effluent may require. Charges will be based on the volume and
characteristics of the waste.
Charges should cover industry's share of the capital costs of the increased mu-
nicipal plant capacity required to handle the additional loadings. Charges should
also cover the added operation and maintenance costs resulting from acceptance
of the industrial effluents.,
Payment of the charges to the municipality may be made in a number of ways
such as direct user charges, annual payment, and ad valorem or other taxing
mechanism.
LANDLittle collection cost information is available on solid wastes from industrial
plants. This is because the collection systems are variable from one plant to
another and are often considered for accounting purposes to be just a part of
some production cost.
Municipal collection costs, however, are well known and represent about 80%
of the total disposal costs when sanitary landfill is used. Current U.S. collection
costs for municipal refuse are about $9 to $12 per short ton of refuse. Industrial
collection costs should represent a smaller percentage of the total cost since
larger concentrations of solids are found within shorter distances from each
other and at fewer sites. Also, when incineration of the solid wastes is utilized,
collection represents a much smaller percentage of total costs although approxi-
mately the same quantitative cost. A major portion of collection costs can be at-
tributed to personnel or labor. In industries where labor is abundant and inex-pensive these costs can be minimized, especially if these represent only the part-time duties of production personnel.
Disposal costs for landfill, whether municipal or industrial, should be similar ifrealistic land values are used. The capital costs should approximate $300 to$3000 per ton (907 kg) per day or $1.00 to $3.50 per ton (907 kg) for basic torefined sanitary landfill operations. Incinerator capital costs range from $5 to$20 per ton (907 kg) per day or $2.50 to $10 per ton (907 kg) of refuse.
Disposal techniques of solid waste by other methods such as rendering, openburning, or plain dumping are not suggested for industries. Composting,however, can be used for organic solid wastes such as those fromslaughterhouses and tanneries and fruit and vegetable processing plants. Theseplants cost about $10 per ton (907 kg) per day for capital costs and $6 per ton(907 kg) of solid waste to operate, based upon municipal refuse experience inthe United States (60% to 65% combustible).
Benefit/Cost ConsiderationsWhen land is preserved or utilized beneficially in a manner which results in noadverse effect on the total environment, the local inhabitants are recognized asobvious beneficiaries. Their daily lives, their homes, and even their work areenhanced by this type of pollution abatement. People living and working near aproperly utilized solid waste disposal or land utilization area will not suffer fromthe unsightliness, odors, or subsurface leachate contaminant. These becomedirect beneficiaries. The land area resulting from proper utilization and preser-vation usually belongs to local government, which also benefits from these ac-tivities. Since the adverse effects can travel many miles, other residents quitedistant from the land in question might also benefit from proper abatement.
Unfortunately, the major means available to date for paying for these neces-sary abatement services has been to charge the solid waste "Producers" (landusers) a direct charge based upon quantity of waste. It is not accepted practiceto charge the other direct or indirect beneficiaries for land disposal and utiliza-tion. Therefore, there exists little incentive to spend other than the bare mini-mum necessary for solids handling.
It is suggested that other beneficiaries be identified and assessed a smallcharge to gain additional revenue for reclaiming the land to its highest use.Perhaps solid waste disposal zones could be established, each zone paying adecreasing amount of revenue, as the distance from the land area increases.
REFERENCES1. U.S. Council on Environmental Quality. Sixth Annual Report. U.S. Government Print-ing Office, Washington, D.C. 20402. (December 1975) (pp. 494-515).2. Prinz, B., "Air Quality Standards and Their Application," in Manual on Urban AirQuality Management, WHO Regional Publications, European Series No. 1, Copenhagen(1976).
3. Capital and Operating Costs of Selected Air Pollution Control Systems. Doc.EPA-450/3-76/014, U.S. Environmental Protection Agency, Washington, D.C. 20460 (May1976).

4. Fabric Filter Costs for Large Coal-Fired Steam Generators. Contract No. 68-
02-2532, Task No. 5, U.S. Environmental Protection Agency, Washington, D.C. 20460
(August 1977).
5. Industrial Cost Recovery Systems. Doc. MCD-44, U.S. Environmental Protection
Agency, Washington, D.C. 20460 (November 1976).

Chapter VII:Sociological, Planning and PoliticalAspectsA town, a country, the world depend on a clean, desirable environment for theirsurvival. All three entities must continue to grow in order to provide the prod-ucts and income necessary to support more people, or even the same number ofpeople in more modern ways. The decision faced by towns, countries, or theworld is whether each will expend the money and effort to provide environmen-tal control and protection along with the increased production.
The alternative, that of protecting the environment with every increase in in-dustrial production, will cost money. It will result in either an increase in prod-uct cost or a decrease in industrial profit, or both. If industrial profits decreasesomewhat, it will be offset largely by increased sales in an expanding market.Thus gross and net industrial profits should increase in the long run.
PLANNING FOR ENVIRONMENTAL PROTECTIONLand area must be shared for major living purposes: household residences,schools, commercial stores, religious services, living, parks and recreation, mu-nicipal and other governmental buildings, and industrial plants. The exact pro-portion which should be dedicated to each of these uses is still debated amongplanners. The criteria for land area depend upon the philosophy, needs andspecial interests of the local citizenry and thus necessitate variation in require-ments from one area to the next. But the important fact to be remembered isthat a definite plan for shared land usages should be made prior to acceptance ofany new industrial plant. Land area for industrial plants should include ap-propriate provisions for liquid and solid waste disposal as well as allow for suffi-cient air space overlying the land area to assimilate the air contaminants fromplants. The basic principle to be followed is that land area should be used in sucha manner as to cause no adverse environmental consequences on any other landarea. Nor should the land area dedicated to industrial purposes be so large thatthe allocation or use of other proper land areas is either eliminated or totallyreduced to a level less than desirable for the community.

There are two main considerations as related to industry in municipal areas:
the type of production and its location within the community. Type of produc-
tion should depend upon the type of labor market available, needs and desires of
community and surrounding area, and the quantity, quality, and uses of environ-
mental resources such as receiving streams. For example, a community with lit-
tle or no receiving water should discourage plants producing pulp and paper,
steel, or textile finishing even though labor and needs of the local people are fa-
vorable for these plants.Even in the most developed countries it is recommended that all industries
locate in specifically zoned areas in which all plants operate. These industrial
zones need not be far from the municipality. They should be located so that pre-
vailing winds and waters lead wastes away from high concentrations of people,
but be convenient to raw materials for production and product distribution by
good transportation systems. Plants operating in the industrial zones should be as
compatible as possible. In fact, it would be extremely desirable for each plant to
be able to utilize the wastes from another for its production and in this way mini-
mize environmental quality control costs.There are both advantages and disadvantages to the location of all industrial
plants in these zones. Some of these are listed below. Should the disadvantages
of industrial zones outweigh the advantages, industrial plants should be dis-
persed throughout the community rather than in one area. In other words, in-
dustrial zoning, although more desirable if designed and operated properly, is
not necessarily always best for every community.
Advantages* A concentrated development of factories enhances the control of
environmental contamination. This presumes that there exist ade-
quate, enforceable legal means for restraining factories from
polluting the air, water or land. This presumes also that it is eco-
nomically feasible for each factory to continue in production after
providing efficient pollution control devices and systems. If these
presumptions are confirmed, then it will be easier to supervise or
administer environmental protection measures at all of the facto-
ries located in close proximity to each other.
* Proper types of industries can be selected on a prearranged and
preplanned scheme in order to minimize the overall effects of
pollution. For example, a plant producing an acid waste can be lo-
cated near a factory producing a basic waste-resulting in a
neutralized liquid wastewater usually requiring no costly adjust-
ment.* Industries can be selected to complement each other as far as
production is concerned. For example, the wastes of one plant can
serve as the raw material for the next. In that way normal waste
treatment costs can be minimized and raw material transportation
costs can also be minimized. An example is that of a
slaughterhouse producing blood and hides of animals as by-prod-
ucts for disposal or shipment to another factory. An adjacent tan-
nery could utilize the hides in making leather while another adja-

cent fertilizer manufacturer or plywood producer could utilizethe blood. Not only a saving in transportation cost but also inproduct preparation and preservation-such as salting of hides-would be possible. In turn, a glue manufacturing factory could belocated next to the tannery to receive and render the fleshingsinto both grease and animal glue. A soap manufacturer or the al-ready mentioned fertilizer manufacturer would be likely users ofthe grease.
Similar cases could be made for other complementary raw ma-terial-dependent industries, such as a sulfuric acid chemicalmanufacturer locating next to the steel mill producing a wasteFe2SO4 pickling liquor.
* By locating all factories in specially planned and zoned industrialareas, potential environmental contamination would be removedfrom residential and recreational areas of the community.
Disadvantages* If adequate, enforceable laws do not exist or if the economic load
of pollution control is too great, one factory might pollute a near-by industrial neighbor and the entire zone may become an "en-vironmental eyesore" to the community. More dispersions ofwastes may be preferable under those conditions.
* While industrial wastes and by-product uses may be matched, itmay be much more difficult to interest each complementary plantin locating in a specific area because of other reasons, such as mar-kets for products at the time.
* Even if complementary industries can be obtained for givenzones, the quantities of wastes produced by one may not matchthe raw material needs of another plant. Or the wastes from someplants-at their current optimum production level-may not beenough to neutralize the wastes from others at their productionlevel.
* Raw materials for some factories in an area may be less expensivefrom some other outside source rather than from an adjacentplant within the area. For example, sulfur may be less expensiveat the time from natural gas or petroleum refinery sour gas thanfrom steel mill pickling liquors or pyrites slag from mine opera-tions. In addition, prices and markets may change from month tomonth, even after a firm decision has been made on specific indus-tries and locations within the zoned areas.
Industrial plants producing air, water or solid wastes are frequently located inremote land areas of the local community which are readily accessible to manand relatively inexpensive to purchase. Often, entire industrial zones are setaside for this purpose with the basic premise that industry, because of commoninterests, needs, and environmental problems, is best placed in isolated zones.These zones permit different and sometimes lower environmental quality stan-dards than those of residential areas of the same communities. Political interests

often lead to preferred tax rates and land subsidization costs for industrial plants
located in these zones. Such circumstances may sometimes result in somewhat
higher environmental contamination in the same zones. However, wherever and
whenever contamination from these zones diffuses and flows out so as to affect
other people with other land uses, such pollution should be carefully controlled
and abated.
CONSIDERATIONS IN LOCATINGINDUSTRIAL PLANTS
An industrial plant should be located in areas which tend to minimize its en-
vironmental effects. This is especially true of large plants and those unsuitable
for one reason or another for location in industrial zones. Proper location of a
plant will not eliminate necessarily the need for final treatment for environmen-
tal protection but it may lessen the degree of treatment needed. A plant produc-
ing a large quantity of highly contaminated wastewater should be located, to the
extent possible:
1. On a watercourse having a maximum diluent waste-carrying capacity;
2. In an area where the wastewater can be reused, preferably with a mini-
mum of treatment, for agricultural or industrial purposes. The resulting
wastewater discharge to the watercourse, if any, should not interfere
with any downstream beneficial uses; and
3. Within a municipality which is able to accept the plant wastes in a prop-
erly designed and operated sewage treatment plant.
A plant producing a large volume of air contaminants should be located (from
an environmental standpoint) at a high elevation, in an area not subject to air in-
versions, and where the prevailing winds are towards relatively unpopulated
and/or unused land areas.A plant producing large volumes of solid wastes should be located on a large
enough plot to permit using landfill or other disposal methods on-site, in an area
close to a disposal site, or in an area readily accessible to private contractors for
collection and hauling to offsite disposal areas.
Solid wastes should not be allowed to accumulate at the plant site because
they tend to (1) decompose and yield odors; and (2) disperse by wind action,
become unsightly, and thus more difficult to collect fully.
ENVIRONMENTAL IMPACT ASSESSMENTAs a part of the planning process for industrial expansion or development it is
important that an assessment be made of the impact which the facility will have
on the environment. In essence, the assessment constitutes an analysis and
evaluation of all the factors affecting the quality of life in the area affected by
the installation. This is an essential component of the decision-making process. It
provides for an examination of a broad range of goals and alternatives, as well as
the opportunity for local participation in the decision-making process.
Attention has been focused on this aspect mainly in the past ten or so years.
The first substantial national legislation was enacted in the United States, with
passage of The National Environmental Policy Act of 1969 (NEPA), and subse-
quent amendments.'
The basic premise underlying the intent of the NEPA is that major policy deci-sions will be improved and a better balance maintained between developmentand environmental objectives if the entire range of parameters and alternativesis examined well before final decisions are made. Thus, a wide choice of optionswould still be open at a point where modifications to proposed plans could bemore readily made and accepted.2,3
In most countries there is little or no tradition of public involvement in techni-cal decision-making. Citizen advisory committees, so common in the UnitedStates, are almost unheard of elsewhere. Also, in most countries, environmentalstandards and regulations are in the evolving stage. Where they do exist, stan-dards are often expressed in general terms-particularly as related to industrialdischarges-and applicable criteria must be developed for specific situations.Existing social and institutional structures, poor economic conditions, and thelack of established mechanisms for public involvement further add to theproblem.,
Assessment techniques are relatively new, and still undergoing change and de-velopment. A number of handbooks, guides, articles, and other source informa-tion are available in the literature for ready reference. Some of these are citedbelow as typical of the materials available for reference.567
ENFORCEMENT FOR ENVIRONMENTALPROTECTION
Often the cost of any type of pollution control is relatively small and can be ab-sorbed in production costs or offset by governmental subsidization. However,the costs usually are reflected in the final product prices, which may make an in-dustry's product somewhat less competitive with that of similar industries inother countries. Political pressure will be brought upon the government agen-cies to relax environmental control requirements to eliminate the gap in produc-tion costs in order to increase competitiveness. It is important to recognize thisand to plan for political pressures being exerted for this purpose. It is importantthat a firm stand be taken against these pressures to assure that the environmentis not sacrificed unnecessarily and excessively in the name of competitiveness.
On the other hand, government may exert pressure on the industry to effectsome unnecessary or excessive environmental controls. Efforts should be madeto come to an agreement with government as to the precise environmental con-trols and effluent levels to be maintained by industry to protect the environmen-tal quality from deteriorating beyond the level necessary to support its bestusage. The objective here should be to provide ample, but not excessive,measures to protect environmental quality.
GOVERNMENTAL CONTROLSChapter II discussed the functions and roles of the various levels of govern-ment-local, state or provincial, national or federal, and international-in theprotection and maintenance of environmental quality. Each level views pollu-tion control from a different vantage point. Therefore, it can be expected thatdifferent types and directions of political pressure will be placed upon industry.For example, usually local government urgently desires and needs industrial

production but, at the same time, is most adamant about living with its pollution.
National governments may also wish for the industrial production at that site but
to a lesser degree (because of the varieties of choices for industrial sites, all
within its governmental jurisdiction) and may also be less concerned about local
pollution since it is further removed from the problem. However, it may be
forced to be more concerned and more demanding when it reflects the influence
being brought to bear upon it by international agencies. In each case, the posi-
tion of each governmental level should be ascertained in the planning stages so
that the plant's abatement measures will conform to the most limiting con-
straints placed upon it by any of the public agencies involved.
REFERENCES1. Public Law 91-900, The National Environmental Policy Act of 1969 (January 1,
1970), as amended by Public Law 94-83 (August 9, 1975). U.S. Government Printing Office,
Washington, D.C. 20402.
2. Anderson, Frederick R. "The National Environmental Policy Act: How Is It Working,
How Should It Work?". Environmental Law Reporter (January 1974).
3. Direct Environmental Factors at Municipal Wastewater Treatment Works. Publica-
tion MCD-20, U.S. Environmental Protection Agency, Washington, D.C. 20460 (January
1976).4. White, R.L. & Bears, G.D. "Four Developing Country Waste Disposal Projects" in
Environmental Impacts of International Civil Engineering Projects and Practices, edited
by C.G. Gunnerson & J.M. Kalbermatten. Preprint 2920, American Society of Civil
Engineers, 345 East Forty-Seventh Street, New York, N.Y. 10017 (October 1977).
5. Environmental, Health, and Human Ecologic Considerations in Economic Develop-
ment Projects. The World Bank, Washington, D.C. 20433 (May 1974).
6. Burchell, R.W. & Listotsin, D. The Environmental Impact Handbook, Center for Ur-
ban Policy Research, Rutgers-The State University, New Brunswick, New Jersey 08903
(1975).7. Proc. of Conference on The Use of Ecological Guidelines for Development in the
American Humid Tropics. IUCN Pub. No. 31, International Union for the Conservation of
Nature and Natural Resources, 1110 Morges, Switzerland (February 1974).
Appendices


Appendix A:Criteria and Standards

TABLE A-i: Standards of Performance for New Stationary Sources of Air Pollutiona
Source category Affected facility Pollutant Emission level Monitoring requirement
Subpart D:
Steam generators Coal fired boilers Particulate 0.10 lb/10 Btu No requirement
(> 250 million Btu/hr) Opacity 20% ContinuousS02 1.2 lb/106 Btu Continuous
Promulgated NOx 0.70 lb/106 Btu Continuous
12/23/71 (36 FR 24876) (except lignite andcoal refuse)
Revised7/26/72 (37 FR 14877) Oil fired boilers Particulate 0.10 lb/10 6 Btu No requirement
6/14/74 (39 FR 20790) Opacity 20%; 40% 2 min/hr Continuous
1/16/75 (40 FR 2803) S02 0.80 lb/10 6 Btu Continuous
10/6/75 (40 FR 46250) NOx 0.30 lb/10 6 Btu Continuous
Gas fired boilers Particulate 0.10 lb/106 Btu No requirement
Opacity 20% No requirement
NOx 0.20 lb/106 Btu Continuous
Subpart E:
Incinerators Incinerators Particulate 0.80 gr/dscf corrected to No requirement
(> 50 tons/day) 12% CO
Promulgated12/23/71 (36 FR 24876)
Revised6/14/74 (39 FR 20790)

Subpart F:
Portland cement plants Kiln Particulate 0.30 lb/ton No requirementOpacity 20% No requirement
Promulgated12/23/71 (36 FR 24876) Clinker cooler Particulate 0.10 lb/ton No requirement
Opacity 10% No requirementRevised6/14/74 (39 FR 20790) Fugitive emission Opacity 10% No requirement11/12/74 (39 FR 39874) points10/6/75 (40 FR 46250)
Subpart G:
Nitric acid plants Process equipment Opacity 10% No requirementNOx 3.0 lb/ton Continuous
Promulgated12/23/71 (36 FR 24876)
Revised5/23/73 (38 FR 13562)6/14/74 (39 FR 20790)10/6/75 (40 FR 46250)
Subpart H:
Sulfuric acid plants Process equipment SO2 4.0 lb/ton ContinuousAcid mist 0.15 lb/ton No requirement
Promulgated Opacity 10% No requirement12/23/71 (36 FR 24876)
Revised5/23/73 (38 FR 13562)6/14/74 (39 FR 20790)10/6/75 (40 FR 46250)

TABLE A-i: Standards of Performance for New Stationary Sources of Air Pollution (continued)
Source category Affected facility Pollutant Emission level Monitoring requirement
Subpart I:
Asphalt concrete plants Dryers; screening and Particulate 0.04 gr/dscf No requirementweighing systems; (90 mg/dscm)
Promulgated storage, transfer, and Opacity 20% No requirement
3/8/74 (39 FR 9308) loading systems; anddust handling equip-
Revised ment10/6/75 (40 FR 46250)
Subpart J:
Petroleum refineries Catalytic cracker Particulate 1.0 lb/1000 lb No requirementOpacity 30% (3 min. exemption) Continuous
Promulgated CO 0.05% Continuous
3/8/74 (39 FR 9308)Fuel gas combination S02 0.1 gr H2S/dscf Continuous
Revised (230 mg/dscm)10/6/75 (40 FR 46250)
Subpart K:
Storage vessels for Storage tanks Hydrocarbons For vapor pressure No requirement
petroleum liquids > 40,000 gal. capacity 78-570 mm Hg, equipwith floating roof, vapor
Promulgated recovery system, or
3/8/74 (39 FR 9308) equivalent; for vaporpressure > 570 mmHg,
Revised equip with vapor
4/17/74 (39 FR 13776) recovery system or
6/14/74 (39 FR 20790) equivalent
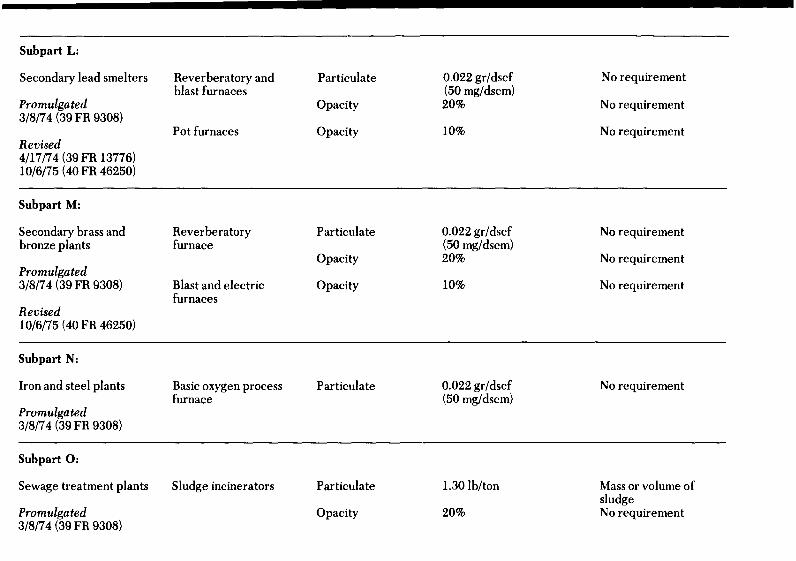
Subpart L:
Secondary lead smelters Reverberatory and Particulate 0.022 gr/dscf No requirementblast furnaces (50 mg/dscm)
Promulgated Opacity 20% No requirement3/8/74 (39 FR 9308)Pot furnaces Opacity 10% No requirementRevised
4/17/74 (39 FR 13776)10/6/75 (40 FR 46250)
Subpart M:
Secondary brass and Reverberatory Particulate 0.022 gr/dsef No requirementbronze plants furnace (50 mg/dscm)Opacity 20% No requirementPromulgated
3/8/74 (39 FR 9308) Blast and electric Opacity 10% No requirementfurnaces
Revised10/6/75 (40 FR 46250)
Subpart N:
Iron and steel plants Basic oxygen process Particulate 0.022 gr/dscf No requirementfurnace (50 mg/dscm)
Promulgated3/8/74 (39 FR 9308)
Subpart 0:
Sewage treatment plants Sludge incinerators Particulate 1.30 lb/ton Mass or volume ofsludgePromulgated Opacity 20% No requirement3/8/74 (39 FR 9308)
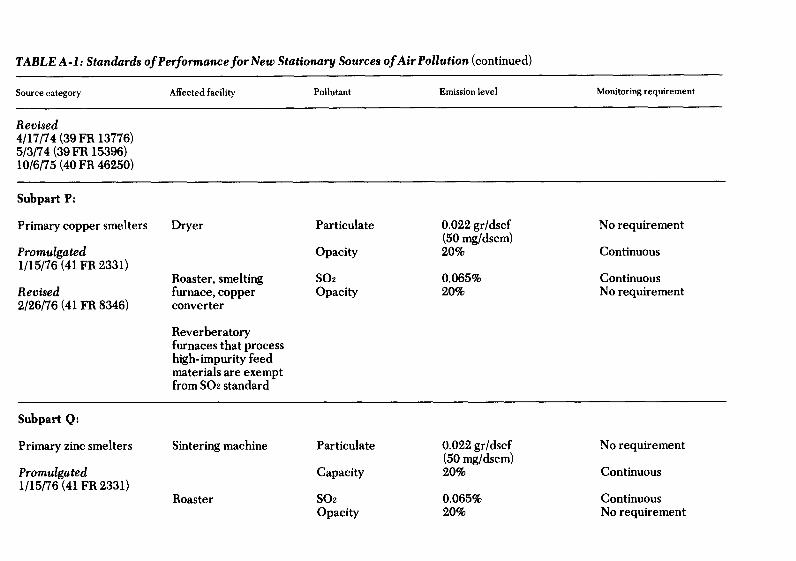
TABLE A-1: Standards of Performance for New Stationary Sources of Air Pollution (continued)
Source category Affected facility Pollutant Emission level Monitoring requirement
Revised4/17/74 (39 FR 13776)5/3/74 (39 FR 15396)10/6/75 (40 FR 46250)
Subpart P:
Primary copper smelters Dryer Particulate 0.022 gr/dscf No requirement(50 mg/dscm)
Promulgated Opacity 20% Continuous1/15/76 (41 FR 2331)
Roaster, smelting S02 0.065% Continuous
Revised furnace, copper Opacity 20% No requirement
2/26/76 (41 FR 8346) converter
Reverberatoryfurnaces that processhigh-impurity feedmaterials are exemptfrom S02 standard
Subpart Q:
Primary zinc smelters Sintering machine Particulate 0.022 gr/dscf No requirement(50 mg/dscm)
Promulgated Capacity 20% Continuous1/15/76 (41 FR 2331)
Roaster S02 0.065% ContinuousOpacity 20% No requirement

Subpart R:
Primary lead smelters Blast or reverberatory Particulate 0.022 gr/dscf No requirementfurnace, sintering (50 mg/dscm)
Promulgated machine discharge Opacity 20% Continuous1/15/76 (41 FR 2331) end
Sintering machine, S02 0.065% Continuouselectric smelting Opacity 20% No requirementfurnace, converter
Subpart S:
Primary aluminum Potroom groupreduction plants (a) Soderberg plant (a) Total fluorides 2.0 lb/ton No requirement
Opacity 10% No requirementPromulgated (b) Prebake plant (b) Total fluorides 1.9 lb/ton No requirement1/26/76 (41 FR 3825) Opacity 10% No requirementAnode bake plants Total fluorides 0.1 lb/ton No requirement
Opacity 20% No requirement
Subpart T:
Phosphate fertilizer Wet process Total fluorides 0.02 lb/ton Total pressure dropplants phosphoric acid across processscrubbing systemPromulgated
8/6/75 (40 FR 33152)
Subpart U: Superphosphoric acid Total fluorides 0.01 lb/ton Total pressure dropacross processscrubbing system
Subpart V: Diammonium Total fluorides 0.06 lb/ton Total pressure dropphosphate across process
scrubbing system

TABLE A-: Standards of Performance for New Stationary Sources of Air Pollution (continued)
Source category Affected facility Pollutant Emission level Monitoring requirement
Subpart W: Triple Total fluorides 0.2 lb/ton Total pressure drop
superphosphate across processscrubbing system
Subpart X: Granular triple Total fluorides 5.0 x 10⁻¹ lb/hr/ton Total pressure drop
superphosphate across processscrubbing system
Subpart Y:
Coal preparation plants Thermal dryer Particulate 0.031 gr/dscf Temperature scrubber(0.070 g/dscm) pressure loss water
Promulgated pressure
1/15/76 (41 FR 2232) Opacity 20% No requirement
Pneumatic coal Particulate 0.018 gr/dsef No requirement
cleaning equipment (0.040 g/dscm)Opacity 10% - No requirement
Processing and Opacity 20% No requirement
conveying equipment,storage systems,transfer and loadingsystems
Subpart Z:
Ferroalloy production Electric submerged Particulate 0.99 lb/Mw-hr (0.45 kg/ No requirement
facilities are furnaces Mw-hr) ("high silicon

alloys") 0.51 lb/Mw-hrPromulgated (0.23 kg/Mw-hr)5/4/76 (41 FR 18497) (chrome and manganese
alloys)Revised5/20/76 (41 FR 20659) No visible emissions may Flowrate monitoring in
escape furnace capture hoodsystem
No visible emission may Flowrate monitoring inescape tapping system hoodfor > 40% of eachtapping period
Opacity 15% ContinuousCO 20% volume basis No requirement
Dust handling Opacity 10% No requirementequipment
Subpart AA:
Iron and steel plants Electric arc furnaces Particulate 0.0052 gr/dsef No requirement(12 mg/dscm)
Promulgated Opacity9/23/75 (40 FR 43850) (a) control device 3% Continuous
(b) shop roof 0, except Flowrate monitoring in20%-charging capture hood, pressure40% - tapping monitoring in DSE
system
Dust handling Opacity 10% No requirementequipment
aChaput, L.S. "Federal Standards of Performance for New Stationary Sources of Air Pollution-A Summary of Regulations". J. Air Pollution ControlAssociation. 26, 11, 1044-1050. (November 1976)

TABLE A-2: Ranges of Uncontaminated and Hazardous Air Quality Levels
Contaminant Uncontaminated Hazardous to Humans
CO 0.03 ppm 50 ppm (90 min.)10 ppm (8 hrs.)
N02 4 ppb 0.06 ppm (mean 24 hrs.)
NO 2ppb
HC
CH4 1-1.5 ppm < 500 ppm (aliphatic)(alicyclic)
Other HC 0.1 ppm < 25 ppm (aromatic)< 0.06 ppm (HCHO)< 0.25 ppm (Acroloin)< 50 ppm (Acetaldehyde)
S02 < 0.002 ppm < 0.04 ppm
03 0.01-0.05 ppm < 0.3 ppm
Particulates 10-60 jLg/m3 < 80-100 /A g/m 3
a"Pollution Control Technology," Research and Education Association, New York, N.Y.
(1973)

TABLE A-3: New York State Classification and Standards for Surface Waters
Water StandardstMinimum Toxic wastes, deleterious substances,
dissolved oxygen Coliform bacteria colored wastes, heated liquids, Floating solids, settleableClass and best use' ml/liter median no/100 ml pH odor-producing substances t solids, oil, and sludge deposits
AA -Source of unfiltered 5.0 (trout) Not to exceed 6.5-8.5 None in sufficient amounts or at None attributable topublic water supply 4.0 (nontrout) 50 such temperatures as to be in- sewage, industrialand any other usage jurious to fish life or make the wastes or other wastes.
waters unsafe or unsuitable.A -Source of filtered 5.0 (trout) Not to exceed 6.5-8.5 None which are readily
public water supply 4.0 (nontrout) 5000 visible and attributableand any other usage to sewage, industrial
wastes or other wastes.B -Bathing and any 5.0 (trout) Not to exceed 6.5-8.5
other usages except 4.0 (nontrout) 2400as a source of publicwater supply
C -Fishing and any 5.0 (trout) Not applicable 6.5-8.5 None in sufficient amounts or atother usages except 4.0 (nontrout) such temperatures as to be in-public water supply jurious to fish life or impair theand bathing waters for any other best
usage.

TABLE A-3: New York State Classification and Standards for Surface Waters (continued)
Water Standardst
Minimum Toxic wastes, deleterious substances,
dissolved oxygen Coliform bacteria colored wastes, heated liquids, Floating solids, settleable
Class and best use* ml/liter median no/100 ml pH odor-producing substances f solids, oil, and sludge deposits
D -Natural drainage, 3.0 Not applicable 6.0-9.5 None in sufficient amounts or at
agriculture, and in- such temperatures as to pre-
dustrial water sup- vent fish survival or impair the
ply waters for agricultural pur-poses or any other best usage.
'Class B and C waters and marine waters shall be substantially free of pollutants that: unduly affect the composition of bottom fauna; unduly affect the
physical or chemical nature of the bottom; interfere with the propagation of fish. Class D and SD (marine) will be assigned only where a higher water
use class cannot be attained after all appropriate waste-treatment methods are utilized. Any water falling below the standards of quality for a given
class shall be considered unsatisfactory for the uses indicated for that class. Waters falling below the standards of quality for Class D or SD (marine)
shall be Class E or SE (marine), respectively, and considered to be in a nuisance condition.
tThese Standards do not apply to conditions brought about by natural causes. Waste effluents discharging into public water supply and recreation waters
must be effectively disinfected. All sewage-treatment plant effluents shall receive disinfection before discharge to a watercourse and/or coastal and
marine waters. The degree of treatment and disinfection shall be as required by the state pollution control agency. The minimum average daily flow for
seven consecutive days that can be expected to occur once in ten years shall be the minimum flow to which the standards apply.
Phenolic compounds cannot exceed 0.005 mg/liter; no odor-producing substances that cause the threshold-odor number to exceed 8 are permitted;
radioactivity limits are to be approved by the appropriate state agency, with consideration of possible adverse effects in downstream waters from dis-
charge of radioactive wastes, and limits in a particular watershed are to be resolved when necessary after consultation between states involved.

TABLE A-4: Pennsylvania State Effluent Standards for Pulp and Paper Mills
Population equivalent, per ton of Pounds of suspended solidsproduct, based on 5-day BOD per ton of product
Type of product or process 3-day average* 8-hr average 3-day average 8-hr average
Group ATissue paper 75 80 40 50Glassine paper 25 30 15 20Parchment paper 40 45 20 30Miscellaneous papers 25 30 5 10Flax papers-Condenser 375 415 300 350
Group B (specialty group)Fiber paper 800 850 200 235Asbestos paper 125 185 290 350Felt paper 210 230 60 65Insulating paper 2250 2500 325 350Specialty papers 1000 1200 135 160
Group C (coarse paper) 90 120 35 50Group D (integrated mills)
Wood preparation 80 100 40 50Pulp (sulfite) 3000 3500 35 40Pulp (alkaline) 300 350 20 35Pulp (groundwood) 115 130 80 85Pulp (de-inked unfilled stock) 500 650 375 500Pulp (de-inked filled stock) 400 500 600 800Pulp (rag cooking) 1400 1550 475 500Bleaching (long-fiber stock, multi-single-stage bleaching
and short-fiber stock, single-stage bleaching) 60 70 3 6Bleaching (short-fiber stock, multi-stage bleaching) 165 185 30 35Paper-making 100 125 75 85
*All averages are for periods of consecutive operation and may be divided by 907 to obtain values per kilogram of product.

TABLE A-5: Typical Mineral Concentrations for Uncontaminated Waters
Natural water types
Chemical Soft Soft Hard Hard
Component Expressed as Rain Surface Ground Surface Ground
Calcium CaCO3 equiv.,mg/i 16 30 29 80 142
Magnesium CaCO.,, mg/1 3 16 32 40 59
Sodium andPotassium Na, mg/1 6 9 26 19 20
Bicarbonate CaCO3, mg/1 12 42 60 106 143
Chloride Cl, mg/l 5 7 9 23 23
Sulfate S04 mg/I 10 12 17 38 59
Nitrate N, mg/I 0.1 1.5 - 0.4 0.06
Iron Fe, mg/I 0.0 1.1 1.8 0.0 0.18
Silica SiO2, mg/1 0 30 41 18 12
Carbon Dioxide CaCOa, mg/I 4 4 59 4 14
pH - 6.8 6.9 6.6 7.8 7.40

Appendix B:Glossary of Terms

GLOSSARY OF TERMSa
A pended solids. Advanced waste treat-ment, known as tertiary treatment, is
abatement: The method of reducing the the "polishing stage" of waste water
degree or intensity of pollution, also treatment and produces a high quality
the use of such a method. effluent.
absorption: The penetration of a sub- aeration: The process of being supplied
stance into or through another. For ex- or impregnated with air. Aeration is
ample, in air pollution control, absorp- used in waste water treatment to foster
tion is the dissolving of a soluble gas, biological and chemical purification.
present in an emission, in a liquid aerobic: This refers to life or processes
which can be extracted, that can occur only in the presence of
activated carbon: A highly adsorbent oxygen.
form of carbon, used to remove odors agricultural pollution: The liquid and
and toxic substances from gaseous solid wastes from all types of farming,
emissions. In advanced waste treat- including runoff from pesticides, fer-
ment, activated carbon is used to re- tilizers and feedlots; erosion and dust
move dissolved organic matter from from plowing, animal manure and car-
waste water. casses and crop residues and debris. It
activated sludge: Sludge that has been has been estimated that agricultural
aerated and subjected to bacterial ac- pollution in the U.S. has amounted to
tion, used to remove organic matter more than 2'/ billion tons per year.
from sewage. air mass: A widespread body of air with
activated sludge process: The process of properties that were established while
using biologically active sewage sludge the air was situated over a particular
to hasten breakdown of organic matter region of the earth's surface and that
in raw sewage during secondary waste undergoes specific modifications while
treatment. in transit away from that region.
acute toxicity: Any poisonous effect pro- air monitoring: See monitoring.
duced within a short period of time, air pollution: The presence of contami-
usually up to 24-96 hours, resulting in nants in the air in concentrations that
severe biological harm and often prevent the normal dispersive ability
death. of the air and that interfere directly or
adaptation: A change in structure or indirectly with man's health, safety or
habit of an organism that produces comfort or with the full use and enjoy-
better adjustment to the environment. ment of his property.
adsorption: The adhesion of a substance air pollution episode: The occurrence of
to the surface of a solid of liquid. Ad- abnormally high concentrations of air
sorption is often used to extract pollu- pollutants usually due to low winds
tants by causing them to be attached to and temperature inversion and accom-
such adsorbents as activated carbon or panied by an increase in illness and
silica gel. Hydrophobic, or water- death. See inversion.
repulsing adsorbents, are used to ex- air quality criteria: The levels of pollu-
tract oil from waterways in oil spills. tion and lengths of exposure at which
advanced waste treatment: Waste water adverse effects on health and welfare
treatment beyond the secondary or bi- occur.
ological stage that includes removal of air quality standards: The prescribed
nutrients such as phosphorus and level of pollutants in the outside air
nitrogen and a high percentage of sus- that cannot be exceeded legally during

a specified time in a specified geo- bar screen: In waste water treatment, agraphical area. screen that removes large floating andambient air: Any unconfined portion of suspended solids.
the atmosphere; the outside air. bioassay: The employment of livingaquifer: An underground bed or stratum organisms to determine the biologicalof earth, gravel or porous stone that effect of some substance, factor or con-contains water. dition.aquatic plants: Plants that grow in water biochemical oxygen demand (BOD): Aeither floating on the surface, growing measure of the amount of oxygen con-up from the bottom of the body of sumed in the biological processes thatwater or growing under the surface of break down organic matter in water.the water. Large amounts of organic waste use upassimilation: Conversion or incorporation large amounts of dissolved oxygen,of absorbed nutrients into protoplasm. thus the greater the degree of pollu-Also refers to the ability of a body of tion, the greater the BOD.
water to purify itself of organic pollu- biodegradable: The process of decompos-tion. ing quickly as a result of the action ofatmosphere: The layer of air surrounding microorganisms.
the earth. biological oxidation: The process bywhich bacterial and other microorga-nisms feed on complex organic materi-B als and decompose them. Self-purifica-tion of waterways and activated sludge
backfill: The material used to refill a ditch and trickling filter waste water treat-or other excavation, or the process of ment processes depend on this princi-doing so. ple. The process is also called bio-background level: With respect to air
pollution, amounts of pollutants pres- BOD: See biochemical oxygen demand.ent in the ambient air due to natural BOD5: The amount of dissolved oxygensources. consumed in five days by biologicalbacteria: Single-celled microorganisms processes breaking down organic mat-that lack chlorophyll. Some bacteria ter in an effluent. See biochemical ox-are capable of causing human, animal ygen demand.
or plant diseases, others are essential brackish water: A mixture of fresh andin pollution control because they salt water.break down organic matter in the airand in the water.
baffle: Any deflector device used to (change the direction of flow or thevelocity of water, sewage or products carbon dioxide (C02): A colorless, odor-of combustion such as fly ash or coarse less, nonpoisonous gas that is a normalparticulate matter. Also used in part of the ambient air. C02 is a prod-deadening sound. uct of fossil fuel combustion, and some
baghouse: An air pollution abatement researchers have theorized that excessdevice used to trap particulates by C02 raises atmospheric temperatures.filtering gas streams through large carbon monoxide (CO): A colorless,fabric bags, usually made of glass odorless, highly toxic gas that is a nor-fibers. mal byproduct of incomplete fossilbaling: A means of reducing the volume of fuel combustion. CO, one of the majorsolid waste by compaction. air pollutants, can be harmful in small

amounts if breathed over a certain coagulation: The clumping of particles in
period of time. order to settle out impurities; often in-
carcinogenic: Cancer producing. duced by chemicals such as lime or
cells: With respect to solid waste disposal, alum.
earthen compartments in which solid coliform organism: Any of a number of
wastes are dumped, compacted and organisms common to the intestinal
covered over daily with layers of tract of man and animals whose pres-
earth. ence in waste water is an indicator of
centrifugal collector: Any of several pollution and of potentially dangerous
mechanical systems using centrifugal bacterial contamination.
force to remove aerosols from a gas combustion: Burning. Technically, a
stream. rapid oxidation accompanied by the
cfs: Cubic feet per second, a measure of release of energy in the form of heat
the amount of water passing a given and light. It is one of the three basic
point. contributing factors causing air pollu-
channelization: The straightening and tion; the others are attrition and
deepening of streams to permit water vaporization.
to move faster, to reduce flooding or to comminution: Mechanical shredding or
drain marshy acreage for farming. pulverizing of waste, a process that
However, channelization reduces the converts it into a homogeneous and
organic waste assimilation capacity of more manageable material. Used in
the stream and may disturb fish breed- solid waste management and in the
ing and destroy the stream's natural primary stage of waste water treat-
beauty. ment.
chlorinated hydrocrabons: A class of composting: A controlled process of de-
generally long-lasting, broad-spec- grading organic matter by microorga-
trum insecticides of which the best nisms. (1) mechanical-a method in
known is DDT, first used for insect which the compost is continuously and
control during World War II. Other mechanically mixed and aerated. (2)
similar compounds include aldrin, ventilated cell-compost is mixed and
dieldrin, heptachlor, chlordane, lin- aerated by being dropped through a
dane, endrin, mirex, benzene hexa- vertical series of ventilated cells. (3)
chloride (BHC), and toxaphene. The windrow-an open-air method in
qualities of persistence and effective- which compostable material is placed
ness against a wide variety of insect in windrows, piles or ventilated bins or
pests were long regarded as highly de- pits and occasionally turned or mixed.
sirable in agriculture, public health The process may be anaerobic or aero-
and home uses. But later research has bic.
revealed that these same qualities may cover material: Soil that is used to cover
represent a potential hazard through compacted solid waste in a sanitary
accumulation in the food chain and landfill.
persistence in the environment. cyclone collector: A device used to col-
chlorination: The application of chlorine lect large-size particulates from pol-
to drinking water, sewage or industrial luted air by centrifugal force.
waste for disinfection or oxidation of
undesirable compounds.
clarification: In waste water treatment,
the removal of turbidity and sus-
pended solids by settling, often aided decomposition: Reduction of the net
by centrifugal action and chemically energy level and change in chemical
induced coagulation. composition of organic matter because

of the actions of aerobic or anaerobic dust: Fine-grain particulate matter that ismicroorganisms. capable of being suspended in air.
detergent: Synthetic washing agent that,like soap, lowers the surface tension ofwater, emulsifies oils and holds dirt insuspension. Environmentalists havecriticized detergents because most ecological impact: The total effect of ancontain large amounts of phosphorus-containing compounds that contribute envirnmeal che eitherynaturalto the eutrophication of waterways. oran
digestion: The biochemical decomposi-tion of organic matter. Digestion of ecolg the inter an nf ivingsewage sludge takes place in tanks tinst oe th d o tere-where the sludge decomposes, result- vionm o s fu ting in partial gasification, liquefactionand mineralization of pollutants. effluent: A discharge of pollutants into the
dilution ratio: The ratio of the volume of environment, partially or completelywater of a stream to the volume of in-coming waste. The capacity of a ally used in regard to discharges intostream to assimilate waste is partially waters.dependent upon the dilution ratio. electrodialysis: A process that uses
disinfection: Effective killing by chemical electrical current and an arrangementor physical processes of all organisms of permeable membranes to separatecapable of causing infectious disease. soluble minerals from water. OftenChlorination is the disinfection method used to desalinize salt or brackishcommonly employed in sewage treat- water.ment processes. electrostatic precipitator: An air pollu-
dissolved oxygen (DO): The oxygen dis- tion control device that removes par-solved in water or sewage. Adequately ticulate matter by imparting andissolved oxygen is necessary for the electrical charge to particles in a gaslife of fish and other aquatic organisms stream for mechanical collection on anand for the prevention of offensive electrode.odors. Low dissolved oxygen concen- emission standard: The maximum amounttrations generally are due to discharge of a pollutant legally permitted to beof excessive organic solids having high discharged from a single source, eitherBOD, the result of inadequate waste mobile or stationary.treatment. environment: The sum of all external
dissolved solids: The total amount of dis- conditions and influences affecting thesolved material, organic and inorganic, life, development and, ultimately, thecontained in water or wastes. Ex- survival of an organism.cessive dissolved solids make water environmental impact statement: Aunpalatable for drinking and unsuit- document prepared by a Federalable for industrial uses. agency on the environmental impact of
distillation: The removal of impurities its proposals for legislation and otherfrom liquids by boiling. The steam, major actions significantly affecting thecondensed back into liquid, is almost quality of the human environment. En-pure water; the pollutants remain in vironmental impact statements arethe concentrated residue. used as tools for decision making.
dump: A land site where solid waste is erosion: The wearing away of the landdisposed of in a manner that does not surface by wind or water. Erosion oc-protect the environment, curs naturally from weather or runoff

but is often intensified by man's land- chimney. Flue gas includes nitrogen
clearing practices. oxides, carbon oxides, water vapor and
eutrophication: The normally slow aging often sulfur oxides or particulates.
process by which a lake evolves into a flume: A channel, either natural or man-
bog or marsh and ultimately assumes a made, which carries water.
completely terrestrial state and disap- fly ash: All solids, including ash, charred
pears. During eutrophication the lake paper, cinders, dust, soot or other par-
becomes so rich in nutritive com- tially incinerated matter, that are car-
pounds, especially nitrogen and phos- red in a gas stream.phorus, that algae and other micro-scopic plant life become super-abun- fo Lu prices formdb n
dant, thereby "choking" the lake, andcausing it eventually to dry up. Eutro-
phication may be accelerated by manyhuman activities.
evaporation ponds: Shallow, artificial grain loading: The rate of emission of par-
ponds where sewage sludge is ticulate matter from a polluting
pumped, permitted to dry and either source. Measurement is made in grains
removed or buried by more sludge. of particulate matter per cubic foot of
gas emitted.
F ground cover: Grasses or other plantsgrown keep soil from being blown or
fabric filters: A device for removing dust washed away.
and particulate matter from industrial groundwater: The supply of freshwater
emissions much like a home vacuum under the earth's surface in an aquifer
cleaner bag. The most common use of or soil that forms the natural reservoir
fabric filters is the baghouse. for man's use.
fecal coliform bacteria: A group of organ- groundwater runoff: Groundwater that is
isms common to the intestinal tracts of discharged into a stream channel as
man and of animals. The presence of spring or seepage water.
fecal coliform bacteria in water is an
indicator of pollution and of poten-
tially dangerous bacterial contamina-tion.
filtration: In waste water treatment, the habitat: The sum total of environmental
mechanical process that removes par- conditions of a specific place that is oc-
ticulate matter by separating water cupied by an organism, a population or
from solid material usually by passing a community.
it through sand. hard water: Water containing dissolved
floc: A clump of solids formed in sewage minerals such as calcium, iron andbyoc Aioclu o hmcl cin magnesium. The most notable charac-by biological or chemical action.
teristic of hard water is its inability toflocculation: In waste water treatment, lather soap. Some pesticide chemicals
the process of separating suspended will curdle or settle out when added to
solids by chemical creation of clumps hard water.or floes. hazardous air pollutant: According to
flowmeter: In waste water treatment, a law, a pollutant to which no ambient
meter that indicates the rate at which air quality standard is applicable and
waste water flows through the plant. that may cause or contribute to an in-
flue gas: A mixture of gases resulting from crease in mortality or in serious illness.
combustion and emerging from a For example, asbestos, beryllium and

mercury have been declared haz- incineration: The controlled process byardous air pollutants. which solid, liquid or gaseous cor-
heat island effect: An air circulation bustible wastes are burned andproblem peculiar to cities. Tall build- changed into gases; the residue pro-ings, heat from pavements and concen- duced contains little or no combustibletrations of pollutants create a haze material.dome that prevents rising hot air from incinerator: An engineered apparatusbeing cooled at its normal rate. A self- used to burn waste substances and incontained circulation system is put in which all the combustion factors-motion that can be broken by rela- temperature, retention time, tur-tively strong winds. If such winds areabsent, the heat island can trap high controlled.
concntrtios o polutats nd re- infiltration: The flow of a fluid into a sub-concentrations of pollutants and pre-sent a serious health problem. stance through pores or small open-
ings. Commonly used in hydrology tohi-volume sampler: A device used in the denote the flow of water into soil mate-
measurement and analysis of sus- rial.pended particulate pollution. Also interceptor sewers: Sewers used to col-called a Hi-Vol. lect the flows from main and trunk
hydrocarbons: A vast family of com- sewers and carry them to a centralpounds containing carbon and hy- point for treatment and discharge. In adrogen in various combinations, found combined sewer system, where streetespecially in fossil fuels. Some hy- runoff from rains is allowed to enterdrocarbons are major air pollutants, the system along with sewage, inter-some may be carcinogenic and others ceptor sewers allow some of thecontribute to photochemical smog. sewage to flow untreated directly into
hydrogen sulfide (H2S): A malodorous gas the receiving stream, to prevent themade up of hydrogen and sulfur with plant from being overloaded.the characteristic odor of rotten eggs. interstate waters: According to law,It is emitted in the natural decomposi- waters defined as: (1) rivers, lakes andtion of organic matter and is also the other waters that flow across or from anatural accompaniment of advanced part of State or international bound-stages of eutrophication. H2S is also a aries; (2) waters of the Great Lakes;byproduct of refinery activity and the (3) coastal waters-whose scope hascombustion of oil during power plant been defined to include ocean watersoperations. In heavy concentrations, it seaward to the territorial limits andcan cause illness. waters along the coastline (including
hydrology: The science dealing with the inland streams) influenced by the tide.properties, distribution and circulation inversion: An atmospheric conditionof water and snow. where a layer of cool air is trapped by
a layer of warm air so that it cannotrise. Inversions spread polluted airhorizontally rather than vertically so
implementation plan: A document of the that contaminating substances cannotsteps to be taken to ensure attainment be widely dispersed. An inversion ofof environmental quality standards several days can cause an air pollutionwithin a specified time period. Imple- episode.mentation plans are required by vari-ous laws. J-K-L
impoundment: A body of water, such as apond, confined by a dam, dike, flood- lagoon: In waste water treatment, agate or other barrier, shallow pond usually man-made

where sunlight, bacterial action and nitrogen dioxide (N02): A compound
oxygen interact to restore waste water produced by the oxidation of nitric ox-
to a reasonable state of purity. ide in the atmosphere; a major con-
leachate: Liquid that has percolated tributor to photochemical smog.
through solid waste or other mediums nitrogenous wastes: Wastes of animal or
and has extracted dissolved or sus- plant origin that contain a significant
pended materials from it. concentration of nitrogen.
leaching: The process by which soluble NO,: A notation meaning oxides of
materials in the soil, such as nutrients, nitrogen. See nitric oxide.
pesticide chemicals or contaminants, nutrients: Elements or compounds essen-
are washed into a lower layer of soil or tial as raw materials for organism
are dissolved and carried away by growth and development; for example,
water. carbon, oxygen, nitrogen and phos-
M phorus
marsh: A low-lying tract of soft, wet land 0that provides an important ecosystem
for a variety of plant and animal life open burning: Uncontrolled burning of
but often is destroyed by dredging and wastes in an open dump.
filling. open dump: See dump.
methane: Colorless, nonpoisonous and organic: Referring to or derived from liv-
flammable gaseous hydrocarbon. ing organisms. In chemistry, any com-
Methane (CA4) is emitted by marshes pound containing carbon.
and by dumps undergoing anaerobic organism: Any living human, plant or
decomposition. animal.
mgd: Millions of gallons per day. Mgd is outfall: The mouth of a sewer, drain or
commonly used to express rate of flow. conduit where an effluent is dis-
mobile sources: A moving source of air charged into the receiving waters.
pollution such as an automobile. oxidation: A chemical reaction in which
monitoring: Periodic or continuous deter- oxygen unites or combines with other
mination of the amount of pollutants or elements. Organic matter is oxidized
radioactive contamination present in by the action of aerobic bacteria; thus
the environment. oxidation is used in waste water treat-
ment to break down organic wastes.
N oxidation pond: A man-made lake orpond in which organic wastes are
natural gas: A fuel gas occurring naturally reduced by-bacterial action. Often ox-
in certain geologic formations. Natural ygen is bubbled through the pond to
gas is usually a combustible mixture of speed the process.
methane and hydrocarbons. ozone (03): A pungent, colorless, toxic
nitric oxide (NO): A gas formed in great gas. Ozone is one component of photo-
part from atmospheric nitrogen and chemical smog and is considered a ma-
oxygen when combustion takes place jor air pollutant.
under high temperature and high
pressure, as in internal combustion
engines. NO is not itself a pollutant; Phowever, in the ambient air, it converts
to nitrogen dioxide, a major contribu- particulates: Finely divided solid or liquid
tor to photochemical smog. particles in the air or in an emission.

Particulates include dust, smoke, potable water: Water suitable for drink-fumes, mist, spray and fog. ing or cooking purposes from both
particulate loading: The introduction of health and aesthetic considerations.particulates into the ambient air. ppm: Parts per million. The unit com-
pathogenic: Causing or capable of caus- monly used to represent the degree ofing disease. pollutant concentration where the
percolation: Downward flow or infiltra- centrations are given inrpercntion of water through the pores or Thus BOD is represented in ppmspaces of a rock or soil. while suspended solids in water are ex-
pesticide: An agent used to control pests. pressed in percentages. In air, ppm isThis includes insecticides for use usually a volume/volume ratio; inagainst harmful insects; herbicides for water, a weight/volume ratio.weed control; fungicides for control of precipitate: A solid that separates from aplant diseases; rodenticides for killing solution because of some chemical orrats, mice, etc.; and germicides used in physical change or the formation ofdisinfectant products, algaecides, such a solid.slimicides, etc. Some pesticides can precipitators: In pollution control work,contaminate water, air or soil and ac-cumulate in man, animals and the en- trol devices usually using mechanical/vironment, particularly if they are electrical means to collect particulatesmisused. Certain of these chemicals from an emission.have been shown to interfere with thereproductive processes of predatory pretreatment: In waste water treatment,birds and possibly other animals. any process used to reduce pollution
load before the waste water is in-pH: A measure of the acidity or alkalinity troduced into a main sewer system orof a material, liquid or solid. pH is delivered to a treatment plant for sub-represented on a scale of 0 to 14 with 7 stantial reduction of the pollution load.representing a neutral state, 0 repre-senting the most acid and 14, the mostalkaline.
phosphorus: An element that while essen-tial to life, contributes to the eutrophi- quencnAaterilled ucation of lakes and other bodies ofwater.
plume: The visible emission from a flue or Rchimney.
point source: In air pollution, a stationary radiation: The emission of fast atomicsource of a large individual emission, particles or rays by the nucleus of angenerally of an industrial nature. This atom. Some elements are naturallyis a general definition, point source is radioactive while others becomelegally and precisely defined in Feder- radioactive after bombardment withal regulations. See area source. neutrons or other particles. The three
major forms of radiation are alpha,pollutant: Any introduced gas, liquid or beta and gamma.
solid that makes a resource unfit for a radiation standards: Regulations that in-specific purpose. dude exposure standards, permissible
pollution: The presence of matter or of concentrations and regulations forenergy whose nature, location or quan- transportation.tity produces undesired environmental raw sewage: Untreated domestic or com-effects. mercial waste water.

receiving waters: Rivers, lakes, oceans or sanitary landfill: A site for solid waste dis-
other bodies that receive treated or posal using sanitary landfilling tech-
untreated waste waters. niques.
recycling: The process by which waste sanitary landfilling: An engineered meth-
materials are transformed into new od of solid waste disposal on land in a
products in such a manner that the manner that protects the environment;
original products may lose their iden- waste is spread in thin layers, com-
tity. pacted to the smallest practical vol-
refuse: See solid waste. ume and covered with soil at the end
refuse reclamation: The process of con-
verting solid waste to saleable prod- sanitary sewers: Sewers that carry only
ucts. For example, the composting of domestic or commercial sewage. Storm
organic solid waste yields a saleable water runoff is carried in a separate
soil conditioner. system. See sewer.
Ringelmann chart: A series of illustra- scrap: Discarded or rejected materials
tions ranging from light grey to black that result from manufacturing or
used to measure the opacity of smoke fabricating operations and are suitable
emitted from stacks and other sources. for reprocessing.
The shades of grey simulate various screening: The removal of relatively
smoke densities and are assigned num- coarse floating and suspended solids by
bers ranging from one to five. straining through racks or screens.
Ringelmann No. 1 is equivalent to 20 scrubber: An air pollution control device
percent dense; No. 5 is 100 percent that uses a liquid spray to remove
dense. Ringelmann charts are used in pollutants from a gas stream by ab-
the setting and enforcement of emis- sorption or chemical reaction. Scrub-
sion standards. bers also reduce the temperature of
river basin: The total area drained by a the emission.
river and its tributaries. secondary treatment: Waste water treat-
rubbish: A general term for solid waste- ment, beyond the primary stage, in
excluding food waste and ashes- which bacteria consume the organic
taken from residences, commercial es- parts of the wastes. This biochemical
tablishments and institutions. action is accomplished by use of trick-
runoff: The portion of rainfall, melted ling filters or the activated sludge pro-
snow or irrigation water that flows cess. Effective secondary treatment
across ground surface and eventually removes virtually all floating and set-
is returned to streams. Runoff can pick tleable solids and approximately 90
up pollutants from the air or the land percent of both BOD5 and suspended
and carry them to the receiving solids. Customarily, disinfection by
waters. chlorination is the final stage of thesecondary treatment process.
sedimentation: In waste water treatment,
S the settling out of solids by gravity.sedimentation tanks: In waste water
salvage: The utilization of waste materi- treatment, tanks where the solids are
als. allowed to settle or to float as scum.
sanitation: The control of all the factors Scum is skimmed off; settled solids are
in man's physical environment that ex- pumped to incinerators, digesters,
ercise or can exercise a deleterious filters or other means of disposal.
effect on his physical development, seepage: Water that flows through the
health and survival, soil.

septic tank: An underground tank used solid waste: Useless, unwanted or dis-for the deposition of domestic wastes. carded material with insufficient liquidBacteria in the wastes decompose the content to he free flowing. Also seeorganic matter, and the sludge settles waste. (1) agricultural-solid wasteto the bottom. The effluent flows that results from the raising andthrough drains into the ground. Sludge slaughtering of animals, and the pro-is pumped out at regular intervals. cessing of animal products and orchard
and field crops. (2) commercial -wastesettleable solids: Bits of debris and fine generated by stores, offices and other
matter heavy enough to settle out of activities that do not actually turn outwaste water. a product. (3) industrial-waste that
settling chamber: In air pollution control, results from industrial processes anda low-cost device used to reduce the manufacturing. (4) institutional-velocity of flue gases usually by means waste originating from educational,of baffles, promoting the settling of fly health care and research facilities. (5)ash. municipal-residential and commer-
settling tank: In waste water treatment, a cial solid waste generated within atank or basin in which settleable solids community. (6) pesticide-the residueare removed by gravity. from the manufacturing, handling or
sewage: The total of organic waste andkilling
waste water generated by residential tlat tanmallyoriginaesinand commercial establishments.
a residential environment. Sometimessewage lagoon: See lagoon. called domestic solid waste.sewerage: The entire system of sewage solid waste disposal: The ultimate dis-
collection, treatment and disposal. position of refuse that cannot beAlso applies to all effluent carried by salvaged or recycled.sewers whether it is sanitary sewage, solid waste management: The pur-industrial wastes or storm water run- poseful, systematic control of the gen-off. eration, storage, collection, transport,
silt: Finely divided particles of soil or separation, processing, recycling, re-rock. Often carried in cloudy suspen- covery and disposal of solid wastes.sion in water and eventually deposited soot: Agglomerations of tar-impregnatedas sediment. carbon particles that form when car-
skimming: The mechanical removal of oil bonaceous-material does not undergoor scum from the surface of water, complete combustion.
sorption: A term including both adsorp-sludge: The construction of solids re- tion and absorption. Sorption is basic tomoved from sewage during wastewater treatment. Sludge disposal is gaseous and particulate pollutantsthen handled by incineration, dumping from an emission and to clean up oilor burial. spills.
smog: Generally used as an equivalent of stabilization: The process of convertingair pollution, particularly associated active organic matter in sewage sludgewith oxidants.withoxidnts.or solid wastes into inert, harmless ma-
smoke: Solid particles generated as a terial.result of the incomplete combustion of stabilization ponds: See lagoon, oxidationmaterials containing carbon. pond.
SOx: A symbol meaning oxides of sulfur. stack: A smokestack; a vertical pipe orsoft detergents: Biodegradable deter- flue designed to exhaust gases and sus-
gents. pended particulate matter.

stack effect: The upward movement of ical stage that includes removal of
hot gases in a stack due to the tem- nutrients such as phosphorus and
perature difference between the gases nitrogen, and a high percentage of sus-
and the atmosphere. pended solids. Tertiary treatment, also
stationary source: A pollution emitter known as advanced waste treatment,
that is fixed rather than moving, as an produces a high quality effluent.
automobile. thermal pollution: Degradation of water
storm sewer: A conduit that collects and quality by the introduction of a heated
transports rain and snow runoff back to effluent. Primarily a result of the dis-
the ground water. In a separate charge of cooling waters from in-
sewerage system, storm sewers are en- dustrial processes, particularly from
tirely separate from those carrying do- elctriaipower nra Even
mestic and commercial waste water. smeatios froma noraluater
stratification: Separating into layers. Thermal pollution usually can be con-
sulfur dioxide (SO2) A heavy, pungent, trolled by cooling towers.
colorless gas formed primarily by the toxicity: The quality or degree of being
combustion of fossil fuels. S02 dam- poisonous or harmful to plant or
ages the respiratory tract as well as animal life.
vegetation and materials and is con- trickling filter: A device for the biological
sidered a major air pollutant. or secondary treatment of waste water
sump: A depression or tank that serves as consisting of a bed of rocks or stones
a drain or receptacle for liquids for that support bacterial growth. Sewage
salvage or disposal. is trickled over the bed enabling thebacteria to break down organic wastes.
surveillance system: A monitoring systemto determine environmental quality. turbidity: A thick, hazy condition of air
Surveillance systems should be estab- due to the presence of particulates or
lished to monitor all aspects of other pollutants, or the similar cloudy
progress toward attainment of en- condition in water due to the suspen-
vironmental standards and to identify sion of silt or finely divided organic
potential episodes of high pollutant matter.
concentrations in time to take preven-
tive action.
suspended solids (SS): Small particles ofsolid pollutants in sewage that con-tribute to turbidity and that resist sep- urn rnff: tr wat from city
aration by conventional means. The
examination of suspended solids and tains a great deal of litter and organic
the BOD test constitute the two main and bacterial wastes.
determinations for water quality per-formed at waste water treatment facil-
ities. s
variance: Sanction granted by a governing
T body for delay or exception in the ap-plication of a given law, ordinance or
tailings: Second grade or waste material regulation.
derived when raw material is screened vector: Disease vector-a carrier, usually
or processed. an arthropod, that is capable of
tertiary treatment: Waste water treat- transmitting a pathogen from one
ment beyond the secondary, or biolog- organism to another.

water quality criteria: The levels ofW pollutants that affect the suitability of
water for a given use. Generally, water
waste: Also see solid waste. (1) bulky use classification includes: publicwaste-items whose large size pre- water supply; recreation; propagationcludes or complicates their handling of fish and other aquatic life; agricul-by normal collection, processing or tural use and industrial use.disposal methods. (2) construction and water quality standard: A plan for waterdemolition waste-building materials quality management containing fourand rubble resulting from construc- major elements: the use (recreation,tion, remodeling, repair and demoli- drinking water, fish and wildlife prop-tion operations. (3) hazardous waste- agation, industrial or agricultural) towastes that require special handling to be made of the water; criteria to pro-avoid illness or injury to persons or tect those uses; implementation plansdamage to property. (4) special (for needed industrial-municipal wastewaste-those wastes that require ex- treatment improvements) and enforce-traordinary management. (5) wood ment plans, and an anti-degradationpulp waste-wood or paper fiber statement to protect existing highresidue resulting from a manufacturing quality waters.process. (6) yard waste-plant clip-pings, prunings and other discarded wtredr bmaterial from yards and gardens. Alsoknown as yard rubbish. water supply system: The system for the
waste water: Water carrying wastes from collection, treatment, storage and dis-homes, businesses and industries that tribution of potable water from theis a mixture of water and dissolved or sources of supply to the consumer.suspended solids. water table: The upper level of ground
water pollution: The addition of sewage,industrial wastes or other harmful orobjectionable material to water in con- -
centrations or in sufficient quantities toresult in measurable degradation of zooplankton: Planktonic animals thatwater quality, supply food for fish.
aStuddard GJ. Common Environmental Terms-A Glossary. US. Environmental Protection Agency, Washingto k D.C.20460 (1973).


Appendix C:Conversion Factors
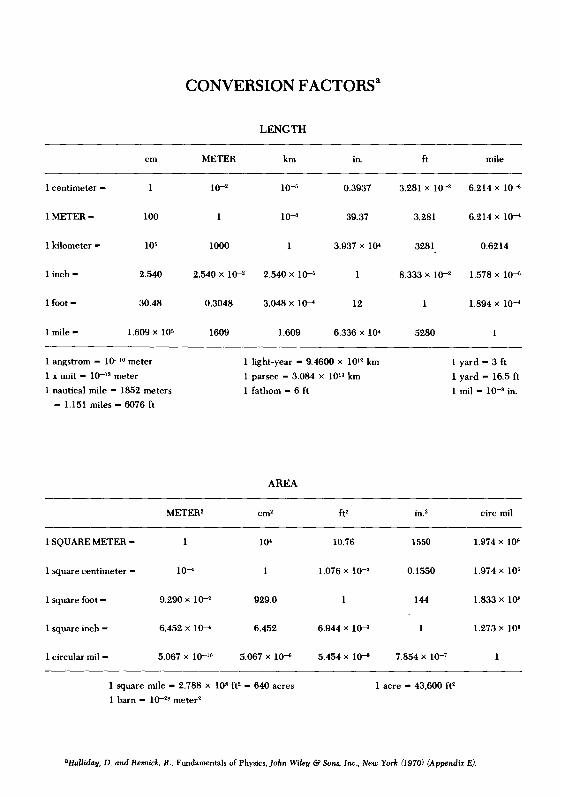
CONVERSION FACTORSa
LENGTH
cm METER km in. ft mile
1 centimeter - 1 10- 10-6 0.3937 3.281 x 10⁻² 6.214 x 10-
1 METER - 100 1 10-1 39.37 3.281 6.214 x 10⁻⁴
1 kilometer - 105 1000 1 3.937 x 10⁴ 3281 0.6214
1 inch - 2.540 2.540 x 10- 2.540 x 10⁻⁶ 1 8.333 x 10⁻² 1.578 x 10⁻¹
1 foot - 30.48 0.3048 3.048 x 10- 12 1 1.894 x 10-
I mile - 1.609 x 10⁵ 1609 1.609 6.336 x 10⁴ 5280 1
1 angstrom - 10-10 meter 1 light-year - 9.4600 x 10¹² km 1 yard - 3 ft
1 x unit - 10-1 meter 1 parsec - 3.084 x 10¹³ km 1 yard - 16.5 ft
1 nautical mile - 1852 meters 1 fathom - 6 ft 1 mil - 10- in.
- 1.151 miles - 6076 ft
AREA
METER' cm ft2 in.2 circ mil
1 SQUARE METER - 1 104 10.76 1550 1.974 x 101
1 square centimeter - 10- 1 1.076 x 10⁻¹ 0.1550 1.974 x 101
1 square foot- 9.290 x 10⁻² 929.0 1 144 1.833 x 101
1 square inch - 6.452 x 10- 6.452 6.944 x 10- 1 1.273 x 10⁶
I circular mil - 5.067 x 10-t 5.067 x 10-s 5.454 x 10- 7.854 x 10⁻¹ 1
1 square mile - 2.788 x 108 ft2 - 640 acres 1 acre - 43,600 ft2
1 barn - 10-28 meter2
aHalliday, D. and Renick, R., Fundamentals of Physics, John Wiley & Sons, Inc., New York (1970) (Appendix E).

VOLUME
METER3 cm, li ft3 in.3
I CUBIC METER - 1 106 1000 35.31 6.102 x 10⁴
1 cubic centimeter - 10< 1 1.000 x 10- 3.531 x 10- 6.102 x 10⁻²
1 liter - 1.000 x 10⁻³ 1000 1 3.531 x 10⁻¹ 61.02
1 cubic foot - 2.832 x 10⁻² 2.832 x 10⁴ 28.32 1 1728
1 cubic inch - 1.639 x 10⁻⁵ 16.39 1.639 x 10⁻² 5.787 x 10- 1
I U.S. fluid gallon - 4 U.S. fluid quarts - 8 U.S. pints - 128 U.S. fluid ounces - 231 in.3
1 British imperial gallon - 277.4 in.3
I liter - the volume of 1 kg of water at its maximum density - 1000.028 cm3
MASS
Quantities in the shaded areas are not mass units but are often used as such. When we write, for ex-ample, 1 kg "-" 2.205 lb this means that a kilogram is a mass that weighs 2.205 pounds under stan-dard condition of gravity (g - 9.80665 meters/sec2).
gm KG slug amu oz lb ton
I gram - 1 0.001 6.852 6.024 3.527. 2.205 1.102x 10-1 x 1023 X 10-2 X1 x 10 X
1 KILOGRAM - 1000 1 6.852 6.024 35.27 2.205 1.102x 10-2 x 1026 X I"
1 slug - 1.459 14.59 1 8.789 5148 32.17 1.609x 10, x 1027 X 10-
1 amu - 1.660 1.660 1.137 1 5.855 3.660 1.829x 10-24 x 10-27 x 10-8 X 10 X 10V - x 10-0
1 ounce - 28.35 2.835 1.943 1.708 1 6.250 3.125X 10-2 X 10-1 X 1024 X 10-2 X 10⁻⁶
I pound - 453.6 0.4536 3.108 2.732 16 1 0.0005X 10-2 x 10-
1 ton - 9.072 907.2 62.16 5.465 3.2 2000 1x 10 x 10 x 10
4

DENSITY
Quantities in the shaded areas are weight densities and, as such, are dimensionally different from
mass densities. See note for mass table.
duzufr KG.METER .am' 1b/ft' lbain.u
1 slug per ft' - I 515 4 1 5151 32.17 1.862 x0-2
1 KILOGRAM per
METER'- I 940 - 10-' I 0001 6.243 x 10-' 3.613 x 10
1gramperem'- I 4.0 1000 I 62.43 3.613 x 10-e
Ipoundperft- 3.108 x 0- 16.02 1.602 x 10⁻¹ I S 77 10-
Ipoundperin. 53.71 2.768 x 10 27.68 172SI
TIME
yr day hr min SEC
1 year - 1 365.2 8.766 x 101 5.259 x 10⁶ 3.156 x 10⁷
1 day - 2.738 x 10- 1 24 1440 8.640 x 101
1 hour - 1.141 x 10- 4.167 x 10⁻² 1 60 3600
1 minute - 1.901 x 10- 6.944 x 10- 1.667 x 10⁻¹ 1 60
1 SECOND - 3.169 x 10⁻¹ 1.157 x 10⁻⁵ 2.778 x 10-i 1.667 x 10⁻² 1

SPEED
ft/sec knVhr METER/SEC mile/hr cm/sec knot
I foot per
second - 1 1.097 0.3048 0.6818 30.48 0.5925
1 kilometer per
hour - 0.9113 1 0.2778 0.6214 27.78 0.5400
1 METER per
SECOND - 3.281 3.6 1 2.237 100 1.944
1 mile per hour - 1.467 1.609 0.4470 1 44.70 0.8689
1 centimeter per
second - 3.281 x 10⁻² 3.6 x 10⁻¹ 0.01 2.237 x 10⁻² 1 1.944 x 10⁻²
1 knot - 1.688 1.852 0.5144 1.151 51.44 1
1 knot - I nautical mile/hr I mile/min - 88.02 ft/sec - 60.00 miles/hr
FORCE
Quantities in the shaded areas are not force units but are often used as such, especially in chemis-try. For instance, if we write 1 gram-force "-" 980.7 dynes, we mean that a gram-mass experiences aforce of 980.7 dynes under standard conditions of gravity (g - 9.80665 meters/sec2).
d ne NT Ib pdl gf kg
I dine I 10- 224h - 10- 7 233 - 10- 1020 x 10 1020 x 10-1
I NEH TON - In I 0224S 7 233 102.0 0.1020
I pond - 4 44 - 1(1 4 441 I 2 1 453.6 0.4536
I puinda - I 383- 10 (1 I 153 3 10i- 1')-. I 14 10 I 410 x 10-1
I gram-force - 9807 9.807 x 10-' 2 205 1 10 7.093 x 10⁻² I 6 0 1
Skilogram-force - 9.807 10 9.807 2 205 70.93 111011 I
I kgf - 9.807 nt I lb - 32.17 pdl

PRESSURE
inch of NT/
atm dyne/cm water cm-Hg METER' lb/in.2 lb/ft
2
1 atmosphere - 1 1.013 406.8 76 1.013 14.70 2116
x 10 x 106
1 dyne per em2 - 9.869 1 4.015 7.501 0.1 1.450 2.089
x 10-1 x 104 x 10-1 x 10-1 x 10-
1 inch of water* at 2.458 2491 1 0.1868 249.1 3.613 5.202
4C- x 10-1 x 10⁻²
I centimeter of mercury 1.316 1.333 5.353 1 1333 0.1934 27.85
at0*C- x 10-2
X 10
1 NEWTON per 9.869 10 4.015 7.501 1 1.450 2.089
METER2 - x 10-2 x 10- 2 x 10 x 10- X 10-2
1 pound per in.2- 6.805 6.895 27.68 5.171 6.895 1 144
X 10-2 X 104 x 102
1poundperft2 - 4.725 478.8 0.1922 3.591 47.88 6.944 1
x 10- X 10-2 x 10⁻¹
*Where the acceleration of gravity has the standard value 9.80665 meters/sec2
.
1 bar - 106 dyne/cm2 1 millibar - 103 dyne/cm2
POWER
Btu/hr ft-lb/sec hp cal/sec kw WATT
1 British thermal
unit per hour - 1 0.2161 3.929 x 10- 7.000 x 10⁻² 2.930 x 10- 0.2930
1 foot-pound per
second - 4.628 1 1.818 x 10⁻¹ 0.3239 1.356 x 10- 1.356
1 horsepower - 2545 550 1 178.2 0.7457 745.7
1 calorie per
second - 14.29 3.087 5.613 x 10- 1 4.186 x 10- 4.186
1 kilowatt - 3413 737.6 1.341 238.9 1 1000
1 WATT - 3.413 0.7376 1.341 x 10- 0.2389 0.001 1

Appendix D:Institutional Resources

SOME USEFULINSTITUTIONAL RESOURCES
CIER c/o UNA-USA
Center for International 345 East 46th Street
Environment Information New York, NY 10017, USATelephone: (212) 697-3232
ECA P.O. Box 3001
Economic Commission for Africa Addis Ababa, EthiopiaTelephone: 47200Cables: ECA, Addis Ababa
ECAFE Sala Santitham
Economic Commission for Asia and Rajadamnern Avenue
the Far East Bangkok, ThailandTelephone: 813544Cables: ECAFE, Bangkok
ECE Palais des Nations
Economic Commission for Europe 1211 Geneva 10, SwitzerlandTelephone: 33-10-00Cables: UNATIONS, Geneva
ECLA Edificio Naciones Unidas
Economic Commission for Latin Avenida Dag Hammarskjold 3030
America VitacuraSantiago, ChileTelephone: 485051-061-071Cables: UNATIONS, Santiago
ECOSOC United Nations
Economic and Social Council New York, NY 10017, USATelephone: (212) 745-1234Cables: UNATIONS, New York
FAO Via delle Terme di Caracalla
Food and Agriculture Organization Rome, ItalyTelephone: 5797Cables: FOODAGRI, Rome
GATT Villa la Fenetre
General Agreement on Tariffs and Palais des Nations
Trade 1211 Geneva 10, SwitzerlandTelephone: 34-60-11
31-02-11Cables: GATT, Geneva

IAEA Kaerntnerring 11International Atomic Energy A-1010 Vienna 1, AustriaAgency Telephone: Vienna 52-45-11
Cables: INATOM, Vienna
IARC 150, Cours Albert ThomasInternational Agency for Research F-69008 Lyon, Franceon Cancer Telephone: 69-81-45
IAWPR C/o Institut fuer HydrobiologieInternational Association for Water Olbersweg 24Pollution Research 2 Hamburg-50, Fed. Rep. of Germany
Telephone: 04-11-39107
ICAO International Aviation BuildingInternational Civil Aviation 1080 University StreetOrganization Montreal, Canada
Telephone: (514) 866-2551Cables: ICAO, Montreal
ICELInternational Council of 214 AdenaueralleeEnvironmental Law 53 Bonn, Fed. Rep. of Germany
ICSU Via Cornelio Celso 7International Council of Scientific 00161 Rome, ItalyUnions Telephone: 862555
IFS Box 5073International Foundation for Stockholm 5, SwedenScience Telephone: 08-22-0760
IED C/o HunterInternational Institute for 21 Smith TerraceEnvironment and Development London, S.W. 34 DL, England
Telephone: 01-352-3289
ILO International Labour OfficeInternational Labour Organization 154, rue de Lausanne
Geneva, SwitzerlandTelephone: 32-62-00Cables: INTERLAB, Geneva
IMCO 101-104 PiccadillyInter-Governmental Maritime London, W1V OAE, EnglandConsultative Organization Telephone: 01-499-9040
Cables: INMARCOR, London, W.1.(includes: Marine EnvironmentProtection Committee)

IOC 7, Place de Fontenoy
Intergovernmental Oceanographic 75700 Paris, France
Commission Telephone: 566-57-57(extension 2455)
IUBS C/o University Botanical Museum
International Union of Biological P.O. Box 12
Sciences 5014 Bergen, NorwayTelephone: 212040
IUCN 1110 Morges, Switzerland
International Union for the Telephone: (021) 71-44-01
Conservation of Nature and Natural
Resources
OAS 17th & Constitution Avenue, NW
Organization of American States Washington, DC 20006, USATelephone: (202) 393-8450Telex: 89503Cables: PAUOAS, Washington
OECD 2, rue Andre Pascal
Organization for Economic 75116 Paris, France
Co-operation and Development Telephone: 524-82-00
(also OCDE-Organisation pour la
Cooperation et le DeveloppementEconomique)
PAHO 525-23rd Street, NW
Pan American Health Organization Washington, DC 20037, USATelephone: (202) 223-4700Cables: OFSANPAN, Washington
UN Headquarters
United Nations New York, NY 10017, USATelephone: (212) 745-1234Cables: UNATIONS, New York
UN Geneva Office
United Nations Palais des Nations1211 Geneva 10, SwitzerlandTelephone: 34-60-11
31-02-11Cables: UNATIONS, Geneva

UNCTAD Palais des NationsUnited Nations Conference on 1211 Geneva 10, SwitzerlandTrade and Development Telephone: 34-60-11
Cables: UNCTAD, Geneva
UNDP 866 United Nations PlazaUnited Nations Development New York, NY 10017, USAProgramme Telephone: (212) 754-1234
Cables: UNDEVPRO, New York
UNEP P.O. Box 30552United Nations Environment Nairobi, KenyaProgramme Telephone: 33930
Cables: UNITERRA, Nairobi(includes: Environment Programme Telex: 22068 UNITERRAInformation CentreGlobal Environmental MonitoringSystem (GEMS)International Centre for Industryand the EnvironmentInternational Referral System forSources of EnvironmentalInformation (IRS))
Unesco 7, Place de FontenoyUnited Nations Educational, 75700 Paris, FranceScientific and Cultural Organization Telephone: 566-57-57
Cables: UNESCO, Paris(includes: 2UC/IntergovernmentalOceanographic Commission)
UNESOB United Nations BuildingUnited Nations Economic and Beirut, LebanonSocial Office in Beirut Telephone: 27-29-27
27-29-2827-30-25
Cables: UNATIONS, Beirut
UNIDO Lercbenfelderstrasse 1United Nations Industrial A-1070 Vienna, AustriaDevelopment Organization Telephone: 4350-0
Cables: UNIDO, Vienna
UNITAR 801 United Nations PlazaUnited Nations Institute for New York, NY 10017, USATraining and Research Telephone: (212) 745-1234
(extension 4285)Cables: UNITAR, New York

WHO 1211 Geneva 27, Switzerland
World Health Organization Telephone: 34-60-61Cables: UNISANTI, Geneva
WHO P.O. Box No. 6
World Health Organization- Brazzaville, People's Rep. of Congo
Regional Office for Africa Telephone: 3073
WMO 41, avenue Giuseppe-Motta
World Meteorological Organization Geneva, SwitzerlandTelephone: 34-64-00Cables: METEOMOND, Geneva


子'終’


World BankHeadquarters:1818 H Street, N.W.Washington, D.C. 20433, U.S.A.
Telephone: (202) 477-1234Cable Address: INTBAFRAD
WASHINGTONDC
V/
/ JI