Embed Size (px)
Citation preview
World Health Organization 1
Environmental Health and Sustainable DevelopmentDr. Maria NeiraWHO
PUBLIC HEALTH AND ENVIRONMENT
World Health Organization 2
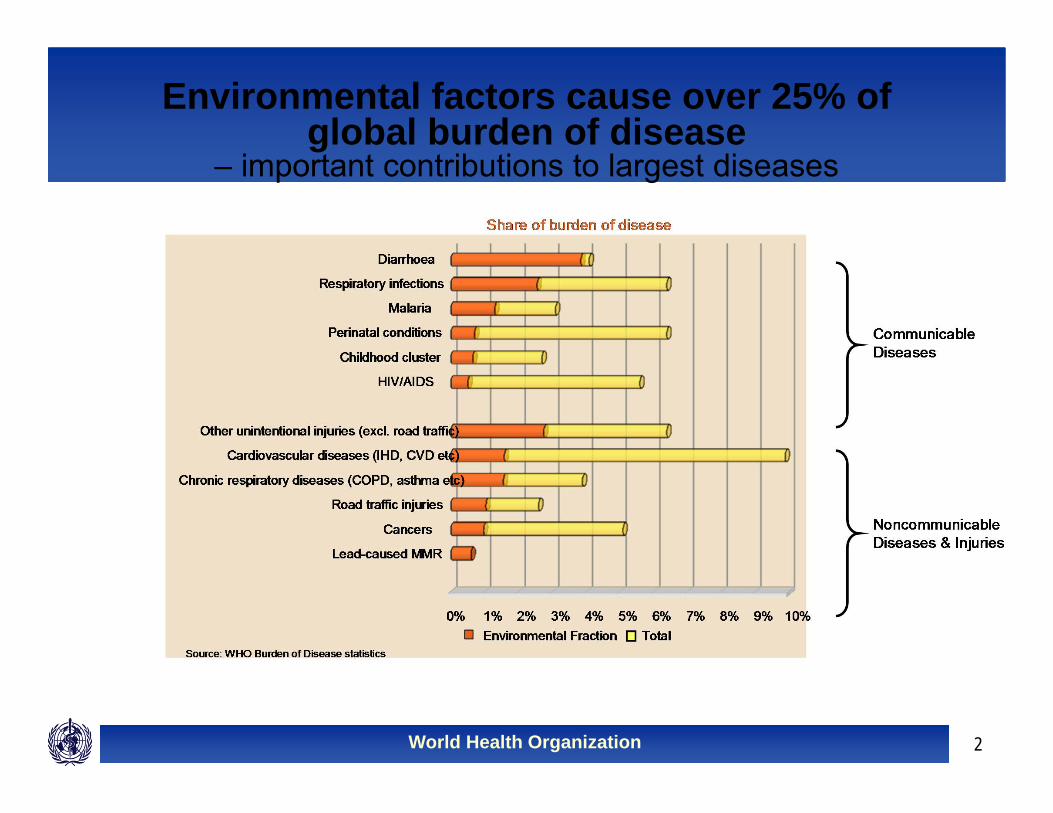
Environmental factors cause over 25% of global burden of disease
– important contributions to largest diseases
World Health Organization 3
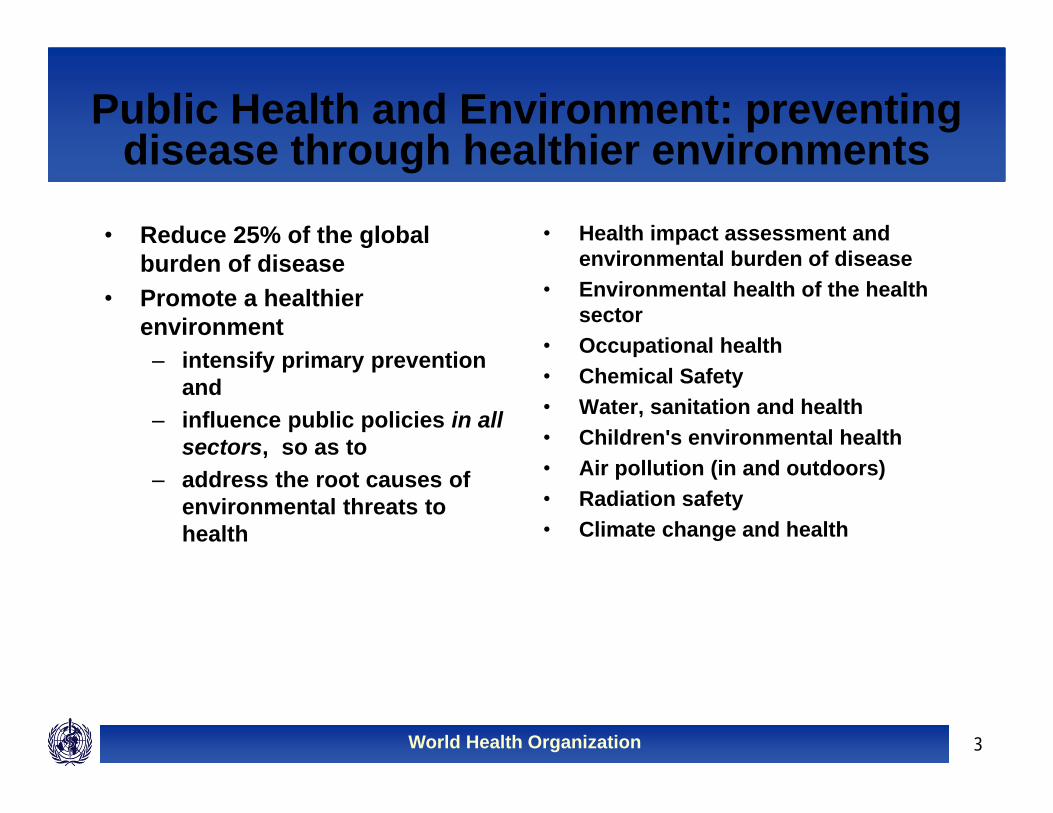
Public Health and Environment: preventing disease through healthier environments
• Reduce 25% of the global burden of disease
• Promote a healthier environment – intensify primary prevention
and– influence public policies in all
sectors, so as to – address the root causes of
environmental threats to health
• Health impact assessment and environmental burden of disease
• Environmental health of the health sector
• Occupational health • Chemical Safety • Water, sanitation and health• Children's environmental health • Air pollution (in and outdoors)• Radiation safety • Climate change and health
World Health Organization 4
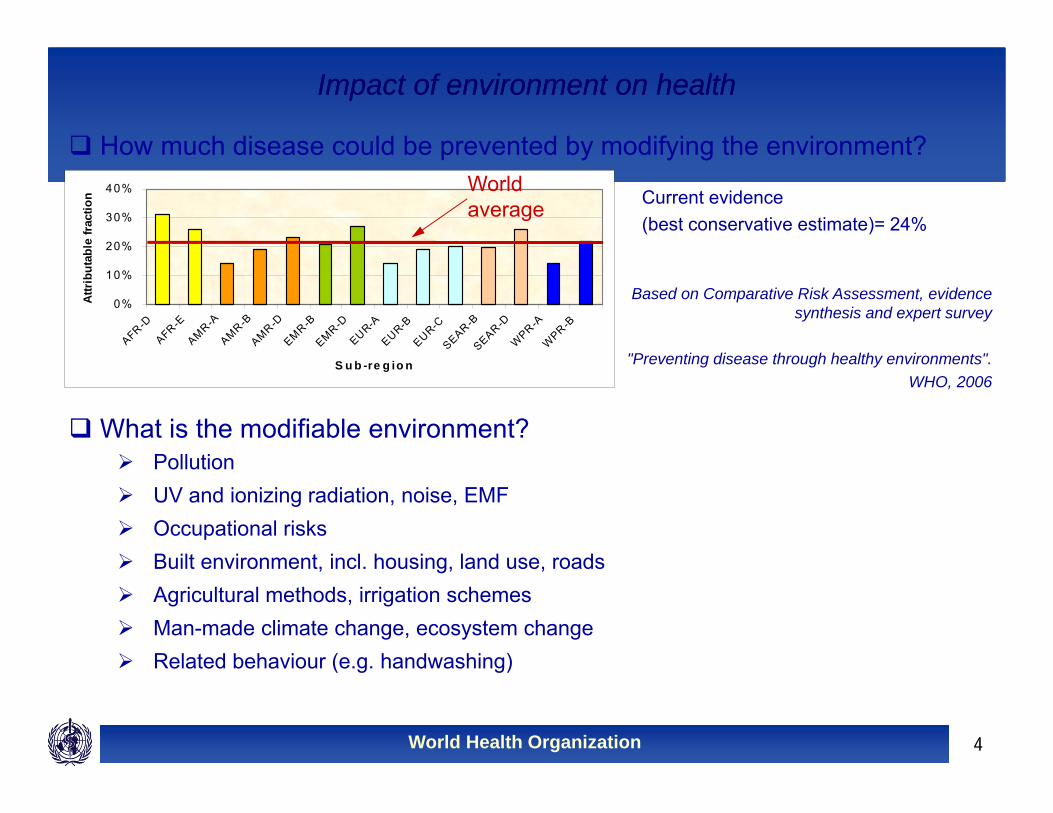
Impact of environment on healthImpact of environment on health
0%
10%
20%
30%
40%
AFR-DAFR-EAMR-AAMR-BAMR-DEMR-BEMR-DEUR-AEUR-BEUR-CSEAR-BSEAR-D
WPR-A
WPR-B
S u b -re g io n
Attri
buta
ble
fract
ion
World average
Based on Comparative Risk Assessment, evidence synthesis and expert survey
"Preventing disease through healthy environments".WHO, 2006
How much disease could be prevented by modifying the environment?
What is the modifiable environment? Pollution UV and ionizing radiation, noise, EMF Occupational risks Built environment, incl. housing, land use, roads Agricultural methods, irrigation schemes Man-made climate change, ecosystem change Related behaviour (e.g. handwashing)
Current evidence (best conservative estimate)= 24%
World Health Organization 5
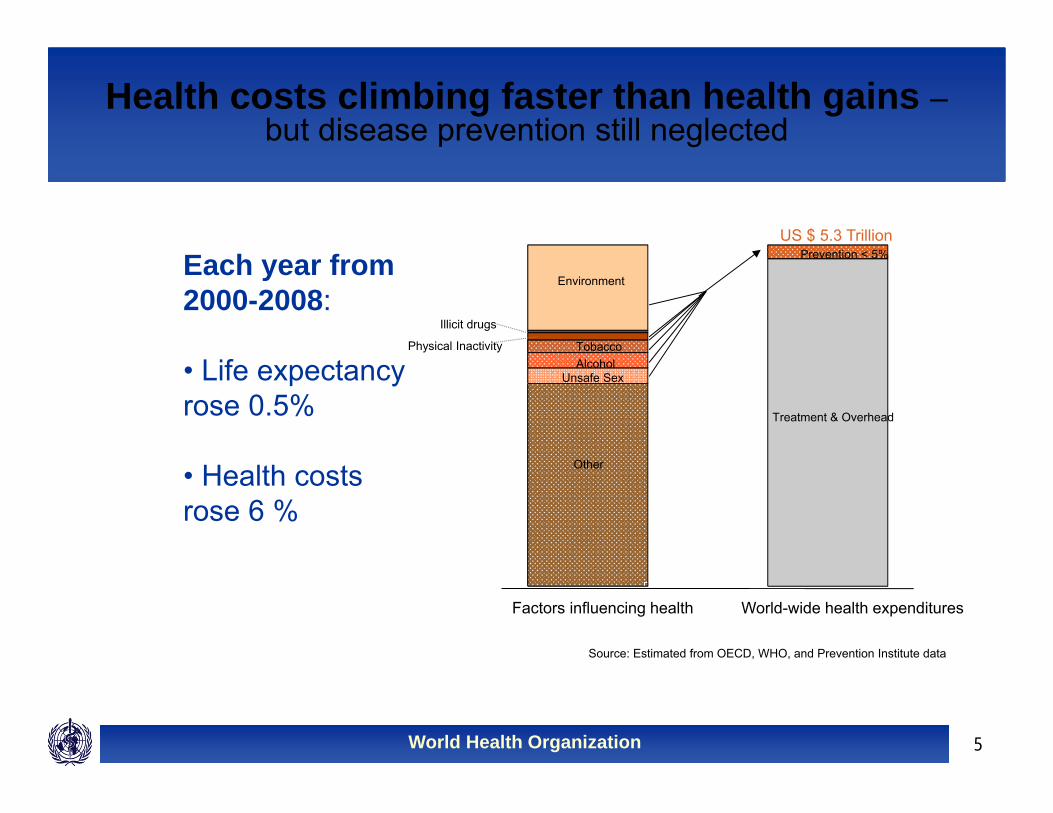
Health costs climbing faster than health gains –but disease prevention still neglected
Source: Estimated from OECD, WHO, and Prevention Institute data
Each year from 2000-2008:
• Life expectancy rose 0.5%
• Health costs rose 6 %
Other
AlcoholUnsafe Sex
TobaccoPhysical Inactivity
Illicit drugs
Environment
Treatment & Overhead
Prevention < 5%
Factors influencing health World-wide health expenditures
US $ 5.3 Trillion
World Health Organization 6
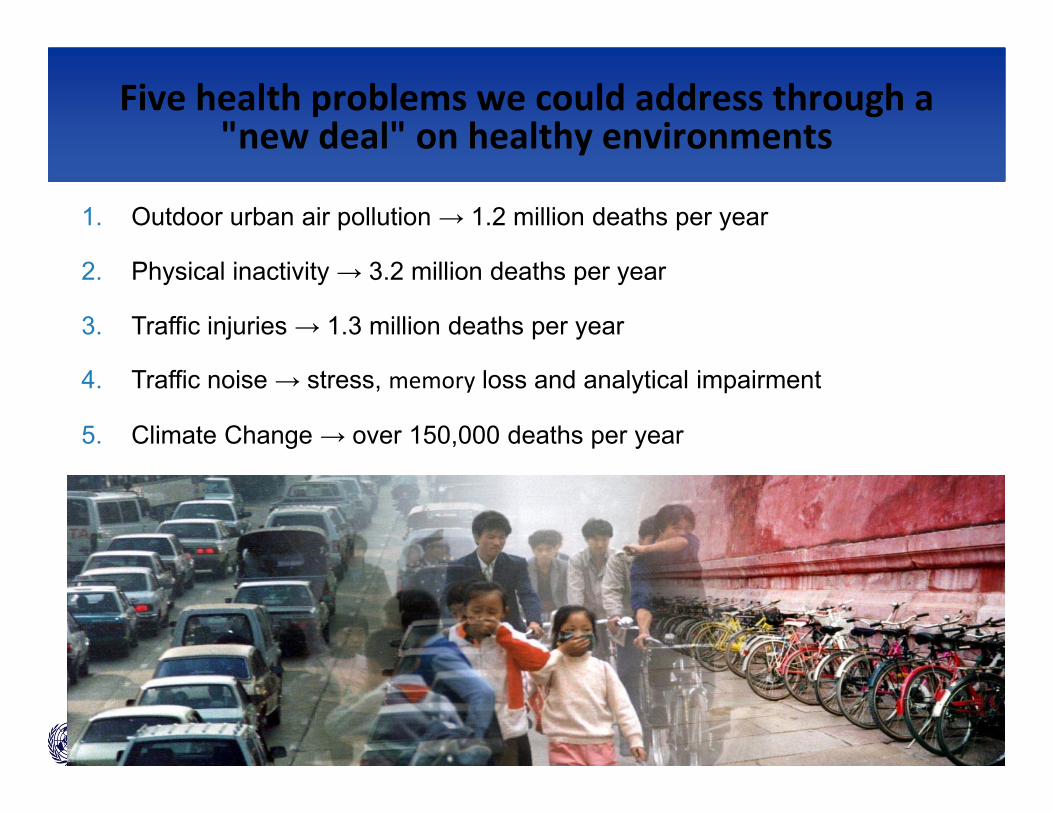
1. Outdoor urban air pollution → 1.2 million deaths per year
2. Physical inactivity → 3.2 million deaths per year
3. Traffic injuries → 1.3 million deaths per year
4. Traffic noise → stress, memory loss and analytical impairment
5. Climate Change → over 150,000 deaths per year
Five health problems we could address through a "new deal" on healthy environments
World Health Organization 7
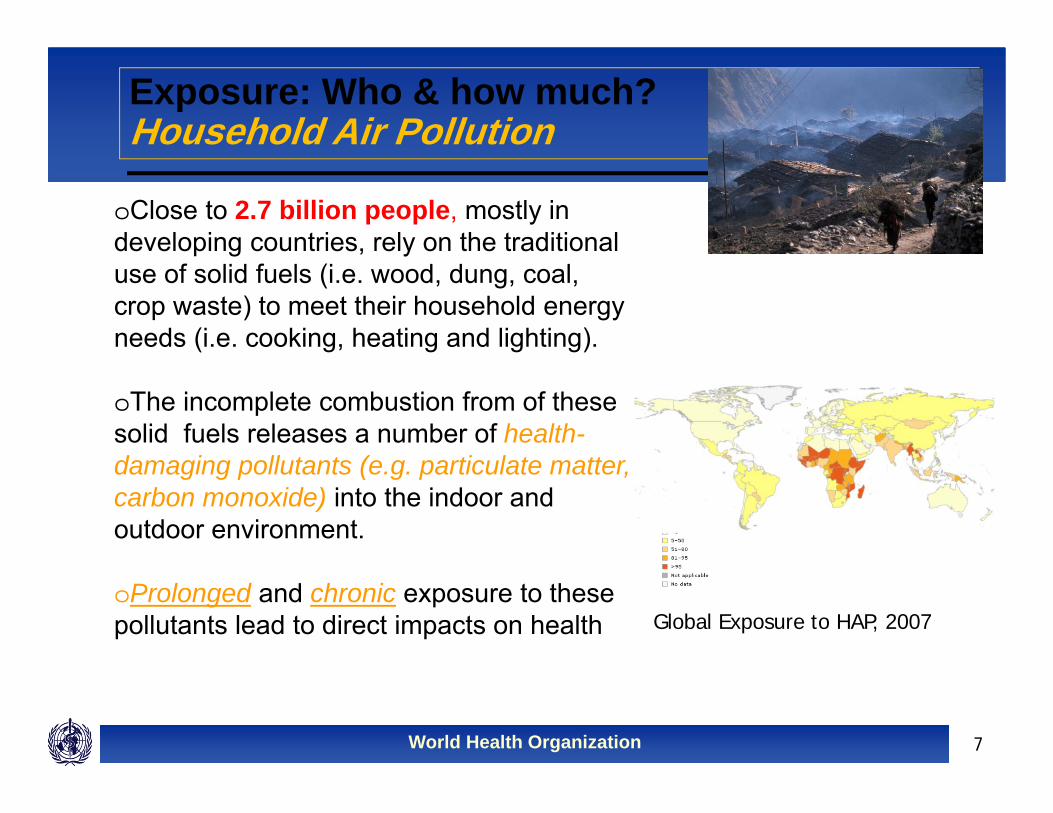
Exposure: Who & how much?Household Air Pollution
oClose to 2.7 billion people, mostly in developing countries, rely on the traditional use of solid fuels (i.e. wood, dung, coal, crop waste) to meet their household energy needs (i.e. cooking, heating and lighting).
oThe incomplete combustion from of these solid fuels releases a number of health-damaging pollutants (e.g. particulate matter, carbon monoxide) into the indoor and outdoor environment.
oProlonged and chronic exposure to these pollutants lead to direct impacts on health Global Exposure to HAP, 2007
World Health Organization 8
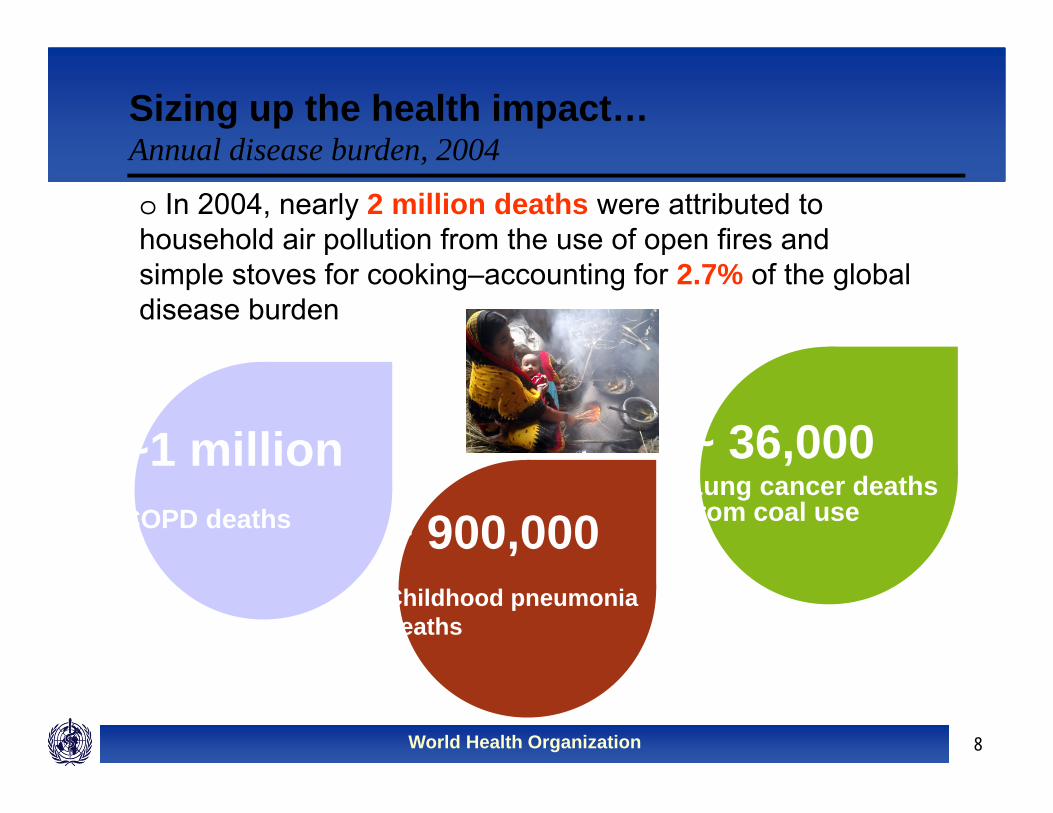
~1 millionCOPD deaths
Sizing up the health impact…Annual disease burden, 2004
~ 900,000Childhood pneumonia deaths
~ 36,000Lung cancer deathsfrom coal use
o In 2004, nearly 2 million deaths were attributed to household air pollution from the use of open fires and simple stoves for cooking–accounting for 2.7% of the global disease burden
World Health Organization 9
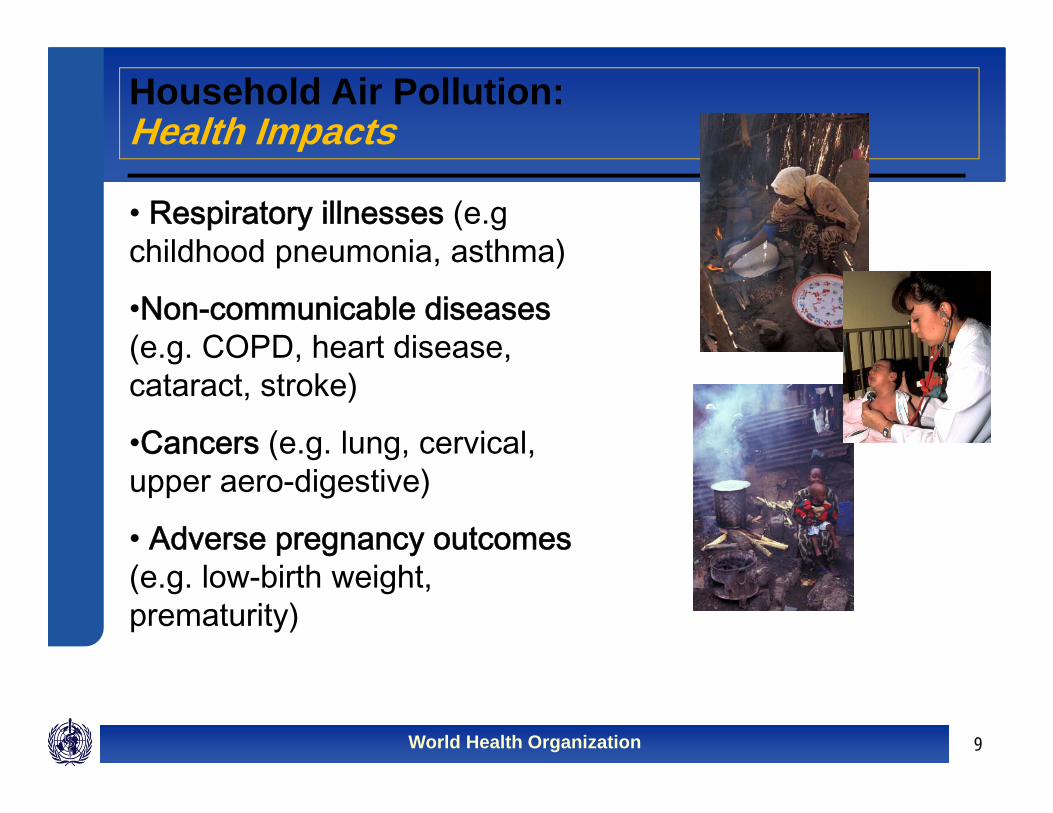
• Respiratory illnesses (e.g childhood pneumonia, asthma)
•Non-communicable diseases(e.g. COPD, heart disease, cataract, stroke)
•Cancers (e.g. lung, cervical, upper aero-digestive)
• Adverse pregnancy outcomes (e.g. low-birth weight, prematurity)
Household Air Pollution:Health Impacts
World Health Organization 10
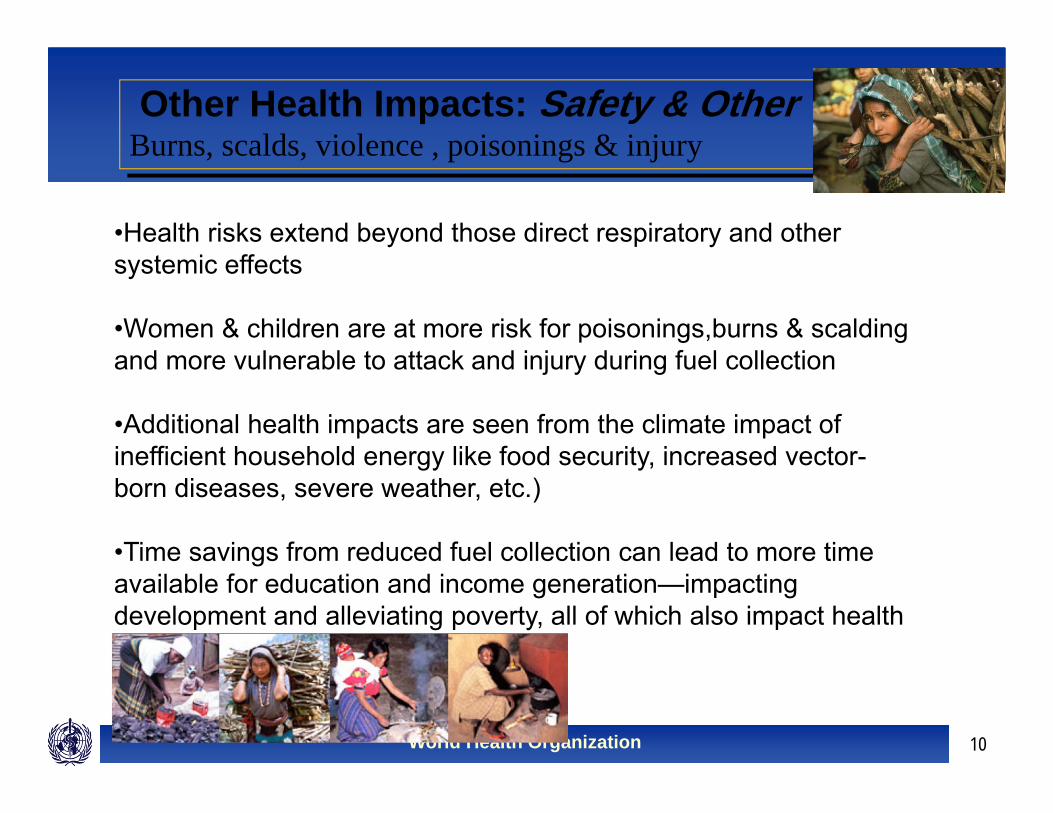
Other Health Impacts: Safety & OtherBurns, scalds, violence , poisonings & injury
Outdoor Air Poution•Health risks extend beyond those direct respiratory and other systemic effects
•Women & children are at more risk for poisonings,burns & scalding and more vulnerable to attack and injury during fuel collection
•Additional health impacts are seen from the climate impact of inefficient household energy like food security, increased vector-born diseases, severe weather, etc.)
•Time savings from reduced fuel collection can lead to more time available for education and income generation—impacting development and alleviating poverty, all of which also impact health
World Health Organization 11
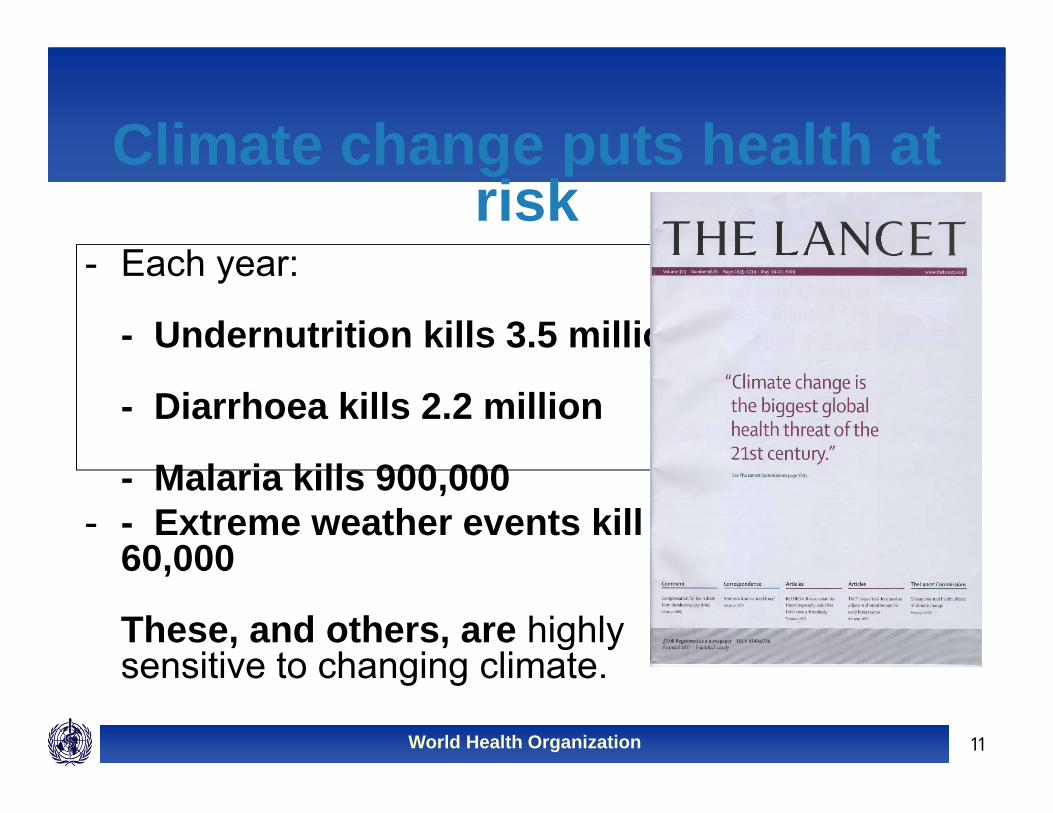
Climate change puts health at risk
- Each year:
- Undernutrition kills 3.5 million
- Diarrhoea kills 2.2 million
- Malaria kills 900,000- - Extreme weather events kill
60,000
These, and others, are highly sensitive to changing climate.
World Health Organization 12
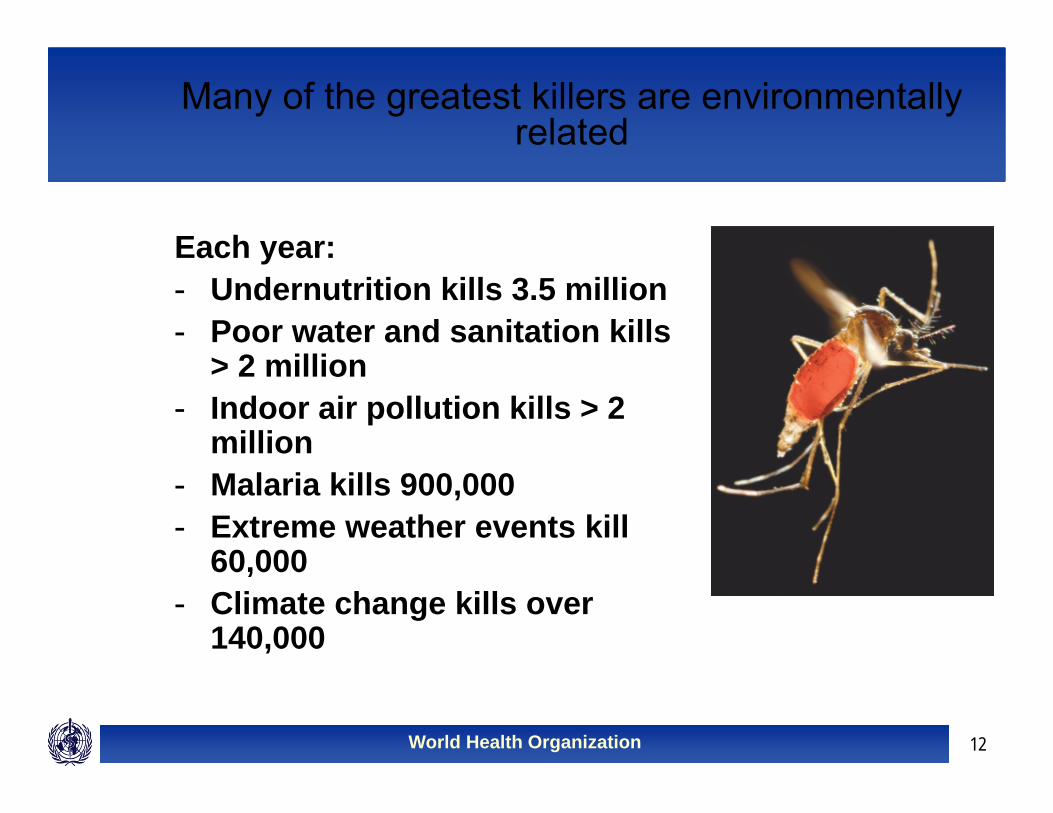
Many of the greatest killers are environmentally related
Each year:- Undernutrition kills 3.5 million - Poor water and sanitation kills
> 2 million- Indoor air pollution kills > 2
million- Malaria kills 900,000- Extreme weather events kill
60,000- Climate change kills over
140,000
World Health Organization 13
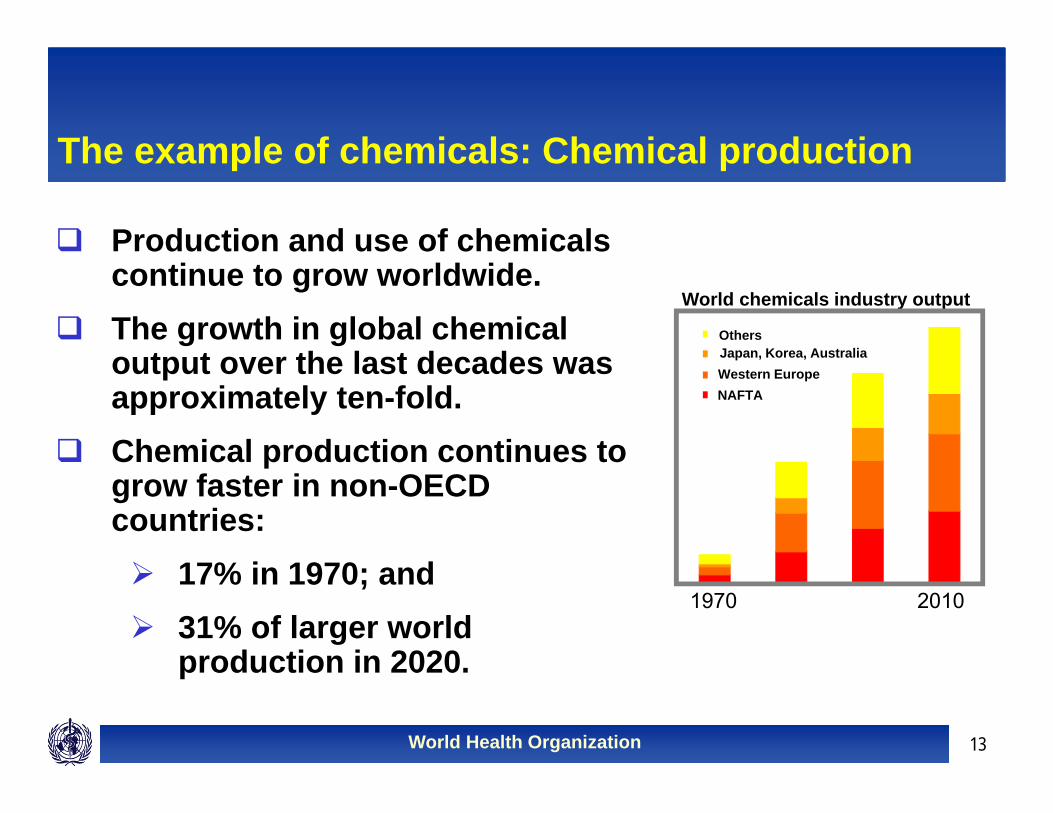
The example of chemicals: Chemical production
Production and use of chemicals continue to grow worldwide.
The growth in global chemical output over the last decades was approximately ten-fold.
Chemical production continues to grow faster in non-OECD countries: 17% in 1970; and 31% of larger world
production in 2020.
World chemicals industry output
1970 1980 1990 1998
OthersJapan, Korea, AustraliaWestern EuropeNAFTA
Source: OECD (2001)1970 2010
World Health Organization 14
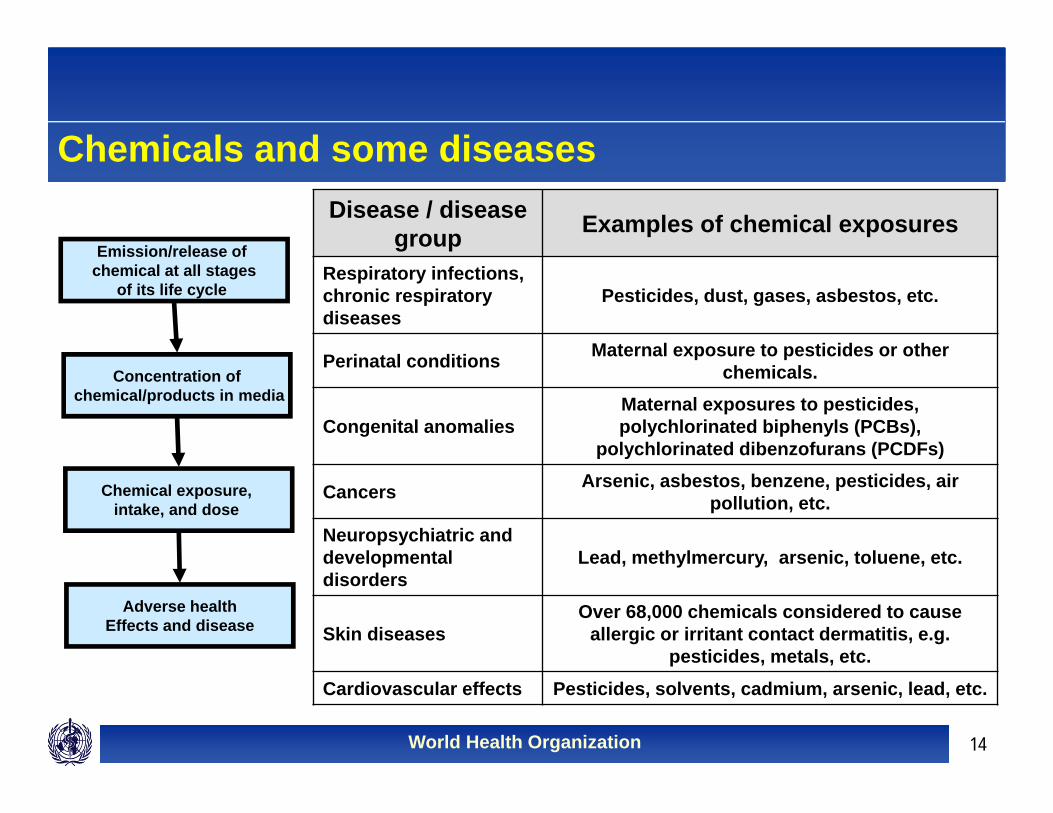
Chemicals and some diseasesDisease / disease
group Examples of chemical exposures
Respiratory infections, chronic respiratory diseases
Pesticides, dust, gases, asbestos, etc.
Perinatal conditions Maternal exposure to pesticides or other chemicals.
Congenital anomaliesMaternal exposures to pesticides, polychlorinated biphenyls (PCBs),
polychlorinated dibenzofurans (PCDFs)
Cancers Arsenic, asbestos, benzene, pesticides, air pollution, etc.
Neuropsychiatric and developmental disorders
Lead, methylmercury, arsenic, toluene, etc.
Skin diseasesOver 68,000 chemicals considered to cause
allergic or irritant contact dermatitis, e.g. pesticides, metals, etc.
Cardiovascular effects Pesticides, solvents, cadmium, arsenic, lead, etc.
Emission/release of chemical at all stages
of its life cycle
Chemical exposure, intake, and dose
Concentration ofchemical/products in media
Adverse healthEffects and disease
World Health Organization 15
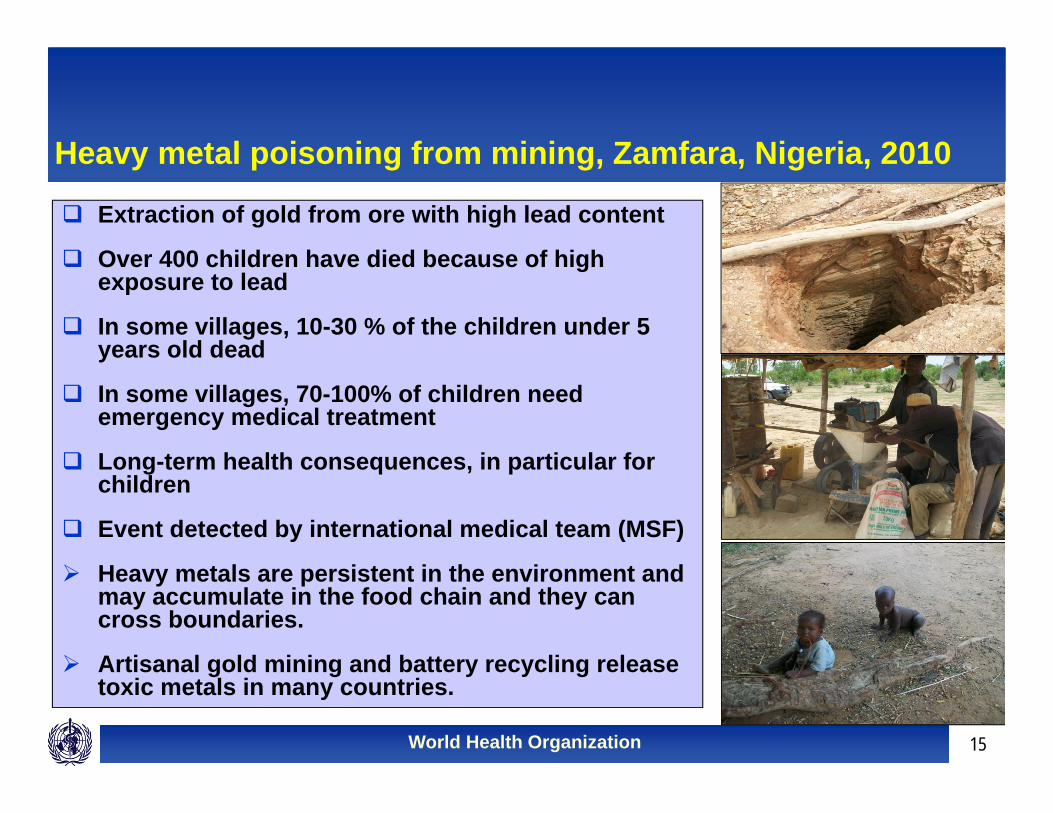
Heavy metal poisoning from mining, Zamfara, Nigeria, 2010
Extraction of gold from ore with high lead content
Over 400 children have died because of high exposure to lead
In some villages, 10-30 % of the children under 5 years old dead
In some villages, 70-100% of children need emergency medical treatment
Long-term health consequences, in particular for children
Event detected by international medical team (MSF)
Heavy metals are persistent in the environment and may accumulate in the food chain and they can cross boundaries.
Artisanal gold mining and battery recycling release toxic metals in many countries.
World Health Organization 16
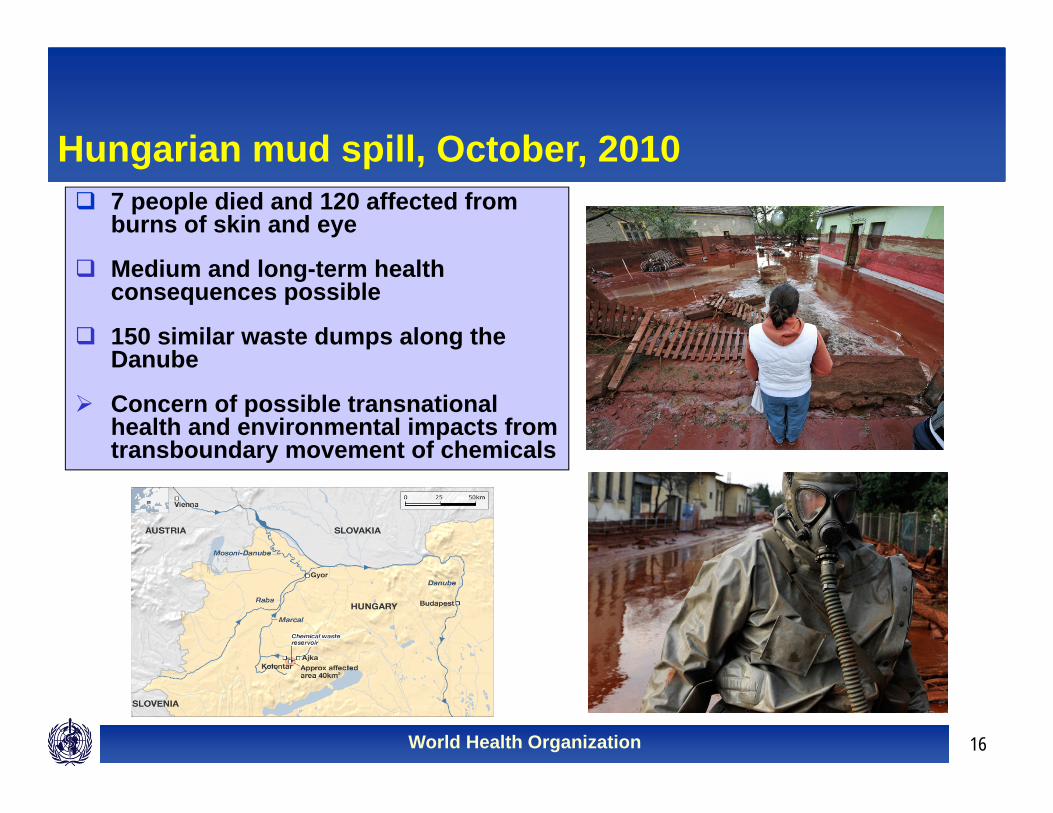
Hungarian mud spill, October, 2010 7 people died and 120 affected from
burns of skin and eye
Medium and long-term health consequences possible
150 similar waste dumps along the Danube
Concern of possible transnational health and environmental impacts from transboundary movement of chemicals
World Health Organization 17
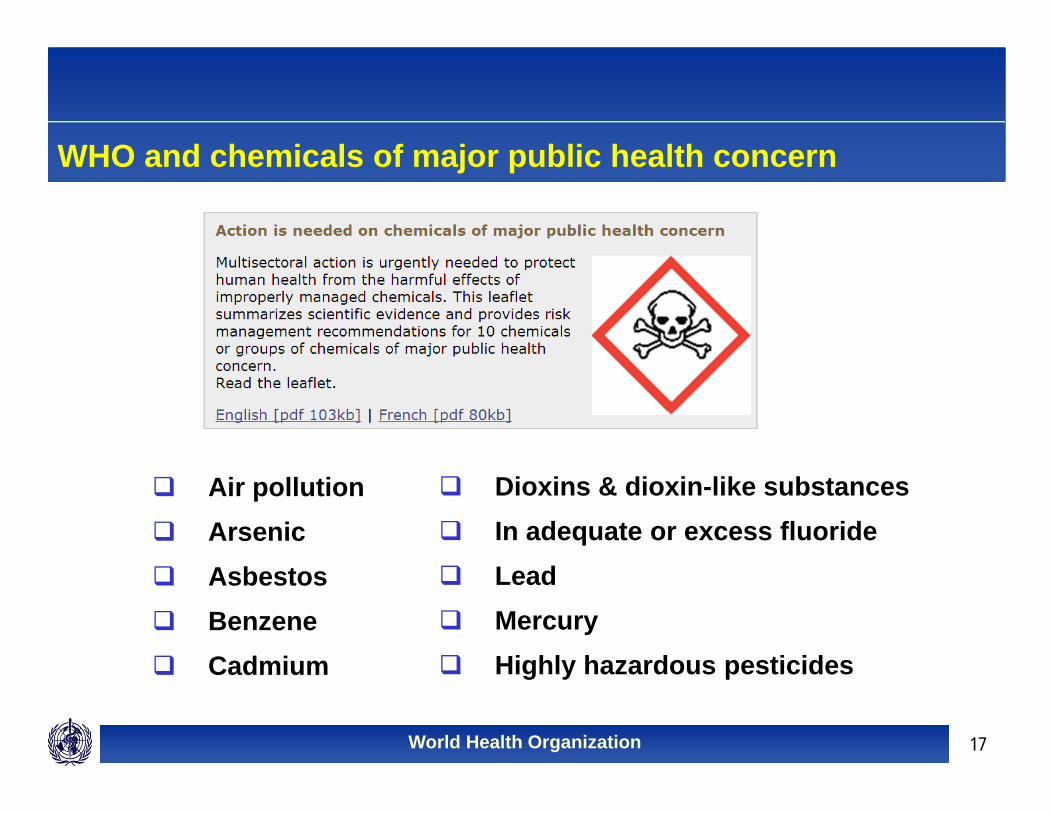
WHO and chemicals of major public health concern
Air pollution Arsenic Asbestos Benzene Cadmium
Dioxins & dioxin-like substances In adequate or excess fluoride Lead Mercury Highly hazardous pesticides
World Health Organization 18
"I have a dream"
World Health Organization 19
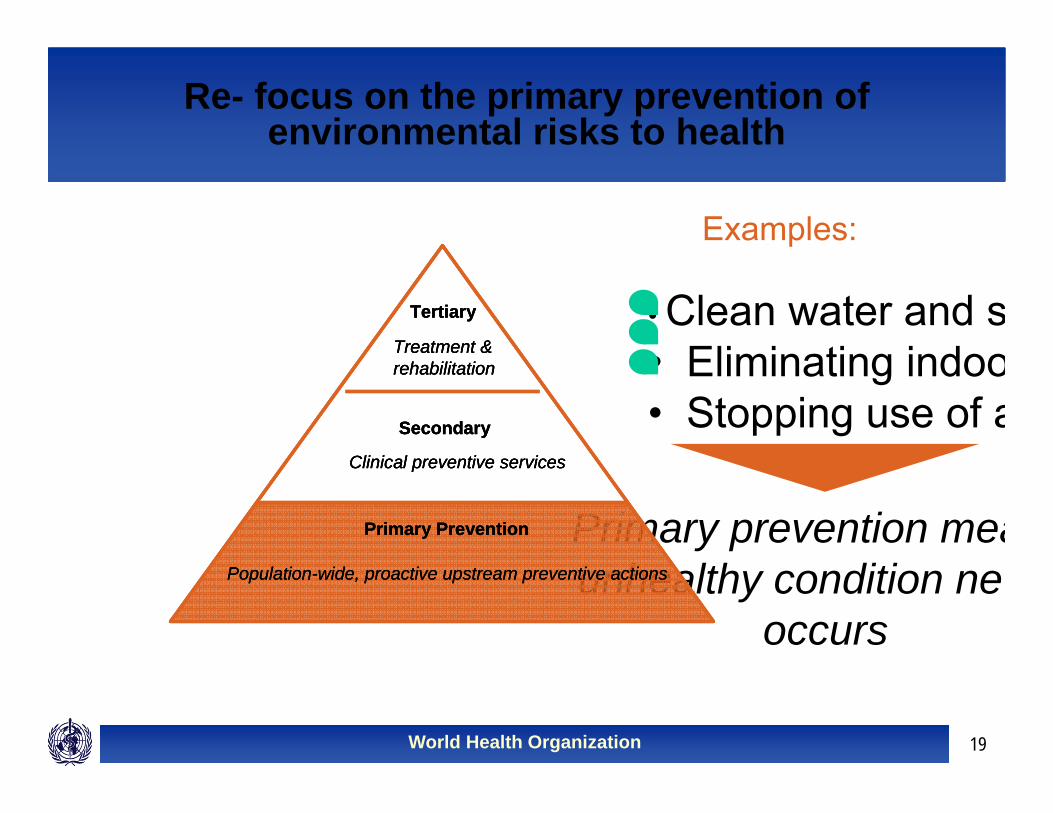
• Clean water and s• Eliminating indoo• Stopping use of a
Examples:
Primary prevention meaunhealthy condition ne
occurs
Re- focus on the primary prevention of environmental risks to health
Primary Prevention
Secondary
Tertiary
Clinical preventive services
Population-wide, proactive upstream preventive actions
Treatment &rehabilitation
Primary Prevention
Secondary
Tertiary
Clinical preventive services
Population-wide, proactive upstream preventive actions
Treatment &rehabilitation
Primary Prevention
Secondary
Tertiary
Clinical preventive services
Population-wide, proactive upstream preventive actions
Treatment &rehabilitation
World Health Organization 20
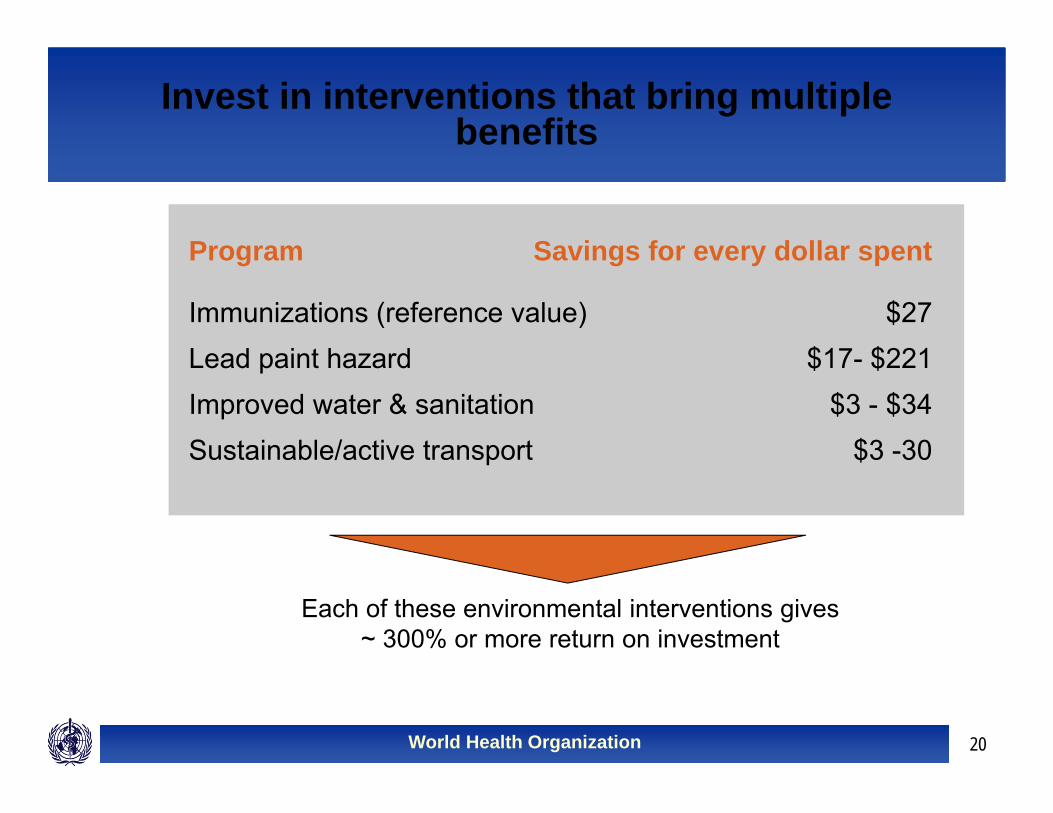
Each of these environmental interventions gives~ 300% or more return on investment
Program Savings for every dollar spent
Immunizations (reference value)Lead paint hazardImproved water & sanitationSustainable/active transport
$27$17- $221
$3 - $34$3 -30
Invest in interventions that bring multiple benefits
World Health Organization 21
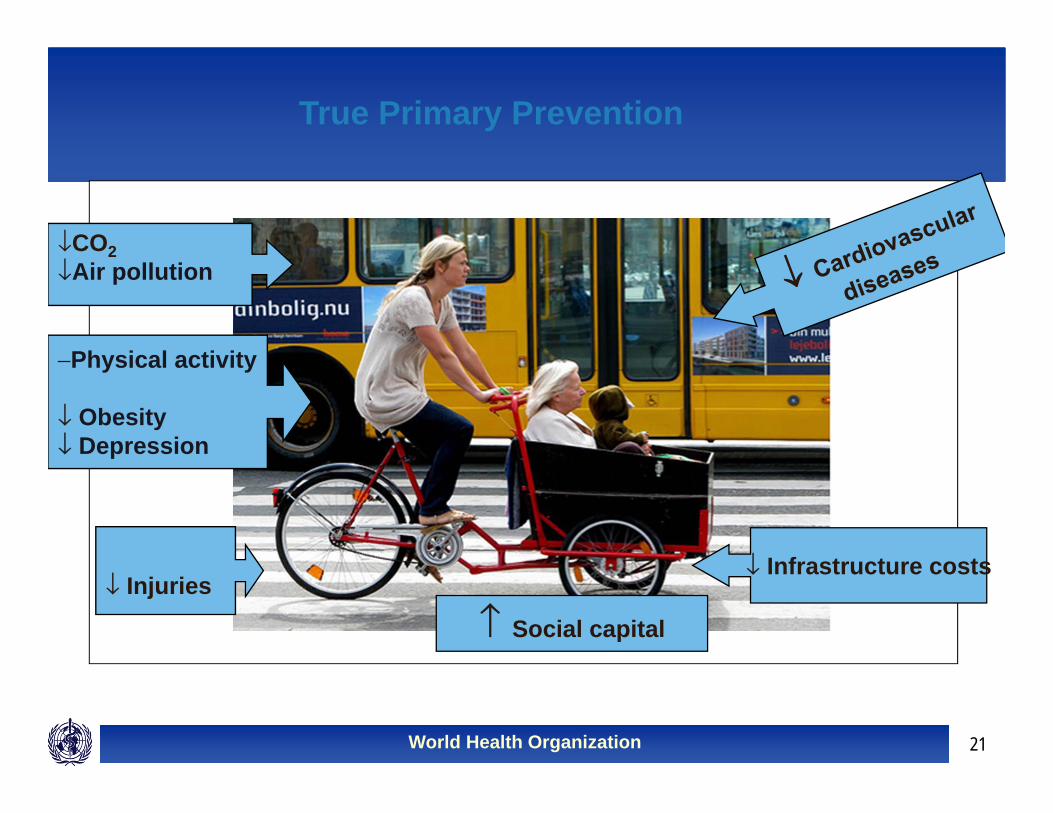
−Physical activity
↓ Obesity↓ Depression
↓ Infrastructure costs
↑ Social capital
↓CO2 ↓Air pollution
↓ Injuries
True Primary Prevention
World Health Organization 22
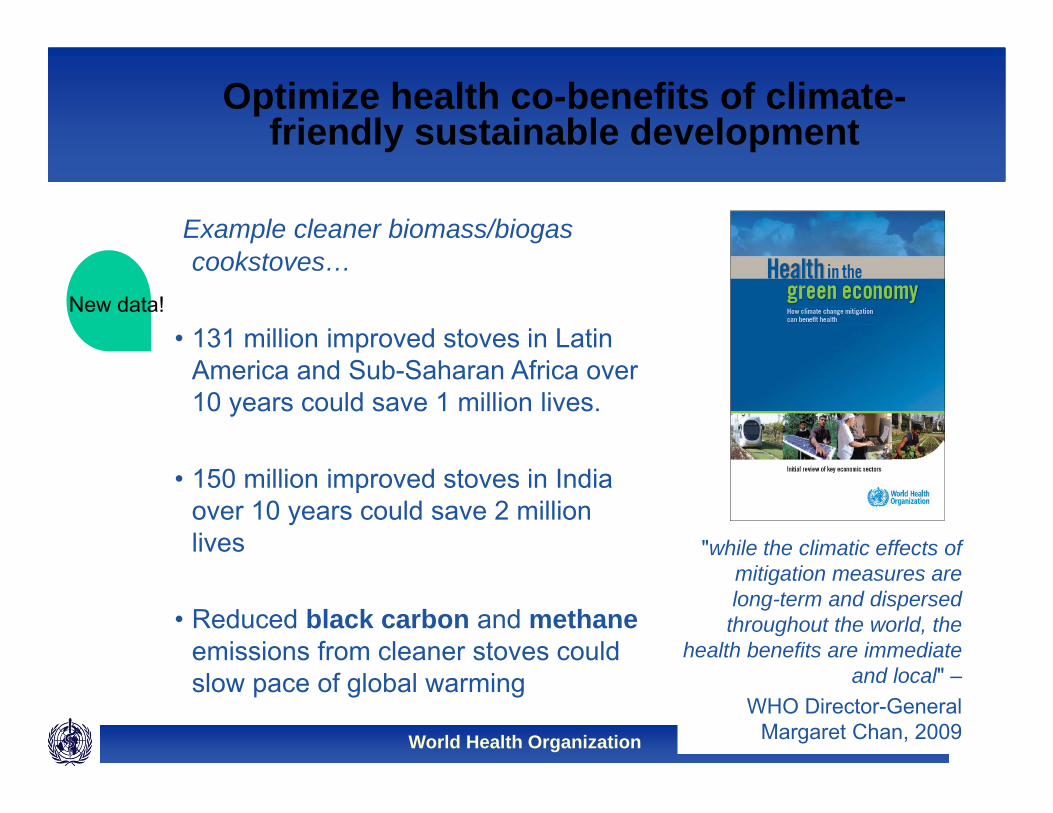
Example cleaner biomass/biogas cookstoves…
• 131 million improved stoves in Latin America and Sub-Saharan Africa over 10 years could save 1 million lives.
• 150 million improved stoves in India over 10 years could save 2 million lives
• Reduced black carbon and methaneemissions from cleaner stoves could slow pace of global warming
Optimize health co-benefits of climate-friendly sustainable development
"while the climatic effects of mitigation measures are long-term and dispersed throughout the world, the
health benefits are immediate and local" –
WHO Director-General Margaret Chan, 2009
New data!
World Health Organization 23
What needs to be done?
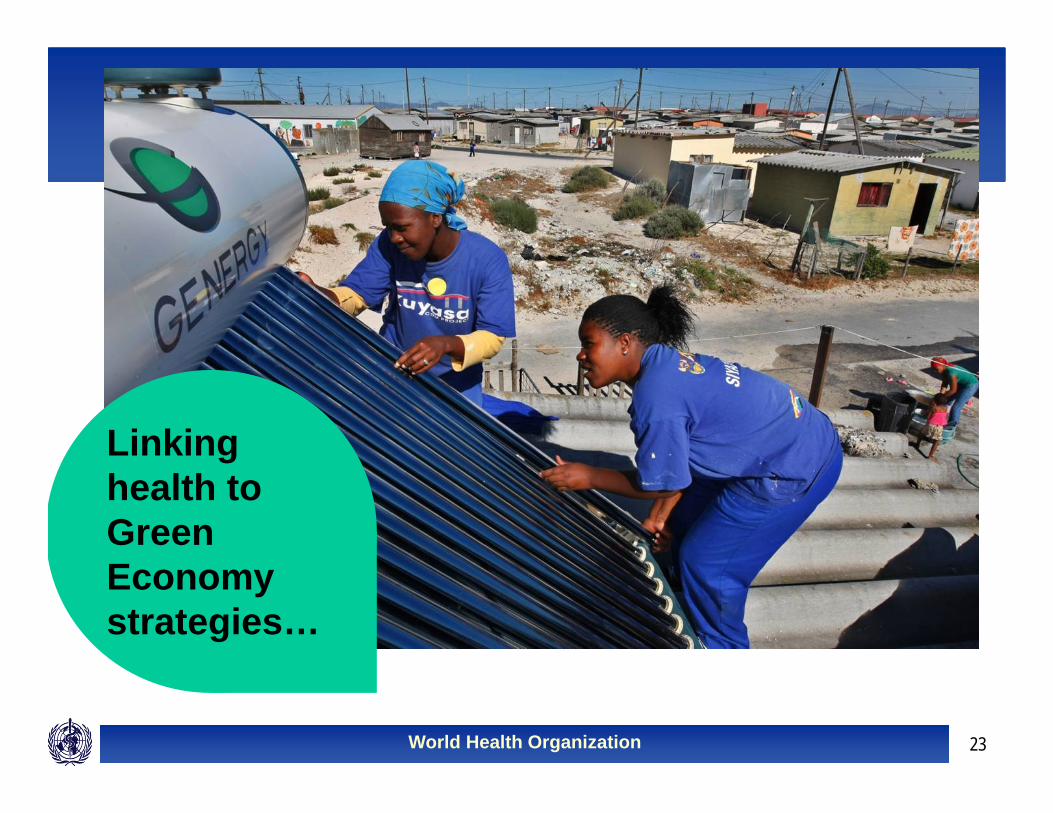
Linking health to Green Economy strategies…
World Health Organization 24
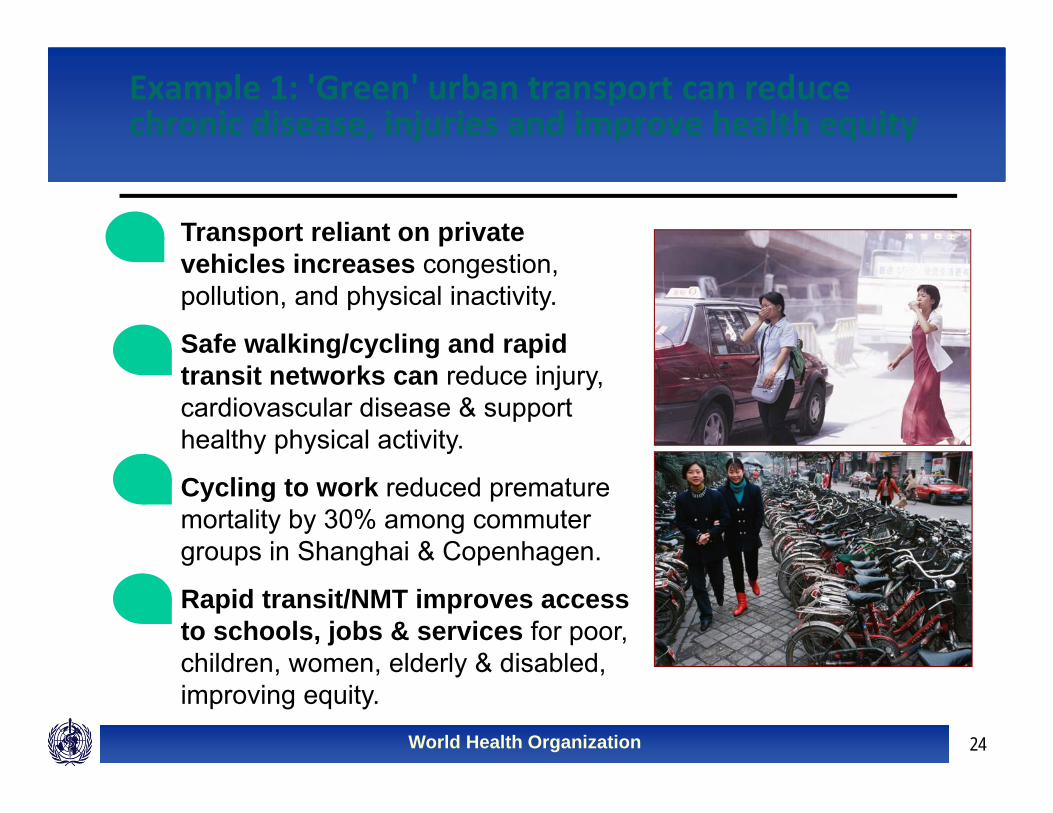
Transport reliant on private vehicles increases congestion, pollution, and physical inactivity.
Safe walking/cycling and rapid transit networks can reduce injury, cardiovascular disease & support healthy physical activity.
Cycling to work reduced premature mortality by 30% among commuter groups in Shanghai & Copenhagen.
Rapid transit/NMT improves access to schools, jobs & services for poor, children, women, elderly & disabled, improving equity.
Example 1: 'Green' urban transport can reduce chronic disease, injuries and improve health equity
World Health Organization 25
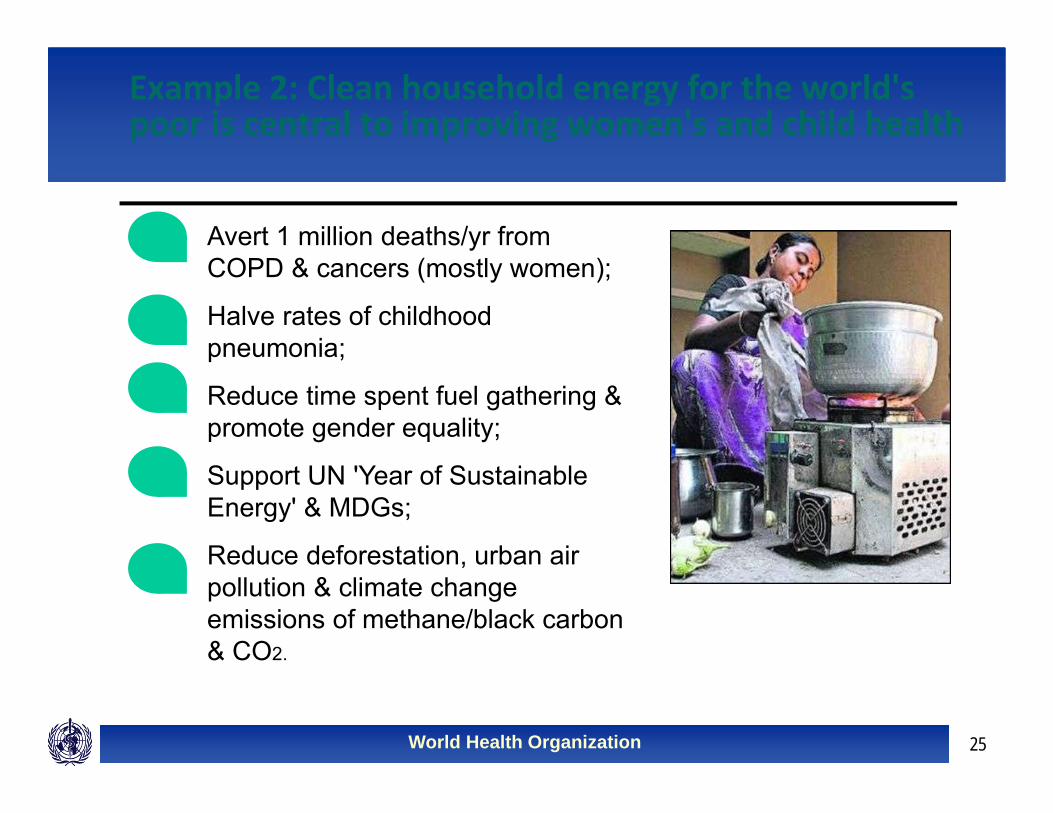
Example 2: Clean household energy for the world's poor is central to improving women's and child health
Avert 1 million deaths/yr from COPD & cancers (mostly women);
Halve rates of childhood pneumonia;
Reduce time spent fuel gathering & promote gender equality;
Support UN 'Year of Sustainable Energy' & MDGs;
Reduce deforestation, urban air pollution & climate change emissions of methane/black carbon & CO2.
World Health Organization 26
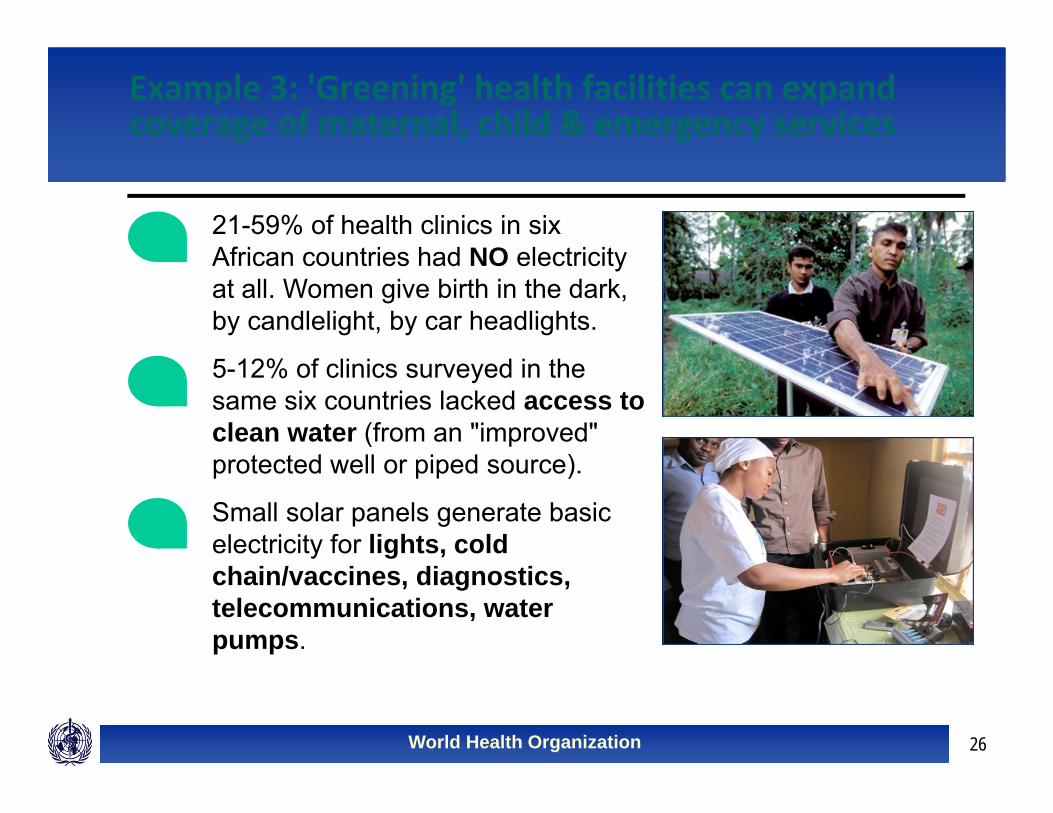
21-59% of health clinics in six African countries had NO electricityat all. Women give birth in the dark, by candlelight, by car headlights.
5-12% of clinics surveyed in the same six countries lacked access to clean water (from an "improved" protected well or piped source).
Small solar panels generate basic electricity for lights, cold chain/vaccines, diagnostics, telecommunications, water pumps.
Example 3: 'Greening' health facilities can expand coverage of maternal, child & emergency services
World Health Organization 27
What needs to be done?
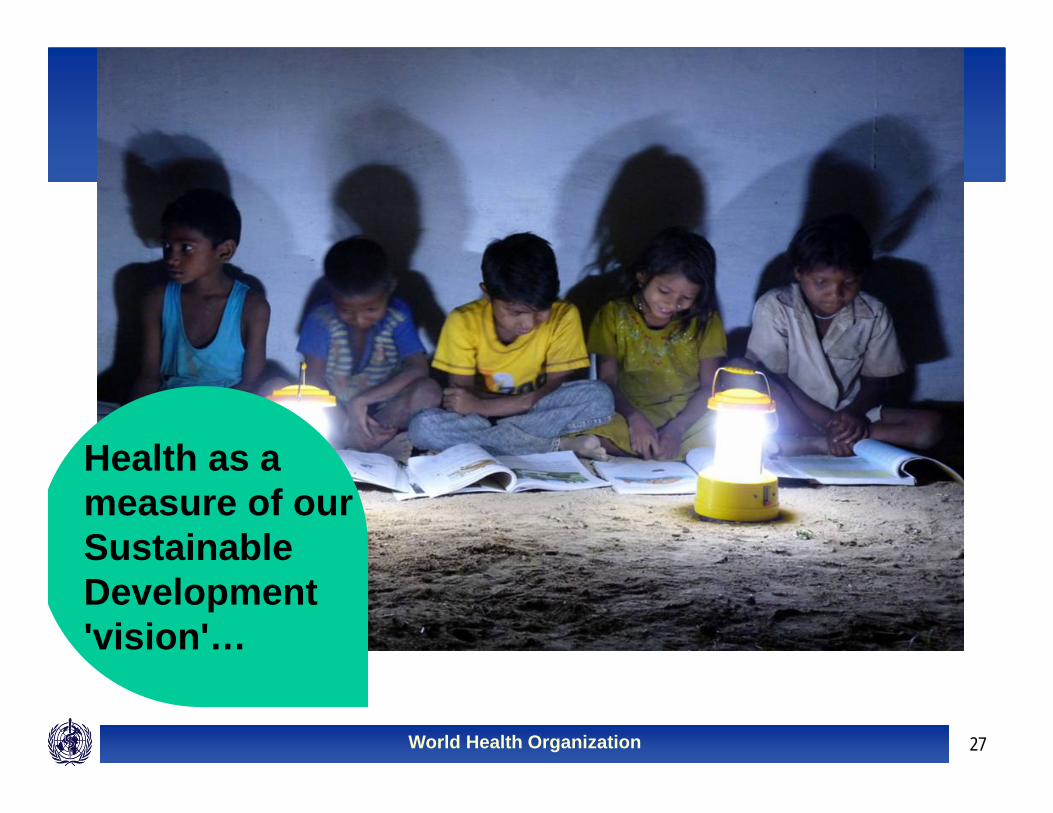
Health as a measure of our Sustainable Development 'vision'…
World Health Organization 28
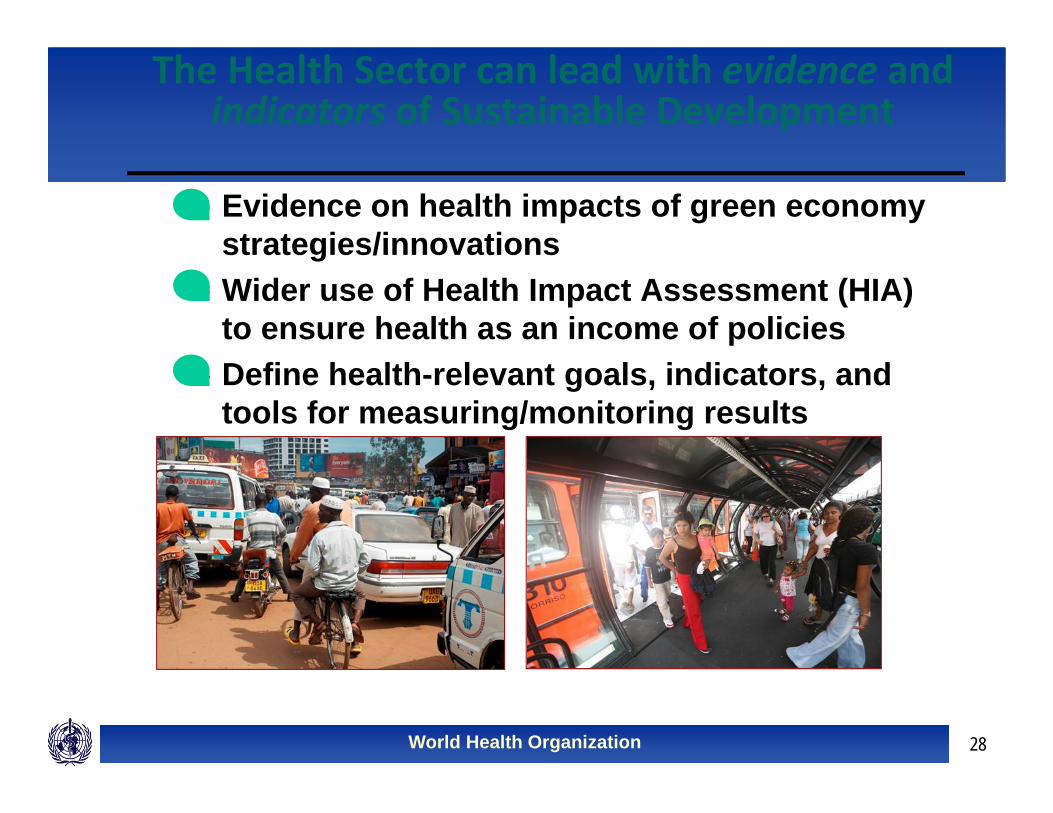
The Health Sector can lead with evidence and indicators of Sustainable Development
– Evidence on health impacts of green economy strategies/innovations
– Wider use of Health Impact Assessment (HIA) to ensure health as an income of policies
– Define health-relevant goals, indicators, and tools for measuring/monitoring results
World Health Organization 29
WH
O/H
ans
Ever
ts
Sustainable Cities: % of urban population exposed to air pollution above recommended WHO Air Quality
limits.
Safe and Healthy transport: % of the population with access to (living within 1km) rapid transit/public transport. % of urban roadways with dedicated walking and cycling infrastructure.
Energy - % of households using clean fuels/cooking and heating technologies.
Green jobs - % of workplaces/jobs meeting basic occupational health and safety standards – including air, water, exposure to chemicals and radiation, lighting & ventilation.
Water - % of global population with access to climate resilient safe drinking water and improved sanitation.
Food - % of population with access to healthy foods, % undernourished; % obese; % inadequate micronutrients and dietary balance.
Health care – % of health care facilities with access to clean energy and water supplies.
Governance – % of large projects integrating health co-benefits considerations into their planning and implementation, e.g. through a health impact assessment (HIA).
Health Metrics - Examples of indicators for Health and Sustainable Development
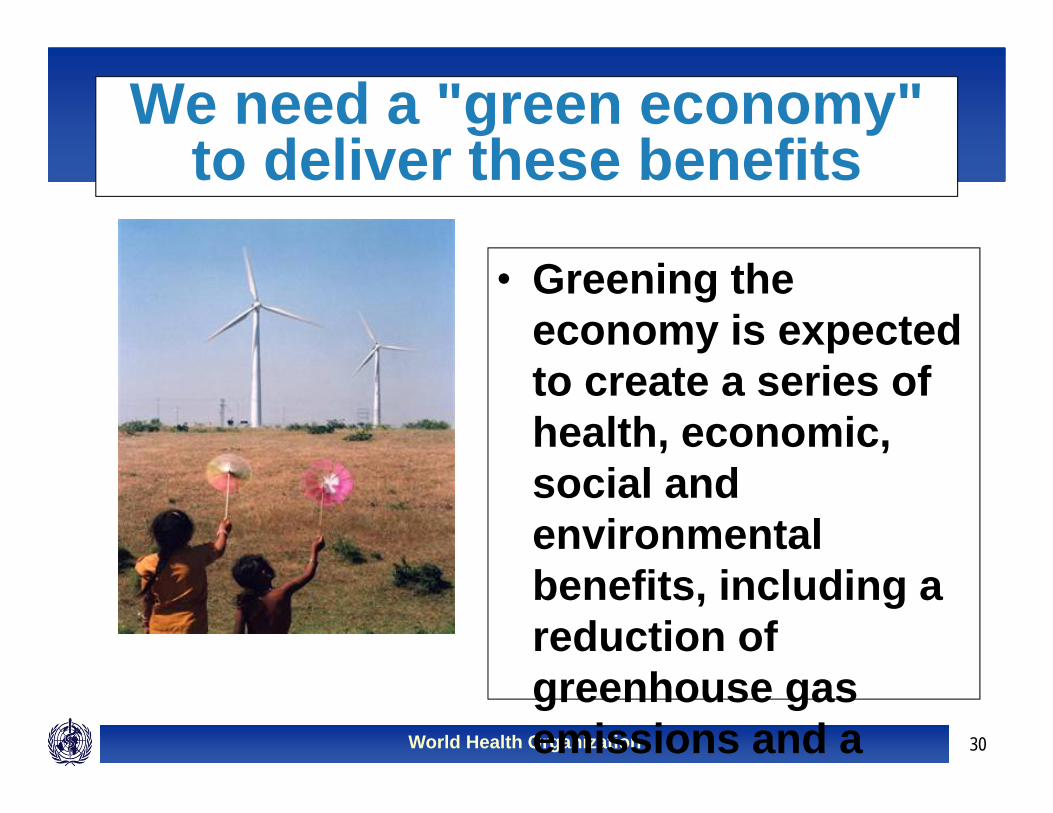
World Health Organization 30
We need a "green economy" to deliver these benefits
• Greening the economy is expected to create a series of health, economic, social and environmental benefits, including a reduction of greenhouse gas emissions and a
World Health Organization 31
Moving from inconvenient to convenient truths