Embed Size (px)
Citation preview
1 International Journal of Green Chemistry and Bioprocess 2011, 1 (1) 1-6
Original Article
Environmental Impact Assessment (EIA) studies of existing of Lime stone industries
D.Gopla Krishna*, M.Anji Reddy and T.Vijaya Lakshmi
Centre for environment, Institute of Science & Technology (IST)
Jawaharlal Nehru Technological University (JNTUH)
Kukatpally, Hyderabad-500072, Andhra Pradesh, India.
E-mail*: [email protected]
Received 21 September 2011; accepted 03 October 2011
Abstract
The present report is a case study of Environmental Impact Assessment and Auditing of existing and expansion of limekiln
industries in and around piduguralla area. The base line studies on air environment, ambient air quality levels of suspended
particulate matter (SPM) Sulphur dioxide, oxides of nitrogen and meteorological data during summer. In order to access the
likely the arising impact from limekiln industries. EIA studies have been carried out, as a part of EIA studies base line
environment monitoring have been carried out during summer to know the existing air quality and predictions have been
carried out using meteorological data collected at the site during the summer season to estimate the incremental rise of ground
level over the base line values. EMP has been formulated for the proposed activity which has been thoroughly discussed.
© 2011 Universal Research Publications. All rights reserved
Key words: Environmental Impact Assessment (EIA), Environmental management plan (EMP), Environmental management system (EMS), Environmental Impact Statement (EIS), Lime stone, Calcium carbonate, Calcium oxide, Calcium sulfite, SOX,
NOX.
Introduction: EIA is a planning tool that is now generally
accepted as an integral component of sound decision-making.
The objective of EIA is to foresee and address potential
environmental problems/concerns at an early stage of project
planning and design. EIA/EMP should assist planners and
government authorities in the decision making process by
identifying the key impacts/issues and formulating mitigation measures.
Environmental Impact Assessment (EIA) methods
consists five analytical functions “Identification, Prediction,
Evaluation, Mitigation and Documentation”.
Andhra Pradesh contains 44% of limestone reserves of the
country with estimated reserves around 30,400 million tons of different
grades, produces 1.5 million tons and contributes 15 % of the total
production of the country. State is one of the largest producer of cement
(18-20%) with 18 major and 29: mini cement plants.
Materials and methods: Lime and lime stone are one of the basic
materials without which life would be greatly diminished and modern
commerce and industry could not exist. .Literally any object in man's home
and his office has acquired these ancient, prosaic, unglamorous, low cost
materials in some form of its manufacture-directly or indirectly. In fact,
the basic essentiality of Lime and Limestone has 'been linked to one leg of
a six-legged stool on which industry revolves. The other essential legs
being iron ore, salt, sulphur, petroleum and coal among these, Lime Stone
is the greatest in physical volume. The small-scale limekiln sector in India is
significant because of its important contribution to the country's economic development and rural employment.
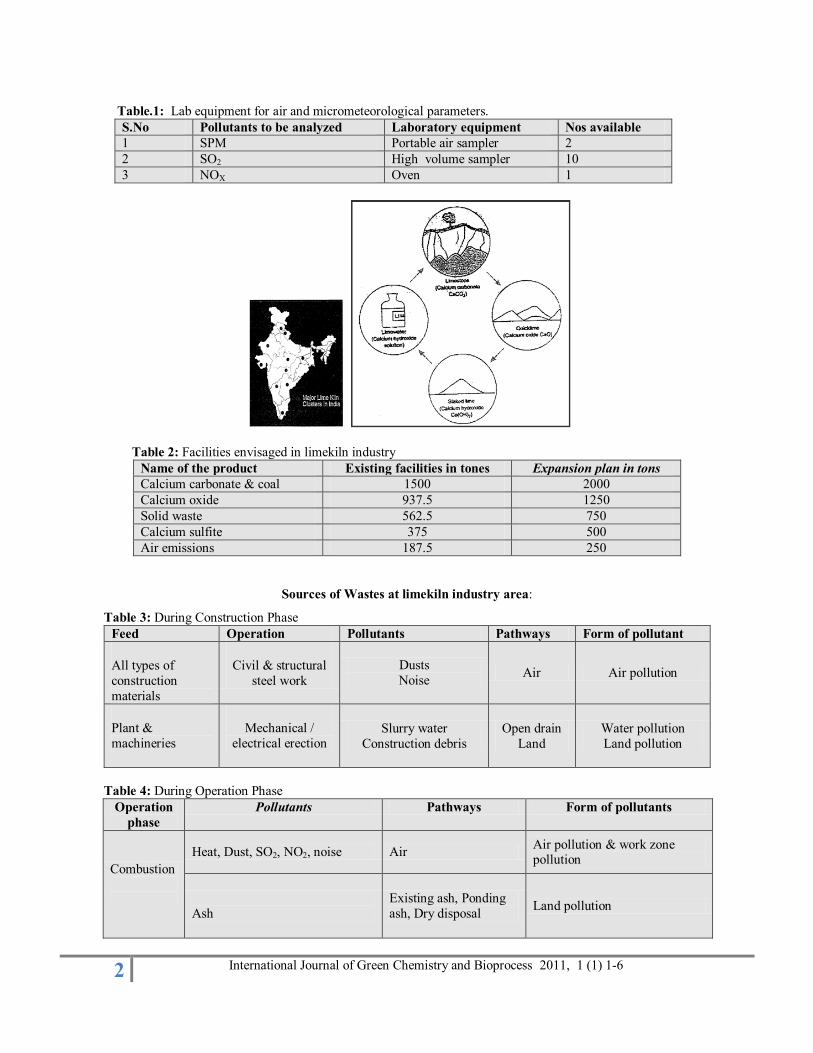
Manufacturing Process of Lime – Kiln: Lime, in the form of
quick lime or hydrated lime, consists of CaO and MgO in various
proportions. High-calcium quicklime contains 0-5% MgO and is the
most common type of lime produced. Magnesium quicklime contains
5-35% MgO and dolomitic quicklime (also referred to as dolime)
contains 35-45% MgO.
Hydrated lime (calcium hydroxide, Ca (OH)2, also known as
slaked lime, is a dry powder manufactured by adding water
to quicklime, converting the oxide to hydroxide. The production
of quick lime involves crushing/chipping of limestone and
burning in a kiln at temperatures ranging from 890°C to
Available online at http://www.urpjournals.com
International Journal of Green Chemistry and Bioprocess
Universal Research Publications. All rights reserved
2 International Journal of Green Chemistry and Bioprocess 2011, 1 (1) 1-6
Table.1: Lab equipment for air and micrometeorological parameters.
S.No Pollutants to be analyzed Laboratory equipment Nos available
1 SPM Portable air sampler 2
2 SO2 High volume sampler 10
3 NOX Oven 1
Table 2: Facilities envisaged in limekiln industry
Name of the product Existing facilities in tones Expansion plan in tons
Calcium carbonate & coal 1500 2000
Calcium oxide 937.5 1250
Solid waste 562.5 750
Calcium sulfite 375 500
Air emissions 187.5 250
Sources of Wastes at limekiln industry area:
Table 3: During Construction Phase
Feed Operation Pollutants Pathways Form of pollutant
All types of
construction
materials
Civil & structural
steel work
Dusts
Noise Air Air pollution
Plant &
machineries
Mechanical /
electrical erection Slurry water
Construction debris
Open drain
Land
Water pollution
Land pollution
Table 4: During Operation Phase
Operation
phase
Pollutants Pathways Form of pollutants
Combustion
Heat, Dust, SO2, NO2, noise Air Air pollution & work zone pollution
Ash
Existing ash, Ponding
ash, Dry disposal Land pollution
3 International Journal of Green Chemistry and Bioprocess 2011, 1 (1) 1-6
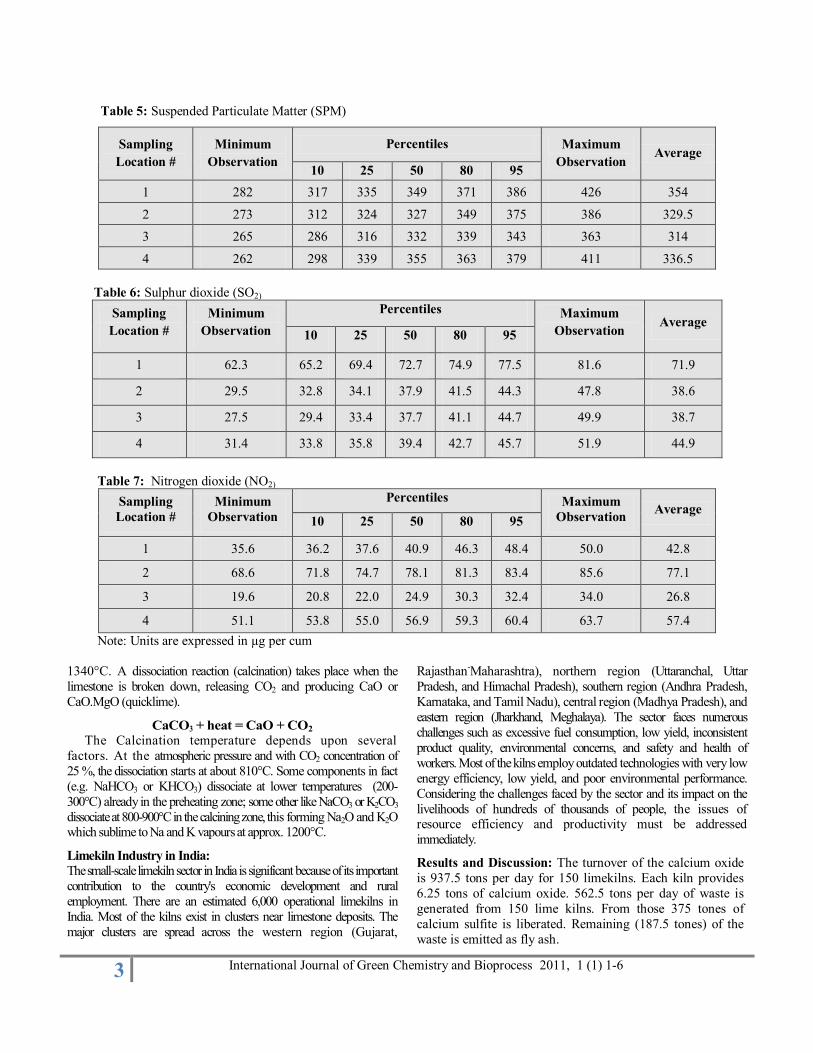
Table 5: Suspended Particulate Matter (SPM)
Sampling
Location #
Minimum
Observation
Percentiles Maximum
Observation Average
10 25 50 80 95
1 282 317 335 349 371 386 426 354
2 273 312 324 327 349 375 386 329.5
3 265 286 316 332 339 343 363 314
4 262 298 339 355 363 379 411 336.5
Table 6: Sulphur dioxide (SO2)
Sampling
Location #
Minimum
Observation
Percentiles Maximum
Observation Average
10 25 50 80 95
1 62.3 65.2 69.4 72.7 74.9 77.5 81.6 71.9
2 29.5 32.8 34.1 37.9 41.5 44.3 47.8 38.6
3 27.5 29.4 33.4 37.7 41.1 44.7 49.9 38.7
4 31.4 33.8 35.8 39.4 42.7 45.7 51.9 44.9
Table 7: Nitrogen dioxide (NO2)
Sampling
Location #
Minimum
Observation
Percentiles Maximum
Observation Average
10 25 50 80 95
1 35.6 36.2 37.6 40.9 46.3 48.4 50.0 42.8
2 68.6 71.8 74.7 78.1 81.3 83.4 85.6 77.1
3 19.6 20.8 22.0 24.9 30.3 32.4 34.0 26.8
4 51.1 53.8 55.0 56.9 59.3 60.4 63.7 57.4
Note: Units are expressed in µg per cum
1340°C. A dissociation reaction (calcination) takes place when the
limestone is broken down, releasing CO2 and producing CaO or
CaO.MgO (quicklime).
CaCO3 + heat = CaO + CO2
The Calcination temperature depends upon several
factors. At the atmospheric pressure and with CO2 concentration of
25 %, the dissociation starts at about 810°C. Some components in fact
(e.g. NaHCO3 or KHCO3) dissociate at lower temperatures (200-
300°C) already in the preheating zone; some other like NaCO3 or K2CO3
dissociate at 800-900°C in the calcining zone, this forming Na2O and K2O which sublime to Na and K vapours at approx. 1200°C.
Limekiln Industry in India:
The small-scale limekiln sector in India is significant because of its important
contribution to the country's economic development and rural
employment. There are an estimated 6,000 operational limekilns in
India. Most of the kilns exist in clusters near limestone deposits. The
major clusters are spread across the western region (Gujarat,
Rajasthan-Maharashtra), northern region (Uttaranchal, Uttar
Pradesh, and Himachal Pradesh), southern region (Andhra Pradesh,
Karnataka, and Tamil Nadu), central region (Madhya Pradesh), and
eastern region (Jharkhand, Meghalaya). The sector faces numerous
challenges such as excessive fuel consumption, low yield, inconsistent
product quality, environmental concerns, and safety and health of
workers. Most of the kilns employ outdated technologies with very low
energy efficiency, low yield, and poor environmental performance.
Considering the challenges faced by the sector and its impact on the
livelihoods of hundreds of thousands of people, the issues of resource efficiency and productivity must be addressed
immediately.
Results and Discussion: The turnover of the calcium oxide
is 937.5 tons per day for 150 limekilns. Each kiln provides
6.25 tons of calcium oxide. 562.5 tons per day of waste is
generated from 150 lime kilns. From those 375 tones of
calcium sulfite is liberated. Remaining (187.5 tones) of the
waste is emitted as fly ash.
4 International Journal of Green Chemistry and Bioprocess 2011, 1 (1) 1-6
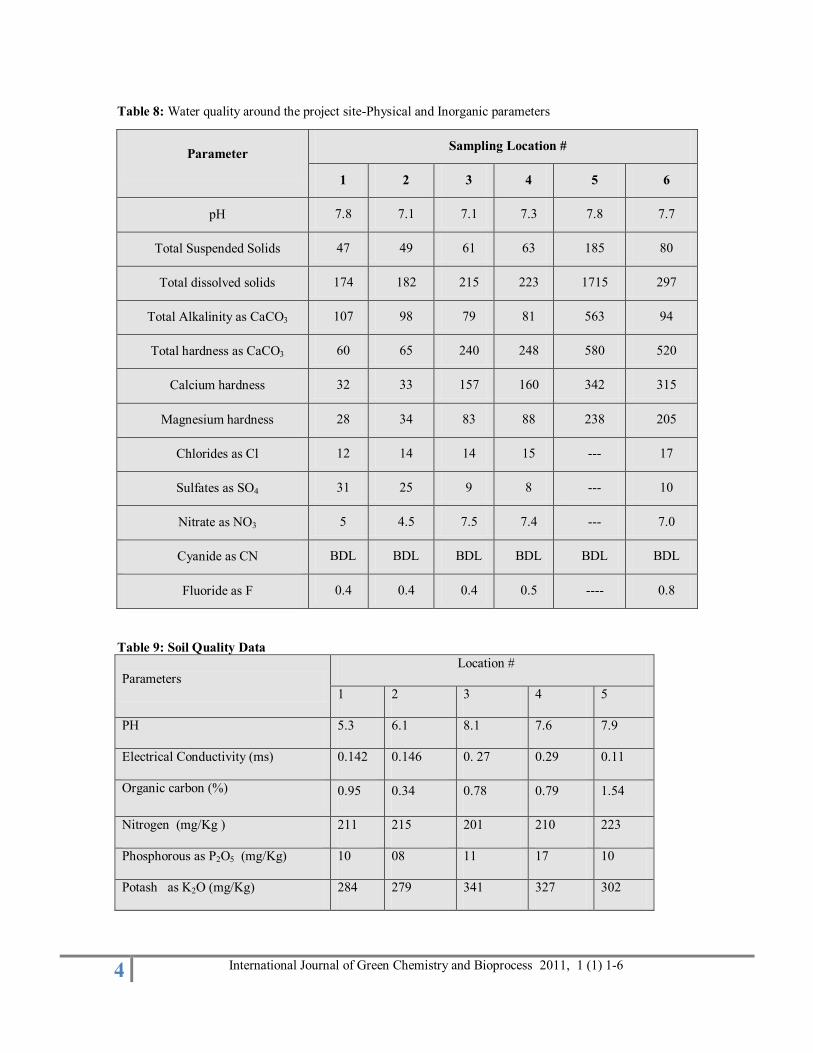
Table 8: Water quality around the project site-Physical and Inorganic parameters
Parameter Sampling Location #
1 2 3 4 5 6
pH 7.8 7.1 7.1 7.3 7.8 7.7
Total Suspended Solids 47 49 61 63 185 80
Total dissolved solids 174 182 215 223 1715 297
Total Alkalinity as CaCO3 107 98 79 81 563 94
Total hardness as CaCO3 60 65 240 248 580 520
Calcium hardness 32 33 157 160 342 315
Magnesium hardness 28 34 83 88 238 205
Chlorides as Cl 12 14 14 15 --- 17
Sulfates as SO4 31 25 9 8 --- 10
Nitrate as NO3 5 4.5 7.5 7.4 --- 7.0
Cyanide as CN BDL BDL BDL BDL BDL BDL
Fluoride as F 0.4 0.4 0.4 0.5 ---- 0.8
Table 9: Soil Quality Data
Parameters
Location #
1 2 3 4 5
PH 5.3 6.1 8.1 7.6 7.9
Electrical Conductivity (ms) 0.142 0.146 0. 27 0.29 0.11
Organic carbon (%) 0.95 0.34 0.78 0.79 1.54
Nitrogen (mg/Kg ) 211 215 201 210 223
Phosphorous as P2O5 (mg/Kg) 10 08 11 17 10
Potash as K2O (mg/Kg) 284 279 341 327 302
5 International Journal of Green Chemistry and Bioprocess 2011, 1 (1) 1-6
Table 10: Stack emissions
S.
No Stack attached to
Dia
(m)
Height
(m)
Temp. of
flue gas
(0C)
Velocity
of flue gas
(m/sec)
SPM
(g/s)
SO2
(g/s)
NOX
(g/s)
1. Pelletisation plant stack attached to Grate 1.5 37 100 14.1 0.3 --- ---
2. EAF & LRF (common Stack) 0.80 30 100 16.0 0.86 --- ---
3 Reheating Furnace 1.10 30 180 15.0 0.52 1.96 2.30
4. FBC Boiler 1.85 75 150 20.0 2.38 74.1 3.6
5. WHRB 2.62 40 150 20.0 7.2 3.05 1.4
6. DG Set (750 KVA) 0.25 6 90 2.5 0.01 2.10 1.80
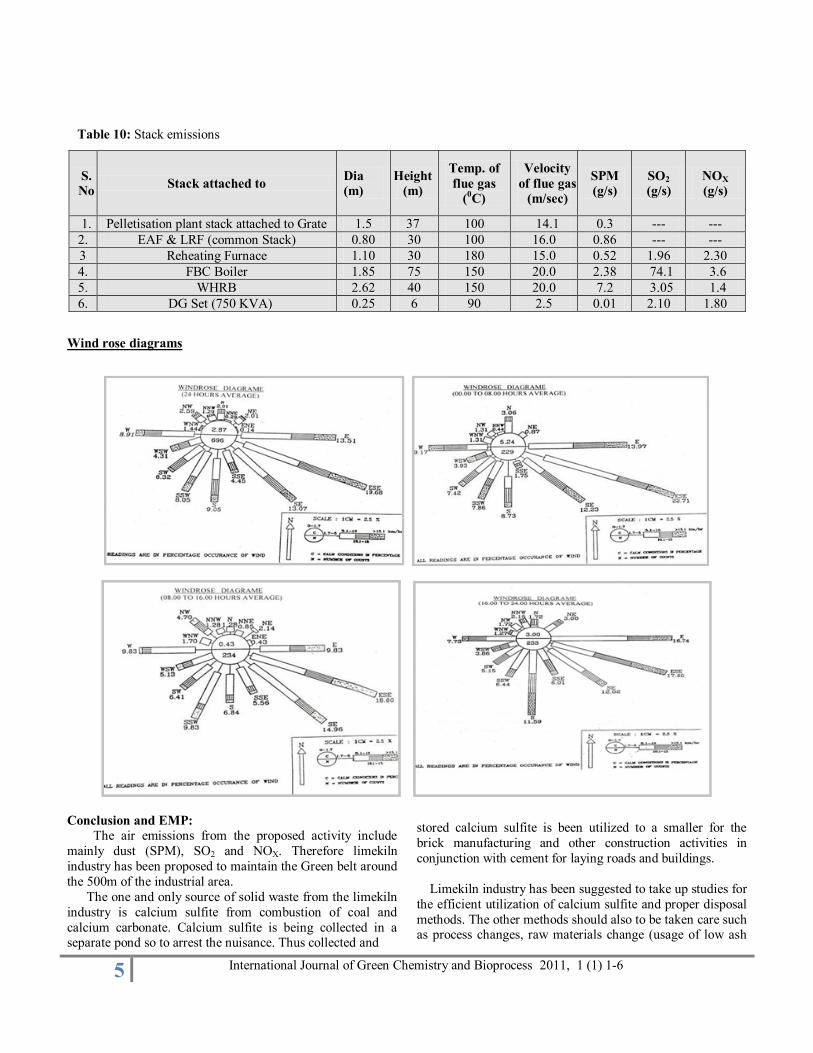
Wind rose diagrams
Conclusion and EMP:
The air emissions from the proposed activity include
mainly dust (SPM), SO2 and NOX. Therefore limekiln
industry has been proposed to maintain the Green belt around
the 500m of the industrial area.
The one and only source of solid waste from the limekiln
industry is calcium sulfite from combustion of coal and
calcium carbonate. Calcium sulfite is being collected in a separate pond so to arrest the nuisance. Thus collected and
stored calcium sulfite is been utilized to a smaller for the
brick manufacturing and other construction activities in
conjunction with cement for laying roads and buildings.
Limekiln industry has been suggested to take up studies for
the efficient utilization of calcium sulfite and proper disposal
methods. The other methods should also to be taken care such as process changes, raw materials change (usage of low ash
6 International Journal of Green Chemistry and Bioprocess 2011, 1 (1) 1-6
content coals in the process) and operating conditions so as to
reduce the solid wastes with a war footing effort.
To reduce the noise levels it has been suggested to use
noise-absorbing materials for construction of floors, walls
and roofs. Noise enclosures are also been suggested for the
generators. Whereas, for the personal protection from noise and dust, Nose masks and ear muffs / plugs to be provided at
work place.
Acknowledgements: Authors thank to Jawaharlal Nehru
Technological University Hyderabad for providing research
facilities to the research scholar.
References
[1]. Environmental Impact Analysis Handbook, edited by
John G. Rau and David C.Wooten (McGraw-Hill Book
company, USA), 1980.
[2]. C.S. Rao, Environmental Pollution control engineering,
(Wiley Eastern Limited, New Delhi), First Reprint, 1992.
[3]. Alden, HR: EIA a procedure for coordination and organizing Environmental planning and ecological Institute,
Boulder.
[4]. RK Jain, L.V. urban and G.S Stacey, Environmental
Impact Analysis – A New dimension in a decision making,
(van Nostrand Reinhold Company, New York), 1977.
[5]. M.K. Dasw,” Air pollution in India and how to tackle it”,
chemical Age of India, Vol.28 (1977), pp.433-435.
[6]. H.M.Dix., environmental Pollution (John Wiley and
Sons, New York), 1981.
[7].O.G.Sutton, Micrometeorology (Mc Graw-Hill, New
York), 1953.
[8]. A.T.Rossanno, Air pollution control guidebook for
management (E.R.A.Inc., Stanford, Conn.,) 1969.
[9]. H.H.Lettau, “wind profile, surface stress, and geotropic
drag coefficients”, in advances in geophysics, Vol.6, Atmospheric diffusion and air pollution (Academic Press,
New York), 1959, pp.241-256.
[10]. Metcalf and Eddy, inc., Waste water Engineering,
(McGraw-Hill, New York), 1972.
[11]. Standard methods for estimation for the Examination of
water and wastewater, 13th edition (American Public Health
Association, yearbook publication, Chicago), 1971.
[12]. D.K. Todd, the water encyclopedia (water inf. Cen. Port
Washington, New York), 1970.
[13]. The institute of energy management, Bombay all India
conference on air pollution, 1980.
[14]. Air pollution, third edition, edited by A.C Stern, Academic process, New York
[15]. S.H.Stocker and S.L.Seager, Environmental Chemistry:
air and water pollution (Scott Foresman & Co., New York),
1976
[16]. Pollution control Acts, rules and notifications, central
pollution control board (CPCB), Government of India.
[17].Guidelines of conducting Air quality Modeling,
CPCB,Doc.NO PROBES/70/1997-98.
[18]. Air pollution by SRERN, Vol.1.
Source of support: Nil; Conflict of interest: None declared