Embed Size (px)
Citation preview
Environmental Impact Assessment Final Report
FOR
Proposed construction of Resort on plot bearing gut No. 31/1, 30/2/3(C+E),
Mauje Chandranagar, Dapoli, Ratnagiri
Submitted to
MCZMA
Environmental Consultant
Building Environment (India) Pvt. Ltd
Dakshina Building, Office No-401,4th Floor,
Beside Raigard Bhavan, Sakal Bhavan Rd,
Sector 11, CBD Belapur,
Navi Mumbai, Maharashtra 400614
Telefax: 022 4123 7073/2757 8554
Web: www.beipl.co.in
March 2017
2
1. Introduction ...................................................................................................................... 7
1.1 Introduction ........................................................................................................................... 7
1.2 Need of the Project ................................................................................................................ 8
1.3 Brief Description ................................................................................................................... 9
1.4 Scope of the EIA study.......................................................................................................... 9
1.5 Legal Framework ................................................................................................................ 10
1.6 Organisation of Report ....................................................................................................... 13
2. Project Description ........................................................................................................ 15
2.1 Location of the Project ....................................................................................................... 15
2.2 Connectivity ......................................................................................................................... 16
2.3 Project details ...................................................................................................................... 17
2.4 Land Use .............................................................................................................................. 20
2.5 Construction Details ........................................................................................................... 20
3. Description of the Environment ................................................................................... 23
3.1 Introduction ......................................................................................................................... 23
3.1.1 Environmental Baseline .............................................................................................. 23
3.1.2 Baseline Environmental Quality Data ....................................................................... 24
3.1.3 Methodology ................................................................................................................ 26
3.1.4 Present Environment Scenario: ................................................................................. 26
3.2 Project site and surrounding area ..................................................................................... 27
3.3 Topography and Land Use ................................................................................................. 27
3.3.1 Topography of the area .............................................................................................. 28
3.3.2 Land use cover under the proposed resort ............................................................... 30
3.3.3 Land Use and Land Cover ......................................................................................... 30
3.3.4 Drainage ....................................................................................................................... 31
3.3.5 Climatic conditions ..................................................................................................... 31
3.3.6 Soil ................................................................................................................................ 31
3.3.7 Wind ............................................................................................................................. 32
3.4 Air Environment ................................................................................................................. 32
3.4.1 Observations ................................................................................................................ 34
3.4.2 Wind Speed and Wind Direction ............................................................................... 34
3.4.3 Results .......................................................................................................................... 35
3.4.4 Visibility: ...................................................................................................................... 35
3.4.5 Rainfall ......................................................................................................................... 35
3.5 Baseline Ambient Air Quality Status ................................................................................ 35
3.5.1 Summary of the result of air quality ......................................................................... 36
3.5.2 Summary of the Ambient Quality report is as below .............................................. 37
3
3.6 Ground Water and Surface Water Monitoring ............................................................... 38
3.6.1 Sampling Procedure for Primary Data Collection ................................................... 38
3.6.2 Methodology for Sampling ......................................................................................... 39
3.6.3 Discussion on Result: .................................................................................................. 41
3.7 Geology of The Area ........................................................................................................... 42
3.7.1 Hard Rock Areas ......................................................................................................... 43
3.7.2 Soil Quality Monitoring .............................................................................................. 44
3.8 Noise Environment .............................................................................................................. 47
3.8.1 Ambient Noise Level Standards ................................................................................. 47
3.8.2 Locations of Noise Level Monitoring......................................................................... 47
3.8.3 Findings ........................................................................................................................ 48
3.9 Flora and Fauna .................................................................................................................. 49
3.9.1 Baseline Status ............................................................................................................. 49
3.9.2 Location of Biological Study ...................................................................................... 49
3.9.3 Methodology of Biological Study ............................................................................... 49
3.9.4 Flora and fauna in and around the project site ........................................................ 50
3.10 Socio–Economic Information ............................................................................................. 57
3.11 Seismology ........................................................................................................................... 59
4. Anticipated Impacts and its Mitigations ...................................................................... 61
4.1 Sources of Pollution: ................................................................................................................. 61
4.1 Impact on Land Environment ........................................................................................... 61
4.2 Impact on Soil and Geology ............................................................................................... 62
4.3 Potential Impact on Water Quality ................................................................................... 62
4.4 Impact on Noise Environment ........................................................................................... 63
4.4.1 During construction phase ......................................................................................... 63
4.4.2 During operation phase .............................................................................................. 63
4.5 Impact on Ecology ............................................................................................................... 64
4.5.1 Construction Phase ..................................................................................................... 64
4.5.2 Functional Phase ......................................................................................................... 64
5. Environmental Monitoring Program ........................................................................... 66
5.1 Monitoring Plan during Construction Phase .................................................................... 66
5.2 Environment monitoring plan during construction and operation phase ..................... 67
5.2.1 During Construction phase ........................................................................................ 67
5.2.2 During Operational phase: ......................................................................................... 68
5.3 Environment Cost ............................................................................................................... 69
6. Project Benefit ................................................................................................................ 70
7. Environment Management Plan ................................................................................... 71
4
7.1 Land Environment .............................................................................................................. 71
7.2 Management of Solid Waste............................................................................................... 71
7.2.1 During Construction Phase ........................................................................................ 72
7.2.2 During Operation Phase ............................................................................................. 72
7.2.3 Storage of Waste.......................................................................................................... 73
7.3 Air Environment ................................................................................................................. 75
7.4 Noise Pollution ..................................................................................................................... 76
7.5 Water Environment ............................................................................................................ 76
7.5.1 Proposed location of STP ........................................................................................... 79
7.6 Green Belt Development ..................................................................................................... 81
Disclosure of Consultants Engaged .............................................................................. 82
8.1 Project Details ............................................................................... Error! Bookmark not defined.
8.2 Project Team ................................................................................. Error! Bookmark not defined.
8.3 EIA Coordinator ........................................................................... Error! Bookmark not defined.
8.4 Functional Area Expert ................................................................ Error! Bookmark not defined.
8.5 Functional Area Code Details .................................................................................................. 86
9. Annexures ....................................................................................................................... 88
9.1 Result of Ambient Air Quality Monitoring ................................................................... 88
9.2 Noise Monitoring Results ......................................................................................................... 95
LIST OF TABLES
Table 1-1: Key Applicable Acts &Regulations for the project .......................................... 10
Table 2-1: Connectivity to the project site ........................................................................... 16
Table 2-2: Details of the project ........................................................................................... 19
Table 2-3: The details of the work involved in development of the resort along with
material of construction and quantity.................................................................................. 20
Table 3-1: Environmental attributes .................................................................................... 23
Table 3-2: Environmental Attributes: Frequency and Monitoring Method .................... 24
Table 3-3: Important features observed in 5 km buffer zone ............................................ 25
Table 3-4: Climatic condition details ................................................................................... 31
Table 3-5: Mean Wind speed in Ratnagiri district ............................................................. 32
Table 3-6: National Ambient Air Quality Standards ......................................................... 32
Table 3-7: Accuracy of Meteorological Equipment ............................................................ 33
Table 3-8: Monthly Normal Rainfall.................................................................................... 35
Table 3-9: Ambient air monitoring report .......................................................................... 37
Table 3-10: Result of Ground water and surface water quality monitoring .................... 40
5
Table 3-11: Details of Soil Quality Monitoring Locations ................................................. 44
Table 3-12: Soil quality results ............................................................................................. 46
Table 3-13: National Ambient Noise Level .......................................................................... 47
Table 3-14: Existing trees at site ........................................................................................... 50
Table 3-15: Available plants in and around Chandranagar, Ratnagiri ........................... 50
Table 3-16: Availability of animals in and around Chandranagar, Ratnagiri ................ 53
Table 3-17: List of Butterfly Species Reported During the Study..................................... 55
Table 4-1: Pollutants generated in construction phase ...................................................... 61
Table 4-2: Total nos. of trees proposed to be planted ......................................................... 64
Table 5-1: Project Startup checklist ..................................................................................... 66
Table 5-2 67
Table 5-3: Environment Monitoring plan during Operational Phase .............................. 68
Table 5-4: Estimated environment cost ............................................................................... 69
Table 7-1: Solid Waste Generation during Operation Phase ............................................ 73
Table 7-2: Waste disposal ...................................................................................................... 74
Table 7-3: Water Budget for the Resort 2 ........................................................................... 77
LIST OF FIGURES
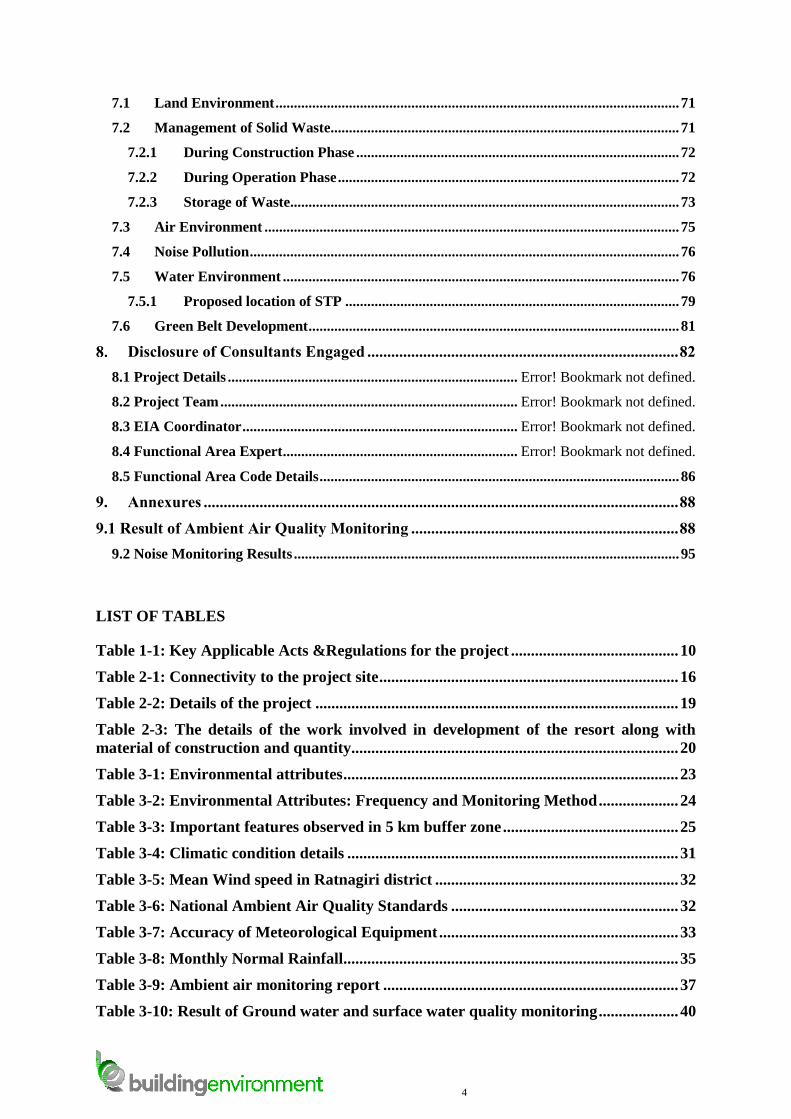
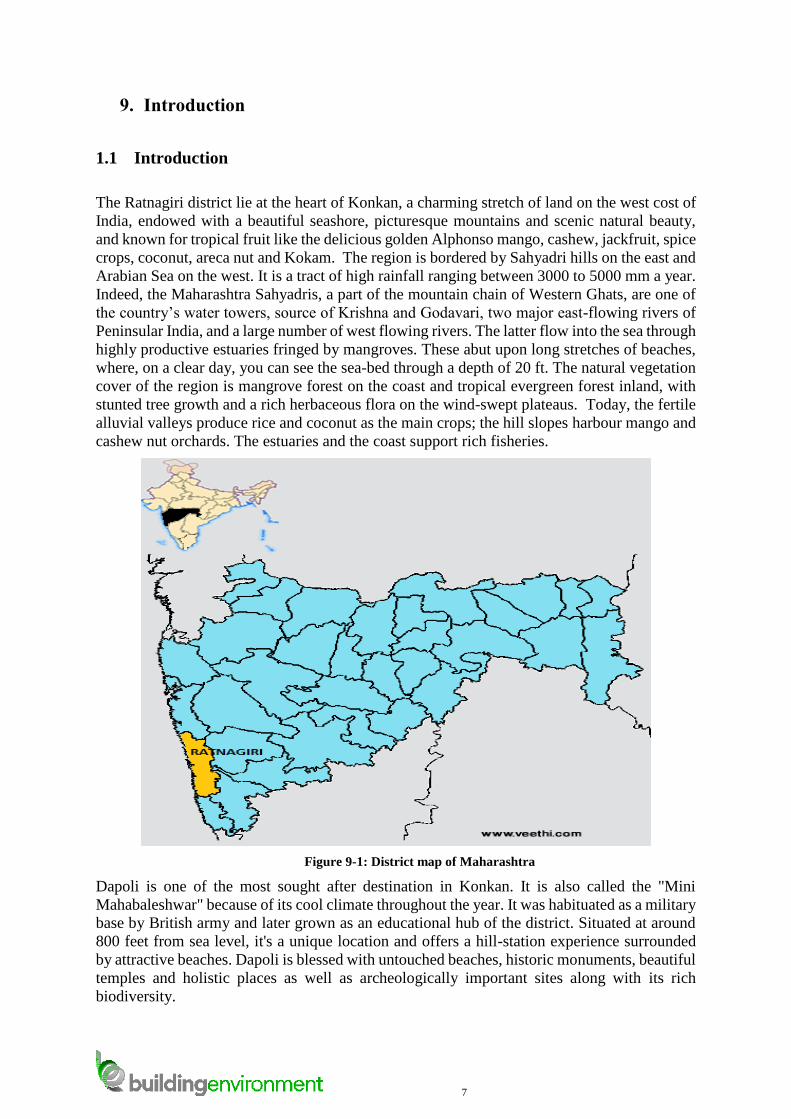
Figure 1-1: District map of Maharashtra .............................................................................. 7
Figure 1-2: Ratnagiri district map ......................................................................................... 8
Figure 2-1: Project location................................................................................................... 15
Figure 2-2: Connectivity map at the project site ................................................................. 17
Figure 2-3: Layout of the project superimposed on Google image ................................... 19
Figure 3-1: Google image of site with 5 km radius ............................................................. 27
Figure 3-2: Topography 5 km around the project site ....................................................... 29
Figure 3-3: 5 km and 10 km radius drawn on topography sheet ...................................... 30
Figure 3-4: Layout of the proposed resort superimposed on the Google image .............. 30
Figure 3-5: Wind rose pattern .............................................................................................. 34
Figure 3-6: Air monitoring locations.................................................................................... 36
Figure 3-7: Location of water sampling ............................................................................... 39
Figure 3-8: Geomorphology of Ratnagiri district ............................................................... 44
Figure 3-9: Soil monitoring locations ................................................................................... 45
Figure 3-10: Location of the Noise monitoring ................................................................... 48
Figure 3-11: Literacy deatils ................................................................................................. 58
Figure 3-12: Vocational study Pattern ................................................................................. 59
6
Figure 3-13: Seismic Zone of India....................................................................................... 60
Figure 7-1: Bin system ........................................................................................................... 73
Figure 7-2: OWC location at the project site ...................................................................... 75
Figure 7-3: Water Balance (dry season) .............................................................................. 78
Figure 7-4: Water Balance (wet season) .............................................................................. 79
Figure 7-5: Phytorid technology ........................................................................................... 80
7
9. Introduction
1.1 Introduction
The Ratnagiri district lie at the heart of Konkan, a charming stretch of land on the west cost of
India, endowed with a beautiful seashore, picturesque mountains and scenic natural beauty,
and known for tropical fruit like the delicious golden Alphonso mango, cashew, jackfruit, spice
crops, coconut, areca nut and Kokam. The region is bordered by Sahyadri hills on the east and
Arabian Sea on the west. It is a tract of high rainfall ranging between 3000 to 5000 mm a year.
Indeed, the Maharashtra Sahyadris, a part of the mountain chain of Western Ghats, are one of
the country’s water towers, source of Krishna and Godavari, two major east-flowing rivers of
Peninsular India, and a large number of west flowing rivers. The latter flow into the sea through
highly productive estuaries fringed by mangroves. These abut upon long stretches of beaches,
where, on a clear day, you can see the sea-bed through a depth of 20 ft. The natural vegetation
cover of the region is mangrove forest on the coast and tropical evergreen forest inland, with
stunted tree growth and a rich herbaceous flora on the wind-swept plateaus. Today, the fertile
alluvial valleys produce rice and coconut as the main crops; the hill slopes harbour mango and
cashew nut orchards. The estuaries and the coast support rich fisheries.
Figure 9-1: District map of Maharashtra
Dapoli is one of the most sought after destination in Konkan. It is also called the "Mini
Mahabaleshwar" because of its cool climate throughout the year. It was habituated as a military
base by British army and later grown as an educational hub of the district. Situated at around
800 feet from sea level, it's a unique location and offers a hill-station experience surrounded
by attractive beaches. Dapoli is blessed with untouched beaches, historic monuments, beautiful
temples and holistic places as well as archeologically important sites along with its rich
biodiversity.
8
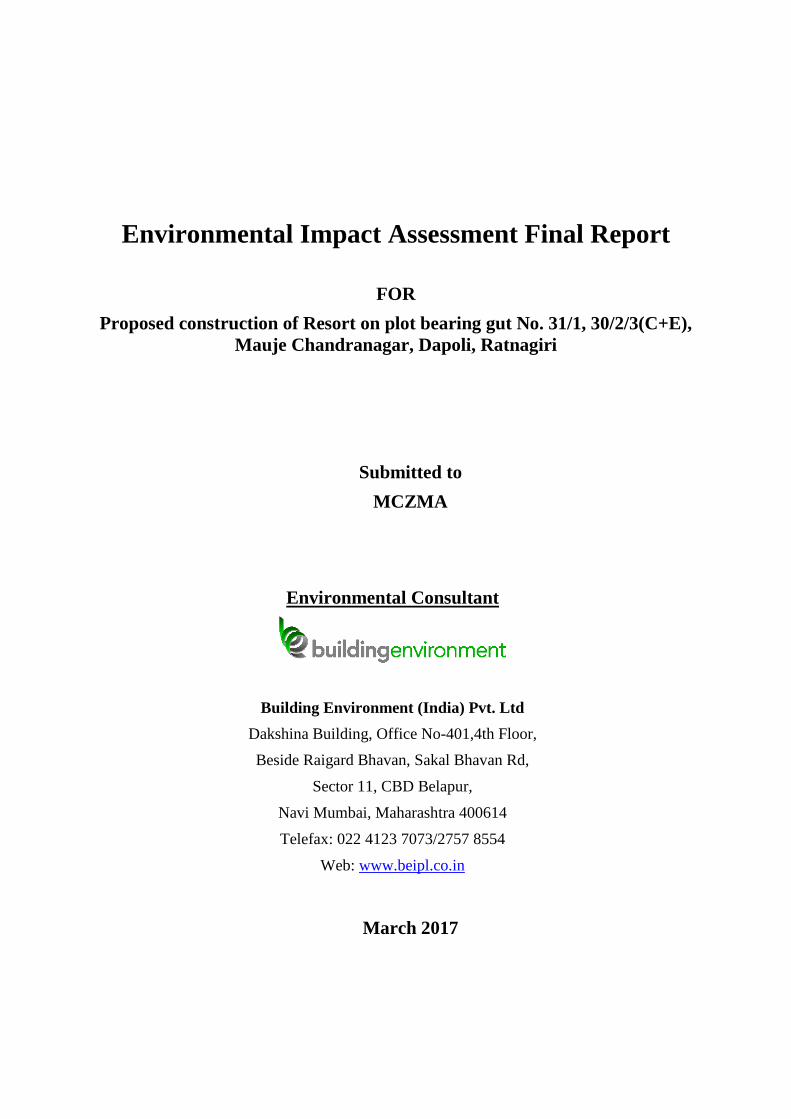
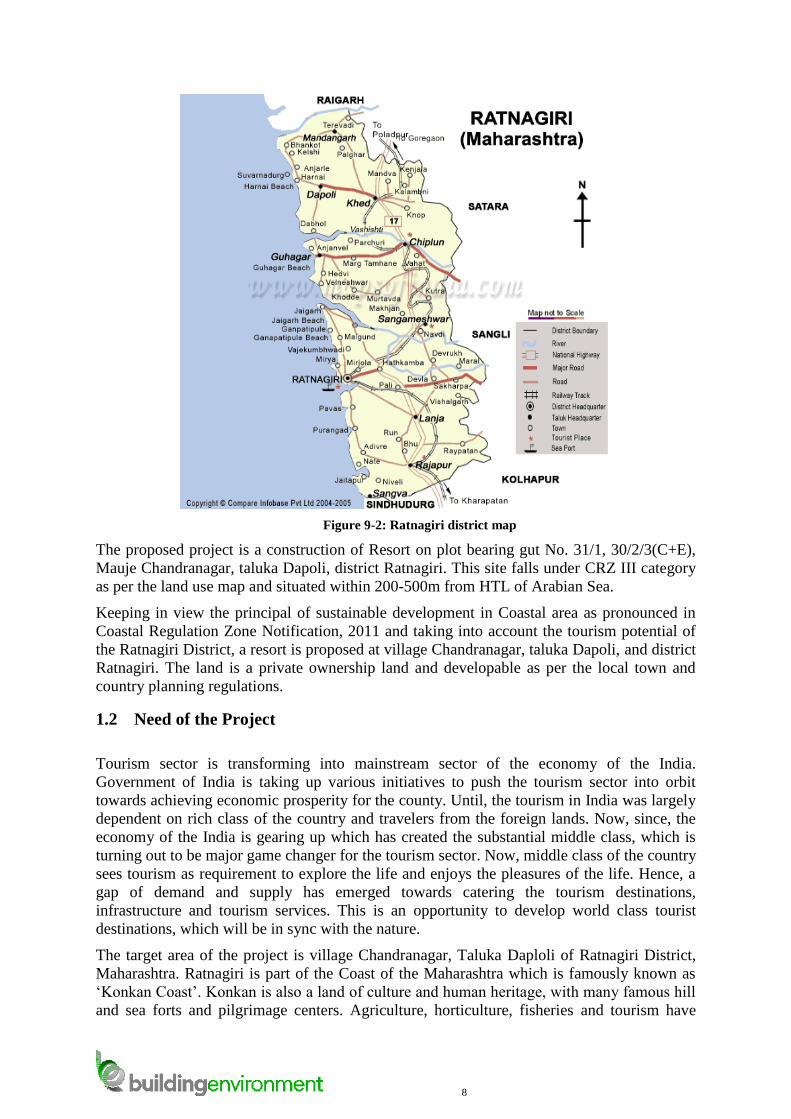
Figure 9-2: Ratnagiri district map
The proposed project is a construction of Resort on plot bearing gut No. 31/1, 30/2/3(C+E),
Mauje Chandranagar, taluka Dapoli, district Ratnagiri. This site falls under CRZ III category
as per the land use map and situated within 200-500m from HTL of Arabian Sea.
Keeping in view the principal of sustainable development in Coastal area as pronounced in
Coastal Regulation Zone Notification, 2011 and taking into account the tourism potential of
the Ratnagiri District, a resort is proposed at village Chandranagar, taluka Dapoli, and district
Ratnagiri. The land is a private ownership land and developable as per the local town and
country planning regulations.
1.2 Need of the Project
Tourism sector is transforming into mainstream sector of the economy of the India.
Government of India is taking up various initiatives to push the tourism sector into orbit
towards achieving economic prosperity for the county. Until, the tourism in India was largely
dependent on rich class of the country and travelers from the foreign lands. Now, since, the
economy of the India is gearing up which has created the substantial middle class, which is
turning out to be major game changer for the tourism sector. Now, middle class of the country
sees tourism as requirement to explore the life and enjoys the pleasures of the life. Hence, a
gap of demand and supply has emerged towards catering the tourism destinations,
infrastructure and tourism services. This is an opportunity to develop world class tourist
destinations, which will be in sync with the nature.
The target area of the project is village Chandranagar, Taluka Daploli of Ratnagiri District,
Maharashtra. Ratnagiri is part of the Coast of the Maharashtra which is famously known as
‘Konkan Coast’. Konkan is also a land of culture and human heritage, with many famous hill
and sea forts and pilgrimage centers. Agriculture, horticulture, fisheries and tourism have
9
therefore been the traditional pillars of economy of these districts. More recent times have
witnessed industrial development, with a chemical industry hub springing up at Lote, coal and
natural gas based power production and mining, and a proposed nuclear power facility.
Village Chandranagar is a coastal village in Dapoli taluka of Ratnagiri. Dapoli and its
surrounding area of Ratnagiri District has rich rich tourism potential, which is unexplored upto
the mark. Coastal area, flat & hilly terrain, vegetation make up pleasant climate. Tourist places
nearby are Ganapati pule, Guhagha, Veleneshar, Velas, Jaigad etc. are major tourist attractions.
The eco-friendly resort destination with all necessary facilities & services at the site would be
perfect setting to boost the tourism potential of the area.
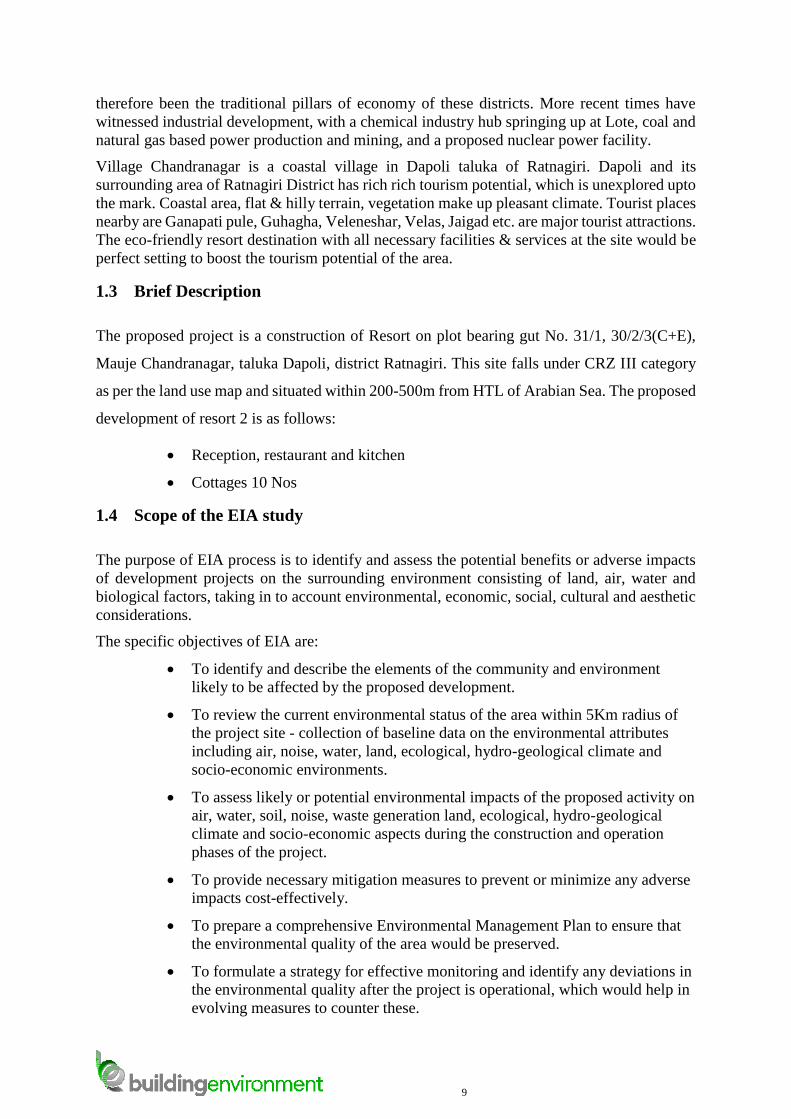
1.3 Brief Description
The proposed project is a construction of Resort on plot bearing gut No. 31/1, 30/2/3(C+E),
Mauje Chandranagar, taluka Dapoli, district Ratnagiri. This site falls under CRZ III category
as per the land use map and situated within 200-500m from HTL of Arabian Sea. The proposed
development of resort 2 is as follows:
Reception, restaurant and kitchen
Cottages 10 Nos
1.4 Scope of the EIA study
The purpose of EIA process is to identify and assess the potential benefits or adverse impacts
of development projects on the surrounding environment consisting of land, air, water and
biological factors, taking in to account environmental, economic, social, cultural and aesthetic
considerations.
The specific objectives of EIA are:
To identify and describe the elements of the community and environment
likely to be affected by the proposed development.
To review the current environmental status of the area within 5Km radius of
the project site - collection of baseline data on the environmental attributes
including air, noise, water, land, ecological, hydro-geological climate and
socio-economic environments.
To assess likely or potential environmental impacts of the proposed activity on
air, water, soil, noise, waste generation land, ecological, hydro-geological
climate and socio-economic aspects during the construction and operation
phases of the project.
To provide necessary mitigation measures to prevent or minimize any adverse
impacts cost-effectively.
To prepare a comprehensive Environmental Management Plan to ensure that
the environmental quality of the area would be preserved.
To formulate a strategy for effective monitoring and identify any deviations in
the environmental quality after the project is operational, which would help in
evolving measures to counter these.
10
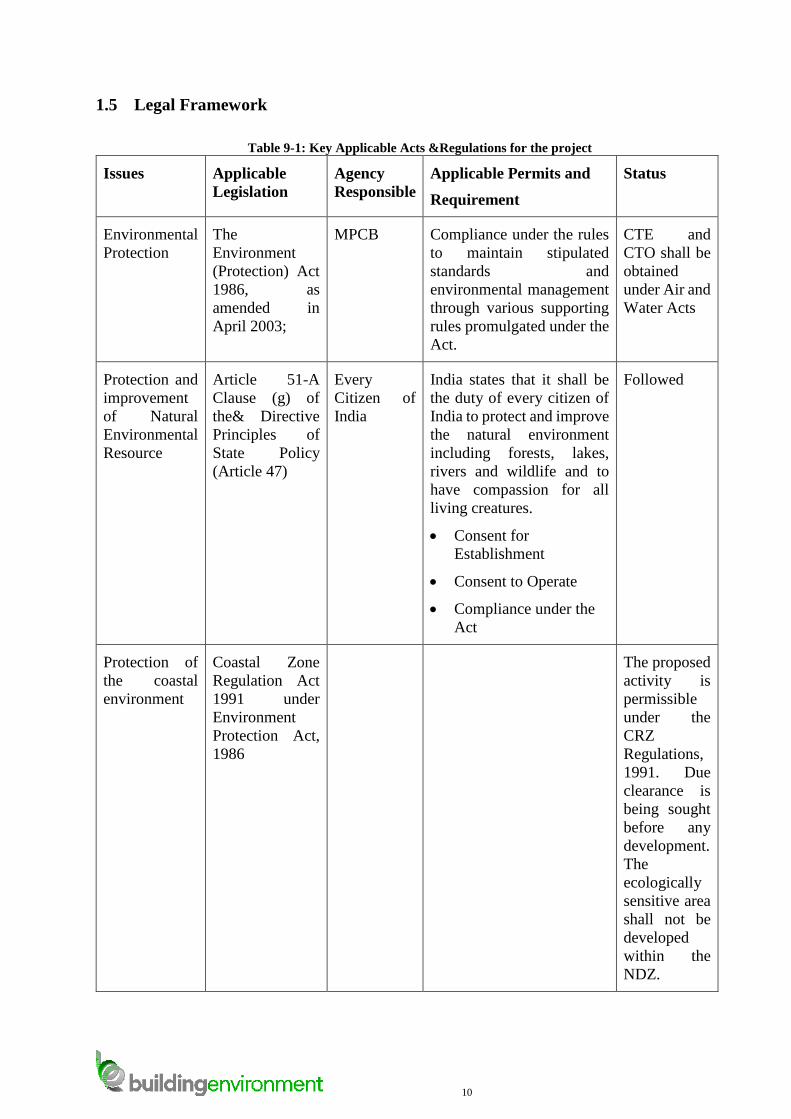
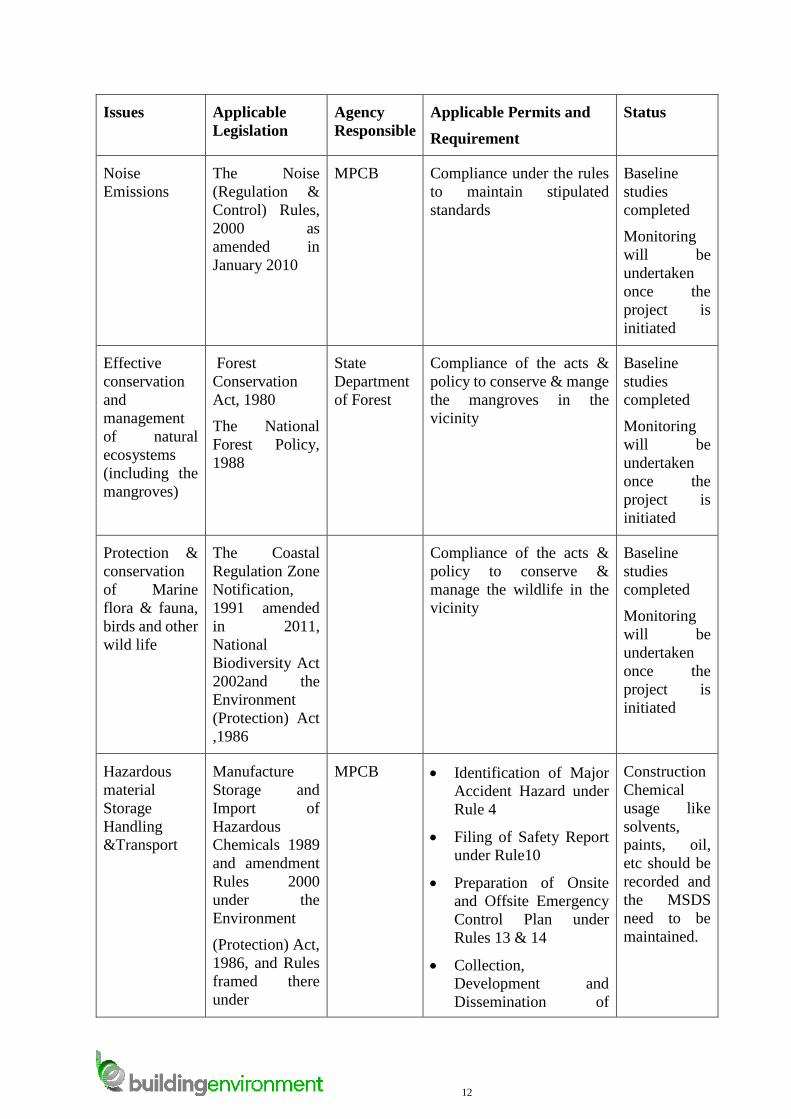
1.5 Legal Framework
Table 9-1: Key Applicable Acts &Regulations for the project
Issues Applicable
Legislation
Agency
Responsible
Applicable Permits and
Requirement
Status
Environmental
Protection
The
Environment
(Protection) Act
1986, as
amended in
April 2003;
MPCB Compliance under the rules
to maintain stipulated
standards and
environmental management
through various supporting
rules promulgated under the
Act.
CTE and
CTO shall be
obtained
under Air and
Water Acts
Protection and
improvement
of Natural
Environmental
Resource
Article 51-A
Clause (g) of
the& Directive
Principles of
State Policy
(Article 47)
Every
Citizen of
India
India states that it shall be
the duty of every citizen of
India to protect and improve
the natural environment
including forests, lakes,
rivers and wildlife and to
have compassion for all
living creatures.
Consent for
Establishment
Consent to Operate
Compliance under the
Act
Followed
Protection of
the coastal
environment
Coastal Zone
Regulation Act
1991 under
Environment
Protection Act,
1986
The proposed
activity is
permissible
under the
CRZ
Regulations,
1991. Due
clearance is
being sought
before any
development.
The
ecologically
sensitive area
shall not be
developed
within the
NDZ.
11
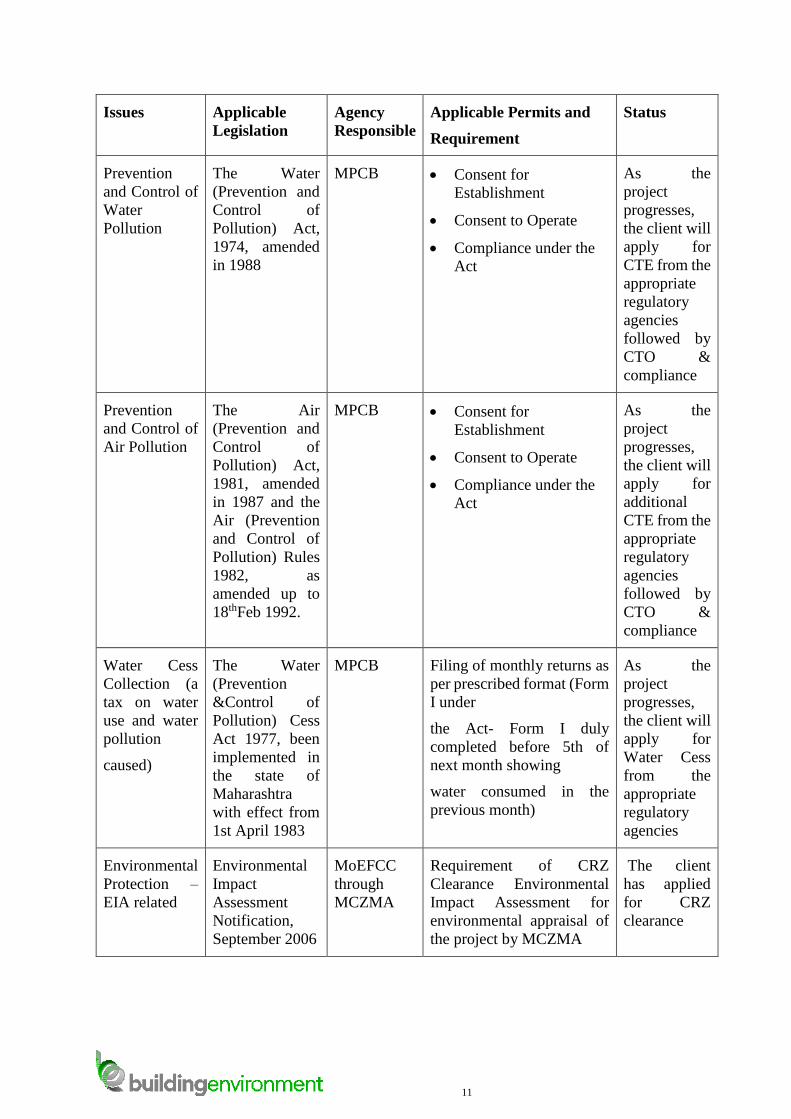
Issues Applicable
Legislation
Agency
Responsible
Applicable Permits and
Requirement
Status
Prevention
and Control of
Water
Pollution
The Water
(Prevention and
Control of
Pollution) Act,
1974, amended
in 1988
MPCB Consent for
Establishment
Consent to Operate
Compliance under the
Act
As the
project
progresses,
the client will
apply for
CTE from the
appropriate
regulatory
agencies
followed by
CTO &
compliance
Prevention
and Control of
Air Pollution
The Air
(Prevention and
Control of
Pollution) Act,
1981, amended
in 1987 and the
Air (Prevention
and Control of
Pollution) Rules
1982, as
amended up to
18thFeb 1992.
MPCB Consent for
Establishment
Consent to Operate
Compliance under the
Act
As the
project
progresses,
the client will
apply for
additional
CTE from the
appropriate
regulatory
agencies
followed by
CTO &
compliance
Water Cess
Collection (a
tax on water
use and water
pollution
caused)
The Water
(Prevention
&Control of
Pollution) Cess
Act 1977, been
implemented in
the state of
Maharashtra
with effect from
1st April 1983
MPCB Filing of monthly returns as
per prescribed format (Form
I under
the Act- Form I duly
completed before 5th of
next month showing
water consumed in the
previous month)
As the
project
progresses,
the client will
apply for
Water Cess
from the
appropriate
regulatory
agencies
Environmental
Protection –
EIA related
Environmental
Impact
Assessment
Notification,
September 2006
MoEFCC
through
MCZMA
Requirement of CRZ
Clearance Environmental
Impact Assessment for
environmental appraisal of
the project by MCZMA
The client
has applied
for CRZ
clearance
12
Issues Applicable
Legislation
Agency
Responsible
Applicable Permits and
Requirement
Status
Noise
Emissions
The Noise
(Regulation &
Control) Rules,
2000 as
amended in
January 2010
MPCB Compliance under the rules
to maintain stipulated
standards
Baseline
studies
completed
Monitoring
will be
undertaken
once the
project is
initiated
Effective
conservation
and
management
of natural
ecosystems
(including the
mangroves)
Forest
Conservation
Act, 1980
The National
Forest Policy,
1988
State
Department
of Forest
Compliance of the acts &
policy to conserve & mange
the mangroves in the
vicinity
Baseline
studies
completed
Monitoring
will be
undertaken
once the
project is
initiated
Protection &
conservation
of Marine
flora & fauna,
birds and other
wild life
The Coastal
Regulation Zone
Notification,
1991 amended
in 2011,
National
Biodiversity Act
2002and the
Environment
(Protection) Act
,1986
Compliance of the acts &
policy to conserve &
manage the wildlife in the
vicinity
Baseline
studies
completed
Monitoring
will be
undertaken
once the
project is
initiated
Hazardous
material
Storage
Handling
&Transport
Manufacture
Storage and
Import of
Hazardous
Chemicals 1989
and amendment
Rules 2000
under the
Environment
(Protection) Act,
1986, and Rules
framed there
under
MPCB Identification of Major
Accident Hazard under
Rule 4
Filing of Safety Report
under Rule10
Preparation of Onsite
and Offsite Emergency
Control Plan under
Rules 13 & 14
Collection,
Development and
Dissemination of
Construction
Chemical
usage like
solvents,
paints, oil,
etc should be
recorded and
the MSDS
need to be
maintained.
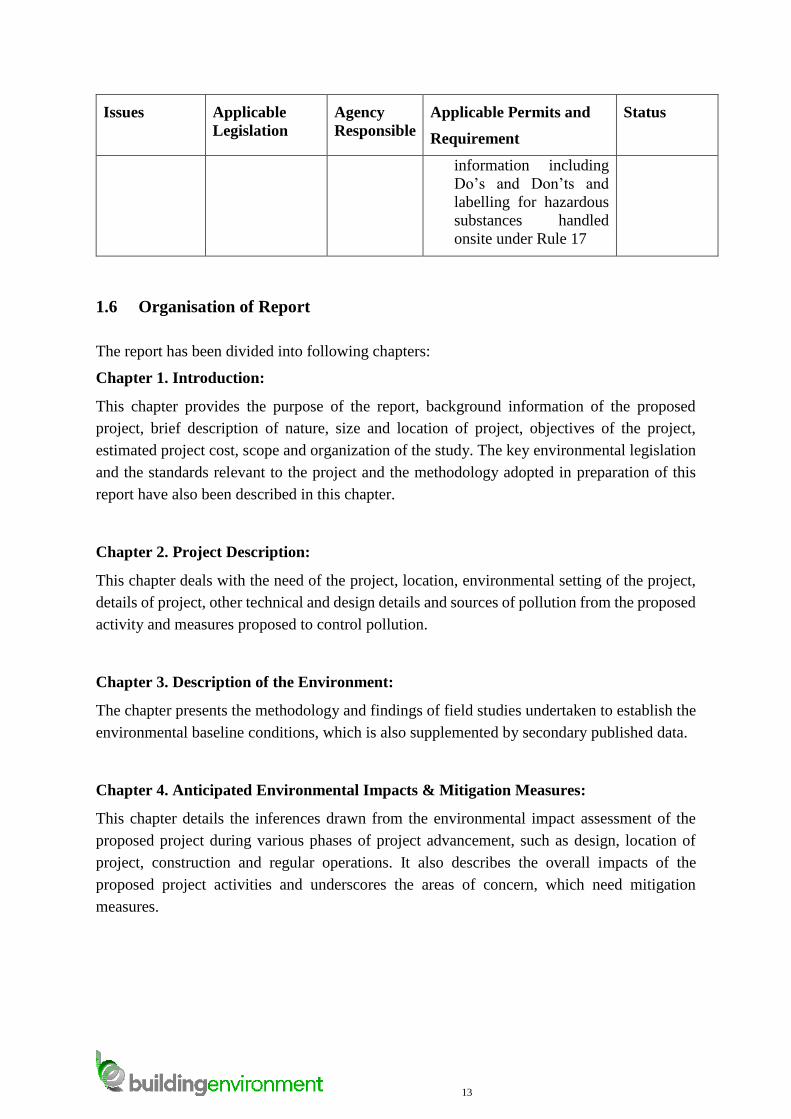
13
Issues Applicable
Legislation
Agency
Responsible
Applicable Permits and
Requirement
Status
information including
Do’s and Don’ts and
labelling for hazardous
substances handled
onsite under Rule 17
1.6 Organisation of Report
The report has been divided into following chapters:
Chapter 1. Introduction:
This chapter provides the purpose of the report, background information of the proposed
project, brief description of nature, size and location of project, objectives of the project,
estimated project cost, scope and organization of the study. The key environmental legislation
and the standards relevant to the project and the methodology adopted in preparation of this
report have also been described in this chapter.
Chapter 2. Project Description:
This chapter deals with the need of the project, location, environmental setting of the project,
details of project, other technical and design details and sources of pollution from the proposed
activity and measures proposed to control pollution.
Chapter 3. Description of the Environment:
The chapter presents the methodology and findings of field studies undertaken to establish the
environmental baseline conditions, which is also supplemented by secondary published data.
Chapter 4. Anticipated Environmental Impacts & Mitigation Measures:
This chapter details the inferences drawn from the environmental impact assessment of the
proposed project during various phases of project advancement, such as design, location of
project, construction and regular operations. It also describes the overall impacts of the
proposed project activities and underscores the areas of concern, which need mitigation
measures.
14
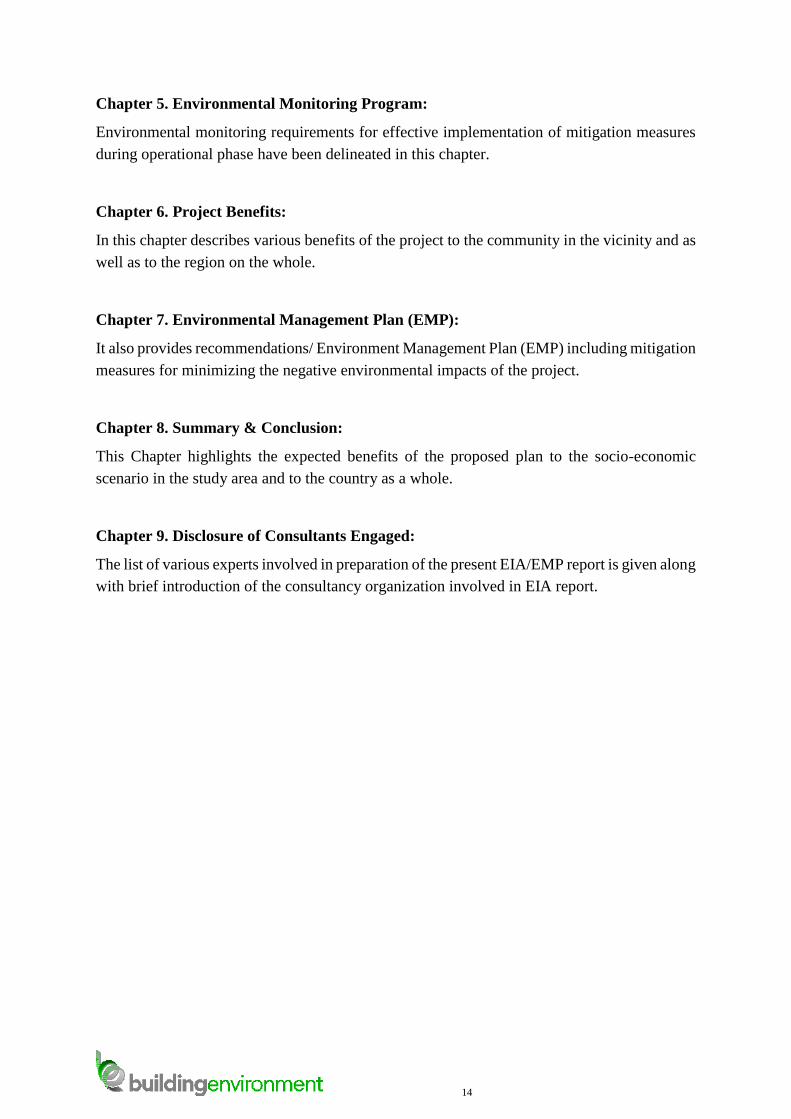
Chapter 5. Environmental Monitoring Program:
Environmental monitoring requirements for effective implementation of mitigation measures
during operational phase have been delineated in this chapter.
Chapter 6. Project Benefits:
In this chapter describes various benefits of the project to the community in the vicinity and as
well as to the region on the whole.
Chapter 7. Environmental Management Plan (EMP):
It also provides recommendations/ Environment Management Plan (EMP) including mitigation
measures for minimizing the negative environmental impacts of the project.
Chapter 8. Summary & Conclusion:
This Chapter highlights the expected benefits of the proposed plan to the socio-economic
scenario in the study area and to the country as a whole.
Chapter 9. Disclosure of Consultants Engaged:
The list of various experts involved in preparation of the present EIA/EMP report is given along
with brief introduction of the consultancy organization involved in EIA report.
15
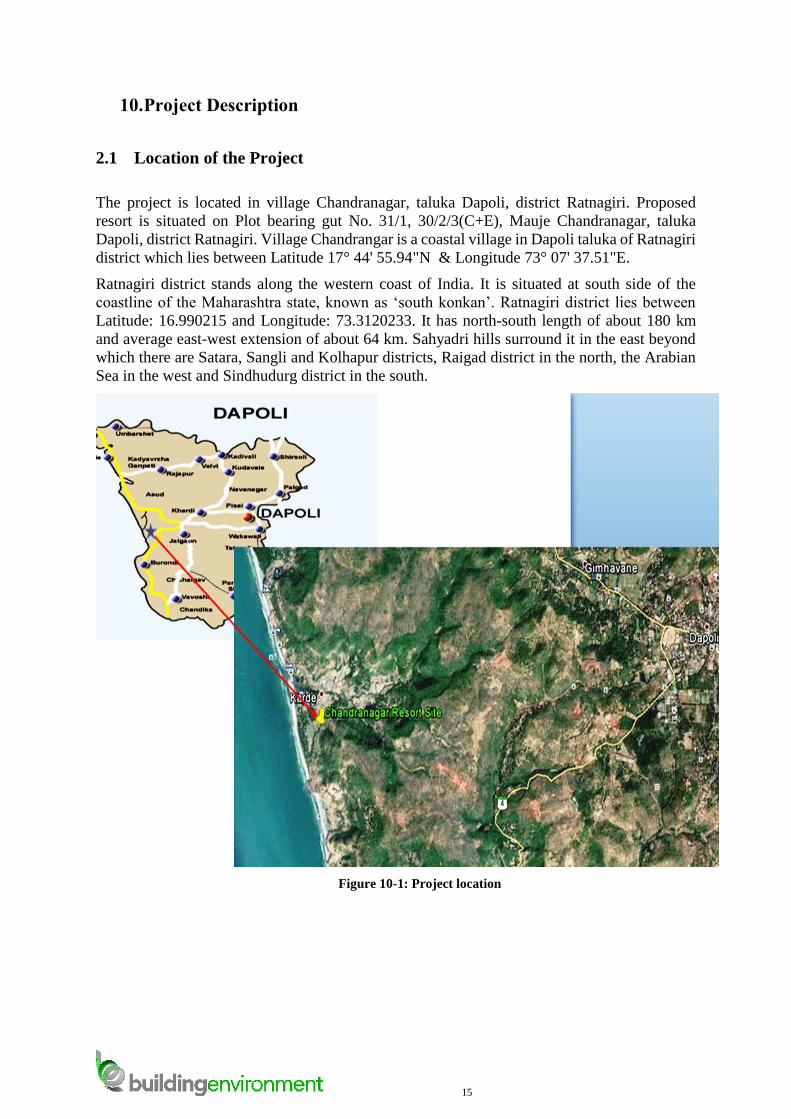
10. Project Description
2.1 Location of the Project
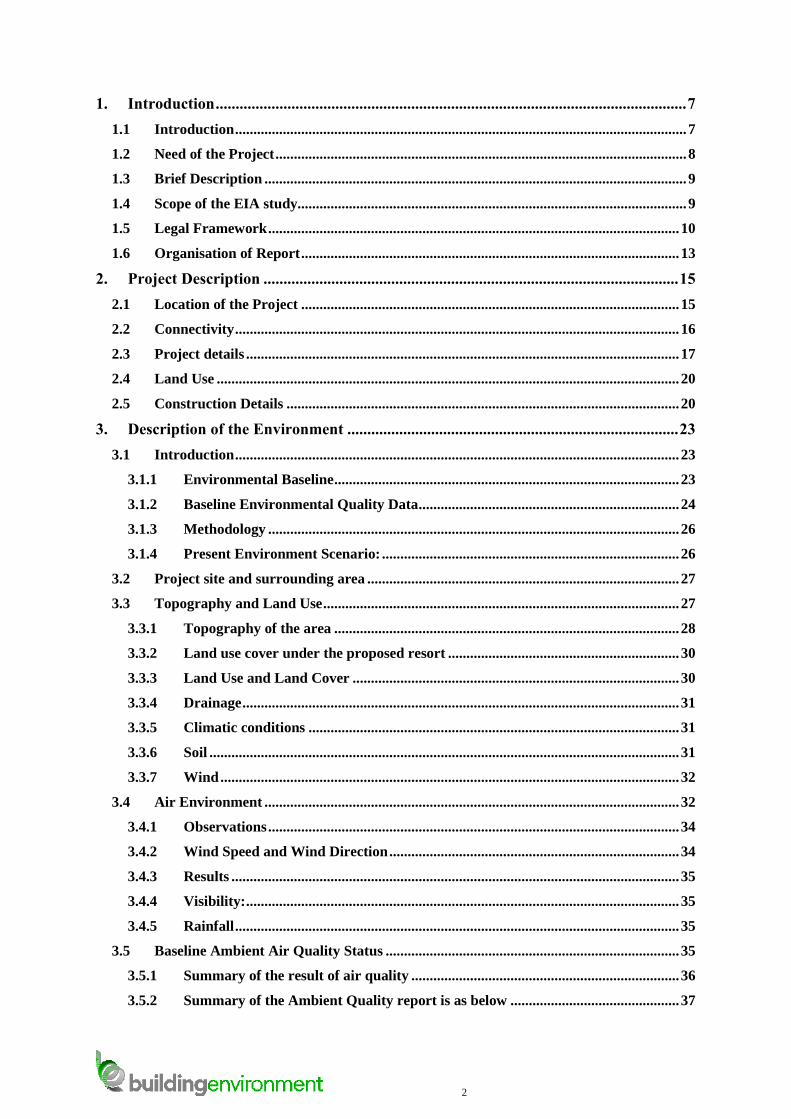
The project is located in village Chandranagar, taluka Dapoli, district Ratnagiri. Proposed
resort is situated on Plot bearing gut No. 31/1, 30/2/3(C+E), Mauje Chandranagar, taluka
Dapoli, district Ratnagiri. Village Chandrangar is a coastal village in Dapoli taluka of Ratnagiri
district which lies between Latitude 17° 44' 55.94"N & Longitude 73° 07' 37.51"E.
Ratnagiri district stands along the western coast of India. It is situated at south side of the
coastline of the Maharashtra state, known as ‘south konkan’. Ratnagiri district lies between
Latitude: 16.990215 and Longitude: 73.3120233. It has north-south length of about 180 km
and average east-west extension of about 64 km. Sahyadri hills surround it in the east beyond
which there are Satara, Sangli and Kolhapur districts, Raigad district in the north, the Arabian
Sea in the west and Sindhudurg district in the south.
Figure 10-1: Project location
16
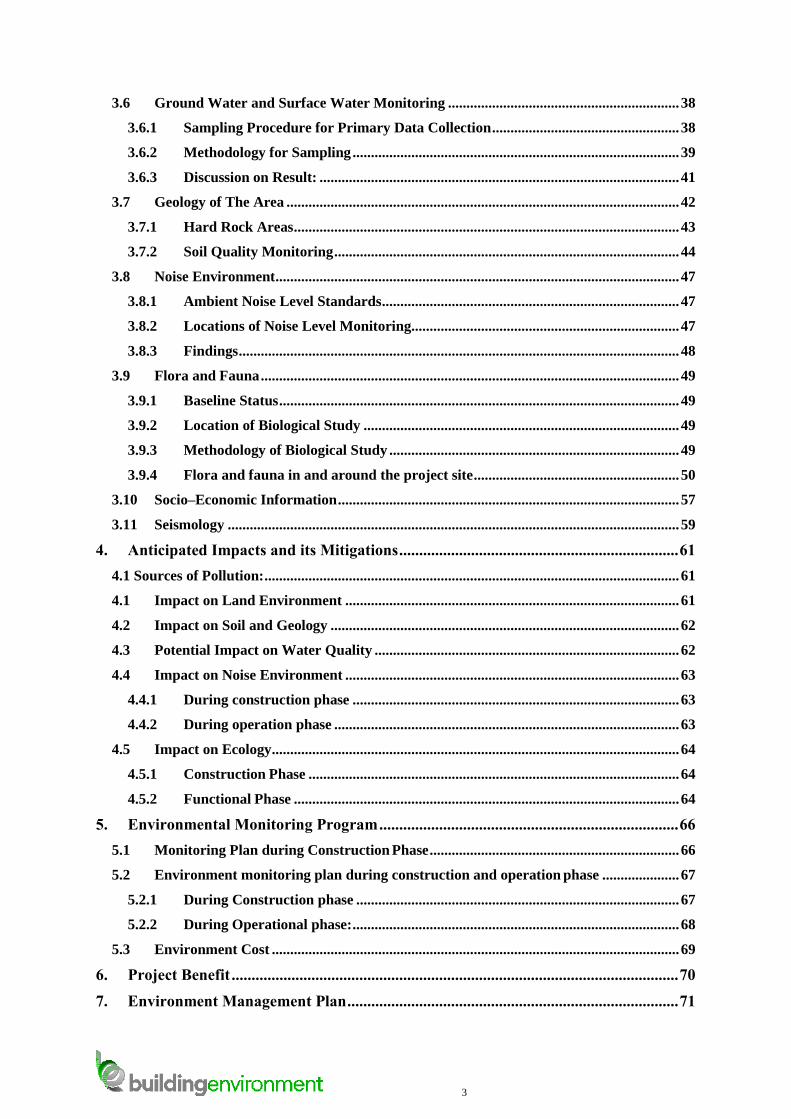
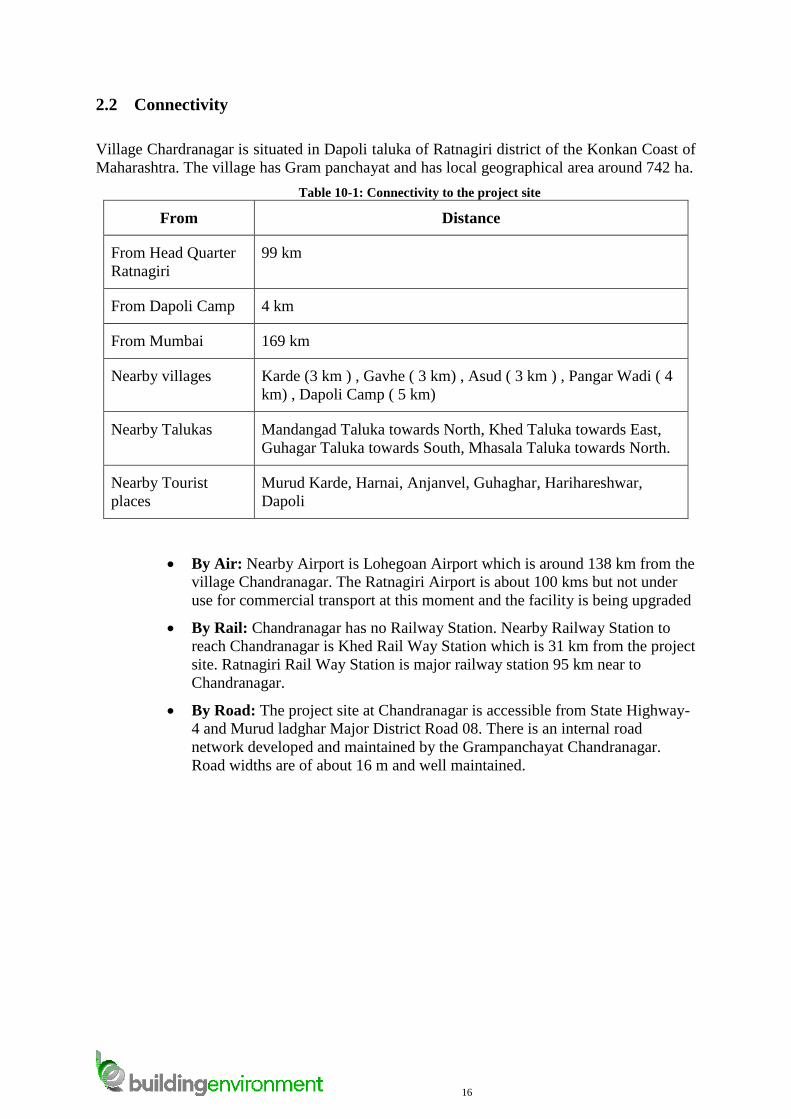
2.2 Connectivity
Village Chardranagar is situated in Dapoli taluka of Ratnagiri district of the Konkan Coast of
Maharashtra. The village has Gram panchayat and has local geographical area around 742 ha.
Table 10-1: Connectivity to the project site
From Distance
From Head Quarter
Ratnagiri
99 km
From Dapoli Camp 4 km
From Mumbai 169 km
Nearby villages Karde (3 km ) , Gavhe ( 3 km) , Asud ( 3 km ) , Pangar Wadi ( 4
km) , Dapoli Camp ( 5 km)
Nearby Talukas Mandangad Taluka towards North, Khed Taluka towards East,
Guhagar Taluka towards South, Mhasala Taluka towards North.
Nearby Tourist
places
Murud Karde, Harnai, Anjanvel, Guhaghar, Harihareshwar,
Dapoli
By Air: Nearby Airport is Lohegoan Airport which is around 138 km from the
village Chandranagar. The Ratnagiri Airport is about 100 kms but not under
use for commercial transport at this moment and the facility is being upgraded
By Rail: Chandranagar has no Railway Station. Nearby Railway Station to
reach Chandranagar is Khed Rail Way Station which is 31 km from the project
site. Ratnagiri Rail Way Station is major railway station 95 km near to
Chandranagar.
By Road: The project site at Chandranagar is accessible from State Highway-
4 and Murud ladghar Major District Road 08. There is an internal road
network developed and maintained by the Grampanchayat Chandranagar.
Road widths are of about 16 m and well maintained.
17
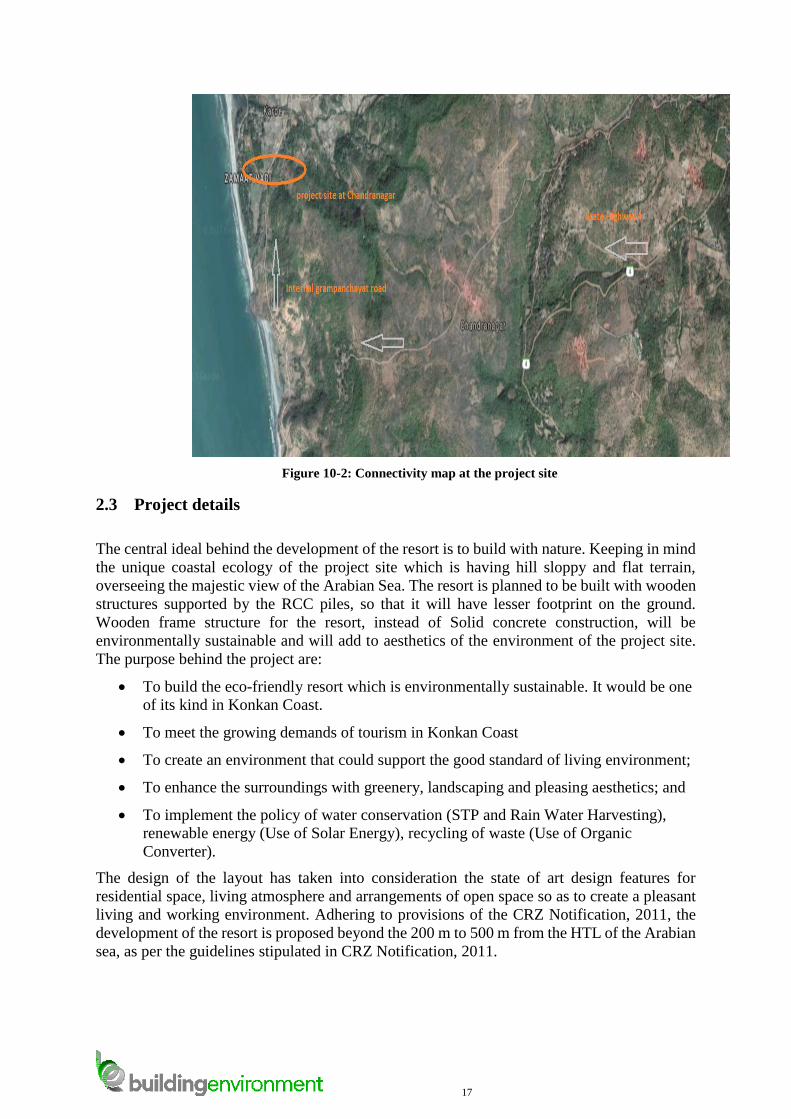
Figure 10-2: Connectivity map at the project site
2.3 Project details
The central ideal behind the development of the resort is to build with nature. Keeping in mind
the unique coastal ecology of the project site which is having hill sloppy and flat terrain,
overseeing the majestic view of the Arabian Sea. The resort is planned to be built with wooden
structures supported by the RCC piles, so that it will have lesser footprint on the ground.
Wooden frame structure for the resort, instead of Solid concrete construction, will be
environmentally sustainable and will add to aesthetics of the environment of the project site.
The purpose behind the project are:
To build the eco-friendly resort which is environmentally sustainable. It would be one
of its kind in Konkan Coast.
To meet the growing demands of tourism in Konkan Coast
To create an environment that could support the good standard of living environment;
To enhance the surroundings with greenery, landscaping and pleasing aesthetics; and
To implement the policy of water conservation (STP and Rain Water Harvesting),
renewable energy (Use of Solar Energy), recycling of waste (Use of Organic
Converter).
The design of the layout has taken into consideration the state of art design features for
residential space, living atmosphere and arrangements of open space so as to create a pleasant
living and working environment. Adhering to provisions of the CRZ Notification, 2011, the
development of the resort is proposed beyond the 200 m to 500 m from the HTL of the Arabian
sea, as per the guidelines stipulated in CRZ Notification, 2011.
18
The proposed development of resort will involve site formation works and construction of
wooden resort villas, access wooden roads, drains and sewer connections. The villas are
proposed to locate on a sloppy terrain.
Details of the proposed structure in Resort 1 are as follows:
Reception restaurant and kitchen
Cottages 10 Nos
The FSI and Height of the resort is well within the permissible limit i.e 0.33.and 9m
respectively, as stipulated in CR Notification, 2011.
Total Plot Area: 15950 m2
Deduction: 2640 m2
Plot area after deduction: 13310 m2
Net plot area (90) %: 11979 m2
Total built up area: 1315.68 m2
FSI consumed: 0.109
Road area: 881.81 m2
Paved area/ pathway: 881.81 m2
Green Area: 6289.75 m2
All the development is proposed between 200 m to 500 m from the HTL of the Arabian sea, as
per the guidelines stipulated in CRZ Notification, 2011.
The project site at Chandranagar village is fronting to Arabian Sea, hence, the CRZ setback
area is 500 m from the High Tide Line from the Arabian Sea, hence, attracts the provisions of
the CRZ Notification, 2011 and guidelines of Annexure III of the CRZ Notification, 2011
pertaining to development of beach resorts/ Hotels for tourists in CRZ areas.
The project site at Chandranagar was surveyed on by the Institute of Remote Sensing (IRS),
Chennai, which is one of the authorized agency of the Ministry of Environment and Forest,
New Delhi. As per the survey, the project site is situated is near to shore area and covered with
normal upland vegetation. There is no mangrove seen in the vicinity of the project site.
19
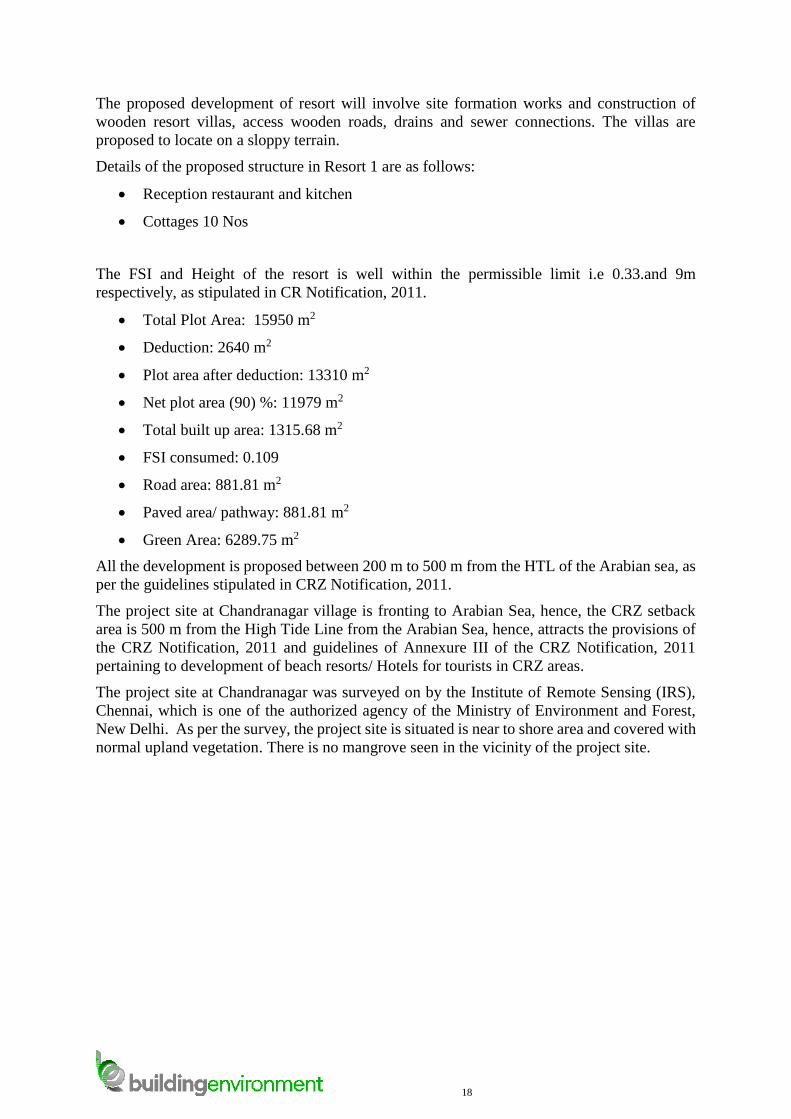
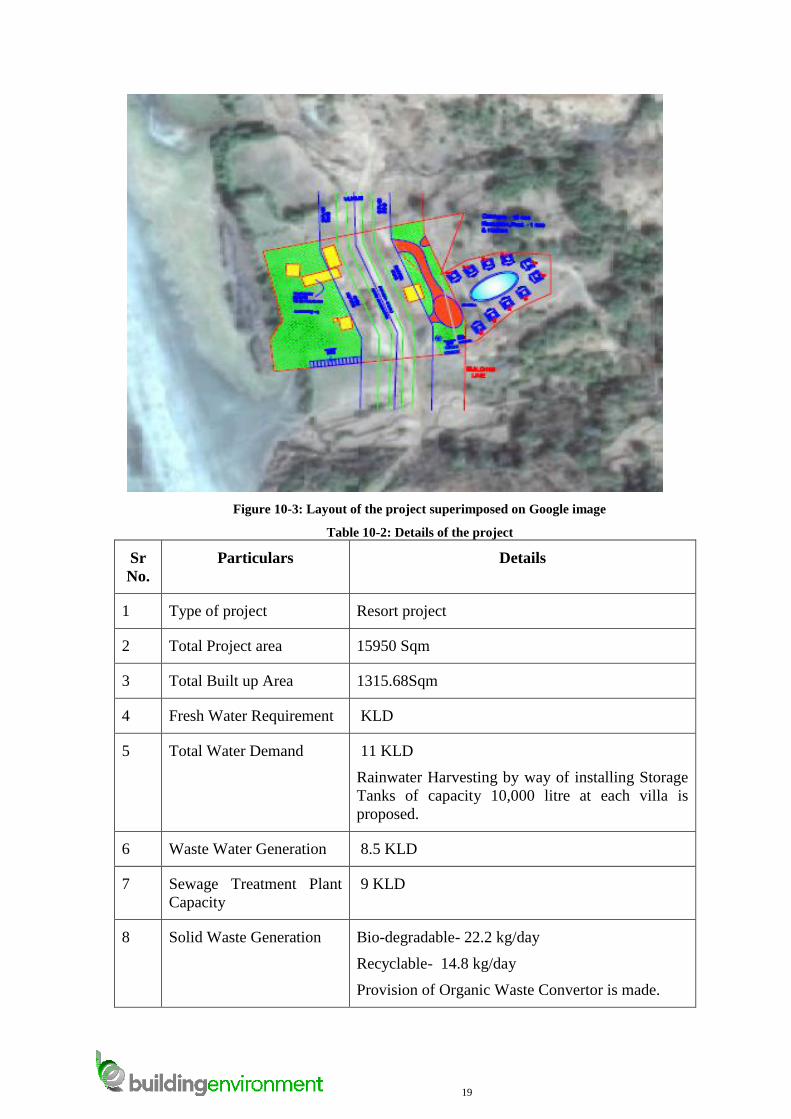
Figure 10-3: Layout of the project superimposed on Google image
Table 10-2: Details of the project
Sr
No.
Particulars Details
1 Type of project Resort project
2 Total Project area 15950 Sqm
3 Total Built up Area 1315.68Sqm
4 Fresh Water Requirement KLD
5 Total Water Demand 11 KLD
Rainwater Harvesting by way of installing Storage
Tanks of capacity 10,000 litre at each villa is
proposed.
6 Waste Water Generation 8.5 KLD
7 Sewage Treatment Plant
Capacity
9 KLD
8 Solid Waste Generation Bio-degradable- 22.2 kg/day
Recyclable- 14.8 kg/day
Provision of Organic Waste Convertor is made.
20
9 Power Requirement 225 KWH
10 Energy efficient system Energy Efficient Lighting using LEDs in Common
Areas of villas and toilet.
Solar Street Lights along pathways and open spaces
11 DG set Requirement 250 KVA – 1 set
12 Green Land Development 6289.75 Sqm
13 Paved area 881.81 Sqm
14 Parking As per requirement, parking provision is proposed:
Car- 47
Scooter-84
Cycle-84
2.4 Land Use
The proposed project site of irregular shape and the land is agricultural land, however, since
long time, the land is not under cultivation.
Attachment 1: The project layout with FSI details and parking plan is attached.
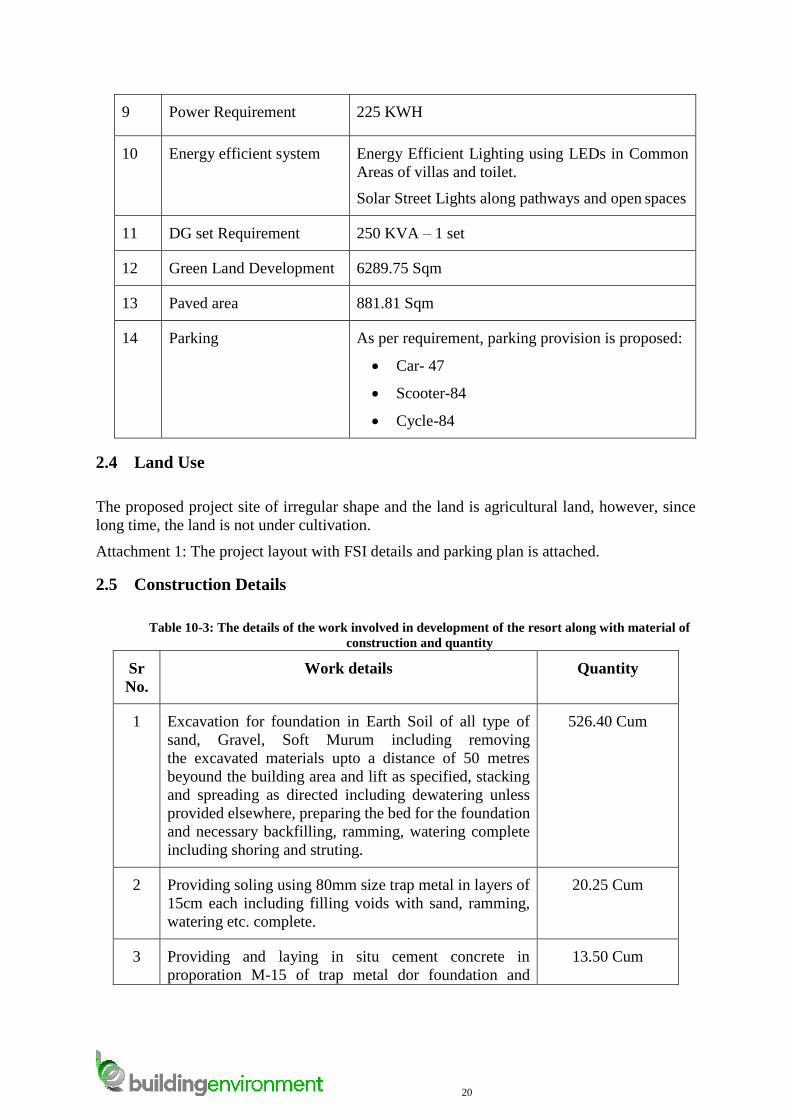
2.5 Construction Details
Table 10-3: The details of the work involved in development of the resort along with material of
construction and quantity
Sr
No.
Work details Quantity
1 Excavation for foundation in Earth Soil of all type of
sand, Gravel, Soft Murum including removing
the excavated materials upto a distance of 50 metres
beyound the building area and lift as specified, stacking
and spreading as directed including dewatering unless
provided elsewhere, preparing the bed for the foundation
and necessary backfilling, ramming, watering complete
including shoring and struting.
526.40 Cum
2 Providing soling using 80mm size trap metal in layers of
15cm each including filling voids with sand, ramming,
watering etc. complete.
20.25 Cum
3 Providing and laying in situ cement concrete in
proporation M-15 of trap metal dor foundation and
13.50 Cum
21
bedding, including bailing out water manually plywood/
steel formwork, compacting and curing complete
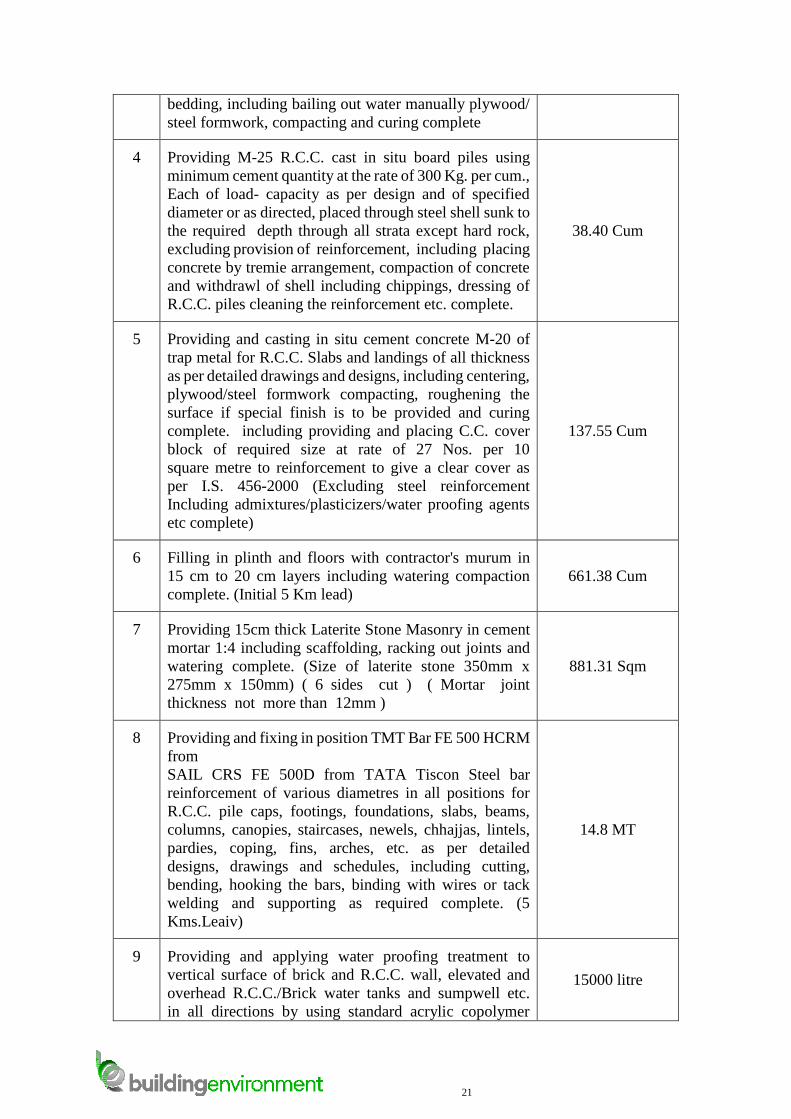
4 Providing M-25 R.C.C. cast in situ board piles using
minimum cement quantity at the rate of 300 Kg. per cum.,
Each of load- capacity as per design and of specified
diameter or as directed, placed through steel shell sunk to
the required depth through all strata except hard rock,
excluding provision of reinforcement, including placing
concrete by tremie arrangement, compaction of concrete
and withdrawl of shell including chippings, dressing of
R.C.C. piles cleaning the reinforcement etc. complete.
38.40 Cum
5 Providing and casting in situ cement concrete M-20 of
trap metal for R.C.C. Slabs and landings of all thickness
as per detailed drawings and designs, including centering,
plywood/steel formwork compacting, roughening the
surface if special finish is to be provided and curing
complete. including providing and placing C.C. cover
block of required size at rate of 27 Nos. per 10
square metre to reinforcement to give a clear cover as
per I.S. 456-2000 (Excluding steel reinforcement
Including admixtures/plasticizers/water proofing agents
etc complete)
137.55 Cum
6 Filling in plinth and floors with contractor's murum in
15 cm to 20 cm layers including watering compaction
complete. (Initial 5 Km lead)
661.38 Cum
7 Providing 15cm thick Laterite Stone Masonry in cement
mortar 1:4 including scaffolding, racking out joints and
watering complete. (Size of laterite stone 350mm x
275mm x 150mm) ( 6 sides cut ) ( Mortar joint
thickness not more than 12mm )
881.31 Sqm
8 Providing and fixing in position TMT Bar FE 500 HCRM
from
SAIL CRS FE 500D from TATA Tiscon Steel bar
reinforcement of various diametres in all positions for
R.C.C. pile caps, footings, foundations, slabs, beams,
columns, canopies, staircases, newels, chhajjas, lintels,
pardies, coping, fins, arches, etc. as per detailed
designs, drawings and schedules, including cutting,
bending, hooking the bars, binding with wires or tack
welding and supporting as required complete. (5
Kms.Leaiv)
14.8 MT
9 Providing and applying water proofing treatment to
vertical surface of brick and R.C.C. wall, elevated and
overhead R.C.C./Brick water tanks and sumpwell etc.
in all directions by using standard acrylic copolymer
15000 litre
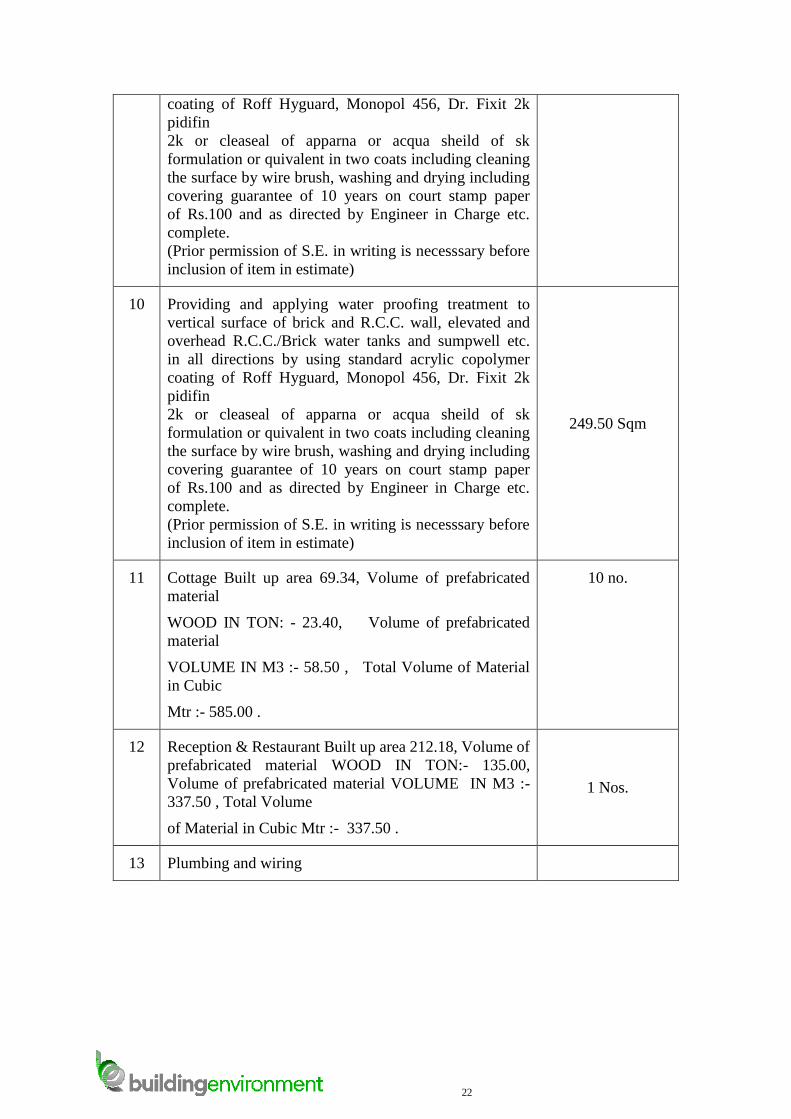
22
coating of Roff Hyguard, Monopol 456, Dr. Fixit 2k
pidifin
2k or cleaseal of apparna or acqua sheild of sk
formulation or quivalent in two coats including cleaning
the surface by wire brush, washing and drying including
covering guarantee of 10 years on court stamp paper
of Rs.100 and as directed by Engineer in Charge etc.
complete.
(Prior permission of S.E. in writing is necesssary before
inclusion of item in estimate)
10 Providing and applying water proofing treatment to
vertical surface of brick and R.C.C. wall, elevated and
overhead R.C.C./Brick water tanks and sumpwell etc.
in all directions by using standard acrylic copolymer
coating of Roff Hyguard, Monopol 456, Dr. Fixit 2k
pidifin
2k or cleaseal of apparna or acqua sheild of sk
formulation or quivalent in two coats including cleaning
the surface by wire brush, washing and drying including
covering guarantee of 10 years on court stamp paper
of Rs.100 and as directed by Engineer in Charge etc.
complete.
(Prior permission of S.E. in writing is necesssary before
inclusion of item in estimate)
249.50 Sqm
11 Cottage Built up area 69.34, Volume of prefabricated
material
WOOD IN TON: - 23.40, Volume of prefabricated
material
VOLUME IN M3 :- 58.50 , Total Volume of Material
in Cubic
Mtr :- 585.00 .
10 no.
12 Reception & Restaurant Built up area 212.18, Volume of
prefabricated material WOOD IN TON:- 135.00,
Volume of prefabricated material VOLUME IN M3 :-
337.50 , Total Volume
of Material in Cubic Mtr :- 337.50 .
1 Nos.
13 Plumbing and wiring
23
11. Description of the Environment
3.1 Introduction
As a first step in the Impact assessment, it is necessary to know the existing environmental
conditions to establish the baseline. These baseline conditions when compared with the
prevailing natural ambient environmental conditions, one can assess whether the area under
surveillance is polluted, degraded or not. It is also possible to quantify the degree of existing
pollution & degradation. This baseline data always serves as a point of reference to know the
impact of development. Depending on the nature & extent of effect of proposed activity,
corrective or mitigative measures are considered accordingly & formulated. The baseline
information is also useful to delineate the merits as well as pros & cons of the proposed
development. This is one of the quintessential aspects for the decision makers while
considering environmental clearance. This chapter presents the existing baseline environmental
status of the project influenced area (within 5km radius) of the project site.
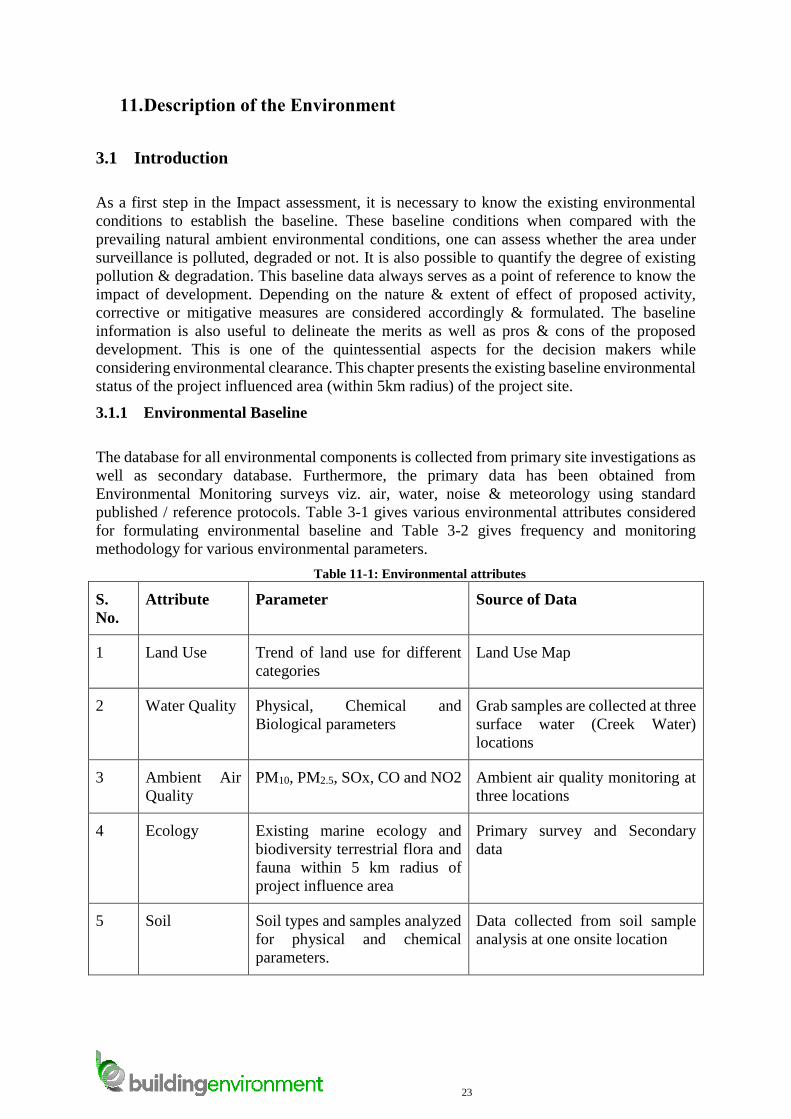
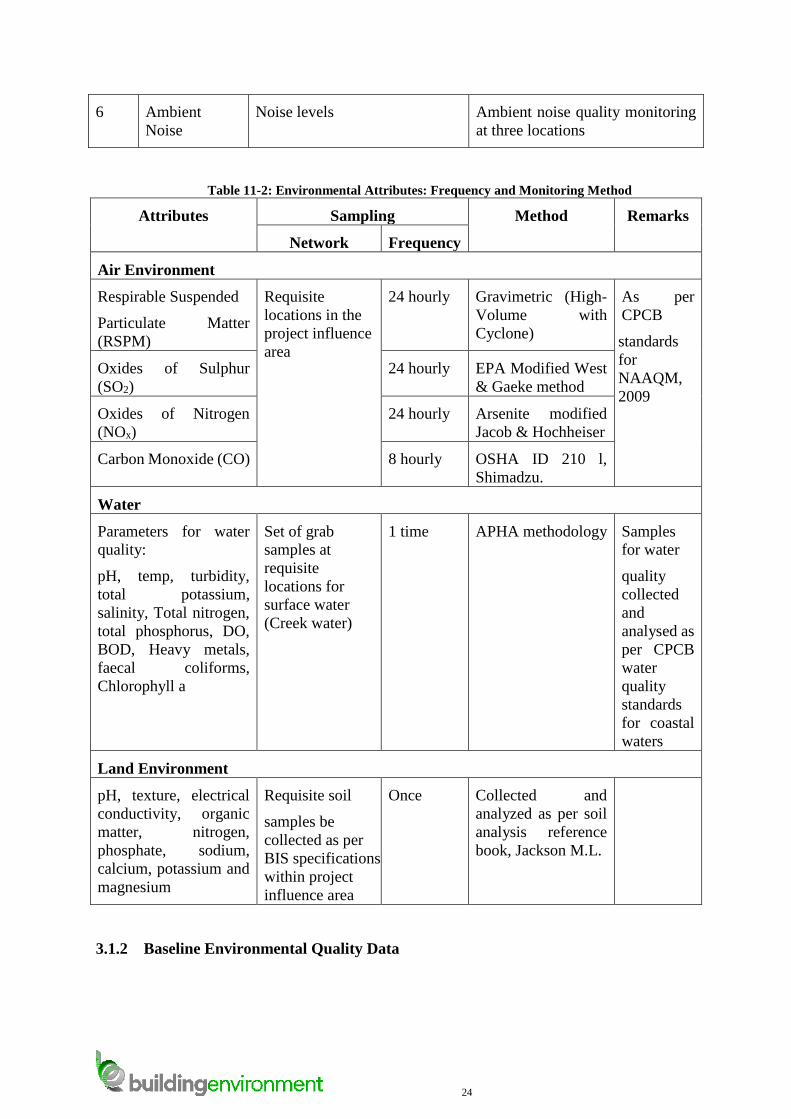
3.1.1 Environmental Baseline
The database for all environmental components is collected from primary site investigations as
well as secondary database. Furthermore, the primary data has been obtained from
Environmental Monitoring surveys viz. air, water, noise & meteorology using standard
published / reference protocols. Table 3-1 gives various environmental attributes considered
for formulating environmental baseline and Table 3-2 gives frequency and monitoring
methodology for various environmental parameters.
Table 11-1: Environmental attributes
S.
No.
Attribute Parameter Source of Data
1 Land Use Trend of land use for different
categories
Land Use Map
2 Water Quality Physical, Chemical and
Biological parameters
Grab samples are collected at three
surface water (Creek Water)
locations
3 Ambient Air
Quality
PM10, PM2.5, SOx, CO and NO2 Ambient air quality monitoring at
three locations
4 Ecology Existing marine ecology and
biodiversity terrestrial flora and
fauna within 5 km radius of
project influence area
Primary survey and Secondary
data
5 Soil Soil types and samples analyzed
for physical and chemical
parameters.
Data collected from soil sample
analysis at one onsite location
24
6 Ambient
Noise
Noise levels Ambient noise quality monitoring
at three locations
Table 11-2: Environmental Attributes: Frequency and Monitoring Method
Attributes Sampling Method Remarks
Network Frequency
Air Environment
Respirable Suspended
Particulate Matter
(RSPM)
Requisite
locations in the
project influence
area
24 hourly Gravimetric (High-
Volume with
Cyclone)
As per
CPCB
standards
for
NAAQM,
2009
Oxides of Sulphur
(SO2)
24 hourly EPA Modified West
& Gaeke method
Oxides of Nitrogen
(NOx)
24 hourly Arsenite modified
Jacob & Hochheiser
Carbon Monoxide (CO) 8 hourly OSHA ID 210 l,
Shimadzu.
Water
Parameters for water
quality:
pH, temp, turbidity,
total potassium,
salinity, Total nitrogen,
total phosphorus, DO,
BOD, Heavy metals,
faecal coliforms,
Chlorophyll a
Set of grab
samples at
requisite
locations for
surface water
(Creek water)
1 time APHA methodology Samples
for water
quality
collected
and
analysed as
per CPCB
water
quality
standards
for coastal
waters
Land Environment
pH, texture, electrical
conductivity, organic
matter, nitrogen,
phosphate, sodium,
calcium, potassium and
magnesium
Requisite soil
samples be
collected as per
BIS specifications
within project
influence area
Once Collected and
analyzed as per soil
analysis reference
book, Jackson M.L.
3.1.2 Baseline Environmental Quality Data
25
Baseline environmental condition constitute the basis for evaluation of impact of the proposed
development on the existing Environmental parameters. Baseline Environmental Conditions
can be broadly grouped into following categories:
Physical Environment which includes air, water, land, terrestrial flora & fauna, civic
infrastructure, public services, etc.
Social Environment includes demography, community facilities and services,
community characteristics, local economy, employment centre, commercial facilities
servicing the area, etc.,
Aesthetic Environment includes historical monuments, archaeological or architectural
sites at and in the vicinity of the proposed project activity. Economic environment
covers employment levels, sources and levels of income, economic base of the area,
land values, land ownership etc.
For the present EIA study, the following environmental attributes within 5 km and 10 Km
radius are considered for Baseline data:
Land environment (Topography, land use, solid waste disposal etc.);
Air environment (Meteorology, ambient air quality, noise levels)
Water environment (Ground, Surface and Drinking Water);
Biological environment (Flora, fauna, ecosystem); and
Socio-economic environment (Demography, occupational structure, educational,
medical facilities, literacy etc.)
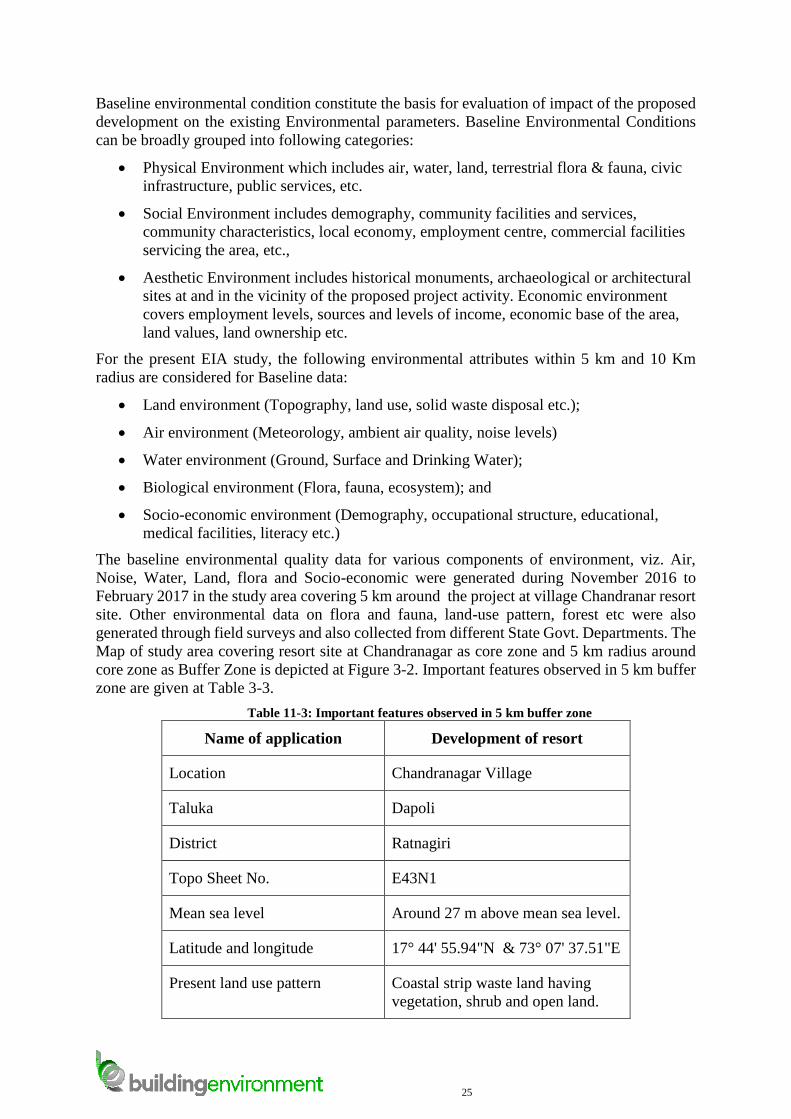
The baseline environmental quality data for various components of environment, viz. Air,
Noise, Water, Land, flora and Socio-economic were generated during November 2016 to
February 2017 in the study area covering 5 km around the project at village Chandranar resort
site. Other environmental data on flora and fauna, land-use pattern, forest etc were also
generated through field surveys and also collected from different State Govt. Departments. The
Map of study area covering resort site at Chandranagar as core zone and 5 km radius around
core zone as Buffer Zone is depicted at Figure 3-2. Important features observed in 5 km buffer
zone are given at Table 3-3.
Table 11-3: Important features observed in 5 km buffer zone
Name of application Development of resort
Location Chandranagar Village
Taluka Dapoli
District Ratnagiri
Topo Sheet No. E43N1
Mean sea level Around 27 m above mean sea level.
Latitude and longitude 17° 44' 55.94"N & 73° 07' 37.51"E
Present land use pattern Coastal strip waste land having
vegetation, shrub and open land.
26
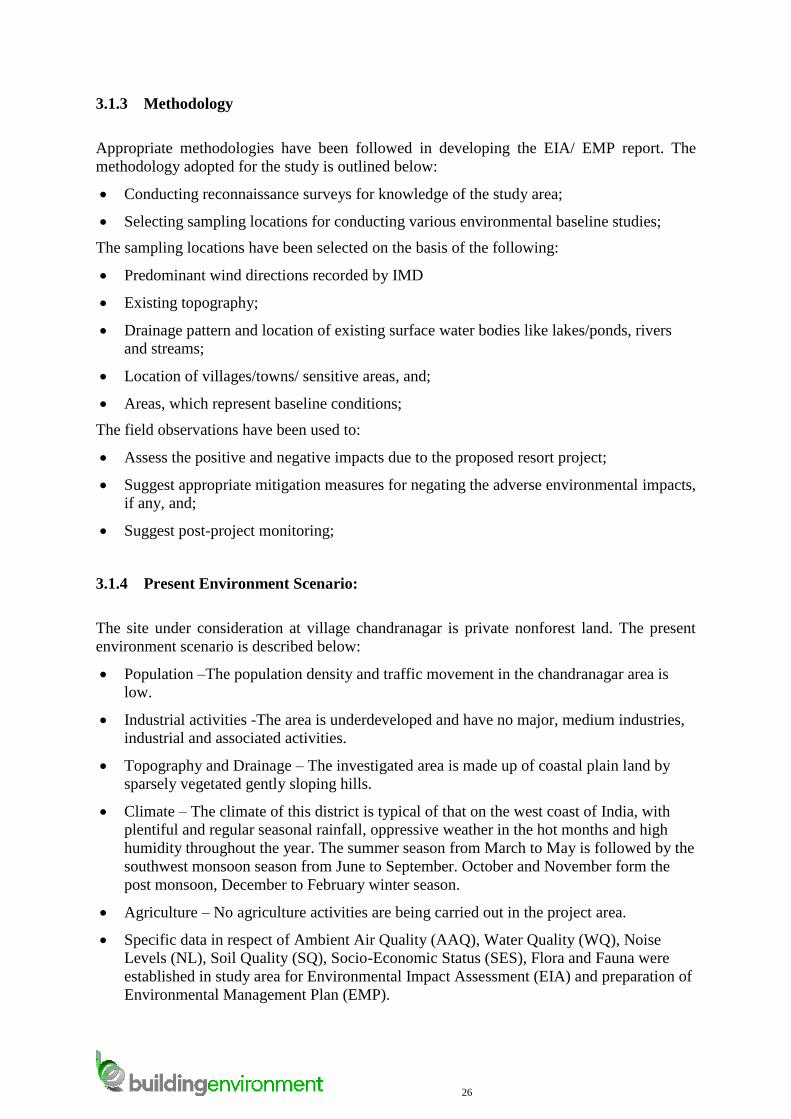
3.1.3 Methodology
Appropriate methodologies have been followed in developing the EIA/ EMP report. The
methodology adopted for the study is outlined below:
Conducting reconnaissance surveys for knowledge of the study area;
Selecting sampling locations for conducting various environmental baseline studies;
The sampling locations have been selected on the basis of the following:
Predominant wind directions recorded by IMD
Existing topography;
Drainage pattern and location of existing surface water bodies like lakes/ponds, rivers
and streams;
Location of villages/towns/ sensitive areas, and;
Areas, which represent baseline conditions;
The field observations have been used to:
Assess the positive and negative impacts due to the proposed resort project;
Suggest appropriate mitigation measures for negating the adverse environmental impacts,
if any, and;
Suggest post-project monitoring;
3.1.4 Present Environment Scenario:
The site under consideration at village chandranagar is private nonforest land. The present
environment scenario is described below:
Population –The population density and traffic movement in the chandranagar area is
low.
Industrial activities -The area is underdeveloped and have no major, medium industries,
industrial and associated activities.
Topography and Drainage – The investigated area is made up of coastal plain land by
sparsely vegetated gently sloping hills.
Climate – The climate of this district is typical of that on the west coast of India, with
plentiful and regular seasonal rainfall, oppressive weather in the hot months and high
humidity throughout the year. The summer season from March to May is followed by the
southwest monsoon season from June to September. October and November form the
post monsoon, December to February winter season.
Agriculture – No agriculture activities are being carried out in the project area.
Specific data in respect of Ambient Air Quality (AAQ), Water Quality (WQ), Noise
Levels (NL), Soil Quality (SQ), Socio-Economic Status (SES), Flora and Fauna were
established in study area for Environmental Impact Assessment (EIA) and preparation of
Environmental Management Plan (EMP).
27
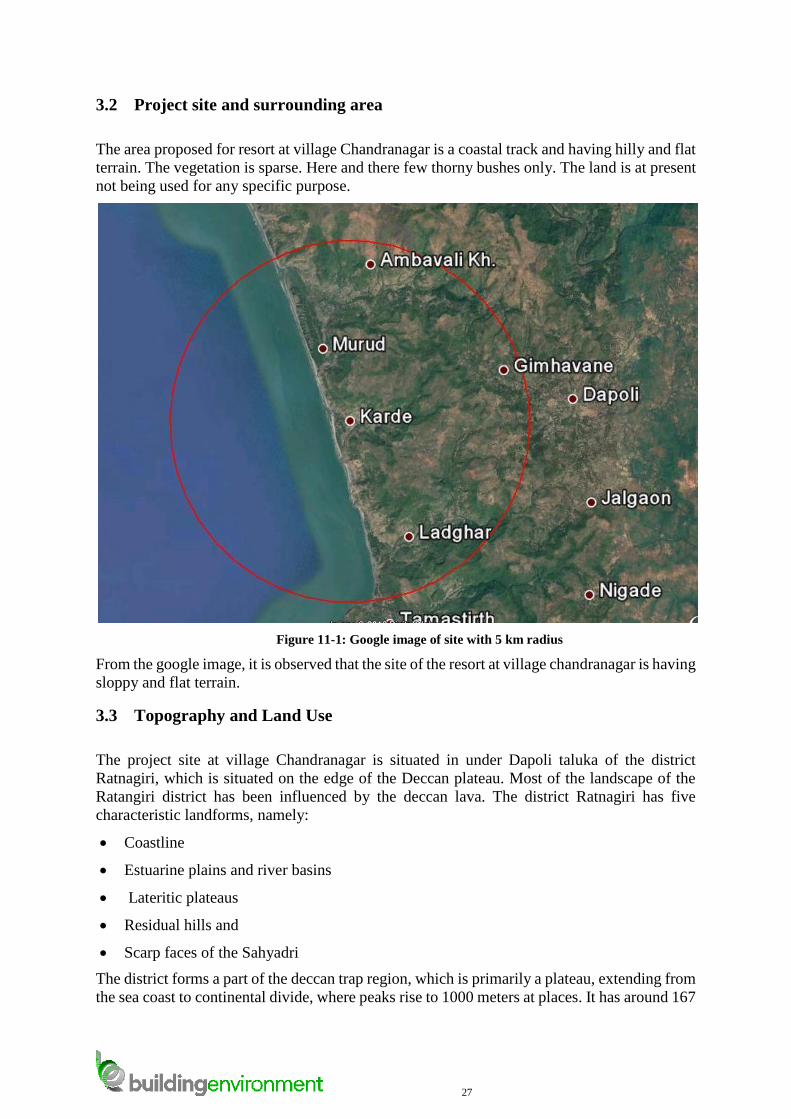
3.2 Project site and surrounding area
The area proposed for resort at village Chandranagar is a coastal track and having hilly and flat
terrain. The vegetation is sparse. Here and there few thorny bushes only. The land is at present
not being used for any specific purpose.
Figure 11-1: Google image of site with 5 km radius
From the google image, it is observed that the site of the resort at village chandranagar is having
sloppy and flat terrain.
3.3 Topography and Land Use
The project site at village Chandranagar is situated in under Dapoli taluka of the district
Ratnagiri, which is situated on the edge of the Deccan plateau. Most of the landscape of the
Ratangiri district has been influenced by the deccan lava. The district Ratnagiri has five
characteristic landforms, namely:
Coastline
Estuarine plains and river basins
Lateritic plateaus
Residual hills and
Scarp faces of the Sahyadri
The district forms a part of the deccan trap region, which is primarily a plateau, extending from
the sea coast to continental divide, where peaks rise to 1000 meters at places. It has around 167
28
km sea long sea coast and 180 km long Sahyadri hill range. Over 85% of the land surface in
Ratnagiri district is hilly. All rivers in the district originate in the Sahyadri ranges and flow
from east to west and merge in Arabian sea. The lateritic plateau that occupies most of the
district are either formed in-situ from the lateralisation of Deccan Trap Basalt or are of
secondary nature, formed due to the lateritic material brought down from the Sahyadri hill
ranges.
The region has a highly-dissected terrain with flat topped hills. The Western Ghats, running
parallel to and at a distance of 50-60 km from the coast rise to greater heights. The drainage
along the coast is almost westerly and considered as a submerged coast, characterized by the
presence of numerous creeks and estuaries, which severely restrict the continuity of coast and
consequently the extent of deposits. Closer to the coast, deep weathering of Deccan basalt gives
rise to thick pile of laterites.
The geomorphology of the study area is its highly uneven nature with very narrow reverie
plains that fringe the coastline. Small hills, which project from the main ranges, are separated
from each other by undulating plateaus having area gradually increasing westward towards the
coast.
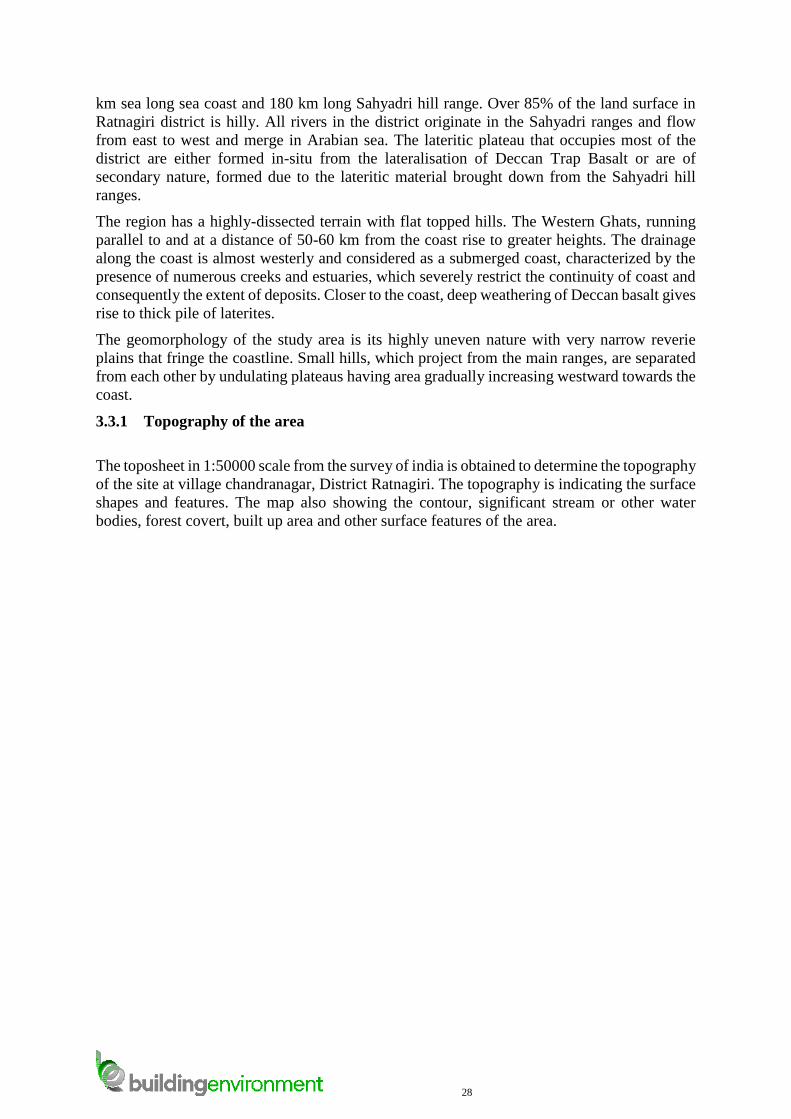
3.3.1 Topography of the area
The toposheet in 1:50000 scale from the survey of india is obtained to determine the topography
of the site at village chandranagar, District Ratnagiri. The topography is indicating the surface
shapes and features. The map also showing the contour, significant stream or other water
bodies, forest covert, built up area and other surface features of the area.
29
Figure 11-2: Topography 5 km around the project site
The topography of the site under reference at village Chandranagar shows hilly and flat terrain
and vegetation and shrubs. The land is sloppy in nature.
The 5 km and 10 km radius is drawn on the topography sheet, which is attached as Figure 3-3.
30
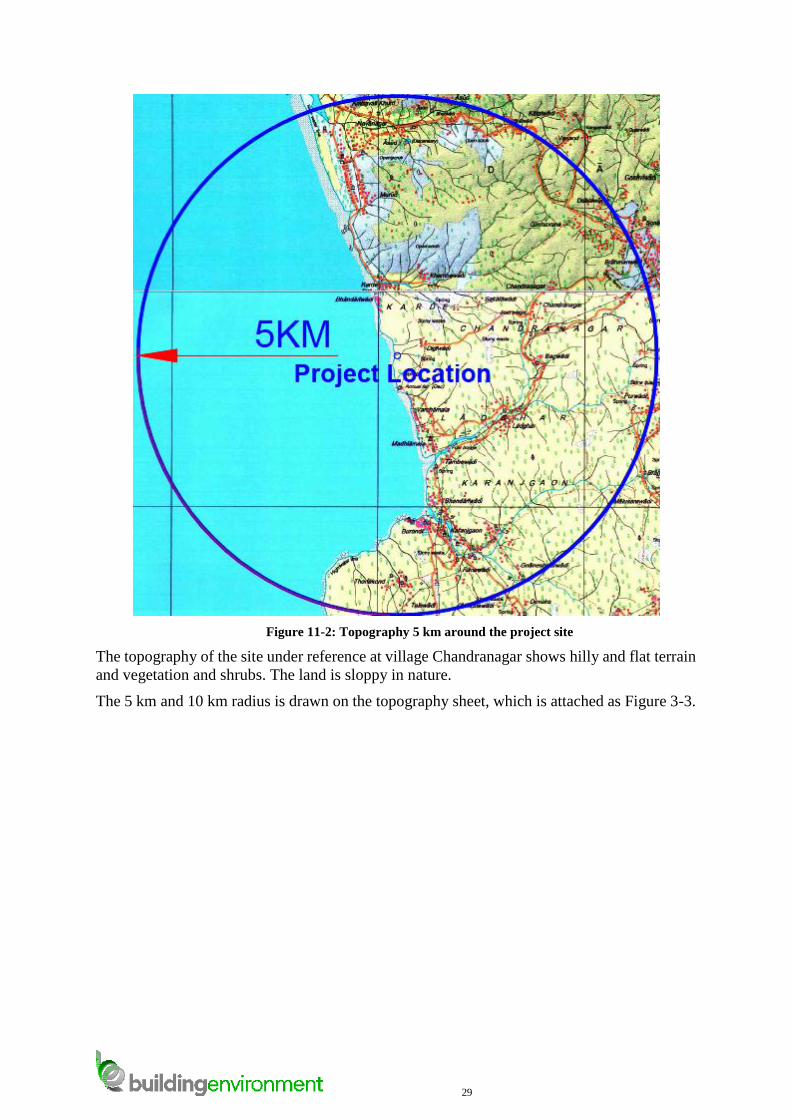
Figure 11-3: 5 km and 10 km radius drawn on topography sheet
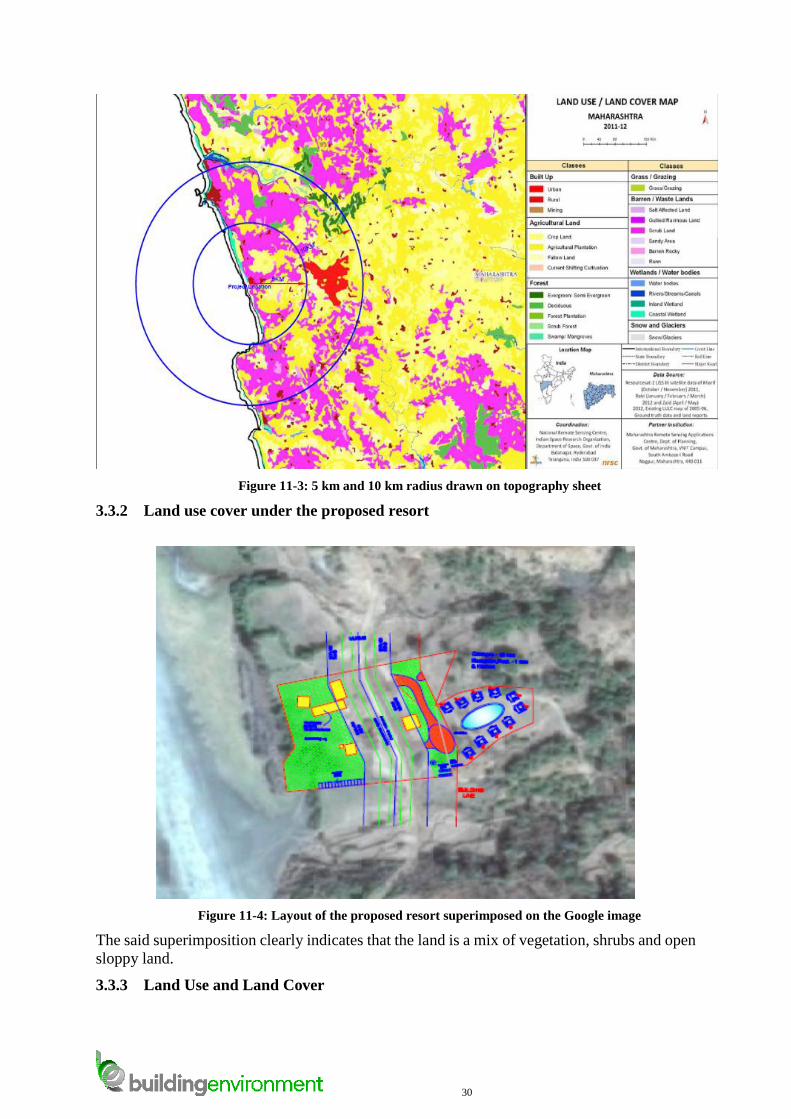
3.3.2 Land use cover under the proposed resort
Figure 11-4: Layout of the proposed resort superimposed on the Google image
The said superimposition clearly indicates that the land is a mix of vegetation, shrubs and open
sloppy land.
3.3.3 Land Use and Land Cover
31
The remote sensing studies in EIA are of great importance due to their capabilities in analyzing
the environmental problems which arise from number of developmental activities. This
technology has emerged as a powerful tool in providing reliable multispectral, multi-temporal
information on various natural resources in spatial format. It has an important role in effective
mapping and periodic monitoring of natural resources and environmental processes.
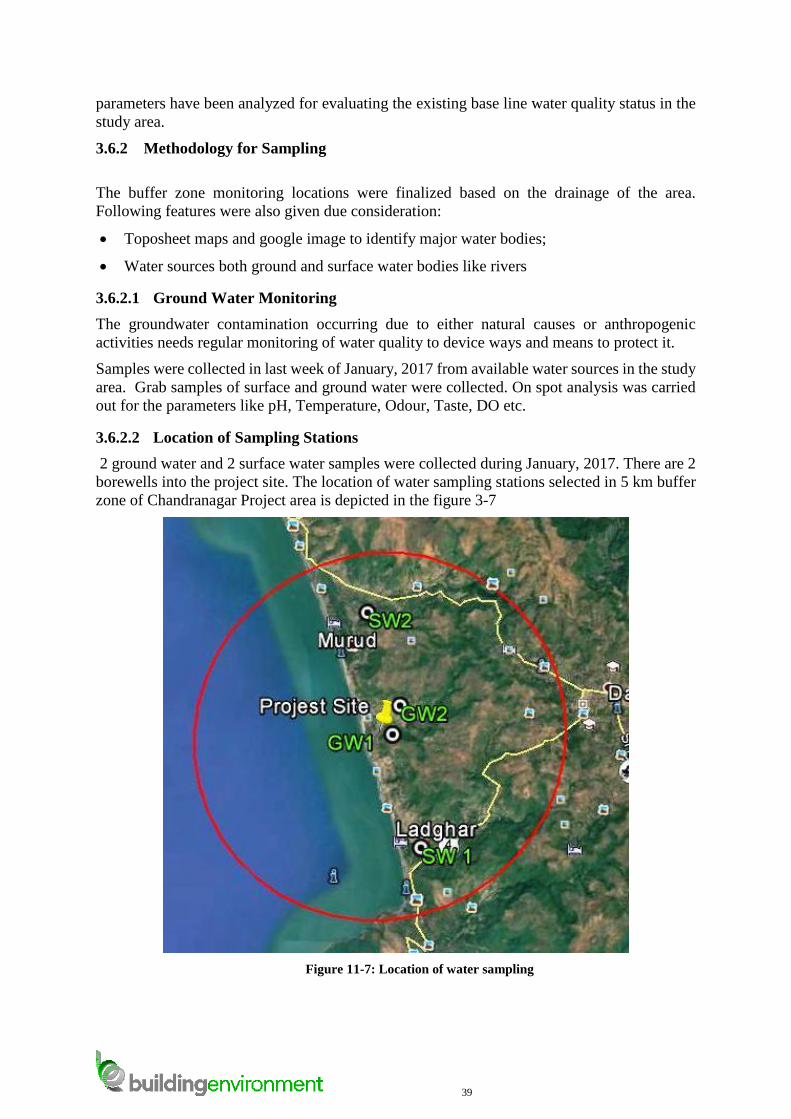
With the rapid improvement in spatial and spectral resolution of data obtained in visible and
near infrared regions the need for assessment of land environment in different perspective is
addressed effectively. Modifications of the land surface during urbanization can produce
tremendous changes in the pattern of vegetative cover, agriculture and water course. Changes
in land cover and vegetation can be indication of environmental degradations/ alterations. Land
use pattern from the satellite image surrounding the project area is given below.
Land use and land cover of the Ratnagiri district of the year 2011-2012 obtained from the
National Remote Sensing Centre, Hyderabad is given in Figure 3-3.
3.3.4 Drainage
The project area is sloppy terrain and has natural gradient towards Western side i.e. towards
Arabian side.
3.3.5 Climatic conditions
Konkan belt experiences tropical warm, humid or maritime climate throughout the year with
regular rainfall of an average 2286-2540 mm during monsoon and the temperature difference
(between minimum and maximum) hardly exceed 10°C. Atmospheric temperature varies from
25-35°C with the average humidity ranging between 60-90%.
Table 11-4: Climatic condition details
The region can broadly be classified in two types - Very High Rainfall Non-lateritic (VRN)
soil zone of north Konkan and Very high Rainfall Lateritic (VRL) soil zone in the southern
coastal parts. The soils from the VRN zone shows varying content and pattern of distribution
of organic carbon throughout the soil depth while in the VRL zone it is in the range of low to
very low in the profile. The available phosphorus is more in the soils from VRN zone than
VRL zone, while the soils from both the zones are well supplied with available K. Both VRN
and VRL soils contain adequate available Mn and Cu but are deficient in the micronutrients
like B, Fe and Zn, which is a major problem in rice cultivation in these soils. The variation in
the soil salinity according to the season is a common feature of coastal saline soils.
3.3.6 Soil
The soils of Konkan are mainly of alluvial and residual types. The residual soil occurs on the
hilltops or slopes while alluvial is seen along the river valleys. Lateritic soil is formed in the
hilly upland where the rainfall is more than 200 cm, which is rich in Fe, Al, Ti. Nevertheless,
it is devoid of lime and poor in organic matter. Soil is lateritic in the south (Sindhudurg and
Ratnagiri districts) while it is read and loamy and alluvial towards the north Thane district).
Temperature Rainfall (mm) Humidity Wind speed km/h
15.9-35.4 937.6 58-90 9.8
32
There is wide variation in the physico-chemical properties of coastal salt affected soils in the
Konkan. The region can broadly be classified in two types - Very High Rainfall Non-lateritic
(VRN) soil zone of north Konkan and Very high Rainfall Lateritic (VRL) soil zone in the
southern coastal parts. The soils from the VRN zone shows varying content and pattern of
distribution of organic carbon throughout the soil depth while in the VRL zone it is in the range
of low to very low in the profile. The available phosphorus is more in the soils from VRN zone
than VRL zone, while the soils from both the zones are well supplied with available K. Both
VRN and VRL soils contain adequate available Mn and Cu but are deficient in the
micronutrients like B, Fe and Zn, which is a major problem in rice cultivation in these soils.
The variation in the soil salinity according to the season is a common feature of coastal saline
soils. In addition, anthropogenic interruptions like construction of embankment,
3.3.7 Wind
Winds are very strong and are mainly westerly or south westerly during the monsoon. In the
rest of the year winds blow from directions between north and east in the mornings and between
west and north-west in the afternoons.
Table 11-5: Mean Wind speed in Ratnagiri district
Jan. Feb. Mar. Apr. May. Jun. Jul. Aug. Sept. Oct. Nov. Dec. Annual.
9.3 10.5 10.8 11.1 11.9 12.2 14.5 12.2 8.5 8.2 8.9 8.7 10.7
3.4 Air Environment
Ambient air is basically natural state of the air in the outdoor environment. Composition of the
air depend upon may factors, such as climatic parameters, land elevation, pollutants etc.
Ambient air quality monitoring is required to determine the existing quality of the air.
Background information of the village Chandranagar such as topography, land use, wind speed/
directions, rainfall, source of pollution etc. has been considered, in order to understand air
quality around the project area.
Since, development of the resort is mainly with wooden structure and minimum solid concrete
construction is involved for the RCC, Rainwater Harvesting and Bio-digester, the project is not
a major contributor to the air pollution except for particulate matter emission during
construction phase due to excavation and machinery and vehicular pollution during use phase.
Ministry of Environment and Forest have defined the National Ambient Air Quality standards.
Accordingly, air quality parameters such as PM10, PM2.5, Oxides of Nitrogen (NOx), Sulphur
dioxide (SO2) and Carbon monoxide (CO) were monitored. This assessment was done by
examining sources of air emissions within a 10 Km radius of the proposed project site and
through site specific background sampling program. In this manner, background data collected
was expected to be representative of all meteorological condition.
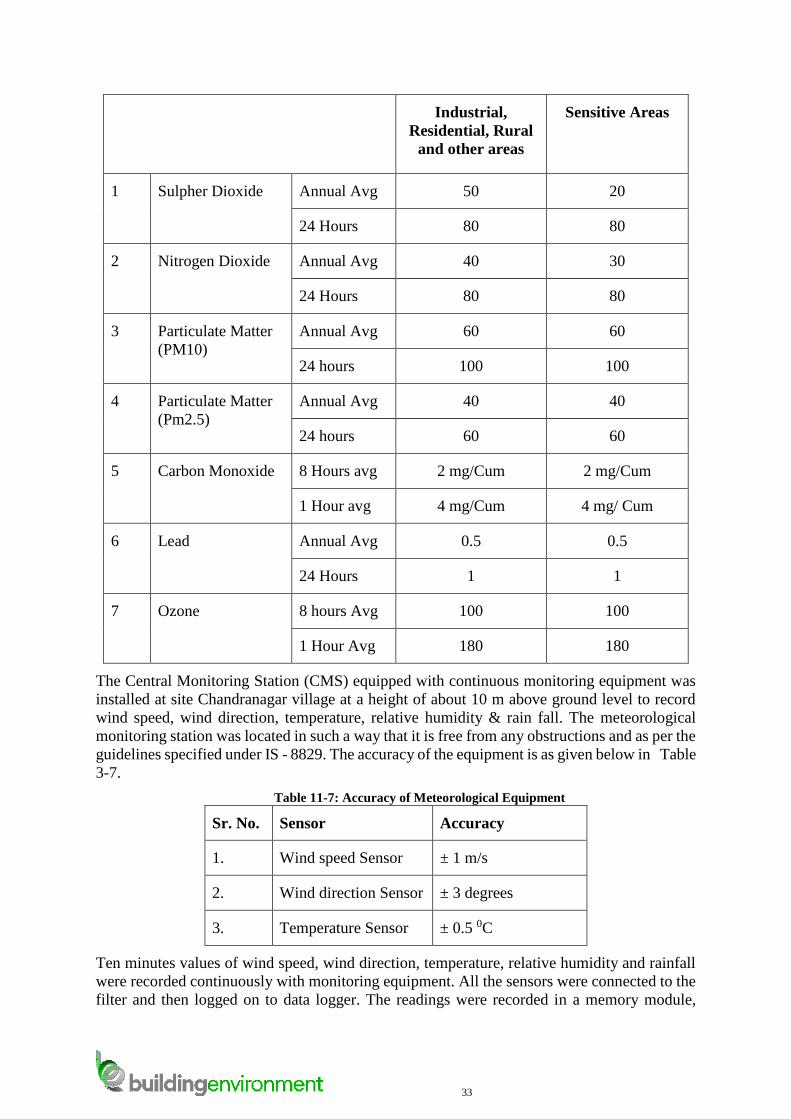
Table 11-6: National Ambient Air Quality Standards
Sr
No.
Pollutant Time
Weighted
Avg
Concentration in Ambient Air in
ug/Cum
33
Industrial,
Residential, Rural
and other areas
Sensitive Areas
1 Sulpher Dioxide Annual Avg 50 20
24 Hours 80 80
2 Nitrogen Dioxide Annual Avg 40 30
24 Hours 80 80
3 Particulate Matter
(PM10)
Annual Avg 60 60
24 hours 100 100
4 Particulate Matter
(Pm2.5)
Annual Avg 40 40
24 hours 60 60
5 Carbon Monoxide 8 Hours avg 2 mg/Cum 2 mg/Cum
1 Hour avg 4 mg/Cum 4 mg/ Cum
6 Lead Annual Avg 0.5 0.5
24 Hours 1 1
7 Ozone 8 hours Avg 100 100
1 Hour Avg 180 180
The Central Monitoring Station (CMS) equipped with continuous monitoring equipment was
installed at site Chandranagar village at a height of about 10 m above ground level to record
wind speed, wind direction, temperature, relative humidity & rain fall. The meteorological
monitoring station was located in such a way that it is free from any obstructions and as per the
guidelines specified under IS - 8829. The accuracy of the equipment is as given below in Table
3-7.
Table 11-7: Accuracy of Meteorological Equipment
Sr. No. Sensor Accuracy
1. Wind speed Sensor ± 1 m/s
2. Wind direction Sensor ± 3 degrees
3. Temperature Sensor ± 0.5 0C
Ten minutes values of wind speed, wind direction, temperature, relative humidity and rainfall
were recorded continuously with monitoring equipment. All the sensors were connected to the
filter and then logged on to data logger. The readings were recorded in a memory module,
34
which was attached to data logger. The memory module was down loaded in computer through
Weather Link software.
3.4.1 Observations
The observations for Wind speed, Wind direction, Temperature, Relative Humidity and Rain
fall were collected during period i.e. November 2016 to February 2017. The observations are
elaborated under following four headings i.e. wind speed & wind direction, temperature &
relative humidity and cloud cover-rain fall.
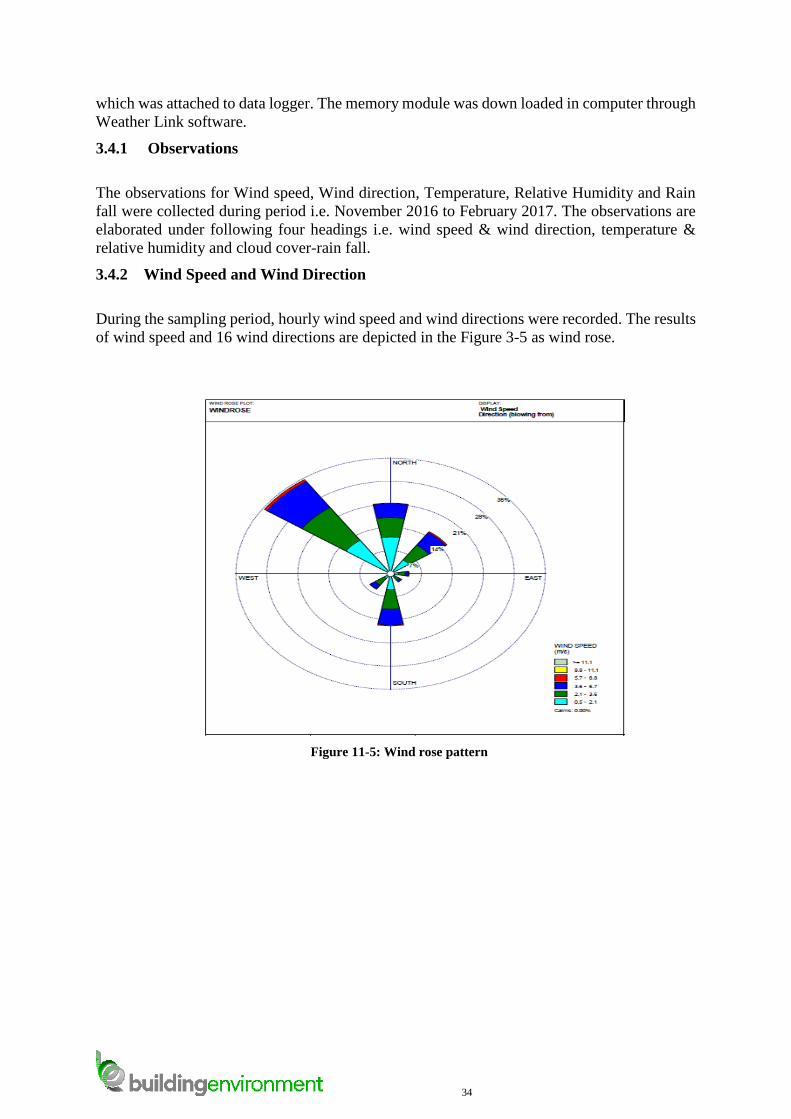
3.4.2 Wind Speed and Wind Direction
During the sampling period, hourly wind speed and wind directions were recorded. The results
of wind speed and 16 wind directions are depicted in the Figure 3-5 as wind rose.
Figure 11-5: Wind rose pattern
35
3.4.3 Results
The predominant wind direction was from NW (27%), N (15.5%).Wind blows from directions
between north and north east in the morning, which changes to west and northwest in the
afternoon. During monsoon, wind flows from west and south west direction. Avg wind speed
is 8 km/h.
3.4.4 Visibility:
Visibility is generally good for most part of the year. There is possibility of lesser visibility
during monsoon. On an average the visibility is expected to be over 4.0 Km for about 300 days
in a year.
3.4.5 Rainfall
The average annual rainfall for the district as a whole is 3461.3 mm. The rainfall increases
rapidly from the coast towards the Western Ghats on the eastern border of the district. In and
near the Ghats, rainfall is very heavy. Practically the entire annual rainfall occurs during the
months June to October. The rainiest month is July when one third of the annual rainfall is
received. The normal monthly rainfall for Dapoli station is 3741.9 mm which is given in the
Table---
Table 11-8: Monthly Normal Rainfall
Month Rainfall mm Month Rainfall mm
Jan 0.5 : Jul 1301.6
Feb 0.0 : Aug 950.2
Mar 0.0 : Sep 409.6
Apr 5.0 : Oct 101.8
May 38.4 : Nov 27.5
Jun 904.4 : Dec 2.9
: Total 3741.9
Heaviest Rainfall In 24 Hrs 535.4 mm, 03rd Jun 1982
Source: Climate of Maharashtra
3.5 Baseline Ambient Air Quality Status
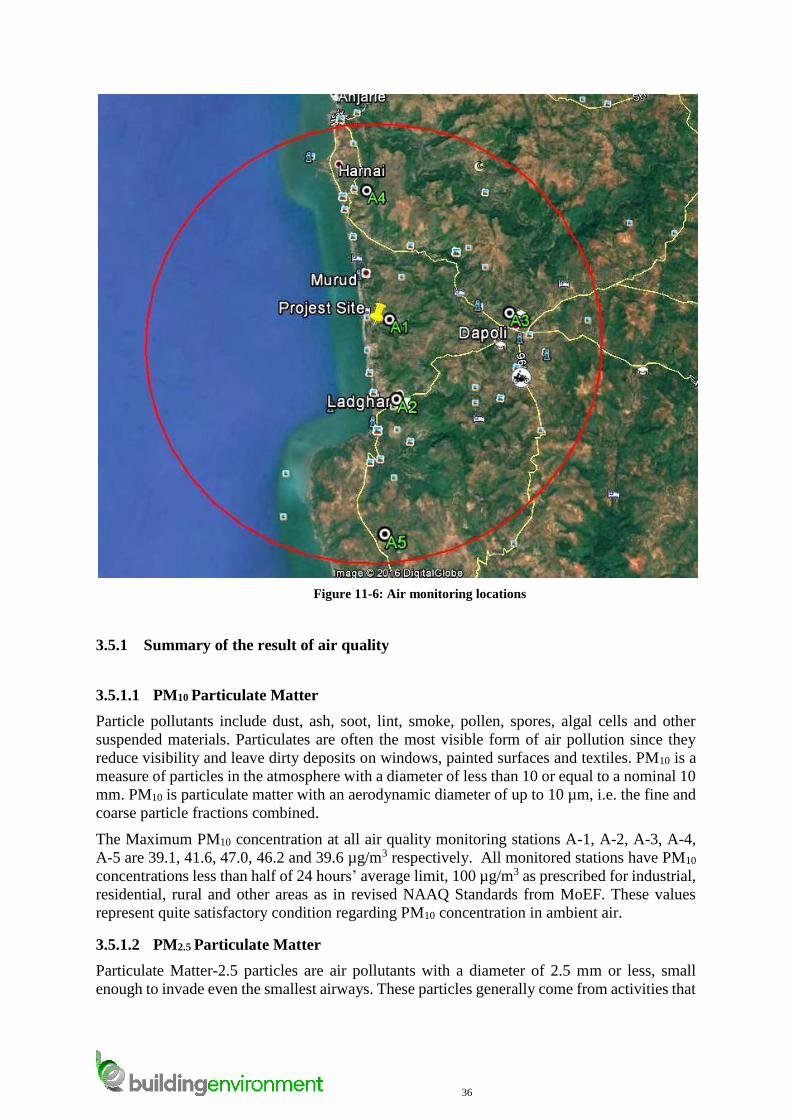
Sampling locations are selected considering predominant prevailing wind direction and on the
basis of sensitive receptors within 10 km of radius. Five of the sampling points were considered
within the project site itself and rest of the two locations were decided considering the
sensitivity of receptors.
36
Figure 11-6: Air monitoring locations
3.5.1 Summary of the result of air quality
3.5.1.1 PM10 Particulate Matter
Particle pollutants include dust, ash, soot, lint, smoke, pollen, spores, algal cells and other
suspended materials. Particulates are often the most visible form of air pollution since they
reduce visibility and leave dirty deposits on windows, painted surfaces and textiles. PM10 is a
measure of particles in the atmosphere with a diameter of less than 10 or equal to a nominal 10
mm. PM10 is particulate matter with an aerodynamic diameter of up to 10 µm, i.e. the fine and
coarse particle fractions combined.
The Maximum PM10 concentration at all air quality monitoring stations A-1, A-2, A-3, A-4,
A-5 are 39.1, 41.6, 47.0, 46.2 and 39.6 µg/m3 respectively. All monitored stations have PM10
concentrations less than half of 24 hours’ average limit, 100 µg/m3 as prescribed for industrial,
residential, rural and other areas as in revised NAAQ Standards from MoEF. These values
represent quite satisfactory condition regarding PM10 concentration in ambient air.
3.5.1.2 PM2.5 Particulate Matter
Particulate Matter-2.5 particles are air pollutants with a diameter of 2.5 mm or less, small
enough to invade even the smallest airways. These particles generally come from activities that
37
burn fossil fuels, such as traffic, smelting, and metal processing. PM2.5 particles are known to
produce respiratory and cardiovascular illness.
The Maximum PM2.5 concentration at all air quality monitoring stations A-1, A-2, A-3, A-4
and A-5 are 19.9, 20.4, 22.8, 26.1, and 25.3 µg/m3 respectively. All monitored stations have
PM2.5 concentrations less than half of annual 24 hours’ limit, 60 µg/m3 as prescribed for
industrial, residential, rural and other areas as in revised NAAQ Standards from MoEF. These
values represent quite satisfactory condition regarding PM2.5 concentration in ambient air.
3.5.1.3 Sulphur Dioxide (SO2):
Sulphur dioxide produces drying of the mouth, scratchy throat and smarting eyes. It also causes
chest constriction, headache, vomiting and death from respiratory diseases. This gas originates
from combustion of fossil fuels. SO2, SO3, H2SO4vapour and sulphur contribute to SO2 values
and can cause health problems, corrosion and injury to vegetation.
The Maximum SO2 concentrations at all sampling stations A-1, A-2, A-3, A-4, and A-5 are
9.3, 10.6, 17.3, 10.5 and 8.7 µg/m3 respectively. All monitored stations have SO2
concentrations well within stipulated annual 24 hours’ limit, 80 µg/m3 as prescribed for
industrial, residential, rural and other areas as in revised NAAQ Standards from MoEF.
3.5.1.4 Oxides of Nitrogen (NOX)
High temperature combustion as well as use of explosives produces oxides of nitrogen which
in turn result in photo-chemicals smog and can contribute to vegetation damage and acid rain.
Diesel also produces NOx that is easily absorbed in the blood and then reduces the oxygen-
carrying capacity of the blood. It makes the lung tissues brittle and leathery and can cause lung
cancer and emphysema (severe breathing problems).
The Maximum NOx concentrations at all sampling stations A-1, A-2, A-3, A-4, A-5, andA-6
are 10.5, 13.5, 19.4, 13.1 and 10.4 µg/m3 respectively. All monitored stations have NOX
concentrations well within stipulated annual 24 hours’ limit, 80 µg/m3 as prescribed for
industrial, residential, rural and other areas as in revised NAAQ Standards from MoEF.
3.5.1.5 Carbon Monoxide (CO):
Samples of air were collected and analyzed for CO content but CO concentration could not be
detected. Hence, the concentration of Carbon mono oxide was found below detectable limit at
all sampling stations.
Overall Ambient Air Quality of Chandranagar project area and its buffer zone is good during
monitoring period and there are no any abnormal values recorded. Concentrations of all
monitored parameters are within stipulated standards from MoEF AAQ Standards.
3.5.2 Summary of the Ambient Quality report is as below
The ambient air monitoring report is given below in Table 3-9.
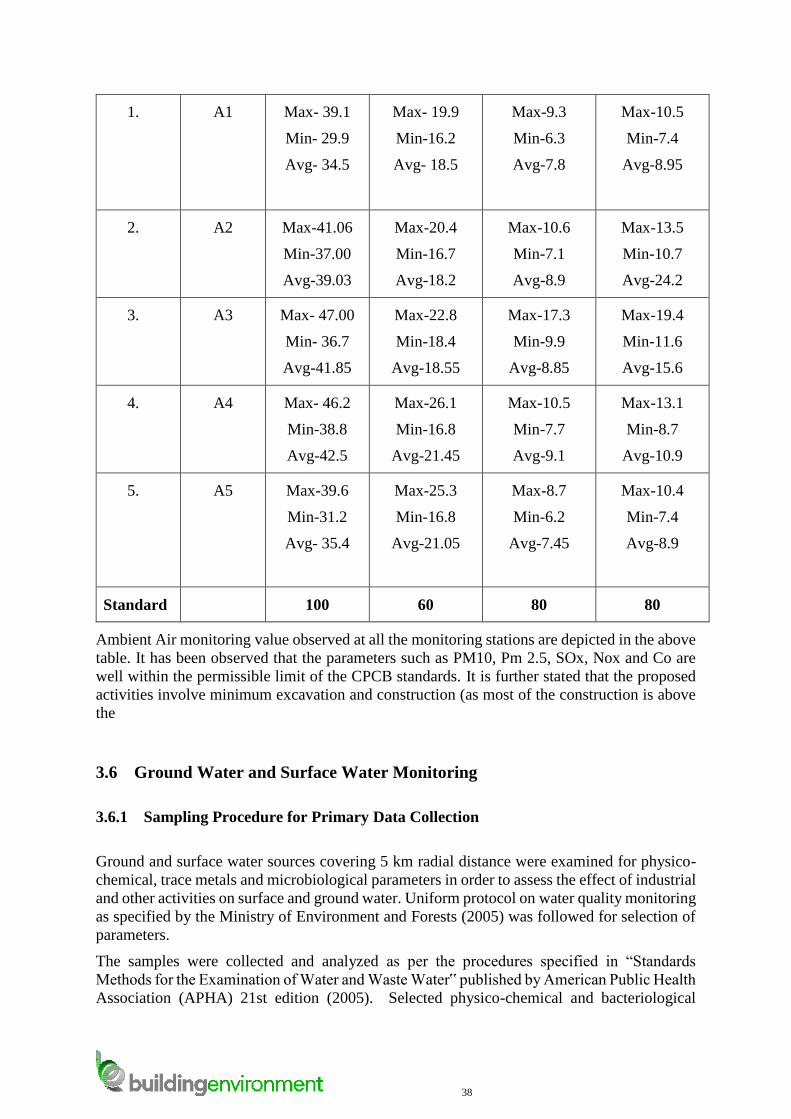
Table 11-9: Ambient air monitoring report
Sr No. Location Pm10 Pm2.5 SOx NOx
38
1. A1 Max- 39.1
Min- 29.9
Avg- 34.5
Max- 19.9
Min-16.2
Avg- 18.5
Max-9.3
Min-6.3
Avg-7.8
Max-10.5
Min-7.4
Avg-8.95
2. A2 Max-41.06
Min-37.00
Avg-39.03
Max-20.4
Min-16.7
Avg-18.2
Max-10.6
Min-7.1
Avg-8.9
Max-13.5
Min-10.7
Avg-24.2
3. A3 Max- 47.00
Min- 36.7
Avg-41.85
Max-22.8
Min-18.4
Avg-18.55
Max-17.3
Min-9.9
Avg-8.85
Max-19.4
Min-11.6
Avg-15.6
4. A4 Max- 46.2
Min-38.8
Avg-42.5
Max-26.1
Min-16.8
Avg-21.45
Max-10.5
Min-7.7
Avg-9.1
Max-13.1
Min-8.7
Avg-10.9
5. A5 Max-39.6
Min-31.2
Avg- 35.4
Max-25.3
Min-16.8
Avg-21.05
Max-8.7
Min-6.2
Avg-7.45
Max-10.4
Min-7.4
Avg-8.9
Standard 100 60 80 80
Ambient Air monitoring value observed at all the monitoring stations are depicted in the above
table. It has been observed that the parameters such as PM10, Pm 2.5, SOx, Nox and Co are
well within the permissible limit of the CPCB standards. It is further stated that the proposed
activities involve minimum excavation and construction (as most of the construction is above
the
3.6 Ground Water and Surface Water Monitoring
3.6.1 Sampling Procedure for Primary Data Collection
Ground and surface water sources covering 5 km radial distance were examined for physico-
chemical, trace metals and microbiological parameters in order to assess the effect of industrial
and other activities on surface and ground water. Uniform protocol on water quality monitoring
as specified by the Ministry of Environment and Forests (2005) was followed for selection of
parameters.
The samples were collected and analyzed as per the procedures specified in “Standards
Methods for the Examination of Water and Waste Water‟ published by American Public Health
Association (APHA) 21st edition (2005). Selected physico-chemical and bacteriological
39
parameters have been analyzed for evaluating the existing base line water quality status in the
study area.
3.6.2 Methodology for Sampling
The buffer zone monitoring locations were finalized based on the drainage of the area.
Following features were also given due consideration:
Toposheet maps and google image to identify major water bodies;
Water sources both ground and surface water bodies like rivers
3.6.2.1 Ground Water Monitoring
The groundwater contamination occurring due to either natural causes or anthropogenic
activities needs regular monitoring of water quality to device ways and means to protect it.
Samples were collected in last week of January, 2017 from available water sources in the study
area. Grab samples of surface and ground water were collected. On spot analysis was carried
out for the parameters like pH, Temperature, Odour, Taste, DO etc.
3.6.2.2 Location of Sampling Stations
2 ground water and 2 surface water samples were collected during January, 2017. There are 2
borewells into the project site. The location of water sampling stations selected in 5 km buffer
zone of Chandranagar Project area is depicted in the figure 3-7
Figure 11-7: Location of water sampling
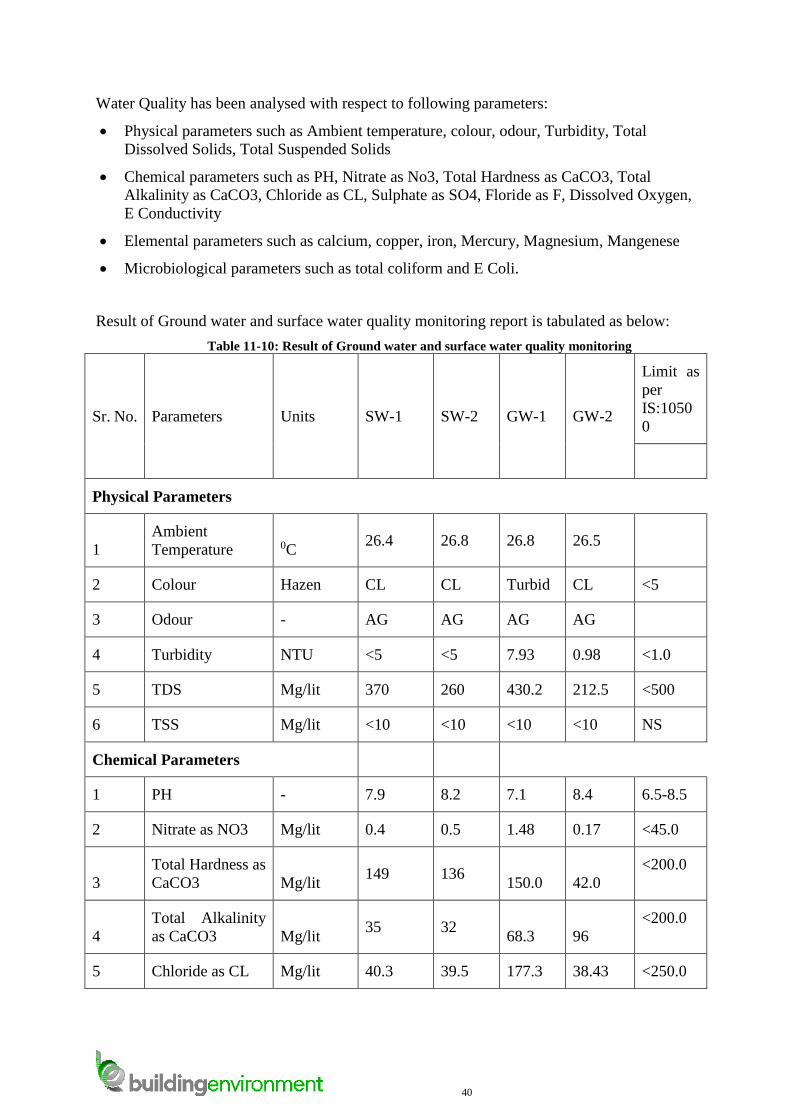
40
Water Quality has been analysed with respect to following parameters:
Physical parameters such as Ambient temperature, colour, odour, Turbidity, Total
Dissolved Solids, Total Suspended Solids
Chemical parameters such as PH, Nitrate as No3, Total Hardness as CaCO3, Total
Alkalinity as CaCO3, Chloride as CL, Sulphate as SO4, Floride as F, Dissolved Oxygen,
E Conductivity
Elemental parameters such as calcium, copper, iron, Mercury, Magnesium, Mangenese
Microbiological parameters such as total coliform and E Coli.
Result of Ground water and surface water quality monitoring report is tabulated as below:
Table 11-10: Result of Ground water and surface water quality monitoring
Sr. No. Parameters Units SW-1 SW-2 GW-1 GW-2
Limit as
per
IS:1050
0
Physical Parameters
1
Ambient
Temperature 0C 26.4 26.8 26.8 26.5
2 Colour Hazen CL CL Turbid CL <5
3 Odour - AG AG AG AG
4 Turbidity NTU <5 <5 7.93 0.98 <1.0
5 TDS Mg/lit 370 260 430.2 212.5 <500
6 TSS Mg/lit <10 <10 <10 <10 NS
Chemical Parameters
1 PH - 7.9 8.2 7.1 8.4 6.5-8.5
2 Nitrate as NO3 Mg/lit 0.4 0.5 1.48 0.17 <45.0
3
Total Hardness as
CaCO3 Mg/lit 149 136
150.0 42.0
<200.0
4
Total Alkalinity
as CaCO3 Mg/lit 35 32
68.3 96
<200.0
5 Chloride as CL Mg/lit 40.3 39.5 177.3 38.43 <250.0
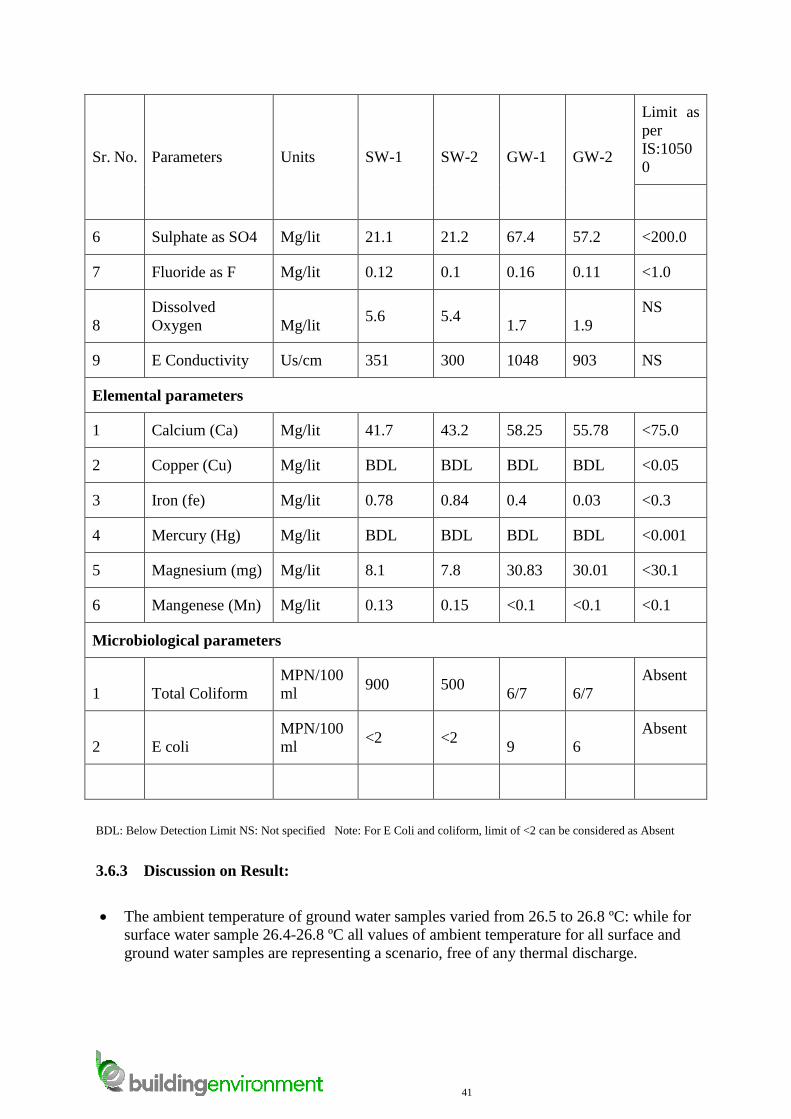
41
Sr. No. Parameters Units SW-1 SW-2 GW-1 GW-2
Limit as
per
IS:1050
0
6 Sulphate as SO4 Mg/lit 21.1 21.2 67.4 57.2 <200.0
7 Fluoride as F Mg/lit 0.12 0.1 0.16 0.11 <1.0
8
Dissolved
Oxygen Mg/lit 5.6 5.4
1.7 1.9
NS
9 E Conductivity Us/cm 351 300 1048 903 NS
Elemental parameters
1 Calcium (Ca) Mg/lit 41.7 43.2 58.25 55.78 <75.0
2 Copper (Cu) Mg/lit BDL BDL BDL BDL <0.05
3 Iron (fe) Mg/lit 0.78 0.84 0.4 0.03 <0.3
4 Mercury (Hg) Mg/lit BDL BDL BDL BDL <0.001
5 Magnesium (mg) Mg/lit 8.1 7.8 30.83 30.01 <30.1
6 Mangenese (Mn) Mg/lit 0.13 0.15 <0.1 <0.1 <0.1
Microbiological parameters
1 Total Coliform
MPN/100
ml 900 500
6/7 6/7
Absent
2 E coli
MPN/100
ml <2 <2
9 6
Absent
BDL: Below Detection Limit NS: Not specified Note: For E Coli and coliform, limit of <2 can be considered as Absent
3.6.3 Discussion on Result:
The ambient temperature of ground water samples varied from 26.5 to 26.8 ºC: while for
surface water sample 26.4-26.8 ºC all values of ambient temperature for all surface and
ground water samples are representing a scenario, free of any thermal discharge.
42
With respect to Colour and odour, Surface water sample and ground water samples are
Clear in appearance, except GW 1 which is turbid. All surface water samples and
ground water samples collected for Odour test did not have any objectionable odour.
Turbidity occurs due to presence of suspended matter or colour pigment in water sample.
High values of turbidity indicate abnormal activity in related area. Turbidity of all
surface and ground water samples has less than 5 NTU, except GW 1 which has turbidity
7.93. Except GW 1, Turbidity values for all of samples are less than permissible limit (5
NTU) as prescribed in IS: 10500 of 2012.
PH values of SW1 and SW2 are 7.9 and 8.2PH values of GW 1 and GW 2 are 7.1 and
8.4. These values are within Acceptable range of 6.5 to 8.5 as per IS 10500:2012
Surface water sample have Dissolved Oxygen levels ranging from 5.4 to 5.6 mg/l which
indicates the good water quality.
Total dissolved solid of GW1 and GW2 are 430.2 and 22.5 respectively. TDS of SW1
and SW2 are 370 and 260 respectively, which are less than permissible limit of 500 mg/l
as per standards
Chloride in surface water samples ranging from 39.5 to 40.3 mg/l and ground water
ranges from 38.43 to 177.3 mg/l these values are below permissible limit of 250 mg/l as
prescribed in IS 10500:2012.
All ground water and surface water samples have fluoride value is around 0.1 mg/l which
are much lower than acceptable limit of 1.0 mg/l as per in IS 10500:2012.
Ground water samples have Coli forms and surface water samples have Coliforms 1100
MPN/100 ml Thus; the surface water samples are contaminated. This is due to surface
runoff entering these sources.
GW 1- Turbidity more than permissible limit and Iron more than desirable limit. E
coli and Coliform limits are exceeding the permissible limit. Not fit for drinking purpose.
With treatment, the water can be used for potable use.
GW 1- Chemically fit for drinking purpose, however, E coli and Coliform limits are
exceeding the permissible limit. With treatment, water can be used for potable use.
3.7 Geology of The Area
Ratnagiri because of its location i.e. the coastline and proximity to the Sahyadri ranges,
following soil types can be observed. (GSDA, 2009). Ratnagiri because of its location i.e. the
coastline and proximity to the Sahyadri ranges, following soil types can be observed. (GSDA,
2009)
Coarse Shallow Soil: They are reddish brown in colour and occur on the slopes of the
hills and are partly eroded, poor in fertility, shallow in depth and course in texture. These
soils are ideal for Cashew and Mango plantations.
Medium Deep Soil: These are reddish yellow in colour and have various names
depending upon the place of occurrence. Those situated at higher elevations are known
as Mal, while at slightly lower levels are known as Kuyat. Near water courses, which
have a fair supply of water during Rabi creekson are known as Panthal or Vaigan. Paddy
43
is grown on these soils during Kharif. On Panthal soils pulses and summer paddy can
also been grown.
Deep Soil: They occur along river banks or valleys and are usually of mixed origin and
are yellowish red to brown in colour. They are light, easily workable, well drained and
fairly fertile. Areca nut and coconut gardens are grown well on these soils.
Coastal Alluvial Soil: They are found along the coastal strip and consist of deep sandy
loams suitable for Coconut and Areca nut.
Coastal Saline Soil: They are formed due to the inundation of the creek, whereby part of
coastal soils becomes salty. They are locally known as Khar, Khajan and Kharvat etc.
They are found along coastal strip of Dapoli, Guhagar and Ratnagiri tehsils.
Geotechnical Hazards are many & diverse. The most common hazards are due to: Ground
water, Slope instability, Subsidence, compressible soil, swelling soil, weak soil, weathering of
soil & rock. Nearly all geotechnical hazards are associated in some way with water.
Water in soil & rocks can, through reducing effective stress, bring about a reduction in strength
which may lead to slope becoming unstable. Changes in ground water conditions can cause the
collapse of surface voids that can result in subsidence. Changes in moisture content in certain
clay-rich soils can result in swelling & shrinkage leading to structural damage of building
founded in them. The movement of water through certain rocks & soil can result in weathering
at rate that may result in changes in the mechanical properties during the life of a structure
placed on or in them. Slope Instability is a generic term that refers to the movement of soil &
rocks under the influence of gravity. Terms such as landslides, slips, slumps, mudflows & rock-
falls are commonly used to describe different type of slope instability.
3.7.1 Hard Rock Areas
Deccan Trap Basalt
Major part of the district is covered by basaltic lava flows of Upper Cretaceous to Lower
Eocene age. The lava flows are predominantly of ‘aa’ type with ‘pahoehoe’ type flows
occurring at few places. Deccan Trap Basalt forms an important water bearing formation in the
district. The primary porosity in the vesicular units is negligible due to lack of interconnection
and secondary filling. The secondary porosity due to cooling joints, partition planes, cracks
and fissures play an important role in ground water circulation especially in the highly porous
‘pahoehoe’ flows.
Degree of weathering and topographic setting also plays a major role in respect of productivity.
In Basalt, ground water occurs in Vesicular and Massive Basalt as well as inter-flow zones in
weathered mantle and fractured zones. In general, ground water occurs under water table
conditions in shallow aquifer and semi-confined to confined conditions in deeper aquifer. The
unconfined aquifer is developed due to the weathering and jointing of upper flow in Basalt
down to depth of 15-20 m bgl and the yield of the wells tapping such aquifer varies from 15 to
145 m3/day. Bore wells are not common in the district due to poor ground water potential of
deeper aquifers of Deccan Traps and their yield varies between 2 and 20 m3/hr.
Laterite
Laterite has better porosity due to intricate network of sinuous conduits making it porous
formation. The ground water circulates through a network of voids and conduits, joints and
fractures. The lithomarge clay occurring at base act as aquiclude preventing further percolation
of ground water and springs emerge at this contact due to lateral movement of ground water.
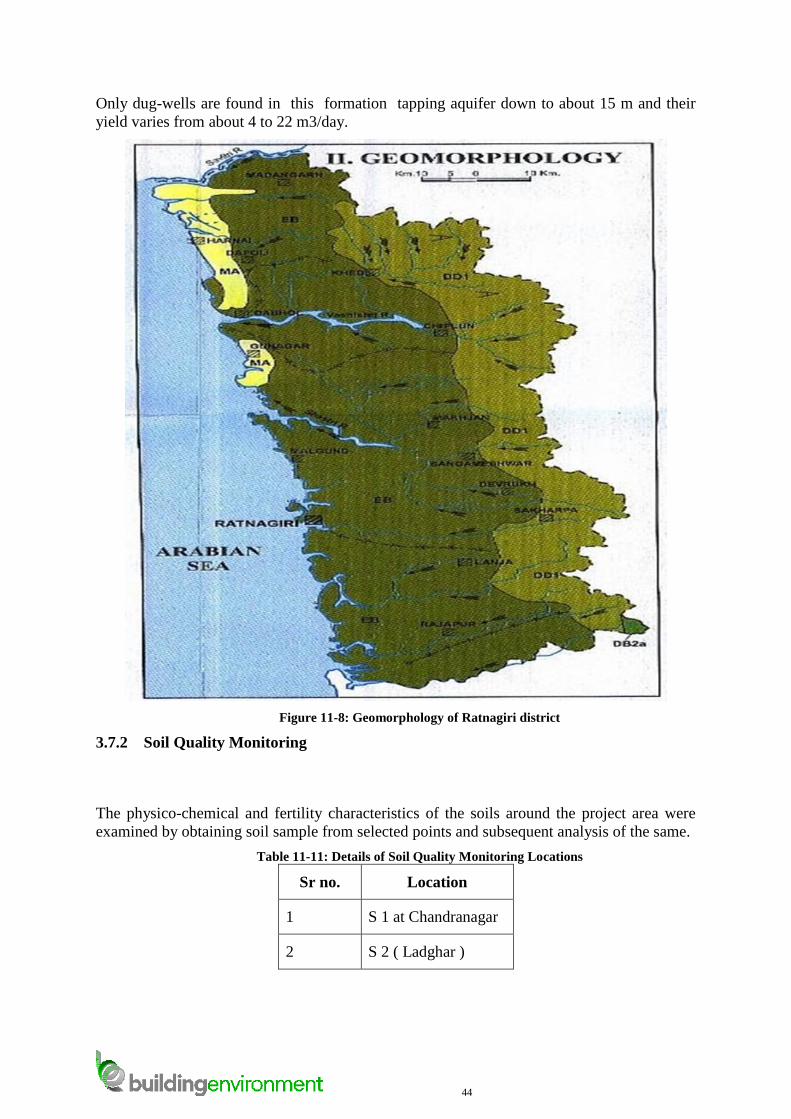
44
Only dug-wells are found in this formation tapping aquifer down to about 15 m and their
yield varies from about 4 to 22 m3/day.
Figure 11-8: Geomorphology of Ratnagiri district
3.7.2 Soil Quality Monitoring
The physico-chemical and fertility characteristics of the soils around the project area were
examined by obtaining soil sample from selected points and subsequent analysis of the same.
Table 11-11: Details of Soil Quality Monitoring Locations
Sr no. Location
1 S 1 at Chandranagar
2 S 2 ( Ladghar )
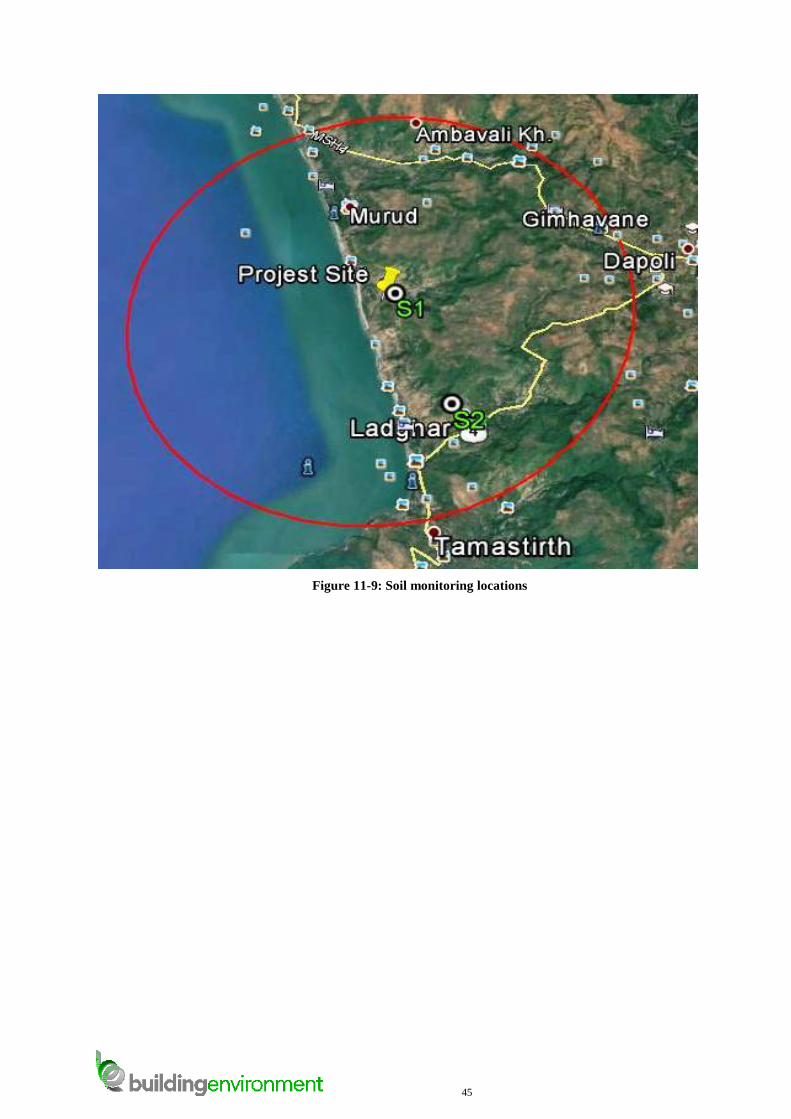
45
Figure 11-9: Soil monitoring locations
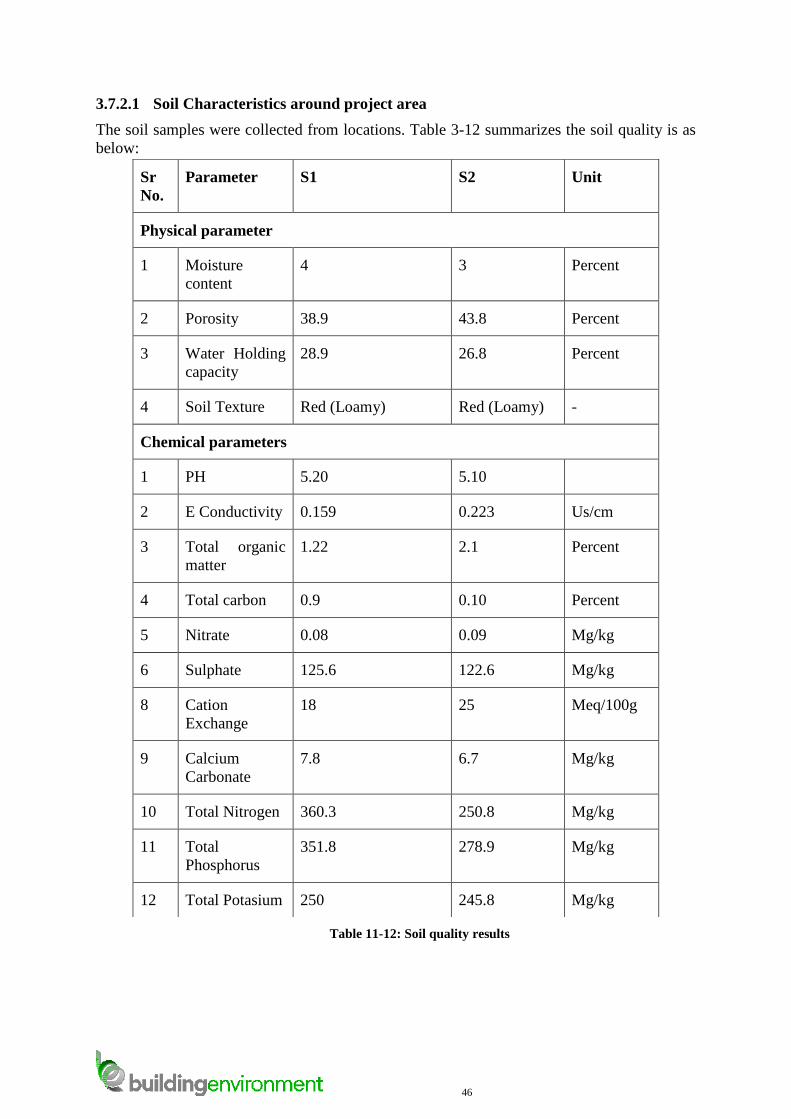
46
3.7.2.1 Soil Characteristics around project area
The soil samples were collected from locations. Table 3-12 summarizes the soil quality is as
below:
Table 11-12: Soil quality results
Sr
No.
Parameter S1 S2 Unit
Physical parameter
1 Moisture
content
4 3 Percent
2 Porosity 38.9 43.8 Percent
3 Water Holding
capacity
28.9 26.8 Percent
4 Soil Texture Red (Loamy) Red (Loamy) -
Chemical parameters
1 PH 5.20 5.10
2 E Conductivity 0.159 0.223 Us/cm
3 Total organic
matter
1.22 2.1 Percent
4 Total carbon 0.9 0.10 Percent
5 Nitrate 0.08 0.09 Mg/kg
6 Sulphate 125.6 122.6 Mg/kg
8 Cation
Exchange
18 25 Meq/100g
9 Calcium
Carbonate
7.8 6.7 Mg/kg
10 Total Nitrogen 360.3 250.8 Mg/kg
11 Total
Phosphorus
351.8 278.9 Mg/kg
12 Total Potasium 250 245.8 Mg/kg
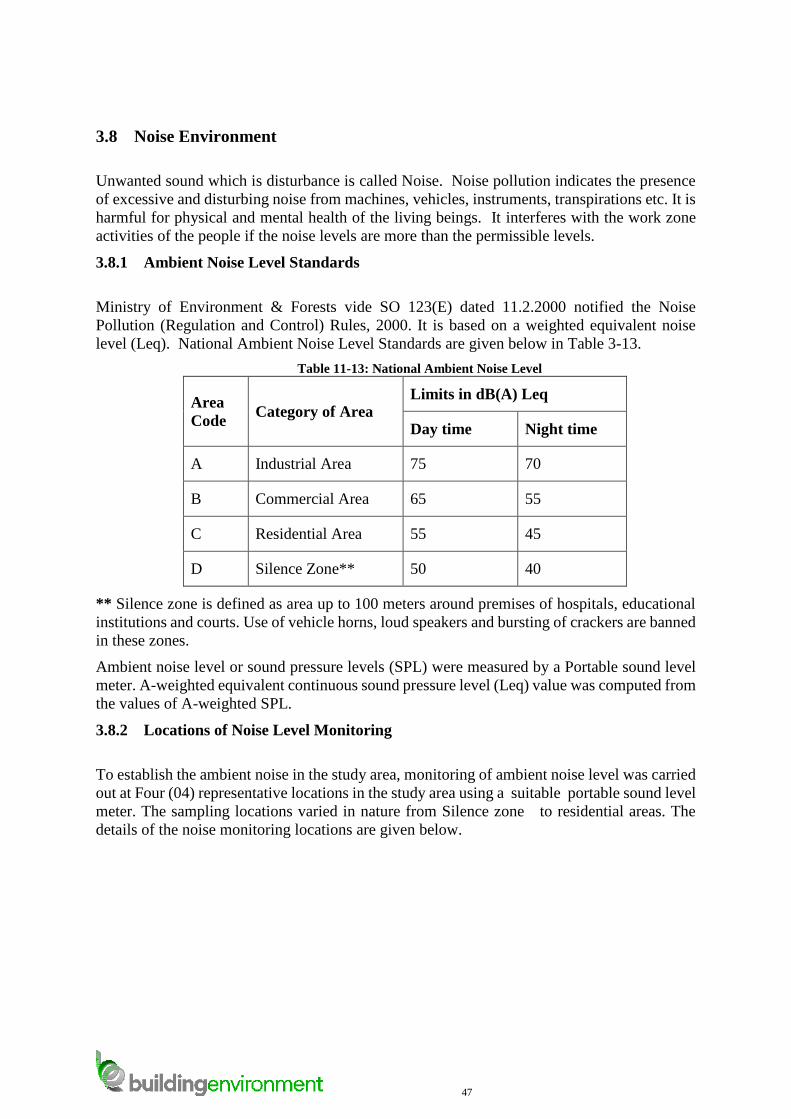
47
3.8 Noise Environment
Unwanted sound which is disturbance is called Noise. Noise pollution indicates the presence
of excessive and disturbing noise from machines, vehicles, instruments, transpirations etc. It is
harmful for physical and mental health of the living beings. It interferes with the work zone
activities of the people if the noise levels are more than the permissible levels.
3.8.1 Ambient Noise Level Standards
Ministry of Environment & Forests vide SO 123(E) dated 11.2.2000 notified the Noise
Pollution (Regulation and Control) Rules, 2000. It is based on a weighted equivalent noise
level (Leq). National Ambient Noise Level Standards are given below in Table 3-13.
Table 11-13: National Ambient Noise Level
Area
Code Category of Area
Limits in dB(A) Leq
Day time Night time
A Industrial Area 75 70
B Commercial Area 65 55
C Residential Area 55 45
D Silence Zone** 50 40
** Silence zone is defined as area up to 100 meters around premises of hospitals, educational
institutions and courts. Use of vehicle horns, loud speakers and bursting of crackers are banned
in these zones.
Ambient noise level or sound pressure levels (SPL) were measured by a Portable sound level
meter. A-weighted equivalent continuous sound pressure level (Leq) value was computed from
the values of A-weighted SPL.
3.8.2 Locations of Noise Level Monitoring
To establish the ambient noise in the study area, monitoring of ambient noise level was carried
out at Four (04) representative locations in the study area using a suitable portable sound level
meter. The sampling locations varied in nature from Silence zone to residential areas. The
details of the noise monitoring locations are given below.
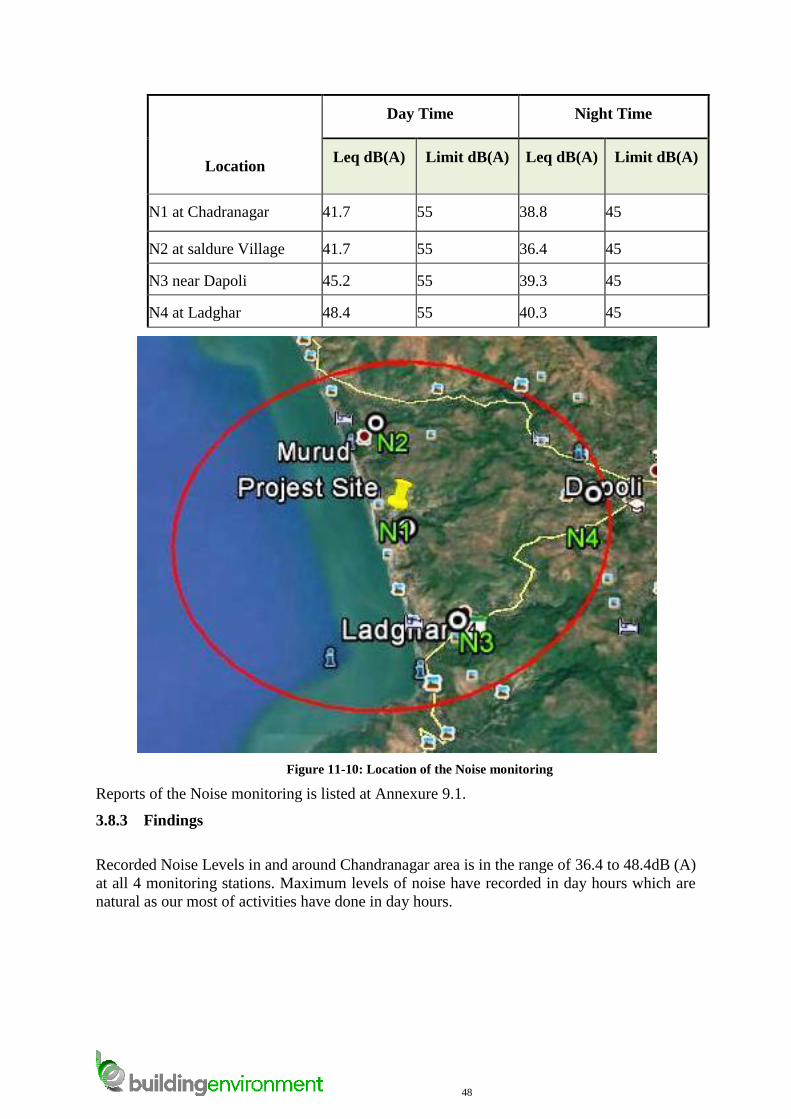
48
Location
Day Time Night Time
Leq dB(A) Limit dB(A) Leq dB(A) Limit dB(A)
N1 at Chadranagar 41.7 55 38.8 45
N2 at saldure Village 41.7 55 36.4 45
N3 near Dapoli 45.2 55 39.3 45
N4 at Ladghar 48.4 55 40.3 45
Figure 11-10: Location of the Noise monitoring
Reports of the Noise monitoring is listed at Annexure 9.1.
3.8.3 Findings
Recorded Noise Levels in and around Chandranagar area is in the range of 36.4 to 48.4dB (A)
at all 4 monitoring stations. Maximum levels of noise have recorded in day hours which are
natural as our most of activities have done in day hours.
49
3.9 Flora and Fauna
As defined by the Convention on Biological Diversity (CBD), biological diversity is “the
variability among living organisms from all sources including, inter alia, terrestrial, marine and
other aquatic ecosystems and the ecological complexes of which they are part, diversity within
species, between species, and of ecosystems”
Biodiversity is the variety of living organisms considered at all levels of organisation, from
genetics through species, to higher taxonomic levels, and including the variety of habitats and
ecosystems, as well as the processes occurring therein Biodiversity is not the same as the
number of different kinds of species in a place : Biodiversity is in fact more complex than
species richness, although species richness is certainly one component of
biodiversity.Biodiversity assessment is means of collecting information on the flora and fauna
present in the area. It involves conducting survey or inventory of the species of the area.
Assessment could focus on one taxanomic group or multi taxanomic such as plants, birds,
mammals, reptiles, amphibians and selected invertebrate group such as ants, butterflies.
Biodiversity assessment can only report what species have been detected and recorded as
present in the area. It is done to protect the morphologic and genetic diversity of the area.
3.9.1 Baseline Status
In the site at village biodiversity has been reported in the study area. Few of flora and fauna
have been cited over the period of time. Various types of birds, reptiles, mammals etc. are seen
in the area.
3.9.2 Location of Biological Study
The study area of this project comprises of an area falling within a radius of 5 km from the
project location. The area is thinly vegetated and there is no thick vegetation on the plateau top.
On the slopes however, some mango, cashew nuts and coconut plantations etc. are noticed.
Paddy is mainly cultivated on the slopes of the plateau and at the sea-shore.
Natural fauna in the area are wild bores, field mice, rabbits, foxes which have been reported.
The reptiles and scorpions are common in the area. Domesticated cattles are oxes, buffaloes,
cows and goat in all the villages in the area.
3.9.3 Methodology of Biological Study
Flora:
List of all plants from the study area was prepared and their habits recorded. The associations
of plants in communities were noted. To study herbaceous and woody vegetation
systematically, standard methods of analyzing vegetation i.e. quadrate of different dimensions
and line transector of appropriate lengths were employed. Their numbers (quadrate) depend
upon the requirement in specific cases. Identification of plants was done by referring to
standard florist and consulting the experts when needed. The samples (specimen) were
individually stored in separate blotting papers and put in the polythene bags. Each specimen
carried the name of the species, time and date of collection and locations.
Fauna:
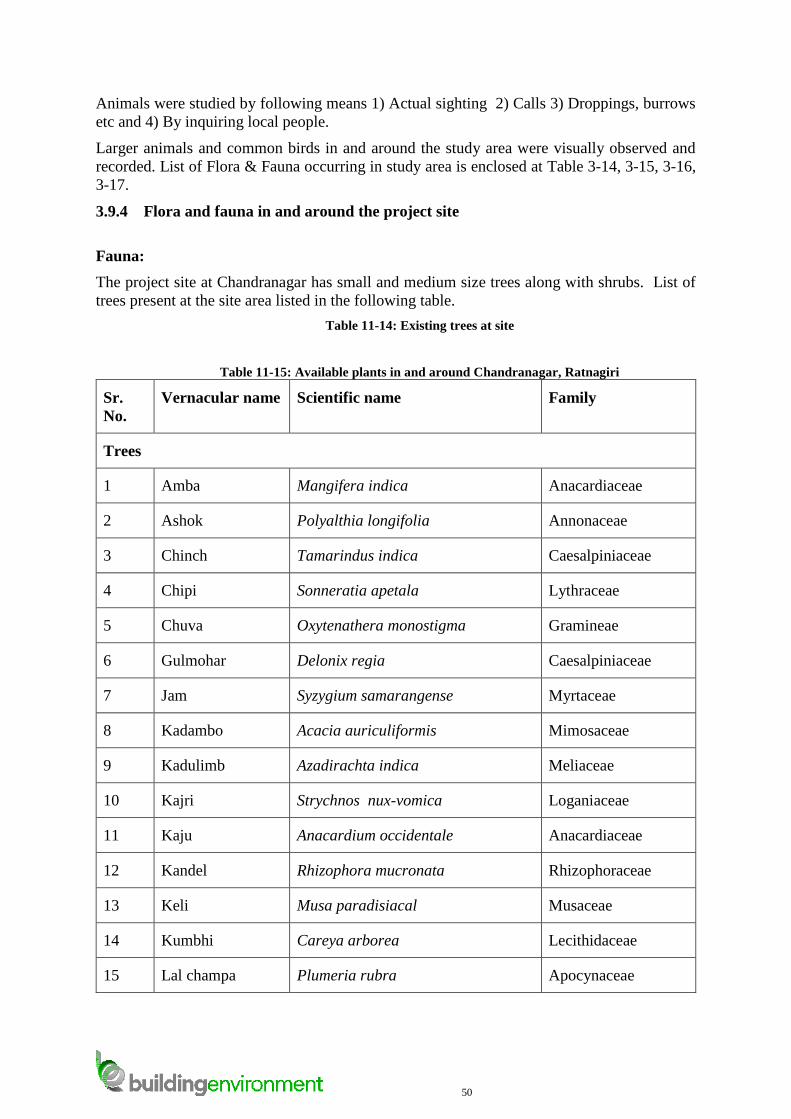
50
Animals were studied by following means 1) Actual sighting 2) Calls 3) Droppings, burrows
etc and 4) By inquiring local people.
Larger animals and common birds in and around the study area were visually observed and
recorded. List of Flora & Fauna occurring in study area is enclosed at Table 3-14, 3-15, 3-16,
3-17.
3.9.4 Flora and fauna in and around the project site
Fauna:
The project site at Chandranagar has small and medium size trees along with shrubs. List of
trees present at the site area listed in the following table.
Table 11-14: Existing trees at site
Table 11-15: Available plants in and around Chandranagar, Ratnagiri
Sr.
No.
Vernacular name Scientific name Family
Trees
1 Amba Mangifera indica Anacardiaceae
2 Ashok Polyalthia longifolia Annonaceae
3 Chinch Tamarindus indica Caesalpiniaceae
4 Chipi Sonneratia apetala Lythraceae
5 Chuva Oxytenathera monostigma Gramineae
6 Gulmohar Delonix regia Caesalpiniaceae
7 Jam Syzygium samarangense Myrtaceae
8 Kadambo Acacia auriculiformis Mimosaceae
9 Kadulimb Azadirachta indica Meliaceae
10 Kajri Strychnos nux-vomica Loganiaceae
11 Kaju Anacardium occidentale Anacardiaceae
12 Kandel Rhizophora mucronata Rhizophoraceae
13 Keli Musa paradisiacal Musaceae
14 Kumbhi Careya arborea Lecithidaceae
15 Lal champa Plumeria rubra Apocynaceae
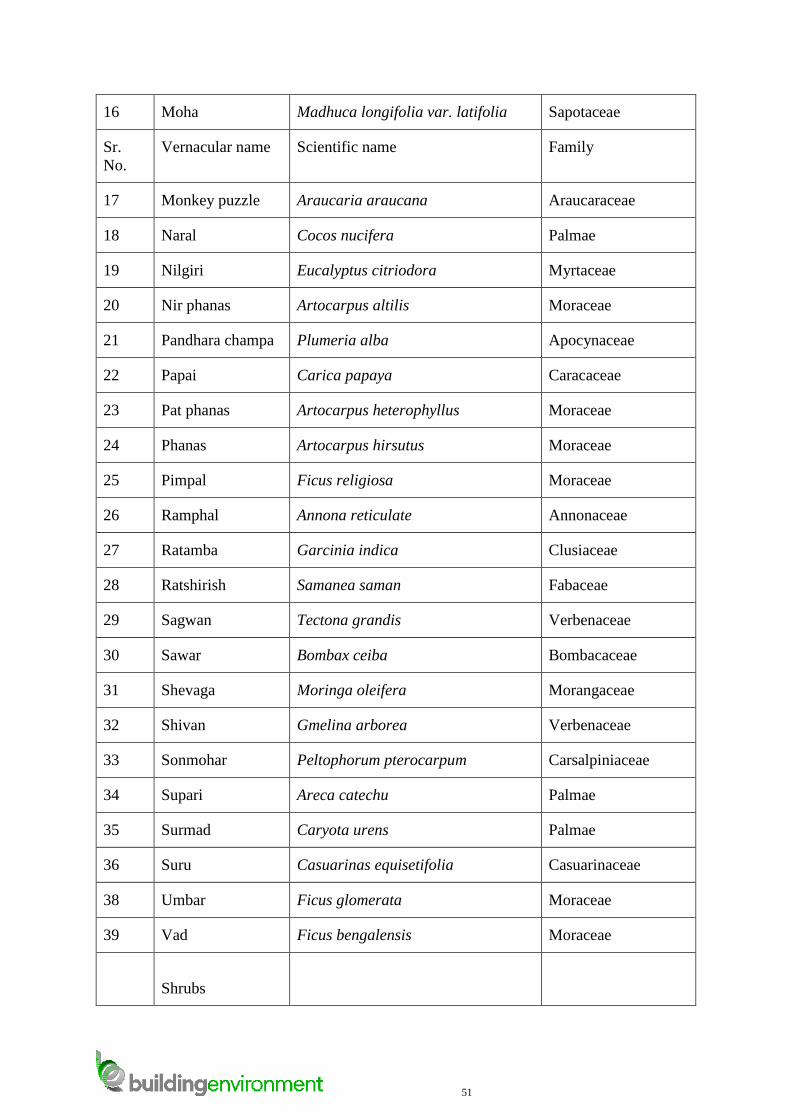
51
16 Moha Madhuca longifolia var. latifolia Sapotaceae
Sr.
No.
Vernacular name Scientific name Family
17 Monkey puzzle Araucaria araucana Araucaraceae
18 Naral Cocos nucifera Palmae
19 Nilgiri Eucalyptus citriodora Myrtaceae
20 Nir phanas Artocarpus altilis Moraceae
21 Pandhara champa Plumeria alba Apocynaceae
22 Papai Carica papaya Caracaceae
23 Pat phanas Artocarpus heterophyllus Moraceae
24 Phanas Artocarpus hirsutus Moraceae
25 Pimpal Ficus religiosa Moraceae
26 Ramphal Annona reticulate Annonaceae
27 Ratamba Garcinia indica Clusiaceae
28 Ratshirish Samanea saman Fabaceae
29 Sagwan Tectona grandis Verbenaceae
30 Sawar Bombax ceiba Bombacaceae
31 Shevaga Moringa oleifera Morangaceae
32 Shivan Gmelina arborea Verbenaceae
33 Sonmohar Peltophorum pterocarpum Carsalpiniaceae
34 Supari Areca catechu Palmae
35 Surmad Caryota urens Palmae
36 Suru Casuarinas equisetifolia Casuarinaceae
38 Umbar Ficus glomerata Moraceae
39 Vad Ficus bengalensis Moraceae
Shrubs
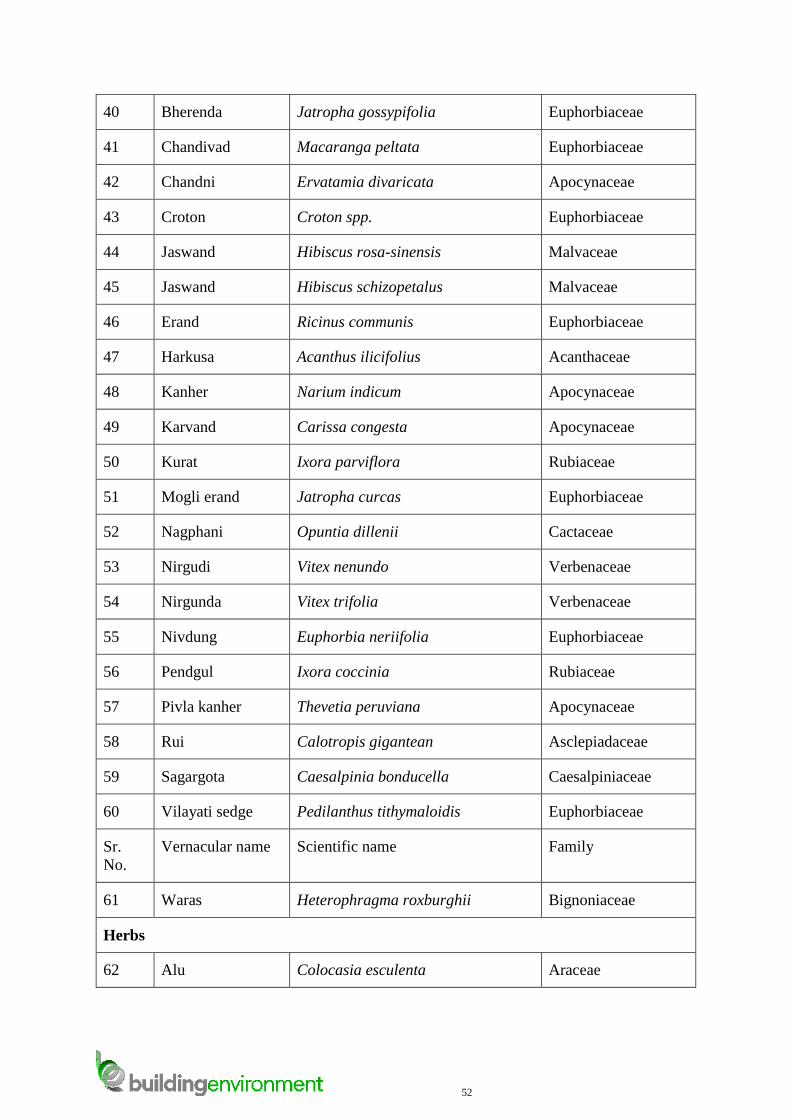
52
40 Bherenda Jatropha gossypifolia Euphorbiaceae
41 Chandivad Macaranga peltata Euphorbiaceae
42 Chandni Ervatamia divaricata Apocynaceae
43 Croton Croton spp. Euphorbiaceae
44 Jaswand Hibiscus rosa-sinensis Malvaceae
45 Jaswand Hibiscus schizopetalus Malvaceae
46 Erand Ricinus communis Euphorbiaceae
47 Harkusa Acanthus ilicifolius Acanthaceae
48 Kanher Narium indicum Apocynaceae
49 Karvand Carissa congesta Apocynaceae
50 Kurat Ixora parviflora Rubiaceae
51 Mogli erand Jatropha curcas Euphorbiaceae
52 Nagphani Opuntia dillenii Cactaceae
53 Nirgudi Vitex nenundo Verbenaceae
54 Nirgunda Vitex trifolia Verbenaceae
55 Nivdung Euphorbia neriifolia Euphorbiaceae
56 Pendgul Ixora coccinia Rubiaceae
57 Pivla kanher Thevetia peruviana Apocynaceae
58 Rui Calotropis gigantean Asclepiadaceae
59 Sagargota Caesalpinia bonducella Caesalpiniaceae
60 Vilayati sedge Pedilanthus tithymaloidis Euphorbiaceae
Sr.
No.
Vernacular name Scientific name Family
61 Waras Heterophragma roxburghii Bignoniaceae
Herbs
62 Alu Colocasia esculenta Araceae
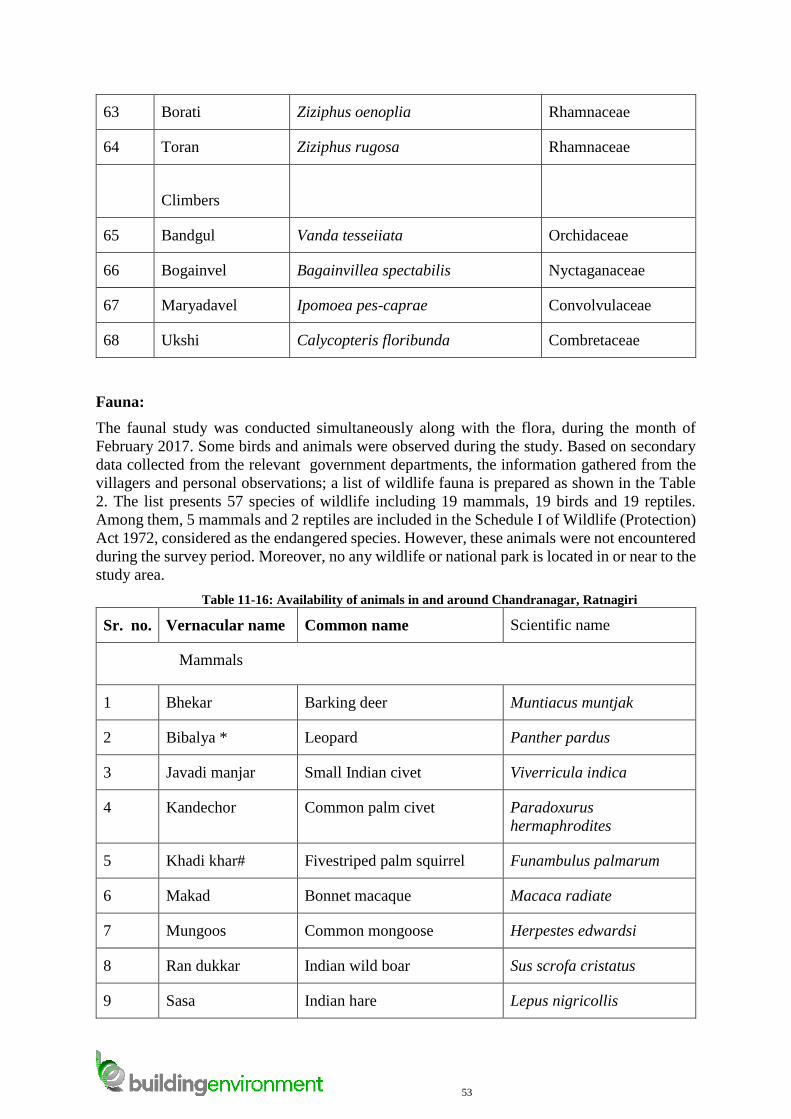
53
63 Borati Ziziphus oenoplia Rhamnaceae
64 Toran Ziziphus rugosa Rhamnaceae
Climbers
65 Bandgul Vanda tesseiiata Orchidaceae
66 Bogainvel Bagainvillea spectabilis Nyctaganaceae
67 Maryadavel Ipomoea pes-caprae Convolvulaceae
68 Ukshi Calycopteris floribunda Combretaceae
Fauna:
The faunal study was conducted simultaneously along with the flora, during the month of
February 2017. Some birds and animals were observed during the study. Based on secondary
data collected from the relevant government departments, the information gathered from the
villagers and personal observations; a list of wildlife fauna is prepared as shown in the Table
2. The list presents 57 species of wildlife including 19 mammals, 19 birds and 19 reptiles.
Among them, 5 mammals and 2 reptiles are included in the Schedule I of Wildlife (Protection)
Act 1972, considered as the endangered species. However, these animals were not encountered
during the survey period. Moreover, no any wildlife or national park is located in or near to the
study area.
Table 11-16: Availability of animals in and around Chandranagar, Ratnagiri
Sr. no. Vernacular name Common name Scientific name
Mammals
1 Bhekar Barking deer Muntiacus muntjak
2 Bibalya * Leopard Panther pardus
3 Javadi manjar Small Indian civet Viverricula indica
4 Kandechor Common palm civet Paradoxurus
hermaphrodites
5 Khadi khar# Fivestriped palm squirrel Funambulus palmarum
6 Makad Bonnet macaque Macaca radiate
7 Mungoos Common mongoose Herpestes edwardsi
8 Ran dukkar Indian wild boar Sus scrofa cristatus
9 Sasa Indian hare Lepus nigricollis
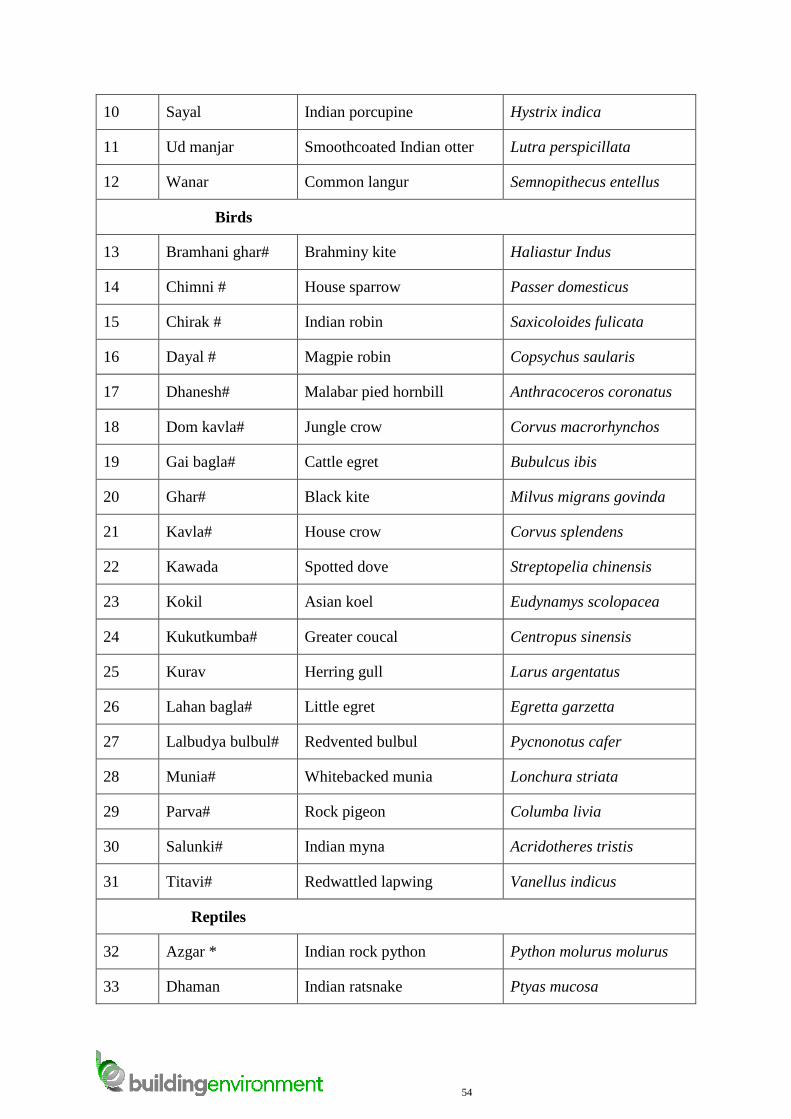
54
10 Sayal Indian porcupine Hystrix indica
11 Ud manjar Smoothcoated Indian otter Lutra perspicillata
12 Wanar Common langur Semnopithecus entellus
Birds
13 Bramhani ghar# Brahminy kite Haliastur Indus
14 Chimni # House sparrow Passer domesticus
15 Chirak # Indian robin Saxicoloides fulicata
16 Dayal # Magpie robin Copsychus saularis
17 Dhanesh# Malabar pied hornbill Anthracoceros coronatus
18 Dom kavla# Jungle crow Corvus macrorhynchos
19 Gai bagla# Cattle egret Bubulcus ibis
20 Ghar# Black kite Milvus migrans govinda
21 Kavla# House crow Corvus splendens
22 Kawada Spotted dove Streptopelia chinensis
23 Kokil Asian koel Eudynamys scolopacea
24 Kukutkumba# Greater coucal Centropus sinensis
25 Kurav Herring gull Larus argentatus
26 Lahan bagla# Little egret Egretta garzetta
27 Lalbudya bulbul# Redvented bulbul Pycnonotus cafer
28 Munia# Whitebacked munia Lonchura striata
29 Parva# Rock pigeon Columba livia
30 Salunki# Indian myna Acridotheres tristis
31 Titavi# Redwattled lapwing Vanellus indicus
Reptiles
32 Azgar * Indian rock python Python molurus molurus
33 Dhaman Indian ratsnake Ptyas mucosa
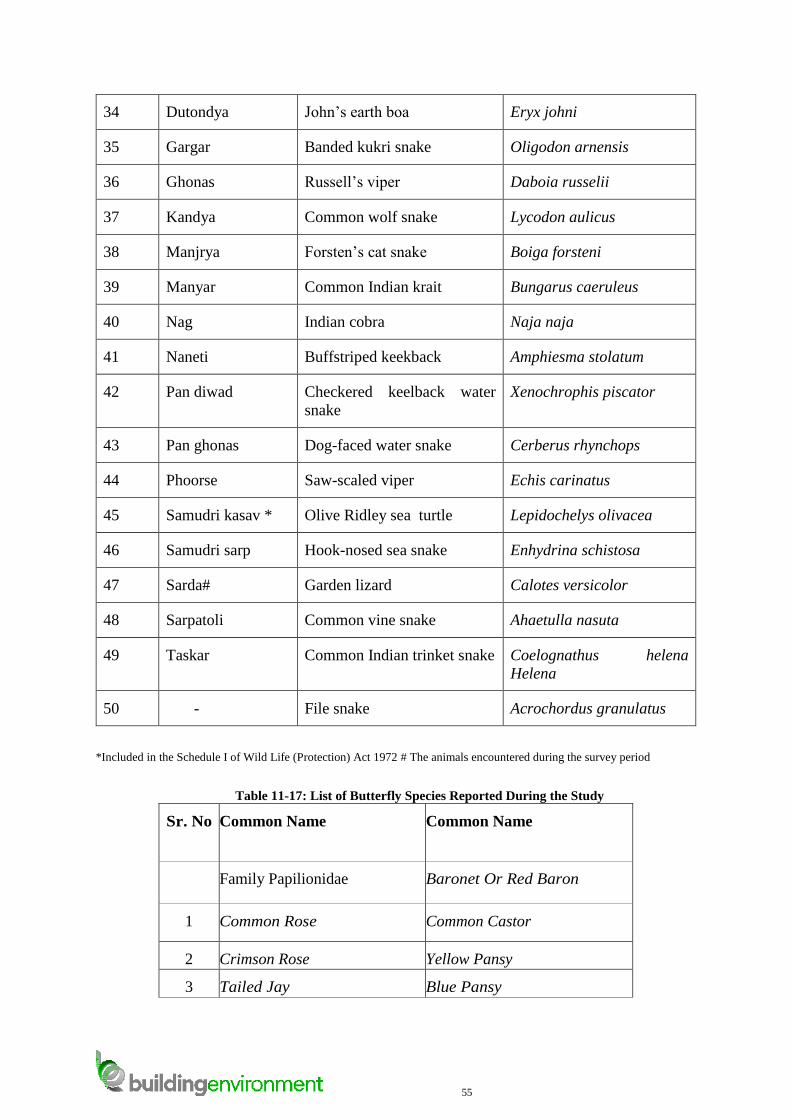
55
34 Dutondya John’s earth boa Eryx johni
35 Gargar Banded kukri snake Oligodon arnensis
36 Ghonas Russell’s viper Daboia russelii
37 Kandya Common wolf snake Lycodon aulicus
38 Manjrya Forsten’s cat snake Boiga forsteni
39 Manyar Common Indian krait Bungarus caeruleus
40 Nag Indian cobra Naja naja
41 Naneti Buffstriped keekback Amphiesma stolatum
42 Pan diwad Checkered keelback water
snake
Xenochrophis piscator
43 Pan ghonas Dog-faced water snake Cerberus rhynchops
44 Phoorse Saw-scaled viper Echis carinatus
45 Samudri kasav * Olive Ridley sea turtle Lepidochelys olivacea
46 Samudri sarp Hook-nosed sea snake Enhydrina schistosa
47 Sarda# Garden lizard Calotes versicolor
48 Sarpatoli Common vine snake Ahaetulla nasuta
49 Taskar Common Indian trinket snake Coelognathus helena
Helena
50 - File snake Acrochordus granulatus
*Included in the Schedule I of Wild Life (Protection) Act 1972 # The animals encountered during the survey period
Table 11-17: List of Butterfly Species Reported During the Study
Sr. No Common Name Common Name
Family Papilionidae Baronet Or Red Baron
1 Common Rose Common Castor
2 Crimson Rose Yellow Pansy
3 Tailed Jay Blue Pansy
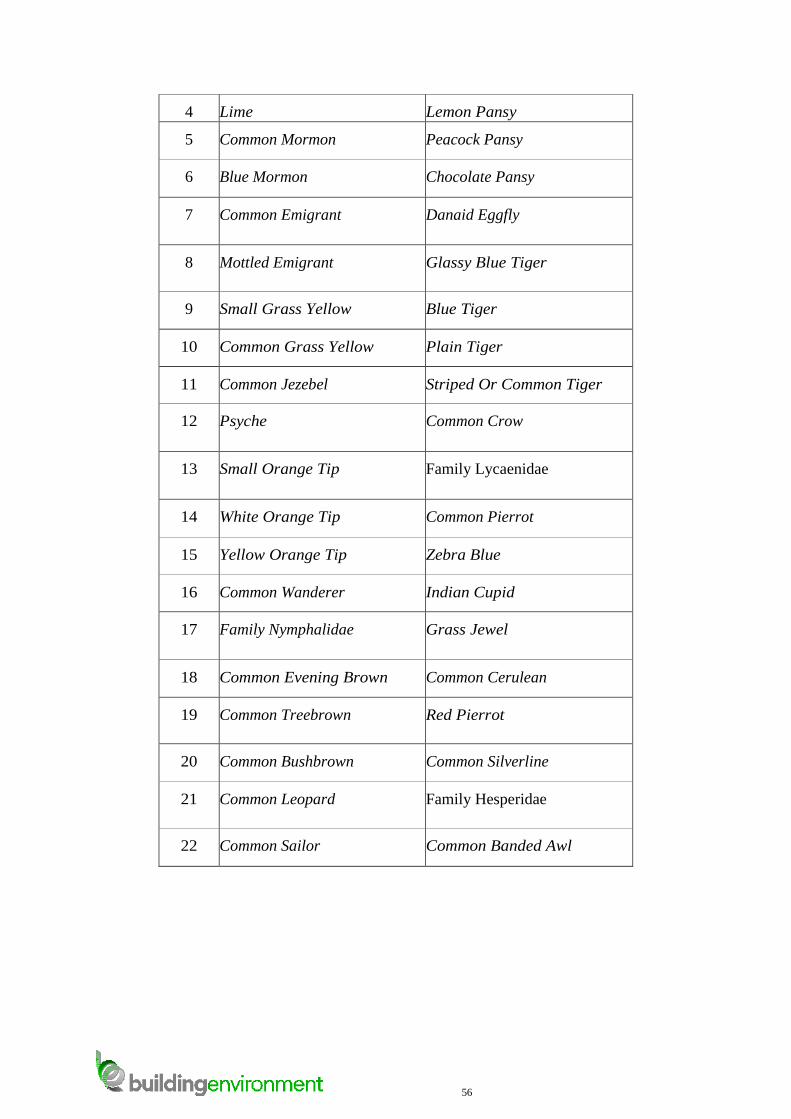
56
4 Lime Lemon Pansy
5 Common Mormon Peacock Pansy
6 Blue Mormon Chocolate Pansy
7 Common Emigrant Danaid Eggfly
8 Mottled Emigrant Glassy Blue Tiger
9 Small Grass Yellow Blue Tiger
10 Common Grass Yellow Plain Tiger
11 Common Jezebel Striped Or Common Tiger
12 Psyche Common Crow
13 Small Orange Tip Family Lycaenidae
14 White Orange Tip Common Pierrot
15 Yellow Orange Tip Zebra Blue
16 Common Wanderer Indian Cupid
17 Family Nymphalidae Grass Jewel
18 Common Evening Brown Common Cerulean
19 Common Treebrown Red Pierrot
20 Common Bushbrown Common Silverline
21 Common Leopard Family Hesperidae
22 Common Sailor Common Banded Awl
57
3.10 Socio–Economic Information
3.10.1.1 Methodology
The socio-economic status of the area around project site situated at village chandranagar and
karde has been examined and analyzed considering the secondary information available with
various Govt. Departments, District Collector office, census data, PHC records, literatures, and
published information. The area has also been visited in order to understand the socio-
economic profile of the area. Village Gram Panchayat has also been visited to obtain the
information.
3.10.1.2 Demographic Structure
Village Chandranagar is an interior rural region which can be considered as backward area in
terms of the urban and industrial development point of view. People by large subsist on
agricultural activities and tourism dependent small scale lodging and boarding services to
tourists.
3.10.1.3 Human settlement and demography
As per census 2011 demographic characteristics of the study area are represented by a number
of criteria, namely population composition, sex ratio, family structure, and age distribution
pattern. Attempt has been made to compare the demographic features between the census data
whenever corresponding data are available. The area selected for the study constitutes 12
inhabited villages. As per census 2011 village Dumdeowith population of 164 is the least
populated while Burondi with population 3966 is the most populated within study area.
3.10.1.4 Socio Economic Characteristics of the Area
Community Profile: The population is distributed among 2565 households in the study area.
The 12 inhabited villages have a population of 10197 comprising of 4454males and 5743
females. As may be observed from the graph below the composition of the society as far as
males and their counterparts female are concerned indicates healthy distribution.
The number of females per 1000 males is 1289 when compared with the figures of the
Maharashtra State 922 and for the nation 933 the study area found to be greater than State as
well as National figures.
The scheduled caste population of the study area on percentage basis is 1.83 % of the total
population and scheduled tribe population is 2.33%. Comparison with the State level figures
indicates percentage of SC as well as ST population in study area is much less than that of State
as well as national level. The distribution as depicted in the graph;
Literacy: The overall literacy in the 12 villages of the study area was 73.0%The male literacy
in the study area was 81.76% as compared with State was 88.38% in this period, and the female
literacy was 66.89% while it was 67.03% for the State.
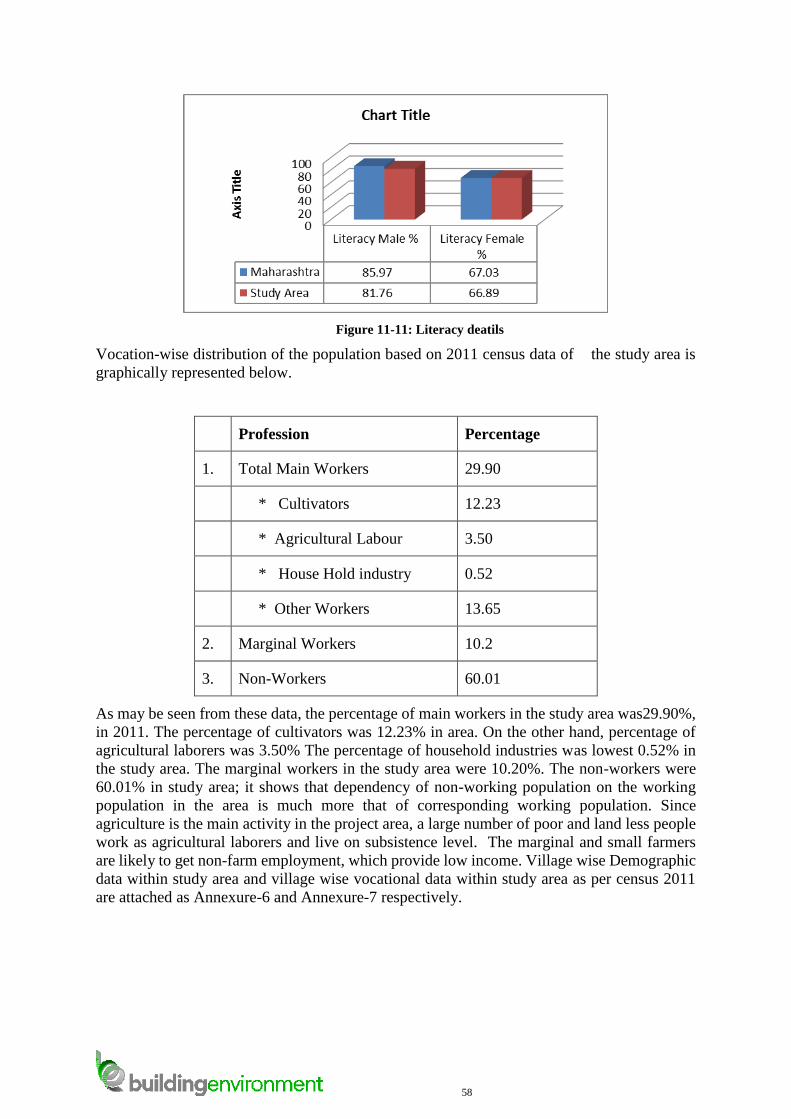
58
Figure 11-11: Literacy deatils
Vocation-wise distribution of the population based on 2011 census data of the study area is
graphically represented below.
Profession Percentage
1. Total Main Workers 29.90
* Cultivators 12.23
* Agricultural Labour 3.50
* House Hold industry 0.52
* Other Workers 13.65
2. Marginal Workers 10.2
3. Non-Workers 60.01
As may be seen from these data, the percentage of main workers in the study area was29.90%,
in 2011. The percentage of cultivators was 12.23% in area. On the other hand, percentage of
agricultural laborers was 3.50% The percentage of household industries was lowest 0.52% in
the study area. The marginal workers in the study area were 10.20%. The non-workers were
60.01% in study area; it shows that dependency of non-working population on the working
population in the area is much more that of corresponding working population. Since
agriculture is the main activity in the project area, a large number of poor and land less people
work as agricultural laborers and live on subsistence level. The marginal and small farmers
are likely to get non-farm employment, which provide low income. Village wise Demographic
data within study area and village wise vocational data within study area as per census 2011
are attached as Annexure-6 and Annexure-7 respectively.
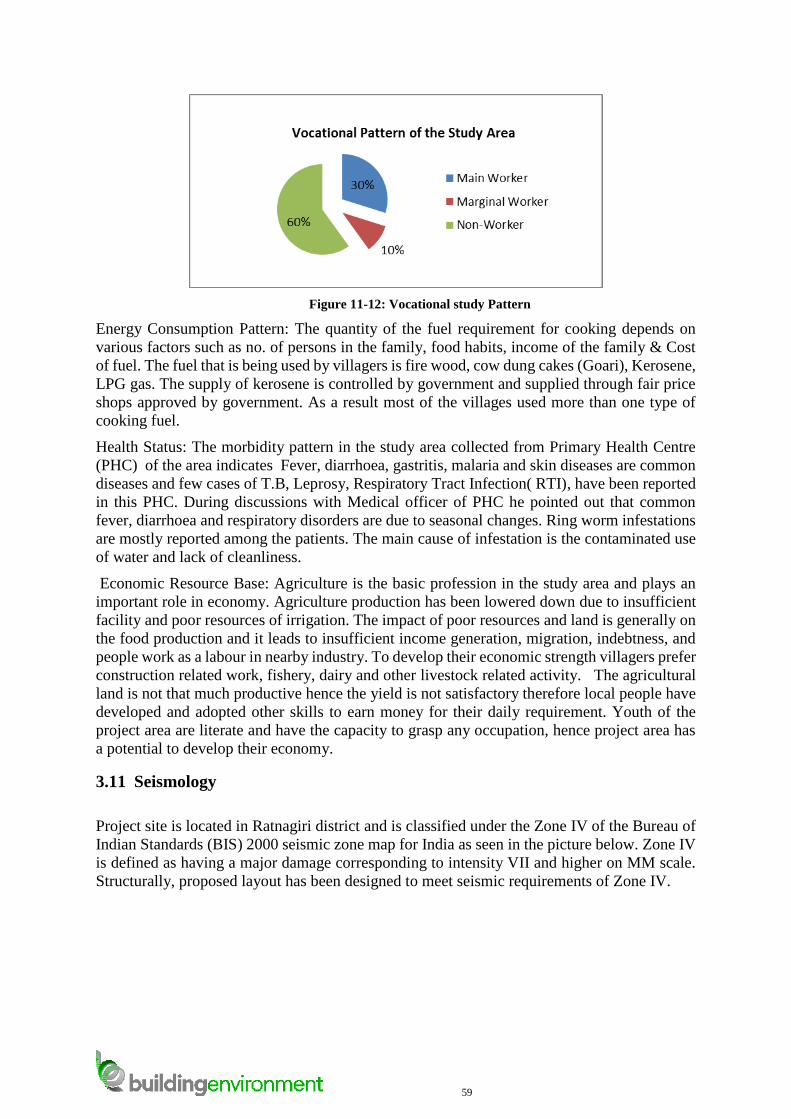
59
Figure 11-12: Vocational study Pattern
Energy Consumption Pattern: The quantity of the fuel requirement for cooking depends on
various factors such as no. of persons in the family, food habits, income of the family & Cost
of fuel. The fuel that is being used by villagers is fire wood, cow dung cakes (Goari), Kerosene,
LPG gas. The supply of kerosene is controlled by government and supplied through fair price
shops approved by government. As a result most of the villages used more than one type of
cooking fuel.
Health Status: The morbidity pattern in the study area collected from Primary Health Centre
(PHC) of the area indicates Fever, diarrhoea, gastritis, malaria and skin diseases are common
diseases and few cases of T.B, Leprosy, Respiratory Tract Infection( RTI), have been reported
in this PHC. During discussions with Medical officer of PHC he pointed out that common
fever, diarrhoea and respiratory disorders are due to seasonal changes. Ring worm infestations
are mostly reported among the patients. The main cause of infestation is the contaminated use
of water and lack of cleanliness.
Economic Resource Base: Agriculture is the basic profession in the study area and plays an
important role in economy. Agriculture production has been lowered down due to insufficient
facility and poor resources of irrigation. The impact of poor resources and land is generally on
the food production and it leads to insufficient income generation, migration, indebtness, and
people work as a labour in nearby industry. To develop their economic strength villagers prefer
construction related work, fishery, dairy and other livestock related activity. The agricultural
land is not that much productive hence the yield is not satisfactory therefore local people have
developed and adopted other skills to earn money for their daily requirement. Youth of the
project area are literate and have the capacity to grasp any occupation, hence project area has
a potential to develop their economy.
3.11 Seismology
Project site is located in Ratnagiri district and is classified under the Zone IV of the Bureau of
Indian Standards (BIS) 2000 seismic zone map for India as seen in the picture below. Zone IV
is defined as having a major damage corresponding to intensity VII and higher on MM scale.
Structurally, proposed layout has been designed to meet seismic requirements of Zone IV.
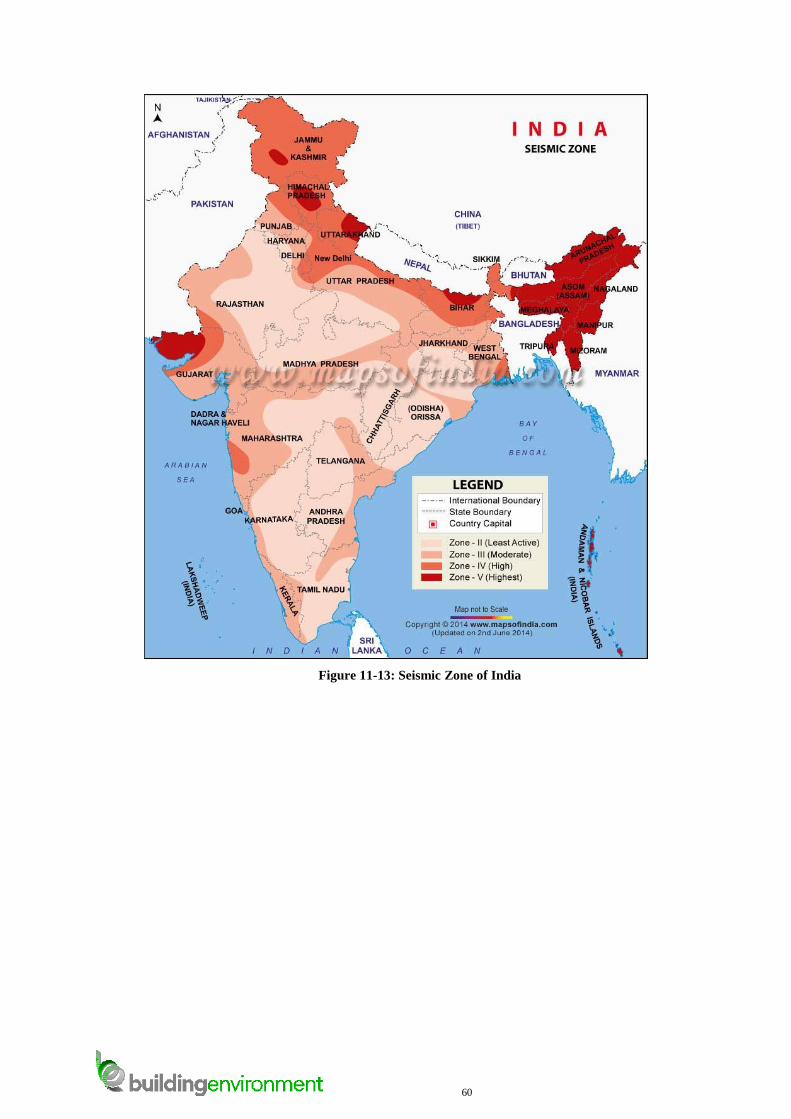
60
Figure 11-13: Seismic Zone of India
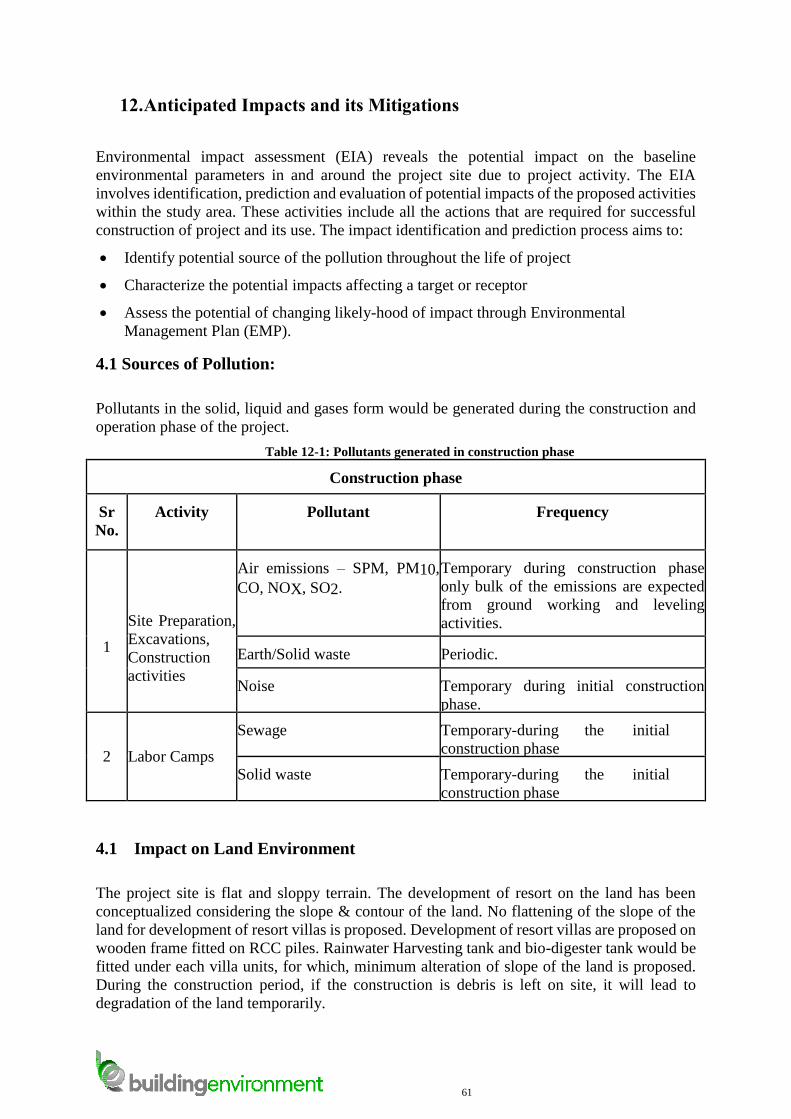
61
12. Anticipated Impacts and its Mitigations
Environmental impact assessment (EIA) reveals the potential impact on the baseline
environmental parameters in and around the project site due to project activity. The EIA
involves identification, prediction and evaluation of potential impacts of the proposed activities
within the study area. These activities include all the actions that are required for successful
construction of project and its use. The impact identification and prediction process aims to:
Identify potential source of the pollution throughout the life of project
Characterize the potential impacts affecting a target or receptor
Assess the potential of changing likely-hood of impact through Environmental
Management Plan (EMP).
4.1 Sources of Pollution:
Pollutants in the solid, liquid and gases form would be generated during the construction and
operation phase of the project.
Table 12-1: Pollutants generated in construction phase
Construction phase
Sr
No.
Activity Pollutant Frequency
1
Site Preparation,
Excavations,
Construction
activities
Air emissions – SPM, PM10,
CO, NOX, SO2.
Temporary during construction phase
only bulk of the emissions are expected
from ground working and leveling
activities.
Earth/Solid waste Periodic.
Noise Temporary during initial construction
phase.
2
Labor Camps
Sewage Temporary-during the initial
construction phase
Solid waste Temporary-during the initial
construction phase
4.1 Impact on Land Environment
The project site is flat and sloppy terrain. The development of resort on the land has been
conceptualized considering the slope & contour of the land. No flattening of the slope of the
land for development of resort villas is proposed. Development of resort villas are proposed on
wooden frame fitted on RCC piles. Rainwater Harvesting tank and bio-digester tank would be
fitted under each villa units, for which, minimum alteration of slope of the land is proposed.
During the construction period, if the construction is debris is left on site, it will lead to
degradation of the land temporarily.
62
Mitigation Measures:
Altogether flattening of the hill slops shall be strictly avoided. Construction on steep
slope shall be avoided.
All the care shall be taken where adequate alteration of the slope is proposed for
development of resort units, in order to avoid the instability of the slope.
Construction material for the resort shall not procure from excavation of the hill and
sloppy terrain of the land area.
Tree plantation shall be carried out in the project area.
Proper drain will be provided to collect the rainwater during the monsoon to prevent the
soil erosion.
All the borrow pits would be properly levelled, so that no isolated pools and puddles
are left over once water dries up.
Waste management plans as per the MPCB norms will be strictly followed to prevent
spills and leakage into the soil.
All the construction materials will be disposed as per MPCB norms.
4.2 Impact on Soil and Geology
Contamination of soils is anticipated due to poor storage and management of solid and liquid
wastes. All these impacts might be permanent if not remediated. Furthermore, contamination
of soils may occur as a result of spillage of fuels, lubricant chemicals, sanitary wastewater, etc.,
as well as from leakage from inadequately protected solid waste storage facilities and sites.
Mitigation Measures :
Proper planning of works and work design (avoid some works in rainy seasons), to avoid
or minimize erosion.
Planting of vegetation on barren and/or sloping surfaces.
Channel runoff from hardened surfaces to well designed and properly maintained drains.
Special care should be taken not to cause spreading of erosion material over the non-
project areas.
Collection of sewage/solid waste/construction waste
4.3 Potential Impact on Water Quality
The resort at the Chandranagar village is proposed at much higher elevation than the water
table. Thus, there will not be any contamination of the ground water. The impacts envisaged
on the surface and ground water quality of the area, during construction phase is the accidental
spillage of oil or fuel from construction machinery that may run off into near-by surface and
groundwater water bodies and/or uncontrolled liquid effluents from construction site or the
labour composites.
63
Further, the construction of the resort is wooden, except for concrete construction of piles,
Rainwater harvesting and Biodigester tank. Hence, there will be minimum requirement of
water during construction phase of the project, for which existing bore wells would be used.
Mitigation Measures:
Dumping of the construction debris, loose soil and other construction in sea water shall
be prohibited.
No existing resources/water sources (surface/groundwater), which are currently being
used by the villagers for the purpose of obtaining drinking water and/or water for
irrigation or other purposes.
Every effort shall be made to treat and reuse the wastewater from the washing and other
construction activity shall be treated.
During operation phase of the project adequate capacity of the sewage treatment facility
shall be installed. Exploration for nature friendly design& technology of the STP shall be
done considering the unique flat and sloppy nature of the project site. Since, the resort is
conceptualized as eco-friendly resort, it will be appropriate to explore the nature friendly
STP such as Phytorid based STP, rather than conventional STP.
Drinking water requirements during the construction phase shall be met through tankers
to the construction sites.
Local people will be employed; there will be no labour camps on the site. Drinking water
requirements during the construction phase shall be met through tankers to the
construction sites.
4.4 Impact on Noise Environment
4.4.1 During construction phase
During construction phase, there will be likely rise in ambient noise level due to sound of
machinery, equipments and plying of vehicles for transportation of material. It will affect the
personnel operating the machines. However this will be short term impacts and will be
restricted to construction phase only.
4.4.2 During operation phase
Vehicular traffic and use of DG sets in case of power failure will be main cause behind the
impact on noise during the operation phase of the project. Proper traffic management systems
will help in minimizing the noise impacts and DG sets with acoustic enclosures will be
procured for operational phase. Also plantation of trees in the project area and along the roads
will help to act as a buffer zone attenuating the noise.
Mitigation measures:
Noise should be best abated at source by choosing machinery and equipment suitably, by
proper mounting of equipment & ventilation systems and by providing noise insulating
enclosures or padding where practicable. The equipments to be procured should be new and as
such the noise emission will be optimal for their design/operation. Proper
maintenance/working should be done which keeps the noise levels within limits. There shall
be sound parking plan for the tourists vehicles, during operation phase of the project.
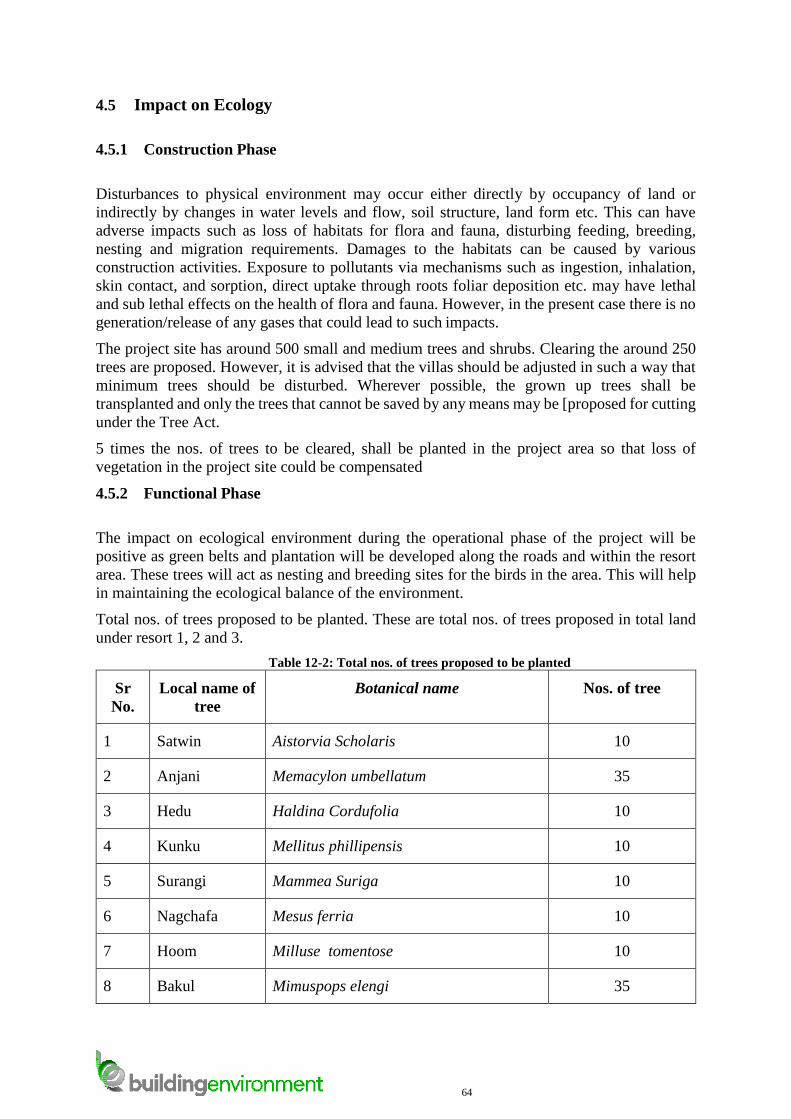
64
4.5 Impact on Ecology
4.5.1 Construction Phase
Disturbances to physical environment may occur either directly by occupancy of land or
indirectly by changes in water levels and flow, soil structure, land form etc. This can have
adverse impacts such as loss of habitats for flora and fauna, disturbing feeding, breeding,
nesting and migration requirements. Damages to the habitats can be caused by various
construction activities. Exposure to pollutants via mechanisms such as ingestion, inhalation,
skin contact, and sorption, direct uptake through roots foliar deposition etc. may have lethal
and sub lethal effects on the health of flora and fauna. However, in the present case there is no
generation/release of any gases that could lead to such impacts.
The project site has around 500 small and medium trees and shrubs. Clearing the around 250
trees are proposed. However, it is advised that the villas should be adjusted in such a way that
minimum trees should be disturbed. Wherever possible, the grown up trees shall be
transplanted and only the trees that cannot be saved by any means may be [proposed for cutting
under the Tree Act.
5 times the nos. of trees to be cleared, shall be planted in the project area so that loss of
vegetation in the project site could be compensated
4.5.2 Functional Phase
The impact on ecological environment during the operational phase of the project will be
positive as green belts and plantation will be developed along the roads and within the resort
area. These trees will act as nesting and breeding sites for the birds in the area. This will help
in maintaining the ecological balance of the environment.
Total nos. of trees proposed to be planted. These are total nos. of trees proposed in total land
under resort 1, 2 and 3.
Table 12-2: Total nos. of trees proposed to be planted
Sr
No.
Local name of
tree
Botanical name Nos. of tree
1 Satwin Aistorvia Scholaris 10
2 Anjani Memacylon umbellatum 35
3 Hedu Haldina Cordufolia 10
4 Kunku Mellitus phillipensis 10
5 Surangi Mammea Suriga 10
6 Nagchafa Mesus ferria 10
7 Hoom Milluse tomentose 10
8 Bakul Mimuspops elengi 35
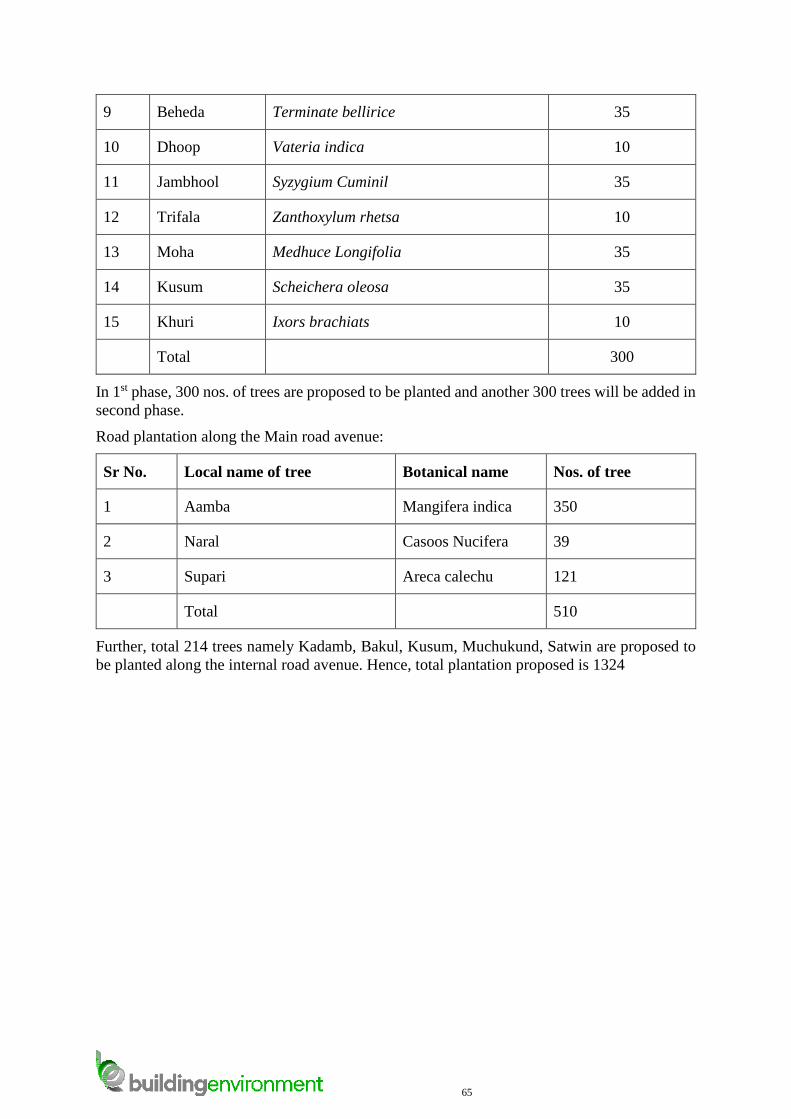
65
9 Beheda Terminate bellirice 35
10 Dhoop Vateria indica 10
11 Jambhool Syzygium Cuminil 35
12 Trifala Zanthoxylum rhetsa 10
13 Moha Medhuce Longifolia 35
14 Kusum Scheichera oleosa 35
15 Khuri Ixors brachiats 10
Total 300
In 1st phase, 300 nos. of trees are proposed to be planted and another 300 trees will be added in
second phase.
Road plantation along the Main road avenue:
Sr No. Local name of tree Botanical name Nos. of tree
1 Aamba Mangifera indica 350
2 Naral Casoos Nucifera 39
3 Supari Areca calechu 121
Total 510
Further, total 214 trees namely Kadamb, Bakul, Kusum, Muchukund, Satwin are proposed to
be planted along the internal road avenue. Hence, total plantation proposed is 1324
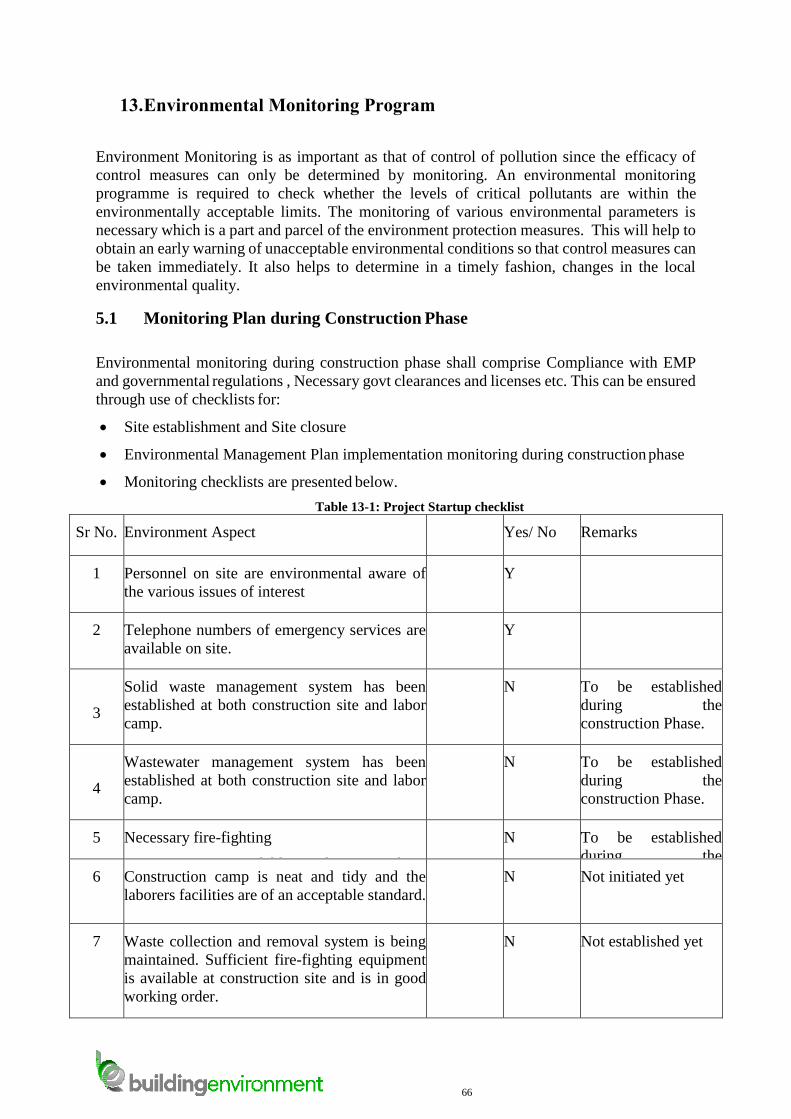
66
13. Environmental Monitoring Program
Environment Monitoring is as important as that of control of pollution since the efficacy of
control measures can only be determined by monitoring. An environmental monitoring
programme is required to check whether the levels of critical pollutants are within the
environmentally acceptable limits. The monitoring of various environmental parameters is
necessary which is a part and parcel of the environment protection measures. This will help to
obtain an early warning of unacceptable environmental conditions so that control measures can
be taken immediately. It also helps to determine in a timely fashion, changes in the local
environmental quality.
5.1 Monitoring Plan during Construction Phase
Environmental monitoring during construction phase shall comprise Compliance with EMP
and governmental regulations , Necessary govt clearances and licenses etc. This can be ensured
through use of checklists for:
Site establishment and Site closure
Environmental Management Plan implementation monitoring during construction phase
Monitoring checklists are presented below.
Table 13-1: Project Startup checklist
Sr No. Environment Aspect Yes/ No Remarks
1 Personnel on site are environmental aware of
the various issues of interest
Y
2 Telephone numbers of emergency services are
available on site.
Y
3
Solid waste management system has been
established at both construction site and labor
camp.
N To be established
during the
construction Phase.
4
Wastewater management system has been
established at both construction site and labor
camp.
N To be established
during the
construction Phase.
5 Necessary fire-fighting
equipment is available and in working
condition
N To be established
during the
construction Phase. 6 Construction camp is neat and tidy and the
laborers facilities are of an acceptable standard.
N Not initiated yet
7 Waste collection and removal system is being
maintained. Sufficient fire-fighting equipment
is available at construction site and is in good
working order.
N Not established yet
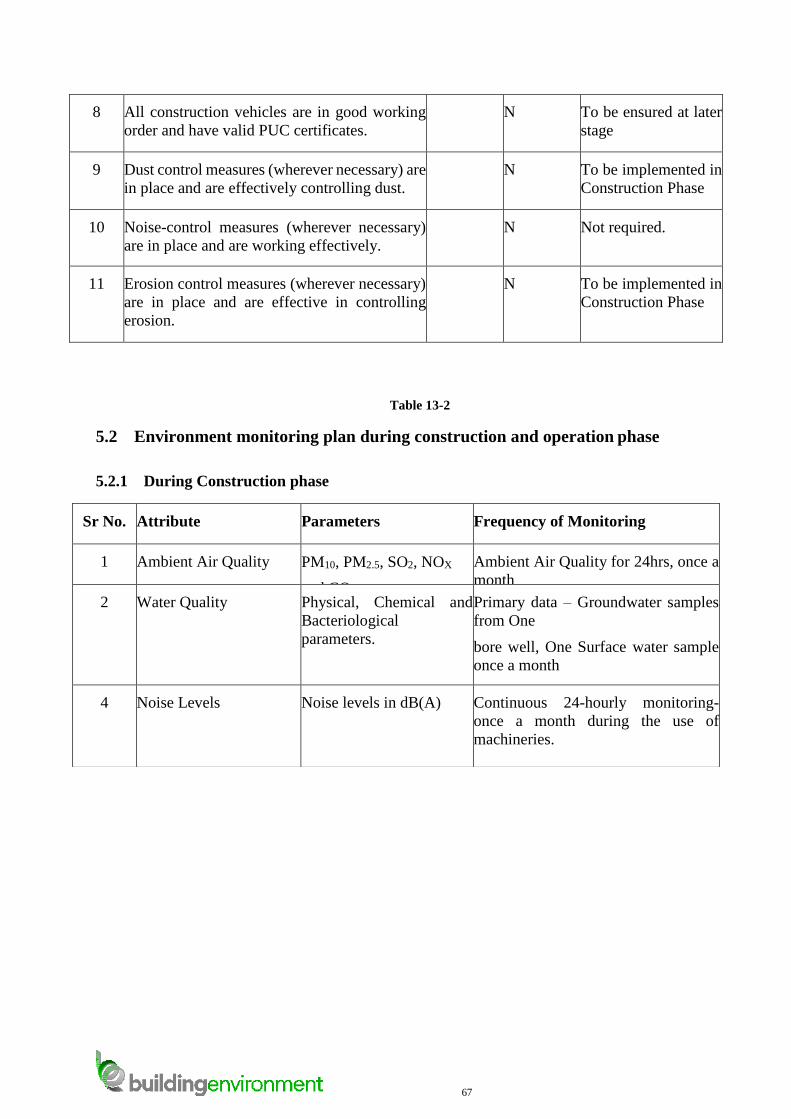
67
8 All construction vehicles are in good working
order and have valid PUC certificates.
N To be ensured at later
stage
9 Dust control measures (wherever necessary) are
in place and are effectively controlling dust.
N To be implemented in
Construction Phase
10 Noise-control measures (wherever necessary)
are in place and are working effectively.
N Not required.
11 Erosion control measures (wherever necessary)
are in place and are effective in controlling
erosion.
N To be implemented in
Construction Phase
Table 13-2
5.2 Environment monitoring plan during construction and operation phase
5.2.1 During Construction phase
Sr No. Attribute Parameters Frequency of Monitoring
1 Ambient Air Quality PM10, PM2.5, SO2, NOX
and CO
Ambient Air Quality for 24hrs, once a
month
2 Water Quality Physical, Chemical and
Bacteriological
parameters.
Primary data – Groundwater samples
from One
bore well, One Surface water sample
once a month
4 Noise Levels Noise levels in dB(A) Continuous 24-hourly monitoring-
once a month during the use of
machineries.
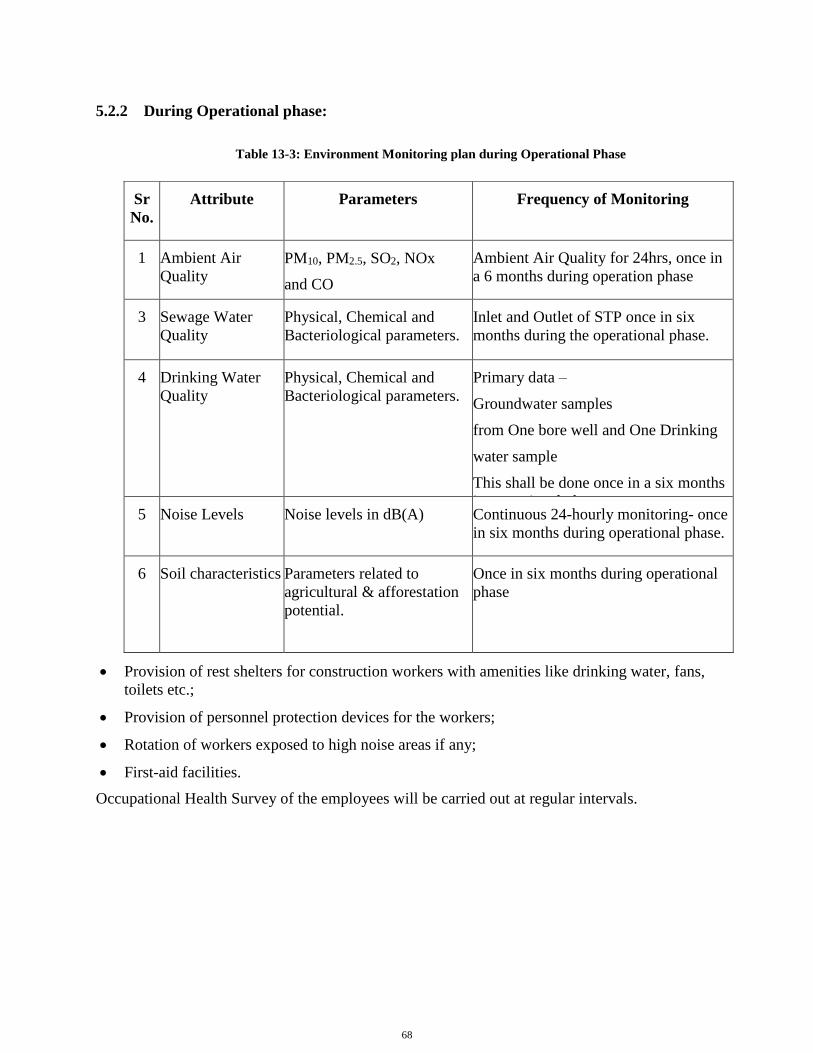
68
5.2.2 During Operational phase:
Table 13-3: Environment Monitoring plan during Operational Phase
Provision of rest shelters for construction workers with amenities like drinking water, fans,
toilets etc.;
Provision of personnel protection devices for the workers;
Rotation of workers exposed to high noise areas if any;
First-aid facilities.
Occupational Health Survey of the employees will be carried out at regular intervals.
Sr
No.
Attribute Parameters Frequency of Monitoring
1 Ambient Air
Quality PM10, PM2.5, SO2, NOx
and CO
Ambient Air Quality for 24hrs, once in
a 6 months during operation phase
3 Sewage Water
Quality
Physical, Chemical and
Bacteriological parameters.
Inlet and Outlet of STP once in six
months during the operational phase.
4 Drinking Water
Quality
Physical, Chemical and
Bacteriological parameters.
Primary data –
Groundwater samples
from One bore well and One Drinking
water sample
This shall be done once in a six months
in operational phase 5 Noise Levels Noise levels in dB(A) Continuous 24-hourly monitoring- once
in six months during operational phase.
6 Soil characteristics Parameters related to
agricultural & afforestation
potential.
Once in six months during operational
phase
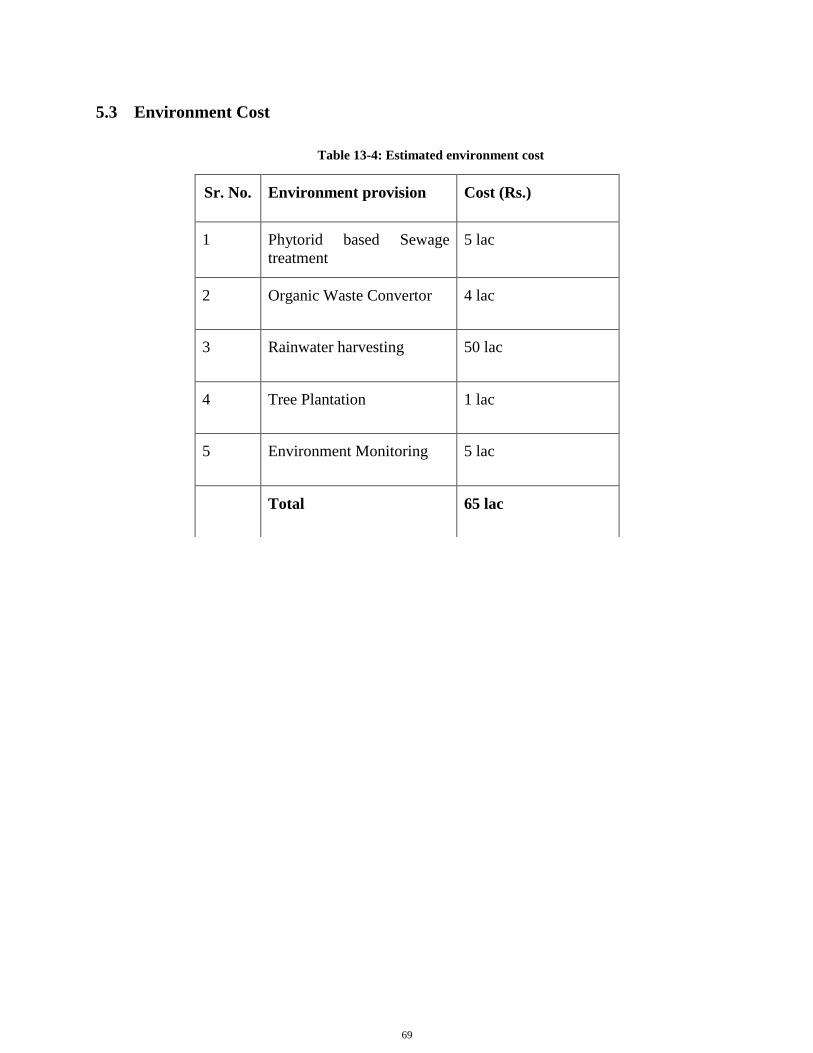
69
5.3 Environment Cost
Table 13-4: Estimated environment cost
Sr. No. Environment provision Cost (Rs.)
1 Phytorid based Sewage
treatment
5 lac
2 Organic Waste Convertor 4 lac
3 Rainwater harvesting 50 lac
4 Tree Plantation 1 lac
5 Environment Monitoring 5 lac
Total 65 lac
70
14. Project Benefit
We envisage some of the benefit of the project:
Development of Eco-friendly resort will attract domestic and foreign tourists, which in turn
will generate the employment for the local people residing in the area.
The project will be boost to tourism sector of the State of Maharashtra.
With direct employment and of indirect employment opportunities it is expected that the
monthly expenditure for daily activities like purchase of milk, vegetables, grocery,
consumables and other domestic requirement will be met from the local area. Thus there will
be rotation of funds in the local area on monthly basis which will also help in improving the
economy of local area.
With improvement in local economy and with increase in employment opportunities there
will be overall improvement in standard of living of the local people.
As a part of local area development and creating employment potential new employment
opportunities will be created through imparting vocational training to unemployed youth and
eligible people.
There will be significant change in the socio-economic scenario of the area. It will upgrade
the local economy of the area and purchasing power of local people
Increased revenue to the State Government.
71
15. Environment Management Plan
In order to avoid and minimize adverse impacts of the development and maximize the positive,
the EMP should be incorporated into overall planning and implementation phase. The EMP
integrates the baseline conditions, impacts likely to occur, and the supportive and assimilative
capacity of the system. The Environmental Management Plan (EMP) for the proposed
Chandranagar resort are classified into following categories:
Land environment
Water environment
Air Environment
Noise Environment
General precautionary measures shall be adopted at all time, which includes:
Persons working near the noise generation equipments shall use Personal Protective
Equipment such as earplugs muffs
All workers should be made aware of adverse effect high noise levels through training
program; this will ensure proper implementation of mitigation measures
All sanitary facilities shall be properly maintained all the wastes generated shall be
treated and disposed as per norms.
7.1 Land Environment
The project envisages no acquisition of land. Following measures are recommended to minimize
adverse impacts on Environment:
It must be ensured that no hill cutting is proposed outright. Development of resort
structures should be in syn with the hill slopes, for that bare minimum flattening of the
hill surface is required.
The topography of the land should be maintained.
Tree cutting is involved in the project. Hence, Tree plantation shall be done in substantial
number
Eco-friendly material should be used for the steps to resort.
7.2 Management of Solid Waste
Project proponent will explore opportunity to recycle the waste generated at the project site, in this
context project will identify authorized vendors and send used batteries, used oil, and used oil
filters for recycling. Adequate facilities for collection, conveyance and disposal of solid waste will
be developed.
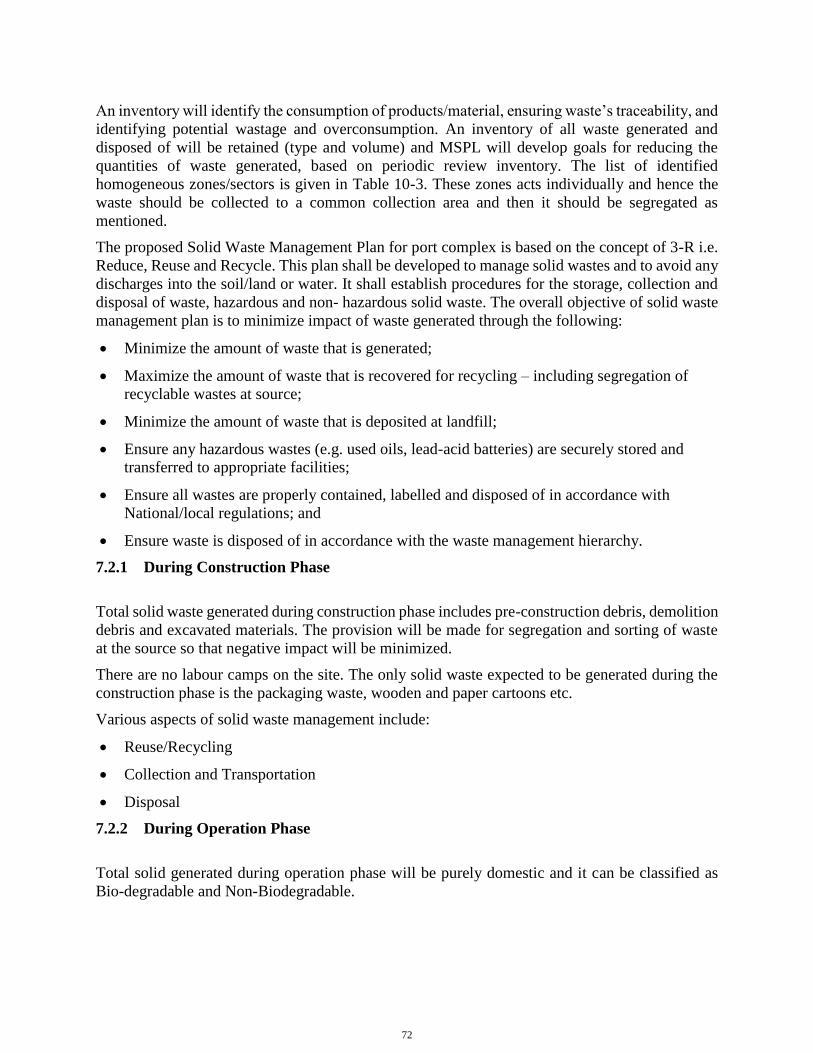
72
An inventory will identify the consumption of products/material, ensuring waste’s traceability, and
identifying potential wastage and overconsumption. An inventory of all waste generated and
disposed of will be retained (type and volume) and MSPL will develop goals for reducing the
quantities of waste generated, based on periodic review inventory. The list of identified
homogeneous zones/sectors is given in Table 10-3. These zones acts individually and hence the
waste should be collected to a common collection area and then it should be segregated as
mentioned.
The proposed Solid Waste Management Plan for port complex is based on the concept of 3-R i.e.
Reduce, Reuse and Recycle. This plan shall be developed to manage solid wastes and to avoid any
discharges into the soil/land or water. It shall establish procedures for the storage, collection and
disposal of waste, hazardous and non- hazardous solid waste. The overall objective of solid waste
management plan is to minimize impact of waste generated through the following:
Minimize the amount of waste that is generated;
Maximize the amount of waste that is recovered for recycling – including segregation of
recyclable wastes at source;
Minimize the amount of waste that is deposited at landfill;
Ensure any hazardous wastes (e.g. used oils, lead-acid batteries) are securely stored and
transferred to appropriate facilities;
Ensure all wastes are properly contained, labelled and disposed of in accordance with
National/local regulations; and
Ensure waste is disposed of in accordance with the waste management hierarchy.
7.2.1 During Construction Phase
Total solid waste generated during construction phase includes pre-construction debris, demolition
debris and excavated materials. The provision will be made for segregation and sorting of waste
at the source so that negative impact will be minimized.
There are no labour camps on the site. The only solid waste expected to be generated during the
construction phase is the packaging waste, wooden and paper cartoons etc.
Various aspects of solid waste management include:
Reuse/Recycling
Collection and Transportation
Disposal
7.2.2 During Operation Phase
Total solid generated during operation phase will be purely domestic and it can be classified as
Bio-degradable and Non-Biodegradable.
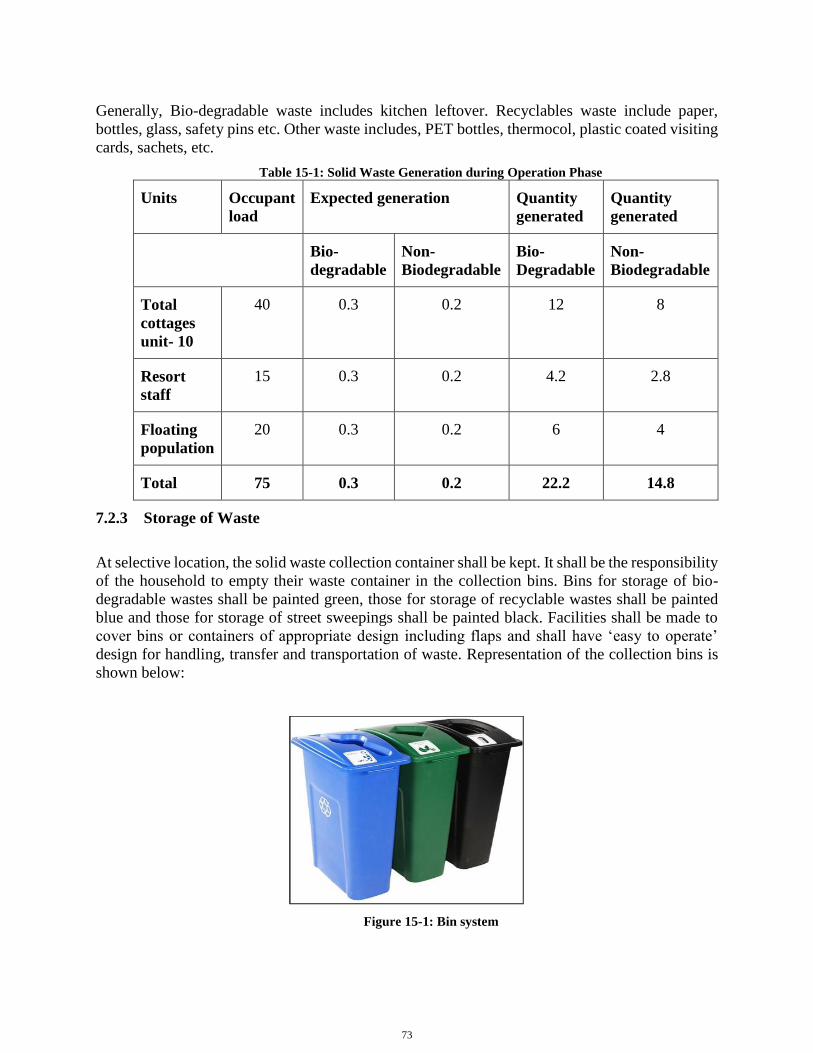
73
Generally, Bio-degradable waste includes kitchen leftover. Recyclables waste include paper,
bottles, glass, safety pins etc. Other waste includes, PET bottles, thermocol, plastic coated visiting
cards, sachets, etc.
Table 15-1: Solid Waste Generation during Operation Phase
Units Occupant
load
Expected generation Quantity
generated
Quantity
generated
Bio-
degradable
Non-
Biodegradable
Bio-
Degradable
Non-
Biodegradable
Total
cottages
unit- 10
40 0.3 0.2 12 8
Resort
staff
15 0.3 0.2 4.2 2.8
Floating
population
20 0.3 0.2 6 4
Total 75 0.3 0.2 22.2 14.8
7.2.3 Storage of Waste
At selective location, the solid waste collection container shall be kept. It shall be the responsibility
of the household to empty their waste container in the collection bins. Bins for storage of bio-
degradable wastes shall be painted green, those for storage of recyclable wastes shall be painted
blue and those for storage of street sweepings shall be painted black. Facilities shall be made to
cover bins or containers of appropriate design including flaps and shall have ‘easy to operate’
design for handling, transfer and transportation of waste. Representation of the collection bins is
shown below:
Figure 15-1: Bin system
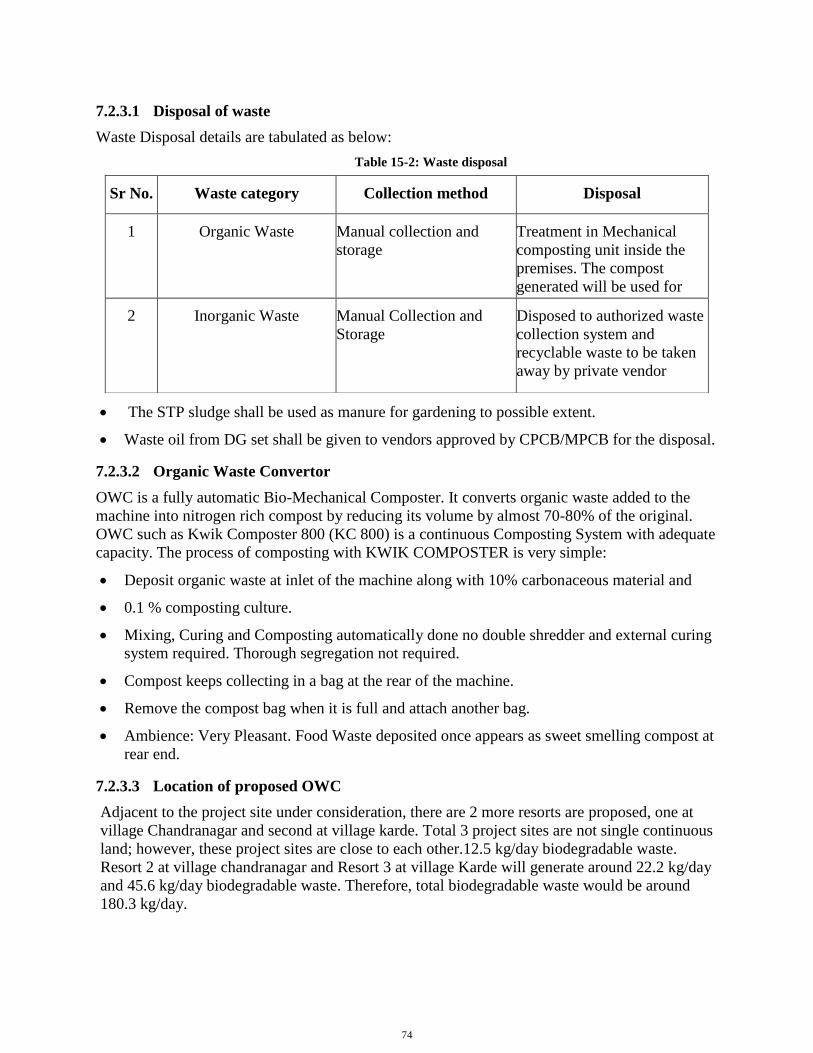
74
7.2.3.1 Disposal of waste
Waste Disposal details are tabulated as below:
Table 15-2: Waste disposal
The STP sludge shall be used as manure for gardening to possible extent.
Waste oil from DG set shall be given to vendors approved by CPCB/MPCB for the disposal.
7.2.3.2 Organic Waste Convertor
OWC is a fully automatic Bio-Mechanical Composter. It converts organic waste added to the
machine into nitrogen rich compost by reducing its volume by almost 70-80% of the original.
OWC such as Kwik Composter 800 (KC 800) is a continuous Composting System with adequate
capacity. The process of composting with KWIK COMPOSTER is very simple:
Deposit organic waste at inlet of the machine along with 10% carbonaceous material and
0.1 % composting culture.
Mixing, Curing and Composting automatically done no double shredder and external curing
system required. Thorough segregation not required.
Compost keeps collecting in a bag at the rear of the machine.
Remove the compost bag when it is full and attach another bag.
Ambience: Very Pleasant. Food Waste deposited once appears as sweet smelling compost at
rear end.
7.2.3.3 Location of proposed OWC
Adjacent to the project site under consideration, there are 2 more resorts are proposed, one at
village Chandranagar and second at village karde. Total 3 project sites are not single continuous
land; however, these project sites are close to each other.12.5 kg/day biodegradable waste.
Resort 2 at village chandranagar and Resort 3 at village Karde will generate around 22.2 kg/day
and 45.6 kg/day biodegradable waste. Therefore, total biodegradable waste would be around
180.3 kg/day.
Sr No. Waste category Collection method Disposal
1 Organic Waste Manual collection and
storage
Treatment in Mechanical
composting unit inside the
premises. The compost
generated will be used for
gardening. 2 Inorganic Waste Manual Collection and
Storage
Disposed to authorized waste
collection system and
recyclable waste to be taken
away by private vendor
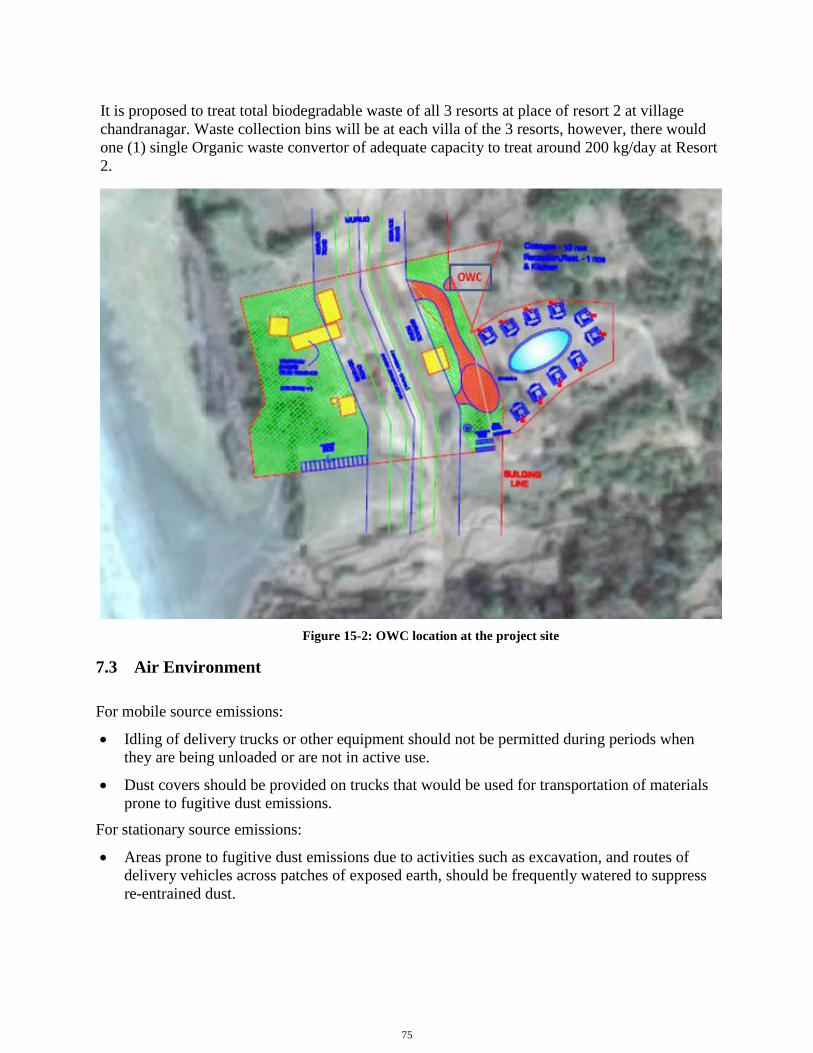
75
It is proposed to treat total biodegradable waste of all 3 resorts at place of resort 2 at village
chandranagar. Waste collection bins will be at each villa of the 3 resorts, however, there would
one (1) single Organic waste convertor of adequate capacity to treat around 200 kg/day at Resort
2.
Figure 15-2: OWC location at the project site
7.3 Air Environment
For mobile source emissions:
Idling of delivery trucks or other equipment should not be permitted during periods when
they are being unloaded or are not in active use.
Dust covers should be provided on trucks that would be used for transportation of materials
prone to fugitive dust emissions.
For stationary source emissions:
Areas prone to fugitive dust emissions due to activities such as excavation, and routes of
delivery vehicles across patches of exposed earth, should be frequently watered to suppress
re-entrained dust.
76
Apart from these, the equipment/machines and vehicles should be always kept in good state
of repair to minimize emissions. Low emission vehicles / equipment should be used
wherever feasible.
7.4 Noise Pollution
During construction phase, the use of construction equipment is the major source of noise. Efforts
will be required to maintain properly functioning equipment and comply with occupational safety
and health standards. The recommended measures are as follows:
Construction equipments shall be properly maintained. Contract should specify use of
equipment generating noise of not greater than 90 dB (A).
Construction Contract Specifications should stipulate levels of maximum noise generation in
various zones (residential, commercial and sensitive) based on CPCB Noise Standards.
During the operational phase noise generation is envisaged due to vehicular movements and DG
sets. Following precautions shall be adopted to maintain the noise levels within the prescribed
limits:
A noise barrier in the form of trees/ green belt shall be developed to attenuate the noise
level.
Proper parking plan for vehicles shall be in place.
Noise from the DG set shall be controlled by providing an acoustic enclosure
7.5 Water Environment
The water supply for the project will be from following source:
Gram Panchayat ( Maharashra Jeevan Pradhikaran Water Scheme)
Existing Bore wells at project site
Rainwater harvesting tanks of capacity 10,000 litre at each villa unit
The Grampanchyat has give the No Objection Certificate for water supply for domestic purpose
as per availability.
During operation phase, the sewage generated from the resort shall be treated in Sewage
treatment plan and treated water shall be used for flushing and gardening.
Drinking water facilities and waste disposal facilities if any will be located away from
each other.
Rainwater Harvesting System
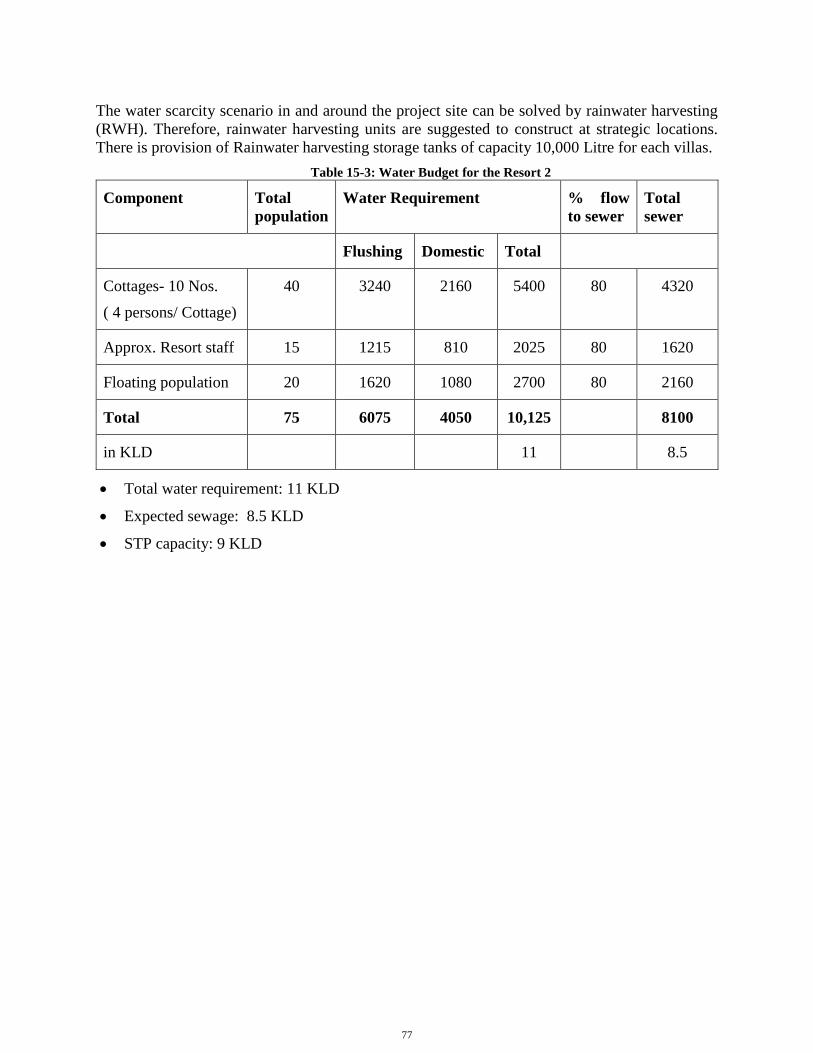
77
The water scarcity scenario in and around the project site can be solved by rainwater harvesting
(RWH). Therefore, rainwater harvesting units are suggested to construct at strategic locations.
There is provision of Rainwater harvesting storage tanks of capacity 10,000 Litre for each villas.
Table 15-3: Water Budget for the Resort 2
Component Total
population
Water Requirement % flow
to sewer
Total
sewer
Flushing Domestic Total
Cottages- 10 Nos.
( 4 persons/ Cottage)
40 3240 2160 5400 80 4320
Approx. Resort staff 15 1215 810 2025 80 1620
Floating population 20 1620 1080 2700 80 2160
Total 75 6075 4050 10,125 8100
in KLD 11 8.5
Total water requirement: 11 KLD
Expected sewage: 8.5 KLD
STP capacity: 9 KLD
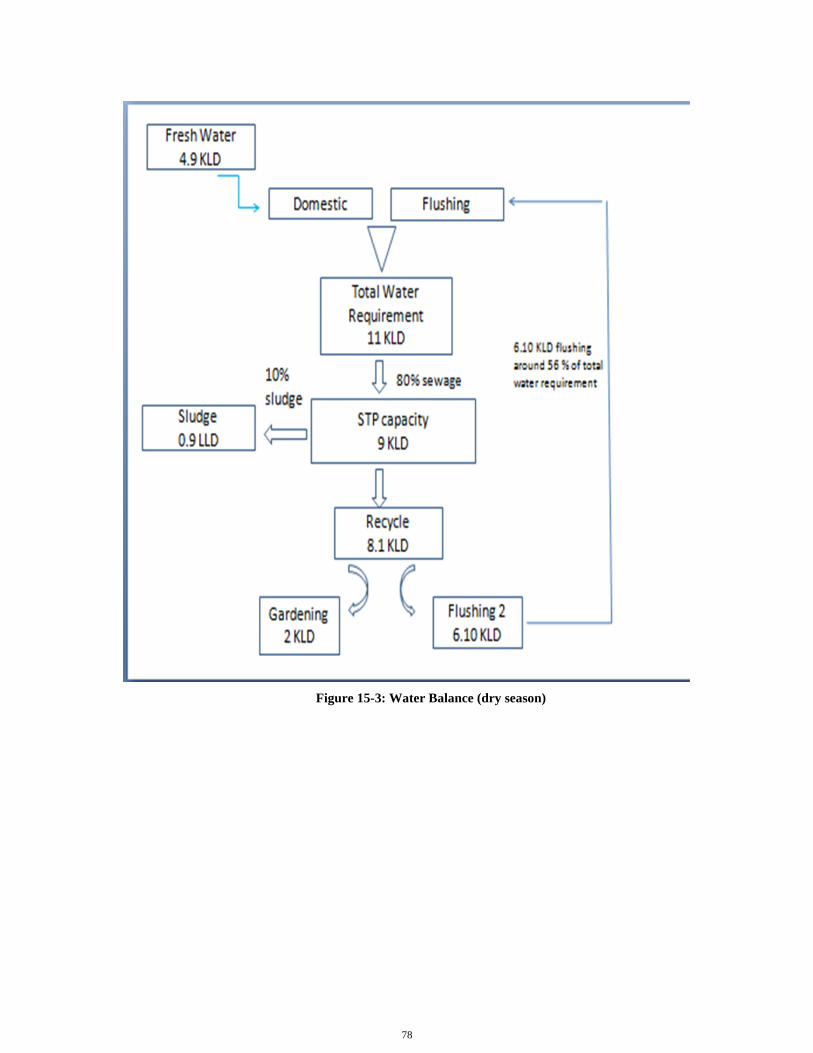
78
Figure 15-3: Water Balance (dry season)
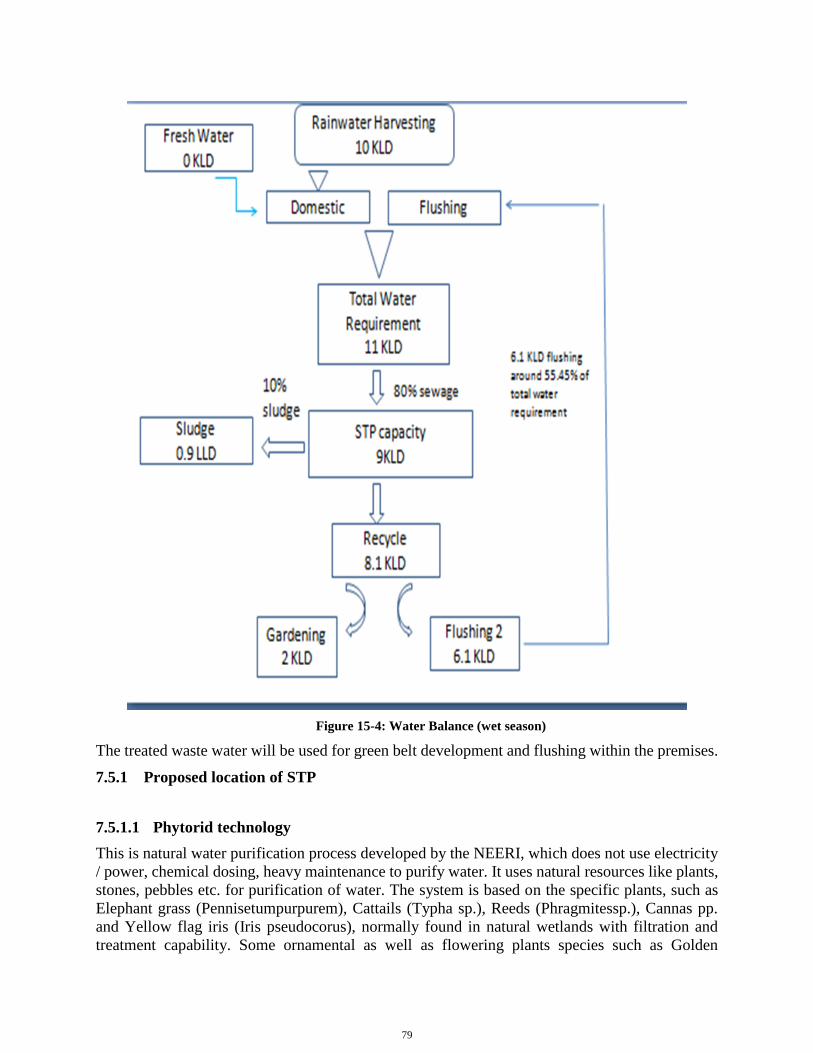
79
Figure 15-4: Water Balance (wet season)
The treated waste water will be used for green belt development and flushing within the premises.
7.5.1 Proposed location of STP
7.5.1.1 Phytorid technology
This is natural water purification process developed by the NEERI, which does not use electricity
/ power, chemical dosing, heavy maintenance to purify water. It uses natural resources like plants,
stones, pebbles etc. for purification of water. The system is based on the specific plants, such as
Elephant grass (Pennisetumpurpurem), Cattails (Typha sp.), Reeds (Phragmitessp.), Cannas pp.
and Yellow flag iris (Iris pseudocorus), normally found in natural wetlands with filtration and
treatment capability. Some ornamental as well as flowering plants species such as Golden
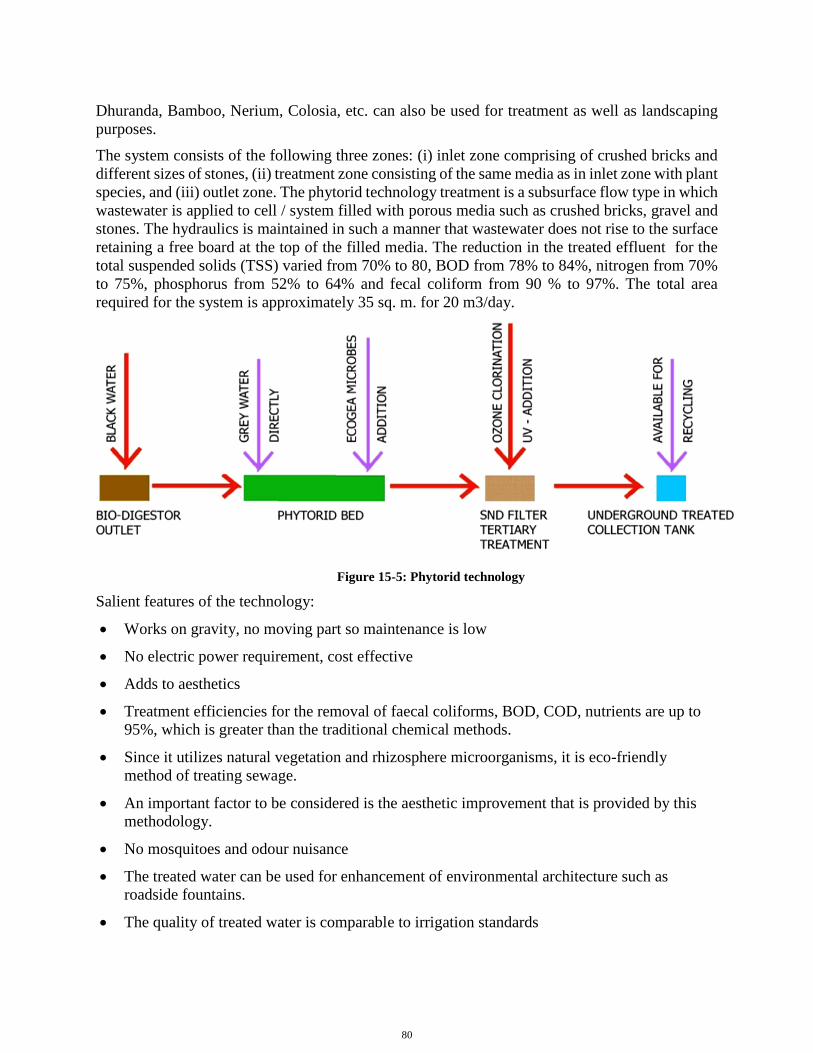
80
Dhuranda, Bamboo, Nerium, Colosia, etc. can also be used for treatment as well as landscaping
purposes.
The system consists of the following three zones: (i) inlet zone comprising of crushed bricks and
different sizes of stones, (ii) treatment zone consisting of the same media as in inlet zone with plant
species, and (iii) outlet zone. The phytorid technology treatment is a subsurface flow type in which
wastewater is applied to cell / system filled with porous media such as crushed bricks, gravel and
stones. The hydraulics is maintained in such a manner that wastewater does not rise to the surface
retaining a free board at the top of the filled media. The reduction in the treated effluent for the
total suspended solids (TSS) varied from 70% to 80, BOD from 78% to 84%, nitrogen from 70%
to 75%, phosphorus from 52% to 64% and fecal coliform from 90 % to 97%. The total area
required for the system is approximately 35 sq. m. for 20 m3/day.
Figure 15-5: Phytorid technology
Salient features of the technology:
Works on gravity, no moving part so maintenance is low
No electric power requirement, cost effective
Adds to aesthetics
Treatment efficiencies for the removal of faecal coliforms, BOD, COD, nutrients are up to
95%, which is greater than the traditional chemical methods.
Since it utilizes natural vegetation and rhizosphere microorganisms, it is eco-friendly
method of treating sewage.
An important factor to be considered is the aesthetic improvement that is provided by this
methodology.
No mosquitoes and odour nuisance
The treated water can be used for enhancement of environmental architecture such as
roadside fountains.
The quality of treated water is comparable to irrigation standards
81
7.6 Green Belt Development
Green belt development in the project area is proposed, this will go a long way to protect
environment and mitigate pollution levels in the area.
Depending upon the topo-climatological conditions and regional ecological status, selection of the
appropriate plant species has been made. The various criteria adopted for selecting the species for
greenbelt development are:
Plants should be fast growing;
Preferably perennial and evergreen;
Indigenous;
Should maintain the ecological and hydrological balance of the region. The general
considerations involved while developing the greenbelt are:
Trees should also be planted along the roadside.
Generally fast growing trees should be planted.
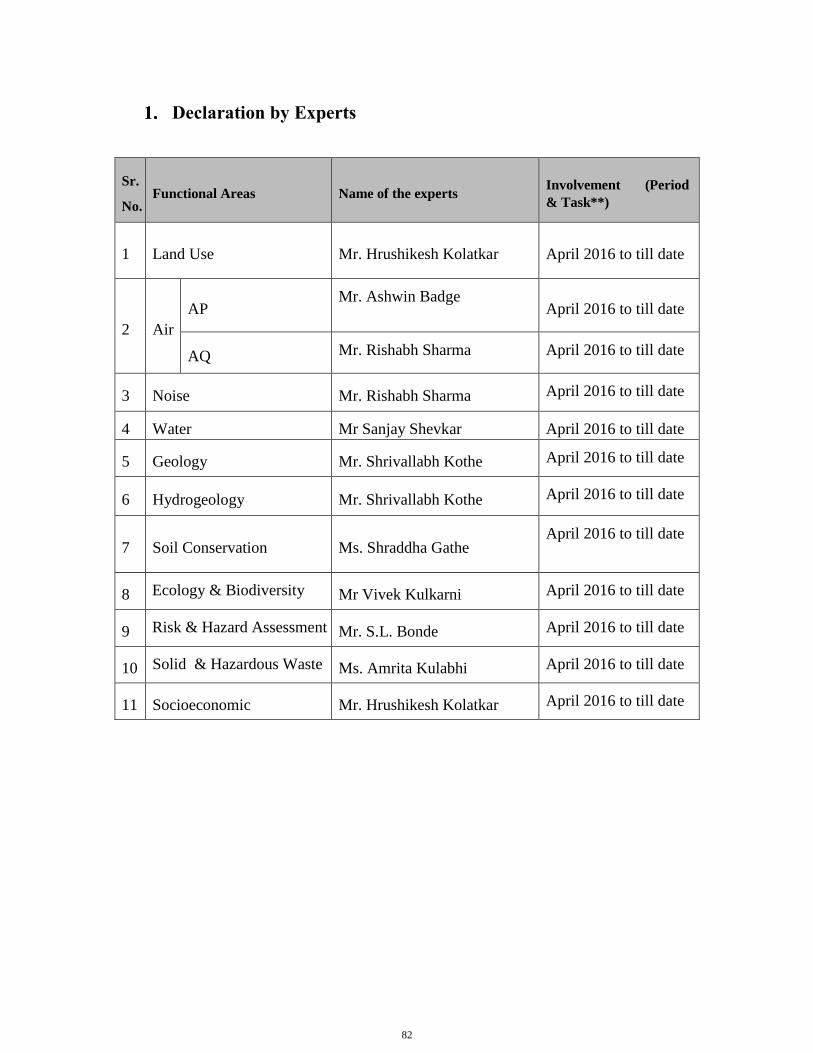
82
Declaration by Experts
Sr.
No. Functional Areas Name of the experts
Involvement (Period
& Task**)
1 Land Use Mr. Hrushikesh Kolatkar April 2016 to till date
2 Air
AP Mr. Ashwin Badge
April 2016 to till date
AQ Mr. Rishabh Sharma April 2016 to till date
3 Noise Mr. Rishabh Sharma April 2016 to till date
4 Water Mr Sanjay Shevkar April 2016 to till date
5 Geology Mr. Shrivallabh Kothe April 2016 to till date
6 Hydrogeology Mr. Shrivallabh Kothe April 2016 to till date
7 Soil Conservation Ms. Shraddha Gathe April 2016 to till date
8 Ecology & Biodiversity Mr Vivek Kulkarni April 2016 to till date
9 Risk & Hazard Assessment Mr. S.L. Bonde April 2016 to till date
10 Solid & Hazardous Waste Ms. Amrita Kulabhi April 2016 to till date
11 Socioeconomic Mr. Hrushikesh Kolatkar April 2016 to till date
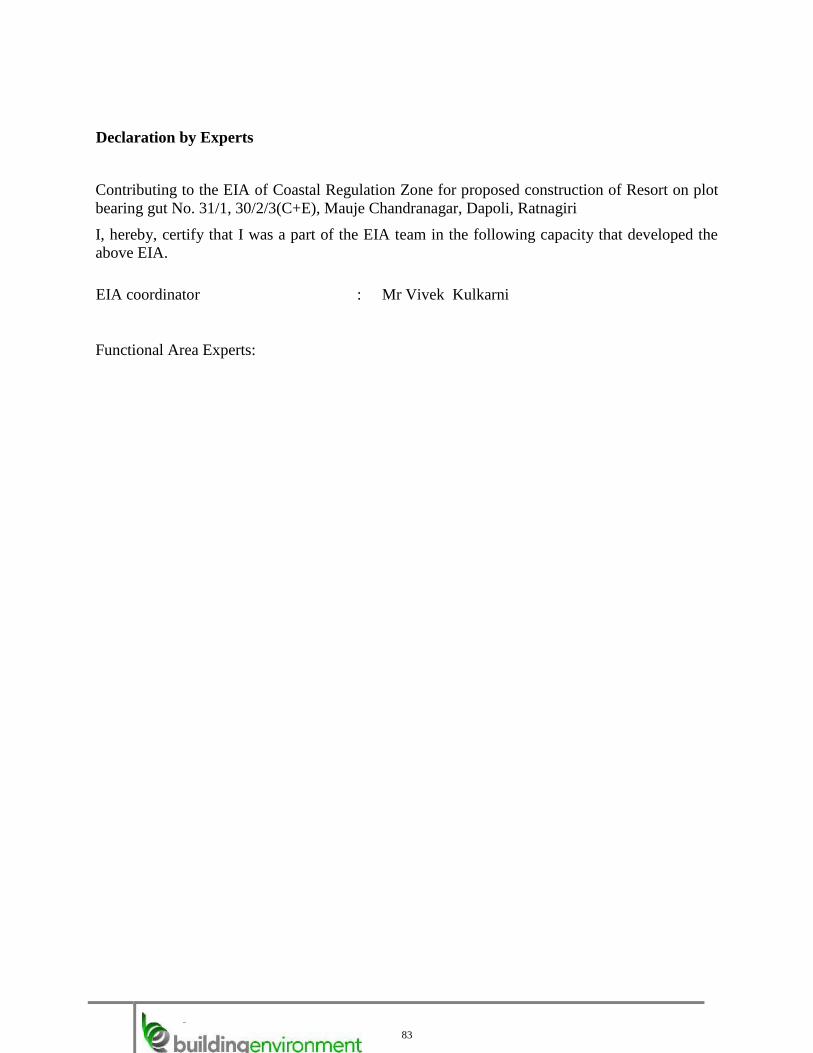
83
Declaration by Experts
Contributing to the EIA of Coastal Regulation Zone for proposed construction of Resort on plot
bearing gut No. 31/1, 30/2/3(C+E), Mauje Chandranagar, Dapoli, Ratnagiri
I, hereby, certify that I was a part of the EIA team in the following capacity that developed the
above EIA.
EIA coordinator : Mr Vivek Kulkarni
Functional Area Experts:
-
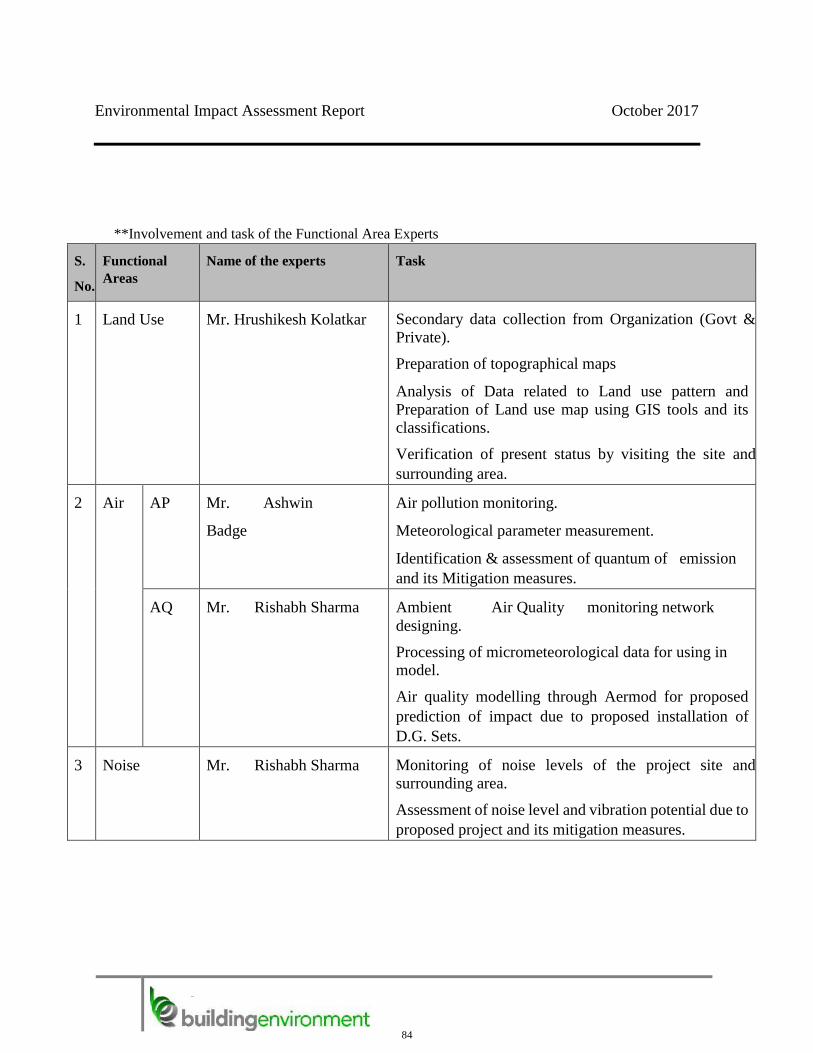
84
Environmental Impact Assessment Report October 2017
**Involvement and task of the Functional Area Experts
S.
No.
Functional
Areas Name of the experts Task
1 Land Use Mr. Hrushikesh Kolatkar Secondary data collection from Organization (Govt &
Private).
Preparation of topographical maps
Analysis of Data related to Land use pattern and
Preparation of Land use map using GIS tools and its
classifications.
Verification of present status by visiting the site and
surrounding area.
2 Air AP Mr. Ashwin
Badge
Air pollution monitoring.
Meteorological parameter measurement.
Identification & assessment of quantum of emission
and its Mitigation measures.
AQ Mr. Rishabh Sharma Ambient Air Quality monitoring network
designing.
Processing of micrometeorological data for using in model.
Air quality modelling through Aermod for proposed
prediction of impact due to proposed installation of
D.G. Sets.
3 Noise Mr. Rishabh Sharma Monitoring of noise levels of the project site and
surrounding area.
Assessment of noise level and vibration potential due to
proposed project and its mitigation measures.
-
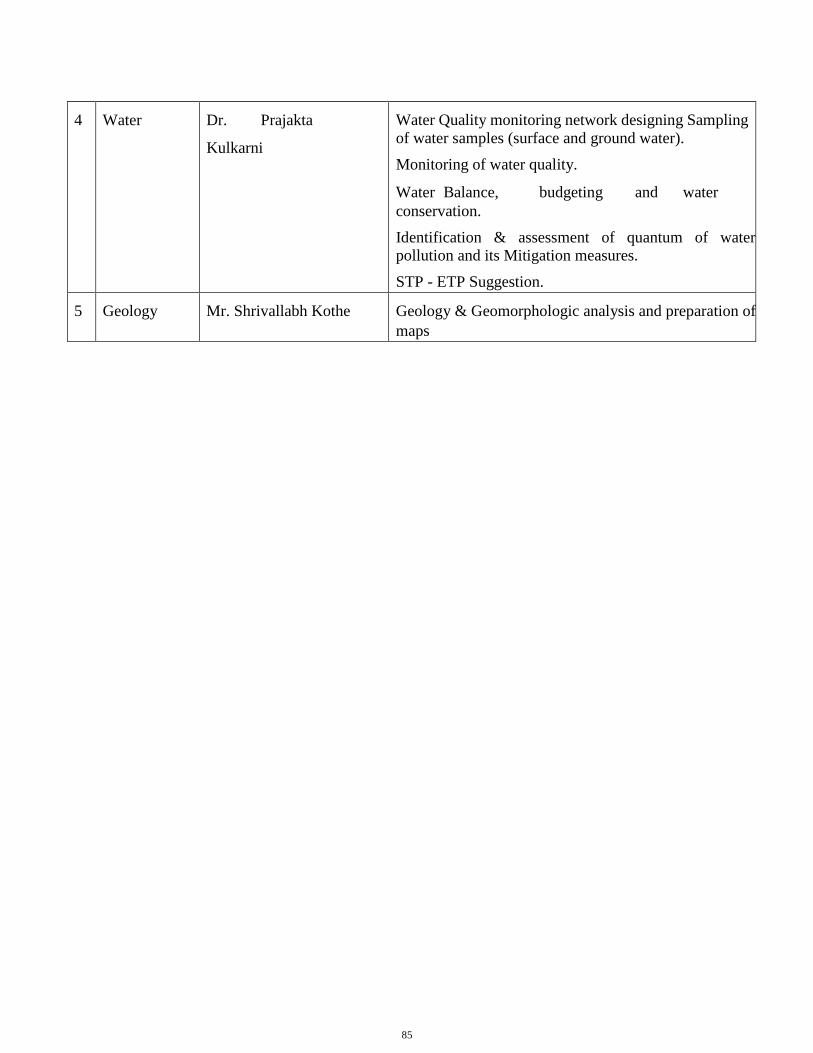
85
4 Water Dr. Prajakta
Kulkarni
Water Quality monitoring network designing Sampling
of water samples (surface and ground water).
Monitoring of water quality.
Water Balance, budgeting and water
conservation.
Identification & assessment of quantum of water pollution and its Mitigation measures.
STP - ETP Suggestion.
5 Geology Mr. Shrivallabh Kothe Geology & Geomorphologic analysis and preparation of
maps
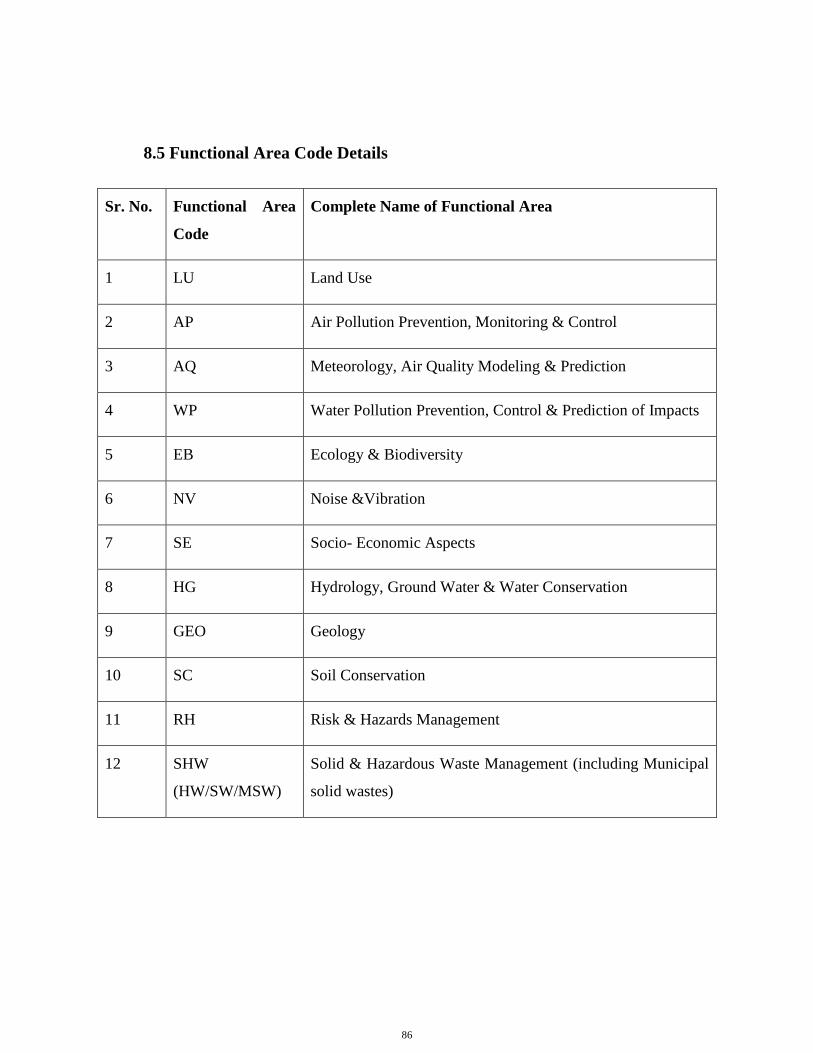
86
8.5 Functional Area Code Details
Sr. No. Functional Area
Code
Complete Name of Functional Area
1 LU Land Use
2 AP Air Pollution Prevention, Monitoring & Control
3 AQ Meteorology, Air Quality Modeling & Prediction
4 WP Water Pollution Prevention, Control & Prediction of Impacts
5 EB Ecology & Biodiversity
6 NV Noise &Vibration
7 SE Socio- Economic Aspects
8 HG Hydrology, Ground Water & Water Conservation
9 GEO Geology
10 SC Soil Conservation
11 RH Risk & Hazards Management
12 SHW
(HW/SW/MSW)
Solid & Hazardous Waste Management (including Municipal
solid wastes)
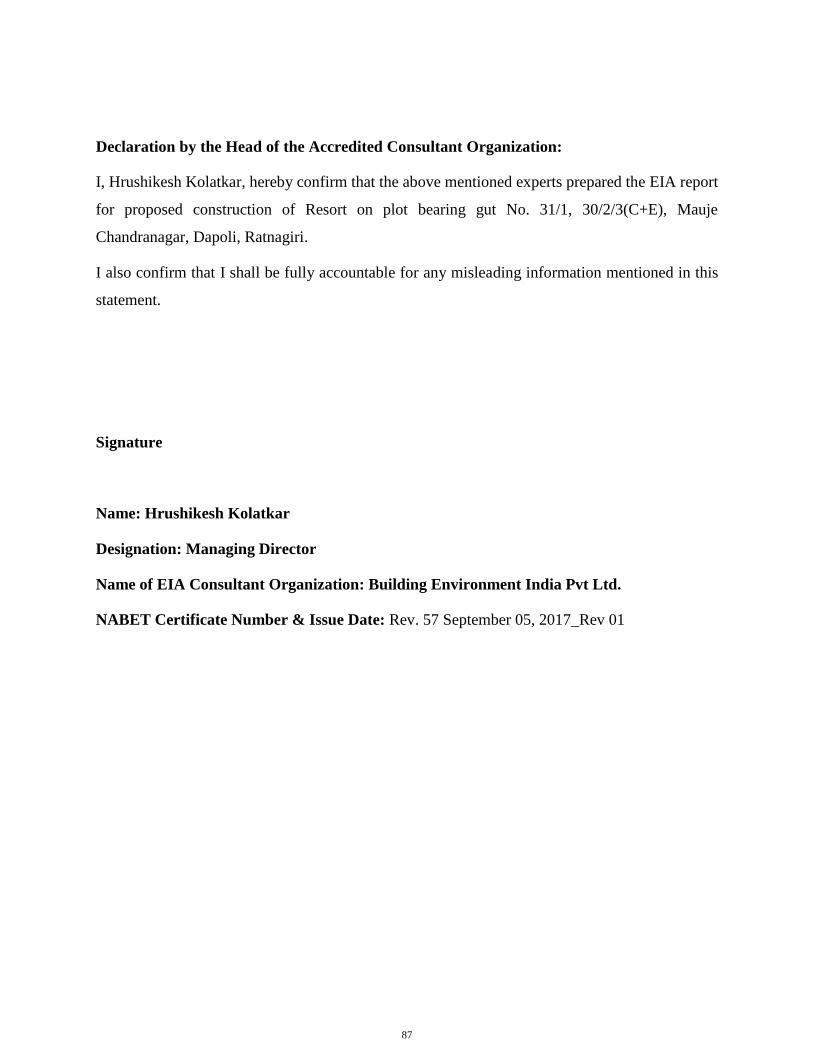
87
Declaration by the Head of the Accredited Consultant Organization:
I, Hrushikesh Kolatkar, hereby confirm that the above mentioned experts prepared the EIA report
for proposed construction of Resort on plot bearing gut No. 31/1, 30/2/3(C+E), Mauje
Chandranagar, Dapoli, Ratnagiri.
I also confirm that I shall be fully accountable for any misleading information mentioned in this
statement.
Signature
Name: Hrushikesh Kolatkar
Designation: Managing Director
Name of EIA Consultant Organization: Building Environment India Pvt Ltd.
NABET Certificate Number & Issue Date: Rev. 57 September 05, 2017_Rev 01
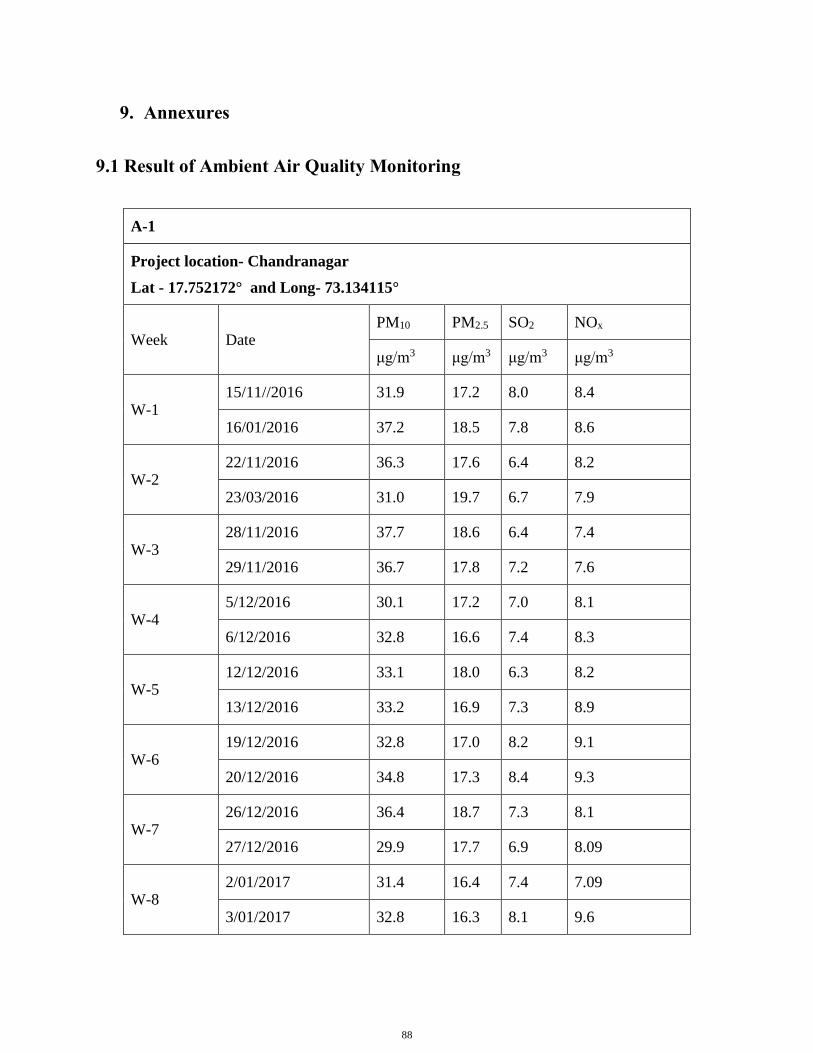
88
9. Annexures
9.1 Result of Ambient Air Quality Monitoring
A-1
Project location- Chandranagar
Lat - 17.752172° and Long- 73.134115°
Week Date PM10 PM2.5 SO2 NOx
μg/m3 μg/m3 μg/m3 μg/m3
W-1 15/11//2016 31.9 17.2 8.0 8.4
16/01/2016 37.2 18.5 7.8 8.6
W-2 22/11/2016 36.3 17.6 6.4 8.2
23/03/2016 31.0 19.7 6.7 7.9
W-3 28/11/2016 37.7 18.6 6.4 7.4
29/11/2016 36.7 17.8 7.2 7.6
W-4 5/12/2016 30.1 17.2 7.0 8.1
6/12/2016 32.8 16.6 7.4 8.3
W-5 12/12/2016 33.1 18.0 6.3 8.2
13/12/2016 33.2 16.9 7.3 8.9
W-6 19/12/2016 32.8 17.0 8.2 9.1
20/12/2016 34.8 17.3 8.4 9.3
W-7 26/12/2016 36.4 18.7 7.3 8.1
27/12/2016 29.9 17.7 6.9 8.09
W-8 2/01/2017 31.4 16.4 7.4 7.09
3/01/2017 32.8 16.3 8.1 9.6
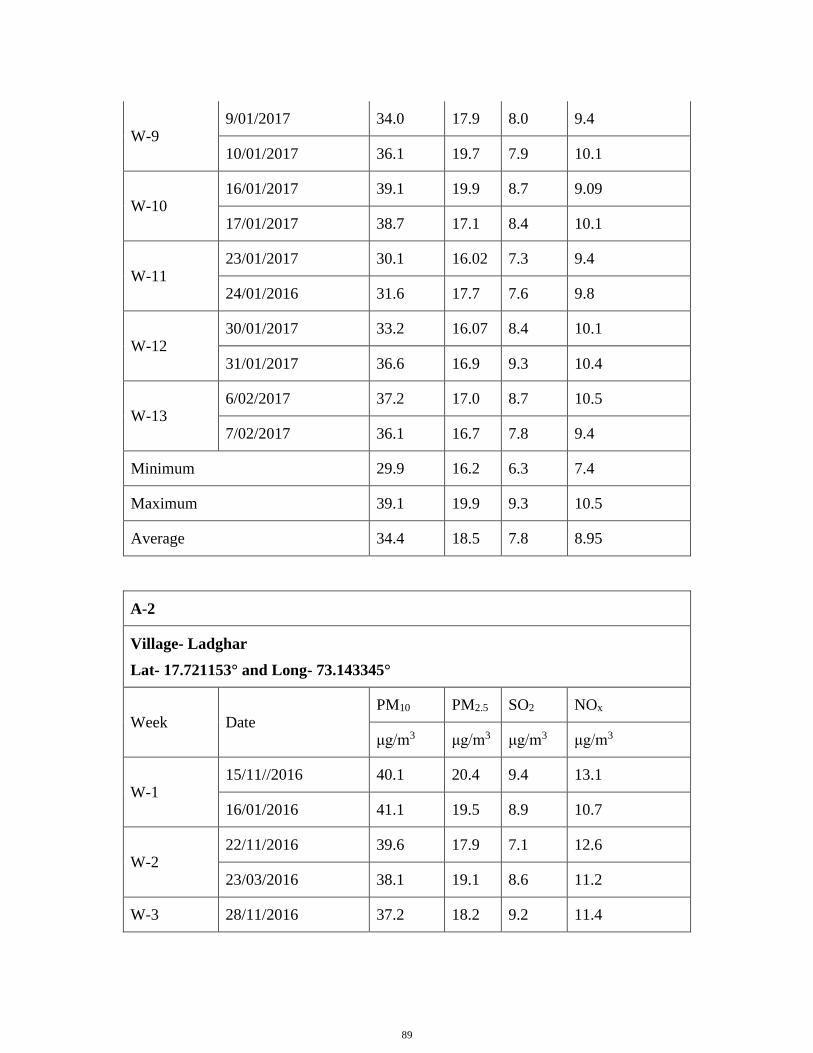
89
W-9 9/01/2017 34.0 17.9 8.0 9.4
10/01/2017 36.1 19.7 7.9 10.1
W-10 16/01/2017 39.1 19.9 8.7 9.09
17/01/2017 38.7 17.1 8.4 10.1
W-11 23/01/2017 30.1 16.02 7.3 9.4
24/01/2016 31.6 17.7 7.6 9.8
W-12 30/01/2017 33.2 16.07 8.4 10.1
31/01/2017 36.6 16.9 9.3 10.4
W-13 6/02/2017 37.2 17.0 8.7 10.5
7/02/2017 36.1 16.7 7.8 9.4
Minimum 29.9 16.2 6.3 7.4
Maximum 39.1 19.9 9.3 10.5
Average 34.4 18.5 7.8 8.95
A-2
Village- Ladghar
Lat- 17.721153° and Long- 73.143345°
Week Date PM10 PM2.5 SO2 NOx
μg/m3 μg/m3 μg/m3 μg/m3
W-1 15/11//2016 40.1 20.4 9.4 13.1
16/01/2016 41.1 19.5 8.9 10.7
W-2 22/11/2016 39.6 17.9 7.1 12.6
23/03/2016 38.1 19.1 8.6 11.2
W-3 28/11/2016 37.2 18.2 9.2 11.4
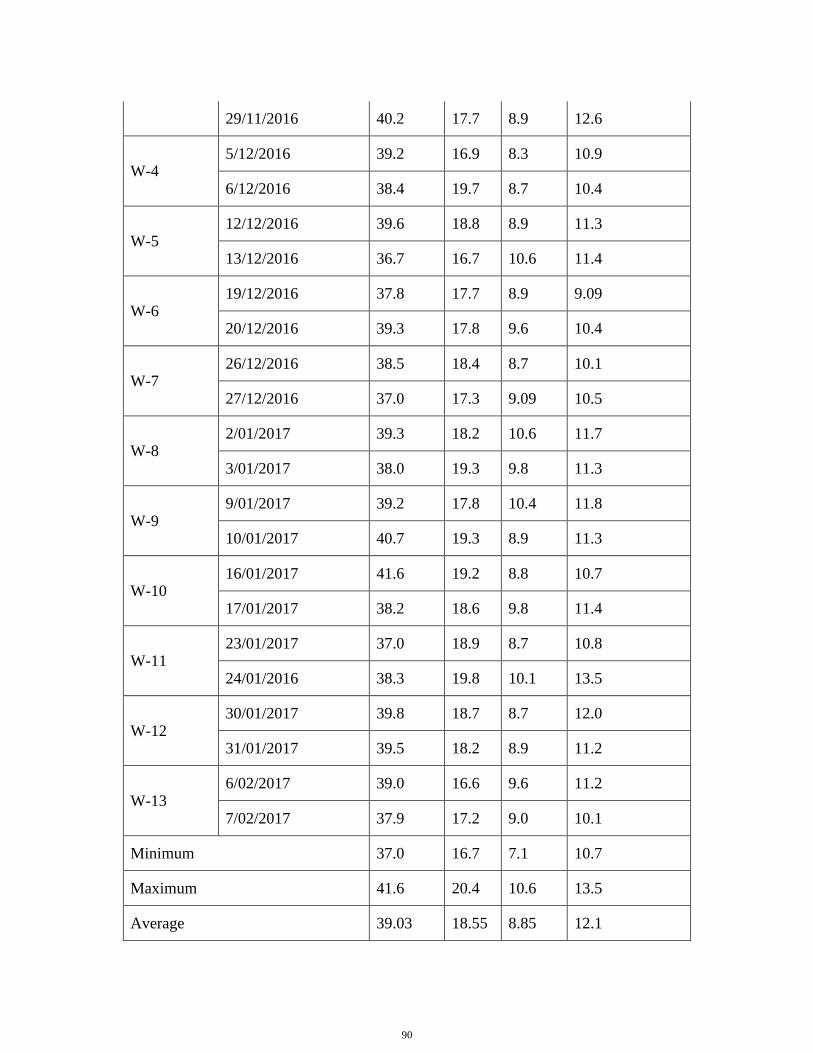
90
29/11/2016 40.2 17.7 8.9 12.6
W-4 5/12/2016 39.2 16.9 8.3 10.9
6/12/2016 38.4 19.7 8.7 10.4
W-5 12/12/2016 39.6 18.8 8.9 11.3
13/12/2016 36.7 16.7 10.6 11.4
W-6 19/12/2016 37.8 17.7 8.9 9.09
20/12/2016 39.3 17.8 9.6 10.4
W-7 26/12/2016 38.5 18.4 8.7 10.1
27/12/2016 37.0 17.3 9.09 10.5
W-8 2/01/2017 39.3 18.2 10.6 11.7
3/01/2017 38.0 19.3 9.8 11.3
W-9 9/01/2017 39.2 17.8 10.4 11.8
10/01/2017 40.7 19.3 8.9 11.3
W-10 16/01/2017 41.6 19.2 8.8 10.7
17/01/2017 38.2 18.6 9.8 11.4
W-11 23/01/2017 37.0 18.9 8.7 10.8
24/01/2016 38.3 19.8 10.1 13.5
W-12 30/01/2017 39.8 18.7 8.7 12.0
31/01/2017 39.5 18.2 8.9 11.2
W-13 6/02/2017 39.0 16.6 9.6 11.2
7/02/2017 37.9 17.2 9.0 10.1
Minimum 37.0 16.7 7.1 10.7
Maximum 41.6 20.4 10.6 13.5
Average 39.03 18.55 8.85 12.1
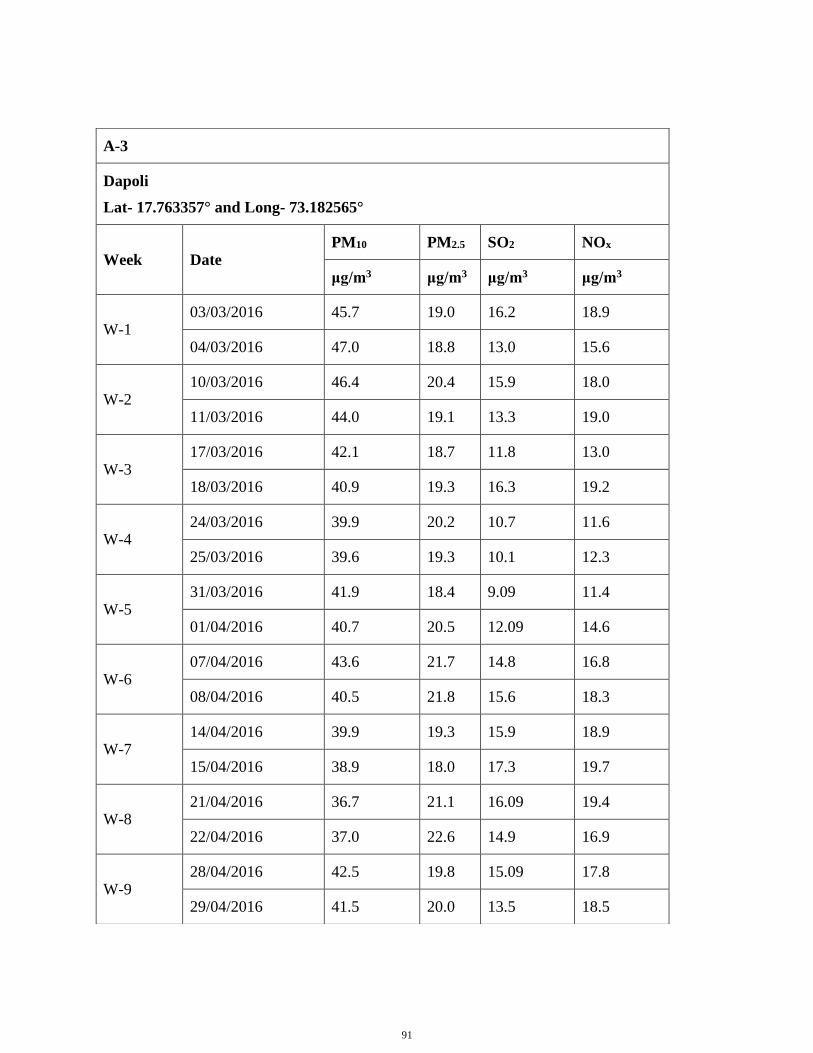
91
A-3
Dapoli
Lat- 17.763357° and Long- 73.182565°
Week Date PM10 PM2.5 SO2 NOx
μg/m3 μg/m3 μg/m3 μg/m3
W-1 03/03/2016 45.7 19.0 16.2 18.9
04/03/2016 47.0 18.8 13.0 15.6
W-2 10/03/2016 46.4 20.4 15.9 18.0
11/03/2016 44.0 19.1 13.3 19.0
W-3 17/03/2016 42.1 18.7 11.8 13.0
18/03/2016 40.9 19.3 16.3 19.2
W-4 24/03/2016 39.9 20.2 10.7 11.6
25/03/2016 39.6 19.3 10.1 12.3
W-5 31/03/2016 41.9 18.4 9.09 11.4
01/04/2016 40.7 20.5 12.09 14.6
W-6 07/04/2016 43.6 21.7 14.8 16.8
08/04/2016 40.5 21.8 15.6 18.3
W-7 14/04/2016 39.9 19.3 15.9 18.9
15/04/2016 38.9 18.0 17.3 19.7
W-8 21/04/2016 36.7 21.1 16.09 19.4
22/04/2016 37.0 22.6 14.9 16.9
W-9 28/04/2016 42.5 19.8 15.09 17.8
29/04/2016 41.5 20.0 13.5 18.5
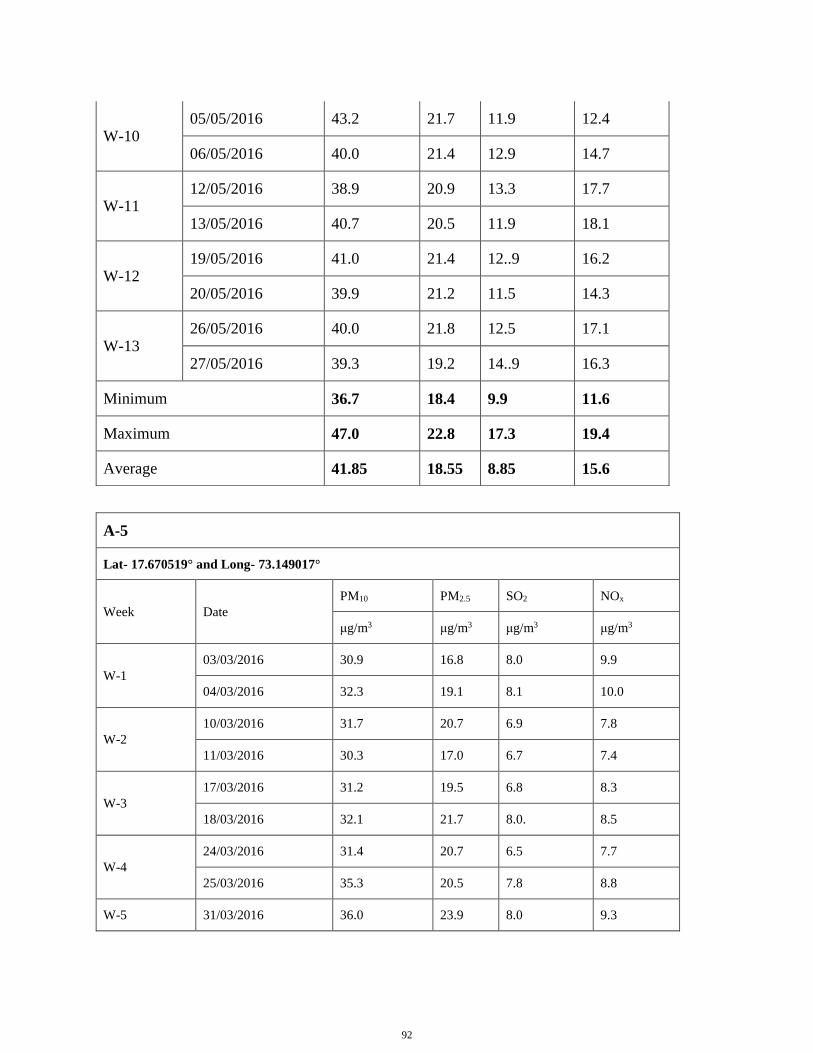
92
A-5
Lat- 17.670519° and Long- 73.149017°
Week Date
PM10 PM2.5 SO2 NOx
μg/m3 μg/m3 μg/m3 μg/m3
W-1
03/03/2016 30.9 16.8 8.0 9.9
04/03/2016 32.3 19.1 8.1 10.0
W-2
10/03/2016 31.7 20.7 6.9 7.8
11/03/2016 30.3 17.0 6.7 7.4
W-3
17/03/2016 31.2 19.5 6.8 8.3
18/03/2016 32.1 21.7 8.0. 8.5
W-4
24/03/2016 31.4 20.7 6.5 7.7
25/03/2016 35.3 20.5 7.8 8.8
W-5 31/03/2016 36.0 23.9 8.0 9.3
W-10 05/05/2016 43.2 21.7 11.9 12.4
06/05/2016 40.0 21.4 12.9 14.7
W-11 12/05/2016 38.9 20.9 13.3 17.7
13/05/2016 40.7 20.5 11.9 18.1
W-12 19/05/2016 41.0 21.4 12..9 16.2
20/05/2016 39.9 21.2 11.5 14.3
W-13 26/05/2016 40.0 21.8 12.5 17.1
27/05/2016 39.3 19.2 14..9 16.3
Minimum 36.7 18.4 9.9 11.6
Maximum 47.0 22.8 17.3 19.4
Average 41.85 18.55 8.85 15.6
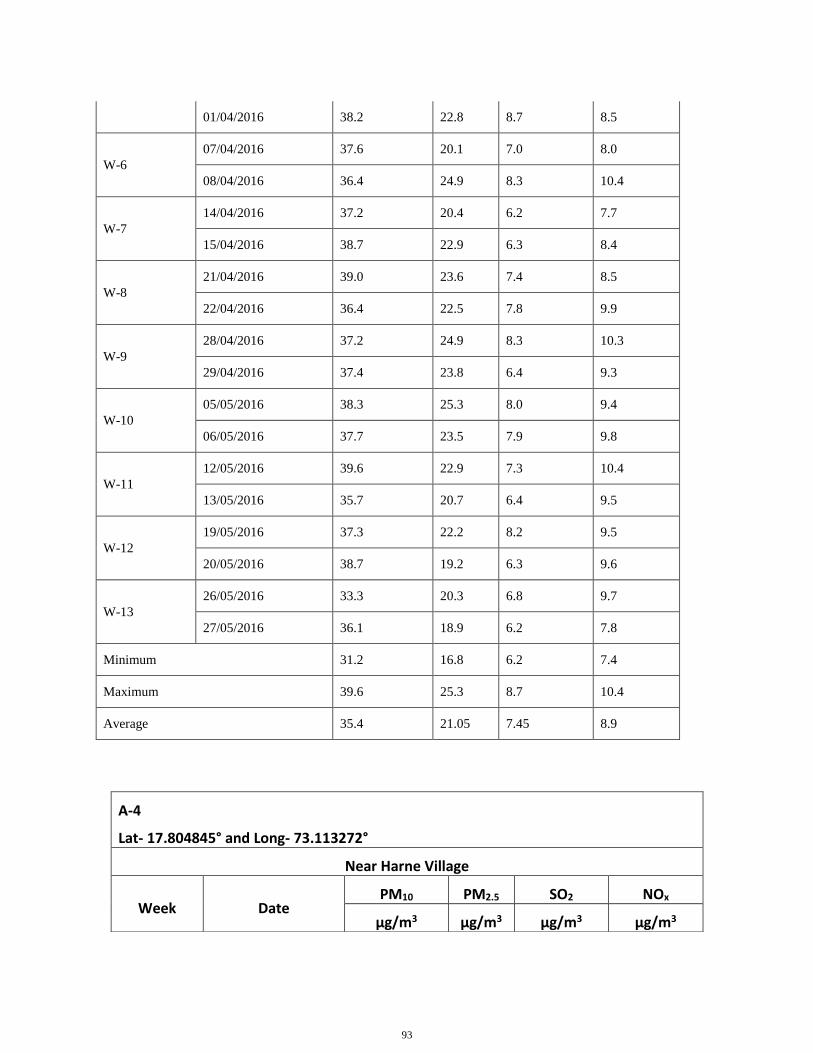
93
01/04/2016 38.2 22.8 8.7 8.5
W-6
07/04/2016 37.6 20.1 7.0 8.0
08/04/2016 36.4 24.9 8.3 10.4
W-7
14/04/2016 37.2 20.4 6.2 7.7
15/04/2016 38.7 22.9 6.3 8.4
W-8
21/04/2016 39.0 23.6 7.4 8.5
22/04/2016 36.4 22.5 7.8 9.9
W-9
28/04/2016 37.2 24.9 8.3 10.3
29/04/2016 37.4 23.8 6.4 9.3
W-10
05/05/2016 38.3 25.3 8.0 9.4
06/05/2016 37.7 23.5 7.9 9.8
W-11
12/05/2016 39.6 22.9 7.3 10.4
13/05/2016 35.7 20.7 6.4 9.5
W-12
19/05/2016 37.3 22.2 8.2 9.5
20/05/2016 38.7 19.2 6.3 9.6
W-13
26/05/2016 33.3 20.3 6.8 9.7
27/05/2016 36.1 18.9 6.2 7.8
Minimum 31.2 16.8 6.2 7.4
Maximum 39.6 25.3 8.7 10.4
Average 35.4 21.05 7.45 8.9
A-4
Lat- 17.804845° and Long- 73.113272°
Near Harne Village
Week Date PM10 PM2.5 SO2 NOx
μg/m3 μg/m3 μg/m3 μg/m3
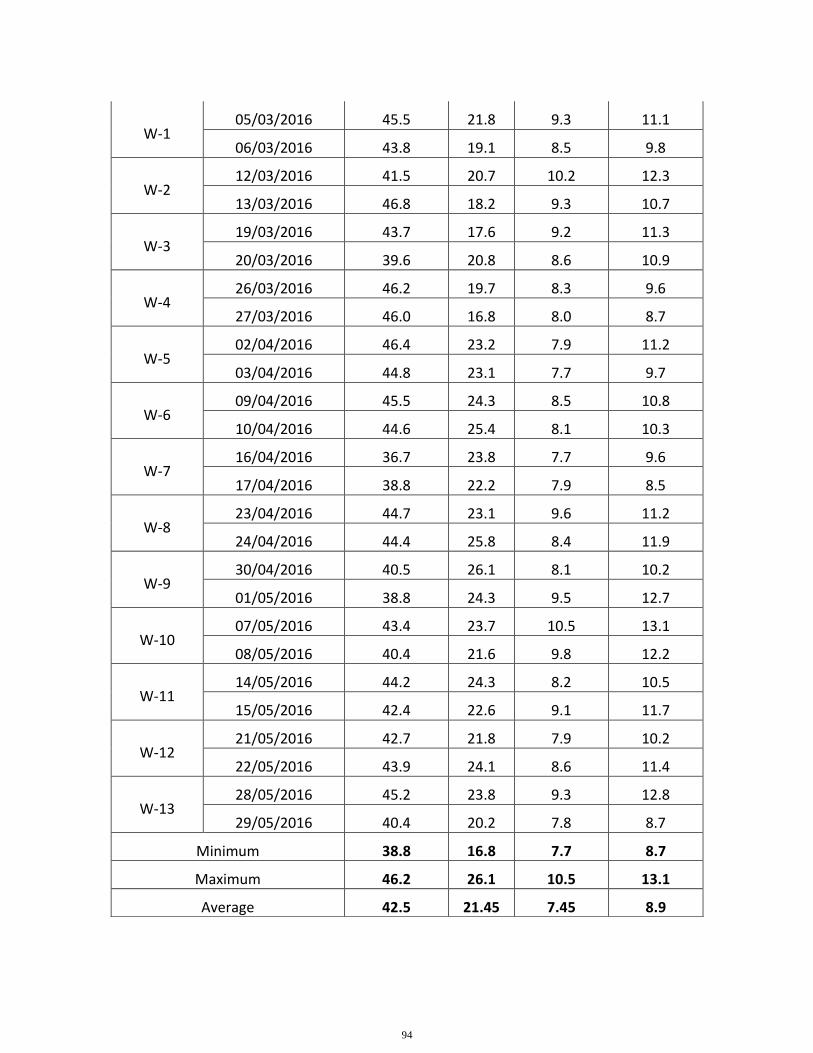
94
W-1 05/03/2016 45.5 21.8 9.3 11.1
06/03/2016 43.8 19.1 8.5 9.8
W-2 12/03/2016 41.5 20.7 10.2 12.3
13/03/2016 46.8 18.2 9.3 10.7
W-3 19/03/2016 43.7 17.6 9.2 11.3
20/03/2016 39.6 20.8 8.6 10.9
W-4 26/03/2016 46.2 19.7 8.3 9.6
27/03/2016 46.0 16.8 8.0 8.7
W-5 02/04/2016 46.4 23.2 7.9 11.2
03/04/2016 44.8 23.1 7.7 9.7
W-6 09/04/2016 45.5 24.3 8.5 10.8
10/04/2016 44.6 25.4 8.1 10.3
W-7 16/04/2016 36.7 23.8 7.7 9.6
17/04/2016 38.8 22.2 7.9 8.5
W-8 23/04/2016 44.7 23.1 9.6 11.2
24/04/2016 44.4 25.8 8.4 11.9
W-9 30/04/2016 40.5 26.1 8.1 10.2
01/05/2016 38.8 24.3 9.5 12.7
W-10 07/05/2016 43.4 23.7 10.5 13.1
08/05/2016 40.4 21.6 9.8 12.2
W-11 14/05/2016 44.2 24.3 8.2 10.5
15/05/2016 42.4 22.6 9.1 11.7
W-12 21/05/2016 42.7 21.8 7.9 10.2
22/05/2016 43.9 24.1 8.6 11.4
W-13 28/05/2016 45.2 23.8 9.3 12.8
29/05/2016 40.4 20.2 7.8 8.7
Minimum 38.8 16.8 7.7 8.7
Maximum 46.2 26.1 10.5 13.1
Average 42.5 21.45 7.45 8.9
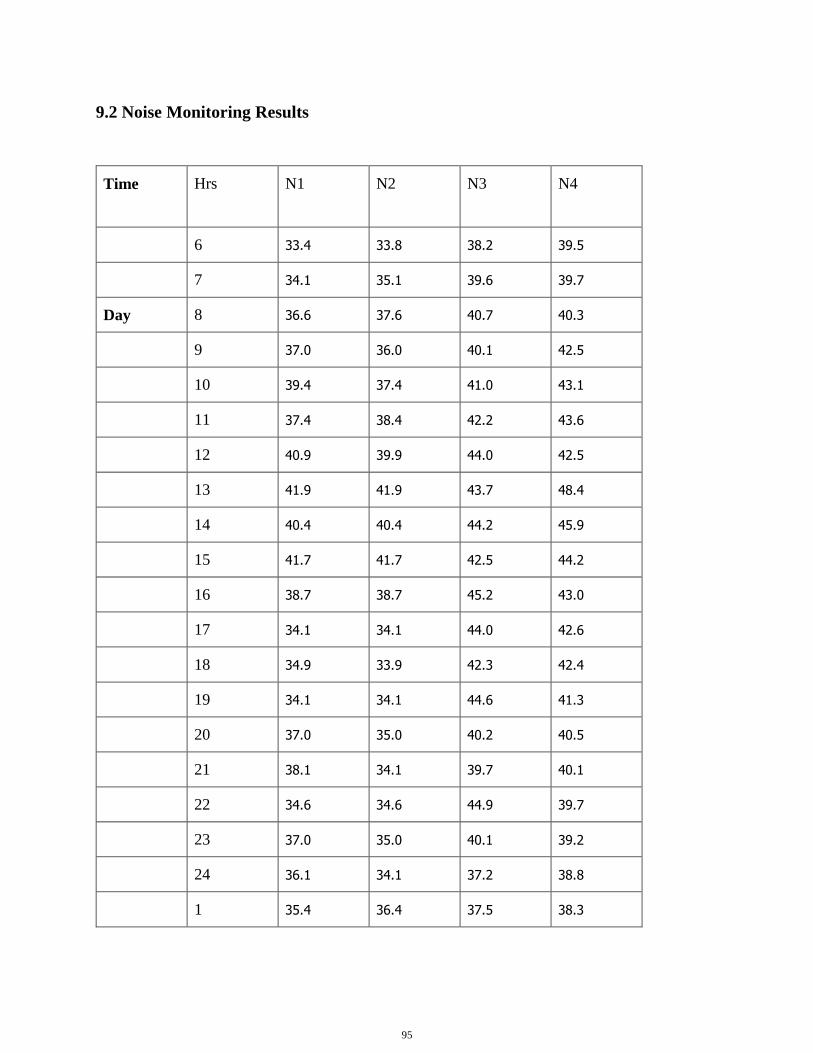
95
9.2 Noise Monitoring Results
Time Hrs N1 N2 N3 N4
6 33.4 33.8 38.2 39.5
7 34.1 35.1 39.6 39.7
Day 8 36.6 37.6 40.7 40.3
9 37.0 36.0 40.1 42.5
10 39.4 37.4 41.0 43.1
11 37.4 38.4 42.2 43.6
12 40.9 39.9 44.0 42.5
13 41.9 41.9 43.7 48.4
14 40.4 40.4 44.2 45.9
15 41.7 41.7 42.5 44.2
16 38.7 38.7 45.2 43.0
17 34.1 34.1 44.0 42.6
18 34.9 33.9 42.3 42.4
19 34.1 34.1 44.6 41.3
20 37.0 35.0 40.2 40.5
21 38.1 34.1 39.7 40.1
22 34.6 34.6 44.9 39.7
23 37.0 35.0 40.1 39.2
24 36.1 34.1 37.2 38.8
1 35.4 36.4 37.5 38.3
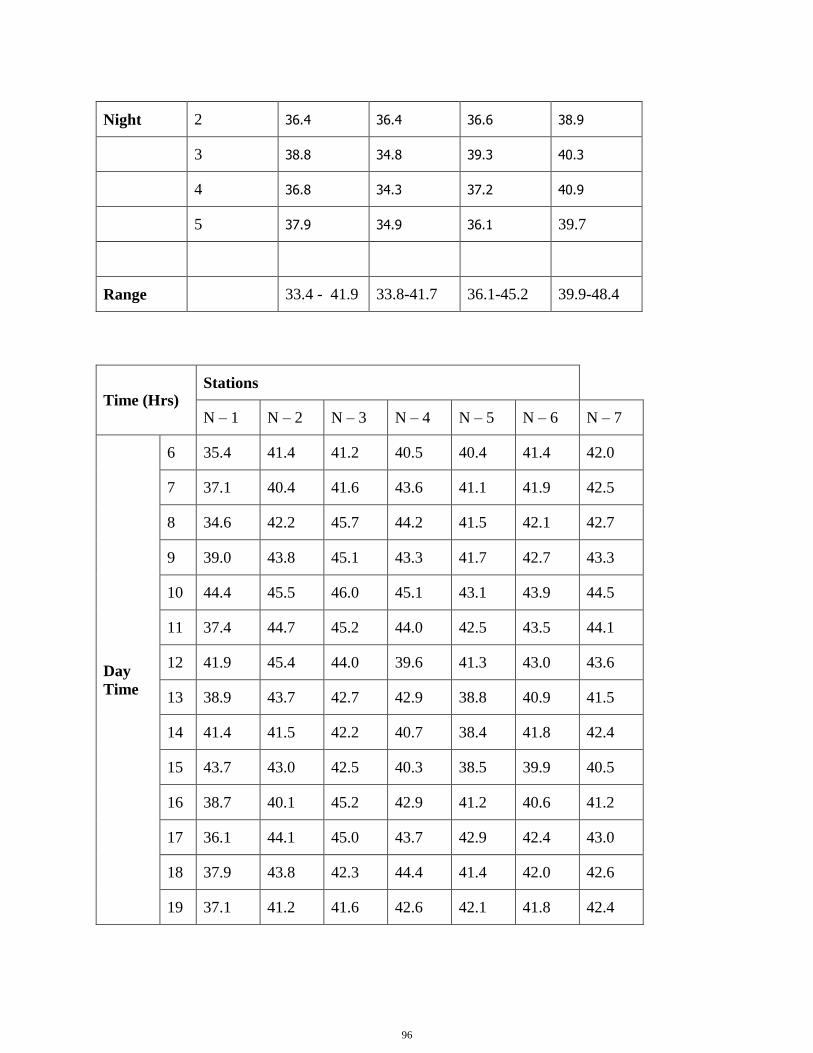
96
Night 2 36.4 36.4 36.6 38.9
3 38.8 34.8 39.3 40.3
4 36.8 34.3 37.2 40.9
5 37.9 34.9 36.1 39.7
Range 33.4 - 41.9 33.8-41.7 36.1-45.2 39.9-48.4
Time (Hrs) Stations
N – 1 N – 2 N – 3 N – 4 N – 5 N – 6 N – 7
Day
Time
6 35.4 41.4 41.2 40.5 40.4 41.4 42.0
7 37.1 40.4 41.6 43.6 41.1 41.9 42.5
8 34.6 42.2 45.7 44.2 41.5 42.1 42.7
9 39.0 43.8 45.1 43.3 41.7 42.7 43.3
10 44.4 45.5 46.0 45.1 43.1 43.9 44.5
11 37.4 44.7 45.2 44.0 42.5 43.5 44.1
12 41.9 45.4 44.0 39.6 41.3 43.0 43.6
13 38.9 43.7 42.7 42.9 38.8 40.9 41.5
14 41.4 41.5 42.2 40.7 38.4 41.8 42.4
15 43.7 43.0 42.5 40.3 38.5 39.9 40.5
16 38.7 40.1 45.2 42.9 41.2 40.6 41.2
17 36.1 44.1 45.0 43.7 42.9 42.4 43.0
18 37.9 43.8 42.3 44.4 41.4 42.0 42.6
19 37.1 41.2 41.6 42.6 42.1 41.8 42.4
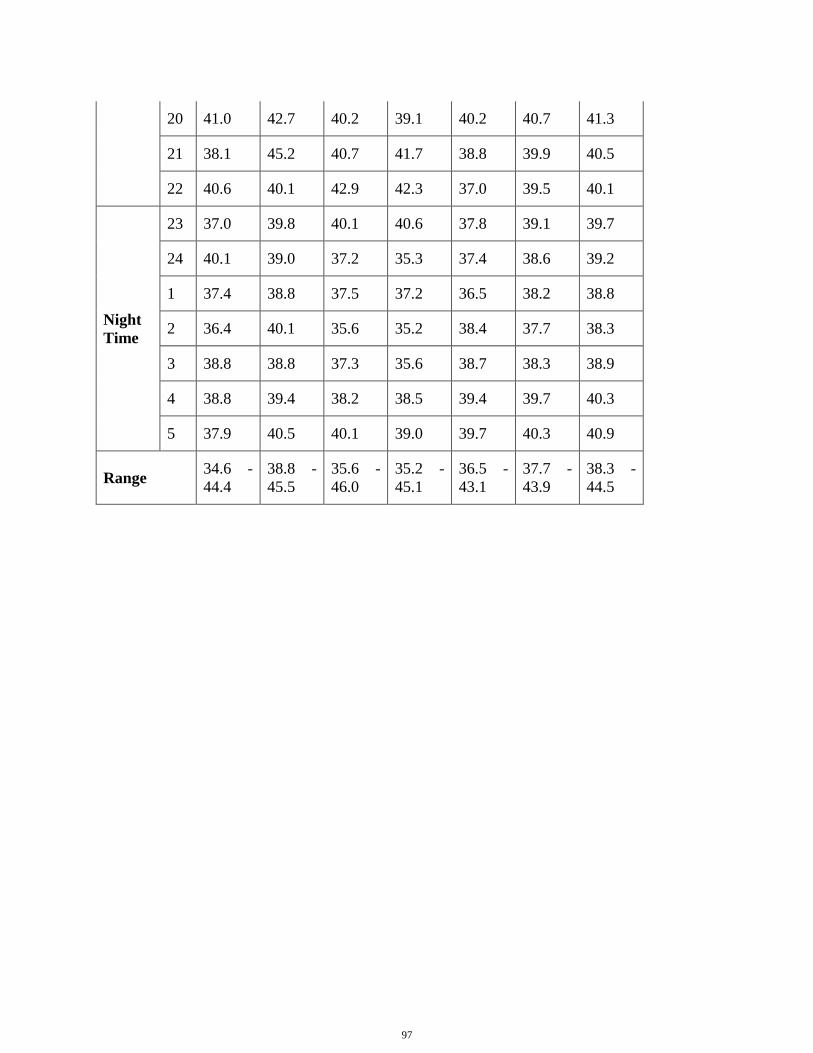
97
20 41.0 42.7 40.2 39.1 40.2 40.7 41.3
21 38.1 45.2 40.7 41.7 38.8 39.9 40.5
22 40.6 40.1 42.9 42.3 37.0 39.5 40.1
Night
Time
23 37.0 39.8 40.1 40.6 37.8 39.1 39.7
24 40.1 39.0 37.2 35.3 37.4 38.6 39.2
1 37.4 38.8 37.5 37.2 36.5 38.2 38.8
2 36.4 40.1 35.6 35.2 38.4 37.7 38.3
3 38.8 38.8 37.3 35.6 38.7 38.3 38.9
4 38.8 39.4 38.2 38.5 39.4 39.7 40.3
5 37.9 40.5 40.1 39.0 39.7 40.3 40.9
Range 34.6 -
44.4
38.8 -
45.5
35.6 -
46.0
35.2 -
45.1
36.5 -
43.1
37.7 -
43.9
38.3 -
44.5