Embed Size (px)
Citation preview

ENVIRONMENTAL IMPACT ASSESSMENT REPORT
ETALIN H. E. PROJECT (3097 MW)
JANUARY 2015
Prepared by
R. S. Envirolink Technologies Pvt. Ltd. 402, Radisson Suites Commercial Plaza,
B-Block, Sushant Lok-I, Gurgaon
Ph. +91-124-4295383 : www.rstechnologies.co.in
for
Etalin Hydro Electric Power Company Limited (EHEPCL)


Scheme for Accreditation of EIA Consultant Organizations
List of Accredited Consultant Organizations (Alphabetically
*denotes Provisionally Accredited Consultants
List of Accredited
S. No.
Consultant Organization
1
Aarvee Associates Architects Engineers & Consultants Pvt. Ltd. * Address: 8-2-5, Ravula Residency
Srinagar Colony, Hyderabad
E.mail: [email protected], [email protected]
Tel.: 040-23737633
Conditions apply
2
ABC Techno Labs India Private Limited known as ABC Environ Solutions Pvt. Ltd.) Address: No. 2, 2
nd Street, Thangam Colony, Anna
Nagar West, Chennai – 600040
E-mail:[email protected],
Scheme for Accreditation of EIA Consultant Organizations
Alphabetically)/ Rev. 26/ Jan. 08, 2015
List of Accredited EIA Consultant Organizations – 1
(as on January 08, 2015)
Scope of Accreditation
As per NABET Scheme
Sector Number
Name of Sector
Architects Engineers & Consultants
Highways, Railways, transport
terminals, mass rapid transport
system
(formerly
Street, Thangam Colony, Anna
1 Mining of minerals (Opencast only)
Mining (Open cast and Underground)
3 Irrigation projects only
4 Thermal Power Plant
8 Metallurgical industries (sec. ferrous
only)
9 Cement Plants
10 Petroleum refining industry
15 Leather/skin/hide processing
Page 1
166
Accreditation
Project or Activity as per Schedule of MoEF Notification dated
September 14, 2006 and subsequent amendments
Category
Highways, Railways, transport
terminals, mass rapid transport A 7 (f)
A 1 (a) (i)
B
A 1 (c )
A 1 (d)
ferrous B 3 (a)
A 3 (b)
A 4 (a)
processing A 4 (f)

Scheme for Accreditation of EIA Consultant Organizations
List of Accredited Consultant Organizations (Alphabetically
*denotes Provisionally Accredited Consultants
S. No.
Consultant Organization
E.mail:[email protected],
Tel.: 0291- 2706098, 09829021098
** Though the EIA Coordinator for this sector was
found suitable for Cat. A, however, the organization as
a whole was accredited for Cat. B, in view of their
having scored less than 60% marks in Office
Assessment. They can take up projects in this sector
only for Cat. B as an organization.
Conditions apply
120
R. S. Envirolinks Technologies Pvt. Ltd. * Address: 402, Radisson Suites Commercial Plaza, B
Block, Sushant Lok 1, Gurgaon – 122009
e. mail: [email protected] Tel.: 0124 – 4295383
09810136853
Conditions apply
Scheme for Accreditation of EIA Consultant Organizations
Alphabetically)/ Rev. 26/ Jan. 08, 2015
Scope of Accreditation
As per NABET Scheme
Sector Number
Name of Sector
this sector was
found suitable for Cat. A, however, the organization as
a whole was accredited for Cat. B, in view of their
having scored less than 60% marks in Office
Assessment. They can take up projects in this sector
402, Radisson Suites Commercial Plaza, B
1 Mining of minerals (Open cast only)
3 River Valley, Hydel, Drainage and
Irrigation projects
27
Oil & gas transportation pipeline
(crude and refinery/ petrochemical
products), passing through national
parks/ sanctuaries/coral reefs
/ecologically sensitive Areas including
LNG terminal
33 Jetties only
34 Railways only
40 (i) Automobile and Auto Components
Page 92
Accreditation
Project or Activity as per Schedule of MoEF Notification dated
September 14, 2006 and subsequent amendments
Category
A 1 (a) (i)
River Valley, Hydel, Drainage and A 1 (c)
Oil & gas transportation pipeline
(crude and refinery/ petrochemical
passing through national
parks/ sanctuaries/coral reefs
/ecologically sensitive Areas including
A 6 (a)
B 7 (e)
A 7 (f)
- -


CONTENTS
CHAPTER 1: INTRODUCTION
1.1 GENERAL 1.1
1.2 ETALIN H.E. PROJECT 1.1
1.2.1 Purpose of the Study 1.1
1.2.2 Scope of the Study 1.1
1.3 CASCADE DEVELOPMENT PLAN 1.3
1.4 STUDY OF ALTERNATIVES 1.3
1.4.1 Alternative Layouts 1.3
1.4.1.1 Layout by CEA 1.4
1.4.1.2 Layout by NHPC 1.5
1.4.1.3 Alternatives Studies in the Present DPR 1.7
1.5 POLICY, LEGAL & ADMINISTRATIVEE FRAMEWORK 1.10
1.6 EIA NOTIFICATION, 2006 1.12
1.7 FOREST CLEARANCE 1.13
1.8 STATE R&R POLICY 1.13
1.9 DISCLOSURE BY THE CONSULTANT 1.13
1.10 OUTLINE OF THE REPORT 1.13
CHAPTER 2: PROJECT DESCRIPTION & INFRASTRUCTURE
2.1 PROJECT LOCATION & ACCESSIBILITY 2.1
2.2 SALIENT FEATURES OF THE PROJECT 2.1
2.3 PROJECT COMPONENTS 2.2
2.3.1 Dri Limb 2.2
2.3.1.1 Dam Complex 2.2
2.3.1.2 Head Race Tunnel 2.2
2.3.1.3 Surge Shaft & Pressure Shafts 2.2
2.3.2 Talo (Tangon) Limb 2.3
2.3.2.1 Dam Complex 2.3
2.3.2.2 Head Race Tunnel 2.3
2.3.3 Components at Power House 2.4
2.3.3.1 Dri Dam-toe Power House 2.4
2.3.3.2 Talo (Tangon) Dam-toe Power House 2.4
2.4 INFRASTRUCTURE FACILITIES 2.14
2.4.1 Approach to the Project 2.14
2.4.1.1 Transportation by Railway 2.14
2.4.1.2 Transportation by Waterway 2.14
2.4.1.3 Transportation by air 2.14
2.4.1.4 Transportation by road 2.15

2.4.2 Project Roads 2.15
2.4.3 Project Bridges 2.15
2.4.4 Construction of new bridges 2.17
2.4.5 Project Colonies 2.17
2.4.5.1 Owner’s building and colonies 2.18
2.4.5.2 Contractors colonies and buildings 2.19
2.4.6 Workshops and Parking Space 2.19
2.4.7 Stores and Warehouses 2.19
2.4.8 Penstock Fabrication Yard 2.19
2.4.9 Aggregate Processing Plants/Batching and Mixing Plants 2.20
2.4.10 Quarries/Borrow Areas 2.20
2.4.11 Muck Disposal Areas 2.21
2.4.12 Explosive Magazine 2.21
2.4.13 Land Requirement 2.21
2.4.13.1 Land Required Permanently 2.23
2.4.13.2 Land Required on Lease or Temporary Basis 2.23
2.4.14 Construction Power 2.24
2.4.15 Tele-Communication and Other Facilities 2.24
2.4.16 Security and Safety 2.24
CHAPTER 3: METHODOLOGY
3.1 INTRODUCTION 3.1
3.2 METHODOLOGY 3.1
3.2.1 Study Area 3.3
3.2.2 Scoping Matrix 3.3
3.2.3 Baseline Status Primary Data Collection 3.3
3.2.4 Secondary Data 3.3
3.2.4.1 Physiography 3.3
3.2.4.2 Geology 3.5
3.2.4.3 Meteorology 3.5
3.2.4.4 Hydrology 3.6
3.2.4.5 Forest Types & Forest Cover 3.6
3.2.4.6 Infrastructure Facilities 3.6
3.2.5 Primary Data Collection –Field Surveys 3.6
3.2.5.1 Soil 3.7
3.2.5.2 Ambient Air Quality 3.8
3.2.5.3 Ambient Noise levels & Traffic Density 3.9
3.2.5.4 Land use / land cover 3.10
3.2.5.5 Vegetation Community Structure/ Floristic Surveys 3.11
3.2.5.6 Faunal Elements 3.13
3.2.5.7 Water Quality 3.15

3.2.5.8 Aquatic Ecology 3.16
3.2.5.9 Socio-economic Surveys 3.18
3.3 IMPACT ASSESSMENT & MITIGATION MEASURES 3.20
3.4 ENVIRONMENTAL MANAGEMENT PLAN 3.20
3.5 ENVIRONMENTAL MONITORIG PROGRAMME 3.21
CHAPTER 4: HYDROLOGY
4.1 GENERAL 4.1
CHAPTER 5: GEOLOGY
5.1 GENERAL 5.1
CHAPTER 6: ENVIRONMENTAL BASELINE STATUS: PHYSICO-CHEMICAL
PARAMETERS
6.1 INTRODUCTION 6.1
6.2 DRAINAGE 6.1
6.3 PHYSIOGRAPHY 6.1
6.4 SOIL 6.2
6.4.1 Soil Taxonomic Classification 6.2
6.4.2 Soil Fertility Status 6.6
6.5 AIR ENVIRONMENT 6.6
6.5.1 Ambient Air Quality 6.11
6.6 NOISE & TRAFFIC 6.12
6.6.1 Noise Level 6.12
6.6.2 Traffic Density 6.13
CHAPTER 7: ENVIRONMENTAL BASELINE STATUS: BIOLOGICAL
RESOURCES
7.1 INTRODUCTION 7.1
7.2 LAND USE/ LAND COVER 7.1
7.3 FOREST TYPES 7.4
7.3.1 Tropical Vegetation 7.4
7.3.1.1 Upper Assam Valley Tropical Evergreen Forest (Tropical
Evergreen Forest) (1B/C2) 7.4
7.3.1.2 Eastern sub-montane Semi-evergreen Forest (Tropical
Semi-evergreen forest) – (2B/C1b) 7.4
7.3.2 East Himalayan moist mixed deciduous forests (Sub tropical
Broadleaved Forests) – (3/C3b) 7.5
7.3.3 Assam Sub-tropical Pine Forests – (9/C2) 7.5
7.3.4 East Himalayan Wet Temperate Forests (Temperate Broadleaved
Forests) – (11B/C1) 7.5

7.3.5 East Himalayan Mixed Coniferous Forest (Temperate Conifer
Forests) – (12/C3a) 7.6
7.3.6 Alpine Pastures (Alpine Forests) – 15/C3) 7.6
7.3.7 Secondary Forests (1B/2S) 7.6
7.3.7.1 Degraded Forests 7.6
7.3.7.2 Bamboo and Musa Forests 7.6
7.3.7.3 Grasslands 7.6
7.4 FLORISTICS 7.7
7.4.1 Objectives 7.7
7.4.2 Taxonomic Diversity 7.7
7.4.3 Community Structure 7.8
7.4.3.1 Catchment of Dri River (V1) 7.8
7.4.3.2 Dam Site Dri River (V2) 7.12
7.4.3.3 Downstream of Dri Dam near Ru Pani (V3) 7.15
7.4.3.4 Catchment Area Talo (Tangon) River (V4) 7.18
7.4.3.5 Talo (Tangon) Dam Site Talo (Tangon) River (V5) 7.20
7.4.3.6 Downstream of Talo (Tangon) Dam near Anon Pani (V6) 7.23
7.4.3.7 Power House Site (V7) 7.25
7.4.3.8 Downstream of Power House Site (V8) 7.28
7.4.4 Density & Dominance 7.31
7.4.5 Diversity 7.34
7.4.6 Economically Important Plant Species 7.36
7.4.7 Rare & Endangered Flora 7.38
7.5 TERRESTRIAL FAUNA 7.38
7.5.1 Mammals 7.38
7.5.2 Avifauna 7.40
7.5.3 Herpetofauna 7.42
7.5.4 Insects 7.42
7.5.5 Threatened and Endangered Fauna 7.45
7.6 WATER QUALITY 7.45
7.6.1 Physico–chemical Characteristics 7.46
7.6.2 Biological Characteristics 7.46
7.6.2.1 Periphyton 7.46
7.6.2.2 Phytoplankton 7.53
7.6.2.3 Zooplankton 7.55
7.6.2.4 Macro-Invertebrates 7.56
7.6.2.5 Water Quality Assessment 7.57
7.7 FISH AND FISHERIES 7.62
CHAPTER 8: ASSESSMENT OF IMPACTS
8.1 GENERAL 8.1

8.2 IMPACTS DURING CONSTRUCTION 8.2
8.2.1 Impacts due to immigration of Construction Workers 8.2
8.2.2 Construction of Main Project Components 8.3
8.2.3 Quarrying Operations 8.4
8.2.4 Operation of Construction Plant and Equipment 8.5
8.2.5 Muck Disposal 8.9
8.2.6 Road Construction 8.10
8.2.7 Flora and Fauna 8.13
8.2.8 Impacts Summary during Construction Phase 8.13
8.3 IMPACTS DURING OPERATION PHASE 8.18
8.3.1 Downstream Impacts 8.18
8.3.2 Impact on Migratory Fishes 8.19
8.3.3 Impact on Downstream Users 8.19
8.3.4 Impact on Reservoir Water Quality 8.20
8.3.5 Minimum Environmental Flow Requirement 8.20

LIST OF TABLES
Table 1.1: Key Environmental Legislations in India 1.10
Table 2.1: Salient Features of Etalin HE Project 2.4
Table 2.2: Existing Bridges in Project area 2.15
Table 2.3: Land requirement of Etalin HE Project 2.21
Table 3.1: Scoping matrix for EIA study of Etalin H.E. Project 3.4
Table 3.2: Sampling schedule for various Environmental Parameters 3.6
Table 3.3: Sampling locations 3.7
Table 3.4: Ambient air quality, noise and traffic density monitoring locations 3.10
Table 3.5: Sampling Locations for terrestrial ecology 3.12
Table 3.6: Number of quadrats studied during field surveys for trees, shrubs
and herbs 3.13
Table 3.7: Transects and trails for faunal elements 3.14
Table 3.8: Water sampling locations 3.15
Table 3.9: Source of data for various Environmental Parameters 3.19
Table 6.1: Areas falling under different slope categories in the study area 6.2
Table 6.2: Description and Area under different Soil Classes 6.8
Table 6.3: Physico-chemical Composition of Soil in the Study Area 6.10
Table 6.4: National Ambient Air Quality Standard by (MOEF&CC) 6.11
Table 6.5: Air Quality Monitoring of the Study Area (unit: µg/m3) 6.11
Table 6.6: Ambient Noise Standards 6.12
Table 6.7: Equivalent Noise levels in study area during day time [dB(A)] 6.13
Table 6.8: Traffic density (per hr) in the study area 6.13
Table 7.1: Area under different land use/ land cover categories in the study area 7.1
Table 7.2: Community structure –Site: V1 (Trees & Shrubs) 7.9
Table 7.3: Community structure –Site: V1 (Herbs) 7.11
Table 7.4: Community structure –Site: V2 (Trees & Shrubs) 7.13
Table 7.5: Community structure –Site: V2 (Herbs) 7.14
Table 7.6: Community structure –Site: V3 (Trees & Shrubs) 7.16
Table 7.7: Community structure –Site: V3 (Herbs) 7.16
Table 7.8: Community structure –Site: V4 (Trees & Shrubs) 7.18
Table 7.9: Community structure –Site: V4 (Herbs) 7.19
Table 7.10: Community structure –Site: V5 (Trees & Shrubs) 7.21
Table 7.11: Community structure –Site: V5 (Herbs) 7.21
Table 7.12: Community structure –Site: V6 (Trees & Shrubs) 7.23
Table 7.13: Community structure –Site: V6 (Herbs) 7.24
Table 7.14: Community structure –Site: V7 (Trees & Shrubs) 7.26

Table 7.15: Community structure –Site: V7 (Herbs) 7.27
Table 7.16: Community structure –Site: V8 (Trees & Shrubs) 7.29
Table 7.17: Community structure –Site: V8 (Herbs) 7.29
Table 7.18: Density (per ha) of Trees, Shrubs and Herbs 7.31
Table 7.19: Shannon Weiner Diversity Index (H) 7.34
Table 7.20: Evenness Index (E) 7.35
Table 7.21: Plant Species used as timber, fodder and fuel wood 7.36
Table 7.22: Commonly used plants species for medicinal purposes in the area 7.36
Table 7.23: Commonly used wild plants species as food 7.37
Table 7.24: Mammalian species sighted in the study area 7.39
Table 7.25: Mammalian species reported from the study area 7.39
Table 7.26: List of birds recorded from the study area and their
conservation status 7.40
Table 7.27: Herpetofaunal composition of the Study area 7.42
Table 7.28: List of commonly found amphibians in the area 7.42
Table 7.29: Insects found in the Study Area 7.43
Table 7.30: List of butterflies/insects recorded from the study area 7.43
Table 7.31: Physico-Chemical Characteristics of Water at Different Sampling
Sites in the Study Area: Winter (Lean) 7.48
Table 7.32: Physico-Chemical Characteristics of Water at Different Sampling
Sites in the Study Area (Pre-Monsoon: Summer) 7.49
Table 7.33: Physico-Chemical Characteristics of Water at Different Sampling
Sites in the Study Area (Monsoon) 7.50
Table 7.34: List of periphyton found in Study Area 7.51
Table 7.35: Density, Species Diversity (H) and Evenness Index (E) of periphyton
7.52
Table 7.36: List of phytoplankton species found in Study Area 7.54
Table 7.37: Density, Species Diversity (H) and Evenness Index (E)
of phytoplankton 7.55
Table 7.38: Zooplankton density and Shannon-Weiner Diversity index in
study area 7.56
Table 7.39: Macro-invertebrates density (individuals/m2) in study area 7.57
Table 7.40: Percent composition of macro-invertebrates at different sampling
locations (Winter Season) 7.59
Table 7.41: Percent composition of macro-invertebrates at different sampling
locations (Pre-Monsoon) 7.60
Table 7.42: Percent composition of macro-invertebrates at different sampling
locations (Monsoon) 7.61

Table 7.43: Fish composition and their status in the Dri and Talo (Tangon) Rivers7.62
Table 8.1: Calculation of Total Migratory Population 8.2
Table 8.2: Details of the quarry sites proposed in the Etalin H.E. Project 8.4
Table 8.3: List of Construction Equipment 8.5
Table 8.4: Details of Excavation work in Etalin Hydroelectric Project 8.9
Table 8.5: Details of Road Construction 8.11
Table 8.6: Summary of Impacts during Construction Phase 8.14
Table 8.7: Summary of Impacts during Operation Phase 8.21

LIST OF FIGURES
Figure 1.1: Map of Arunachal Pradesh showing location of Etalin H.E. project 1.2
Figure 1.2: L-section of Dri river showing cascade of projects 1.4
Figure 1.3: L-section of Talo (Tangon) river showing cascade of projects 1.4
Figure 1.4: Alternatives studied in Etalin HE project 1.5
Figure 2.1: Accessibility of Etalin HE project 2.2
Figure 2.2: Layout map of Etalin H.E. Project showing infrastructural facilities 2.16
Figure 3.1: Study area map delineated as per approved TOR of Etalin H.E. Project 3.2
Figure 6.1: Drainage Catchment areas of two limbs of Etalin HE project 6.3
Figure 6.2: Digital Terrain Model (DTM) of the study area generated from ASTER
G-DEM data 6.4
Figure 6.3: Slope map of the study area generated from DEM 6.5
Figure 6.4: Soil Series and their description in the Study Area 6.7
Figure 6.5: Map showing sampling sites for soil sampling, air and
noise monitoring stations in the study area 6.9
Figure 7.1: FCC generated from satellite data showing study area 7.2
Figure 7.2: Land Use/ Land Cover Map of the project Study Area 7.3
Figure 7.3: Location of terrestrial biodiversity sampling sites in the study area 7.10
Figure 7.4: Variation in Tree Density at different Sampling Locations 7.32
Figure 7.5: Variation in Shrub Density at different Sampling Locations 7.32
Figure 7.6: Seasonal variation in density of herbs 7.33
Figure 7.7: Importance Value Index of dominant tree species at
different sampling locations 7.33
Figure 7.8: Importance Value Index of dominant shrub species at
different sampling locations 7.34
Figure 7.9: Species Diversity Index (H) of Trees and Shrubs 7.35
Figure 7.10: Species Diversity Index (H) of Herbs 7.35
Figure 7.11: Location of sites for water sampling 7.47
Figure 7.12: Seasonal Variation in density of periphyton 7.53
Figure 7.13: Seasonal variation in Species Diversity Index (H) of periphyton 7.53
Figure 7.14: Seasonal Fluctuation in Evenness Index (E) of periphyton 7.53
Figure 7.15: Macro-invertebrates density (individuals/m2) 7.56
Figure 7.16: BMWP scores a different sites in different seasons 7.58
Figure 7.17: ASPT scores a different sites in different seasons 7.58
Figure 8.1: Drainage downstream of Dri and Talo (Tangon) dam sites 8.24

LIST OF PLATES
Plate 7.1: Blue green algae recorded from Dri and Talo (Tangon) rivers 7.63
Plate 7.2: Diatoms recorded from Dri and Talo (Tangon) rivers 7.64
LIST OF ANNEXURES
Annexure I: Approved Scoping and TOR by MoEF, GOI vide its letter No. J-
12011/61/2006-IA.I dated November 30, 2009
Annexure II: Revised TOR by MOEF, letter No. J-12011/60/2006-IA-I dated April
26, 2013
Annexure III: ToR Compliance
Annexure IV: Hydrology
Annexure V: Geology
Annexure VI: Inventory of Plants
References
Photographs

Environmental Impact Assessment (EIA) Report of Etalin HE Project
Proponent: M/s Etalin Hydro Electric Power Company Limited (EHEPCL) 1.1
Consultant: RS Envirolink Technologies Pvt. Ltd.
1.1 GENERAL
The state of Arunachal Pradesh has vast Hydro Power potential. The main rivers that flow
through Arunachal Pradesh region are Dibang, Lohit and Siang. Dibang River, also known as Dri
at its origin, is the major tributary of Brahmaputra River. Dri and Talo (Tangon) rivers meet
near Etalin village; downstream of the confluence of Dri and Talo (Tangon) rivers, the river is
named Dibang.
1.2 ETALIN H.E. PROJECT
Etalin HEP is a run-of-the-river project that will be using the waters of Dri and Talo (Tangon)rivers
in Dibang Valley district of Arunachal Pradesh. The diversion structure on Dri limb is located near
Eron village, around 22 km from Etalin village while the diversion structure on Talo (Tangon)
limb is located near Avonli village, around 17 km from Etalin village. The powerhouse site is
located near Etalin village, around 185 km from Roing, the district headquarter of Lower Dibang
Valley district. Anini, the district headquarter of Dibang Valley district, is around 240 km north of
Roing. The nearest railhead is at Tinsukia, about 110km from Roing. Roing and Tinsukia are
connected by means of NH-37 and a district road, which includes crossing river Lohit at Dhola.
The project site is about 300km from Tinsukia. The location of the project is shown in Figure 1.1.
1.2.1 Purpose of the Study
The purpose of Environmental Impact Assessment (EIA) is to assist in the decision making
process and to ensure that the project options under consideration are environmentally sound
and sustainable. This Environmental Impact Assessment (EIA) study has been conducted to
identify possible environmental impacts and to suggest ways for mitigating or minimizing them.
The EIA also identifies the possible benefits and adverse impacts on the environment as a result
of construction and operation of the project. The Environment Management Plan (EMP) provides a
plan which, upon implementation, will reduce impacts of the project and minimize environmental
degradation. This minimization may be a result of implementation of a project alternative or
project modifications or environmental protection measures which simply reduces the severity or
magnitude of impacts.
1.2.2 Scope of the Study
The general scope of this EIA study is as follows:
Assessment of the existing condition of physico-chemical, ecological and socio-economic
aspects of environment;
Identification of potential impacts on various environmental components due to activities
envisaged during construction and operational phases of the proposed hydro-electric project.
Prediction of significant impacts on major environmental components;
Preparation of Environmental Management Plan (EMP) outlining measures to minimize adverse
impacts during construction and operational phases of the proposed project. This includes
components like Catchment Area Treatment Plan (CAT), Green Belt Development
Chapter INTRODUCTION
1

Environmental Impact Assessment (EIA) Report of Etalin HE Project
Proponent: M/s Etalin Hydro Electric Power Company Limited (EHEPCL) 1.2
Consultant: RS Envirolink Technologies Pvt. Ltd.
Figure 1.1: Map of Arunachal Pradesh showing location of Etalin H.E. Project

Environmental Impact Assessment (EIA) Report of Etalin HE Project
Proponent: M/s Etalin Hydro Electric Power Company Limited (EHEPCL) 1.3
Consultant: RS Envirolink Technologies Pvt. Ltd.
Plan, Fisheries development, conservation/management plan, Muck Disposal Plan, Dam Break
Analysis etc;
Formulation of Rehabilitation and Resettlement Plan as per ‘The Right to Fair Compensation and
Transparency in Land Acquisition, Rehabilitation and Resettlement Act, 2013 (RFCT_LARR)’, The
National Rehabilitation and Resettlement Policy (NRRP), 2007 and State Rehabilitation and
Resettlement Policy (SRRP), 2008 of Arunachal Pradesh;
Formulation of environmental monitoring plan for construction and operation phases;
Estimation of Cost for implementation of Environmental Management Plan, Resettlement &
Rehabilitation Plan, Catchment Area Treatment Plan and Environmental Monitoring Programme.
1.3 CASCADE DEVELOPENT PLAN
Dri and Talo (Tangon) rivers are two major rivers in Dibang Valley district. There are seven
projects planned on Dri river which is main limb of Dibang river. Similarly there are two projects
planned on Talo (Tangon) river. These are:
On Dri Limb (Dibang river)
Upstream Projects
Etalin (3097 MW) on Dri river limb (Dri Dam)
Agoline (375 MW) on Dri river
Mithundon (400MW) on Dri river
Etabue on Ange Pani river, a tributary of Dri river
Amuliin (420 MW) Mathun river, tributary of Dri river
Emini (500 MW) Mathun river, tributary of Dri river
Downstream Projects
Dibang Multipurpose (3000 MW) project on Dibang river
On Talo (Tangon) Limb
Upstream Projects
Etalin (3097 MW) on Talo (Tangon) river limb (Tangon Dam)
Attunli (680 MW) on Talo (Tangon) river
Malinye (335 MW) on Talo (Tangon) river
Downstream Projects
Dibang Multipurpose (3000 MW) project on Dibang river
Out of about 79 km long river stretch of Dri river from origin to its confluence with Talo
(Tangon) river, these projects will use up about 33.6 km (42%) of main Dri river stretch. Major
free riverine stretch of 18.93 Km is between Amulin and Emini HEPs. Free flowing river stretch
in adjacent projects can be seen from L-sections given at Figures 1.2 & 1.3. There are 3
projects upstream of Dri limb of Etalin HEP on main Dri river and 3 projects on its tributaries
i.e. Mathun and Ange Pani whereas there are 2 projects upstream of Talo (Tangon) river limb.
There is one downstream project which is Dibang Multipurpose Project whose FRL is at a
distance of 2 Km along the river from the TWL of Etalin HEP.
1.4 STUDY OF ALTERNATIVES
1.4.1 Alternative Layouts
Since the conception of the project, several alternative layouts were developed and analyzed.
The merits and demerits of the selected layout as discussed in DPR of the project have been
being been described in the following paragraphs.

Environmental Impact Assessment (EIA) Report of Etalin HE Project
Proponent: M/s Etalin Hydro Electric Power Company Limited (EHEPCL) 1.4
Consultant: RS Envirolink Technologies Pvt. Ltd.
Figure 1.2: L-section of Dri river showing cascade of projects
Figure 1.3: L-section of Talo (Tangon) river showing cascade of projects
1.4.1.1 Layout by CEA
The project, as originally conceived by Central Electricity Authority (CEA) at the pre-feasibility
stage, envisaged construction of two diversion structures, one each on Dri and Talo (Tangon)
rivers with the underground powerhouse located at their confluence. The riverbed level at the
selected diversion sites on both rivers was at El 1040m and the level at the location of tailrace
discharge was El 600m. Water conductor systems along both rivers were proposed underground
and culminated in a common underground powerhouse located in the hill mass at the
confluence of the two rivers near Etalin village. The water conductor system of Dri limb of the
project followed the left bank of Dri and that of the Talo (Tangon) limb followed the right bank
of Talo (Tangon). The total length of the two water conductor systems aggregated to 26km. The
installed capacity was estimated as 3045MW. The line layout of the scheme is shown in Figure
1.4.

Environmental Impact Assessment (EIA) Report of Etalin HE Project
Proponent: M/s Etalin Hydro Electric Power Company Limited (EHEPCL) 1.5
Consultant: RS Envirolink Technologies Pvt. Ltd.
Figure 1.4: Alternatives studied in Etalin HE Project
1.4.1.2 Layout by NHPC
The project was subsequently studied by National Hydroelectric Power Corporation Ltd. (NHPC)
as part of preparation of the Pre-Feasibility Report (under Government of India’s 50,000 MW
Hydro Initiative). Based on their study of the topography and geology of the area, NHPC
proposed some modifications to the project layout conceived by CEA. The main changes
comprised:
Downstream relocation of dam site on Dri river to about 1.5 km downstream of the
confluence with Ayo Pani nala. The proposed dam site is near Yuon Village. Riverbed at this
location is about El 980 m.
It was observed that by keeping the diversion structure at the same location as proposed by
CEA, the HRT had to negotiate Ayopani, a deeply dissected nala with presence of thick
fluvio-glacial deposits. It was apprehended that adequate rock cover over the tunnel may
not be available without a very long detour. Keeping this in view, an alternative diversion
site located about 1.5km downstream of confluence of Ayo Pani with Dri river was identified.
Downstream relocation of dam site on Talo (Tangon) river to about 800 m downstream of
confluence with Anon Pani nala. The proposed dam site is near Avonli Village. The riverbed
at the proposed location is El 920 m.
In this case, the diversion site proposed by CEA was not found suitable due to non-
availability of rock on the left bank of the river within 1km from the dam axis identified by
CEA. Keeping this in view, a site located about 800m downstream was proposed. Another
advantage of this site was utilization of the discharge of Anon Pani and Kun Pani joining the
river Talo (Tangon) downstream of the axis proposed by CEA. Reaches further downstream
were also examined and were not found suitable due to increase in width of valley and

Environmental Impact Assessment (EIA) Report of Etalin HE Project
Proponent: M/s Etalin Hydro Electric Power Company Limited (EHEPCL) 1.6
Consultant: RS Envirolink Technologies Pvt. Ltd.
presence of thick overburden on the right bank of the river. In addition, further shifting of
the dam towards downstream would have resulted in increase in the height of diversion
structure for maintaining same FRL and gross head.
Splitting the single powerhouse into two independent underground powerhouses one for Dri
limb and the other for Talo (Tangon) limb. The two powerhouses were however kept in the
same general location as proposed by CEA, with tailrace outfall level retained at El 600 m.
The water conductor system was changed and two HRTs and two surge shafts were
proposed for each limb.
The total installed capacity of the project was increased to 4000 MW. The scheme on Talo
(Tangon) envisaged diversion of 426 cumec of water to utilize a gross head of about 466.5m to
generate 1500MW (6x250 MW) of power. Dri limb of the project was envisaged to generate 2500
MW (10x250 MW) of power through a design discharge of 720cumec and a gross head of 461.5m.
Other alternatives were also studied. One of them comprised locating the waterway system for Dri
limb on the right bank of Dri and that of Talo (Tangon) limb on the left bank of Talo (Tangon).
Two separate powerhouses were accordingly planned with the tailrace levels still kept at around El
600m. In other words, two independent schemes were formulated with Talo (Tangon) limb
scheme on left bank of Talo (Tangon) and Dri limb scheme on right bank of Dri river. As the
alternatives were developed, it was found that the tunnel alignments in both limbs were to
negotiate several deep nalas and, consequently, the tunnel lengths were found to increase by
6.6km on Dri limb and 4km on Talo (Tangon) limb. The areas identified for locating the
powerhouses also did not provide adequate space for working. Moreover, it was also noted that
substantial additional infrastructure facilities would be required, particularly on Dri limb where the
existing road is on the left bank and the valley is quite steep. Clearly, the overall cost of the
project would increase considerably without any benefit of additional generation. Consequently,
the proposal for laying out the schemes on left bank for Talo (Tangon) and right bank for Dri was
rejected at the initial stage itself. Figure 1.4 shows the schemes studied by NHPC.
Project components as envisaged by NHPC are briefly described in the following
paragraphs:
The diversion structure on Talo (Tangon) comprised a 135m high concrete gravity dam having a
gross storage capacity of 50.61MCM. The proposed MWL / FRL was kept at El 1050m, and MDDL
was proposed at El 1030m. Eight spillway bays (7.0mX9m), were conceived, out of which six
are provided as lower spillways and remaining two as upper spillways. The invert levels of the
lower and upper spillway bays were fixed at elevation 1000m and 1040m, respectively.
The diversion structure on Dri was a 70m high concrete gravity dam having a gross storage
capacity of 28.16MCM. The proposed MWL / FRL for the scheme was El 1045m with MDDL
at El 1025m. Ten spillway bays (7.5mX9m) were provided, with eight bays as lower
spillways and remaining two as upper spillways. The invert levels of the lower spillway bays
and upper spillway bays were fixed at elevation 998m and elevation 1036m, respectively.
Two numbers intakes of 8.0 x 9.0m were envisaged for drawl of 255.6 cumec of water
through each opening for Talo (Tangon) limb to feed the desanding chambers. For Dri limb,
four nos. of intakes of size 7.3 x 8.3m were considered for drawl of 216.0 cumec of water
through each opening.
Four desanding chambers (350mx17mx23m, each) were proposed on Talo (Tangon) limb
and eight chambers (8-300mx16mx23m, each) were proposed on the Dri limb.

Environmental Impact Assessment (EIA) Report of Etalin HE Project
Proponent: M/s Etalin Hydro Electric Power Company Limited (EHEPCL) 1.7
Consultant: RS Envirolink Technologies Pvt. Ltd.
Two circular headrace tunnels were proposed on each limb. The tunnel on Dri limb were
10.5m diameter and 9.7km and 9.9km long while those on the Talo (Tangon) limb were 8m
in diameter and 12km and 12.5km long.
Two 15.0m diameter, 125m high restricted orifice surge shafts were proposed in the Talo
(Tangon) limb. Water from each surge shaft was to be carried through a 6.7m diameter
steel lined pressure shaft with vertical drop of 361m. Surge shafts in the Dri limb were
23.0m in diameter and 125m high. The steel lined pressure shafts were of diameter 5.5m
and 6.7m and negotiated a vertical drop of 379m.
Surge shafts in the Dri limb were 23.0m in diameter and 125m high. The steel lined
pressure shafts were of diameter 5.5m and 6.7m and negotiated a vertical drop of 379m.
Two separate caverns having dimension 180 m X 24.0 m X 48.0 m for Talo (Tangon) limb
and 270m x 24.0m x 48.0m for Dri limb were proposed to accommodate six numbers of
250MW and 10 nos. of 250 MW turbines, respectively. Orientation of the cavity was
considered in E-W direction.
1.4.1.3 Alternatives Studies in the Present DPR
At the start of work on the present DPR, a detailed study of the reports prepared by CEA and
NHPC was carried out along with on-site assessment of the proposals contained therein.
Specialists from diversified fields such as hydrology, geology, planning and design were
involved and they came up with the following observations.
The dam site proposed in PFR for the Dri limb of the project appears in general suitable.
However, an alternative site that offers a superior location exists downstream of this axis.
On the Talo (Tangon) limb, the left bank at the proposed dam axis does not appear to be
very attractive due to the existence of a large terrace. Upstream and downstream of this
axis, the river flows along the right bank in a width of 20m while the left bank shoal
formation extends up to 50m (width) at places and is covered by large boulders as big as 5
cubic meter in size. In this case too, an alternative dam axis, about 2.3km upstream, was
identified for further study. Riverbed level at this new location is of the order of El 1000m.
The intake structures, as proposed in the PFR, are suitably located vis-à-vis the proposed
dam axis. The intakes also appear to be sized appropriately.
Based on preliminary observation of surface geology, orientation of desilting chambers on
Talo (Tangon) limb is considered suitable from rock mass structural stability point of view.
Construction of eight large underground desanding chambers will be a major challenge that
will be fraught with significant geological and construction risks. Attempt should be made to
find other ways of minimizing sediment entry into the water conductor system. Even the
proposed desanding arrangement on the Talo (Tangon) side, comprising of four large
underground chambers, will also involve substantial effort.
The proposed 6.7m diameter pressure shafts would require a very thick steel liner at the
lower portion of the pressure shafts, and is considered not preferable from fabrication and
erection point of view. Also providing a trifurcation in such a thick steel plate shall be
extremely difficult from design (particularly, weld design) and fabrication point of view.
The powerhouse is proposed to be accommodated within the ridge; in-situ stresses across
the gable walls would require careful assessment. Moreover, provision of two separate
powerhouses will leave a rock wall between the two caverns which are not desirable from
construction and operational point of view.
Keeping the above observations in view, the detailed assessment of different appurtenant of

Environmental Impact Assessment (EIA) Report of Etalin HE Project
Proponent: M/s Etalin Hydro Electric Power Company Limited (EHEPCL) 1.8
Consultant: RS Envirolink Technologies Pvt. Ltd.
both limbs of the project was made in the initial stages based on the data available on
topography, geology and hydrology etc. The summary of the studies and conclusions drawn
from these are discussed in the following paragraphs. Alternatives considered for each
component of the project are described as applicable.
a) Diversion Site on Dri River
As per PFR, the diversion site on Dri river was located near Yuron village, about 1500m
downstream of confluence of Ayo Pani nala with Dri river. During the site reconnaissance in the
initial DPR stage, an alternative diversion site located about 250m downstream of the PFR site
was identified. The PFR stage dam axis is termed as Alternative-I and the downstream dam axis
as Alternative-II.
At the Alternative-I dam site Dri river flows in a meandering course through a narrow to
moderately wide modified V-shaped valley. The river exhibits a westerly bend with convexity
towards the left bank; the proposed axis is located at the curvature. The water flow is
approximately 60m wide and a shoal exists on the right bank which is covered with boulders of
various sizes (even up to 3m in diameter). The valley width at this site is around 90m (Figure
1.4). Massive gneissic bedrock has been observed protruding in the river on the left bank. The
bank rises with a slope of about 50º up to about 80m above the riverbed and, beyond that, at
70° up to the road level. Vegetation is rather sparse on this bank. The right bank of the river is
covered by a shoal at the foot of the hill slope which then rises up at an angle of around 45º
and is covered by dense forest. The bedrock comprising granodiorite gneiss is medium strong to
strong with four major joint sets. The foliation joint is oblique to the river, dipping towards
upstream at 247º/55º to 75º. The riverbed is covered with pebbles, cobbles, boulders and sand.
Boulders are as big as 3m3 to 5m3.
While the site generally appears suitable for locating a dam-spillway structure, the width of the
valley is somewhat inadequate. Substantial excavation would be required on the abutments to
accommodate the dam-spillway structure. Presence of the bend in the river course would also
make it difficult to locate and design proper energy dissipation arrangement. Presence of a nala
on the left bank of the river would pose further constraints for locating the diversion structure
at this site.
Keeping in view the above factors, another site located about 250m downstream was identified
and designated as Alternative-II site.
The river at this site flows along almost straight course for length of about 500m. The river
valley is about 110m wide with the water way taking up approximately 60m. A 50m wide shoal
exists on the left bank which is covered with boulders of various sizes (up to 3m in diameter).
The riverbed is generally covered by large boulders, up to 3 to 5m in size. The bedrock is
exposed along river edge on both the banks. The left bank has uniform, moderate to steep
slopes and exposes granodiorite gneiss all through the slope with occasional occurrence of
superficial overburden over the rock mass. The area in general is covered by thick vegetation.
One nala has been observed on the upstream of the proposed dam axis. The right bank initially
rises in a steep slope (700) followed by moderate to gentle upward slopes. The rock exposures
have been observed just at the riverbed level. These are followed upslope by vegetation cover
and grass cover at higher altitude. The bedrock on the right bank appears to be massive gneiss
Environmental Impact Assessment (EIA) Report of Etalin HE Project
Proponent: M/s Etalin Hydro Electric Power Company Limited (EHEPCL) 1.9
Consultant: RS Envirolink Technologies Pvt. Ltd.
with some local folds.
Alternative-II diversion site on Dri was thus found to offer better conditions to locate the dam-
spillway and was selected for further studies during the DPR preparation. Subsequent detailed
assessment of topographic, geologic, design and planning aspects have confirmed that this site
is indeed suitable for locating the diversion structure.
b) Diversion site on Talo (Tangon) River
On the Talo (Tangon) limb also, two alternative diversion sites have been studied. The diversion
site selected by NHPC is called Alternative-I. As discussed above, this site is located about
600m downstream of the confluence of Anon Pani nala with Talo (Tangon).
River Talo (Tangon) at this site flows along a meandering course through a flat and wide valley.
Upstream of the proposed axis, the river takes a right angled bend. The riverbed is covered by
large boulders, gravels, pebbles admixed with sand. Extensive terrace deposits occupy the left
bank, even at the road level and above. The terrace extends upstream and downstream of the
proposed axis. Toe erosion of the terrace is quite prominent in the upstream area where the
river takes the right-angled bend. Beyond the terrace, the slope of the left bank is moderate to
steep and is covered by thick forest. Upstream and downstream of the terrace, granodiorite
rock is exposed along the river water edge. The right bank has a steep slope covered by thick
vegetation but patches of rock exposures can be seen through the vegetation cover all along
the slope. The width of the valley, approximately 20m above riverbed level, is estimated to be
170m. The rock at the proposed dam site is slightly to moderately weathered, jointed and
medium strong to strong granodiorite/diorite gneiss, massive in nature.
Visual examination of the site indicated that the bedrock in the riverbed could be at a
considerable depth. In order to assess the depth of overburden, exploratory drilling and
geophysical investigations through seismic profiling were commissioned immediately after the
start of the DPR preparation work. Exploration of riverbed through two drill holes indicated the
presence of thick terrace deposits extending to a considerable height on the left abutment and
existence of more than 70m thick overburden in the riverbed. With the riverbed elevation at
this location being around El 945m, the height of dam for an FRL of El 1050m would be around
110m above the existing riverbed level. A wide valley with deep bedrock was not considered
amenable to locate a concrete gravity structure.
Keeping the above aspects in view another alternative site (Alternative-II) located about 2.3km
upstream was identified. The river at this dam site flows through a flat and narrow valley. The
river Talo (Tangon) at the site flows along more or less straight course for a considerable
length. The right abutment is in general covered by thick overburden that supports dense
vegetation and occasional exposures of bedrock are observed at higher elevations. The left
abutment has very steep slope and the bedrock is exposed right from riverbed level and
extends all along up to road and above. The riverbed level at the site is around El 1000m and
the dam height for an FRL of El 1050m would be about 50m above the riverbed. This site was
therefore selected for locating the dam and further investigations were focused on this site.
c) Water Conductor Systems
Alternative studies related to the water conductor systems comprised the alignment of the

Environmental Impact Assessment (EIA) Report of Etalin HE Project
Proponent: M/s Etalin Hydro Electric Power Company Limited (EHEPCL) 1.10
Consultant: RS Envirolink Technologies Pvt. Ltd.
tunnels, the size and number of tunnels as well as requirement, and subsequently alignment
of the desilting chambers. Alternative locations of surge shafts also formed part of the initial
studies. The selected tunnel alignments have considered such factors as the optimal overall
cover, optimal length of adits etc. A single tunnel is proposed for each limb based on the study
of construction logistics and cost. Geologically also, a single large diameter tunnel is considered
acceptable. The HRT on Dri limb is proposed as a 11.3m diameter circular tunnel while the HRT
on Talo (Tangon) limb is 9.7m in diameter. Studies have indicated that desilting chambers could
be eliminated in case of Dri limb, no such arrangement is therefore provided. Three
underground desilting chambers are however provided in Talo (Tangon) limb. Each HRT
culminates in a surge shaft from where pressure shafts emanate. The layout of the water
conductor system adopted at DPR stage is shown in Figure 1.4.
d) Powerhouse Complex
In case of the powerhouse, two separate caverns (having dimension 180m x 24.0m x 48.0m for
Talo (Tangon) limb and 270m x 24.0m x 48.0m for Dri limb) were to be located within ridge at
the confluence of Dri and Talo (Tangon) rivers as proposed by NHPC during PFR stage. In the
CEA study, a single powerhouse was proposed with an installed capacity of 3045 MW. The
provision of two separate powerhouse caverns is not desirable from construction and
operational point of view. Moreover, such an arrangement would leave a rock wall in between
the two caverns. Stability of this wall located in a ridge open on two sides could be of concern.
A single powerhouse cavern is therefore retained to accommodate the power plant for both the
limbs of the project.
1.5 POLICY, LEGAL & ADMINISTRATIVE FRAMEWORK
In the emerging scenario of rapid economic growth, sustainability of existing resources for the
present and future generations requires an integrated approach so that, the existing resources
are optimally utilized without causing undue damage to the environment. To achieve this
objective, the Ministry of Environment, Forests & Climate Change (MoEF&CC), Government of
India has enacted Acts, Legislations, Guidelines and Standards to ensure sustainable
development and conserve the environment. These are required to be compiled by the Project
proponents while executing the development of Project. The Project proponent thus prepares
the EIA report, incorporating management plans to mitigate the adverse impacts (if any) for
perusal of the MoEF&CC. The MoEF&CC in turn evaluates the proposal and suggests stipulations
for mitigation of adverse impacts while granting the clearance for execution of the Project. The
important Environmental legislations laid down for conservation of environment are presented
in Table 1.1.
Table 1.1: Key Environmental Legislations in India
Name Scope and Objective Key Areas Operational Agencies/
Key Players
Water (Prevention
and Control of
Pollution) Act, 1974,
Amendment 1988
To provide for the
prevention and control
of water pollution and
enhancing the quality of
water
Controls sewage and
industrial effluent
discharges
Central and State
Pollution Control Boards
Air (Prevention and
Control of Pollution)
Act 1981 Amendment
1987
To provide for the
prevention and control
of air pollution
Controls emissions
of air pollutants
Central and State
Pollution Control Boards
Forest (Conservation)
Act,1980 Amendment
To consolidate
acquisition of common
Regulates access to
natural resources,
State Government and
Central Government

Environmental Impact Assessment (EIA) Report of Etalin HE Project
Proponent: M/s Etalin Hydro Electric Power Company Limited (EHEPCL) 1.11
Consultant: RS Envirolink Technologies Pvt. Ltd.
Name Scope and Objective Key Areas Operational Agencies/
Key Players
1988 property such as
forests; halt India’s
rapid deforestation and
resulting Environmental
degradation
state has a
monopoly right over
land; Restriction on
de-reservation and
using forest for non-
forest purpose
Wildlife (Protection)
Act, 1972,
Amendment 1993
To protect wildlife Creates protected
areas (National
parks/ sanctuaries)
categories of wildlife
which are protected
Wildlife Advisory Boards;
Central Zoo Authorities
Environment
(Protection) Act,
1986
To provide for the
protection and
improvement of
Environment
An umbrella
legislation;
supplements
pollution laws
Central Government
nodal agency MoEF, can
delegate powers to state
departments of
Environments
National Policy on
R&R 2007, The Right
to Fair Compensation
& Transparency in
Land Acquisition,
Rehabilitation and
Resettlement Act,
2013 and Arunachal
Pradesh State R&R
Policy 2008
Resettlement and
Rehabilitation of Project
affected people and
Social Impact
Assessment
Social issues Central Government
EIA Notification 2006
with subsequent
amendment (2009 &
2011)
Environmental Impact
Assessment
Environmental
Protection
Project Developer,
State and Central
government
(Source: Government of India Publications)
Like many other developmental activities, the proposed Project, while providing planned power
generation could also lead to a variety of adverse environmental impacts. However, by proper
planning at the inception stage and by incorporating appropriate mitigation measures in the
planning, design, construction and operation phases, the adverse impacts can be minimized to a
large extent, whereas the beneficial impacts could be maximized. The main objective of the EIA
study is to assess the positive and negative impacts likely to accrue as a result of the
construction and operation of the proposed Project and to suggest suitable Environmental
Management Plans (EMP) to ameliorate the adverse impacts, if any. A well-designed
environmental monitoring programme covering various critical parameters to be covered in the
Project construction and operation phase would also be required. The present EIA for Etalin HEP
has been prepared based on the analysis of baseline data and accordingly Environment
Management Plan has been prepared for seeking Environment Clearance.
The principal Environmental Regulatory Agency in India is the Ministry of Environment, Forests
and Climate Change (MoEF&CC). MoEF&CC formulates environmental policies and accords
environmental and Forest clearance for the projects. The State Pollution Control Board (SPCB)
conducts Public hearing and accords Consent to Establish and Consent to Operate for the
project.
The project would need the following clearances before starting construction:
Public hearing as per EIA notification 2006 (and addendum thereafter)

Environmental Impact Assessment (EIA) Report of Etalin HE Project
Proponent: M/s Etalin Hydro Electric Power Company Limited (EHEPCL) 1.12
Consultant: RS Envirolink Technologies Pvt. Ltd.
Prior Environmental Clearance from the MoEF&CC, GoI;
Forest Clearance from MoEF&CC;
Consent to Establish from the Arunachal Pradesh State Pollution Control Board;
1.6 EIA NOTIFICATION, 2006
Etalin (3097 MW) HEP is a Category ‘A’ project (>50 MW), as per item 1 (c) of Schedule
attached to EIA notification of September 2006 and require environmental appraisal from the
Ministry of Environment, Forests and Climate Change (MoEF&CC), Government of India. The
environmental clearance process involves three stages:
Scoping
Public Consultation
Appraisal
As per MoEF&CC EIA Notification, dated 14th September 2006 (and amendments
thereafter), under Activity 1(c) - River Valley projects; if, the capacity of power generation for
any HEP will more than 50 MW, the project falls under Category A. Comprehensive EIA study
needs to be undertaken and environmental clearance to be obtained from MoEF&CC before start
of any construction activity.
The Etalin HEP (3097 MW) is a Category A project (> 50 MW), as per item 1 (c) of Schedule
attached to EIA notification of September 2006 and requires environmental appraisal from the
Ministry of Environment, Forests & Climate Change (MoEF&CC), Government of India.
Scoping: The scoping and Terms of Reference (TOR) for EIA studies was earlier accorded to
this project on 15.1.2007 under the provisions of EIA Notification of September 14, 2006 to
NTPC Ltd. Later on the project was allotted to joint venture Company Etalin Hydro Electric
Power Company Limited a subsidiary of Jindal Power Ltd. and Hydro Development Corporation
of Arunachal Pradesh vide letter no. Sectt/Power/03/Jindal/2009 dt. 29.8.2009. A fresh Form 1
including proposed Terms of Reference (TOR) for the EIA study along with Pre Feasibility Report
(PFR) in prescribed format was submitted to MoEF&CC for determining TOR by Expert Appraisal
Committee under the category of River Valley Projects of Ministry of Environment & Forests,
Government of India. The TOR for 4000 MW was conveyed by MoEF&CC vide letter no. J-
12011/61/2006-IA-I dt. 30.11.2009 (Refer Annexure I).
On approval of Scoping, EIA study was undertaken with extensive field data collection during
three different seasons, data generation and analysis, impact assessment and preparation of
Environmental Management Plan (EMP) as per the TOR. After the downward revision of capacity
of Etalin HEP from 4000 MW to 3097 MW with slight changes in project features, MoEF&CC vide
letter no. J-12011/61/2006-IA-I dt. 26.04.2013 issued revised TOR valid for 2 years from the
date of issue of letter (Refer Annexure-II). A draft report was prepared incorporating all the
above required for submission for other two stages viz. Public Consultation and Appraisal.
Public Consultation:
After the preparation of Draft EIA report along with Executive Summary, Public consultation
process was initiated as per stipulated public consultation process by Arunachal Pradesh State
Pollution Control Board (APSPCB). Public hearing was held on 12 December, 2014 at Etalin
Head Quarter, under Etalin Circle, Dibang Valley District of Arunachal Pradesh. After the
completion of the Public Consultation minutes of the same have been appended as a separate

Environmental Impact Assessment (EIA) Report of Etalin HE Project
Proponent: M/s Etalin Hydro Electric Power Company Limited (EHEPCL) 1.13
Consultant: RS Envirolink Technologies Pvt. Ltd.
document in the form of report detailing the proceedings and video of the entire event has
been submitted to MoEF&CC by APSPCB. Major issues raised during Public Consultation process
and responses addressed in the Final EIA/EMP report are given in a separate chapter i.e. in
Chapter 14 of EMP
Appraisal: After completion of Public Consultation process, the final EIA report has been
prepared for submission to MoEF&CC for appraisal and environment clearance.
Environmental Clearance:
The final EIA report prepared as per the approved TOR after incorporating the concerns and
suggestions made during the Public Hearing, is now submitted to MoEF&CC for appraisal and
grant of Environment Clearance.
1.7 FOREST CLEARANCE
Forest Clearance under the Forest (Conservation) Act 1980 from Ministry of Environment,
Forests & Climate Change, Government of India is one of major step in project development as
the project is required to divert 1155.11 ha of forest land for non-forestry purposes i.e. for the
purpose of construction of various project components. Application for diversion of forest land
has already been moved and proposal is under examination by the regional office of MoEF & CC,
Shillong.
1.8 STATE R&R POLICY
In addition to the National Rehabilitation and Resettlement Policy 2007 by Ministry of Rural
Development (Department of Land Resources, Land Reforms Division), Government of India in
2007, and recently notified The Right to Fair Compensation and Transparency in Land
Acquisition, Rehabilitation and Resettlement Act, 2013, the Government of Arunachal Pradesh
has come out with a policy in September 2008 as State Rehabilitation & Resettlement Policy
2008 to address specific concerns of the state. R&R plan has been prepared as per state policy
and recent 2013 Act.
1.9 DISCLOSURE BY THE CONSULTANT
Final EIA/EMP reports have been prepared by M/s RS Envirolink Technologies Pvt. Ltd., (RSET)
Gurgaon which is a QCI-NABET accredited company to undertake River Valley, Hydroelectric,
Drainage and Irrigation Projects (Category ‘A’) according to the TOR approved by MoEF&CC. A
copy of the Accreditation certificate along with the list of experts involved is appended at the
beginning of the report.
1.10 OUTLINE OF THE REPORT
The Comprehensive EIA for the proposed Etalin hydroelectric project has been presented in two
parts - First part presents the findings of EIA study and the second part includes various
mitigation as well as management measures under the Environmental Management Plan. The
report has been prepared according to approved TOR of the project and the compliance to the
TOR is given at Annexure III.
The contents of Part - I of the document are organized as follows:

Environmental Impact Assessment (EIA) Report of Etalin HE Project
Proponent: M/s Etalin Hydro Electric Power Company Limited (EHEPCL) 1.14
Consultant: RS Envirolink Technologies Pvt. Ltd.
PART – I: Environmental Impact Assessment (EIA) Report Chapter-1: Introduction: The Chapter gives brief of the project. The Environmental Clearance
procedure and the related policies, legal and administrative framework for the same have been
summarized in this chapter. The objectives and need for EIA study too have been covered. Brief
description of the proposed hydroelectric project is also given.
Chapter-2: Project Description & Infrastructure: It gives the salient features of the project
and also the brief of major components of the project. In addition, the details of various
infrastructural facilities including land requirement for different components of the project and
equipment to be deployed for construction has been covered.
Chapter-3: Methodology: It includes the methodology adopted for conducting the
Comprehensive EIA study. The details of selected sampling sites and specific methodology
adopted for each environmental parameter have been given.
Chapter-4: Hydrology: It covers aspects like river system, drainage, basin characteristics,
hydro-meteorology, water availability, flow series, design flood, etc. It is being appended as
Annexure –IV.
Chapter-5: Geology & Seismicity: It includes details on regional geology of the area,
geomorphology, and geological details of various project components along with their
geotechnical appraisal. In also covers seismo-tectonic environment of the project area. It is
being attached as Annexure-V.
Chapter-6: Environmental Baseline Status: Physico-chemical Aspects: Presents physic-
chemical aspects of environment. The study is based on collection of data from various
secondary data sources. As a part of the Comprehensive EIA study, detailed ecological survey
was conducted for various seasons. The findings of the study were analyzed and ecological
characteristics of the study area have been described in this Chapter.
Chapter-7: Environmental Baseline Status: Biological Resources: Presents biological
aspects of environment. The study is based on collection of data from various secondary data
sources. As a part of the Comprehensive EIA study, detailed ecological survey was conducted
for various seasons. The findings of the study were analyzed and ecological characteristics of
the study area have been described in this Chapter.
Chapter-8: Assessment of Impacts: It describes the anticipated positive and negative
impacts as a result of the construction and operation of the proposed Etalin hydro-power
project. It is essentially a process to forecast the future environmental conditions of the project
area that might be expected to occur as a result of the construction and operation of the
proposed project. An attempt was made to forecast future environmental conditions
quantitatively to the extent possible. But for certain parameters, which cannot be quantified,
the general approach has been to discuss such intangible impacts in qualitative terms so that
planners and decision makers are aware of their existence as well as their possible implications.
PART – II: Environmental Management Plan (EMP)
The Part-II of the report deals with different Environmental Management Plans prepared to

Environmental Impact Assessment (EIA) Report of Etalin HE Project
Proponent: M/s Etalin Hydro Electric Power Company Limited (EHEPCL) 1.15
Consultant: RS Envirolink Technologies Pvt. Ltd.
mitigate the adverse environmental impacts. The contents of the Part-II are organized as
follows:
Chapter-1: Biodiversity Conservation & Management Plan: It delineates the plan for
mitigation of anticipated adverse impacts likely to accrue as a result of the proposed project on
the biodiversity of the area. The approach for formulation of Biodiversity Conservation Plan is to
maximize the positive environmental impacts and minimize the negative ones. After suggesting
environmental mitigation measures, the cost required for implementation of various measures
is also estimated.
Chapter-2: Catchment Area Treatment (CAT) plan: CAT plan methodology suggested by
SLUSOI has been used and Silt yield Index (SYI) method has been used for categorization of
sub-watersheds into priority classes. Treatment measures for very severe and severe categories
of sub-watersheds have been formulated. Cost required for implementation of CAT Plan too has
been estimated.
Chapter-3: Fisheries Conservation & Management Plan: It describes the various measures
to be undertaken for the Conservation & Management of the fish fauna.
Chapter-4: Solid Waste Disposal Plan: This chapter describes issues related to solid waste
disposal that are likely to accrue during the construction period and also the formulation of
management plan for the same.
Chapter-5: Public Health Delivery System: This chapter deals with the basic health care
facilities available in the area and setting up of new infrastructure as well as improvement of
existing infrastructure along with the cost estimates.
Chapter-6: Energy Conservation Measures: It deals with the provisions being made for the
reduction of pressure on the adjoining forest of the project area during the construction period
energy conservation measures like subsidy for fuel wood, etc. along with the cost of these
measures.
Chapter-7: Muck Disposal Plan: It deals with the rehabilitation of muck that is likely to be
generated during the construction of various project components and also suggests measures
for both engineering and biological measures for restoration of muck disposal sites in
environmentally sustainable manner.
Chapter-8: Landscaping & Restoration of Quarry & Working Areas: This chapter covers
adverse impact of construction activities on the landscape and suggests measures for
restoration of the disturbed area back to their similar or near-similar pre-construction conditions
and land use. It also includes green belt to be created along reservoir periphery and around the
colony areas.
Chapter-9: Reservoir Rim Treatment Plan: This Chapter describes the possibility of slope
failures, land slips, etc. due to fluctuation in water level along the reservoir periphery. In order
to mitigate the same, Reservoir Rim Treatment Plan and measures for treatment of existing
landslides/ slips, and prevention of further slides by undertaking engineering as well as

Environmental Impact Assessment (EIA) Report of Etalin HE Project
Proponent: M/s Etalin Hydro Electric Power Company Limited (EHEPCL) 1.16
Consultant: RS Envirolink Technologies Pvt. Ltd.
biological measures have been suggested. The cost estimation for various activities involved has
also been made.
Chapter-10: Air and Water Environment Management Plan: This chapter covers various
environmental risks that are foreseen during the construction on air, water and noise
environment in the project area and also deals with mitigation measures during the construction
and operational phase.
Chapter-11: Dam Break Modeling & Disaster Management plan: Dam Break Modeling
using MIKE11 model has been conducted. The results of the modeling exercise are outlined in
this Chapter. Disaster Management Plan (DMP) too has been outlined for implementation in
case of Dam Break.
Chapter-12: Compensatory Afforestation Programme: This Chapter discusses various
aspects of Compensatory Afforestation Programme to be implemented by the State Forest
Department.
Chapter-13: Environmental Monitoring Plan: This chapter deals with the issues of
implementation of various mitigation measures and environmental management plans during
project construction and operation phases. The environmental monitoring plan has been
suggested to assess the adequacy of various environmental safeguards and to compare the
predicted and actual scenario during construction and operation phases. This will help the
project proponents to formulate remedial measures not foreseen during the planning stage but
arising during these phases and to generate data for further use.
Chapter-14: Cost Estimates: It summarizes the cost to be incurred for implementation of the
Environmental Management Plan (EMP) and the Environmental Monitoring Programme.
Chapter-15: Public Consultation – Concerns and Responses: This chapter covers the
major issues raised during Public Consultation process and response given by
developer/consultant and where EIA related issues have been addressed in the EIA report.
Social Impact Assessment (SIA) and Rehabilitation & Resettlement Plan:
As the project involves displacement of more than 20 families, therefore as mandated by SRRP,
2008 of Arunachal Pradesh, a Social Impact Assessment report was prepared in addition to EIA
report. In addition based upon the SIA report findings an elaborate Rehabilitation &
Resettlement Plan for Project Affected Families has been prepared which deals with the
resettlement issues, rehabilitation measures, economic development package and benefits to be
given to the project affected families. These two reports have been appended as a separate
volume with the EIA volumes covering both the SIA report and R&R plan.
Environmental Flow Assessment Report
As mandated in the approved TOR for the project, a detailed Environmental Flow assessment
study was undertaken by Central Inland Fisheries Research Institute (CIFRI), Barrackpore and
findings of the same have been appended as a separate report along with the EIA volumes.

Environmental Impact Assessment (EIA) Report of Etalin HE Project
Proponent: M/s Etalin Hydro Electric Power Company Limited (EHEPCL 2.1
Consultant: RS Envirolink Technologies Pvt. Ltd.
2.1 PROJECT LOCATION & ACCESSIBILITY
The project is located in Dibang Valley district of Arunachal Pradesh, which is almost entirely hilly and
covered mostly by forests. The project area falls in the Lower Himalayan region and is located in a
remote area with limited local infrastructure. It envisages diversion of two rivers - Dri / Dibang (called
Dri limb) and Talo (Tangon) (called Talo (Tangon) limb). The dam site of the Dibang limb of the
project is located across Dri River near Yuron village about 22 km from Etalin. The Talo (Tangon) limb
consists of construction of dam about 800m upstream of Anon Pani confluence with Talo (Tangon)
river. The installed capacity for the scheme proposed on Dri limb is 1861.6MW, comprising of a small
hydro scheme of 19.6MW at the toe of the dam on Dri river and six (6) units of 307MW each in the
common underground powerhouse near Etalin village. The installed capacity for the scheme proposed
on Talo (Tangon) limb is 1235.4MW, including a small hydro scheme of 7.4MW envisaged at the toe of
the dam on Tangon river and four (4) units of 307MW each in the common underground powerhouse.
The total installed capacity of the project consequently is 3097MW. The Etalin Hydroelectric Project is
proposed upstream of the 3000MW Dibang Multipurpose Project being developed by NHPC.
The diversion structure on Dri limb is located near Yuron village, around 22km from Etalin village, and
can be approached via Etalin-Anini road. The diversion structure on Talo (Tangon) limb is located on
near Avonli village, 17 km from Etalin village and approachable by Etalin-Maliney road.
The powerhouse site is located near Etalin village, around 185 km from Roing, the district headquarter
of Lower Dibang Valley district. Anini, the district headquarter of Dibang Valley district, is around 240
km north of Roing. The nearest railhead is at Tinsukia, about 110 km from Roing. Roing and Tinsukia
are connected by means of NH-37 and a district road, which includes crossing river Lohit at Dhola.
The project site is about 300 km from Tinsukia. The nearest airport is at Dibrugarh, about 350km
from the project site via Dhola/Sadiya Ghat.
Etalin village can be reached by a single lane road which connects Roing to Anini via Hunli (see
Figure 2.1). The road crosses a high altitude pass between Roing and Hunli and is frequently blocked
by ice and snow during peak winter months.
2.2 SALIENT FEATURES OF THE PROJECT
Etalin HEP (6 X 307 MW at Dri Limb + 4 X 307 MW at Talo (Tangon) Limb + 19.6 MW + 7.4 MW) is a
run-of-the-river project that will be using the waters of Dri and Talo (Tangon) rivers in Dibang Valley
district of Arunachal Pradesh. Dri and Talo (Tangon) rivers meet near Etalin village; downstream of
the confluence the river is named Dibang. The project is proposed to be developed as a run-of-the-
river scheme by constructing concrete gravity dams on Talo (Tangon) and Dri rivers and diverting the
water through two (2) separate waterway systems to utilize the available head in a common
underground powerhouse located just upstream of the confluence of Dri and Talo (Tangon) rivers.
Height of dams as envisaged for diversion of Dri and Talo (Tangon) rivers, are 101.5m and 80m,
respectively. The salient features of the project are given at Table 2.1. The layout map of the Etalin
HE project is given at Figure 2.2.
Chapter PROJECT DESCRIPTION & INFRASTRUCTURE 2

Environmental Impact Assessment (EIA) Report of Etalin HE Project
Proponent: M/s Etalin Hydro Electric Power Company Limited (EHEPCL 2.2
Consultant: RS Envirolink Technologies Pvt. Ltd.
Figure 2.1: Accessibility of Etalin HE project
2.3 PROJECT COMPONENTS
2.3.1 Dri Limb
2.3.1.1 Dam Complex
A 101.5m high concrete gravity dam is proposed at this location to divert water of Dri river into the
water conductor system. The top level of the dam is at El 1047m. The total length of the dam at top is
213.7m, with fourteen (14) concrete gravity blocks. The average riverbed level at the dam site is
around El 968m. The Full Reservoir Level (FRL) and Minimum Draw Down Level (MDDL) of the
reservoir are El 1045m and El 1039m, respectively, with a live storage of 4.6 MCM for diurnal peaking
capabilities. The total area of submergence is 83.32 ha.
The intake is located on the left bank of Dri River, upstream of the dam axis. The left bank is steeply
sloping with exposed rock mostly along the slope and is covered by thin overburden at lower
elevations. The intake system consists of two (2) inlet tunnels, which later combine to form the
headrace tunnel. The intake system is provided with a trash rack and four (4) vertical fixed wheel
gates – two for service and two for emergency.
2.3.1.2 Head Race Tunnel
The headrace tunnel is a circular shaped tunnel of 11.3m finished diameter having length of 10722m.
The headrace tunnel culminates in a vertical surge shaft of 26m internal diameter having restricted
orifice of diameter 5.5m.
2.3.1.3 Surge Shaft & Pressure Shafts
The surge shaft is envisaged as a 132m high structure, with the top at El 1102m. Three (3) main
pressure shafts, each of 5.6m diameters, originate from the bottom of the surge shaft. Each pressure
shaft bifurcates into two (2) unit pressure shafts of 4m diameter each to feed the six (6) units of Dri
limb. Main pressure shafts are 49.2, 26.6, 49.2m long and each unit pressure shaft is 512m long. Six
(6) butterfly valves are proposed for emergency closure of the underground penstock. A separate
underground cavern of dimensions 131m (L) x 10m (W) x 20m (H) is foreseen to accommodate
butterfly valves of 4m diameter each.
Talo Dam
Site

Environmental Impact Assessment (EIA) Report of Etalin HE Project
Proponent: M/s Etalin Hydro Electric Power Company Limited (EHEPCL 2.3
Consultant: RS Envirolink Technologies Pvt. Ltd.
2.3.2 Talo (Tangon) Limb
2.3.2.1 Dam Complex
The proposed Talo (Tangon) dam is a 80m high concrete gravity structure with top level at El 1052m.
The total length of the dam at top is 184.1m, with twelve (12) concrete gravity blocks. The average
riverbed level at the dam site is around El 1003m. The Full Reservoir Level (FRL) and Minimum Draw
Down Level (MDDL) of the reservoir are El 1050m and El 1040m, respectively with a live storage of
2.94 MCM for diurnal peaking capabilities. The total area of submergence is 36.12 ha.
The intake is located on the right bank of Talo (Tangon) river, upstream of the dam axis. The right
bank is moderately sloping with thick overburden above the riverbed level. The intake consists of
three (3) 6m diameter modified horseshoe shaped tunnels of lengths 925m, 851m and 777m. The
intake would also consist of three (3) service gates, operated by rope drum hoist of 55MT capacity
and three (3) emergency gates, operated by rope drum hoist of 30MT capacity.
The water from the intake is conveyed to three (3) Duffore type underground desilting basins of
dimensions 350m (L) x 18.5m (W) x 26.5m (H) each. The layout of the desilting basins would help in
isolating each basin during flushing and other maintenance operations. Gates are proposed at the end
of each desilting basin. The gates, each 4.5m (W) x 5.5 m (H) would be operated from an
underground gate operating chamber, access to which will be provided through an access tunnel. The
settling silt would be collected in the flushing ducts running under each of the desilting basins. Gates
are provided at the end of each flushing duct. Individual flushing ducts merge downstream of the
gates to form a single silt flushing tunnel which would discharge the sediments back into the Talo
(Tangon) river.
2.3.2.2 Head Race Tunnel
Water from the desilting basins would then be led to the headrace tunnel, a 13045m long, 9.7m
diameter circular shaped structure. The tunnel, with a design discharge of 320.2 cumec, will also
contain five (5) intermediate adits of lengths 555m, 370m, 530m, 417m and 366m.
Surge Shaft & Pressure Shafts
The headrace tunnel culminates in a 137m high restricted orifice type surge shaft. The internal
diameter of the surge shaft is proposed to be 21m, while the orifice diameter would be 4.25m. The
top of the surge shaft is envisaged at El 1107m. Two (2) main pressure shafts, each of diameter
5.6m, originate from the bottom of the surge shaft. The 46m (each) long pressure shafts envisage a
design discharge of 160.1 cumec . Each main pressure shaft bifurcates into two (2) unit pressure
shafts of 4m diameter each, to feed the four (4) units of Talo (Tangon) limb. The unit pressure shafts
have a design discharge of 80.05 cumec each and the length of each unit pressure shaft is 512m.
Four (4) butterfly valves are proposed for emergency closure of the underground penstock.
A separate underground cavern is foreseen to accommodate the butterfly valves. The dimensions of
the cavern are 85.6m (L) x 10m (W) x 20m (H) to house the butterfly valves of 4m diameter each.

Environmental Impact Assessment (EIA) Report of Etalin HE Project
Proponent: M/s Etalin Hydro Electric Power Company Limited (EHEPCL 2.4
Consultant: RS Envirolink Technologies Pvt. Ltd.
2.3.3 Components at Power House
A common underground power house of size 352m (L) x 23.5m (W) x 59.73m (H) with six units of
307 MW at Dri Limb and four units of 307 MW at Talo (Tangon) Limb and two tail race channel
discharging into the river is envisaged.
2.3.3.1 Dri Dam-toe Power House
An intake structure for a design discharge of 30.64 cumecs, near left abutment
A surface power house with 19.6 MW capacity
a 39.7m long rectangular tailrace duct of size 5.5m (W) x 3.5m (H)
2.3.3.2 Talo (Tangon) Dam-toe Power House
An intake structure for a design discharge of 19.52 cumecs, near left abutment
A surface power house with 7.4 MW capacity
a 27.9 m long rectangular tailrace duct of size 4.0 m (W) x 3.0 m (H)
The reservoir to be created by the dam at Dri and Talo (Tangon) Rivers will operate between FRL
1045 m & MDDL 1039 m and FRL 1050 m & MDDL 1040 m, respectively. The installed capacity of the
main power house will be 3070 MW (6 X 307 MW + 4 X 307 MW) while that of the Two Dam Toe
Powerhouses will be 27 MW (19.6 MW+ 7.4MW) totaling to 3097 MW (3070 MW + 27 MW). The rated
head for the Dri and Talo (Tangon) limb is 420 m. The design energy at 95% plant availability is
12,766.8 MU.
Table 2.1: Salient features of the Etalin HE project
State Arunachal Pradesh
District Dibang Valley
Dam Complex & Water Conductor –
Dri Limb
Location of Dam Site
Latitude 28° 42’ 24”N
Longitude 95° 51’ 52”E
Location of Power House
Latitude 28°36’ 40”N
Longitude 95° 51’ 51”E
HYDROLOGY
Catchment Area 3685 sq km
Design Flood (PMF) 11,811 m3/s
Glacial Lake Outburst Flood (GLOF) 1,170 m3/s
River Diversion Flood 4,805 m3/s
RESERVOIR
Full Reservoir Level (FRL) El 1045m
Minimum Draw Down Level (MDDL) El 1039m
Gross Storage at FRL 21.97 MCM
Gross Storage at MDDL 17.37 MCM
Live Storage 4.6 MCM
Submergence Area 83.32 Ha
Diversion Tunnel
Number 3 on Right bank & 1 on Left bank
Diameter 10.9m Circular shape

Environmental Impact Assessment (EIA) Report of Etalin HE Project
Proponent: M/s Etalin Hydro Electric Power Company Limited (EHEPCL 2.5
Consultant: RS Envirolink Technologies Pvt. Ltd.
Inlet Invert / Outlet Invert El 975.0 m / El 964.0m
Length 338m, 461m, 594m & 692m
Slopes
Number and size of Gates in each tunnel
1 in 30.73, 1 in 41.91, 1 in 53.96 and 1 in
62.92,
2 Nos, 4.45m (W) x 10.9m (H)
Hoist Arrangement and Capacity 110MT, Electrically operated Rope Drum Hoist
COFFER DAM (UPSTREAM)
Type Concrete face with plum core
Top level 993m
Average river bed elevation 973m
Top width 6.5m
Length at top 140m
COFFER DAM (DOWNSTREAM
Type Random fill with downstream sealing layers
Top level El 975m
Average river bed elevation El 966m
Top width 5.0m
Length at top 70m
Upstream / downstream slope 1 in 1.5
GRAVITY DAM
Average river bed level around 968m
Top of Dam El 1047m
Length at top 213.7m
Foundation level (Deepest) El 945.5m
Height above deepest foundation 101.5m
Number of Blocks 14 Nos.
LOWER SPILLWAY
Number 7 Nos.
Crest elevation El 990m
Gate Type and Size Radial gates; 6.1m (W) x 12.6m (H)
Hoist Type and Capacity Twin Hydraulic cylinders, 2 x 175 MT
Stop Log Gates 1 No., 7 units, 6.1m (W) x 2.585m (H)
Hoist Type and Capacity Gantry Crane, 35 MT
ENERGY DISSIPATION ARRANGEMENT
Type Trajectory Bucket
Bucket radius 49.0 m
Lip angle 30o
Bucket Invert level EL 973.0 m
AUXILIARY SPILLWAYS
Number 2 Nos.
Crest elevation El 1041m
Size (including free board of 200mm) 5.0 x 4.2m
No. of Gates 3 (2 Service & 1 Emergency)
Hoist Type and Capacity Gantry Crane operating Stoplog units
INTAKE
Number 2 Nos.
Invert elevation El 1021m
Gate opening size 7.0m x 7.5m
Total width of trash rack arrangement 49m
Length of trash rack arrangement 16.24m
Length of inlet tunnel (including transition) 41.1m
Number of Gates 2 Nos. – Service Gate

Environmental Impact Assessment (EIA) Report of Etalin HE Project
Proponent: M/s Etalin Hydro Electric Power Company Limited (EHEPCL 2.6
Consultant: RS Envirolink Technologies Pvt. Ltd.
2 Nos. – Emergency Gate (Bulk Head)
Hoist Arrangement and Capacity Rope Drum Hoist, 45 MT for bulk head Rope Drum Hoist, 80 MT for Intake Gate Rope Drum Hoist, 45 MT for bulk head
Rope Drum Hoist, 80 MT for Intake Gate
HEAD RACE TUNNEL
Number 1No.
Diameter & Shape 11.3m Circular shape
Length 10722m
Slope 1 in 227.16
Design discharge 480.3 m3/s
Velocity 4.79m/s
Number of intermediate Adits 4 Nos.
Length of intermediate Adits 301m, 740m, 355 and 267m
SURGE SHAFT
Number and type 1 No., Restricted orifice type
Diameter 26.0m
Orifice Dia 5.5m
Height 132 m
HRT invert at Surge shaft El 970.0 m
Top of Surge shaft 1102 m
Maximum surge level El 1100.5 m
Minimum surge level El 990.9 m
Length of Surge shaft bottom tunnel
(including transitions) 51 m
PRESSURE SHAFT
Number 3 Nos.
Diameter 5.6m
Length 49.2m, 26.6m, 49.2m
Design discharge 160.1 m3/s each
Steel Liner 28mm, ASTM 537 Class II
UNIT PRESSURE SHAFT
Number 6 Nos.
Diameter 4.0m
Length 512m each
Height of vertical drop 195m and 182m
Design discharge 80.05 m3/s
Steel Liner 22mm to 40mm, ASTM 537 Class II
40mm to 44mm, ASTM 517 Grade F
Intermediate Adit level & length El 775.0m; 313m
BUTTERFLY VALVE (BFV) CHAMBER
Dimension 131m (L) x 10m (W) x 20m (H)
Number of BF Valves 6 Nos
BFV diameter 4.0m
BFV Centerline elevation El 972.0m
Floor Invert elevation El 968.0m
DRAFT TUBE
Invert level El 578.47 m
Size (Start / End) 1 No. – 11.53m (w) x 3.04m (h) /
2 No. - 6.5m (w) x 5.5m (h)
Length 22.82 m
Slope 1 in 10
DRAFT TUBE TUNNEL
Numbers 6 Nos.

Environmental Impact Assessment (EIA) Report of Etalin HE Project
Proponent: M/s Etalin Hydro Electric Power Company Limited (EHEPCL 2.7
Consultant: RS Envirolink Technologies Pvt. Ltd.
Size and type D-Shape, 6.6m
Length (including transition) 99m
Slope 1 in 12
DOWNSTREAM SURGE CHAMBER
Dimension 165m (L) x 13m (W) x 46m (H)
Invert level El 589.0m
Gate operation level El 621.0m
Maximum Surge level EL 619.7m
Minimum Surge level EL 597.4 m
Draft Tube Gate – Number and Size 6m, 6.2m x 6.2m
Hoist Arrangement and Capacity Rope Drum Hoist, 40 MT
TAILRACE TUNNEL
LINK TRT (s)
Number 3 / 1
Diameter 6.6m / 9.5m Modified Horse shoe
Length 85m, 60m, 86m / 52m
Invert at downstream surge chamber El 589.0m
MAIN TRT
Number 1 No.
Diameter 11.3m circular shape
Length (including transition) 555m
Invert level (Start / End) El 589.83 m / El 595.18 m
Slope 1 in 102
TRT DOWNSTREAM TRANSITION
Size - Start / End 11.3m D-shape /
11.3m (w) x 8.0m (h) D-shape
Length 50m
Bottom slope 1 in 8
TRT OUTFALL
Invert level El 601.4m
Transition - size 1 No - 11.3m (w) x 8.0m (h) D-shape to 3 No –
6.0m (w) x 8.0 (h) Rectangle
Transition - length 9m
Minimum TWL El 603.0m
Normal TWL El 605.6m
Maximum TWL El 613.3m
TRT Outfall Gates 3 Nos, 6.0m (W) x 8.0m (H)
Gate Operating platform El 615.0 m
Hoist Arrangement and Capacity Rope Drum Hoist, 45 MT
DAM COMPLEX & WATER CONDUCTOR
– TALO (TANGON) LIMB
Location of Dam Site
Latitude 28°39’18”N
Longitude 96°00’07”E
Location of Power House
Latitude 28°36’ 40”N
Longitude 95° 51’ 51”E
HYDROLOGY
Catchment Area 2573 sq km
Design Flood (PMF) 10,218 m3/s
River Diversion Flood 3,670 m3/s
Glacial Lake Induced Flood (GLOF) 2143 m3/s

Environmental Impact Assessment (EIA) Report of Etalin HE Project
Proponent: M/s Etalin Hydro Electric Power Company Limited (EHEPCL 2.8
Consultant: RS Envirolink Technologies Pvt. Ltd.
RESERVOIR
Full Reservoir Level (FRL) El 1050m
Minimum Draw Down Level (MDDL) El. 1040m
Gross Storage at FRL 6.15 MCM
Gross Storage at MDDL 3.21 MCM
Live Storage 2.94 MCM
Submergence Area 36.12 ha
DIVERSION TUNNEL
Number 3 (on Left bank)
Diameter 11.5m Circular shape
Inlet Invert / Outlet Invert El 1010.0 m / El 1002.0m
Length 368m, 490m and 631m
Slopes 1 in 46.05, 1 in 61.27, 1 in 78.87
Number and size of Gates in each tunnel 2 Nos, 5.0m (W) x 11.5m (H)
Hoist Arrangement and Capacity 90 MT, Electrically operated Rope
Drum Hoist
COFFER DAM (UPSTREAM)
Type Concrete face with plum core
Top level El 1028.5m
Average river bed elevation El 1006m
Top width 6.5m
Length at top 93m
Upstream / downstream slope Vertical; 1 in 0.9 Stepped
COFFER DAM (DOWNSTREAM)
Type Random fill with downstream sealing layers
Top level El 1010m
Average river bed elevation El 1001m
Top width 5.0m
Length at top 75m
Upstream / downstream slope 1 in 1.5
GRAVITY DAM
Average river bed level El 1003m
Top of dam El 1052m
Length at top 184.1m
Foundation level (Deepest) El 972m
Height above deepest foundation 80m
Number of blocks 12
LOWER SPILLWAY
Number 6
Crest elevation El 1018m
Gate Type and Size Radial gates; 7.9m (W) x 13.37m (H)
Hoist Type and Capacity
Twin Hydraulic cylinders,
2 x 150 MT
Stop Log Gates 1 No., 8 units, 7.9m (W) x 2.44m (H)
Hoist Type and Capacity Gantry Crane, 35 MT
AUXILIARY SPILLWAY
Number 1 1 No.
Crest elevation El 1046m
Size (including free board of 200mm) 5.0m x 4.2m
Hoist Type and Capacity Gantry Crane operating Stoplog units
ENERGY DISSIPATION ARRANGEMENT
Type Trajectory Bucket
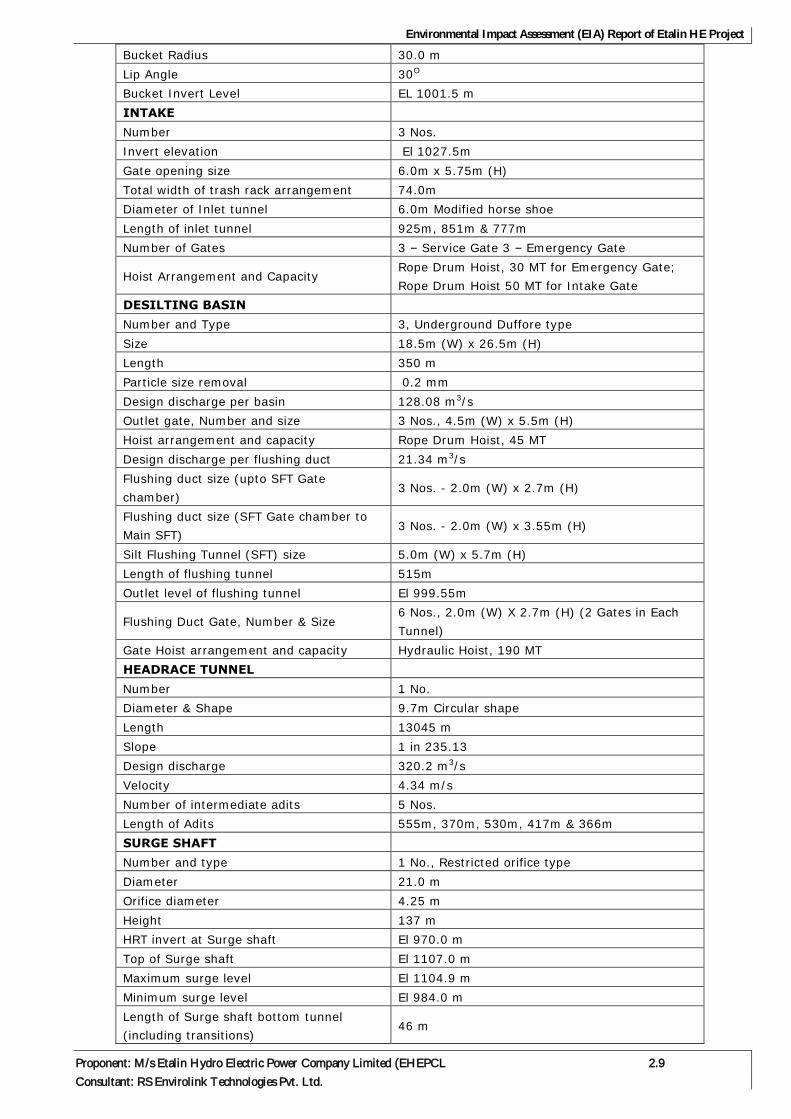
Environmental Impact Assessment (EIA) Report of Etalin HE Project
Proponent: M/s Etalin Hydro Electric Power Company Limited (EHEPCL 2.9
Consultant: RS Envirolink Technologies Pvt. Ltd.
Bucket Radius 30.0 m
Lip Angle 30O
Bucket Invert Level EL 1001.5 m
INTAKE
Number 3 Nos.
Invert elevation El 1027.5m
Gate opening size 6.0m x 5.75m (H)
Total width of trash rack arrangement 74.0m
Diameter of Inlet tunnel 6.0m Modified horse shoe
Length of inlet tunnel 925m, 851m & 777m
Number of Gates 3 – Service Gate 3 – Emergency Gate
Hoist Arrangement and Capacity Rope Drum Hoist, 30 MT for Emergency Gate;
Rope Drum Hoist 50 MT for Intake Gate
DESILTING BASIN
Number and Type 3, Underground Duffore type
Size 18.5m (W) x 26.5m (H)
Length 350 m
Particle size removal 0.2 mm
Design discharge per basin 128.08 m3/s
Outlet gate, Number and size 3 Nos., 4.5m (W) x 5.5m (H)
Hoist arrangement and capacity Rope Drum Hoist, 45 MT
Design discharge per flushing duct 21.34 m3/s
Flushing duct size (upto SFT Gate
chamber) 3 Nos. - 2.0m (W) x 2.7m (H)
Flushing duct size (SFT Gate chamber to
Main SFT) 3 Nos. - 2.0m (W) x 3.55m (H)
Silt Flushing Tunnel (SFT) size 5.0m (W) x 5.7m (H)
Length of flushing tunnel 515m
Outlet level of flushing tunnel El 999.55m
Flushing Duct Gate, Number & Size 6 Nos., 2.0m (W) X 2.7m (H) (2 Gates in Each
Tunnel)
Gate Hoist arrangement and capacity Hydraulic Hoist, 190 MT
HEADRACE TUNNEL
Number 1 No.
Diameter & Shape 9.7m Circular shape
Length 13045 m
Slope 1 in 235.13
Design discharge 320.2 m3/s
Velocity 4.34 m/s
Number of intermediate adits 5 Nos.
Length of Adits 555m, 370m, 530m, 417m & 366m
SURGE SHAFT
Number and type 1 No., Restricted orifice type
Diameter 21.0 m
Orifice diameter 4.25 m
Height 137 m
HRT invert at Surge shaft El 970.0 m
Top of Surge shaft El 1107.0 m
Maximum surge level El 1104.9 m
Minimum surge level El 984.0 m
Length of Surge shaft bottom tunnel
(including transitions) 46 m

Environmental Impact Assessment (EIA) Report of Etalin HE Project
Proponent: M/s Etalin Hydro Electric Power Company Limited (EHEPCL 2.10
Consultant: RS Envirolink Technologies Pvt. Ltd.
PRESSURE SHAFT
Number 2 Nos.
Diameter 5.6 m
Length 46m (each)
Design discharge 160.1 m3/s each
Steel Liner 28mm, ASTM 537 Class II
UNIT PRESSURE SHAFT
Number 4
Diameter 4.0 m
Length 512 m each
Height of vertical drop 377 m
Design discharge 80.05 m3/s
Steel Liner 25 to 40mm, ASTM 537 Class II
40 to 46mm, ASTM 517 Grade F
Intermediate Adit (Level, Length) El 775m, 422m
BUTTERFLY VALVE (BFV) CHAMBER
Dimension 85.6m (L) x 10m (W) x 20m (H)
No. of BF Valves 4 Nos.
BFV diameter 4.0 m
BFV Centerline elevation El 972.0 m
Floor Invert elevation El 968.0 m
DOWNSTREAM SURGE CHAMBER
Dimension 110m (L) x 13m (W) x 46m (H)
Invert level El 589.0m
Gate operation platform level El 621.0m
Maximum Surge level EL 619.6 m
Minimum Surge level EL 597.6 m
Draft Tube Gate – Number and Size 4 Nos, 6.2m x 6.2m
Hoist Arrangement and Capacity Rope Drum Hoist, 40T
TAILRACE TUNNEL
LINK TRT (s)
Number 2 Nos.
Diameter 6.7 m Modified Horse shoe
Length 81 m and 99m
Invert at downstream surge chamber El 589.0m
MAIN TRT
Number 1 No.
Diameter 9.5 m circular shape
Length (including transition) 544 m
Invert level (Start / End) El 589.83 m / El 595.18 m
Slope 1 in 99.45
TRT DOWNSTREAM TRANSITION
Size - Start / End 9.5 m D-shape /
9.5m (w) x 8.0m (h) D-shape
Length 50 m
Bottom slope 1 in 8
TRT OUTFALL
Invert level El 601.4m
Transition - size 1 No. – 9.5m (w) x 8.0m (h) D-shape to
2 Nos. – 6.0m (w) x 8.0m (h) Rectangle
Transition - length 9 m
Minimum TWL El 603.0 m

Environmental Impact Assessment (EIA) Report of Etalin HE Project
Proponent: M/s Etalin Hydro Electric Power Company Limited (EHEPCL 2.11
Consultant: RS Envirolink Technologies Pvt. Ltd.
Normal TWL El 605.6 m
Maximum TWL El 613.3 m
Gate Operating platform El 615.0 m
TRT Outfall Gates 2 Nos., 6.0m (W) x 8.0m (H)
Hoist Arrangement and Capacity Rope Drum Hoist, 45 MT
POWER HOUSE COMPLEX
UNDERGROUND POWER HOUSE
Dimensions 352m (L) x 23.5m (W) x 59.73m (H)
Installed Capacity 3070 MW
Number of Units 6 x 307 MW (Dri) + 4 x 307 MW (Talo)
Turbine centerline elevation El 595.0m
Maximum gross head 447.0m (Dri) / 442.0m (Talo)
Maximum net head 446.9m (Dri) / 441.9m (Talo)
Minimum net head 413.40m (Dri) / 415.9m (Talo)
Rated Net Head 420.0 m
Service Bay Level El 610.0m
MAIN ACCESS TUNNEL (MAT)
Size and type D-Shape, 8.0m (W) x 8.0m (H)
Length (Dri / Talo (Tangon) Limb) 474m / 779m
TRANSFORMER HALL
Dimension 349.6(L) x 16.5(w) x 24.3 (H)
Transformer floor level El 610.0m
GIS floor level El 622.0 m
TURBINE
Numbers & Type 10 Nos., Vertical Axis Francis
Rated Turbine Output 311.68 MW
Rated head 420.0m
Speed 250 rpm
Rate discharge 80.05 m3/s
GENERATOR
Number & Type 10 Nos., Semi Umbrella Type
Output 341.11 MVA
Nominal speed 250 rpm
Voltage/Frequency 17.5 kV, 50 Hz
Power factor 0.9
TRANFORMER
Type ODWF
Rating 17.5 kV, 400/√3 kV, 125 MVA
Phase Single
SWITCHYARD
Type Gas Insulated Switchyard (GIS)
Location Above transformer hall
POTHEAD YARD
Size 234m (L) x 60m (W) & 120m (L) x 45 m (w)
Bench Elevation El 725m
Nominal Voltage Class 400kV
POWER BENFITS
50% Dependable Energy 13, 694.3 MU
90% Dependable Energy 12, 846.8 MU
Design Energy (@ 95% Plant availability) 12, 766.8 MU
DRI DAM-TOE POWER HOUSE
OPERATING LEVELS

Environmental Impact Assessment (EIA) Report of Etalin HE Project
Proponent: M/s Etalin Hydro Electric Power Company Limited (EHEPCL 2.12
Consultant: RS Envirolink Technologies Pvt. Ltd.
Full Reservoir Level El 1045m
Minimum Draw Down Level El 1039m
INTAKE STRUCTURE
Number of Intakes 1 No.
Block Number 4 Nos.
Nearest Abutment Left
Invert level of intake El. 1030m
Size of Trash Rack Opening 17.00m (H) x 6.0m (W)
Size of Gate 4.675m (H) x 2.8m (W)
Hoist Capacity Rope Drum Hoist Capacity 18T
Design Discharge 30.64 m3/s
PENSTOCK
Number and Diameter 1 No., 2.8m
Thickness of Liner 10mm
Type of Steel ASTM A537 Cl-2
Length of Penstock 108.6m
Design Discharge through Penstock 30.64 m3/s
SURFACE POWER HOUSE
Dimensions 20m (L) x 20m (W) x 40.7m (H)
Installed Capacity 19.6 MW
Number of Units 1 x 19.6 MW
Elevation of Turbine Runner Center Line 964.8m
Design Discharge 30.64 m3/s
Maximum Gross Head 77.8m
Min. Gross Head 71.0m
EOT Crane capacity (Powerhouse) 80 MT
TURBINE
Number and Turbine Type 1 Nos., Vertical Axis Francis
Turbine Rated Output 20 MW
Rated Head 72.5m
Rated Speed 300 rpm
GENERATOR
Number & Type 1 Nos., Suspended Type
Rated Capacity 21.8 MVA
Generation voltage 11 kV
Power factor 0.9
TRANFORMER
Type ONAN
Rating 11/66 kV, 24 MVA
Phase 3 –phase
SWITCHYARD
Max. voltage 72.5 kV
Rated Voltage Class 66 kV
Rated Continuous Current 191 A
DRAFT TUBE GATE
Type of Gate Vertical Lift Slide Type
Gate Size 5.5m (W) x 3.1m (H)
Hoist Type Rope drum hoist, Capacity 15T
TAILRACE DUCT
Length 39.7m
Duct shape Rectangular
Duct size 5.5m (W) x 3.5m (H)

Environmental Impact Assessment (EIA) Report of Etalin HE Project
Proponent: M/s Etalin Hydro Electric Power Company Limited (EHEPCL 2.13
Consultant: RS Envirolink Technologies Pvt. Ltd.
Outlet sill elevation El 965.8m
Normal Tailwater Level 968.0m
Maximum Tailwater Level 980.7m
Minimum Tailwater Level 967.2m
POWER BENEFITS
90% Dependable Energy 172 MU
Design Energy (@ 95% Plant availability) 163 MU
TALO (TANGON) DAM-TOE POWER
HOUSE
OPERATING LEVELS
Full Reservoir Level El 1050 m
Minimum Draw Down Level El 1040 m
INTAKE STRUCTURE
Number of Intake 1 No.
Block Number 2 Nos.
Nearest Abutment Left
Invert level of intake El. 1034 m
Size of Trash Rack Opening 18.00 m (H) x 5.38 m (W)
Size of Gate 4.01 m (H) x 2.4m (W)
Design Discharge 19.52 m3/s
PENSTOCK
Number and Diameter 1 No., 2.4m
Thickness of Liner 10mm
Type of Steel ASTM A537 Cl-2
Length of Penstock 68.50m
Design Discharge through Penstock 19.52 m3/s
SURFACE POWER HOUSE
Dimensions 19m (L) x 32m (W) x 36.35m (H)
Installed Capacity 7.4 MW
Number of Units 1 x 7.4 MW
Elevation of Turbine Runner Center Line 998.3 m
Design Discharge 19.52 m3/s
Maximum Gross Head 49.0m
Min. Gross Head 38.5m
EOT Crane capacity (Powerhouse) 32 MT
TURBINE
Number and Turbine Type 1 Nos., Vertical Axis Francis
Turbine Rated Output 7.55 MW
Rated Head 43m
Rated Speed 375 rpm
GENERATOR
Number & Type 1 No., Suspended Type
Rated Capacity 8.22 MVA
Generation voltage 11 kV
Power factor 0.9
TRANFORMER
Type ONAN
Rating 11/66 kV, 9 MVA
Phase 3 –phase
SWITCHYARD
Max. voltage 72.5 kV
Rated Voltage Class 66 kV

Environmental Impact Assessment (EIA) Report of Etalin HE Project
Proponent: M/s Etalin Hydro Electric Power Company Limited (EHEPCL 2.14
Consultant: RS Envirolink Technologies Pvt. Ltd.
Rated Continuous Current 72 A
DRAFT TUBE GATE
Type of Gate Vertical Lift Slide Type
Gate Size 4.0m (W) x 2.5m (H)
Hoist Type Rope drum hoist, Capacity 10T
TAILRACE DUCT
Length 27.9m
Duct shape Rectangular
Duct size 4m (W) x 3m (H)
Outlet sill elevation El 999.85m
Normal Tailwater Level 1001.5m
Maximum Tailwater Level 1013.5m
Minimum Tailwater Level 1001.0m
POWER BENEFITS
90% Dependable Energy 65 MU
Design Energy (@ 95% Plant availability) 62 MU
PROJECT ECONOMICS (FOR 3097 MW)
Base cost of Civil Works (Dec.2011 Price
Level) Rs.9865.34 Crore
Base cost of E&M Works (Dec.2011 Price
Level) Rs.3,566.65 Crore
Miscellaneous Cost Rs. 52.00 Crores
Total Base Cost (Dec.2011 Price Level) Rs.13,483.99 Crore
Construction period (including
commissioning of all units)
84 months (after 43 months of preconstruction
activities)
Escalation in Cost (Civil & HM) Rs. 3,903.32 Crores
Escalation in Cost (E&M) Rs. 1,418.72 Crores
IDC & Financing Cost Rs. 6,464.19
Total completion cost of the project Rs.25,296.95 Crores
2.4 INFRASTRUCTURE FACILITIES
This part outlines the preliminary planning of infrastructure facilities.
2.4.1 Approach to the Project
The project can be approached through various routes and modes of transportation like railways,
airways, waterways and roadway.
2.4.1.1 Transportation by Railway
Project site is accessible by railway up to Dangari railway station on the south bank (Assam side) of
Lohit River which is connected with broad-gauge rail line. The transportation of project cargo by
railway is possible up to Tinsukia. Tinsukia is the nearest rail yard from this head.
2.4.1.2 Transportation by Waterway
The nearest sea port is Haldia port at Kolkata. The Haldia port is connected to nearest waterway head at
Sadiya Ghat through India-Bangladesh protocol route from Haldia port to Bangladesh border and from
Bangladesh border to Sadiya Ghat by national waterway number 2.
2.4.1.3 Transportation by air
The nearest airport is at Dibrugrah which is about 350km from Etalin village, the power house
location. The distance from Dibrugarh to Tinsukia is 60km. The nearest operational helipad is at Anini

Environmental Impact Assessment (EIA) Report of Etalin HE Project
Proponent: M/s Etalin Hydro Electric Power Company Limited (EHEPCL 2.15
Consultant: RS Envirolink Technologies Pvt. Ltd.
which is 60 km from Etalin village.
2.4.1.4 Transportation by road
There are various alternative road routes connecting Kolkata port to Guwahati and then Guwahati to
Roing. A detailed study has been conducted by ABC India Ltd, Kolkata to explore all the possible
alternative routes connecting Kolkata to Roing and Roing to Etalin.
2.4.2 Project Roads
A network of roads is required to approach various locations of project site such as Dam sites, Adits,
surge shaft, powerhouse, pothead yard, Main Access Tunnel (MAT) and Tailrace Tunnel (TRT) portal,
Dumping yards, quarry locations etc. It has been assessed that about 50km length of new road is
required to be constructed to facilitate construction of various components. Average gradient of 1(V)
to 15(H) has been considered for proposed roads from the construction point of view. Apart from the
construction of new project roads 35km stretch of existing roads with in project area needs to be
widened and strengthened for the movement of heavy equipment and machinery in all weathers and
round the year. All the major roads have been proposed for 40R loading class as per IRC standards
and allowing clearances on the sides, drains and parapets, the required formation width of the road
works out to be 7.5m for the free flow of traffic mostly comprising of rear end dumpers, tippers,
transit mixers and loading equipment like loaders, excavators, backhoes.
2.4.3 Project Bridges
Keeping in view the access to various project components and approaches it has emerged that 2nos.
of temporary and 2nos. of permanent new bridges and culverts at various locations would be required
during and after the construction phase of the project. It is also required to strengthen or recast the
existing bridges in the project area.
The details of bridges and culverts in the project area which are required to be strengthened or
recasting are given in Table 2.2.
Table 2.2: Existing Bridges in Project Area
S.
No.
Location (distance
measured from
Etalin)
Type of
bridges Class Sector
Road
maintained
by
Bridge
characteristics
1 Talo (Tangon) , 3.4
km
DTBB
DDBB 24 R
Etalin-Talo (Tangon)
Dam site BRO
Span-1 X 67m,
CW-3.8m, VC-3.2m
2 3.9 km RCC
Slab
Etalin-Talo (Tangon)
Dam site BRO
Span-1 X 6.5m,
CW-7m
3 Noh Nallah, 7 km DSR BB 18 R Etalin-Talo (Tangon)
Dam site BRO
Span- 1 X 42.6m
CW-3.7m, PH-1.1m
4 Makri Pani, 11 km DLR 24 R Etalin-Talo (Tangon)
Dam site BRO
Span-1 X 36.5m,
CW-3.7m, PH-1.1m
5 Chambopani, 9.5
km Bailey 24 R Etalin-Dri Dam site BRO
Span-1 X 33m,
CW-3.8m, PH-1.1m
7 Rupani, 14 km Bailey 24 R Etalin-Dri Dam site BRO Span-1 X 43m, Cw-
3.8m, PH-2.2m
8 17.4 km Bailey 24 R Etalin-Dri Dam site BRO Span-1 X 27.3m,
CW-3.8m, PH-1.1m
9 24 km Bailey 24 R Etalin-Dri Dam site BRO Span-1 X 30.4m,
CW-3.8m, PH-1.1m

Environmental Impact Assessment (EIA) Report of Etalin HE Project
Proponent: M/s Etalin Hydro Electric Power Company Limited (EHEPCL 2.16
Consultant: RS Envirolink Technologies Pvt. Ltd.
Figure 2.2: Layout map of Etalin H.E. Project showing infrastructural facilities
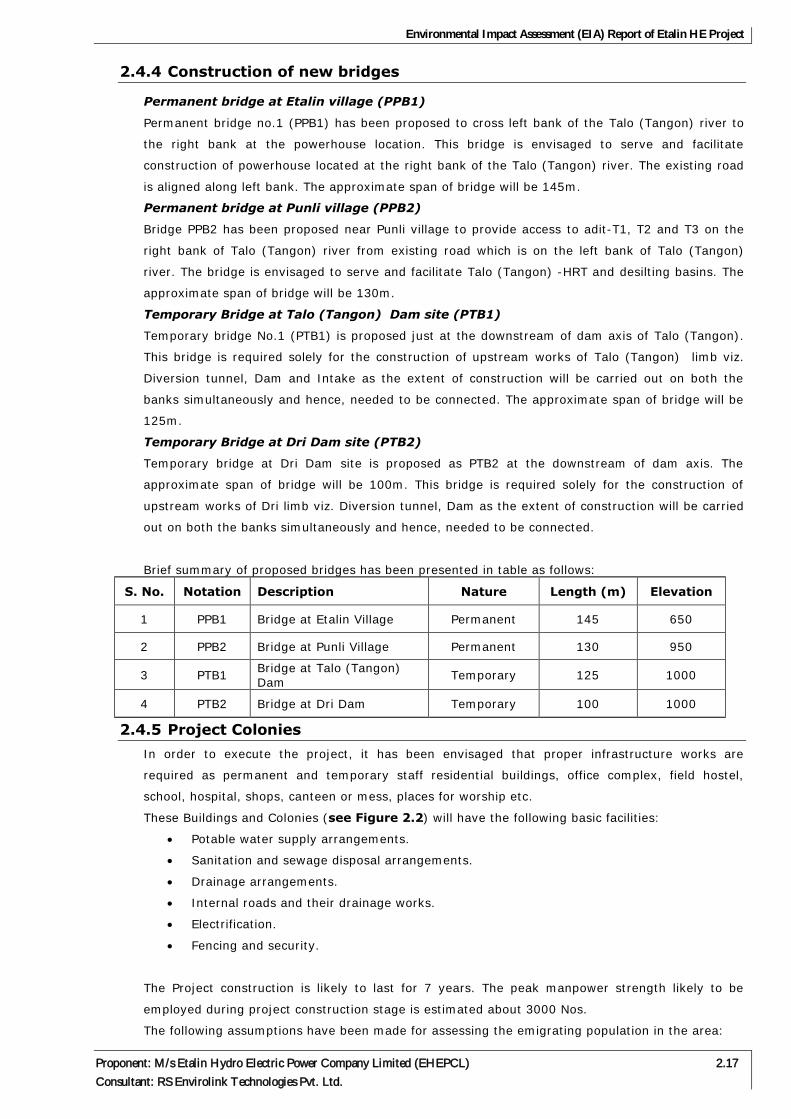
Environmental Impact Assessment (EIA) Report of Etalin HE Project
Proponent: M/s Etalin Hydro Electric Power Company Limited (EHEPCL) 2.17
Consultant: RS Envirolink Technologies Pvt. Ltd.
2.4.4 Construction of new bridges
Permanent bridge at Etalin village (PPB1)
Permanent bridge no.1 (PPB1) has been proposed to cross left bank of the Talo (Tangon) river to
the right bank at the powerhouse location. This bridge is envisaged to serve and facilitate
construction of powerhouse located at the right bank of the Talo (Tangon) river. The existing road
is aligned along left bank. The approximate span of bridge will be 145m.
Permanent bridge at Punli village (PPB2)
Bridge PPB2 has been proposed near Punli village to provide access to adit-T1, T2 and T3 on the
right bank of Talo (Tangon) river from existing road which is on the left bank of Talo (Tangon)
river. The bridge is envisaged to serve and facilitate Talo (Tangon) -HRT and desilting basins. The
approximate span of bridge will be 130m.
Temporary Bridge at Talo (Tangon) Dam site (PTB1)
Temporary bridge No.1 (PTB1) is proposed just at the downstream of dam axis of Talo (Tangon).
This bridge is required solely for the construction of upstream works of Talo (Tangon) limb viz.
Diversion tunnel, Dam and Intake as the extent of construction will be carried out on both the
banks simultaneously and hence, needed to be connected. The approximate span of bridge will be
125m.
Temporary Bridge at Dri Dam site (PTB2)
Temporary bridge at Dri Dam site is proposed as PTB2 at the downstream of dam axis. The
approximate span of bridge will be 100m. This bridge is required solely for the construction of
upstream works of Dri limb viz. Diversion tunnel, Dam as the extent of construction will be carried
out on both the banks simultaneously and hence, needed to be connected.
Brief summary of proposed bridges has been presented in table as follows:
S. No. Notation Description Nature Length (m) Elevation
1 PPB1 Bridge at Etalin Village Permanent 145 650
2 PPB2 Bridge at Punli Village Permanent 130 950
3 PTB1 Bridge at Talo (Tangon) Dam
Temporary 125 1000
4 PTB2 Bridge at Dri Dam Temporary 100 1000
2.4.5 Project Colonies
In order to execute the project, it has been envisaged that proper infrastructure works are
required as permanent and temporary staff residential buildings, office complex, field hostel,
school, hospital, shops, canteen or mess, places for worship etc.
These Buildings and Colonies (see Figure 2.2) will have the following basic facilities:
Potable water supply arrangements.
Sanitation and sewage disposal arrangements.
Drainage arrangements.
Internal roads and their drainage works.
Electrification.
Fencing and security.
The Project construction is likely to last for 7 years. The peak manpower strength likely to be
employed during project construction stage is estimated about 3000 Nos.
The following assumptions have been made for assessing the emigrating population in the area:

Environmental Impact Assessment (EIA) Report of Etalin HE Project
Proponent: M/s Etalin Hydro Electric Power Company Limited (EHEPCL) 2.18
Consultant: RS Envirolink Technologies Pvt. Ltd.
80% of workers and technical staff immigrating into the area are married.
In 80% of the family of workers both the husband and wife will work.
In 100% of the family of technical staff, only husband will work.
2% of total migrating population has been assumed as service providers.
50% of service providers will have families.
Family size has been assumed as 5.
Based on experience of similar projects and above referred assumptions, the increase in the
population as a result of migration may be of the order of 12000.
The water requirement during construction phase is proposed to be met from the flow of nearby
Nala/Streams by gravity flow and providing water treatment plant and overhead storage tanks.
The domestic water requirement has been estimated as 70 lpcd (Liters Per capita per day). Thus,
total water requirements work out to 0.84 Mld (Million Liters per day). It is assumed that about
80% of the water supplied will be generated as sewage. Thus, total quantum of sewage generated
is expected to be of the order of 0.67 Mld. The sewage shall be collected in anaerobic septic tanks.
The details are discussed in Chapter 4 on Solid Waste Management in EMP report.
During the operation phase the cause and source of water will be much different. Since, only a
small number of staff, about 300 persons will be residing in the project colony proposed to be
developed. About 0.20 to 0.30 Mld of sewage will be generated.
It is proposed to provide biological treatment facilities including secondary treatment units for
sewage so generated. The BOD load after treatment shall reduce to 10 to 12 kg/day. It shall be
ensured that sewage from the project colony be treated in a sewage treatment plant so as to meet
the disposal standards for effluent. Thus, with commissioning of facilities for sewage treatment, no
impacts are anticipated as a result of disposal of effluents from the project colony. Each building is
proposed to be provided with septic tanks of required capacity and maintained on regular basis for
the collection of anaerobic sewage.
2.4.5.1 Owner’s building and colonies
The owner’s colony would provide for residential as well as office accommodation to its staff, both
for pre and post construction stages. In addition to residential complex, the colony would also
have facilities for medical aid, places of worship, fire fighting, educational and vocational facilities,
banking and telecom facilities, shopping, sports and recreational activities including community
functions, fuel dispensing outlet, material testing laboratory, etc. A small workshop or auto shop
for up keep of automobiles in the post construction period would also be located in the colony. One
project colony has been proposed on the left bank of the Talo (Tangon) river, about 9km upstream
of Etalin village on Etalin-Maliney road. This colony is proposed to have Main building for Project
office and a residential campus for high rank officers. One field hostel has also been envisaged for
engineers and equivalent staff, one school for residential staff and a hospital.
One building at each dam site (Dri and Talo (Tangon)) has been envisaged for operation and
maintenance. The total number of permanent O&M Staff required for the project is estimated to be
about 702 for which 3,000 Sq m flat area will be required.

Environmental Impact Assessment (EIA) Report of Etalin HE Project
Proponent: M/s Etalin Hydro Electric Power Company Limited (EHEPCL) 2.19
Consultant: RS Envirolink Technologies Pvt. Ltd.
2.4.5.2 Contractors colonies and buildings
Temporary buildings will include contactors colonies which would serve the purpose of residence
and offices, facilities for social activities like shopping, social gatherings, worship, etc. for the
contractors and their families engaged in project. Ample space for colonies of Civil, H&M and E&M
contractors has been marked near powerhouse location the same location shall be partially shared
by a proposed permanent hospital building and first aid center during project execution phase. Five
locations for laborers camps have been earmarked as 1 on each dam site, 1 at Chanal village near
Ron pani, 1 at Punli village and 1 at powerhouse location.
2.4.6 Workshops and Parking Space
Given the layout of civil components, both the dam site and powerhouse areas would be major
hubs of construction activities throughout the implementation period of the project. Moreover, as
they are not close to each other, it would be practical and efficient that separate job facilities of
major nature are created near each of these work zones. Three (3) separate base workshops have
been proposed for earth moving, concreting and drilling equipments one each at both the dam
locations and one near to the powerhouse area.
Every workshop would have partly covered area in addition to open area. Equipment requiring
major overhaul/repairs would normally be parked under cover. The open areas would provide
parking space for the equipment under minor repair. A store to stock the spares for the
equipment, an office and toilet facilities would be provided under the covered space.
One first aid post would be provided at each work site which would also cater to the requirements
of the workshop crew.
2.4.7 Stores and Warehouses
The storage of material and spares required for various activities of the project would be efficiently
managed. Adequate material supply is the backbone of any job.
Three central warehouses have been planned; one would be established for the powerhouse
complex and the other two for the dam complexes on each limb, which would receive all incoming
supplies. Cement, reinforcement steel, explosives, and other job specific items of material could
also be sent directly to the respective sites as per their demand. The ware houses would stock
electrical items separately.
2.4.8 Penstock Fabrication Yard
A penstock fabrication yard equipped with two plate bending rolls, a battery of welding and gas
cutting sets, hydro-testing and radiography facility, sand-blasting and painting equipment and
sufficient space to stock the raw plates as well as the finished ferrules awaiting dispatch, would be
provided near the powerhouse complex. An E.O.T crane of 40 MT capacities traveling over the yard
would be deployed for handling the ferrules during different stages of fabrication. A separate
mobile crane of 40 MT would be deployed to handle the plates/ferrules in the stock yard. The
fabrication yard would be partly covered to allow welding and other activities to go on unhindered
under the covered area.
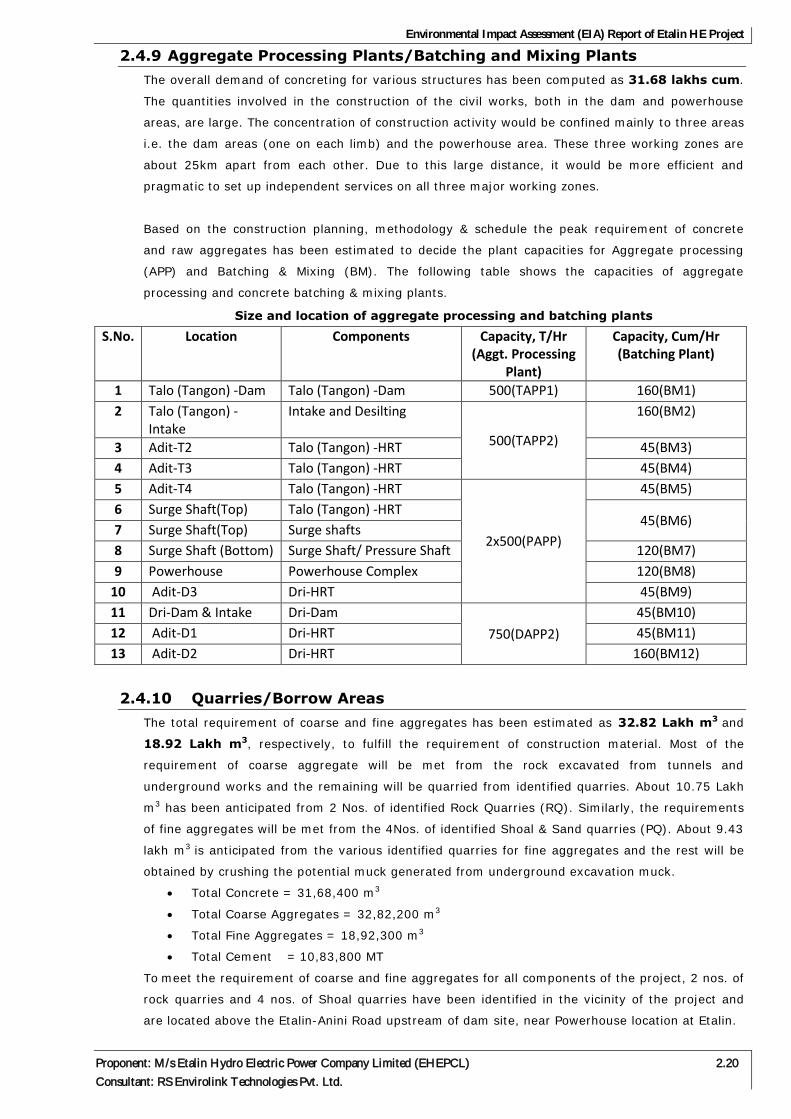
Environmental Impact Assessment (EIA) Report of Etalin HE Project
Proponent: M/s Etalin Hydro Electric Power Company Limited (EHEPCL) 2.20
Consultant: RS Envirolink Technologies Pvt. Ltd.
2.4.9 Aggregate Processing Plants/Batching and Mixing Plants
The overall demand of concreting for various structures has been computed as 31.68 lakhs cum.
The quantities involved in the construction of the civil works, both in the dam and powerhouse
areas, are large. The concentration of construction activity would be confined mainly to three areas
i.e. the dam areas (one on each limb) and the powerhouse area. These three working zones are
about 25km apart from each other. Due to this large distance, it would be more efficient and
pragmatic to set up independent services on all three major working zones.
Based on the construction planning, methodology & schedule the peak requirement of concrete
and raw aggregates has been estimated to decide the plant capacities for Aggregate processing
(APP) and Batching & Mixing (BM). The following table shows the capacities of aggregate
processing and concrete batching & mixing plants.
Size and location of aggregate processing and batching plants
S.No. Location Components Capacity, T/Hr (Aggt. Processing
Plant)
Capacity, Cum/Hr (Batching Plant)
1 Talo (Tangon) -Dam Talo (Tangon) -Dam 500(TAPP1) 160(BM1)
2 Talo (Tangon) -Intake
Intake and Desilting
500(TAPP2)
160(BM2)
3 Adit-T2 Talo (Tangon) -HRT 45(BM3)
4 Adit-T3 Talo (Tangon) -HRT 45(BM4)
5 Adit-T4 Talo (Tangon) -HRT
2x500(PAPP)
45(BM5)
6 Surge Shaft(Top) Talo (Tangon) -HRT 45(BM6)
7 Surge Shaft(Top) Surge shafts
8 Surge Shaft (Bottom) Surge Shaft/ Pressure Shaft 120(BM7)
9 Powerhouse Powerhouse Complex 120(BM8)
10 Adit-D3 Dri-HRT 45(BM9)
11 Dri-Dam & Intake Dri-Dam
750(DAPP2)
45(BM10)
12 Adit-D1 Dri-HRT 45(BM11)
13 Adit-D2 Dri-HRT 160(BM12)
2.4.10 Quarries/Borrow Areas
The total requirement of coarse and fine aggregates has been estimated as 32.82 Lakh m3 and
18.92 Lakh m3, respectively, to fulfill the requirement of construction material. Most of the
requirement of coarse aggregate will be met from the rock excavated from tunnels and
underground works and the remaining will be quarried from identified quarries. About 10.75 Lakh
m3 has been anticipated from 2 Nos. of identified Rock Quarries (RQ). Similarly, the requirements
of fine aggregates will be met from the 4Nos. of identified Shoal & Sand quarries (PQ). About 9.43
lakh m3 is anticipated from the various identified quarries for fine aggregates and the rest will be
obtained by crushing the potential muck generated from underground excavation muck.
Total Concrete = 31,68,400 m3
Total Coarse Aggregates = 32,82,200 m3
Total Fine Aggregates = 18,92,300 m3
Total Cement = 10,83,800 MT
To meet the requirement of coarse and fine aggregates for all components of the project, 2 nos. of
rock quarries and 4 nos. of Shoal quarries have been identified in the vicinity of the project and
are located above the Etalin-Anini Road upstream of dam site, near Powerhouse location at Etalin.

Environmental Impact Assessment (EIA) Report of Etalin HE Project
Proponent: M/s Etalin Hydro Electric Power Company Limited (EHEPCL) 2.21
Consultant: RS Envirolink Technologies Pvt. Ltd.
2.4.11 Muck Disposal Areas
The project would generate substantial quantity of muck from excavation of various structures.
The total quantity of muck likely to be generated from open excavation including construction and
widening of the roads, etc. including swell factor is about 165.65 lakh cum. However after the
utilization of muck for different project components and also considering the swell factor total
estimated quantity to be disposed of is about 117.35 lakh cum. Most of the excavated material is
proposed to be dumped at 12 suitable locations identified specifically for this purpose with 7 sites
along Dri limb, 1 site near powerhouse location and 4 sites along Talo (Tangon) limb.
2.4.12 Explosive Magazine
For the storage and handling of explosives required for the drilling and blasting operations,
permanent and portable magazines will be constructed for which necessary approvals will be taken
from the concerned authorities. Explosive vans will be used for the transport of explosives from
the magazine to the work sites. All safety codes and regulations prescribed by the central and
state government in this respect will be followed and magazines will be suitably guarded round the
clock. It has been assessed that 2 no. of magazines of 20MT capacities would be required. The
explosive magazine complex has been planned to keep the distance traveled by the explosive van
to the minimum.
As laid down in the Explosive Rules of 1983, a safe distance of 300m is required to be maintained
from public roads, etc. The location of the magazines has been indicated in the Infrastructure
layout plan keeping the above in mind.
2.4.13 Land Requirement
For the development of Etalin Hydroelectric Project, land would be acquired for construction of
project components, submergence area, muck dumping, quarrying, construction camps and
colony, etc. Based on the final project layout, land requirement has been finalized as 1155.11 ha
(Table 2.3).
Table 2.3: Land Requirement of Etalin H.E. Project
(For Legends (LA-1 to LA-21A refer to Figure 2.2)
LA Name of the Component Area
(Ha)
LA-1
RQ1 (Rock Quarry)
58.02
RQ2 (Rock Quarry)
Contractor / Owner site office and store
Dumping Yard, DMD-4 (a)
Dumping Yard, DMD-4 (b)
Labour Camp-5
DT -RB(Diversion Tunnel- Right Bank); 3 Nos. (DRI LIMB)
DT -LB(Diversion Tunnel- Left Bank); 1 No. (DRI LIMB)
Dam/ Dam Toe Power House & Coffer Dam D/S
Intake Structure
Project Roads
LA -2
Explosive magazine/construction facility areas and labour camps (Right Bank)
56.53 Work Shop, Warehouse, Store &
Parking Space-3 (Left Bank)
Dumping area DMD 5 (Left bank)
Project Roads
LA-3
Dumping Yard, DMD-3
20.05 Dumping Yard, DMD-2
Total Road Area in LA -3

Environmental Impact Assessment (EIA) Report of Etalin HE Project
Proponent: M/s Etalin Hydro Electric Power Company Limited (EHEPCL) 2.22
Consultant: RS Envirolink Technologies Pvt. Ltd.
LA Name of the Component Area (Ha)
LA-4 Labour camps
23.98 Total Road Area in LA -4
LA-4A
Store/ work shop for package- B
67.74 Batching plant / main work shop
Contractors camp and owners camp office/residences
Provision for Priority Road (Dri Limb)
LA-5 Road Area 2
LA-6
Batching Plant/ work shop
39.79 Labour Camp-4
Dumping Yard, DMD-6
Total Road Area in LA -6
LA-6A Provision of facility area/explosive magazine and change in road alignment 12.33
LA-7
Batching Plant
80.56
Dumping site
Aggregate crushing plant
Batching plant and aggregate stock piling
Batching plant and work shop
Total Road Area in LA -7
LA-7A Provision of change in portal & alignment of road 6.38
LA-8
Batching Plant BM-6
120.65
Batching Plant BM-7
Contractor & Departmental Office-2
PQ-01 (Shoal Quarry)
Labour Camps
Power House
Main store/workshop and facility areas
Total Road & Bridge (PPB1) Area in LA -8
LA-9 Dumping yard EM & HM Storage Workshop, Warehouse, store, Parking 20.81
Total Road & Bridge (PPB1) Area in LA -9
LA-10
Owners temporary colony and office
11.31 Dumping Yard, PMD-2
Total Road Area in LA -10
LA-10A Provision of Shoal Quarry PQ-02 9.77
LA-11 Road Area 41.38
LA-11A Provision of Shoal Quarry PQ-03
17.2 Contractors colony and office and facility areas
LA-12
Batching Plant and aggregate processing plant
52.79
Labour camps for Contractors Colony-EM, HM &
Civil PH Works
Penstock fabrication yard
Dumping Yard, TMD-7 / PQ-02
Total Road Area in LA -12
LA-13 Site office and work shop
8.33 Total Road Area in LA -13
LA-13A Provision of facility Area 1.5
LA-14
Main Project Office and Residential Campus including school and hospital (Left Bank) 67.78
Road & Labour Camp
LA-14A
Main work shop and batching plants
31.49 Labour camps for contractor (Right Bank)
Road Area
LA-14B Additional Bridge to access Adit T2 & T3
6.99 Contractors colony
LA-15
Dumping Yard, TMD-5
79.18
Dumping Yard, TMD-4
Batching Plant BM-3
Labour Camp -2
Dumping Yard, TMD-6
Dumping Yard, TMD-7
Aggregate crushing plant
Total Road Area in LA -15
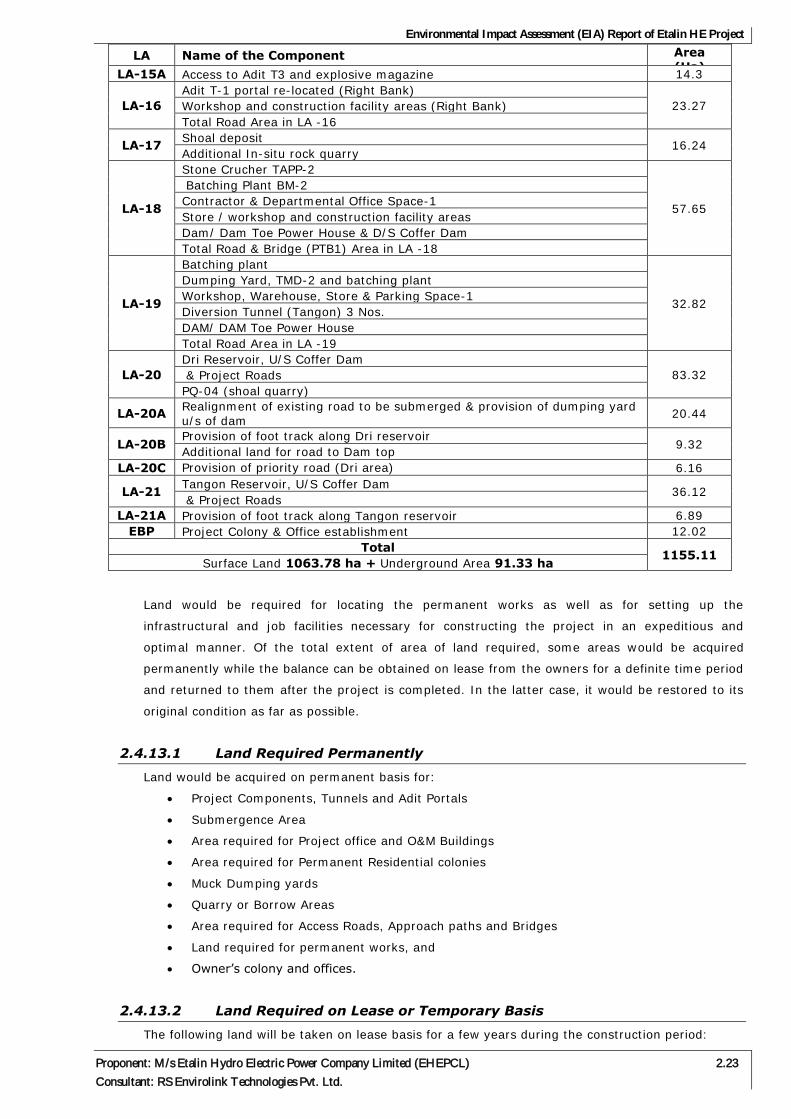
Environmental Impact Assessment (EIA) Report of Etalin HE Project
Proponent: M/s Etalin Hydro Electric Power Company Limited (EHEPCL) 2.23
Consultant: RS Envirolink Technologies Pvt. Ltd.
LA Name of the Component Area (Ha)
LA-15A Access to Adit T3 and explosive magazine 14.3
LA-16
Adit T-1 portal re-located (Right Bank)
23.27 Workshop and construction facility areas (Right Bank)
Total Road Area in LA -16
LA-17 Shoal deposit
16.24 Additional In-situ rock quarry
LA-18
Stone Crucher TAPP-2
57.65
Batching Plant BM-2
Contractor & Departmental Office Space-1
Store / workshop and construction facility areas
Dam/ Dam Toe Power House & D/S Coffer Dam
Total Road & Bridge (PTB1) Area in LA -18
LA-19
Batching plant
32.82
Dumping Yard, TMD-2 and batching plant
Workshop, Warehouse, Store & Parking Space-1
Diversion Tunnel (Tangon) 3 Nos.
DAM/ DAM Toe Power House
Total Road Area in LA -19
LA-20
Dri Reservoir, U/S Coffer Dam
83.32 & Project Roads
PQ-04 (shoal quarry)
LA-20A Realignment of existing road to be submerged & provision of dumping yard u/s of dam
20.44
LA-20B Provision of foot track along Dri reservoir
9.32 Additional land for road to Dam top
LA-20C Provision of priority road (Dri area) 6.16
LA-21 Tangon Reservoir, U/S Coffer Dam
36.12 & Project Roads
LA-21A Provision of foot track along Tangon reservoir 6.89
EBP Project Colony & Office establishment 12.02
Total 1155.11
Surface Land 1063.78 ha + Underground Area 91.33 ha
Land would be required for locating the permanent works as well as for setting up the
infrastructural and job facilities necessary for constructing the project in an expeditious and
optimal manner. Of the total extent of area of land required, some areas would be acquired
permanently while the balance can be obtained on lease from the owners for a definite time period
and returned to them after the project is completed. In the latter case, it would be restored to its
original condition as far as possible.
2.4.13.1 Land Required Permanently
Land would be acquired on permanent basis for:
Project Components, Tunnels and Adit Portals
Submergence Area
Area required for Project office and O&M Buildings
Area required for Permanent Residential colonies
Muck Dumping yards
Quarry or Borrow Areas
Area required for Access Roads, Approach paths and Bridges
Land required for permanent works, and
Owner’s colony and offices.
2.4.13.2 Land Required on Lease or Temporary Basis
The following land will be taken on lease basis for a few years during the construction period:

Environmental Impact Assessment (EIA) Report of Etalin HE Project
Proponent: M/s Etalin Hydro Electric Power Company Limited (EHEPCL) 2.24
Consultant: RS Envirolink Technologies Pvt. Ltd.
Temporary buildings and residential colonies includes labour camps
Temporary site offices testing laboratories
Workshops and Equipment parking
Stores and warehouses
Pre-Fabrication yards
Construction plants (APP and BM)
Temporary bridges
Areas near construction of roads or project components where disturbance is expected due
to be loose muck, noise etc.
2.4.14 Construction Power
Dibang valley district has about 1.85MW of power supply through mini/micro projects, which is not
even sufficient to meet to their local domestic demands and thus the state Government has kept
D.G. sets to meet the shortfall in demand.
There is no grid power available in the region. Therefore the project has to make its own
arrangements of power supply for its construction activities as well as domestic need and thus
27MW of power supply through D.G sets has to be arranged. 7 DG-Houses have been envisaged
with different capacities of DG sets to meet the project demand.
2.4.15 Tele-Communication and Other Facilities
Mobile network or any other telecommunication facilities in the project area are not available. The
nearest mobile network is available at Hunli and is served only by BSNL. It is proposed that the
project area will be connected by the mobile network, fixed line and WLL services from BSNL as
available in other parts of the state. For effective coordination among various work sites,
workshop, colonies, stores, design office, head office, etc. and a reliable tele-communication
network is necessary. An electronic automatic telephone exchange with a capacity of about 100
lines is proposed at project head quarters. The internal telephone or EPBAX system would be
maintained by the project authority. Telecommunication link outside the project area would be
provided by upgrading the existing BSNL network. A wireless V-SAT system is also proposed for
linking the project site with Dri-Dam site, Talo (Tangon) -Dam site, Etalin Powerhouse Site, Hunli,
Roing, Tinsukia, Guwahati and Delhi. After completion of construction activities, the
telecommunication network is proposed to be continued so as to serve during operation and
maintenance stage.
A VHF wireless network is also proposed to be established to connect various project sites,
Guwahati and Tinsukia, Roing Etalin. This will be mainly utilized for the construction purpose and
will be scaled down after commissioning.
2.4.16 Security and Safety
Safety being an essential job requirement, adequate arrangement for lighting and security will be
made in the project area. Adequate preventive measures against accidents will be taken as
prescribed in various IS codes. The project work site will have restricted entry and visitors will only
be allowed on permits issued by the relevant competent authority. All work force and other
personnel will be required to carry identity cards and passes issued by the project authority which
will be checked at the entry check posts provided at suitable places.

Environmental Impact Assessment (EIA) Report of Etalin HE Project
Proponent: M/s Etalin Hydro Electric Power Company Limited (EHEPCL) 3.1
Consultant: RS Envirolink Technologies Pvt. Ltd.
3.1 INTRODUCTION
The importance given to environmental considerations in order to achieve sustainable and
successful development is increasingly gaining acceptance among various developmental
experts and institutions. Understanding the consequences of development and forecasting its
impact on the basic life support system - land, water and air - is referred to as the
Environmental Impact Assessment or EIA. New dimensions have also been added to the EIA
studies encompassing impacts on the ethnic diversity, socio-cultural and socio-economic
aspects including displacement, resettlement and rehabilitation of human societies where
developmental activities are undertaken.
EIA is a location specific study; with a common basic structure of understanding the baseline
status of relevant environmental components and impact prediction due to proposed
development. However, the process varies from project to project based on location, type and
magnitude of the operations. EIA studies give emphasis on the assessment and prediction of
impacts of development on natural ecosystems and their species along with concentrating on
geophysical features, which mostly cover reversible impacts. The main aim of having EIA
studies carried out is to understand and prioritize the impact of development activity on the
natural life support systems and processes with main emphasis on the continuation of
ecosystem processes and functions, so that adequate remedial/mitigating measures are taken
right from the design stage.
Typically in a hydro-power scheme, whose sustenance and continuity largely depends on the
quality of ecosystems in the catchment of its river and reservoir, biological health of the
catchment will control not only the quality and quantity of water in the river but also the life of
reservoir. There is only one way to generate hydro-power on sustainable basis and that is by
maintaining the natural ecosystems in the catchment. Hydro-power is a direct benefit of
natural ecosystem functions, which are controlled by the biodiversity.
3.2 METHODOLOGY
Standard methodologies of EIA were followed for conducting the CEIA study for the proposed
Etalin HE Project. A brief account of the methodologies and matrices followed in the present
study is given below under different headings. All the methods were structured for the
identification, collection and organization of baseline environmental data, assessment of
developmental component and their impacts on the baseline environment. The information
thus gathered has been analyzed and presented in the form of a number of visual formats for
easy interpretation and decision-making.
Chapter METHODOLOGY
3

Environmental Impact Assessment (EIA) Report of Etalin HE Project
Proponent: M/s Etalin Hydro Electric Power Company Limited (EHEPCL) 3.2
Consultant: RS Envirolink Technologies Pvt. Ltd.
Figure 3.1: Study area map delineated as per approved TOR of Etalin H.E. Project

Environmental Impact Assessment (EIA) Report of Etalin HE Project
Proponent: M/s Etalin Hydro Electric Power Company Limited (EHEPCL) 3.3
Consultant: RS Envirolink Technologies Pvt. Ltd.
3.2.1 Study Area
Study area for environmental study has been delineated as:
Project area or the direct impact area within 10 km radius of the main project
components like barrage and also area within 10 km upstream of reservoir tail.
Submergence Area
Catchment area up to the dam sites
A map of the study area prepared based on the above criteria is given at Error! Reference
source not found..
3.2.2 Scoping Matrix
Scoping is a tool which gives direction for selection of impacts due to the project activities on
the environment. As part of the study, scoping exercise was conducted selecting various types
of impacts which can accrue due to hydroelectric project. Based on the project features, site
conditions, the scope of studies were approved by MoEF&CC (Refer Annexures – I & II).
The approved Terms of Reference (TOR) specified for various parameters were covered during
the EIA study.
Based on the Scoping matrix (Table 3.1), the environmental baseline data have been
collected and the project details superimposed on environmental baseline conditions to
understand the beneficial and deleterious impacts due to the construction and operation of the
proposed project.
3.2.3 Baseline Status Primary Data Collection
The data on baseline status of various environmental parameters in the study area was
collected through primary surveys for three seasons as specified in the approved TOR for the
Etalin HEP.
3.2.4 Secondary Data
The data for various environmental baseline parameters like forest types, flora, wildlife, fishes,
and also socio-cultural aspects was collected from secondary sources like published reports of
Government departments like State Forest Department, State Fisheries Department
educational and research institutions like State Forest Research Institute, Itanagar, Regional
Centers of Botanical Survey of India and Zoological Survey of India, Itanagar, Rajiv Gandhi
University and Census of India. The secondary data was duly supplemented, wherever
applicable, with primary field surveys conducted in different seasons.
3.2.4.1 Physiography
The spatial database on physiographic features like drainage, roads, settlements and villages,
etc. was created from maps of topographic sheets and satellite data followed by ground truth
verification and data analysis with Geographic Information System (GIS) tools. The contours
of study area including that of catchment area were digitized from Survey of India 1:50,000
scale toposheets to calculate slope category for the entire catchment. Percent area under
various slope categories namely gently sloping, moderately sloping, strongly sloping,
moderately steep to steep, steep, very steep and escarpments were also calculated for the
entire catchment.

Environmental Impact Assessment (EIA) Report of Etalin HE Project
Proponent: M/s Etalin Hydro Electric Power Company Limited (EHEPCL) 3.4
Consultant: RS Envirolink Technologies Pvt. Ltd.
GIS based maps have been provided for the following themes:
General Features (Villages, roads, tributaries)
Hydrology: Drainage of Dri and Talo (Tangon) river along with their tributaries
Geology
Erosion
Elevation profile
Slope
Land use in study area
Villages in Impact Zone
Table 3.1: Scoping matrix for EIA study of Etalin H.E. Project
Environmental Parameter Likely Impacts
Land Environment
Construction phase
Increase in soil erosion
Pollution by construction spoils
Acquisition of land for construction works colonies
Solid waste from construction works colonies
Acquisition of land for various project appurtenances
Change of land use
Water Resources and Water Quality
Construction phase
Increase in turbidity of nearby receiving water bodies
Degradation of water quality due to disposal of wastes from
construction works colony and construction sites
Operation phase
Disruption of hydrologic regime
Sedimentation and siltation risks
Impacts on D.O. due to reservoir stratification
Risk of eutrophication
Reduced flow impacting downstream users
Aquatic Ecology
Construction phase
Increased pressure on aquatic ecology as a result of
indiscriminate fishing.
Reduced productivity due to increase in turbidity and
pollution of the river body
Operation phase
Impacts on migratory fish species
Impacts on spawning and breeding grounds
Degradation of riverine ecology
Shift in species density and diversity due to change in
aquatic ecosystem from lotic to lentic.
Increased potential for reservoir fisheries
Terrestrial Ecology
Construction phase
Increased pressure from construction works to meet their
fuel wood and timber requirements
Adverse impacts due to increased accessibility of the area
Loss of vegetation and forest area
Operation phase Impacts on wildlife movement

Environmental Impact Assessment (EIA) Report of Etalin HE Project
Proponent: M/s Etalin Hydro Electric Power Company Limited (EHEPCL) 3.5
Consultant: RS Envirolink Technologies Pvt. Ltd.
Environmental Parameter Likely Impacts
Loss of forest area due to submergence
Impact on Rare, Endangered and Threatened (RET) species,
if any
Socio-Economic Aspects
Construction phase
Improved employment potential during the project
construction phase
Development of allied sectors leading to greater
employment
Pressure on existing infrastructure facilities
Friction between the construction works and the native
population
Operation phase
Loss of land
Loss of private properties
Increased revenue from power generation
Increase in employment opportunities and standard of living
Public Health
Construction phase
Impacts due to disposal of untreated sewage from
construction works camps
Increase in incidence of communicable diseases
Operation phase Increased incidence of vector borne disease due to increase
in water spread area
Air Environment
Construction phase
Emissions due to fuel combustion in construction equipment
Increased vehicular movement
Entrainment of fugitive emissions
Noise Environment
Construction phase Increased noise level due to operation of various equipment
Increased vehicular movement
3.2.4.2 Geology
The regional geology around the project area highlighting geology, stratigraphy and structural
features, based on the existing information on these aspects contained in Detailed Project
Report (DPR) of the project. In addition the important parameters of seismicity were assessed
using published literature on seismic history and seismo-tectonic nature of the regional rock
types in the area.
3.2.4.3 Meteorology
Meteorological factors like precipitation, temperature and evapo-transpiration are important,
as they have a profound impact on the water availability, cropping pattern, irrigation and
drainage practices, soil erosion, public health, etc. Meteorological data have been collected
and analyzed as part of the DPR preparation by DPR consultants and the same has been used
in preparation of the EIA study.

Environmental Impact Assessment (EIA) Report of Etalin HE Project
Proponent: M/s Etalin Hydro Electric Power Company Limited (EHEPCL) 3.6
Consultant: RS Envirolink Technologies Pvt. Ltd.
3.2.4.4 Hydrology
Hydrological data for Dibang river available as Hydrology Volume in the DPR of Etalin HE
project has been appropriately compressed and duly incorporated in the EIA report as a
separate Chapter on Hydrology. The discharge data given in this Chapter has been used for
deriving minimum environmental flows and the discharge pattern in the river. As mandated in
the approved TOR for the project, a detailed Environmental Flow assessment study was
undertaken by Central Inland Fisheries Research Institute (CIFRI), Barrackpore and findings of
the same have been appended as a separate report along with the EIA volumes.
3.2.4.5 Forest Types & Forest Cover
The details on forest types and forest cover in the catchment area were based on field surveys
in the area supplemented with the working plans of the forest divisions of the study area.
Major forest types in the study area have been described based upon the classification of
Champion and Seth (1968).
3.2.4.6 Infrastructure Facilities
The present status of infrastructure facilities, status and availability of electricity, drinking
water, communication and mode of transportation, commercial, educational and health
facilities, veterinary services, etc. were collected using secondary data from Census of India
2011, District Statistical Handbook and interactions with the locals.
3.2.5 Primary Data Collection –Field Surveys
The field surveys for the collection of primary data commenced from April 2010 up to
November 2013 and were conducted in different seasons of the year i.e. winter/lean season,
pre-monsoon/summer and monsoon to collect data/ information on flora, fauna, forest types
and ecological parameters as well as sociological aspects. In addition, surveys and studies
were also conducted for understanding aquatic ecology and fish diversity of Dri and Talo
(Tangon) Rivers. The details of sampling are given in Table 3.2.
Field surveys in the study area were also conducted for the purpose of ground truthing and
augmenting the remote sensing data. For this purpose various attributes such as land
features, rivers, forests and vegetation types were recorded on the ground.
Table 3.2: Sampling schedule for various Environmental Parameters
Parameters Winter Pre-monsoon/
Summer Monsoon
Soil sampling December 2009 & Dec
2012
March-April 2010 &
March-April 2012
July-August 2010 &
July-August 2012
Air environment December 2009 & Dec
2012
March-April 2010 &
March-April 2012
July-August 2010 &
July-August 2012
Noise & Traffic December 2009 & Dec
2012
March-April 2010 &
March-April 2012
July-August 2010 &
July-August 2012
Vegetation
sampling
December 2009 & Dec
2012
March-April 2010 &
March-April 2012
July-August 2010 &
July-August 2012
Faunal surveys December 2009 & Dec
2012
March-April 2010 &
March-April 2012
July-August 2010 &
July-August 2012
Water sampling
and Aquatic
Ecology
December 2009 & Dec
2012
March-April 2010 &
March-April 2012
July-August 2010 &
July-August 2012

Environmental Impact Assessment (EIA) Report of Etalin HE Project
Proponent: M/s Etalin Hydro Electric Power Company Limited (EHEPCL) 3.7
Consultant: RS Envirolink Technologies Pvt. Ltd.
Parameters Winter Pre-monsoon/
Summer Monsoon
Socio-economic
survey of study
area villages
December 2009 & Dec
2012
March-April 2010 &
March-April 2012
July-August 2010 &
July-August 2012
Socio-economic
survey of project
affected families
- July-August 2010, June 2012 and
November 2013
3.2.5.1 Soil
The soil taxonomic (family) classification map of Etalin H.E. Project area was prepared as per
the Soil Atlas of Arunachal Pradesh procured from National Bureau of Soil Survey & Land Use
Planning (NBSS & LUP). Soil resource map of the study area was prepared and the area under
each soil taxonomic class was calculated using GIS.
In order to assess the nutrient and fertility status of the soil in the study area the samples
were collected from five different locations (Table 3.3 & Figure 3.1). The sampling for soil
was done at locations where major components of the projects are planned. Soil samples were
collected with help of khurpi from a depth of 15-30 cm (deep soil) and from surface (top soil)
after removing the debris material and were stored in cotton bags and brought to laboratory
for further physico-chemical analysis. The soil analysis was carried out at the Hitech Labs
Limited (CPCB accredited Lab.), Okhla, New Delhi. The soil samples were collected during all
the three seasons.
Table 3.3: Sampling locations
Sampling Site Location in Study Area
Site S1 Near Dri dam site
Site S2 Punli village on Dri limb
Site S3 Near Talo (Tangon) dam site
Site S4 Chanli village on Talo (Tangon) limb
Site S5 Powerhouse near Etalin village
The following parameters were analysed.
Physical parameters included:
Bulk density (gm/cc)
Water holding capacity (%w/w)
Porosity (%w/w)
Soil texture
Electrical conductivity (mhos/cm)
Chemical Parameters included:
pH
Organic matter (%w/w)
Nitrogen as N (% w/w)
Phosphorus as P (mg/kg)
Potassium as K (mg/kg)

Environmental Impact Assessment (EIA) Report of Etalin HE Project
Proponent: M/s Etalin Hydro Electric Power Company Limited (EHEPCL) 3.8
Consultant: RS Envirolink Technologies Pvt. Ltd.
Magnesium as Mg (mg/kg)
Chloride as Cl (mg/kg)
Sodium as Na (mg/kg)
Calcium as Ca (mg/kg)
Total alkalinity (mg/kg)
Salinity, ppt
Exchangeable Sodium Percentage (ESP)
3.2.5.2 Ambient Air Quality
Instruments such as Respirable Dust Samplers APM-460 and APM-411 (Envirotech make) was
used for monitoring Particulate Matter (PM10 and PM2.5 and gaseous pollution like SO2 and NOx.
Monitoring was carried out twice a week for 4 weeks at each location. Following parameters
were measured to understand the baseline condition:
i) Particulate Matter (PM10)
ii) Particulate Matter (PM2.5)
iii) Sulphur dioxide (SO2)
iv) Nitrogen oxide (NOx)
Identification of Sampling Location
Sampling locations are identified keeping in view the following:
Potential source of pollution - location of construction machinery and equipment, DG
sets, material storage and handling areas
Receptors - populated area or habitation, typically villages in the vicinity
Predominant wind direction – typically winds in mountainous regions that change
direction twice daily: - In the daytime the air over the mountain ridges and valleys
becomes warmer than the air at the same levels over the plains and expands more.
Consequently, at the higher levels the downward pressure from the mountains to the
valleys is reduced and air travels in that direction. At night the temperature and
pressure factors are reversed, so that mountain winds result. In addition to this
circulation of air between the valleys and mountains, there is a down flow of cooled air
along the mountain slopes at night and an upward flow of warmed air along the slopes
during the day.
Accessibility – Based on the above analysis sampling locations are identified, however,
they are finalized keeping in the view the accessibility of the identified sites;
acceptance of the locals to monitoring, safety of equipment and source of power
supply.
Sampling and Analysis
Sulphur dioxide (Modified West and Gaeke method (IS-5182 Part-II, 1969))
Placed 30 ml of absorbing solution in an impinger and sample for four hours at the flow rate of
1 L/min in High Volume Sampler. After sampling measured the volume of sample and
transferred to a sample storage bottle.
Sulphur dioxide from air is absorbed in a solution of potassium tetrachloromercurate (TCM). A
dichlorosulphitomercurate complex, which resists oxidation by the oxygen in the air, is

Environmental Impact Assessment (EIA) Report of Etalin HE Project
Proponent: M/s Etalin Hydro Electric Power Company Limited (EHEPCL) 3.9
Consultant: RS Envirolink Technologies Pvt. Ltd.
formed, which is stable to strong oxidants such as ozone and oxides of nitrogen and therefore,
the absorber solution was stored for some time prior to analysis. The complex was made to
react with para-rosaniline and formaldehyde to form the intensely coloured pararosaniline
methylsulphonic acid. The absorbance of the solution was measured by means of a suitable
spectrophotometer and SO2 concentration was calculated using the standard calibration graph.
Nitrogen dioxide (Jacobs Hochheiser method (IS 5182 Part-IV, 1975))
Place 30 ml of absorbing solution in an impinger and sample for four hour at the flow rate of
0.2 to 1 L/min in High Volume Sampler. After sampling measure the volume of sample and
transfer to a sample storage bottle.
Ambient nitrogen dioxide (NO2) is collected by bubbling air through a solution of sodium
hydroxide and sodium arsenite. The concentration of nitrite ion (NO2-) produced during
sampling is determined colorimetrically by reacting the nitrite ion with phosphoric acid,
sulfanilamide, and N-(1-naphthyl)-ethylenediamine di-hydrochloride (NEDA) and measuring
the absorbance of the highly coloured azo-dye at 540 nm using spectrophotometer and
concentration is calculated using the standard calibration graph.
Particulate Matter (PM10) - Gravimetric Method
Air is drawn through a size-selective inlet and through a 8” X 10” filter at a flow rate, which is
typically 1132 L/min using High Volume Sampler for 8 hours. Particles with aerodynamic
diameter less than the cut-point of the inlet are collected, by the filter. The mass of these
particles was determined by the difference in filter weights prior to and after sampling. The
concentration of PM10 in the designated size range was calculated by dividing the weight gain
of the filter by the volume of air sampled.
Particulate Matter (PM2.5) - Gravimetric Method
An electrically powered air sampler draws ambient air at a constant volumetric flow rate (16.7
lpm) maintained by a mass flow / volumetric flow controller coupled to a microprocessor into
specially designed inertial particle-size separator (i.e. cyclones or impactors) where the
suspended particulate matter in the PM2.5 size ranges is separated for collection on a 47 mm
polytetrafluoroethylene (PTFE) filter over a specified sampling period. Each filter is weighed
before and after sample collection to determine the net gain due to the particulate matter. The
mass concentration in the ambient air is computed as the total mass of collected particles in
the PM2.5 size ranges divided by the actual volume of air sampled, and is expressed in μg/m3.
The microprocessor reads averages and stores five-minute averages of ambient temperature,
ambient pressure, filter temperature and volumetric flow rate.
In order to build data base on the existing air quality of the study area, ambient air monitoring
at three locations at nearby villages viz. Etalin, Punli on Dri Limb and Punli on Talo (Tangon)
Limb were undertaken.
3.2.5.3 Ambient Noise levels & Traffic Density
Unwanted sound that is loud and unpleasant or unexpected is termed as noise pollution. It has
adverse impact on the daily activities of the human being and animals. The adverse impact of
the noise on human and animals also depends upon time, season and the quality of sound.

Environmental Impact Assessment (EIA) Report of Etalin HE Project
Proponent: M/s Etalin Hydro Electric Power Company Limited (EHEPCL) 3.10
Consultant: RS Envirolink Technologies Pvt. Ltd.
Sound Levels monitoring was carried out by digital sound level meter in terms of dB(A) levels
along with time of the day and source of sound, if any, to establish baseline data.
Monitoring locations are selected keeping in view the project activity area which are likely to
be potential source of noise in the area during the construction phase; location of receptors
i.e. habitation for human population and nearby forest areas to assess the impact on fauna
due to increased sound levels in the region. Existing sources of noise such as river flow and
accessibility of the identified location are also considered during the finalization of sound level
monitoring location.
Hourly monitoring is carried out where levels are recorded using hand held digital sound level
meter for 6-8 hours during the daytime. Night time readings are not practical as the
accessibility and security at nighttime is always a cause of concern in remote areas. Data
collected is compiled and analyzed to establish baseline equivalent levels.
Noise levels were monitored during the studies at locations in the Direct Impact Area of the
project is given in Table 3.4.
Table 3.4: Ambient air quality, noise and traffic density monitoring locations
Sl. No. Monitoring location
1 Dam Site Dri River
2 Punli Village on Dri Limb
3 Dam Site Talo (Tangon) River
4 Avonli village
5 Punli Village on Talo (Tangon) Limb
6 Etalin Village
7 Power house Area
8 Near Etalin School
Traffic density data was recorded by physically counting the number of different types of
vehicles passing through a particular point in a fixed time interval. Some major villages along
the road were considered as nodes for monitoring movement of traffic.
3.2.5.4 Land use / land cover
The objective of the study was to produce a detailed vegetation/ land use map using hybrid
digital classification technique. The study also aims to produce land cover data set appropriate
for applications like erosion mapping, etc. Land use and land cover mapping of the study area
was prepared from the data procured from Forest Survey of India (FSI). It was further refined
by ground checks carried out during the field surveys. For this purpose FCC of the entire study
area was generated from digital satellite data of IRS-1D LISS-III, Path/Row - 94/47 with
Bands 2, 3 and 4. In addition Landsat ETM+ data was also downloaded from Global Land
Cover Facility web site.
The data procured from FSI was downloaded and further processed to generate mosaic of
study area. In order to understand the extent of forest cover in particular, the classification
scheme suggested by Forest Survey of India was adopted for the preparation of land use/land
cover maps. Three forest density classes were interpreted for the forest cover mapping. The

Environmental Impact Assessment (EIA) Report of Etalin HE Project
Proponent: M/s Etalin Hydro Electric Power Company Limited (EHEPCL) 3.11
Consultant: RS Envirolink Technologies Pvt. Ltd.
forests with <70% canopy cover has been demarcated as Very Dense forest, between 40%
and 70% canopy cover was delineated as Moderately Dense forest and between 10% and 40%
crown density as Open forest. Furthermore, degraded forests, grass covered slopes with
canopy density <10% were delineated as scrubs. The area not included in any of the above
classes has been delineated as non-forest land cover.
Data Set Used
Survey of India (SoI) : 82/P-14, 82/P-15, 83D/2 & 82/D-3
(Scale: 1:50000)
Projection and Datum : UTM and WGS 84 North
Satellite Data : IRS P6 LISS 3 and LANDSAT ETM+
3.2.5.5 Vegetation Community Structure/ Floristic Surveys
The objectives of the present floristic study are as follows:
To prepare an inventory of various groups plants (Angiosperms, Gymnosperms,
Pteridophytes, Bryophytes, and Lichens) in the study area
To assess the community structure in the study area
To Determine Importance Value Index and
Shannon Wiener Diversity Index for trees, shrubs and herbs present in the study area.
The detailed account of floristic diversity and ecology has been described based on the primary
surveys in the catchment area and study area of the proposed project. These surveys were
undertaken during different seasons of the year to assess the vegetation structure and to
prepare inventory of plant species belonging to different plant groups like angiosperms,
gymnosperms, pteridophytes, bryophytes and lichens found in the study area.
The community structure of the study area was studies by Quadrat method. The size and
number of quadrats needed were determined using the species- area curve (Misra, 1968). The
data on vegetation were quantitatively analyzed for abundance, density, frequency as per the
methodology given in Curtis & McIntosh (1950). The Importance Value Index (IVI) for trees
was determined as the sum of relative density, relative frequency and relative dominance
(Curtis, 1959).
Sampling Site Selection
The sampling locations were selected on the basis of the area located in the vicinity of
proposed projects and its components. Sampling was undertaken to assess the composition of
particular forest type/s in that area. Eight sampling locations were selected for carrying out
phytosociological surveys of the vegetation and in addition an inventory of various floristic
elements was also prepared by walking along different transects around these sampling sites.
The location of sampling sites has already been described earlier in the document. In order to
understand the composition of the vegetation, most of the plant species were identified in the
field itself whereas the species that could not be identified a herbarium specimen was made
along with their photographs for identification later with the help of available published
literature and floras of the region.
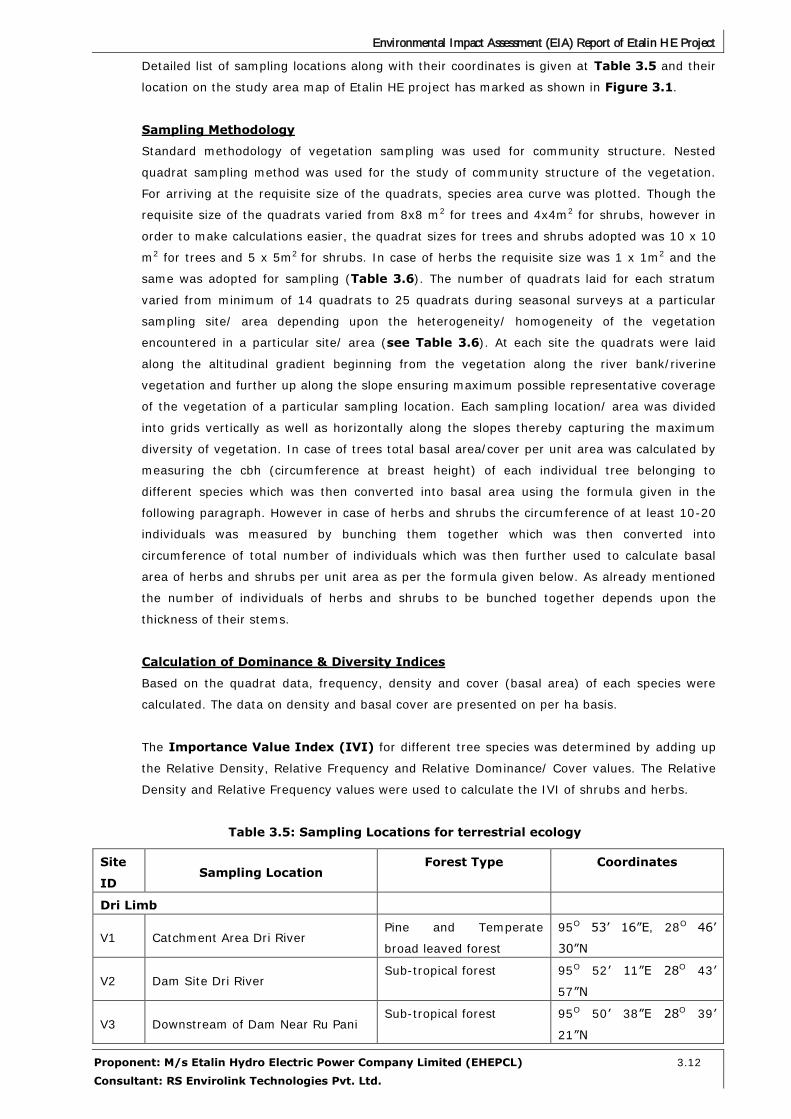
Environmental Impact Assessment (EIA) Report of Etalin HE Project
Proponent: M/s Etalin Hydro Electric Power Company Limited (EHEPCL) 3.12
Consultant: RS Envirolink Technologies Pvt. Ltd.
Detailed list of sampling locations along with their coordinates is given at Table 3.5 and their
location on the study area map of Etalin HE project has marked as shown in Figure 3.1.
Sampling Methodology
Standard methodology of vegetation sampling was used for community structure. Nested
quadrat sampling method was used for the study of community structure of the vegetation.
For arriving at the requisite size of the quadrats, species area curve was plotted. Though the
requisite size of the quadrats varied from 8x8 m2 for trees and 4x4m2 for shrubs, however in
order to make calculations easier, the quadrat sizes for trees and shrubs adopted was 10 x 10
m2 for trees and 5 x 5m2 for shrubs. In case of herbs the requisite size was 1 x 1m2 and the
same was adopted for sampling (Table 3.6). The number of quadrats laid for each stratum
varied from minimum of 14 quadrats to 25 quadrats during seasonal surveys at a particular
sampling site/ area depending upon the heterogeneity/ homogeneity of the vegetation
encountered in a particular site/ area (see Table 3.6). At each site the quadrats were laid
along the altitudinal gradient beginning from the vegetation along the river bank/riverine
vegetation and further up along the slope ensuring maximum possible representative coverage
of the vegetation of a particular sampling location. Each sampling location/ area was divided
into grids vertically as well as horizontally along the slopes thereby capturing the maximum
diversity of vegetation. In case of trees total basal area/cover per unit area was calculated by
measuring the cbh (circumference at breast height) of each individual tree belonging to
different species which was then converted into basal area using the formula given in the
following paragraph. However in case of herbs and shrubs the circumference of at least 10-20
individuals was measured by bunching them together which was then converted into
circumference of total number of individuals which was then further used to calculate basal
area of herbs and shrubs per unit area as per the formula given below. As already mentioned
the number of individuals of herbs and shrubs to be bunched together depends upon the
thickness of their stems.
Calculation of Dominance & Diversity Indices
Based on the quadrat data, frequency, density and cover (basal area) of each species were
calculated. The data on density and basal cover are presented on per ha basis.
The Importance Value Index (IVI) for different tree species was determined by adding up
the Relative Density, Relative Frequency and Relative Dominance/ Cover values. The Relative
Density and Relative Frequency values were used to calculate the IVI of shrubs and herbs.
Table 3.5: Sampling Locations for terrestrial ecology
Site
ID Sampling Location
Forest Type Coordinates
Dri Limb
V1 Catchment Area Dri River Pine and Temperate
broad leaved forest
95O 53’ 16”E, 28O 46’
30”N
V2 Dam Site Dri River Sub-tropical forest 95O 52’ 11”E 28O 43’
57”N
V3 Downstream of Dam Near Ru Pani Sub-tropical forest 95O 50’ 38”E 28O 39’
21”N

Environmental Impact Assessment (EIA) Report of Etalin HE Project
Proponent: M/s Etalin Hydro Electric Power Company Limited (EHEPCL) 3.13
Consultant: RS Envirolink Technologies Pvt. Ltd.
Talo (Tangon) Limb
V4 Catchment Area Talo (Tangon)
River
Pine and Temperate
broad leaved forest
96O 3’ 20”E 28O 39’ 16”N
V5 Dam Site Talo (Tangon) River Sub-tropical forest 96O 0’ 55”E 28O 38’ 36”N
V6 Downstream Near Anon Pani Sub-tropical forest 96O 56’ 59”E 28O 37’
32”N
Power House Area
V7 Power House Site Sub-tropical forest 95O 51’ 55”E 28O 37’ 7”N
V8 Downstream of Power House Site Sub-tropical forest 95O 50’ 58”E 28O 35’
26”N
Table 3.6: Number of quadrats studied during field surveys for trees, shrubs and
herbs
Sampling Site Trees
(10x10) m2
Shrubs
(5x5) m2
Herbs (1x1)
m2
V1 14 20 15
V2 14 20 24
V3 14 20 25
V4 14 20 15
V5 14 20 15
V6 14 20 22
V7 14 20 15
V8 14 20 20
For the calculation of dominance, the basal area was determined by using following formula.
Basal area = π r2
Species diversity and evenness index were calculated by using the Shannon-Wiener Diversity
Index (1963) and Evenness Index, respectively.
The index of diversity was computed by using Shannon Wiener Diversity Index (Shannon
Wiener, 1963) as:
H = - Σ (ni/n) x ln (ni/n)
Where, ni is individual density of a species and n is total density of all the species
The Evenness Index (E) is calculated by using Shannon's Evenness formula (Magurran, 2004).
Evenness Index (E) = H / ln(S)
Where, H is Shannon Wiener Diversity index; S is number of species
3.2.5.6 Faunal Elements
The fauna of the study area has been compiled with the help of secondary sources
supplemented with information provided by local people during field surveys in the study area.
For the preparation of checklist of animals, Forest Working Plan of Anini Social Forestry
Division and Dibang Valley Forest Divisions, as well as State Biodiversity Management Action
Plan prepared by SFRI, Itanagar were consulted. In addition data was compiled from published
literature like Chetri & Chetri (2007), De et al. (2006), Sanyal & Gayen (2006), Sarkar & Ray

Environmental Impact Assessment (EIA) Report of Etalin HE Project
Proponent: M/s Etalin Hydro Electric Power Company Limited (EHEPCL) 3.14
Consultant: RS Envirolink Technologies Pvt. Ltd.
(2006), Ali & Ripley (1983), Grewal et al. (2002), Grimmett et al. (1998), Fleming et al.
(1984), Sumit Sen (2007).
Sampling Methodology & Constraints
Since observations of fauna and wildlife take long time, primary surveys were limited to
indirect sightings of animals during the field surveys as direct sightings are very rare. The
presence of wildlife was also confirmed from the local inhabitants depending on the animal
sightings and the frequency of their visits in the catchment area.
Table 3.7: Transects and trails for faunal elements
Transect Location
Tr1 Catchment Area Dri River (Dri Limb)
Tr2 Catchment Area Talo (Tangon) River (Talo Limb)
Tr3 Near Dri Dam site
Tr4 Near Talo (Tangon) Dam site
Tr5 Power House Site
Tr6 Downstream of Power House Site
The study area was divided into different strata based on vegetation and topography.
Sampling for habitat and animals was done in different strata. As the normal systematic
transects for mammals and birds were not possible in this study area due to difficult terrain,
therefore mostly trails were used for faunal sampling. In addition to the field sampling the
data/ information was also collected as follows:
Direct sighting and indirect evidences such as calls, signs and trophies of mammals were
recorded along the survey routes taking aid from Prater (1980).
The interviews with local villagers were conducted for the presence and relative abundance of various
animal species within each locality. In addition, the data was also collected on habitat condition,
animal presence by direct sighting and indirect evidences by forest personnel and villagers.
Transects were walked along the forest trail in the study area (as shown in Figure 3.1) to
make observations on the wildlife in each forest areas that fall within study area of the
proposed hydropower project. To study the wild mammalian fauna of the study area, 2 - 5 km
long transects and trails were walked during early morning and evening hours. Direct sighting
of animals as well as indirect signs like scat, pellets, pugmarks, scraps, vocalizations, horns
etc. were also recorded during the survey trails. On each transect, the locations were marked
with the help of a hand held GPS. Animals and birds observed along the route were recorded,
together with information on their habitat. This method of continuous recording (Martin &
Batson, 1993, Chalise, 2003) was adopted for the collection of general information on species
presence and absence. It also reveals diversity and population by direct observation. This
method is also known as Visual Encountered Sampling to reflect wildlife population and
diversity (Mukherjee, 2007). Four to five separate walks were done along both the banks of
Dri and Talo (Tangon) rivers and their tributaries to collect information on riverine tract.
Secondary data as well as information gathered from the locals were also noted for the
presence or absence of wild animals in the area. These indirect evidences and information
have to be analyzed and ascertained with the help of literature available.

Environmental Impact Assessment (EIA) Report of Etalin HE Project
Proponent: M/s Etalin Hydro Electric Power Company Limited (EHEPCL) 3.15
Consultant: RS Envirolink Technologies Pvt. Ltd.
The birds were also sighted on the same transect and trails marked for mammals. Sampling
was carried out on a fixed width trails of 2 km wherever the terrain permitted and point counts
were carried out at a fixed distances at more or less regular intervals. A prismatic field
binocular (10 × 50) was used for bird watching during transect survey and nearby the human
habitation of study area. Birds were identified as per the field guide of Ali & Ripley (1983),
Grimmett and Flaming et al. (1984), Krys Kazmierczak (2006) and Grimmett (2007).
The herpetofauna was also sampled along the same transects marked for mammals.
3.2.5.7 Water Quality
The data on water quality has been collected to:
Assess the quantitative and qualitative nature of effluent discharges to the river and its
tributaries.
Evaluate river water quality on upstream and downstream of the project site and also in
the stretch between barrage and powerhouse.
Selection of Sampling Sites
The sampling was carried out at 11 different locations during three seasons as described below
in the table to study various physico-chemical and biological characteristics of Dri and Talo
(Tangon) rivers (Table 3.8 & Figure 3.1). Water samples were collected during each
sampling season for physico-chemical as well as biological parameters. The sampling sites in
the Dri and Talo (Tangon) rivers were located near the area where major project components
are proposed like dam site, powerhouse, muck dumping sites, working area, near the
confluence of major tributaries of Dri and Talo (Tangon) rivers and near settlements.
Sampling Parameters
Analysis of physico-chemical parameters included temperature, turbidity, total dissolved
solids, pH, dissolved oxygen, total alkalinity, total hardness, electrical conductivity, chloride,
nitrate, phosphate and silicates in the water samples collected during the field visit of the
proposed project site. The samples were taken in the replicates at each site of the river and
the average value was calculated for the result. The sites at which sampling was done are as
listed in Table 3.8 and also shown in Figure 3.1.
Table 3.8: Water sampling locations
Sites Location
W1 Catchment Area (Dri River)
W2 Dam Site (Dri River)
W3 Ayo Pani
W4 Ru Pani
W5 Catchment Area (Talo River)
W6 Dam Site (Talo River)
W7 Non Pani
W8 Makri Pani
W9 Noh Pani
W10 Power house Site (near Etalin village)
W11 After confluence of Dri and Talo rivers

Environmental Impact Assessment (EIA) Report of Etalin HE Project
Proponent: M/s Etalin Hydro Electric Power Company Limited (EHEPCL) 3.16
Consultant: RS Envirolink Technologies Pvt. Ltd.
Some of the physico-chemical parameters of water necessary for the ecological studies were
measured in the field with the help of different instruments. The water temperature was
measured with the help of graduated mercury thermometer. The hydrogen ion concentration
(pH), electrical conductivity and total dissolved solids were recorded with the help of a pH, EC
and TDS probes of Hanna instruments (Model HI 98130) in the field. Dissolved oxygen was
measured with the help of Digital Dissolved Oxygen meter (Eutech ECDO 602K). The water
samples were collected in polypropylene bottles from the different sampling sites and brought
to the laboratory for further analysis after adding formalin as preservative. The turbidity was
measured with the help of Digital Turbidity meter and other parameters such as total
alkalinity, total hardness, chloride, nitrate, phosphate, and silicates were analyzed at the
Hitech Labs Limited, Okhla, New Delhi. These parameters were analysed as per the standard
procedures given by Adoni (1980) and APHA (1992).
Presence/ Absence (P/A) test was performed in the field for Total coliform using P/A broth
ampules without MUG reagent (4-methylumbelliferyl-ß-Dglucuronide). The colour change from
reddish purple to yellow or yellow brown indicates positive for Total coliform presence whereas
no colour change after incubation for more than 48 h indicates negative for Total coliform.
3.2.5.8 Aquatic Ecology
Sampling of Phytoplankton & Periphyton -Benthic (Epilithic) Diatoms and
Zooplankton
For the quantification of phytoplankton and zooplankton 50 liters of water for each community
was filtered at each site by using plankton net made up of fine silk cloth (mesh size 25 m).
The study was repeated three times at each site and samples were pooled. The filtrate
collected for phytoplankton was preserved in1% Lugol’s Iodine solution.
For periphyton sampling was performed across the width of the river at the depth of 15 - 30
cm. The samples were taken from the accessible banks only. The pebbles (64 - 128 mm size)
usually 4 - 5 in number, were picked from the riffle and pools, in apparently different flows
such as stones above and below gushing waters, swift flow and slow flow conditions so as to
obtain a representative sample. Benthic diatom samples were collected by scratching the
pebbles with a brush of hard bristles in order to dislodge benthos from crevices and minute
cavities on the boulder surface from an area of 3 x 3 cm2, using a sharp edged razor. The
scrapings from each cobble were collected in 25µ mesh and transferred to storage vials. The
samples were preserved in 1% Lugol’s iodine solution.
For preparing permanent mounts from the treated samples, the slide was first smeared with
Mayer’s albumen. The sample was then agitated to render it homogeneous. Quickly a drop of
known volume (0.04 ml) of processed material was placed on the slide and heated gently till it
dried. It was dehydrated using 95% and 100% alcohol, consecutively. The dehydrated
material was transferred to Xylol twice before finally mounting in Euparol.
Identification of Benthic algae & Zooplankton
The permanent mounts were then subjected to analysis under a phase contrast binocular
microscope using an oil immersion lens of x 100 magnification. For identifying the various
diatom species, varieties and forms, the morphological characteristics used included length,

Environmental Impact Assessment (EIA) Report of Etalin HE Project
Proponent: M/s Etalin Hydro Electric Power Company Limited (EHEPCL) 3.17
Consultant: RS Envirolink Technologies Pvt. Ltd.
width (µm), number of striae, raphe, axial area, central area, terminal and central nodules.
Identifications were made according to standard literature (Schmidt 1914 - 1954, Hustedt
1943, Hustedt 1985, Krammer & Lange - Bertalot 1986, 1991, 1999, 2000 a & b, Lange -
Bertalot, H. Krammer, K. 2002, Metzeltin & Lange - Bertalot 2002, Krammer 2000, 2003,
Lange Bertalot et al. 2003, Werum & Lange - Bertalot 2004., Metzeltin et al. 2005). Sarode &
Kamat (1984), Prasad (1992) and Gandhi (1998) were also consulted for the Oriental species.
The slide preparation and identification of benthos was done at Ecology Lab., Department of
Zoology, HNB Garhwal University, Srinagar and the permanent mounts have been adequately
stored there.
The supernatant plankton free water was removed and the settled zooplankton were
enumerated by ‘Sedgwick-Rafter Cell’ method. Identification of zooplanktons species was
performed under microscope by using keys and monographs of standard references like Ward
and Whipple (1959) and Battish (1992).
For samples were preserved in 1% Lugol’s iodine solution acid treatment was done according
to Reimer (1962) method adopted earlier by (Nautiyal & Nautiyal 1999, 2002) to process the
samples for light microscopy. The treated samples were washed repeatedly to remove traces
of acid. Samples were treated with hydrogen peroxide with high organic content to clean the
diatom frustules. The permanent mounts were prepared in Naphrax for further analysis. They
were examined using a BX-40 Trinocular Olympus microscope (x10 and x15 wide field
eyepiece) fitted with Universal condenser and PLANAPO x 100 oil immersion objective under
bright field using appropriate filters to identify the species.
Sampling & Identification of Macro-invertebrates
The Macro-invertebrate samples were collected from 1 sq ft area by lifting of stones and
sieving of substratum from the wide able portion of the river. The material was sieved through
125 µm sieve and preserved in 70% ethyl alcohol. Samples were collected in three replicates
and pooled for further analysis. The organisms obtained were then counted after identifying
them up to family level. Standard keys were used for the identification of macro invertebrate
samples (Pennek 1953; Edmondson 1959; Macan 1979; Edington and Hildrew 1995).
Crude density (Indiv/m2) = total numbers of individuals in each quadrat/ total quadrats × 11
Density and Diversity of different species was calculated as follows:
a) Density of phytoplankton (cells/lit) and zooplankton (indiv./lit)
b) Density of phytobenthos (cells mm-2)
Total count of cells × cover glass size/length of visual field of microscope × counted rows ×
total sample volume (ml)/observed sample / sampled area
c) Species Diversity Index (Shannon & Wiener 1963): The Shannon diversity
indices were determined on the basis of counts (500 - 600 valves).
Shannon-Wiener Diversity Index H = - Σ (ni/n) x ln (ni/n)
where, pi is the proportion of total number of species made up of the ith species
d) Evenness Index (Shannon & Wiener 1963)
Evenness Index (E) = H / ln(S)
where, H is Shannon Index of general diversity and S is Number of species

Environmental Impact Assessment (EIA) Report of Etalin HE Project
Proponent: M/s Etalin Hydro Electric Power Company Limited (EHEPCL) 3.18
Consultant: RS Envirolink Technologies Pvt. Ltd.
Sampling for Fishes
The data on the occurrence of fish species was collected from Fisheries Department of State
Government and through literature review as well. Experimental fishing was done with the
help of local fishermen at various sites in the study area and river stretches both upstream
and downstream of the project site to ascertain the distribution pattern of fish species. The
fishermen used fish traps locally known as Takom. It is a conical shaped fish trap made of
bamboo with a mouth diameter ranging from 0.1 to 0.3 meter. It is fixed against the water
current. Once the fish entered inside, they remained entangled in the base with the pressure
of water current. They also used a conical shaped basket made of cane to collect fishes from
the river. With this fishing gear small sized fishes, especially bottom dwellers, are easily
collected. Identification and of all the fish catch was done and an inventory of the fish species
was also by consulting Nath & Dey (2000) and Bagra et al. (2009). Interviews were conducted
with locals regarding the probable presence of migratory fishes like Mahseer in the area.
3.2.5.9 Socio-economic Surveys
To assess the baseline condition of socio-economic aspects of the study area, following
primary and secondary data were collected:
The data on socio-economic aspects was collected at two levels- at village and individual
household level.
The first level of data collection was done in the villages which are going to be directly
affected by acquisition of land for project construction. A sampling strategy was adopted
based on the observations made during the first phase (Details given in R&R Report).
In the second level data collection Socio-economic survey of Project Affected Families was
conducted. For this format was designed for conducting socio-economic survey which
included questions on demographic, ethnographic, economic, literacy, development,
agricultural, cultural and aesthetic site, infrastructure facilities: education, health and
hygiene, communication network, etc. A door to door survey was conducted to collect
information (Details given in R&R Report).
Data collection from secondary sources was also made to validate some of the primary
information.
The details of surveys conducted for the preparation of R&R plan as well as Social Impact
Assessment (SIA) are given in separate volume as Social Impact Assessment and
Rehabilitation & Resettlement Plan for Etalin HE Project (3097MW).
In order to assess the existing status of public health, the following data on public health
status has been collected from Public Health Department:
Prevalent vectors in the area
Prevalence of malaria and other water and vector-borne diseases in the area.
The details of source of different Environmental parameters are given at Table 3.9.

Environmental Impact Assessment (EIA) Report of Etalin HE Project
Proponent: M/s Etalin Hydro Electric Power Company Limited (EHEPCL) 3.19
Consultant: RS Envirolink Technologies Pvt. Ltd.
Table 3.9: Source of data for various Environmental Parameters
Aspect Mode of Data
collection
Parameters monitored Frequency Sources
Meteorology Secondary Temperature, Humidity, Rainfall - Detailed Project Report (DPR)
Hydrology/ Water
Resources
Secondary Flow, Design, hydrograph, and design flood
hydrograph
- Detailed Project Report (DPR)
Geology and seismology Primary and
Secondary
Regional Geology Tectonic and Earthquakes - Detailed Project Report (DPR)
Land use Primary and
secondary
Land use pattern - Remote Sensing and GIS Studies
Ambient Air Primary SPM, RSPM, SO2, NOx Seasonal On-site monitoring and analysis
Surface Water Primary Physico-chemical and biological parameters Seasonal On-site monitoring and analysis
Drinking Water Primary Physico-chemical and biological parameters Seasonal On-site monitoring and analysis
Ambient Noise Primary Leq (Day only), and Mean noise level in dB (A) Seasonal On-site monitoring and analysis
Soil Primary and
Secondary
Physico-chemical parameters Seasonal On-site monitoring and analysis
Terrestrial Ecology Primary and
secondary
Floral and faunal diversity, density and
species composition
Seasonal On-site data collection, Forest
Department,
State Forest Research Institute,
Itanagar, Zoological Survey of India,
Itanagar, Rajiv Gandhi University,
Itanagar, and Literature review
Aquatic Ecology and
Fisheries
Primary and
secondary
Diversity, density and species composition of
planktons and fishes
Seasonal On-site data collection, Fishery
Department, Itanagar, and Literature
review
Socio-economic aspect Primary and
secondary
Demographic profile, Ethnographic profile,
Economic structure, Literacy profile,
Development profile, Agricultural practices,
Cultural and aesthetic sites, Infrastructure
facilities: education, health and hygiene,
communication network, etc., Impact on socio-
cultural and ethnographic aspects due to dam
building activity
- Field Survey, Directorate of
Economics and Statistics, Govt. of
Arunachal Pradesh, Itanagar, District
Statistical Office, Dibang Valley
District, Arunachal Govt. Website,
Revenue Department and Literature
review

Environmental Impact Assessment (EIA) Report of Etalin HE Project
Proponent: M/s Etalin Hydro Electric Power Company Limited (EHEPCL) 3.20
Consultant: RS Envirolink Technologies Pvt. Ltd.
3.3 IMPACT ASSESSMENT & MITIGATION MEASURES
Prediction is essentially a process to forecast the environmental conditions of the project area
that might be expected to occur because of implementation of the project. Impacts of project
activities have been predicted using overlay technique (super-imposition of activity on
environmental parameter). For intangible impacts qualitative assessment has been done. The
environmental impacts predicted are as follows:
Loss of cultivable land and forests
Impacts on land use pattern
Impact on socio-economic aspects
Displacement of population, if any, due to acquisition of private and community
properties
Impacts on hydrologic regime
Impacts on water quality
Increase in incidence of water-related diseases including vector-borne diseases
Effect on riverine fisheries, including migratory fish species
Increase in air pollution and noise level during project construction phase
Impact due to sewage generation from construction works camps
Impact due to acquisition of forest land
Impacts on terrestrial and aquatic ecology due to increased human interferences
during project construction and operation phases
Impact due to blasting
3.4 ENVIRONMENTAL MANAGEMENT PLAN
Based on the environmental baseline conditions and project inputs, the adverse impacts were
identified and a set of measures have been suggested as a part of Environmental Management
Plan (EMP) for their mitigation.
The management measures have been suggested for the following aspects:
Biodiversity Conservation and Management Plan
Catchment Area Treatment Plan
Fishery Conservation & Management Plan
Solid Waste Management Plan
Public Health Delivery System
Forest Protection Plan/Energy Conservation Measures
Muck Disposal Plan
Landscaping and Restoration of Quarries and Working Areas
Reservoir Rim Treatment Plan
Dam Break Modeling and Disaster Management Plan
Mitigation Measures for Air, Noise and Water Environment
Compensatory Afforestation Plan
Environmental Monitoring Plan
The expenditure required for implementation of R & R Plan, CAT Plan and other components of
EMP have been estimated and proposed as part of the study report.

Environmental Impact Assessment (EIA) Report of Etalin HE Project
Proponent: M/s Etalin Hydro Electric Power Company Limited (EHEPCL) 3.21
Consultant: RS Envirolink Technologies Pvt. Ltd.
3.5 ENVIRONMENTAL MONITORING PROGRAMME
It is necessary to continue monitoring of certain parameters to verify the adequacy of various
measures outlined in the Environmental Management Plan (EMP) and to assess the
implementation of mitigation measures. A comprehensive environmental monitoring
programme including monitoring frequency for critical parameters has been suggested for
implementation during project construction and operation phases. The staff, necessary
equipments and agencies to be involved for implementation of the Environmental Monitoring
Programme and costs have also been indicated.

Draft Environmental Impact Assessment (EIA) Report of Etalin HE Project
Proponent: M/s Etalin Hydro Electric Power Company Limited (EHEPCL) 4.1
Consultant: RS Envirolink Technologies Pvt. Ltd.
4.1 GENERAL
Arunachal Pradesh, the land first to greet sunrise in the country, is a thinly populated hilly
terrain on the North East extremity of India situated between latitude 26°40'N and 29°25'N
and longitude 91°35'E and 97°25'E. The state has international borders with Bhutan in west,
China in north and north-east and Myanmar (Burma) in east and interstate borders with
Nagaland in south west and Assam in south. It covers an area of about 83,743 sq km
extending along south slope of Eastern Himalaya and the western slopes of the Patkoi hills
around the Brahmaputra Valley. Arunachal Pradesh is the largest state area wise in the North
Eastern Region.
Known as North-East-Frontier Agency (NEFA) since British days, the area was awarded the
status of Union Territory on 21st January, 1972 when it was renamed as Arunachal Pradesh.
Subsequently, on 20th February 1987 it was elevated to the status of a full-fledged state. The
capital of the state is Itanagar which is situated in Papumpare district. The State is
administratively divided into 17 districts. Evergreen forests cover about 82% of total area with
its numerous turbulent streams, roaring rivers, deep gorges, lofty mountains, snow clad
shining peaks and hundreds & thousands of species of flora and fauna.
For details on Hydrological aspects Refer Annexure –IV.
Chapter HYDROLOGY
4

Draft Environmental Impact Assessment (EIA) Report of Etalin HE Project
Proponent: M/s Etalin Hydro Electric Power Company Limited (EHEPCL) 5.1
Consultant: RS Envirolink Technologies Pvt. Ltd.
5.1 GENERAL
The proposed Etalin Hydroelectric Project is located in Dibang Valley district of Arunachal Pradesh.
To its west lies Upper Siang district and its southern boundary is shared by Lower Dibang valley
district. The Etalin Hydroelectric project envisages utilization of the discharges of the rivers Dri and
Talo (Tangon) to generate 3097 MW of power including 27 MW installed capacity contributed by two
small hydro schemes at the toe of the Dams at Dri river and Talo (Tangon) river. The project layout
conceived by CEA during pre-feasibility stage and subsequently reassessed by NHPC is more or less
similar. The project envisaged two separate diversion dams each on river Dri and Talo (Tangon)
and a common underground powerhouse at the confluence of Dri and Talo (Tangon) near Etalin
village. The layout has been studied further and the best suitable options for locating the project
features have been evolved.
For details on Geological aspects Refer Annexure –V.
Chapter GEOLOGY &
SEISMOTECTONICS 5

Environmental Impact Assessment (EIA) Report of Etalin HE Project
Proponent: M/s Etalin Hydro Electric Power Company Limited (EHEPCL) 6.1
Consultant: RS Envirolink Technologies Pvt. Ltd.
6.1 INTRODUCTION
The Environmental Baseline chapter provides details of data collected during different seasons
i.e. winter/lean season, Summer/pre-monsoon and monsoon in the project study area as
specified in the approved Terms of Reference by MoEF&CC, Government of India. The details
of collection of both primary and secondary data for pertinent environmental components
have been given in Chapter-3 Methodology of the EIA report.
6.2 DRAINAGE
Dri river originates at an altitude of around 5350 m in the glacial ranges of Great Himalaya. It
meets several streams like Ange from the left and Mathun river from the right. It has a palm
shaped drainage basin and is sufficiently steep and flow through narrow valley.
The Dri River after its confluence with Mathun river near village Mathuli is known as Dri /
Dibang river and has got a moderate to steep gradient. The river, as it flows down, is met by
streams called Ange from the left and Mathun from the right. Further downstream Talo
(Tangon) joins the river from the left and following this confluence the river is named as
Dibang. It is further joined by tributaries viz. Emra, Ahi, and Ithun rivers.
River Talo (Tangon) originates in the high ranges of the Himalaya. It flows from east to west
in a sufficiently deep and narrow river basin. Various tributaries meeting the river from its left
are Edzon river, Lalu Pani, Anon Pani and from right Ipi Pani, Emo Pani, Sonko Pani, Echcha
river. River Talo (Tangon) meets River Dri near Etalin village and the combined flow together
is called Dibang River further meets Emra, Ahi, Ithun etc. The proposed dam site is Talo
(Tangon) River near Apanli village and power house is proposed on left bank of Talo (Tangon)
River near the Etalin village. The catchment area drainage map of Dibang River up to Etalin
Hydroelectric Project site is given in Figure 6.1.
The general drainage pattern is pre-dominantly dendritic to trellis type as it branches at
random, apparently with no definite preference for anyone direction and minor branches flow
into another at every conceivable angle.
The catchment area of Etalin project up to the proposed dam site on Dri/Dibang limb is
3,685 sq km whereas the catchment area of the project up to proposed dam site on Talo
(Tangon) limb is 2,573 sq km. Dibang River has a total length 195 km from its origin to
confluence with Lohit. The length of the rivers up to the proposed diversion structures is
estimated at around 90 km and 74 km, respectively, on Dri/Dibang and Talo (Tangon) limbs.
6.3 PHYSIOGRAPHY
The topography of the area is rugged with deep gorges and high hills. The slopes in the valley
are very steep with thick vegetation. Some of the areas are inaccessible. Many streams cut
Chapter ENVIRONMENTAL BASELINE
STATUS: PHYSICO-CHEMICAL PARAMETERS
6

Environmental Impact Assessment (EIA) Report of Etalin HE Project
Proponent: M/s Etalin Hydro Electric Power Company Limited (EHEPCL) 6.2
Consultant: RS Envirolink Technologies Pvt. Ltd.
across the valley slopes. The area is marked by characteristic peri-glacial topography with
sharp crested ridges and sculptured „whale back‟ hill slopes and marginal glacial features. The
area is marked by typical U-shaped valleys and presence of terminal and lateral moraines,
which suggest early quaternary glaciations in the area. Digital Terrain Model (DTM) of the
study area of Etalin Hydroelectric project generated from the ASTER G-DEM data is shown
below in Figure 6.2.
Majority of the study area as well as catchment area of Dri limb lies between 2000 m and
4000 m elevations i.e. more than 72% of area lies in this band while about 15% lies above
4000m. Only about 12% lies in 500-2000 m elevation band. However in Talo (Tangon) limb
catchment and study about 57% area lies between 2000 m and 4000 m elevation band and
more than 36% lies above 4000m while only about 6% lies in 500-2000 m elevation band.
Most of the project activities are restricted to the 600-1500 m elevation zone only.
Derived contours from topographical maps were used for preparation of Digital Elevation
Model (DEM) for the Free Draining Catchment area and to prepare a slope map. First of all, a
Digital Terrain Model (DTM) of the area was prepared, which was then used to derive a slope
map. The slope classes and ranges are recommended by Soil & Land Use Survey of India
(SLUSI) has been used for the study.
The slope map of the study area is given at Figure 6.3 and area falling under various slope
categories has been tabulated below in Table 6.1. As seen from the map and table nearly
90% of the study area is under steep to extremely steep slopes. The area under extremely
steep category i.e. with slopes higher than 70% is more than 45% of the total area.
Table 6.1: Areas falling under different slope categories in the study area
Slope in
Percent Category Area (sq km)
Area
(%)
0 - 2 Gently Sloping 10.50 1.16
2 - 8 Moderately Sloping 9.78 1.08
8 - 15 Strongly Sloping 17.50 1.93
15 - 30 Moderately Steep 65.26 7.20
30 - 50 Steep 163.10 17.99
50 - 70 Very Steep 229.00 25.26
>70 Extremely Steep 411.48 45.39
TOTAL 906.62 100.00
6.4 SOIL
6.4.1 Soil Taxonomic Classification
The soil taxonomic (family) classification map of Etalin H.E. Project area was prepared as per the
Soil Atlas of Arunachal Pradesh published by National Bureau of Soil Survey & Land Use Planning
(NBSS & LUP). Soil resource map of the project study area and their description is given in Figure
6.4. Majority of project study area i.e. more than 80% falls under Lithic Udorthents of Entisols
and Entic Haplumbrepts of Inceptisols. Lithic Udorthents are characterized by shallow depth,
and are loamy-skeletal soils found on very steeply sloping hill summit with very severe
erosion hazard while Entic Haplumbrepts are deep, loamy-skeletal soils found on moderately
steep slopes with severe erosion hazard (Table 6.2 & Figure 6.4).

Environmental Impact Assessment (EIA) Report of Etalin HE Project
Proponent: M/s Etalin Hydro Electric Power Company Limited (EHEPCL) 6.3
Consultant: RS Envirolink Technologies Pvt. Ltd.
Figure 6.1: Drainage Catchments areas of two limbs of Etalin HE project
Talo (Tangon) Catchment
Talo(Tangon)Catchment

Environmental Impact Assessment (EIA) Report of Etalin HE Project
Proponent: M/s Etalin Hydro Electric Power Company Limited (EHEPCL) 6.4
Consultant: RS Envirolink Technologies Pvt. Ltd.
Figure 6.2: Digital Terrain Model (DTM) of the study area generated from ASTER G-DEM data
Talo( )

Environmental Impact Assessment (EIA) Report of Etalin HE Project
Proponent: M/s Etalin Hydro Electric Power Company Limited (EHEPCL) 6.5
Consultant: RS Envirolink Technologies Pvt. Ltd.
Figure 6.3: Slope map of the study area generated from DEM

Environmental Impact Assessment (EIA) Report of Etalin HE Project
Proponent: M/s Etalin Hydro Electric Power Company Limited (EHEPCL) 6.6
Consultant: RS Envirolink Technologies Pvt. Ltd.
6.4.2 Soil Fertility Status
It is very essential to assess the soil quality of the region for proper planning of a project
whether hydroelectric, road, construction and agricultural or afforestation. The soil quality can be
defined as “capacity of a specific kind of soil to function”. It is generally assessed by measuring a
minimum data set of soil properties to evaluate the soil‟s ability to perform basic functions (i.e.
maintaining productivity, regulating and partitioning of water solute flow, filtering and buffering
against pollutants and storing and cycling nutrients). Evaluation of physical and chemical
characteristic is essential for measuring the soil quality of a particular region or area and it has
also been done for the project area of Etalin H.E. Project.
In order to ascertain the fertility status of the soils in the area the soil samples were collected
from different locations in the area in different seasons. The sampling locations, methodology
and the analysis details have already been given in Chapter 3-Methodology. Among the physical
parameters soil texture, bulk density, water holding capacity and conductivity were analyzed
while chemical characteristics included pH, organic matter, phosphate, nitrate, magnesium and
potassium were analysed (Table 6.3). Physico-chemical analysis of soil samples was carried out
at the Hi-Tech Labs Limited (CPCB accredited Lab.), Okhla, New Delhi. The results of soil analysis
are given in Table 6.3 as an average value of three season‟s values of each parameter.
The bulk density of soil varied from 1.27 to 1.45 (gm/cc). Water holding capacity was recorded
highest near the powerhouse area. The soil of the area is typically sandy loam type. Soil of study
area is slightly acidic in nature at most of the sites with pH values ranging from 4.6 to 5.1 (Table
6.3). Organic matter content also is good. The lower pH values and good organic matter is
mainly due to presence of decomposed leaf litter. This kind of soil is generally good for all kinds
of crops especially citrus fruit crops and banana, pineapple, etc. The texture of soil in general is
medium and is predominantly sandy-loamy. Electrical conductivity ranged between 120
mhos/cm and 150 mhos/cm. The concentration main nutrients like Nitrogen and phosphorus in
the soil is indicative of medium soil fertility rating whereas the concentration of potassium is on
the lower side. Exchangeable Sodium Percentage (ESP) is the amount of sodium held in
exchangeable form on the soil‟s cation exchange complex expressed as a percentage of the total
Cation Exchange Capacity (CEC) whereas the Sodium Adsorption Ratio (SAR) is a measure of the
suitability of water for use in agricultural irrigation, as determined by the concentrations of solids
dissolved in the water. It is also a measure of the sodicity of soil, as determined from analysis of
water extracted from the soil. The ESP and SAR values indicate that soils are stable (Table 6.3).
Salinity also is low at all locations.
6.5 AIR ENVIRONMENT
The air pollutants present in atmosphere, in concentrations that disturbs its dynamic equilibrium
and, thereby, affect man and his environment. There are three potential air pollutants; sulphur
oxides (SO2), nitrogen oxides (NOx) and soot/dust technically known as particulate matter
divided into PM10 and PM2.5. In order to evaluate and quantify the ambient air quality monitoring
is carried out during winter, pre-monsoon and monsoon seasons at different locations in the
study area.
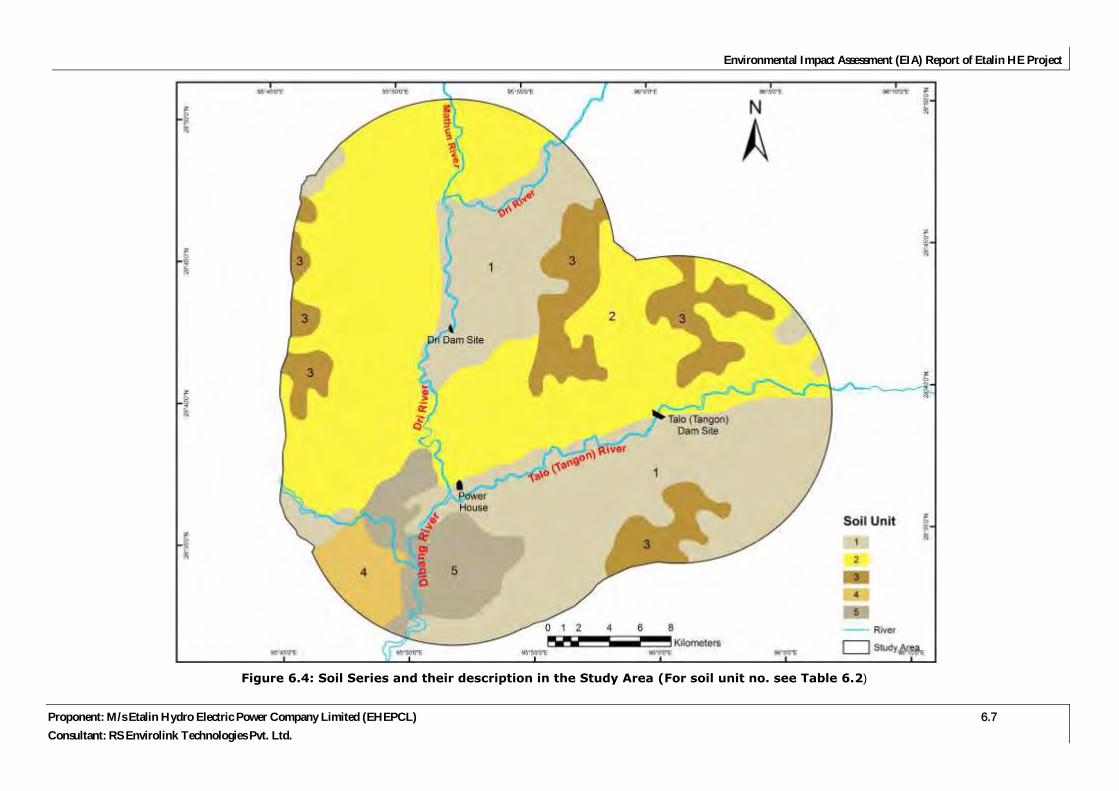
Environmental Impact Assessment (EIA) Report of Etalin HE Project
Proponent: M/s Etalin Hydro Electric Power Company Limited (EHEPCL) 6.7
Consultant: RS Envirolink Technologies Pvt. Ltd.
Figure 6.4: Soil Series and their description in the Study Area (For soil unit no. see Table 6.2)

Environmental Impact Assessment (EIA) Report of Etalin HE Project
Proponent: M/s Etalin Hydro Electric Power Company Limited (EHEPCL) 6.8
Consultant: RS Envirolink Technologies Pvt. Ltd.
Table 6.2: Description and Area under different Soil Classes
Soil Unit
Order Sub-order
Great Groups Sub-Groups Area
(sq km) Area (%)
1 Entisols Orthents Udorthents Loamy-skeletal, Lithic Udorthents Shallow, excessively drained, loamy-skeletal soils on very steeply sloping hill summit having loamy surface with very severe erosion hazard and moderate stoniness Loamy-skeletal, Typic Udorthents Moderately deep, somewhat excessively drained, loamy-skeletal soils on
moderately steeply sloping side slopes with severe erosion hazard and moderate stoniness
309.64 34.15
2 Inceptisols Umbrepts Haplumbrepts Loamy-skeletal, Entic Haplumbrepts
Deep, somewhat excessively drained, loamy-skeletal soils on moderately steeply sloping summits having loamy surface with severe erosion hazard and moderate stoniness: associated with: Sandy-skeletal, Typic Udorthents Moderately shallow, excessively drained, sandy-skeletal soils on steeply sloping summits with very severe erosion hazard and slight stoniness.
421.84 46.53
3 Entisols Orthents Udorthents Loamy-skeletal, Lithic Udorthents Shallow, excessively drained, loamy-skeletal soils on steeply sloping summits having loamy surface with severe erosion hazard and slight stoniness: associated with: Loamy-skeletal, Dystric Eutrochrepts Moderately deep. Somewhat excessively drained, loamy-skeletal soils on moderately steeply sloping side slopes and slight stoniness
21.97 2.42
4 Entisols Orthents Udorthents Loamy-skeletal, Lithic Udorthents Shallow, excessively drained, loamy-skeletal soils on very steeply sloping summits having loamy surface with severe erosion hazard and strong stoniness: associated
with: Sandy-skeletal Typic Udorthents Moderately deep, somewhat excessively drained, sandy-skeletal soils with very
severe erosion hazard and moderate stoniness
55.18 6.09
46 Rocky mountains covered with perpetual snow and glaciers 98.00 10.81
Total 906.61 100.00

Environmental Impact Assessment (EIA) Report of Etalin HE Project
Proponent: M/s Etalin Hydro Electric Power Company Limited (EHEPCL) 6.9
Consultant: RS Envirolink Technologies Pvt. Ltd.
Figure 6.5: Map showing sampling sites for soil sampling, air and noise monitoring stations in the study area

Environmental Impact Assessment (EIA) Report of Etalin HE Project
Proponent: M/s Etalin Hydro Electric Power Company Limited (EHEPCL) 6.10
Consultant: RS Envirolink Technologies Pvt. Ltd.
Table 6.3: Physico-chemical Composition of Soil in the Study Area
S.
No.
Soil
Characteristics
Site S1
Near Dri
dam site
Site S2
Punli village
on Dri limb
Site S3
Near Talo
(Tangon)
dam site
Site S4
Chanli
village on
Talo
(Tangon)
limb
Site S5
Powerhouse
near Etalin
village
A. Physical Characteristics
1 Bulk density
(gm/cc) 1.32 1.35 1.27 1.28 1.21
2 Water holding
capacity (%w/w) 39.30 40.65 42.10 36.70 42.10
3 Porosity, (%w/w) 55.63 41.68 53.62 54.22 44.28
4 Soil texture
Sand (%w/w) 74.22 68.16 65.26 72.1 68.12
Silt (%w/w) 24.64 19.33 22.24 26.1 21.40
Clay (%w/w) 1.14 12.51 12.5 1.8 10.48
5
Electrical
conductivity
(mhos/cm)
140 150 120 130 120
B. Chemical Characteristics
6 pH 4.6 5.0 4.7 5.1 4.8
7 Organic matter
(%w/w) 1.8 1.3 1.2 1.6 1.7
8 Nitrogen as N
(kg/ha) 446.69 651.8 479.30 437.38 357.18
9 Phosphorus as P
(kg/ha) 16.9 12.7 13.1 13.3 12.3
10 Potassium as K
(kg/ha) 97.3 63.8 80.4 93.9 78.3
11 Magnesium as Mg
(mg/kg) 85.47 63.50 44.23 58.90 75.33
12 Chloride as Cl
(mg/kg) 875.91 690.33 655.62 953.72 941.11
13 Sodium as Na
(mg/kg) 32.19 31.61 41.43 54.35 33.22
14 Calcium as Ca
(mg/kg) 931.32 623.27 512.29 642.33 948.75
15 Total alkalinity
(mg/kg) 212.10 41.60 81.22 42.87 211.32
16 Salinity, ppt 1.64 1.32 1.12 1.54 1.38
17
Exchangeable
Sodium
Percentage (ESP)
2.98 4.39 10.39 5.49 3.33
18
Sodium
Adsorption Ratio
(SAR)
1.43 1.71 2.48 2.90 1.47
The sources of air pollution in the study area are vehicular traffic, dust arising from unpaved
village roads and domestic fuel burning. The air environment around project site is free from any
significant pollution source. Air quality monitoring was carried out as per the new air quality
parameters conforming to the National Ambient Air Quality Standards for Industrial Residential,
Rural & Other Areas.
The National Ambient Air Quality Standard notified by MOEF&CC are given in Table 6.4.

Environmental Impact Assessment (EIA) Report of Etalin HE Project
Proponent: M/s Etalin Hydro Electric Power Company Limited (EHEPCL) 6.11
Consultant: RS Envirolink Technologies Pvt. Ltd.
Table 6.4: National Ambient Air Quality Standard by (MOEF&CC)
Pollutant Time Weighted
Average
Concentration in Ambient Air
Industrial Residential, Rural &
Other Areas
Ecologically
Sensitive Area (Notified by
Central Govt.)
Sulphur Dioxide (SO2) µg/m3 Annual 50 20
24 hour 80 80
Nitrogen Oxides (NO)x µg/m3 Annual 40 30
24hour 80 80
Particulate Matter (size less
than 10µm or PM10) µg/m3
Annual 60 60
24 hour 100 100
Particulate Matter (size less
than 2.5µm or PM2.5) µg/m3
Annual 40 40
24hour 60 60
6.5.1 Ambient Air Quality
Map showing sampling locations for air and noise monitoring locations in the study area is given at
Figure 6.5. The SO2 values ranged from 5.6 to 8.9 g/m3 at various stations covered as a part of
the ambient air quality monitoring study. The SO2 levels observed during the study was much
lower than the permissible limit of 50 g/m3 for industrial, residential and rural areas (Table 6.5).
The NOx values ranged from 12.2 to 16.8 g/m3 at various stations covered as a part of the
study. The NOx level observed at various sampling stations was much lower than the permissible
limit of 40 g/m3 for industrial, residential and rural areas.
The maximum PM10 level observed during ambient air quality monitoring conducted was 27.1
g/m3. The PM10 level at various stations covered during ambient air monitoring was below the
permissible limit (60 µg/m3) specified for industrial, residential, rural and other areas (Table 6.5).
The maximum PM2.5 level observed during ambient air quality monitoring conducted was 12.9
g/m3. The PM2.5 level at various stations covered during ambient air quality monitoring was
below the permissible limit (40 µg/m3) specified for industrial, residential, rural and other areas
(Table 6.5).
Table 6.5: Air Quality Monitoring of the Study Area (unit: µg/m3)
S. No. Monitoring
location SO2 NOx PM10 PM2.5
1 Dam Site Dri River
W 6.2 13.8 22.1 9.8
PM 7.4 15.6 24.7 11.8
M 5.8 12.5 19.9 9.3
2 Punli Village on
Dri Limb
W 6.8 14.2 23.2 10.5
PM 7.8 16.3 25.6 11.2
M 6.1 12.7 21.2 9.8

Environmental Impact Assessment (EIA) Report of Etalin HE Project
Proponent: M/s Etalin Hydro Electric Power Company Limited (EHEPCL) 6.12
Consultant: RS Envirolink Technologies Pvt. Ltd.
S. No. Monitoring
location SO2 NOx PM10 PM2.5
3 Dam Site Talo
(Tangon) River
W 6.3 12.4 23.6 11.6
PM 6.9 13.2 26.7 12.9
M 5.6 12.2 21.7 10.6
4 Avonli village
W 6.8 14.7 24.2 12.6
PM 8.1 16.8 26.2 12.9
M 6.5 13.4 21.9 10.2
5
Punli Village on
Talo (Tangon)
Limb
W 7.1 14.3 22.6 10.7
PM 8.6 15.9 24.7 12.6
M 6.5 13.2 23.2 9.8
6 Etalin Village
W 7.9 14.9 24.3 11.2
PM 8.9 16.2 26.2 11.7
M 6.4 14.1 22.1 10.4
7 Power house Area
W 6.3 12.8 24.6 11.2
PM 7.4 13.2 26.0 12.5
M 6.0 12.5 23.1 9.2
8 Near Etalin School
W 7.2 13.2 25.8 10.6
PM 8.5 13.9 27.1 12.5
M 6.7 12.9 23.7 10
* W = Winter, S = Summer, PM = Pre-Monsoon
6.6 NOISE & TRAFFIC
6.6.1 Noise Level
Unwanted sound that is loud and unpleasant or unexpected termed as noise pollution. It has
adverse impact on the daily activities of the human being and animals. The adverse impact of the
noise on human and animals also depends upon time, season and the quality of sound. Noise
levels were monitored during the studies at various locations in the Direct Impact Area of the
project. The Ambient noise standards and results of noise level monitoring in terms of equivalent
sound levels are given in Tables 6.6 and 6.7, respectively. The sound levels on an average
ranged from 55.9 to 61.8 dB(A) (day time observations (see Table 6.7).
Table 6.6: Ambient Noise Standards
Area Code Category of Area Limits in dB(A)Leq
Day time Night time
A. Industrial Area 75 70
B. Commercial Area 65 55
C. Residential Area 55 45
D. Silence Zone 50 40
Note :
1 Day time 6 AM and 9 PM
2 Night time is 9 P. and 6 AM
3 Silence zone is defined as areas up to 100 meters around such premises as hospitals, educational
institutions and courts. The silence zones are to be declared by competent authority. Use of
vehicular horns, loudspeakers and bursting of crackers shall be banned in these zones.
4 Environment (Protection) Third Amendment Rules, 2000 Gazette notification, Government of India,
dt. 14.2.2000

Environmental Impact Assessment (EIA) Report of Etalin HE Project
Proponent: M/s Etalin Hydro Electric Power Company Limited (EHEPCL) 6.13
Consultant: RS Envirolink Technologies Pvt. Ltd.
Table 6.7: Equivalent Noise levels in study area during day time [dB(A)]
S.
No. Monitoring location Winter Pre-Monsoon Monsoon
Leq dB(A) Leq dB(A) Leq dB(A)
1 Dam Site on Dri River 59.6 60.2 61.8
2 Punli Village on Dri Limb 58.9 56.4 57.2
3 Dam Site on Talo (Tangon) River
58.5 58.6 59.5
4 Avonli village 57.0 56.4 55.9
5 Punli Village on Talo (Tangon)
Limb 58.6 58.2 57.3
6 Etalin Village 59.7 59.6 60.2
7 Power house Area 59.9 59.6 60.0
8 Near Etalin School 60.9 60.5 60.8
6.6.2 Traffic Density
Traffic density data was recorded by physically counting the number of different types of vehicles
passing through a particular point in a fixed time interval. Some major villages along the road were
considered as nodes for monitoring movement of traffic. Traffic density was recorded maximum at
Etalin village. The traffic density recorded at different sites is presented in Table 6.8.
Table 6.8: Traffic density (per hr) in the study area
Sl.
No. Monitoring location
Winter Summer Monsoon
HV LV TW HV LV TW HV LV TW
1 Dam Site Dri River 1 4 8 2 5 3 1 4 5
2 Punli Village on Dri Limb 2 6 10 2 4 8 2 5 2
3 Dam Site Talo (Tangon) River 1 6 14 1 3 7 2 5 8
4 Avonli village 3 8 11 1 3 7 2 6 6
5 Punli Village on Talo (Tangon)
Limb 4 5 17 2 4 5
3 6 5
6 Etalin Village 8 10 22 6 12 18 9 9 14
7 Power house Area 1 8 15 3 10 12 3 9 10
8 Near Etalin School 2 9 18 5 8 11 4 10 14
HV= Heavy Vehicle; LV= Light Vehicle; TW= Two Wheelers

Environmental Impact Assessment (EIA) Report of Etalin HE Project
Proponent: M/s Etalin Hydro Electric Power Company Limited (EHEPCL) 7.1
Consultant: RS Envirolink Technologies Pvt. Ltd.
7.1 INTRODUCTION
The project area is comprised of Mishmi Hills. Bio-geographically Mishmi Hills are situated in the
Eastern Himalayan province (Eastern Himalaya - Province 2D; Rodgers and Panwar‟s (1988)),
and is the richest bio-geographical province of the Himalayan zone and one of the Mega bio-
diversity hotspots of the world. It is a complex hill system of varying elevations and receives
heavy rainfall, which can be as much as 4,500-5,000mm annually in the foothill areas. The pre-
monsoon showers start from March and the monsoon remains active till October. The humidity in
the rainy season is often over 90%. This diversity of topographical and climatic conditions has
favoured the growth of luxuriant forests which are home to myriad plant and animal species.
Vast diversity of species can be attributed to the location which is at the junction of the
Paleoarctic, Indo-Chinese, and Indo-Malayan bio-geographic regions, Biotic elements from all
these regions occur in this area making it very rich in floral and faunal resources.
The Environmental Baseline chapter provides details of data compiled from primary as well as
secondary sources on terrestrial biodiversity. The primary data was collected during different
season‟s i.e. winter/lean season, Summer/pre-monsoon and monsoon in the project study area
as specified in the approved Terms of Reference by MoEF&CC, Government of India. The primary
data was supplemented by data collected from secondary sources like published reports,
research articles, etc. The details of collection of both primary and secondary data for pertinent
environmental components have been given in Chapter-3 of the EIA report.
7.2 LAND USE/ LAND COVER
The land use/ land cover pattern within 10 km radius of proposed dam sites and powerhouse site
was interpreted from LANDSAT satellite data of Path/Row 135/40 of October 2008. The False
Color Composite (FCC) of the study area is given in Figure 7.1 and the classified land use/ land
cover map interpreted from the same is given at Figure 7.2. Almost 90% of the area is covered
with dense vegetation with barren land/ jhum cultivation as second predominant land use in the
area (Table 7.1).
Table 7.1: Area under different land use/ land cover categories in the study area
S.No. Land Use/ Land Cover Area (sq km) Area (%)
1 Dense Forest 772.21 85.15
2 Open Forest 34.98 3.86
3 Barren Land/Jhum Cultivation 95.62 10.54
4 Settlement 0.55 0.06
5 Snow 0.02 0.00
6 Water Body 3.49 0.39
Total 906.88 100.00
Chapter ENVIRONMENTAL BASELINE STATUS: BIOLOGICAL
RESOURCES 7

Environmental Impact Assessment (EIA) Report of Etalin HE Project
Proponent: M/s Etalin Hydro Electric Power Company Limited (EHEPCL) 7.2
Consultant: RS Envirolink Technologies Pvt. Ltd.
Figure 7.1: FCC generated from satellite data showing study area

Environmental Impact Assessment (EIA) Report of Etalin HE Project
Proponent: M/s Etalin Hydro Electric Power Company Limited (EHEPCL) 7.3
Consultant: RS Envirolink Technologies Pvt. Ltd.
Figure 7.2: Land Use/ Land Cover Map of the project Study Area

Environmental Impact Assessment (EIA) Report of Etalin HE Project
Proponent: M/s Etalin Hydro Electric Power Company Limited (EHEPCL) 7.4
Consultant: RS Envirolink Technologies Pvt. Ltd.
7.3 FOREST TYPES
Dibang Valley District is almost entirely hilly and covered mostly by forests which are almost
52% of the total geographical area of the valley. Champion and Seth (1968); Rao and Panigrahi
(1961); Sahni (1981); Rao & Hajra (1986), Kaul & Haridasan (1987) are the prominent workers
who studied forest and vegetation of the region. The Dri and Talo (Tangon) valleys are
characterized by the Tropical evergreen, Tropical semi-evergreen, Sub-tropical forests at lower
elevations and Pine, Temperate Broadleaved, Temperate Conifer and Alpine forests at higher
elevations. The forest types of the study area have been described as per the Revised Survey of
Forest Types of India by Champion & Seth (1968).
7.3.1 Tropical Vegetation
This type of vegetation is spread over the foothill areas and outer valleys in all over the study
area and represents maximum species diversity. It is further divided into two types:
Tropical evergreen forests, and,
Tropical semi-evergreen forests
7.3.1.1 Upper Assam Valley Tropical Evergreen Forest (Tropical Evergreen
Forest) (1B/C2)
The species composition is classified into top storey representing tall trees like Altingia excelsa,
Castanopsis indica, Duabanga grandiflora, Terminalia myriocarpa, etc. Trees are heavily
plastered with lichens and festooned with climbers and epiphytes of the numerous lianas like
Pericamphylus glaucus, Stephania elegans, Parabaena sagitata, and species of Bauhinia, Derris,
Entada, Gnetum, Hodgsonia, Piper, Raphidophora, etc. The second storey mainly consists of
medium to small trees and shrubs, viz., Actiphila excelsa, Ardisia crispa, Bauhinia pupurea,
Grewia disperma, Gynocardia odorata, Leea robusta, Michelia doltsopa, and Mussaenda
roxburghii. Salacca secunda and Wallichia densiflora are found on the drier hill slopes, whereas
Angiopteris evecta, Cyathea spinulosa, and Pandanus nepalensis are found along the shaded
gorges. Calamus erectus, Calamus leptospadix and various other species of similar plants occur
along the swampy areas and form extensive thickets. Arenga pinnata, Caryota obtusa, Livistona
jenkinsiana, and Phoenix rupicola are the palms that occur in these forests. The epiphytic flora is
very rich, some of the common epiphytes are the species of Aerides, Cymbidium, Eria, and
Pholidota.
Along the hills slopes wild species of Musa comprising Musa acuminata, M. balbisiana and M.
rosacea is prominent feature of the vegetation.
7.3.1.2 Eastern sub-montane Semi-evergreen Forest (Tropical Semi-
evergreen forest) – (2B/C1b)
These types of forests occur on slopes in the vicinity of dam as well as powerhouse area and also
on foothills and river bank. The upper storey consists of deciduous trees as well as evergreen
trees. The shrubs, climbers and lianas constitute the rest. Depending on its species contents
Tropical Semi-evergreen forests are further divided into two subtypes.
i) Low hills and plains semievergreen forest
In this forest the upper storey is dominated by tall trees like Altingia excelsa, Bombax ceiba,
Canarium strictum, Elaeocarpus rugosus, Phoebe lanceolata, and Terminalia myriocarpa followed
by small trees and shrubs. The ground flora is dominated by species of Colocacia, Costus, and

Environmental Impact Assessment (EIA) Report of Etalin HE Project
Proponent: M/s Etalin Hydro Electric Power Company Limited (EHEPCL) 7.5
Consultant: RS Envirolink Technologies Pvt. Ltd.
Phrynium. Among the climbers and lianas Disocorea alata, Thunbergia coccinia, and T.
grandiflora are common. There are number of epiphytic species of orchids like Dendrobium,
Pholidota, Eria, and Hoya balaensis and several species of ferns in these forests.
ii) Riverine semi-evergreen forest
The top storey is dominated by Bombax ceiba, Bischofia javanica, Canarium strictum, Dalbergia
sissoo, Duabanga grandiflora, and Lagerstroemia parviflora. The next storey is represented by
the species of Calamus, Ficus, Meliosma, Murraya, and Randia. These species are closely
associated with dense clump of species of Phragmitis, Saccharum, Hedychium.
7.3.2 East Himalayan moist mixed deciduous forests (Sub tropical
Broadleaved Forests) – (3/C3b)
The subtropical broadleaved forests occur between 900 and 1200 m and are basically are of
evergreen and dense in nature. The canopy layer consists of Castanopsis indica, Quercus spicata,
Q. lemellosa, Alnus nepalensis, Ulmus lancifolia, Engelhardtia spicata, and Schima khasiana. The
middle storey is comprised mainly of Schefflera, Turpinia, Rhus, Hydrangea sp., Vernonia
arborea, Eurya acuminata, Symplocos racemosa, and Viburnum foetidum. Shrub and herb layers
include number of species of Ardisia humilis, Oxyspora paniculata, Chasalia curviflora, Rubus
ellipticus, Lobelia rhynchopetalum, Begonia palmata and Potentilla nepalensis. Lianas are not
very frequent but climbers are represented by Clematis gauriana, Senecio densiflorus, Crawfordia
speciosa, Jasminum officinale and Holboelia latifolia. Epiphytes are found growing luxuriantly and
comprised mainly of orchids and ferns.
7.3.3 Assam Sub-tropical Pine Forests – (9/C2)
These forests occur between 1200 and 1800 m, the Pine forest is common in catchment area of
Dri and Talo (Tangon) Rivers. The dominant species is Pinus merkusii. There is no middle storey.
However, the shrub and herb layer is gregarious. The main species in this layer is Imperata
cylindrica, Rubus ellipticus, Artemisia nilagirica, Pteridium aquilinum, Polygonum amplexicaule,
Osbeckia stellata, and Desmodium laxiflorum. A few broad-leaved species found associated are
Lyonia ovalifoila, Rhododendron arboreum, Quercus lemellosa, Rhus javanica, and Albizia mollis.
7.3.4 East Himalayan Wet Temperate Forests (Temperate Broadleaved
Forests) – (11B/C1)
They are found in elevation of 1800 – 2800 m and are generally dense in nature. These forests
are dominated by members of Fagaceae and Lauraceae families. Canopy trees are represented
by Qurecus lamellosa, Michelia doltstopa, Acer laevigatum, Populus ciliata, Exbucklandia
populnea, Carpinus viminea, Rhododendron spp., Tetracentron sinensis, Magnolia campbellii, and
Amentotaxus assamica. Middle canopy is composed of Lyonia ovalifolia, Vaccinium donianum,
Corylopsis himalayana, Rhododendron arboreum, Myrsine semiserrata, Spiraea callosa, Berberis
wallichii, and Mahonia nepalensis. Herbaceous layer is usually gregarious and abundant. The
shrub layer is represented by Potentilla polyphylla, Fragaria nubicola, Sedum spp., Desmodium
caudatum, and Rubus ellipticus. Herbs are comprised of Anaphalis busua, Daphne papyracea,
and Ranunculus sceleratus. Epiphytes are represented by Vaccinium chaetothrix, Aeschynanthus
bracteatus, Hoya parasitica. Lichens and ferns are few. These types of forests occur over
Mithumna-Mailang ridge, Chaglagam area and Malinja-Simbi area.

Environmental Impact Assessment (EIA) Report of Etalin HE Project
Proponent: M/s Etalin Hydro Electric Power Company Limited (EHEPCL) 7.6
Consultant: RS Envirolink Technologies Pvt. Ltd.
7.3.5 East Himalayan Mixed Coniferous Forest (Temperate Conifer
Forests) – (12/C3a)
These forests are seen above the elevation of temperate broadleaved forests. Among the conifers
Abies densa, A. spectabilis are more extensive than other species. The shrubs are represented by
different species of Berberis, Viburnum, Lonicera, Gaultheria, Rosa, Rubus, and Hydrangea. The
herb layer consists of species of Anaphalis, Hypericum, Podophyllum, Primula, Polygonum,
Rumex, Rheum, Pilea, Potentilla, Plectranthus, and Ranunculus. Climbers are scanty and
epiphytic flora is comprised of lichens.
7.3.6 Alpine Pastures (Alpine Forests) – 15/C3)
These forests occupy the highest altitude, 3500 - 5500m and lack tree cover. The main feature
here is that the area is under snow cover for a longer period resulting in a very brief growing
season. Even the occasional trees seen here are stunted in growth and are bushy or crooked in
appearance. They include Rhododendron spp., Juniperus spp., Betula alnoides, and Acer
oblongum. The shrubs include Berberis wallichiana, Rubus niveus, and Lonicera angustifolia. The
herbs include various species of Pedicularis, Rheum, Rumex, Polygonum, Anaphalis,
Cypripedium, Hypericum, Ranunculus, Sedum, Saxifraga, Delphinium, and Selinum.
7.3.7 Secondary Forests (1B/2S)
The primary forest due to impact of various adverse biotic and abiotic factors like shifting
cultivation or “Jhumming”, development activities and urbanization, landslides, fires, etc., are
destroyed and develop into secondary forests. The secondary forests divided into the three
following types.
7.3.7.1 Degraded Forests
As compared to the original primary forest these degraded ones have very low species diversity
and generally dominated by shrubs and small trees. Among the predominant trees are the
species of Bauhinia, Callicarpa, Glochidium and Mallotus whereas species of Capparis,
Clerodendrum, Eurya and Randia are the commonly occurring shrubs along with species of weeds
like Ageratum, Eupatorium, and Mikania.
7.3.7.2 Bamboo and Musa Forests
This type of secondary forests mostly occurs in the areas which are abandoned after “jhum”
cultivation. The common bamboo species are Arundina graminifolia, Bambusa pallida, B. tulda,
Chimonobambusa callosa, Dendrocalamus hamiltonia, D. hookeri and D. strictus. Musa
comprising Musa acuminata, M. balbisiana and M. rosacea are commonly found.
7.3.7.3 Grasslands
Generally formed due to practice of “jhum” cultivation or sometimes due to fires or over-grazing
and also on sun facing slopes on the hill tops. The more common species of grasses are
Arundinella bengalensis, Chrysopogon aciculatus, Imperata cylindrica, Saccharum spontaneum,
Themeda villosa, Thysanolaena maxima with sedges like Cyperus brevifolius, and Fimbristylis
bisumbellata.

Environmental Impact Assessment (EIA) Report of Etalin HE Project
Proponent: M/s Etalin Hydro Electric Power Company Limited (EHEPCL) 7.7
Consultant: RS Envirolink Technologies Pvt. Ltd.
7.4 FLORISTICS
7.4.1 Objectives
The main objectives of the floristic studies are as follows:
To prepare inventory of plants belonging to different groups like Angiosperms,
Gymnosperms, Pteridophytes, Bryophytes, Lichens and macro-fungi occurring in the
study area
To assess the vegetation community structure in the study area
To identify the dominant plant species occurring in the study are by calculating
Importance Value Index
To assess the Diversity of different tree, shrubs and herbaceous species by calculating
the Shannon Wiener Diversity
The study area comprised of power house, dam site, submergence area and area within 10 km
radius of dam site and power house site as per the TOR approved by MoEF&CC, GOI. As already
described in the Methodology Chapter quadrat sampling was undertaken at 8 different locations for
carrying out phytosociological surveys of the vegetation and in addition an inventory of various
floristic elements was also prepared by walking different transects around these sampling sites.
In order to understand the composition of the vegetation, most of the plant species could be
identified in the field itself whereas in case of the species that could not be identified a herbarium
specimen of some flowers were collected without uprooting the plant itself and in addition their
photographs were also taken for identification later with the help of available published literature
and floras of the region.
7.4.2 Taxonomic Diversity
During the field surveys and also based upon secondary data and available information an
inventory of 447 plant species in the study area has been prepared and list of the same is given
at Annexure-VI. The number of plant species recorded in various taxonomic groups is:
Angiosperms - 370, Gymnosperms - 7, Pteridophytes - 29, Bryophytes - 11, Lichens - 14, Algae
– 10 and Macro-Fungi- 6.
A brief description of each group is given in the following paragraphs.
a) Angiosperms
In all total 370 species of angiosperms were recorded. These include 95 trees, 77 shrubs and 198
herbaceous species.
These angiosperm species belong to 102 families of which Asteraceae and Orchidaceae with 26
species each are largest families followed by Poaceae with 21 species and Araceae with 14
species. The dominance of Asteraceae and Poaceae families is the indicator of open and grass
covered slopes in the study area mainly due to jhum cultivation which is prevalent in the area.
However, in the project study area there are patches of primary undisturbed forests which are
mainly seen higher on the slopes and away from the settlements. The vegetation of these areas
is comprised of species such as Altingia excelsa, Canarium strictum, Duabanga grandiflora, Ficus
spp., Terminalia myriocarpa, Lagerstroemia minuticarpa, and Pterospermum acerifolium. The
shrub layer is comprised of species like Acacia pennata, Acacia pruinescens, Boehmeria longifolia,

Environmental Impact Assessment (EIA) Report of Etalin HE Project
Proponent: M/s Etalin Hydro Electric Power Company Limited (EHEPCL) 7.8
Consultant: RS Envirolink Technologies Pvt. Ltd.
Boehmeria macrophylla, Calamus erectus, Calamus leptospadix, Clerodendrumcoolebrookianum,
Debregeasia longifolia and Desmodium laxiflorum.
b) Gymnospersms
This group is represented by 7 species of which Pinus merkusii is the most commonly occurring
species in the study area.
c) Pteridophytes
The study area was found to be rich in distribution of Pteridophytes. This group is represented by
29 species belonging to 15 families with Polypodiaceae being the largest family, represented by 9
species. List of all the pteridophytes is given at Annexure-VI.
d) Lichens
14 lichen species were found in the study area belonging to 13 families. Usnea baileyi and
Parmelia wallichiana were the most frequently occurring species found hanging from the trees.
List of lichen species recorded from the study is given at Annexure-VI.
e) Bryophytes
In the study area eleven species of bryophytes were recorded. These belong to 8 families and of
them Marchantia palmata, M. polymorpha, Polytrichum commune and Funaria hygrometrica were
commonly found. Detailed list is given at Annexure-VI.
f) Macro-fungi
From the study area 6 species of macro-fungi could be recorded during the surveys. Their list is
given at Annexure-VI.
7.4.3 Community Structure
Community structure of the vegetation was assessed by quadrat sampling method described in
Chapter on Methodolgy to evaluate various quantitive parameters at different sampling sites
during three seasons and location of the sites is given at Figure 7.3.
The description of vegetation structure at different sampling locations is given in the following
paragraphs
7.4.3.1 Catchment of Dri River (V1)
The site V1 is comprised upstream catchment area of Dri River on Dri dam limb and is located
near Makuni village before the confluence of Mathun river with Dri. The area is predominantly
covered with Sub-tropical and Pine forest at lower slopes while slopes at higher elevations are
covered with Temperate broadleaved and Temperate conifer forests.
The tree layer at this site is represented by 13 species. Among them Pinus merkusii is dominant
tree at higher elevations with highest density of 57 trees/ha (Table 7.2) and highest basal
cover. Albizia procera, Ficus semicordata, and Castanopsis indica are prominant along the river
banks and shaded places with high density and basal cover.
The shrub layer is comprised of 13 species and is dominated by the species of bamboo and
grasses such as Bambusa pallida, Dendrocalamus giganteus, Dendrocalamus hamiltonii,
Arundinaria falcata, Phragmites karka and Saccharum spontaneum with other species like
Oxyspora paniculata and Rhus wallichi (Table 7.2).
The herb layer was represented by 15 species during winter, 29 species in summer and 25 in
monsoon season (Table 7.3). Poa annua, Begonia palmata, Nephrolephis cordifolia,

Environmental Impact Assessment (EIA) Report of Etalin HE Project
Proponent: M/s Etalin Hydro Electric Power Company Limited (EHEPCL) 7.9
Consultant: RS Envirolink Technologies Pvt. Ltd.
Thysanolaena maxima, Arisaema concinnum, and Hedychium spicatum were recorded during
winter season. During summer season Thysanolaena maxima, Fragaria indica, Urtica dioica,
Fagopyrum dibotrys, Arundina graminifolia, Pouzolzia fulgens, Pilea scripta, Equisetum
ramosissimum, and Themeda anthera are the common herbs in the catchment area of Dri River.
In addition, fern species like Pteridium, Pteris, Angiopteris, Adiantum are also found at this site.
Table 7.2: Community structure –Site: V1 (Trees & Shrubs)
S. No.
Name of Species Density (no./ ha)
Frequency (%)
Basal Cover (sq m /ha)
TREES
1 Albizia procera 36 28.57 304.78
2 Alnus nepalensis 43 14.29 18.87
3 Aralia armata 36 21.43 153.70
4 Brassiopsis glomerulata 29 28.57 10.52
5 Castanopsis indica 57 28.57 65.97
6 Cyathea spinulosa 21 21.43 13.10
7 Engelhardtia spicata 14 14.29 64.75
8 Ficus semicordata 50 28.57 347.24
9 Macaranga denticulata 21 14.29 43.44
10 Macropanax dispermus 7 7.14 4.72
11 Pinus merkusii 57 28.57 366.90
12 Terminalia chebula 14 14.29 45.05
13 Toona hexandra 7 7.14 6.97
Total 393
1446
SHRUBS
1 Acacia pennata 80 10 0.32
2 Arundinaria falcata 240 15 0.43
3 Bambusa pallida 560 20 37.92
4 Dendrocalamus giganteus 280 20 66.66
5 Dendrocalamus hamiltonii 200 15 17.13
6 Oxyspora paniculata 360 10 0.28
7 Phragmites karka 420 25 0.40
8 Rhus wallichi 160 20 0.16
9 Rubus ellipticus 120 15 0.09
10 Rubus foliolosus 80 15 0.11
11 Saccharum spontaneum 240 25 0.35
12 Schizostachyum polymorphum 100 20 0.09
13 Solanum ciliatum 100 10 0.05
Total 2940

Environmental Impact Assessment (EIA) Report of Etalin HE Project
Proponent: M/s Etalin Hydro Electric Power Company Limited (EHEPCL) 7.10
Consultant: RS Envirolink Technologies Pvt. Ltd.
Figure 7.3: Location of terrestrial biodiversity sampling sites in the study area

Environmental Impact Assessment (EIA) Report of Etalin HE Project
Proponent: M/s Etalin Hydro Electric Power Company Limited (EHEPCL) 7.11
Consultant: RS Envirolink Technologies Pvt. Ltd.
Table 7.3: Community structure –Site: V1 (Herbs)
S. No. Name of Species Density
(no./ ha)
Frequency
(%)
Winter
1 Anaphalis contorta 8000 20
2 Adiantum philippense 6667 13
3 Alpinia allughas 5333 20
4 Arisaema concinnum 10667 27
5 Aster himalaicus 3333 13
6 Begonia palmata 12000 27
7 Dryoathyrium boryanum 7333 20
8 Fagopyrum dibotrys 3333 13
9 Fragaria indica 4000 13
10 Hedychium spicatum 10000 20
11 Nephrolephis cordifolia 10667 20
12 Poa annua 14667 27
13 Pteridium aquilinum 5333 13
14 Pteris vittata 8000 20
15 Thysanolaena maxima 10667 27
Summer
1 Ageratum conyzoides 3077 7.69
2 Alpinia allughas 1923 7.69
3 Amaranthus hybridus 3846 11.54
4 Anaphalis busua 4615 11.54
5 Anaphalis contorta 3077 7.69
6 Artemisia maritima 1538 11.54
7 Arundina graminifolia 6923 11.54
8 Aster himalaicus 1923 7.69
9 Bidens pilosa 4231 15.38
10 Cyperus rotundus 5769 19.23
11 Dicranopteris linearis 3846 15.38
12 Elsholtzia ciliata 4231 15.38
13 Equisetum ramosissimum 5385 19.23
14 Fagopyrum dibotrys 8077 15.38
15 Fragaria indica 10385 19.23
16 Gnaphalium affine 1923 7.69
17 Lycopodium clavatum 3077 11.54
18 Oxalis corniculata 5385 7.69
19 Pilea scripta 6538 15.38
20 Poa annua 3846 11.54
21 Pouzolzia fulgens 6154 19.23
22 Ranunculus sikkimensis 3077 11.54
23 Rhynchostylis retusa 769 7.69
24 Selaginella bryopteris 4615 15.38
25 Spilanthes oleracea 3077 11.54
26 Tagetes minuta 3846 19.23
27 Themeda anathera 5000 15.38
28 Thysanolaena maxima 10769 15.38

Environmental Impact Assessment (EIA) Report of Etalin HE Project
Proponent: M/s Etalin Hydro Electric Power Company Limited (EHEPCL) 7.12
Consultant: RS Envirolink Technologies Pvt. Ltd.
S. No. Name of Species Density
(no./ ha) Frequency
(%)
29 Urtica dioica 8462 19.23
Monsoon
1 Ageratum conyzoides 10000 23.81
2 Anaphalis contorta 2381 14.29
3 Artemisia maritima 7143 23.81
4 Arundina graminifolia 10476 19.05
5 Chirita bifolia 8571 23.81
6 Commelina benghlensis 4286 14.29
7 Cynodon dactylon 7143 9.52
8 Cyperus rotundus 8571 14.29
9 Dicranopteris linearis 2857 4.76
10 Dryoathyrium boryanum 3333 14.29
11 Fragaria indica 5714 14.29
12 Impatiens acuminata 8095 19.05
13 Leucas ciliata 4762 9.52
14 Microsorum punctatum 5238 19.05
15 Persicaria chinensis 6667 19.05
16 Pilea scripta 7619 14.29
17 Plantago erosa 3810 4.76
18 Poa annua 7619 9.52
19 Pratia nummularia 10000 19.05
20 Pteridium aquilinum 2381 9.52
21 Selaginella bryopteris 5238 9.52
22 Solanum indicum 2857 14.29
23 Spilanthes paniculata 5714 14.29
24 Strobilanthes rhombifolius 4762 19.05
25 Thysanolaena maxima 9048 14.29
7.4.3.2 Dam Site Dri River (V2)
This sampling site is located in the vicinity of Dri Dam site and is comprised of Sub-tropical
forest.
At this site 17 species of trees were recorded (Table 7.4). Most dominant and frequent trees
are Castanopsis indica, Albizia lucida, Ficus semicordata, Macropanax dispermus, Saurauia
roxburghii, and Albizia procera.
Bambusa tulda, Bambusa pallida and Dendrocalamus giganteus have highest density at this
site found mostly in the clumps as seen from their basal cover (Table 7.4). Other dominant
shrub species are Oxyspora paniculata, Phragmites karka, Piper clarkei, and Saccharum
spontaneum. In winter ground layer is most prominent in this area and represented by 27
species, summer season comprised with 34 and in monsoon 29 species of herbs were
reported from the area.
Among the herbs Ageratum conyzoides, Alpinia allughas and Lepisorus sordidus were the
most adundant species during winters (Table 7.5). Elatostema sessile, Begonia palmata,
Thysanolaena maxima, Pilea scripta, and Polygonum capitatum were dominant during pre-

Environmental Impact Assessment (EIA) Report of Etalin HE Project
Proponent: M/s Etalin Hydro Electric Power Company Limited (EHEPCL) 7.13
Consultant: RS Envirolink Technologies Pvt. Ltd.
monsoon surveys while Cyperus rotundus, Cynodon dactylon and Arundina graminifolia were
the dominant herbs during monsoon.
Table 7.4: Community structure –Site: V2 (Trees & Shrubs)
S.
No. Name of Species
Density
(no./ ha)
Frequency
(%)
Basal Cover
(sq m /ha)
Trees
1 Ailanthus integrifolia 29 21.43 140.18
2 Albizia lucida 43 21.43 380.31
3 Albizia procera 36 28.57 61.16
4 Aralia armata 36 21.43 93.61
5 Brassiopsis glomerulata 21 14.29 42.55
6 Caryota urens 14 14.29 26.45
7 Castanopsis indica 50 28.57 32.76
8 Cyathea spinulosa 21 14.29 4.05
9 Engelhardtia spicata 36 28.57 109.72
10 Ficus semicordata 43 28.57 195.69
11 Lagerstroemia parviflora 21 21.43 42.55
12 Macaranga denticulata 29 21.43 63.54
13 Macropanax dispermus 43 28.57 94.49
14 Pandanus odoratissma 36 21.43 7.62
15 Saurauia roxburghii 43 28.57 77.72
16 Terminalia chebula 21 21.43 151.47
17 Terminalia myriocarpa 29 21.43 155.77
Total 550
1680
Shrubs
1 Acacia pennata 40 10 2.29
2 Agapetes forrestii 60 10 1.53
3 Angiopteris evecta 100 15 0.32
4 Bambusa pallida 360 10 47.12
5 Bambusa tulda 580 20 74.06
6 Costus speciosus 80 10 0.28
7 Dendrocalamus giganteus 240 10 75.37
8 Ficus heterophylla 100 15 7.50
9 Jasminum amplexicaule 140 15 1.86
10 Luculia pinceana 40 5 0.50
11 Musa acuminata 160 15 9.79
12 Musa balbisiana 120 10 7.78
13 Oxyspora paniculata 440 20 0.92
14 Phragmites karka 360 20 1.53
15 Piper clarkei 340 25 0.46
16 Rhaphidophora decursiva 80 10 0.37
17 Hydrangea serrata 100 10 0.48
18 Rubus ellipticus 160 15 0.74
19 Saccharum spontaneum 260 20 1.12
20 Trevesia palmata 100 20 3.58
21 Myrsine semiserrata 80 10 0.54
Total 3940
238.15

Environmental Impact Assessment (EIA) Report of Etalin HE Project
Proponent: M/s Etalin Hydro Electric Power Company Limited (EHEPCL) 7.14
Consultant: RS Envirolink Technologies Pvt. Ltd.
Table 7.5: Community structure –Site: V2 (Herbs)
S. No. Name of Species Density
(no./ ha)
Frequency
(%)
Winter
1 Achyranthes bidentata 3333 13
2 Adiantum philippense 6250 8
3 Ageratum conyzoides 8333 17
4 Alocasia fallax 2083 8
5 Alpinia allughas 7083 13
6 Anaphalis contorta 2500 8
7 Arundina graminifolia 1667 4
8 Begonia nepalensis 6250 17
9 Bidens pilosa 4583 13
10 Carex longipes 2500 8
11 Commelina appeniculata 1250 4
12 Cynodon dactylon 2083 8
13 Cyperus rotundus 2917 8
14 Elatostema sessile 5833 13
15 Fagopyrum dibotrys 3333 8
16 Hedychium spicatum 6250 13
17 Impatiens racemosa 1667 4
18 Lepisorus exavata 5000 4
19 Lepisorus sordidus 7083 8
20 Pilea scripta 2500 8
21 Polygonum flaccidum 4167 17
22 Polystichum aculeatum 2083 8
23 Pteridium aquilinum 3333 13
24 Pteris quadriaurita 2500 13
25 Thysanolaena maxima 5000 17
26 Urena lobata 1667 8
27 Urtica dioica 2917 13
Summer
1 Adiantum caudatum 4800 12.00
2 Alpinia allughas 3600 16.00
3 Angiopteris evecta 3200 8.00
4 Artemisia maritima 800 4.00
5 Arundina graminifolia 1600 4.00
6 Begonia nepalensis 6000 16.00
7 Begonia palmata 11200 32.00
8 Bidens pilosa 8400 20.00
9 Cardamine hirsuta 4800 12.00
10 Colocasia forniculata 2400 16.00
11 Commelina appeniculata 1600 8.00
12 Dicranopteris linearis 3200 8.00
13 Elatostema sessile 12800 28.00
14 Elsholtzia ciliata 6800 12.00
15 Equisetum ramosissimum 5600 16.00
16 Fagopyrum dibotrys 7200 12.00
17 Fragaria indica 8000 20.00
18 Hedychium spicatum 4800 16.00
19 Impatiens bicornuta 2000 12.00
20 Justicia parviflora 2800 12.00
21 Lycopodium clavatum 1600 8.00
22 Oxalis corniculata 4000 8.00
23 Pilea scripta 10000 16.00
24 Plantago erosa 8800 24.00
25 Polygonum capitatum 11200 16.00
26 Pouzolzia glaberrima 4000 12.00
27 Selaginella bryopteris 2000 8.00

Environmental Impact Assessment (EIA) Report of Etalin HE Project
Proponent: M/s Etalin Hydro Electric Power Company Limited (EHEPCL) 7.15
Consultant: RS Envirolink Technologies Pvt. Ltd.
S. No. Name of Species Density
(no./ ha)
Frequency
(%)
28 Solanum nigrum 1600 8.00
29 Strobilanthes rhombifolius 4800 16.00
30 Thysanolaena maxima 11600 24.00
31 Urtica dioica 6000 16.00
32 Viola diffusa 9600 12.00
33 Viola hediniana 3200 12.00
34 Canna indica 8800 16.00
Monsoon
1 Adiantum caudatum 5882 17.65
2 Angiopteris evecta 3529 11.76
3 Arisaema jacquemontii 1765 11.76
4 Arisaema speciosum 2941 17.65
5 Artemisia maritima 5882 23.53
6 Arundina graminifolia 10588 29.41
7 Bidens pilosa 8824 23.53
8 Chirita bifolia 7647 29.41
9 Commelina benghalensis 4706 17.65
10 Cynodon dactylon 12941 23.53
11 Cyperus rotundus 12353 29.41
12 Dicranopteris linearis 8235 17.65
13 Equisetum ramosissimum 6471 23.53
14 Fagopyrum dibotrys 8235 17.65
15 Fragaria indica 9412 17.65
16 Hedychium densiflorum 4706 17.65
17 Hedychium spicatum 2941 23.53
18 Impatiens bicornuta 6471 23.53
19 Impatiens acuminata 7647 29.41
20 Lycopodium clavatum 6471 11.76
21 Microsorum punctatum 2941 17.65
22 Persicaria chinensis 3529 17.65
23 Plantago erosa 1765 11.76
24 Poa annua 7059 17.65
25 Pteridium aquilinum 1765 5.88
26 Selaginella bryopteris 2353 5.88
27 Solanum indicum 1176 11.76
28 Strobilanthes rhombifolius 4706 17.65
29 Thysanolaena maxima 9412 29.41
7.4.3.3 Downstream of Dri Dam near Ru Pani (V3)
The sampling location is downstream of the proposed dam on Dri River on the left bank near
the village Punli. The area comes under shadow zone and dominated by Tropical evergreen,
Tropical semi-evergreen and Subtropical forest types.
Tree canopy at Site V3 is represented by 17 species and the most dominant species are
Albizia lucida, Saurauia roxburghii, Engelhardtia spicata, Ficus semicordata, and Aralia armata
(Table 7.6).
The shrub layer is represented by 16 species and most ones are the species of bamboo, and
Musa (Table 7.6). Other dominat species are Oxyspora paniculata, Piper clarkei and
Phragmitis karka.
Herbaceous flora was comprised of 26 species recorded during winter, 29 in summer season
and 25 during monsoon season (Table 7.7). Dominant herb species in the area are Begonia

Environmental Impact Assessment (EIA) Report of Etalin HE Project
Proponent: M/s Etalin Hydro Electric Power Company Limited (EHEPCL) 7.16
Consultant: RS Envirolink Technologies Pvt. Ltd.
palmata, Bidens pilosa, Hedychium spicatum, Ageratum conyzoides, Alpinia allughas, Cynodon
dactylon, Themeda anathera, and Thysanolaena maxima. Viola diffusa, Fagopyrum dibotrys,
Equisetum ramossimum, Elatostema sessile, Begonia palmata, and Polygonum capitatum
were most abundant in pre-monsoon and during monsoon Pratia nummularia, Fragaria indica,
Fagopyrum dibotrys, and Polygonum capitatum were most common and abundant.
Table 7.6: Community structure –Site: V3 (Trees & Shrubs)
S.
No. Name of Species
Density
(no./ ha)
Frequency
(%)
Basal Cover
(sq m /ha)
TREES
1 Ailanthus integrifolia 14 14.29 13.54
2 Albizia lucida 57 35.71 235.28
3 Albizia procera 29 21.43 131.39
4 Aralia armata 36 28.57 192.75
5 Caryota urens 14 14.29 26.22
6 Castanopsis indica 29 21.43 33.02
7 Cinnamomum obtusifolia 21 14.29 40.13
8 Cyathea giganteus 14 14.29 5.86
9 Cyathea spinulosa 7 7.14 2.68
10 Engelhardtia spicata 43 28.57 190.45
11 Ficus semicordata 36 28.57 134.52
12 Lagerstroemia parviflora 21 21.43 32.76
13 Macaranga denticulata 14 7.14 19.53
14 Macropanax dispermus 21 14.29 34.96
15 Pandanus odoratissma 29 21.43 7.45
16 Saurauia roxburghii 50 28.57 44.64
17 Terminalia myriocarpa 21 21.43 65.35
457
1211
SHRUBS
1 Angiopteris evecta 60 10 0.52
2 Bambusa pallida 160 5 33.40
3 Bambusa tulda 540 25 7.43
4 Dendrocalamus giganteus 240 20 18.41
5 Hydrangea serrata 100 15 1.53
6 Jasminum amplexicaule 60 10 0.55
7 Canna indica 240 20 1.82
8 Musa acuminata 280 20 24.10
9 Musa balbisiana 180 15 9.95
10 Myrsine semiserrata 120 20 1.12
11 Oxyspora paniculata 480 30 1.69
12 Phragmites karka 400 20 1.41
13 Piper clarkei 460 20 1.35
14 Rhaphidophora decursiva 60 10 0.23
15 Rubus ellipticus 140 15 7.99
16 Saccharum spontaneum 180 20 1.86
3700.00
113.36
Table 7.7: Community structure –Site: V3 (Herbs)
S.
No. Name of Species
Density
(no./ ha)
Frequency
(%)
Winter
1 Achyranthes bidentata 1600 4
2 Adiantum philippense 2000 4
3 Ageratum conyzoides 5600 12
4 Alpinia allughas 4400 12
5 Arthromeris wallichiana 800 8
6 Begonia griffithiana 4800 12
7 Begonia nepalensis 4000 16
8 Begonia palmata 5600 16
9 Bidens pilosa 6000 12
10 Commelina appeniculata 1600 8

Environmental Impact Assessment (EIA) Report of Etalin HE Project
Proponent: M/s Etalin Hydro Electric Power Company Limited (EHEPCL) 7.17
Consultant: RS Envirolink Technologies Pvt. Ltd.
S. No.
Name of Species Density
(no./ ha) Frequency
(%)
11 Cynodon dactylon 4800 8
12 Cyperus rotundus 3200 8
13 Elatostema sessile 6000 16
14 Fagopyrum dibotrys 3200 12
15 Hedychium spicatum 5600 16
16 Impatiens racemosa 1200 8
17 Lepisorus sordidus 4800 8
18 Pilea scripta 3200 12
19 Pogonatherum crinitum 3600 8
20 Polygonum flaccidum 2800 8
21 Polystichum aculeatum 2000 8
22 Sida rhombifolia 1200 8
23 Siegesbeckia orientalis 1600 12
24 Themeda anathera 4400 16
25 Thysanolaena maxima 5200 16
26 Urtica dioica 4000 12
Summer
1 Adiantum caudatum 6364 13.64
2 Alpinia allughas 2273 18.18
3 Arisaema speciosum 2727 18.18
4 Begonia nepalensis 5455 18.18
5 Begonia palmata 10455 22.73
6 Bidens pilosa 6364 9.09
7 Cardamine hirsuta 3636 13.64
8 Colocasia forniculata 909 4.55
9 Commelina appeniculata 2273 13.64
10 Cyperus rotundus 10000 22.73
11 Dicranopteris linearis 2273 9.09
12 Elatostema sessile 11818 18.18
13 Equisetum ramosissimum 5455 13.64
14 Fagopyrum dibotrys 12727 18.18
15 Fragaria indica 10000 18.18
16 Hedychium spicatum 1818 4.55
17 Impatiens bicornuta 1364 4.55
18 Justicia parviflora 3636 13.64
19 Lecanthes peduncularis 5455 13.64
20 Oxalis corniculata 3636 4.55
21 Pilea scripta 4545 9.09
22 Plantago erosa 6818 13.64
23 Polygonum capitatum 10909 18.18
24 Pouzolzia glaberrima 5000 18.18
25 Selaginella bryopteris 2727 9.09
26 Thysanolaena maxima 4091 18.18
27 Urtica dioica 5909 9.09
28 Viola diffusa 12727 22.73
29 Canna indica 6818 13.64
Monsoon
1 Adiantum caudatum 3571 14.29
2 Ageratum conyzoides 7143 21.43
3 Arisaema speciosum 3571 21.43
4 Arundina graminifolia 6429 28.57
5 Chirita bifolia 7857 35.71
6 Commelina benghlensis 2143 7.14
7 Equisetum ramosissimum 5714 14.29
8 Fagopyrum dibotrys 12857 28.57
9 Fragaria indica 14286 42.86
10 Gnaphalium affine 3571 21.43
11 Hedychium densiflorum 8571 35.71
12 Hedychium longipedunculatum 3571 21.43
13 Hedychium spicatum 5714 21.43
14 Impatiens bicornuta 4286 14.29
15 Impatiens acuminata 1429 7.14
16 Lactuca virosa 3571 14.29

Environmental Impact Assessment (EIA) Report of Etalin HE Project
Proponent: M/s Etalin Hydro Electric Power Company Limited (EHEPCL) 7.18
Consultant: RS Envirolink Technologies Pvt. Ltd.
S. No.
Name of Species Density
(no./ ha) Frequency
(%)
17 Lepisorus excavata 6429 7.14
18 Lycopodium clavatum 9286 21.43
19 Nephrolephis cordifolia 5714 28.57
20 Physalis minima 2143 14.29
21 Polygonum capitatum 11429 28.57
22 Pratia nummularia 20000 35.71
23 Pteris quadriaurita 7143 21.43
24 Selaginella bryopteris 5714 14.29
25 Stellaria monosperma 2857 7.14
7.4.3.4 Catchment Area Talo (Tangon) River (V4)
The catchment area is mainly dominated by Subtropical broad leaved and Subtropical Pine
forest.
The site is comprised of 13 tree species (Table 7.8). The right bank slopes at this site are sun
facing and mainly comprised of Pinus merkusii forest at upper reaches. Left bank slopes are
covered with dense broad leaved vegetation. Pinus merkusii, Ficus semicordata and Albizia
procera are the most dominant plants at higher elevation and Engelhardtia spicata,
Macropanax dispermus and Pterospermum acerifolium are common near river bank and at
lower elevations.
Shrub layer is represented by 16 species comprised of the clumps of bamboo species. On
open places grasses like Saccharum spontaneu and Phragmites karka are common. Oxyspora
paniculata, Rubus foliolosus, Saxifraga sp., Piper clarkei, etc are the other common shrubs
recorded from the catchment area of Talo (Tangon) River.
Herb layer was represented by 20 species in winter, 23 in summer and 25 in monsoon (Table
7.9). The herbaceous layer mainly consists of Poa annua, Anaphalis contorta, Dryoathyrium
boryanum, Eupatorium odoratum, Themeda nathera, Thysanolaena maxima, Artemisia
maritima, Bidens pilosa, Ageratum conyzoides along with fern species like Nephrolephis
cordifolia, and Lecanthes peduncularis.
Table 7.8: Community structure –Site: V4 (Trees & Shrubs)
S.
No. Name of Species
Density
(no./ ha)
Frequency
(%)
Basal Cover
(sq m /ha)
TREES
1 Albizia procera 43 28.57 63.30
2 Aralia armata 21 14.29 32.25
3 Brassiopsis glomerulata 29 21.43 17.08
4 Caryota urens 7 7.14 3.84
5 Cyathea spinulosa 21 21.43 42.95
6 Engelhardtia spicata 29 21.43 90.00
7 Ficus semicordata 29 28.57 137.16
8 Kydia calycina 14 14.29 13.54
9 Macropanax dispermus 21 21.43 54.62
10 Ostodes paniculata 14 14.29 10.37
11 Pandanus odoratissma 21 14.29 7.21
12 Pinus merkusii 57 28.57 237.83
13 Pterospermum acerifolium 29 21.43 72.36
336
783
SHRUBS
1 Artemisia indica 140 10 0.50

Environmental Impact Assessment (EIA) Report of Etalin HE Project
Proponent: M/s Etalin Hydro Electric Power Company Limited (EHEPCL) 7.19
Consultant: RS Envirolink Technologies Pvt. Ltd.
S.
No. Name of Species
Density
(no./ ha)
Frequency
(%)
Basal Cover
(sq m /ha)
2 Arundinaria falcata 240 15 0.41
3 Bambusa pallida 360 20 20.41
4 Bambusa tulda 400 35 4.49
5 Musa balbisiana 100 15 5.51
6 Buddleja asiatica 120 15 2.61
7 Dendrocalamus giganteus 340 10 120.53
8 Hydrangea serrata 100 10 0.83
9 Oxyspora paniculata 480 25 1.32
10 Phragmites karka 340 20 1.10
11 Piper clarkei 160 15 0.37
12 Rhus wallichi 100 10 0.92
13 Rubus ellipticus 160 20 0.35
14 Rubus foliolosus 200 20 1.26
15 Saccharum spontaneum 260 15 2.18
16 Saxifraga sarmentosa 160 10 1.12
3660
163.90
Table 7.9: Community structure –Site: V4 (Herbs)
S.
No. Name of Species
Density
(no./ ha)
Frequency
(%)
Winter
1 Alpinia allughas 2667 7
2 Anaphalis contorta 5333 20
3 Aster himalaicus 2000 13
4 Begonia palmata 4667 13
5 Bidens pilosa 8000 27
6 Dryoathyrium boryanum 5333 13
7 Eupatorium odoratum 10000 33
8 Fagopyrum dibotrys 2667 13
9 Hedychium spicatum 5333 13
10 Kyllinga brevifolia 6667 20
11 Lecanthes peduncularis 5333 13
12 Leucas ciliata 2667 13
13 Majus pumilus 10000 27
14 Nephrolephis cordifolia 10667 27
15 Physalis minima 4667 20
16 Poa annua 12000 13
17 Pothos scandens 3333 13
18 Pouzolzia fulgens 6000 20
19 Themeda anathera 4667 13
20 Thysanolaena maxima 9333 27
Summer
1 Alpinia allughas 4667 13.33
2 Anaphalis contorta 4000 13.33
3 Aster himalaicus 1333 20.00
4 Begonia palmata 9333 26.67
5 Bidens pilosa 8667 26.67
6 Dryoathyrium boryanum 4000 13.33
7 Ageratum conyzoides 3333 20.00
8 Centella asiatica 2667 13.33
9 Eupatorium odoratum 8000 26.67
10 Fagopyrum dibotrys 4000 20.00
11 Hedychium spicatum 4667 20.00
12 Kyllinga brevifolia 8000 20.00
13 Lecanthes peduncularis 6667 20.00
14 Leucas ciliata 4667 13.33
15 Majus pumilus 8000 20.00
16 Nephrolephis cordifolia 9333 26.67

Environmental Impact Assessment (EIA) Report of Etalin HE Project
Proponent: M/s Etalin Hydro Electric Power Company Limited (EHEPCL) 7.20
Consultant: RS Envirolink Technologies Pvt. Ltd.
S.
No. Name of Species
Density (no./ ha)
Frequency (%)
17 Physalis minima 6667 20.00
18 Poa annua 14667 26.67
19 Pothos scandens 2667 20.00
20 Pouzolzia fulgens 2667 13.33
21 Themeda anathera 6000 20.00
22 Thysanolaena maxima 6667 20.00
23 Plantago erosa 5333 20.00
Monsoon
1 Abutilon indicum 1538 15.38
2 Adiantum caudatum 4615 7.69
3 Anaphalis contorta 3846 23.08
4 Artemisia maritima 2308 7.69
5 Arundina graminifolia 9231 23.08
6 Chirita bifolia 11538 30.77
7 Commelina benghlensis 5385 30.77
8 Cynodon dactylon 18462 23.08
9 Cynoglossum glochidiatum 6154 23.08
10 Cyperus rotundus 7692 15.38
11 Dicranopteris linearis 2308 15.38
12 Dioscorea belophylla 3846 23.08
13 Elsholtzia ciliata 4615 15.38
14 Hedychium longipedunculatum 1538 7.69
15 Hedychium spicatum 2308 15.38
16 Impatiens bicornuta 3846 15.38
17 Lecanthes peduncularis 4615 15.38
18 Lycopodium clavatum 2308 7.69
19 Pratia nummularia 14615 30.77
20 Rhaphidophora decursiva 2308 23.08
21 Selaginella bryopteris 3846 7.69
22 Sida rhombifolia 4615 23.08
23 Solanum indicum 3077 15.38
24 Spilanthes paniculata 769 7.69
25 Strobilanthes rhombifolius 3846 15.38
7.4.3.5 Talo (Tangon) Dam Site Talo (Tangon) River (V5)
Tree layer at Talo (Tangon) dam site sampling location is comprised of 16 species.
Castanopsis indica Alnus nepalensis, Albizia lucida, Engelhardtia spicata and Ficus semicordata
are the most dominant species (Table 7.10). Castanopsis indica and Alnus nepalensis are
dominant only near the river bank and in shaded zone. Ficus semicordata and Albizia lucida
were found with highest basal cover.
As compared to trees, shrubs were represented by 22 species (Table 7.10). Bamboo brakes
are common in this area which comprised mostly of Bambusa tulda, Bambusa pallida,
Dendrocalamus giganteus and Dendrocalamus hamiltonii. Other dominant shrubs were
Oxyspora paniculata, Piper clarkei and Calamus leptospadix found occuring in shaded areas.
Saccharum spontaneum and Phragmites karka are common along river flood plain and
degraded area on the hills.
The herb layer was represented by 20 species in winter 24 species in summer and 23 in
monsoon (Table 7.11). Alpinia allughas, Begonia nepalensis, Bidens pilosa, Poa annua,
Hedychium spicatum, Thysanolaena maxima, Centella asiatica, Plantago erosa, Pteridium
aquilinum and Cyperus rotundus are the common herbs in the area.
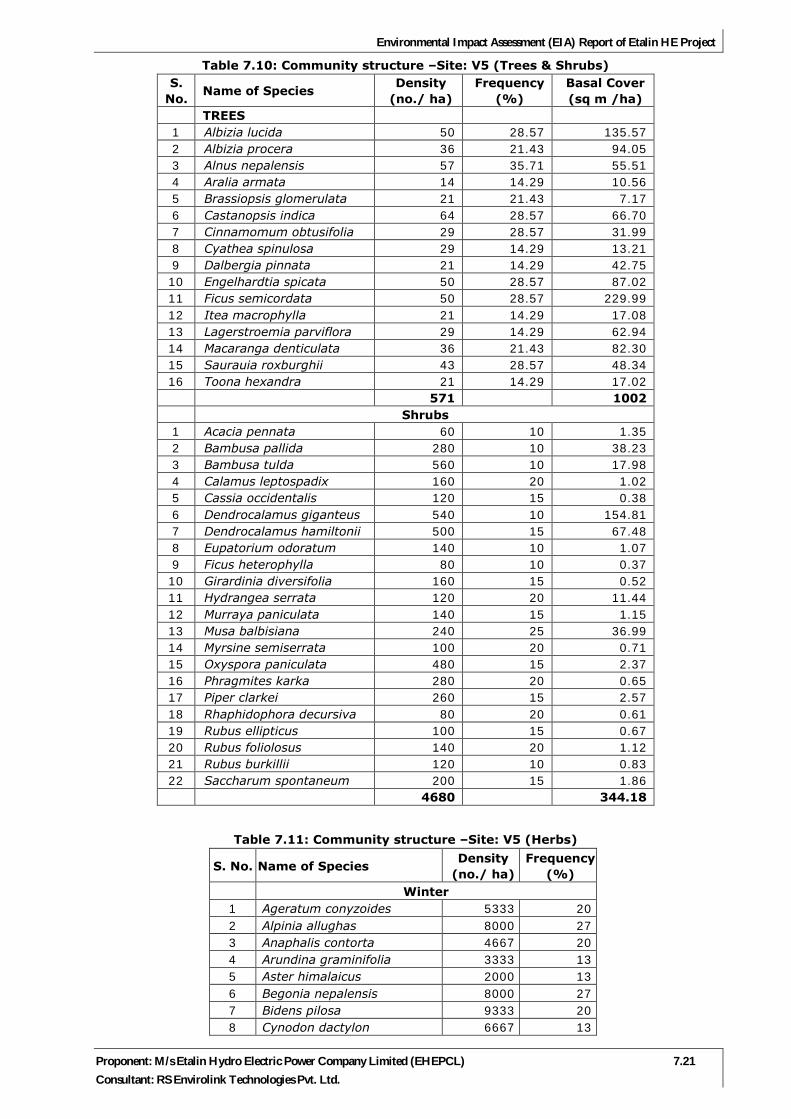
Environmental Impact Assessment (EIA) Report of Etalin HE Project
Proponent: M/s Etalin Hydro Electric Power Company Limited (EHEPCL) 7.21
Consultant: RS Envirolink Technologies Pvt. Ltd.
Table 7.10: Community structure –Site: V5 (Trees & Shrubs)
S.
No. Name of Species
Density
(no./ ha)
Frequency
(%)
Basal Cover
(sq m /ha)
TREES
1 Albizia lucida 50 28.57 135.57
2 Albizia procera 36 21.43 94.05
3 Alnus nepalensis 57 35.71 55.51
4 Aralia armata 14 14.29 10.56
5 Brassiopsis glomerulata 21 21.43 7.17
6 Castanopsis indica 64 28.57 66.70
7 Cinnamomum obtusifolia 29 28.57 31.99
8 Cyathea spinulosa 29 14.29 13.21
9 Dalbergia pinnata 21 14.29 42.75
10 Engelhardtia spicata 50 28.57 87.02
11 Ficus semicordata 50 28.57 229.99
12 Itea macrophylla 21 14.29 17.08
13 Lagerstroemia parviflora 29 14.29 62.94
14 Macaranga denticulata 36 21.43 82.30
15 Saurauia roxburghii 43 28.57 48.34
16 Toona hexandra 21 14.29 17.02
571
1002
Shrubs
1 Acacia pennata 60 10 1.35
2 Bambusa pallida 280 10 38.23
3 Bambusa tulda 560 10 17.98
4 Calamus leptospadix 160 20 1.02
5 Cassia occidentalis 120 15 0.38
6 Dendrocalamus giganteus 540 10 154.81
7 Dendrocalamus hamiltonii 500 15 67.48
8 Eupatorium odoratum 140 10 1.07
9 Ficus heterophylla 80 10 0.37
10 Girardinia diversifolia 160 15 0.52
11 Hydrangea serrata 120 20 11.44
12 Murraya paniculata 140 15 1.15
13 Musa balbisiana 240 25 36.99
14 Myrsine semiserrata 100 20 0.71
15 Oxyspora paniculata 480 15 2.37
16 Phragmites karka 280 20 0.65
17 Piper clarkei 260 15 2.57
18 Rhaphidophora decursiva 80 20 0.61
19 Rubus ellipticus 100 15 0.67
20 Rubus foliolosus 140 20 1.12
21 Rubus burkillii 120 10 0.83
22 Saccharum spontaneum 200 15 1.86
4680
344.18
Table 7.11: Community structure –Site: V5 (Herbs)
S. No. Name of Species Density
(no./ ha)
Frequency
(%)
Winter
1 Ageratum conyzoides 5333 20
2 Alpinia allughas 8000 27
3 Anaphalis contorta 4667 20
4 Arundina graminifolia 3333 13
5 Aster himalaicus 2000 13
6 Begonia nepalensis 8000 27
7 Bidens pilosa 9333 20
8 Cynodon dactylon 6667 13

Environmental Impact Assessment (EIA) Report of Etalin HE Project
Proponent: M/s Etalin Hydro Electric Power Company Limited (EHEPCL) 7.22
Consultant: RS Envirolink Technologies Pvt. Ltd.
S. No. Name of Species Density
(no./ ha)
Frequency
(%)
9 Cyperus rotundus 7333 13
10 Fagopyrum dibotrys 4667 13
11 Hedychium spicatum 8000 20
12 Impatiens racemosa 3333 13
13 Pilea scripta 4667 27
14 Poa annua 2667 13
15 Polygonum flaccidum 5333 20
16 Polystichum aculeatum 4000 13
17 Pteridium aquilinum 7333 27
18 Pteris quadriaurita 5333 27
19 Thysanolaena maxima 8000 20
20 Urena lobata 2667 7
Summer
1 Ageratum conyzoides 5556 16.67
2 Alpinia allughas 7778 22.22
3 Anaphalis contorta 6667 22.22
4 Arundina graminifolia 2222 11.11
5 Aster himalaicus 2222 16.67
6 Begonia nepalensis 8889 33.33
7 Bidens pilosa 6111 16.67
8 Cynodon dactylon 7222 16.67
9 Cyperus rotundus 6667 16.67
10 Fagopyrum dibotrys 4444 11.11
11 Hedychium spicatum 5000 22.22
12 Impatiens racemosa 4444 16.67
13 Pilea scripta 5000 22.22
14 Poa annua 6667 16.67
15 Polygonum flaccidum 5556 22.22
16 Polystichum aculeatum 2222 11.11
17 Pteridium aquilinum 7778 16.67
18 Pteris quadriaurita 4444 22.22
19 Thysanolaena maxima 7778 22.22
20 Urena lobata 5000 11.11
21 Centella asiatica 7778 22.22
22 Gnaphalium affine 4444 11.11
23 Commelina appeniculata 5000 11.11
24 Plantago erosa 6111 16.67
Monsoon
1 Ageratum conyzoides 3333 20.00
2 Arisaema speciosum 3333 20.00
3 Arundina grarminifolia 5333 13.33
4 Begonia nepalensis 5333 20.00
5 Bidens pilosa 7333 26.67
6 Chirita bifolia 6667 26.67
7 Commelina benghlensis 4667 13.33
8 Dicranopteris linearis 2667 6.67
9 Equisetum ramosissimum 5333 13.33
10 Fagopyrum dibotrys 12667 26.67
11 Hedychium spicatum 6667 33.33
12 Impatiens racemosa 6000 20.00
13 Impatiens acuminata 8000 33.33
14 Lycopodium clavatum 2667 13.33
15 Nephrolephis cordifolia 4000 13.33
16 Polygonum flaccidum 8667 26.67
17 Polystichum aculeatum 5333 20.00
18 Pteris vittata 6667 20.00

Environmental Impact Assessment (EIA) Report of Etalin HE Project
Proponent: M/s Etalin Hydro Electric Power Company Limited (EHEPCL) 7.23
Consultant: RS Envirolink Technologies Pvt. Ltd.
S. No. Name of Species Density
(no./ ha)
Frequency
(%)
19 Selaginella bryopteris 5333 20.00
20 Smilax aspera 4000 13.33
21 Strobilanthes rhombifolius 9333 26.67
22 Thysanolaena maxima 14000 26.67
23 Tinospora crispa 3333 20.00
7.4.3.6 Downstream of Talo (Tangon) Dam near Anon Pani (V6)
In the downstream of the dam site near the Anon Pani area the dense tropical evergreen
forest are present on both the banks of the river.
Tree canopy is represented by 15 species with Albizia procera, Castanopsis indica, Saurauia
roxburghii, Engelhardtia spicata, Ficus semicordata and Lagerstroemia parviflora as the
dominant species (Table 7.12). The frequency of occurence of Albizia procera, Castanopsis
indica, Saurauia roxburghii too was highest amongst all species. However the basal of Albizia
procera was the highest.
Bambusa pallida, B. tulda, Musa balbasiana, Oxyspora paniculata, Piper clarkei, and
Saccharum spontaneum were the dominant shrubs (Table 7.12). The density of Oxyspora
paniculata was the highest amongst 17 species recorded from this location.
The herb layer was represented by 28 species in winter 30 species in summer and 23 in
monsoon (Table 7.13). The herbaceous species dominant in the area are Fagopyrum
dibotrys, Poa annua, Elatostema sessile followed by Begonia nepalensis, Alpinia allughas,
Bidens pilosa and Polystichum aculeatum.
Table 7.12: Community structure –Site: V6 (Trees & Shrubs)
S.
No. Name of Species Density
(no./ ha)
Frequency
(%)
Basal
Cover
(sq m /ha)
TREES
1 Albizia procera 57 35.71 261.17
2 Caryota urens 21 14.29 41.77
3 Castanopsis indica 57 42.86 120.89
4 Cyathea spinulosa 29 21.43 16.71
5 Engelhardtia spicata 50 35.71 134.70
6 Ficus semicordata 43 21.43 111.15
7 Lagerstroemia parviflora 43 21.43 172.97
8 Macaranga denticulata 29 21.43 45.05
9 Macropanax dispermus 14 14.29 24.25
10 Mallotus philippinensis 36 35.71 33.54
11 Pandanus odoratissma 43 28.57 22.57
12 Sarcosperma griffithii 29 28.57 17.08
13 Saurauia roxburghii 57 42.86 19.53
14 Terminalia myriocarpa 14 14.29 11.93
15 Toona hexandra 14 14.29 32.85
536
1066
Shrubs
1 Angiopteris evecta 160 15 3.30
2 Bambusa pallida 200 5 19.28
3 Bambusa tulda 560 25 17.55
4 Calamus leptospadix 100 10 0.78

Environmental Impact Assessment (EIA) Report of Etalin HE Project
Proponent: M/s Etalin Hydro Electric Power Company Limited (EHEPCL) 7.24
Consultant: RS Envirolink Technologies Pvt. Ltd.
S.
No. Name of Species Density
(no./ ha)
Frequency
(%)
Basal
Cover
(sq m /ha)
5 Cassia occidentalis 240 20 1.10
6 Dendrocalamus giganteus 160 5 14.72
7 Dendrocalamus strictus 280 10 24.47
8 Hydrangea serrata 80 20 3.93
9 Canna indica 320 20 0.65
10 Musa balbisiana 280 20 42.73
11 Myrsine semiserrata 60 10 0.46
12 Oxyspora paniculata 680 30 11.78
13 Phragmites karka 160 10 0.67
14 Piper clarkei 500 20 6.05
15 Rubus ellipticus 60 15 0.32
16 Rubus foliolosus 100 15 0.78
17 Saccharum spontaneum 300 15 5.16
4240
153.74
Table 7.13: Community structure –Site: V6 (Herbs)
S.
No. Name of Species
Density
(no./ ha)
Frequency
(%)
Winter
1 Alpinia allughas 6818 18
2 Amaranthus viridis 4545 14
3 Arisaema speciosum 4091 14
4 Begonia nepalensis 6364 18
5 Begonia palmata 5455 14
6 Bidens pilosa 6818 23
7 Commelina appeniculata 3182 14
8 Cymbidium aloifolium 4545 18
9 Cyperus exaltatus 3636 9
10 Elatostema sessile 10909 23
11 Fagopyrum dibotrys 9545 18
12 Hedychium spicatum 6364 23
13 Impatiens racemosa 3636 9
14 Lepisorus exavata 4545 14
15 Leucas ciliata 3636 9
16 Onychium siliculosum 4091 14
17 Ophiopogon intermedeus 2273 9
18 Oxalis corniculata 3636 9
19 Physalis minima 1818 9
20 Pilea scripta 909 5
21 Poa annua 9545 14
22 Pogonatherum paniceum 2273 14
23 Polygonum capitatum 6364 18
24 Polystichum aculeatum 5455 18
25 Pronephrium affine 3636 9
26 Pteridium aquilinum 3182 9
27 Themeda anathera 4545 14
28 Urtica dioica 2727 9
Summer
1 Alpinia allughas 8182 22.73
2 Amaranthus viridis 3182 9.09
3 Anaphalis contorta 4545 13.64
4 Arisaema speciosum 3636 13.64
5 Begonia nepalensis 8182 22.73
6 Begonia palmata 3636 13.64
7 Bidens pilosa 8182 18.18
8 Commelina appeniculata 4545 13.64

Environmental Impact Assessment (EIA) Report of Etalin HE Project
Proponent: M/s Etalin Hydro Electric Power Company Limited (EHEPCL) 7.25
Consultant: RS Envirolink Technologies Pvt. Ltd.
S.
No. Name of Species
Density
(no./ ha)
Frequency
(%)
9 Cymbidium aloifolium 3182 13.64
10 Cyperus exaltatus 3636 13.64
11 Elatostema sessile 9091 18.18
12 Fagopyrum dibotrys 12727 22.73
13 Hedychium spicatum 4545 22.73
14 Impatiens racemosa 5455 13.64
15 Justicia parviflora 4545 13.64
16 Lepisorus exavata 2727 9.09
17 Leucas ciliata 2727 13.64
18 Oxalis corniculata 5455 18.18
19 Physalis minima 2727 9.09
20 Pilea scripta 1818 9.09
21 Plantago erosa 7273 18.18
22 Poa annua 11818 18.18
23 Pogonatherum paniceum 3182 13.64
24 Polygonum capitatum 7273 18.18
25 Polystichum aculeatum 8182 18.18
26 Pronephrium affine 1818 9.09
27 Pteridium aquilinum 4545 18.18
28 Themeda anathera 5455 13.64
29 Urtica dioica 3636 13.64
30 Viola diffusa 7273 18.18
Monsoon
1 Ageratum conyzoides 8235 23.53
2 Arundina grarminifolia 1765 5.88
3 Begonia nepalensis 2941 11.76
4 Bidens pilosa 9412 29.41
5 Centella asiatica 7647 17.65
6 Chirita bifolia 5882 23.53
7 Colocasia forniculata 1176 5.88
8 Commelina benghlensis 7647 17.65
9 Cymbidium aloifolium 8824 23.53
10 Dryoathyrium boryanum 3529 17.65
11 Erigeron bonariensis 7059 17.65
12 Fagopyrum dibotrys 9412 23.53
13 Fragaria indica 11765 29.41
14 Hedychium longipedunculatum 1765 11.76
15 Hedychium spicatum 2941 23.53
16 Hypericum densiflorum 2353 17.65
17 Impatiens acuminata 5882 17.65
18 Phyrnium pubinerve 4706 17.65
19 Polygonum capitatum 7059 23.53
20 Pratia nummularia 1765 5.88
21 Pteridium aquilinum 9412 23.53
22 Stellaria monosperma 2941 11.76
23 Thysanolaena maxima 12941 29.41
7.4.3.7 Power House Site (V7)
The power house site is located near the confluence of the Dri and Talo (Tangon) rivers near
Etalin village. This area is covered with dense forest.
The tree canopy at this location is dominated by Engelhardtia spicata, Saurauia roxburghii,
Pterospermum acerifolium, Castanopsis indica and Albizia procera with 20 species recorded
from this site (Table 7.14).
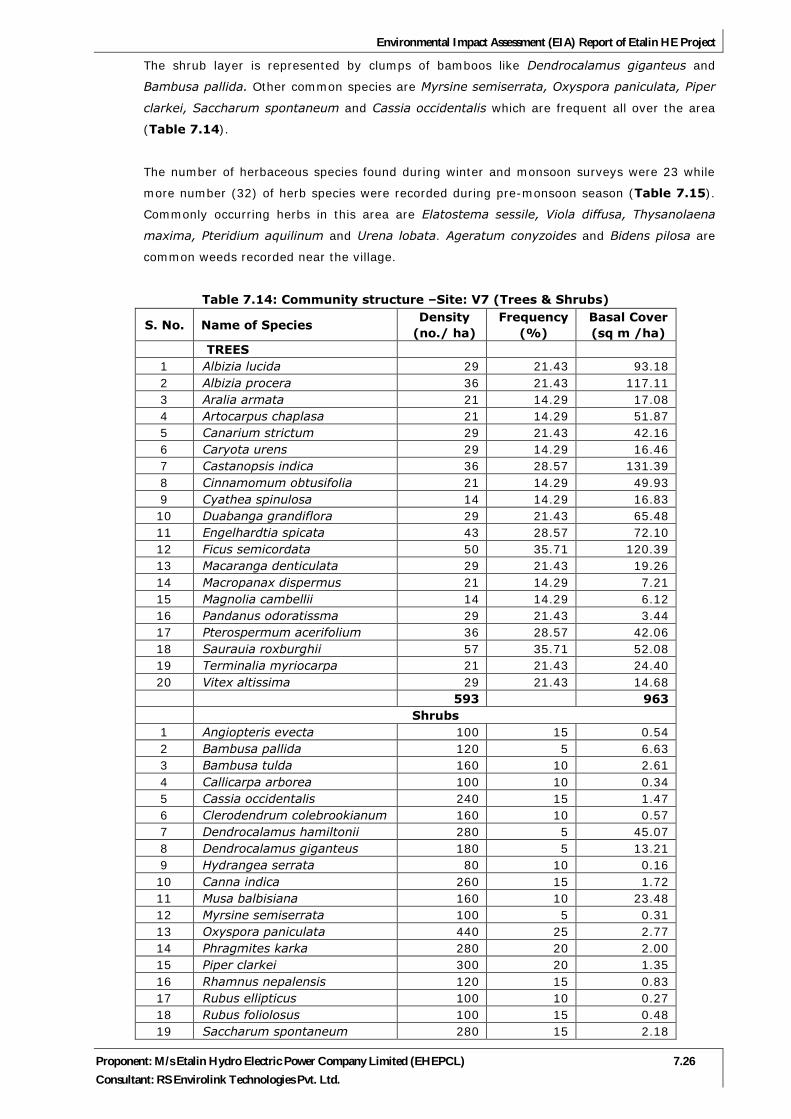
Environmental Impact Assessment (EIA) Report of Etalin HE Project
Proponent: M/s Etalin Hydro Electric Power Company Limited (EHEPCL) 7.26
Consultant: RS Envirolink Technologies Pvt. Ltd.
The shrub layer is represented by clumps of bamboos like Dendrocalamus giganteus and
Bambusa pallida. Other common species are Myrsine semiserrata, Oxyspora paniculata, Piper
clarkei, Saccharum spontaneum and Cassia occidentalis which are frequent all over the area
(Table 7.14).
The number of herbaceous species found during winter and monsoon surveys were 23 while
more number (32) of herb species were recorded during pre-monsoon season (Table 7.15).
Commonly occurring herbs in this area are Elatostema sessile, Viola diffusa, Thysanolaena
maxima, Pteridium aquilinum and Urena lobata. Ageratum conyzoides and Bidens pilosa are
common weeds recorded near the village.
Table 7.14: Community structure –Site: V7 (Trees & Shrubs)
S. No. Name of Species Density
(no./ ha)
Frequency
(%)
Basal Cover
(sq m /ha)
TREES
1 Albizia lucida 29 21.43 93.18
2 Albizia procera 36 21.43 117.11
3 Aralia armata 21 14.29 17.08
4 Artocarpus chaplasa 21 14.29 51.87
5 Canarium strictum 29 21.43 42.16
6 Caryota urens 29 14.29 16.46
7 Castanopsis indica 36 28.57 131.39
8 Cinnamomum obtusifolia 21 14.29 49.93
9 Cyathea spinulosa 14 14.29 16.83
10 Duabanga grandiflora 29 21.43 65.48
11 Engelhardtia spicata 43 28.57 72.10
12 Ficus semicordata 50 35.71 120.39
13 Macaranga denticulata 29 21.43 19.26
14 Macropanax dispermus 21 14.29 7.21
15 Magnolia cambellii 14 14.29 6.12
16 Pandanus odoratissma 29 21.43 3.44
17 Pterospermum acerifolium 36 28.57 42.06
18 Saurauia roxburghii 57 35.71 52.08
19 Terminalia myriocarpa 21 21.43 24.40
20 Vitex altissima 29 21.43 14.68
593
963
Shrubs
1 Angiopteris evecta 100 15 0.54
2 Bambusa pallida 120 5 6.63
3 Bambusa tulda 160 10 2.61
4 Callicarpa arborea 100 10 0.34
5 Cassia occidentalis 240 15 1.47
6 Clerodendrum colebrookianum 160 10 0.57
7 Dendrocalamus hamiltonii 280 5 45.07
8 Dendrocalamus giganteus 180 5 13.21
9 Hydrangea serrata 80 10 0.16
10 Canna indica 260 15 1.72
11 Musa balbisiana 160 10 23.48
12 Myrsine semiserrata 100 5 0.31
13 Oxyspora paniculata 440 25 2.77
14 Phragmites karka 280 20 2.00
15 Piper clarkei 300 20 1.35
16 Rhamnus nepalensis 120 15 0.83
17 Rubus ellipticus 100 10 0.27
18 Rubus foliolosus 100 15 0.48
19 Saccharum spontaneum 280 15 2.18

Environmental Impact Assessment (EIA) Report of Etalin HE Project
Proponent: M/s Etalin Hydro Electric Power Company Limited (EHEPCL) 7.27
Consultant: RS Envirolink Technologies Pvt. Ltd.
S. No. Name of Species Density
(no./ ha)
Frequency
(%)
Basal Cover
(sq m /ha)
20 Saxifraga sarmentosa 160 10 3.30
21 Ficus heterophylla 140 25 12.84
22 Trevesia palmata 100 25 4.88
23 Solanum ciliatum 160 10 0.90
24 Solanum viarum 80 5 0.28
4200
128.17
Table 7.15: Community structure –Site: V7 (Herbs)
S.
No. Name of Species
Density
(no./ ha)
Frequency
(%)
Winter
1 Ageratum conyzoides 3667 10
2 Bidens biternata 5000 10
3 Bidens pilosa 6667 13
4 Colocasia forniculata 2667 7
5 Cynodon dactylon 7333 10
6 Cyperus rotundus 4000 7
7 Dryoathyrium boryanum 1667 10
8 Fagopyrum dibotrys 2667 10
9 Fragaria indica 5667 13
10 Hedychium densiflorum 3333 10
11 Hedychium spicatum 4667 17
12 Impatiens bicornuta 4000 10
13 Impatiens racemosa 2000 7
14 Nephrolephis cordifolia 4667 13
15 Oxalis corniculata 4000 7
16 Poa annua 9333 10
17 Polygonum capitatum 4667 13
18 Polypodium amoenum 3333 13
19 Pothos scandens 4667 17
20 Pteridium aquilinum 4000 17
21 Solanum indicum 2667 7
22 Thysanolaena maxima 8000 17
23 Urtica dioica 3333 10
Summer
1 Adiantum philippense 1905 4.76
2 Acorus calamus 2857 9.52
3 Adiantum caudatum 6667 14.29
4 Ageratum conyzoides 10476 23.81
5 Ajuga macrosperma 2381 9.52
6 Alocasia fallax 1429 9.52
7 Angiopteris evecta 4762 19.05
8 Arisaema speciosum 476 4.76
9 Arisaema wallichianum 952 4.76
10 Begonia nepalensis 3810 14.29
11 Begonia roxburghii 5714 19.05
12 Bidens biternata 2381 9.52
13 Bidens pilosa 4762 14.29
14 Cardamine hirsuta 4762 14.29
15 Cynodon dactylon 5238 9.52
16 Elatostema sessile 10952 23.81
17 Equisetum ramosissimum 2381 9.52
18 Eupatorium odoratum 1429 4.76
19 Hedychium spicatum 1905 9.52
20 Impatiens bicornuta 2381 9.52
21 Lecanthes peduncularis 4762 9.52
22 Lepisorus sordidus 2381 4.76

Environmental Impact Assessment (EIA) Report of Etalin HE Project
Proponent: M/s Etalin Hydro Electric Power Company Limited (EHEPCL) 7.28
Consultant: RS Envirolink Technologies Pvt. Ltd.
S.
No. Name of Species
Density
(no./ ha)
Frequency
(%)
23 Leucas ciliata 3810 14.29
24 Nephrolephis cordifolia 5238 19.05
25 Plantago erosa 4762 14.29
26 Pteridium aquilinum 7143 19.05
27 Pteris quadriaurita 4762 9.52
28 Selaginella bryopteris 3333 9.52
29 Themeda anathera 5238 14.29
30 Thysanolaena maxima 6667 14.29
31 Urena lobata 8095 19.05
32 Viola diffusa 9524 23.81
Monsoon
1 Abutilon indicum 1667 11.11
2 Ageratum conyzoides 10000 22.22
3 Begonia palmata 3333 16.67
4 Blumea procera 2778 11.11
5 Chirita bifolia 10000 27.78
6 Commelina benghlensis 6111 16.67
7 Cyanotis vaga 2778 22.22
8 Cynodon dactylon 7222 22.22
9 Cyperus rotundus 2778 16.67
10 Fragaria indica 6111 22.22
11 Impatiens acuminata 2778 11.11
12 Impatiens bicornuta 3333 11.11
13 Iris domestica 4444 16.67
14 Justicia khasiana 2778 16.67
15 Lecanthes peduncularis 4444 5.56
16 Pogostemon bengalensis 5556 16.67
17 Polygonum capitatum 7778 22.22
18 Polygonum flaccidum 5556 16.67
19 Pratia nummularia 7222 27.78
20 Selaginella bryopteris 2778 11.11
21 Solanum indicum 4444 16.67
22 Strobilanthes rhombifolius 1667 16.67
23 Thysanolaena maxima 10000 22.22
7.4.3.8 Downstream of Power House Site (V8)
This sampling site is located about 5 km downstream of the confluence of Dri and Talo
(Tangon) Rivers on the Dibang River. The area is covered with dense tropical evergreen
forest.
The tree canopy is represented by Engelhardtia spicata, Terminalia myriocarpa, Albizia lucida,
Bauhinia purpurea, Cyathea spinulosa, Ficus semicordata and Saurauia roxburghii (Table
7.16).
Shrub layer is represented by 20 species in the area (Table 7.16) with Oxyspora paniculata,
Bambusa tulda, Cassia occidentalis, Bambusa pallida and Piper clarkei as the dominant
shrubs.
The herbaceous layer was represented by 22, 26 and 20 species during winter, pre-monsoon
and monsoon surveys, respectively (Table 7.17). The herbaceous layer was dominated by
species like Fagopyrum dibotrys, Elatostema sessile, Polygonum capitatum, Thysanolaena
maxima, Viola diffusa, Begonia nepalensis, Urena lobata, and Cynodon dactylon.

Environmental Impact Assessment (EIA) Report of Etalin HE Project
Proponent: M/s Etalin Hydro Electric Power Company Limited (EHEPCL) 7.29
Consultant: RS Envirolink Technologies Pvt. Ltd.
Table 7.16: Community structure –Site: V8 (Trees & Shrubs)
S.
No. Name of Species Density
(no./ ha)
Frequency
(%)
Basal
Cover
(sq m /ha)
TREES
1 Ailanthus integrifolia 14 7.14 15.44
2 Albizia lucida 36 21.43 55.51
3 Albizia procera 21 14.29 26.68
4 Aralia armata 29 14.29 30.64
5 Artocarpus chaplasa 7 7.14 3.70
6 Bauhinia purpurea 36 28.57 26.92
7 Castanopsis indica 29 21.43 42.06
8 Cyathea spinulosa 36 21.43 18.22
9 Engelhardtia spicata 50 28.57 129.33
10 Ficus roxburghii 14 14.29 14.62
11 Ficus semicordata 36 14.29 60.10
12 Gmelina arborea 14 7.14 22.43
13 Kydia calycina 14 7.14 7.33
14 Livistonia jenkinsiana 21 14.29 11.77
15 Pandanus odoratissma 14 7.14 5.97
16 Saurauia roxburghii 36 21.43 35.67
17 Terminalia myriocarpa 50 28.57 99.39
457
606
Shrubs
1 Acacia pennata 100 15 4.44
2 Agapetes forrestii 40 10 1.12
3 Angiopteris evecta 160 20 2.07
4 Bambusa pallida 300 5 49.40
5 Bambusa tulda 520 15 31.11
6 Callicarpa arborea 80 10 0.23
7 Cassia occidentalis 300 15 13.21
8 Clerodendrum colebrookianum 160 10 0.90
9 Dendrocalamus giganteus 240 5 32.25
10 Ficus heterophylla 120 20 3.98
11 Canna indica 360 20 3.21
12 Luculia pinceana 80 10 3.73
13 Musa balbisiana 220 15 33.99
14 Oxyspora paniculata 480 25 5.75
15 Phragmites karka 240 20 2.18
16 Piper clarkei 300 20 2.77
17 Rubus ellipticus 80 10 0.67
18 Saccharum spontaneum 240 20 6.63
19 Solanum ciliatum 160 15 1.86
20 Trevesia palmata 160 20 15.40
Total 340
214.89
Table 7.17: Community structure –Site: V8 (Herbs)
S.
No. Name of Species
Density
(no./ ha)
Frequency
(%)
Winter
1 Abutilon indicum 3000 10
2 Achyranthes bidentata 5000 15
3 Anisomeles indica 7500 20
4 Bidens biternata 9000 25
5 Bidens pilosa 6500 15
6 Colocasia forniculata 3500 20
7 Cyathula prostrata 6000 20
8 Cynodon dactylon 11000 15
9 Cyperus rotundus 12000 20

Environmental Impact Assessment (EIA) Report of Etalin HE Project
Proponent: M/s Etalin Hydro Electric Power Company Limited (EHEPCL) 7.30
Consultant: RS Envirolink Technologies Pvt. Ltd.
S.
No. Name of Species
Density
(no./ ha)
Frequency
(%)
10 Dryoathyrium boryanum 4000 10
11 Ephedra aspera 5000 10
12 Fagopyrum dibotrys 5500 15
13 Fragaria indica 6000 20
14 Hedychium spicatum 11000 20
15 Impatiens racemosa 7000 15
16 Leucas ciliata 7500 15
17 Nephrolephis cordifolia 5500 25
18 Persicaria chinensis 6000 20
19 Poa annua 12000 15
20 Polygonum capitatum 12500 20
21 Pteridium aquilinum 7500 25
22 Solanum indicum 5000 15
Summer
1 Adiantum philippense 2500 10
2 Arisaema speciosum 1500 10
3 Begonia griffithiana 2000 15
4 Begonia nepalensis 7500 20
5 Begonia roxburghii 5000 15
6 Bidens pilosa 12500 20
7 Cynodon dactylon 6500 20
8 Elatostema sessile 16000 30
9 Equisetum ramosissimum 4000 10
10 Eupatorium odoratum 2500 5
11 Fagopyrum dibotrys 12000 25
12 Fragaria indica 11000 20
13 Hedychium spicatum 5000 15
14 Impatiens brachycentra 4000 20
15 Impatiens bicornuta 5000 15
16 Majus pumilus 5000 20
17 Oxalis corniculata 6000 10
18 Plantago erosa 6500 20
19 Polygonum capitatum 12000 25
20 Pteridium aquilinum 8000 15
21 Pteris quadriaurita 4000 15
22 Selaginella bryopteris 2000 5
23 Solanum nigrum 2500 20
24 Thysanolaena maxima 9000 20
25 Urena lobata 5000 20
26 Viola diffusa 11000 25
Monsoon
1 Ageratum conyzoides 11000 20
2 Asplenium nidus 5000 15
3 Begonia palmata 6000 20
4 Bidens pilosa 8000 25
5 Chirita bifolia 9000 30
6 Commelina benghlensis 7000 15
7 Dryoathyrium boryanum 2000 15
8 Fragaria indica 7000 15
9 Hedychium spicatum 2500 15
10 Impatiens bicornuta 4000 10
11 Imperata cylindrica 6000 20
12 Justicia khasiana 4000 15
13 Lycopodium clavatum 7500 20
14 Poa annua 5000 15
15 Pogostemon bengalensis 5500 15
16 Polygonum flaccidum 7000 20

Environmental Impact Assessment (EIA) Report of Etalin HE Project
Proponent: M/s Etalin Hydro Electric Power Company Limited (EHEPCL) 7.31
Consultant: RS Envirolink Technologies Pvt. Ltd.
S.
No. Name of Species
Density
(no./ ha)
Frequency
(%)
17 Pratia nummularia 12500 20
18 Solanum indicum 3500 15
19 Themeda anathera 6000 15
20 Thysanolaena maxima 11000 25
7.4.4 Density & Dominance
Density is one of the indicators to assess the dominance of a particular plant species occurring
in a particular area.
The density of trees varied from site to site depending upon elevation and the extent of area
subjected to shifting cultivation in the area current as well as abandoned jhummed area. The
overall tree density throughout the study area ranged from minimum of 336 number of
trees/ha to maximum of 593 trees/ha (Table 7.18 & Figure 7.4). Highest tree density was
recorded near power house site, followed by dam sites of the Dri and Talo (Tangon) River and
lowest was at catchment area of both the rivers.
The shrub layer was quite prominent at all sampling sites and the density of shrub layer
varied from 2940 plants/ha to 4860 plants/ha, lowest density was found at sites located in
catchment area upstream of Dri limb dam site and highest at Dam site on Talo (Tangon) River
(Table 7.18 & Figure 7.5).
The density of herbaceous plant species varied from season to season amongst all sampling
sites (Table 7.18 & Figure 7.6). In winter season herb density is highest at downstream of
power house site (158000 plants/ha) and lowest at downstream of Dri Dam site along the Dri
River (93200 plants/ha). In summer season density of herbs ranged from 135385 to 188800
per ha along the Dri River limb, 135000 to 163182 per ha along Talo (Tangon) River limb;
near Powerhouse area it was 141429; and in downstream of power house after the confluence
of Dri and Talo (Tangon) River it was 168000 per ha. In monsoon season maximum herb
density was observed along the Dri River, ranged from 154286 plants /ha to 172353 plants
/ha. In Talo (Tangon) river limb herb density during monsoon varied in between 129237
plants/ha and 140667 plants/ha. Lowest herb density was recorded from power house
(113889 plants/ha) and downstream area (129500 plants/ha).
Table 7.18: Density (per ha) of Trees, Shrubs and Herbs
Sampling Site
Location
V1 V2 V3 V4 V5 V6 V7 V8
Trees 393 550 457 336 571 536 593 457
Shrubs 2940 3940 3700 3660 4860 4240 4200 4340
Herbs
Winter 120000 104167 93200 121333 110667 134545 98333 158000
Summer 154286 172353 165000 129231 140667 137059 113889 129500
Monsoon 135385 188800 168182 136000 135000 163182 141429 168000
In order to understand the dominance of various species among trees and shrubs, Importance
Value Index (IVI) of most dominant species has been given at Figures 7.7 & 7.8. The tree

Environmental Impact Assessment (EIA) Report of Etalin HE Project
Proponent: M/s Etalin Hydro Electric Power Company Limited (EHEPCL) 7.32
Consultant: RS Envirolink Technologies Pvt. Ltd.
species which recorded IVI value of more than 40 are Albizia lucida (at site V3), A. procera (at
site V1 & V6), Engelhardtia spicata (at site V8), Ficus semicordata (at site V1) and Pinus
merkusii ((at site V1 & V4) (Figure 7.7). Pinus merkusii recorded highest IVI values of 58.53
and 51.03 at sites V4 and V1, respectively. At sites V2, V5 and V7 no single tree species
dominanted the composition. At these sites there were mixture of species that dominated. At
V1 the co-dominant species are Albizia lucida, Engelhardtia spicata, Ficus semicordata,
Macropanax dispermus and Terminalia myriocarpa, at site V5 Albizia lucida, Engelhardtia
spicata, and Ficus semicordata were co-dominant while at site V7 Ficus semicordata,
Castanopsis indica, Saurauia roxburghii and Albizia procera are co-dominant.
Figure 7.4: Variation in Tree Density at different Sampling Locations
Figure 7.5: Variation in Shrub Density at different Sampling Locations
0
100
200
300
400
500
600
V 1 V 2 V 3 V 4 V 5 V 6 V 7 V 8
Dri River Talo (Tangon) River Power HouseArea
No
. of
tre
es/
ha
0
500
1000
1500
2000
2500
3000
3500
4000
4500
5000
V 1 V 2 V 3 V 4 V 5 V 6 V 7 V 8
Dri River Talo (Tangon) River Power HouseArea
De
nsi
ty (
no
. pe
r h
a)

Environmental Impact Assessment (EIA) Report of Etalin HE Project
Proponent: M/s Etalin Hydro Electric Power Company Limited (EHEPCL) 7.33
Consultant: RS Envirolink Technologies Pvt. Ltd.
Figure 7.6: Seasonal variation in density of herbs
Figure 7.7: Importance Value Index of dominant tree species at different sampling locations
0
20000
40000
60000
80000
100000
120000
140000
160000
180000
200000
V 1 V 2 V 3 V 4 V 5 V 6 V 7 V 8
Dri River Talo (Tangon River) Power HouseArea
De
nsi
ty (
No
. pe
r h
a)
Winter Summer Monsoon
0
10
20
30
40
50
60
70
V 1 V 2 V 3 V 4 V 5 V 6 V 7 V 8
Im
po
rta
nce V
alu
e I
nd
ex
Albizia lucida Albizia procera Aralia armata Brassiopsis glomerulata
Castanopsis indica Cyathea spinulosa Engelhardtia spicata Ficus semicordata
Lagerstroemia parviflora Macaranga denticulata Macropanax dispermus Pandanus odoratissma
Pinus merkusii Saurauia roxburghii Terminalia myriocarpa

Environmental Impact Assessment (EIA) Report of Etalin HE Project
Proponent: M/s Etalin Hydro Electric Power Company Limited (EHEPCL) 7.34
Consultant: RS Envirolink Technologies Pvt. Ltd.
Figure 7.8: Importance Value Index of dominant shrub species at different sampling locations
Amongst the shrubs, Dendrocalamus giganteus was the single most doninant species with
high IVI values i.e. more than 50 at 6 out of 8 sampling sites : V1-V2, V4-V7 (Figure 7.8). It
is indicative of jhum cultivation was being practiced at these sites and has recently been
abandoned as the slopes are covered with this bamboo species. At sites V1 & V2 other
bamboo species Bambusa pallida and B. tulda were the most dominant species with high IVI
values. At rest of the three sites too i.e. at sites V3 and V8) these three species of bamboos
(Bambusa pallida, B. tulda and Dendrocalamus giganteus) together constituted majority of
shrub vegetation.
7.4.5 Diversity
To understand the species richness Shannon Weiner Diversity was calculated for trees, shrubs
and herbs, seperately. The species diversity in tree and shrub was moderately high at all the
sampling locations as the Diversity Index ranged from lowest of 2.38 (Shrubs at Site V1) to
highest of 3.06 (at Site V7) (Table 7.19, Figure 7.9). However the species diversity in
general was very high at majority of the sampling locations, during all seasonal surveys. It
varied from lowest of 2.62 at Site V1 during winter to highest of 3.34 at Site V2 during pre-
monsoon sampling (Table 7.19 & Figure 7.10). In general the Shannon Weiner Index was
recorded around 3 at most of the sites during all seasons.
Table 7.19: Shannon Weiner Diversity Index (H)
Diversity Dri River
Talo (Tangon)
River
Power House
Area
V1 V2 V3 V4 V5 V6 V7 V8
Trees 2.40 2.79 2.71 2.46 2.69 2.61 2.93 2.72
Shrubs 2.38 2.78 2.56 2.65 2.88 2.60 3.06 2.83
Herbs
Winter 2.62 3.17 3.14 2.88 2.92 3.22 3.01 3.02
Summer 3.23 3.34 3.19 3.02 3.12 3.28 3.27 3.09
Monsoon 3.14 3.22 3.04 2.96 3.04 2.96 2.97 2.91
0.00
10.00
20.00
30.00
40.00
50.00
60.00
70.00
80.00
90.00
100.00
V 1 V 2 V 3 V 4 V 5 V 6 V 7 V 8
Im
po
rta
nce V
alu
e I
nd
ex
Angiopteris evecta Bambusa pallida Bambusa tuldaCassia occidentalis Dendrocalamus gigantea Dendrocalamus hamiltoniiFicus heterophylla Hydrangea serrata Musa acuminataMusa balbasiana Myrsine semiserrata Oxyspora paniculataPhragmites karka Piper clarkei Rubus ellipticusRubus foliolosus Saccharum spontaneum Trevesia palmata

Environmental Impact Assessment (EIA) Report of Etalin HE Project
Proponent: M/s Etalin Hydro Electric Power Company Limited (EHEPCL) 7.35
Consultant: RS Envirolink Technologies Pvt. Ltd.
Figure 7.9: Species Diversity Index (H) of Trees and Shrubs
Figure 7.10: Species Diversity Index (H) of Herbs
Evenness Index (E) was calculated by using Evenness Index Formula and is indicative of
distribution pattern of vegetation in any area. Amongst the tree species the evenness index
ranged between 0.93 and 0.98 indicating highly regular distribution pattern at all locations
(Table 7.20). The shrubs too were evenly distributed at all the sites (Table 7.20). The
herbaceous species were also found to be evenly distributed at all the sites during seasons
(Table 7.20).
Table 7.20: Evenness Index (E)
V1 V2 V3 V4 V5 V6 V7 V8
Trees 0.93 0.98 0.96 0.96 0.97 0.96 0.98 0.96
Shrubs 0.93 0.91 0.92 0.95 0.93 0.92 0.96 0.94
Herbs
Winter 0.97 0.96 0.96 0.96 0.97 0.97 0.97 0.98
Summer 0.96 0.95 0.95 0.96 0.98 0.96 0.95 0.95
Monsoon 0.97 0.96 0.94 0.92 0.97 0.95 0.96 0.97
0.00
0.50
1.00
1.50
2.00
2.50
3.00
3.50
0.00
0.50
1.00
1.50
2.00
2.50
3.00
3.50
V 1 V 2 V 3 V 4 V 5 V 6 V 7 V 8
Dri River Tangon River Power HouseArea
Shru
b D
ive
rsit
y
Tre
e D
ive
rist
y
Sampling Location
Tree
Shrub
Talo ( )
Talo ( )

Environmental Impact Assessment (EIA) Report of Etalin HE Project
Proponent: M/s Etalin Hydro Electric Power Company Limited (EHEPCL) 7.36
Consultant: RS Envirolink Technologies Pvt. Ltd.
7.4.6 Economically Important Plant Species
During the field survey, numbers of economically important plant species were recorded from
the study area. The local people utilise various plants species in their day to day life. Mainly
plants are used as timber, fuel wood, and fodder, vegetable, medicinal, thatching and wild
edible. Knowledgeable and elder persons of study area villages were interviewed and
information on plants parts (seed, bark, leaf & root) used and indigenous knowledge was
gathered. Secondary information was also collected to know the ethnobotanical importance of
the region. Some of the plant species used by local people for various purposes like timber,
fuel wood, wild edible plants, medicine found in the study area have been given in Tables
7.21-7.23.
Nearly 13 species are most commonly used by local inhabitants for timber, fodder and fuel
wood (Table 7.21).
Table 21: Plant Species used as timber, fodder and fuel wood
S. No. Plant name Uses
1 Altingia excelsa Timber
2 Bambusa pallida Timber
3 Calamus erectus Thatch
4 Dendrocalamus hamiltonii Timber
5 Duabanga grandiflora Timber
6 Ficus roxburghii Fodder, fruits edible
7 Kydia calycina Timber
8 Macaranga denticulata Fuel
9 Pandanus odoratissima Fibre
10 Pinus merkusii Timber
11 Saurauia nepalensis Fodder
12 Terminalia myriocarpa Timber
13 Thysanolaena maxima Broom, fodder
Dibang valley area is mainly inhabited by Idu-mishmi tribe communities. They used various
plant species for curing various diseases and ailments. Some of the most frequently used
medicinal plants species along with their medicinal uses found in the study area are given in
Table 7.22.
Table 22: Commonly used plants species for medicinal purposes in the area
S. No. Plant name Uses Part/s used
1 Abroma angusta Cut and wounds, dysentery
and vomiting, leucorrhoea Leaf, root and stem
2 Achyranthes bidentata Diuretic and astringent Whole plant
3 Acorus calamus Brain tonic, coolant and colic Rhizome, tubers
4 Allium sativum
Infusion of Zanthoxylum
armatum seeds with its bulb
for stomach bloating
Bulb
5 Angiopteris evecta Antidysenteric and
antidiarrhoeic Rhizome
6 Alpinia allughas Rheumatism and fish poison Fruit and seeds
7 Andrographis paniculata Diarrhoea, malaria and
stomach trouble Leaf and whole plant

Environmental Impact Assessment (EIA) Report of Etalin HE Project
Proponent: M/s Etalin Hydro Electric Power Company Limited (EHEPCL) 7.37
Consultant: RS Envirolink Technologies Pvt. Ltd.
S. No. Plant name Uses Part/s used
8 Artemisia nilagirica Wound healing, nose bleeding
and muscular pain Leaves
9 Berberis aristata Diabetes, jaundice and
leucoderma Root
10 Calamus erectus Indigestion and stomach
problem Seeds, leaf
11 Cannabis sativa Digestion and dysentery Leaves
12 Centela asiatica Stomachache, diabetes, blood
disorders and brain tonic Whole plant
13 Cinnamom camphora Diarrhoea and skin diseases Leaf
14 Citrus limon
Digestive, dysentery,
dehydration and stomachic
trouble
Fruit
15 Coptis teeta
Improvement of appetite,
jaundice, malarial fever, worm
infestation, cold, cough,
hypertension and diabetes
Root/rhizome
16 Curcuma longa Body pain Rhizome
17 Dioscorea bulbifera Aphrodisiac and tonic Root
18 Engelthardtia spicata Skin diseases, fish poison Bark
19 Ficus relegiosa Ulcer Bark
20 Girardinia diversifolia Diabetes Leaves
21 Hedychium spicatum Joint pain, injury and wound
healing Rhizome
22 Oroxylum indicum For fever and other ailments Bark
23 Piper betle Various ailments Fruits
24 Plantago major Wound healing Whole plant
25 Psidium guajava Dysentery Stem
26 Ricinus communis Constipation, rheumatism Seed
27 Solanum nigrum Liver diseases, dyspepsia,
fever and diarrhoea Fruit
28 Zanthoxylum armatum Digestive, tootache Seed and bark
29 Zingiber officinale Cold and cough, ulcer Rhizome
In addition to medicinal and other uses there are number of wild edible plants that are used
as food by locals and list of the same is given at Table 7.23.
Table 23: Commonly used wild plants species as food
S. No. Name of species Local name
1 Bambusa pallida Dibang
2 Begonia palmata -
3 Centella asiatica Kipum
4 Choerospondias axillaris -
5 Clerodendrum colebrookianum Papa tsitsu
6 Coix lacryma-jobi -
7 Deeringia amaranthoides -
8 Dendrocalamus hamiltonii Epo
9 Dillenia indica Sampa
10 Elaeocarpus floribundus -
11 Hovenia dulcis -
12 Mangifera sylvatica Aru
13 Paedaria foetida Bhidailota
14 Sarcochlamys pulcherrima -
15 Solanum nigrum Koitang
16 Spilanthus paniculata Marsang
17 Spondias pinnata Hitum
18 Sterculia hamiltonii -
19 Syzygium cumini -

Environmental Impact Assessment (EIA) Report of Etalin HE Project
Proponent: M/s Etalin Hydro Electric Power Company Limited (EHEPCL) 7.38
Consultant: RS Envirolink Technologies Pvt. Ltd.
7.4.7 Rare & Endangered Flora
An assessment of plant species found in the study area was made using IUCN Redlist Ver3.01.
According to this only one species i.e. Lagerstroemia minuticarpa of Lythraceae has been
categorized as Endangered (EN). Though it has been listed as Endangered, it has been stated
that its status needs updating. This species has been considered as Rare by some authors but
it is has been regularly found in most of the valleys of Arunachal Pradesh. However none of its
plants were recorded in the quadrat studies. During the surveys another related species
Lagerstroemia parviflora was regularly recorded in the quadrats at sites V2, V3 and V6.
Another species Pinus merkusii has been put in Vulnerable category needing updating and it
was regularly found in most of the quadrats studied at most of the sampling sites and was
found as dominant species at these locations. Amongst rest of the species found in the area
none of them fall under any RET category as either they are listed under Least Concern (LC)
category or have been listed as Not Evaluated (NE) category. According to Red Data Book of
published by Botanical Survey of India (BSI), Livistona jenkinsiana is under Endangered
category, Coptis teeta and Cymbidium eberneum are under Vulnerable category. Angiopteris
evecta, a fern also has been listed under Endangered category by some authors.
Calamus leptospadix, Coptis teeta, Cymbidium eberneum and Livistona jenkinsiana are
endemic to Arunachal Pradesh. Dendrobium hookerianum of Orchidaceae and Lagerstroemia
minuticarpa belonging to Lythraceae are endemic to north-east India.
Appropriate measures have been suggested in Biodiversity Conservation Plan prepared under
overall Environmental Management Plan (EMP) for their conservation and adopting mitigation
measures for their protection during construction of the project.
7.5 TERRESTRIAL FAUNA
A three season study was carried out to describe the faunal elements in the region. The
fauna of catchment area is discussed briefly with the help of primary survey and secondary
sources.
7.5.1 Mammals
To study the wild mammalian fauna of the study area, 2 - 5 km long transects and trails were
walked at early morning and evening hours. Direct sighting of animals as well as indirect signs
like scat, pellets, pugmarks, scraps, vocalizations, horns etc. were also recorded during the
survey walk. On each transect, the group size, age and sex and distance of animal/ group
from transect was noted and the locations were marked with the help of a hand held GPS.
Four to five separate walks were done along Dri and Talo (Tangon) Rivers to collect
information on riverine tract. Secondary data as well as information elicited from the locals
were also noted for the presence or absence of wild animals in the area. These indirect
evidences and information were analyzed and checked with the help of literature available.
During the surveys only 5 mammalian species belonging to 5 orders in the study could be
sighted (Table 7.24). The Jungle cat was observed near Punli village, a troop of Assam
Macaque were sighted near dam site at Dri river, Himalayan Striped Squirrel was sighted on a
tree (Pterospermum acerifolium) near powerhouse site, Mithun was found in the wild or semi

Environmental Impact Assessment (EIA) Report of Etalin HE Project
Proponent: M/s Etalin Hydro Electric Power Company Limited (EHEPCL) 7.39
Consultant: RS Envirolink Technologies Pvt. Ltd.
domesticated forms near villages and road side while the House Bat was recorded near Etalin
village during evening hours.
However, according to the list prepared based upon secondary data 26 species of mammals
are reported from the area and list of the same is given at Table 7.25.
Table7.24: Mammalian species sighted in the study area
S. No./ Order Common name Scientific name WPA
1972
IUCN Ver 3.1
Carnivora
1 Jungle Cat Felis chaus II LC
Primates
2 Assam macaque Macaca assamensis II NT
Rodentia
3 Himalayan Striped Squirrel Tamiops macClellandi - LC
Artiodactyla
4 Mithun Bos frontalis - -
Chiroptera
5 House Bat Eptesicus hottentotus - LC
VU – Vulnerable; NT- Near Threatened; LC - Least concern
Table 7.25: Mammalian species reported from the study area*
S.
No. Family Scientific name Common name
Conservation Status
IUCN Ver. 3.1
WPA Schedule
ORDER: ARTIODACTYLA
Bovidae
1 Naemorhedus goral Goral NT III
2 Bos frontalis Mithun - -
3 Budorcas taxicolor Mishmi takin VU I
Cervidae
4 Cervus unicolor Sambar VU III
5 Muntiacus muntjak Barking deer LC III
Suidae
6 Sus scrofa Wild boar LC III
ORDER: CARNIVORA
Ailuridae
7 Ailurus fulgens Red Panda VU I
Canidae
8 Cuon alpinus Wild Dog EN II
9 Canis aureus Jackal LC II
10 Vulpes bengalensis Indian fox LC IV
Felidae
11 Panthera pardus Leopard VU I
12 Felis chaus Jungle Cat LC II
13 Prionailurus viverrinus Fishing Cat EN I
Herpestidae
14 Herpestes javanicus Indian Mongoose LC IV
Ursidae
15 Ursus thibetanus Asiatic black bear VU II
Viverridae
16 Viverra zibetha Large Indian Civet NT II
17 Viverricula indica Small Indian Civet LC II
ORDER: CHIROPTERA
Vespertilionidae
18 Scotophilus heathi Common yellow bat LC IV
19 Eptesicus hottentotus House Bat LC -
ORDER: LAGOMORPHA
Leporidae

Environmental Impact Assessment (EIA) Report of Etalin HE Project
Proponent: M/s Etalin Hydro Electric Power Company Limited (EHEPCL) 7.40
Consultant: RS Envirolink Technologies Pvt. Ltd.
20 Lepus nigricollis Indian Hare LC IV
ORDER: PHOLIDOTA
Manidae
21 Manis crassicaudata Indian Pangolin NT I
ORDER: PRIMATES
Cercopithecidae
22 Macaca mulatta Rhesus monkey LC II
ORDER: RODENTIA
Hystricidae
23 Hystrix indica Indian Crested Porcupine - IV
Muridae
24 Rattus nitidus Himalayan rat LC IV
Sciuridae
25 Callosciurus pygerythrus Hoary-bellied Squirrel LC II
26 Tamiops macClellandi Himalayan Striped Squirrel LC -
*Source: Secondary data; VU – Vulnerable; EN – Endangered; NT- Near Threatened; LC - Least
Concern
Mithun (Bos frontalis): The mithun is a domesticated form of Gaur. This unique livestock
species is found in the steep slopes of the hills North-east India, Bhutan, Myanmar and China
and is considered to be a descendent of wild gaur. This animal has religious significance and is
intimately related to the socio-cultural life of the Mishmi people. The mithun is considered to
be a source of personal prestige with an economic value far in excess of the material
contribution. Mithuns are considered a unit of wealth and are allowed to move freely in jungle
till used for food on festive occasions or for barter.
7.5.2 Avifauna
As discussed in Methodology Chapter 3 of this report, the survey for birds was carried out on
a fixed width trails of 2 km wherever the terrain permits and point counts were carried out at
a fixed distances at more or less regular intervals. Birds were identified as per the field guide
of Ali & Ripley (1983), Grimmeth and Flaming et al. (1984), Krys Kazmierczak (2006) and
Grimmeth (2007).
The surveys showed the presence of barbets, hornbills, trogon, swiftlet, treepie, drongo,
thrushes, redstart, flycatcher, tits, bulbul, wagtails, forktails, munia, etc. 33 species of bird
species belonging to 22 families inhabit these areas. The sighting of Plumbeous Water
Redstart, White Capped Water Redstart and Brown Dipper recorded mostly near the water
body like river and nalas while other birds were observed in forest area. A single sighting of
the Great Hornbill, Buceros bicornis was also recorded near Etalin village at morning hours
during the visit. List of bird species composition and their conservation status has been
described in Table 7.26.
Table7.26: List of birds sighted from the study area and their conservation status
S.
No. Family / Scientific
Name Common Name
Conservation status
IUCN
(ver 3.1) WPA 1972
Megalaimidae
1 Megalaima asiatica Blue-throated Barbet LC Schedule IV
Bucerotidae
2 Buceros bicornis Great Hornbill NT Schedule I
Trogonidae
3 Harpactes
erythrocephalus
Red Headed Trogon LC Schedule IV

Environmental Impact Assessment (EIA) Report of Etalin HE Project
Proponent: M/s Etalin Hydro Electric Power Company Limited (EHEPCL) 7.41
Consultant: RS Envirolink Technologies Pvt. Ltd.
S.
No. Family / Scientific
Name Common Name
Conservation status
IUCN
(ver 3.1) WPA 1972
Cuculidae
4 Centropus sinensis Greater coucal LC Schedule IV
Apodidae
5 Collocalia brevirostris Himalayan Swiftlet LC -
Accipitridae
6 Spilornis cheela Crested Serpent Eagle LC Schedule I
Corvidae
7 Dendrocitta formosae Grey Treepie LC Schedule IV
Dicruridae
8 Dicrurus macrocercus Black Drongo LC Schedule IV
9 Dicrurus aeneus Bronzed Drongo LC Schedule IV
Cinclidae
10 Cinclus pallasii Brown Dipper LC -
Campephagidae
11 Pericrocotus ethologus Long tailed Minivet LC Schedule IV
Muscicapidae
12 Monticola solitarius Blue Rock Thrush LC Schedule IV
13 Phoenicurus hodgsoni Hodgson's Redstart LC Schedule IV
14 Enicurus scouleri Little Forktail LC Schedule IV
15 Ficedula westermanni Little pied Flycatcher LC Schedule IV
16 Rhyacornis fuliginosa Plumbeous Water
Redstart
LC Schedule IV
17 Enicurus maculatus Spotted Forktail LC Schedule IV
18 Chaimarrornis
leucocephalus
White capped Water
Redstart
LC Schedule IV
Sturnidae
19 Acridotheres tristis Common Myna LC Schedule IV
Paridae
20 Parus monticolus Green backed Tit LC Schedule IV
Pycnonotidae
21 Hypsepetes
leucocephalus
Black Bulbul LC Schedule IV
22 Pycnonotus jocosus Red whiskered Bulbul LC Schedule IV
23 Pycnonotus cafer Red-vented Bulbul LC Schedule IV
Cisticolidae
24 Orthotomus sutorius Common Tailor Bird LC Schedule IV
Timaliidae
25 Garrulax leucolophus White crested
Laughingthrush
LC Schedule IV
Chloropseidae
26 Chloropsis hardwickii Orange bellied Leafbird LC Schedule IV
Passeridae
27 Passer montanus Eurasian tree sparrow LC Schedule IV
Motacillidae
28 Motacilla cinerea Grey Wagtail LC Schedule IV
29 Anthus hodgsoni Olive backed Pipit LC Schedule IV
30 Motacilla alba White Wagtail LC Schedule IV
Estrildidae
31 Lonchura punctulata Scaly-breasted Munia LC Schedule IV
Turdidae
32 Myophonus caeruleus Blue Whistling Thrush LC Schedule IV
Rhipiduridae
33 Rhipidura hypoxantha Yellow bellied Faintail LC Schedule IV
VU – Vulnerable; NT- Near Threatened; LC - Least Concern

Environmental Impact Assessment (EIA) Report of Etalin HE Project
Proponent: M/s Etalin Hydro Electric Power Company Limited (EHEPCL) 7.42
Consultant: RS Envirolink Technologies Pvt. Ltd.
7.5.3 Herpetofauna
The herpetofauna were sampled on the same transect marked for mammals. During the
survey there were no direct sightings of any herpetofauna in the study area. Following species
of reptiles and lizards are reported from the study area as per discussion with locals and
secondary data source of the area (Table 7.27). In all 11 species of reptiles and lizards are
reported from the study area and these belong to 9 families.
Table 7.27: Herpetofaunal composition of the Study area
S. No. Family Common Name Scientific Name
1 Colubridae Green Trinket Snake Elaphe prasina
2 Colubridae Rat Snake Ptyas mucosa
3 Pythonidae Burmese Python Python molurus bivittatus
4 Hydrophiidae King Cobra Ophiophagus hannah
5 Elapidae Monocled cobra Naja naja kaouthia
6 Viperidae Mountain Pit Viper Ovophis monticola
7 Agamidae Common calotes Calotes versicolor
8 Agamidae Blue throated Forest lizard Ptyctolaemus gularis
9 Gekkonidae Spiny tailed House Gecko Hemidactylus frenatus
10 Scincidae Speckled little Sun skink Mabuya macularia macularia
11 Varanidae Common Asian Monitor Varanus bengalensis
In addition, 5 species of amphibian are also reported from the area and a list of the same is
given at Table 7.28.
Table 7.28: List of commonly found amphibians in the area
S. No. Common Name Scientific Name
1. Amolops formosus Assam Sucker Frog
2. Duttaphrynus himalayanus Himalayan Broad-skulled Toad
3. Duttaphrynus melanostictus Common Indian Toad
4. Euphlyctis cyanophlyctis Indian Skipper Frog / Skittering Frog
5. Fejervarya limnocharis Cricket Frog
7.5.4 Insects
The insects including butterflies are common in the area and are sighted throughout the study
period. The presence of the insects was abundant in monsoon and summer season however
their availability was less in winter months. This might be by the influence of cold weather
which forces them to migrate and hibernate. Insects have a variety of methods for surviving
the coldness of winter. Hibernation is a well-known natural phenomenon among insects. In
general, insects are able to survive cold temperatures easiest when the temperatures are
stable, not fluctuating through alternate thaws and freezes. Many insects can gain shelter and
nourishment through the winter in a variety of microhabitats. Among these niches are under
the soil, inside the wood of logs and trees, and even in plant galls.

Environmental Impact Assessment (EIA) Report of Etalin HE Project
Proponent: M/s Etalin Hydro Electric Power Company Limited (EHEPCL) 7.43
Consultant: RS Envirolink Technologies Pvt. Ltd.
Overwintering into different stages larvae, nymphs, eggs, pupae, or as adults of insect life is
very common. Many large wasps seek shelter in the eaves and attics of houses or barns. Tree
holes, leaf litter, and under logs and rocks are common shelters for overwintering adult
insects. A list of insects compiled from primary surveys as well as secondary sources is given
at Table 7.29. Total 18 insect species are reported from the study area.
Moths were recorded from the residential areas of Etalin and Yuron villages the species of
which could not be identified. Some other insects like Pyrrhocorid and Coreid Bugs, and Blue
Bottle Fly, were also recorded from the forests of the study area.
Table 7.29: Insects found in the Study Area
S. No. Family Common Name Scientific Name
1 Acrididae Grasshoper Heteracris sp.
2 Acrididae Grasshoper Stenopola sp.
3 Apidae Honey Bee Apis sp.
4 Calliphoridae Blue Bottle Fly Phormia sp.
5 Cerambycidae Red Ants Oecophyla smaragelina
6 Cicadidae Cicada Cicada sp.
7 Coccinellidae Longicorn beetle Rhytidodera sp.
8 Coccinellidae Red Beetle Chrysolina sp.
9 Coreidae Coreid Bug Coreus sp.
10 Gerridae Gerris Aquarius remigis
11 Libellulidae Black Stream Glider Trithemis festiva
12 Libellulidae Crimson-tailed Marsh Hawk Orthetrum pruinosum
13 Libellulidae Ruddy Marsh Skimmer Crocothemis servilia
14 Phasmidae Stick Insect Ctenomorpha chronus
15 Pyrrhocoridae Pyrrhocorid Bug Pyrrhocoridae sp.
16 Syrphidae Fly Asarkina sp.
17 Theridiidae House Spider Parasteatoda tepidariorum
18 Vespidae Wasp Vespula vulgaris
A large number of butterfly species forage specific host plant for nectar, shelter and to spawn,
while large numbers of species congregate on damp and moist places near streams for water
and salt. Some species are attracted in large numbers of rotting or over ripe fruits, animal
dung and birds‟ droppings. They inhabit open ground, sheltered and shaded areas, among
bushes and over the tree. The area is rich in the diversity and density of butterflies. A total of
45 species of butterflies belonging to 6 families were recorded (Table 7.30) from the
surroundings of proposed project area. Nymphalidae was the most represented family with 16
species followed by Lycaenidae with 13 species. Among the butterflies, Indian Cabbage White
(Pieris canidia indica) was most dominant at all sites while, others were observed only at two
or three sites of the study area.
Table 7.30: List of butterflies/insects recorded from the study area
S. No. Family Common name Scientific name
1 Hesperiidae Blank Swift Caltoris kumara
2
Common Grass Dart Taractrocera maevius
3 Lycaenidae Albocerulean Celastrina albocoeruleus
4
Angled Pierrot Caleta caleta decidia
5
Centaur Oakblue Arhopala centaurus
6
Common Cerulean Jamides celeno

Environmental Impact Assessment (EIA) Report of Etalin HE Project
Proponent: M/s Etalin Hydro Electric Power Company Limited (EHEPCL) 7.44
Consultant: RS Envirolink Technologies Pvt. Ltd.
S. No. Family Common name Scientific name
7
Common Hedge Blue Celastrina cardia
8
Dark Caerulean Jamides bochus
9
Dark Pierrot Tarucus ananda
10
Glistening cerulean Lampides kankena
11
Pale Hedge Blue Celastrina cardia
12
Peablue Lampides boeticus
13
Pointed Lineblue Nacaduba helicon
14
Purple Sapphire Heliophorus epicles indicus
15
Small Copper Lycaena phlaeas
16 Nymphalidae Black Prince Rohana parisatis
17
Chocolate Soldier Precis iphita iphita
18
Circe Hestina nama
19
Club Beak Libythea myrrha
20
Common Map Cyrestis thyodamas
21
Common Sailer Neptis hylas
22
Common Threering Ypthima asterope
23
Dark- glassy Tiger Parantica agleoides
24
Dwarf Crow Euploea tulliolus
25
Indian Fritillary Argynnis hyperbius
26
Large Three-Ring Ypthima newara
27
Large Yeoman Cirrochroa aoris
28
Lemon Pansy Precis lemonias
29
Orange Oakleaf Kallima inachus
30
Siren Hestina persimilis
31
Yellow Pansy Precis hierta
32 Papilionidae Common Bluebottle Graphium sarpedon
33
Fourbar swordtail Graphium agetes
34
Great Mormon Princeps memnon agenor
35
Paris Peacock Princeps paris
36
Redbreast Princeps alcmenor
37 Pieridae Indian Cabbage White Pieris canidia indica
38
Mottled Emigrant Catopsilia pyranthe
39
Painted Jazebel Delias hyparete
40
Plain Sulphur Dercas lycoris lycoris
41
Red-breast Jezebel Delias thysbe
42
Redspot Jazebel Delias descombesi
43
Spotted Sawtooth Prioneris thestylis
44
Yellow Orangetip Ixias pyrene
45 Riodinidae Punchinello Zemeros flegyas
Some of the species like Common threering (Ypthima asterope), Dark caerulean (Jamides
elips palissa), Dwarf crow (Euploea tulliolus), Indian fritillary (Argynnis hyperbius) and
Punchinello (Zemeros flegyas) were very common and found during all three seasons in the
study area. Sighting was very good during the pre-monsoon season survey however migration
and hibernation cause sharp decrease in population and diversity during winter season.

Environmental Impact Assessment (EIA) Report of Etalin HE Project
Proponent: M/s Etalin Hydro Electric Power Company Limited (EHEPCL) 7.45
Consultant: RS Envirolink Technologies Pvt. Ltd.
7.5.5 Threatened and Endangered Fauna
Only one of the mammals which were sighted in the study area fall under the category RET
fauna. Assam macaque (Macaca assamensis) is a Near Threatened species as per IUCN and
falls under Schedule II as per Wildlife (Protection) Act 1972 (see Table 7.24). One of the
main reasons that has cited for its decreasing populations is human-macaque interaction by
way of crop raiding. It is known to prefer crops like potato, wheat, maize, millets, etc. This
human interaction invariably leads to their killing as they cause loss of crops to the farmers.
The animals resort to crop raiding as their habitat has been shrinking by cutting of trees for
firewood, and forest clearing due to jhum cultivation.
According to list prepared from secondary data two species Prionalurus viverrinus (Fishing
cat) and Cuon alpinus (Wild dog) are listed under Endangered catergory in IUCN Redlist Ver
3.1 (see Table 7.25) while 5 species are under Vulnerable category namely, Panthera pardus
(Leopard), Cervus unicolor (Sambar), Ailurus fulgens (Red panda), Budorcas taxicolor (Mishmi
takin) and Ursus thibetanus (Asiatic black bear). Three species i.e. Goral (Naemorhedus
goral), Indian pangolin (Manis crassicaudata) and Large Indian civet (Viverra zibetha) are
under Near Threatened category.
According to WPA (1972) five species fall under Schedule-I viz. Panthera pardus (Leopard),
Prionalurus viverrinus (Fishing cat), Aliurus fulgens (Red panda), Budorcas taxicolor (Mishmi
takin) and Manis crassicaudata (Indian pangolin). Eight species fall under Schedule-II. Among
rest of the species 5 are under Schedule-III while 2 are under Schedule-IV.
Regarding the Fishing cat though according to secondary data it has been included in the list
however its habitat is wetland and lowlands in Himalayan foothills. Therefore its presence in
the study is highly unlikely. Nothwithstanding one of the reasons for its dwindling populations
is pollution of wetlands, forest clearance, excessive hunting and fishing. Similarly regarding
other RET species reported from the area like Mishmi takin, Wild dog, Leopard, Red panda and
Indian pangolin habitat degradation and fragmentation, prey loss, snaring, and conflict with
livestock are cited as some of the major causes for their decreasing populations.
Amongst birds except for Great Hornbill (Buceros bicornis) which is listed Near Threatened
category as per IUCN Redlist Ver 3.1, all the birds recorded from the study area belong to
Least Concern category (Table 7.26). As per the Wildlife (Protection) Act 1972 only two bird
species fall under Schedule I i.e. Great Hornbill and Crested Serpent Eagle (see Table 7.26).
Dibang Wildlife Sanctuary is situated at a distance of about 20 km from the project site.
7.6 WATER QUALITY
Three season study were carried out along the Dri & Talo (Tangon) Rivers and perennial nalas
for the evaluation of water and limnological parameters. Sampling locations for water
sampling have been shown in in Figure 7.11.
The details of methodology have already been discussed in Chapter 3 on Methodology.

Environmental Impact Assessment (EIA) Report of Etalin HE Project
Proponent: M/s Etalin Hydro Electric Power Company Limited (EHEPCL) 7.46
Consultant: RS Envirolink Technologies Pvt. Ltd.
7.6.1 Physico–chemical Characteristics
The physico-chemical nature of river water depends upon number of factors like the
hydrological and geological nature of the watershed, the soil and the type of vegetation it
supports and a variety of biological processes both within and outside river.
Water temperature is one of the important ecological factors which play an important role in
the distribution of organisms. The temperature of the river water fluctuated from 9C to 12C
in the winter, 10C to 15C in summer and 15C to 25C in monsoon season. Electrical
conductivity (EC) which is a measure of the ability of water to conduct an electric current and
it mainly depends on concentration of the ions dissolved in water ranged from 20 to 145
µS/cm. Turbidity of surface water tends to increase during runoff events as a result of
increased overland flow, stream flow and erosion. The turbidity levels were almost nil in
winter and summer seasons while in monsoon it was found in the range of 8 to 10 NTU,
however, it has been reported nil at few sites in monsoon (refer Table 7.26).
The pH of river water was observed to be neutral to slightly alkaline in nature and recorded
6.9 to 7.8. Dissolved oxygen in water depends on the temperature and concentration of
various ions. The dissolved oxygen of the river water is quite higher and measured from 9.1
to 11.8 mg/l. The water was soft in nature and total hardness was found between 8 to 48
mg/l in water samples collected from various sites. Nitrate and phosphate concentrations was
quite lower at all the sites and shown in the range of 0.021 – 1.41 and <0.004 – 0.05 mg/l
respectively. The details of physico-chemical characteristics of water are given in Tables 7.31
– 7.33.
7.6.2 Biological Characteristics
Rock surfaces, plant surfaces, leaf debris, logs, silt and sandy sediments and all other spaces
in the stream provide habitats for different organisms. According to these habitats, organisms
are divided into plankton, benthos, nektons and neuston. River water was rich in all biotic
components. The photomicrographs of some of the diatoms and other algae are given at
Plates 7.1 & 7.2. The descrition of various biological components is given in the following
paragraphs.
7.6.2.1 Periphyton
In all total, 58 species of periphyton were identified in the samples collected from proposed
hydroelectric project study area. The periphyton community comprised of 7 species of
Chlorophyceae, 15 species of Cyanophyceae and 36 species of Bacillariophyceae (Table
7.34). The total number of taxa recorded during different seasons varied from 31 in
monsoon and 49 in pre-monsoon 41 in winter season. Among Bacillariophyceae 23, 34 and 20
species were recorded during winter, pre-monsoon and mosoon surveys, respectively. Most
common species are Achnanthidium biasolettianum var. biasolettianum, Achnanthidium
minutissimum var. minutissimum, Cocconeis placentula var. euglypta, Cocconeis placentula
var. lineata, Cocconeis placentula var. placentula, Diatoma mesodon and Planothidium
lanceolata var. elliptica.

Environmental Impact Assessment (EIA) Report of Etalin HE Project
Proponent: M/s Etalin Hydro Electric Power Company Limited (EHEPCL) 7.47
Consultant: RS Envirolink Technologies Pvt. Ltd.
Figure 7.11 : Location of sites for water sampling
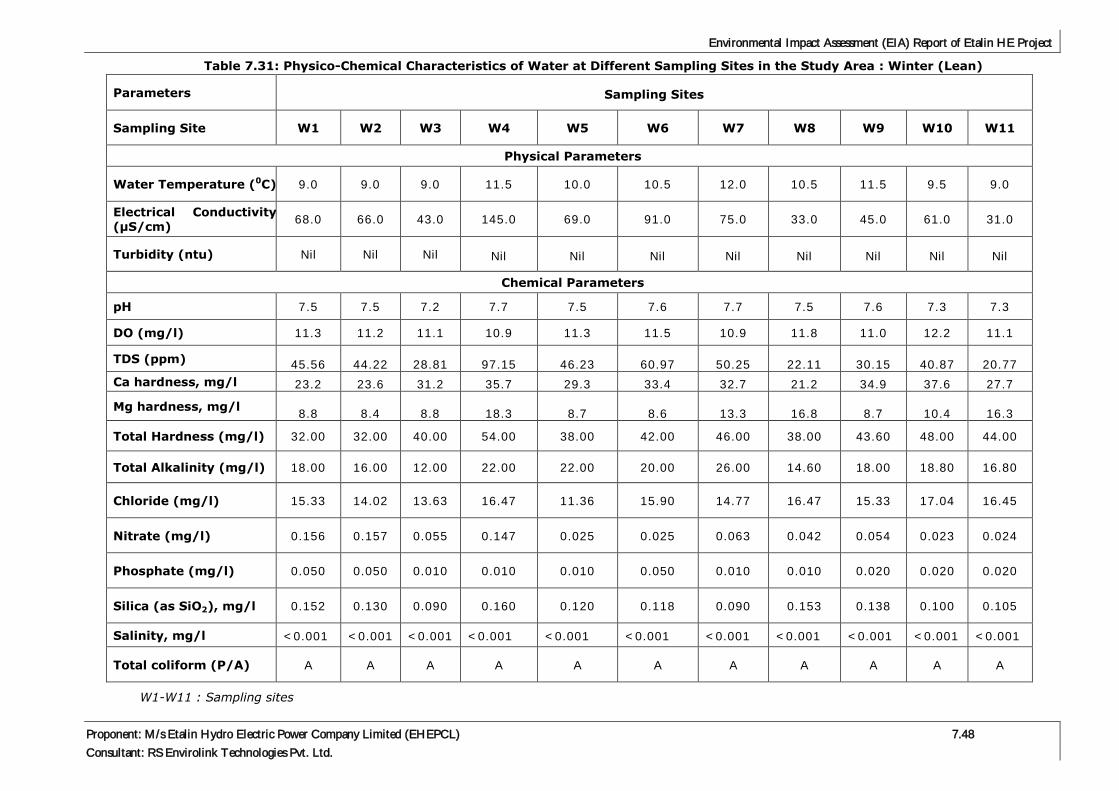
Environmental Impact Assessment (EIA) Report of Etalin HE Project
Proponent: M/s Etalin Hydro Electric Power Company Limited (EHEPCL) 7.48
Consultant: RS Envirolink Technologies Pvt. Ltd.
Table 7.31: Physico-Chemical Characteristics of Water at Different Sampling Sites in the Study Area : Winter (Lean)
Parameters Sampling Sites
Sampling Site W1 W2 W3 W4 W5 W6 W7 W8 W9 W10 W11
Physical Parameters
Water Temperature (0C) 9.0 9.0 9.0 11.5 10.0 10.5 12.0 10.5 11.5 9.5 9.0
Electrical Conductivity
(µS/cm) 68.0 66.0 43.0 145.0 69.0 91.0 75.0 33.0 45.0 61.0 31.0
Turbidity (ntu) Nil Nil Nil Nil Nil Nil Nil Nil Nil Nil Nil
Chemical Parameters
pH 7.5 7.5 7.2 7.7 7.5 7.6 7.7 7.5 7.6 7.3 7.3
DO (mg/l) 11.3 11.2 11.1 10.9 11.3 11.5 10.9 11.8 11.0 12.2 11.1
TDS (ppm) 45.56 44.22 28.81 97.15 46.23 60.97 50.25 22.11 30.15 40.87 20.77
Ca hardness, mg/l 23.2 23.6 31.2 35.7 29.3 33.4 32.7 21.2 34.9 37.6 27.7
Mg hardness, mg/l 8.8 8.4 8.8 18.3 8.7 8.6 13.3 16.8 8.7 10.4 16.3
Total Hardness (mg/l) 32.00 32.00 40.00 54.00 38.00 42.00 46.00 38.00 43.60 48.00 44.00
Total Alkalinity (mg/l) 18.00 16.00 12.00 22.00 22.00 20.00 26.00 14.60 18.00 18.80 16.80
Chloride (mg/l) 15.33 14.02 13.63 16.47 11.36 15.90 14.77 16.47 15.33 17.04 16.45
Nitrate (mg/l) 0.156 0.157 0.055 0.147 0.025 0.025 0.063 0.042 0.054 0.023 0.024
Phosphate (mg/l) 0.050 0.050 0.010 0.010 0.010 0.050 0.010 0.010 0.020 0.020 0.020
Silica (as SiO2), mg/l 0.152 0.130 0.090 0.160 0.120 0.118 0.090 0.153 0.138 0.100 0.105
Salinity, mg/l <0.001 <0.001 <0.001 <0.001 <0.001 <0.001 <0.001 <0.001 <0.001 <0.001 <0.001
Total coliform (P/A) A A A A A A A A A A A
W1-W11 : Sampling sites

Environmental Impact Assessment (EIA) Report of Etalin HE Project
Proponent: M/s Etalin Hydro Electric Power Company Limited (EHEPCL) 7.49
Consultant: RS Envirolink Technologies Pvt. Ltd.
Table 7.32: Physico-Chemical Characteristics of Water at Different Sampling Sites in the Study Area (Pre-Monsoon : Summer)
Parameters Sampling Sites
Sampling Site W1 W2 W3 W4 W5 W6 W7 W8 W9 W10 W11
Physical Parameters
Water Temperature (0C) 11.0 10.0 12.0 13.0 11.5 12.0 15.0 13.0 15.0 12.0 12.0
Electrical Conductivity
(µS/cm) 23.0 20.0 32.0 195.0 42.0 36.0 61.0 22.0 42.0 50.0 27.0
Turbidity (ntu) Nil Nil Nil Nil Nil Nil Nil Nil Nil Nil Nil
Chemical Parameters
pH 7.5 7.0 7.2 7.5 7.4 7.5 7.8 7.5 7.6 7.2 7.6
DO (mg/l) 11.2 10.9 11.0 9.8 10.2 10.1 9.8 10.1 9.9 11.1 9.9
TDS (ppm) 15.41 13.4 21.44 130.65 28.14 24.12 40.87 14.74 28.14 33.5 18.09
Ca hardness, mg/l 23.2 13.6 31.2 35.7 29.3 33.4 32.7 21.2 34.9 37.6 27.7
Mg hardness, mg/l 7.8 9.4 3.8 8.3 4.7 3.6 12.3 15.8 8.2 4.4 17.3
Total Hardness (mg/l) 31.00 23.00 35.00 44.00 34.00 37.00 45.00 37.00 43.10 42.00 45.00
Total Alkalinity (mg/l) 13.50 12.00 11.50 19.00 19.00 18.00 27.00 14.20 17.00 16.98 17.98
Chloride (mg/l) 12.12 11.12 12.55 14.44 10.32 13.20 14.89 16.32 15.10 16.93 16.88
Nitrate (mg/l) 0.145 0.134 0.048 0.144 0.019 0.022 0.062 0.041 0.045 0.021 0.025
Phosphate (mg/l) 0.008 0.007 0.009 0.008 0.007 0.045 0.009 0.011 0.021 0.019 0.022
Silica (as SiO2), mg/l 0.135 0.123 0.079 0.156 0.112 0.111 0.088 0.144 0.133 0.091 0.112
Salinity, mg/l <0.001 <0.001 <0.001 <0.001 <0.001 <0.001 <0.001 <0.001 <0.001 <0.001 <0.001
Total coliform (P/A) A A A A A A A A A A A
W1-W11 : Sampling sites

Environmental Impact Assessment (EIA) Report of Etalin HE Project
Proponent: M/s Etalin Hydro Electric Power Company Limited (EHEPCL) 7.50
Consultant: RS Envirolink Technologies Pvt. Ltd.
Table 7.33: Physico-Chemical Characteristics of Water at Different Sampling Sites in the Study Area (Monsoon)
Parameters Sampling Sites
Sampling Site W1 W2 W3 W4 W5 W6 W7 W8 W9 W10 W11
Physical Parameters
Water Temperature
(0C) 18.0 25.0 17.0 15.0 22.0 17.0 18.0 17.0 15.0 25.0 24.0
Electrical
Conductivity (µS/cm) 40.0 30.0 45.0 50.0 30.0 30.0 55.0 70.0 70.0 30.0 40.0
Turbidity (ntu) 10.0 10.0 0.0 0.0 8.0 8.0 0.0 0.0 0.0 8.0 10.0
Chemical Parameters
pH 7.1 7.0 7.2 7.2 7.0 7.0 6.9 7.1 7.0 7.0 7.1
DO (mg/l) 10.8 10.4 9.7 10.3 9.7 10.2 10.4 10.6 9.7 9.1 10.1
TDS (ppm) 26.8 20.1 30.15 33.5 20.1 20.1 36.85 46.9 46.9 20.1 26.8
Ca hardness, mg/l 17.2 13.6 21.2 27.7 15.3 23.4 29.7 21.2 34.9 7.6 2.7
Mg hardness, mg/l 6.8 8.4 6.8 8.3 4.7 6.6 6.3 17.8 6.1 4.4 5.3
Total Hardness
(mg/l) 24.00 22.00 28.00 36.00 20.00 30.00 36.00 39.00 41.00 12.00 8.00
Total Alkalinity
(mg/l) 23.60 20.62 26.62 34.06 19.04 14.28 34.18 38.78 39.98 14.28 9.52
Chloride (mg/l) 1.99 1.99 2.13 2.01 3.99 3.99 3.79 3.99 3.91 3.99 3.99
Nitrate (mg/l) 1.410 0.970 0.680 0.690 0.550 1.320 0.460 0.680 0.520 0.970 1.320
Phosphate (mg/l) <0.004 <0.004 <0.004 <0.004 <0.004 <0.004 <0.004 <0.004 <0.004 <0.004 <0.004
Silica (as SiO2), mg/l 3.630 3.560 5.120 5.670 1.970 2.180 4.610 4.320 5.040 2.600 2.490
Salinity, mg/l <0.001 <0.001 <0.001 <0.001 <0.001 <0.001 <0.001 <0.001 <0.001 <0.001 <0.001
Total coliform (P/A) A A A A A A A A A A A
W1-W11 : Sampling sites

Environmental Impact Assessment (EIA) Report of Etalin HE Project
Proponent: M/s Etalin Hydro Electric Power Company Limited (EHEPCL) 7.51
Consultant: RS Envirolink Technologies Pvt. Ltd.
The Cyanophyceae family was represned by 15 species wih 14, 9 and 8 species recorded during
winter, pre-monsoon and mosoon surveys, respectively (Table 7.34).
The Chlorophyceae was represented by species like Cladophora sp., Oedogonium sp. and
Spirogyra sp. and 4, 6 and 3 species recorded during winter, pre-monsoon and mosoon
surveys, respectively (Table 7.34).
The density of periphyton ranged from 297 to 2833 in winter season, 458 to 755 in summer
season and 143 to 544 during monsoon (Table 7.35 & Figure 7.12). Species Diversity Index
ranged from 1.50-3.10 in winter season, 2.10-3.10 in summer season and 1.70-2.40 in
monsoon (Table 7.35 & Figure 7.13) while Eveness Index (E) for periphyton ranged from
0.30-0.50 in winter season, 0.40-0.52 in summer season and 0.40-0.50 in monsoon (Table
7.35 & Figure 7.14).
Table 7.34: List of periphyton found in Study Area
S. No. Name of species Winter Pre-monsoon Monsoon
Bacillariophyceae
1 Achnanthes crenulata + + +
2 Achnanthes exigua var. exigua + + +
3 Achnanthidium biasolettiana var. biasolettiana + + +
4 Achnanthidium minutissima var. minutissima + + +
5 Achnanthidium subhudsonis + - +
6 Ceratoneis arcus + + +
7 Ceratoneis arcus var. amphioxus + + +
8 Ceratoneis arcus var. recta + + -
9 Cocconeis placentula var. euglypta + + +
10 Cocconeis placentula var. lineata + + +
11 Cocconeis placentula var. placentula + + +
12 Cymbella excisa - + +
13 Cymbella leavis - + +
14 Cymbella parva - + -
15 Cymbella turgidula - + +
16 Cymbopleura sp. + + -
17 Diatoma mesodon + + +
18 Encyonema minutum + + -
19 Encyonema silisiacum - + -
20 Epithemia sorex - + -
21 Fragilaria capucina + + +
22 Fragilaria rumpens + + -
23 Gomphonema clevei + + +
24 Gomphonema olivaceum - + -
25 Navicula caterva + + +
26 Navicula cryptotenella - + -
27 Navicula radiosa + - +
28 Navicula radiosaffalax + + -
29 Navicula sp. + + -
30 Nitzschia linearis - + -
31 Planothidium lanceolata var. elliptica - + -
32 Reimeria sinuata + + +

Environmental Impact Assessment (EIA) Report of Etalin HE Project
Proponent: M/s Etalin Hydro Electric Power Company Limited (EHEPCL) 7.52
Consultant: RS Envirolink Technologies Pvt. Ltd.
S. No. Name of species Winter Pre-monsoon Monsoon
33 Rhoicosphenia abbreviata - + -
34 Surirella angusta + + +
35 Surirella linearis - + -
36 Tabellaria flocculosa - + -
Total (Bacillariophyceae) 23 34 20
Cyanophyceae
37 Amphorocapsa sp. + - +
38 Anabaena anomala + + +
39 Anabaena sp. + + +
40 Aphanocapsa sp. - + -
41 Gloeocapsa sp. + + -
42 Gloeocapsa punctata + - -
43 Gloeocapsa rupestis + - -
44 Lyngbya ambiguum + - +
45 Lyngbya sp. + + -
46 Oscillatoria curviceps + + +
47 Oscillatoria sp. + + +
48 Rivularia sp. + - +
49 Scytonema sp. + + +
50 Stigonema sp. + + -
51 Tolypothrix sp. + - -
Total (Cyanophyceae) 14 9 8
Chlorophyceae
52 Chaetophora sp. - + -
53 Characiosiphora vivularis + - +
54 Cladophora sp. + + -
55 Coleochaete sp. - + -
56 Oedogonium sp. + + +
57 Spirogyra sp. + + +
58 Zygnema sp. - + -
Total (Chlorophyceae) 4 6 3
Total species 41 49 31
-Present; - Absent
Table 7.35: Density, Species Diversity (H) and Evenness Index (E) of periphyton
Sampling Locations W1 W2 W3 W4 W5 W6 W7 W8 W9 W10 W11
Density (cells/ mm2)
Winter (Lean)
466 297 2833 900 654 822 755 793 1022 700 1122
Summer (Pre-monsoon)
690 529 673 567 579 523 640 458 478 642 755
Monsoon 343 414 443 288 355 466 143 277 317 352 544
Species Diversity
Index
(H)
Winter (Lean)
1.50 1.50 1.90 1.80 3.10 1.80 2.40 2.00 1.80 2.40 2.50
Summer (Pre-
monsoon)
2.10 2.10 2.40 2.50 3.10 2.30 2.20 2.60 2.40 2.30 2.70
Monsoon 1.80 1.90 1.80 2.40 2.10 1.90 1.80 1.70 1.90 1.80 2.00
Evenness Index (E)
Winter (Lean)
0.30 0.30 0.30 0.30 0.50 0.30 0.40 0.40 0.30 0.40 0.50
Summer (Pre-monsoon)
0.40 0.40 0.50 0.49 0.50 0.40 0.40 0.52 0.47 0.40 0.50
Monsoon 0.40 0.40 0.50 0.40 0.50 0.40 0.40 0.40 0.40 0.50 0.40

Environmental Impact Assessment (EIA) Report of Etalin HE Project
Proponent: M/s Etalin Hydro Electric Power Company Limited (EHEPCL) 7.53
Consultant: RS Envirolink Technologies Pvt. Ltd.
Figure 7.12: Seasonal Variation in density of periphyton
Figure 7.13: Seasonal variation in Species Diversity Index (H) of periphyton
Figure 7.14: Seasonal Fluctuation in Evenness Index (E) of periphyton
7.6.2.2 Phytoplankton
In all total, 51 species of phytoplankton were identified in the samples collected from proposed
hydroelectric project study area. The phytoplankton community comprised of 5 species of
Chlorophyceae, 16 species of Cyanophyceae and 30 species of Bacillariophyceae (Table 7.36).
0
500
1000
1500
2000
2500
3000
W1 W2 W3 W4 W5 W6 W7 W8 W9 W10 W11
Winter (Lean)
Summer(Pre-monsoon)Monsoon
De
nsi
ty (
cells
per
sq
mm
)
Sampling Locations
0.00
0.50
1.00
1.50
2.00
2.50
3.00
3.50
W1 W2 W3 W4 W5 W6 W7 W8 W9 W10 W11
Winter(Lean)
Summer(Pre-monsoon)Monsoon
Spe
cie
s D
ive
rsit
y In
de
x (H
)
Sampling Locations
0.00
0.10
0.20
0.30
0.40
0.50
0.60
W1 W2 W3 W4 W5 W6 W7 W8 W9 W10 W11
Winter(Lean)
Summer(Pre-monsoon)
MonsoonEven
nes
s In
dex
(E)
Sampling Locations

Environmental Impact Assessment (EIA) Report of Etalin HE Project
Proponent: M/s Etalin Hydro Electric Power Company Limited (EHEPCL) 7.54
Consultant: RS Envirolink Technologies Pvt. Ltd.
The total number of taxa recorded during different seasons varied from 27 in monsoon and pre-
monsoon and 34 in winter season. Among Bacillariophyceae 18 in winter, and 16 species were
recorded during pre-monsoon and mosoon surveys. Most common species are Achnanthidium
biasolettianum var. biasolettianum, Achnanthidium minutissimum var. minutissimum,
Cocconeis placentula var. euglypta, Cocconeis placentula var. lineata, Cocconeis placentula var.
placentula, Diatoma mesodon and Planothidium lanceolata var. elliptica.
The Cyanophyceae family was represned by 12 species wih 12, 9 and 8 species recorded during
winter, pre-monsoon and mosoon surveys, respectively (Table 7.36).
The Chlorophyceae was represented by species like Cladophora sp., Oedogonium sp. and
Spirogyra sp. and 4, 4 and 3 species recorded during winter, pre-monsoon and mosoon
surveys, respectively (Table 7.36).
The density of phytoplankton ranged from 248 to 2179 in winter season, 327 to 627 in summer
season and 98 to 388 during monsoon (Table 7.37). Species Diversity Index ranged from 1.40
-2.50 in winter season, 1.80-2.50 in summer season and 1.60 -2.10 in monsoon (Table 7.37)
while Eveness Index (E) for phytoplankton ranged from 0.30-0.50 in winter season, 0.40-0.51
in summer season and 0.40-0.48 in monsoon (Table 7.37).
Table 7.36: List of phytoplankton species found in Study Area
S. No. Name of species Winter Pre-
monsoon Monsoon
Bacillariophyceae
1 Achnanthes crenulata + + +
2 Achnanthidium minutissima var. minutissima + + +
3 Achnanthidium subhudsonis + - +
4 Ceratoneis arcus + + +
5 Ceratoneis arcus var. amphioxus + + +
6 Cocconeis placentula var. placentula + + +
7 Cymbella excisa - + +
8 Cymbella leavis - + +
9 Cymbella parva - + -
10 Cymbella turgidula - + +
11 Cymbopleura sp. + + -
12 Diatoma mesodon + + +
13 Encyonema minutum + + -
14 Encyonema silisiacum - + -
15 Epithemia sorex - + -
16 Fragilaria capucina + + +
17 Fragilaria rumpens + + -
18 Gomphonema clevei + + +
19 Navicula caterva + + +
20 Navicula cryptotenella - + -
21 Navicula radiosa + - +
22 Navicula radiosaffalax + + -
23 Navicula sp. + + -
24 Nitzschia linearis - + -
25 Planothidium lanceolata v. elliptica - + -
26 Reimeria sinuata + + +
27 Rhoicosphenia abbreviata - + -
28 Surirella angusta + + +
29 Surirella linearis - + -

Environmental Impact Assessment (EIA) Report of Etalin HE Project
Proponent: M/s Etalin Hydro Electric Power Company Limited (EHEPCL) 7.55
Consultant: RS Envirolink Technologies Pvt. Ltd.
30 Tabellaria flocculosa - + -
Total Bacillariophyceae 18 16 16
Cyanophyceae
31 Amphorocapsa sp. + - +
32 Anabaena anomala + + +
33 Anabaena sp. + + +
36 Gloeocapsa punctata + - -
38 Gloeocapsa rupestis + - -
39 Lyngbya ambiguum + - +
40 Lyngbya sp. + + -
41 Oscillatoria curviceps + + +
41 Oscillatoria sp. + + +
42 Rivularia sp. + - +
43 Scytonema sp. + + +
46 Stigonema sp. + + -
Total Cyanophyceae 12 7 8
Chlorophyceae
47 Characiosiphora vivularis + - +
48 Cladophora sp. + + -
49 Oedogonium sp. + + +
50 Spirogyra sp. + + +
51 Zygnema sp. - + -
Total Chlorophyceae 4 4 3
Total Phytoplankton species 34 27 27
Table 7.37: Density, Species Diversity (H) and Evenness Index (E) of phytoplankton
Sampling Locations W1 W2 W3 W4 W5 W6 W7 W8 W9 W10 W11
Density
(cells/
mm2)
Winter
(Lean) 388 248 2179 692 503 514 472 417 568 411 590
Summer
(Pre-
monsoon)
627 481 561 471 362 327 457 412 318 428 539
Monsoon 264 318 385 206 237 321 98 213 226 271 388
Species
Diversity
Index
(H)
Winter
(Lean) 1.40 1.50 1.40 1.70 2.50 1.90 1.90 1.80 1.70 1.90 2.10
Summer
(Pre-
monsoon)
2.00 1.80 2.10 2.20 2.50 2.20 2.20 2.50 2.30 2.10 2.00
Monsoon 1.70 1.80 1.70 2.00 2.10 1.80 1.70 1.60 1.90 1.90 1.80
Evenness
Index (E)
Winter
(Lean) 0.30 0.30 0.30 0.30 0.50 0.30 0.40 0.40 0.30 0.40 0.50
Summer
(Pre-
monsoon)
0.40 0.42 0.53 0.48 0.51 0.40 0.40 0.51 0.45 0.40 0.50
Monsoon 0.40 0.40 0.48 0.40 0.47 0.40 0.40 0.40 0.40 0.48 0.41
7.6.2.3 Zooplankton
The zooplankton population is quite low in Dri and Talo (Tangon) rivers owing fast flows of
these rivers. Zooplankton were represented by 1 genus of Cladocera, 3 genera of Rotifera and
1 genus of Copepoda (see Table 7.38). The important species of zooplankton were Daphnia
(Cladocera), Trichocera, Keratella and Asplanchana (Rotifera) and Cyclops (Copepoda). Density
of zooplankton was in the range of 3 – 6 individuals per litre. The Shannon-Weiner diversity
index ranged between 1.960 and 2.271 at all the sites (Table 7.38).

Environmental Impact Assessment (EIA) Report of Etalin HE Project
Proponent: M/s Etalin Hydro Electric Power Company Limited (EHEPCL) 7.56
Consultant: RS Envirolink Technologies Pvt. Ltd.
Table 7.38: Zooplankton density and Shannon-Weiner Diversity index in study area
Zooplankton
Winter Summer Monsoon
Density
(indiv./l )
Diversity
index
Density
(indiv./l )
Diversity
index
Density
(indiv./l )
Diversity
index
Cladocera
Daphnia sp. 6 0.511 5 0.488 5 0.319
Rotifera
Trichocera sp. 6 0.488 5 0.415 5 0.410
Keratella sp. 8 0.441 6 0.415 3 0.40
Asplanchana sp. 6 0.391 4 0.390 3 0.391
Copepoda
Cyclops sp. 5 0.440 5 0.421 5 0.440
Total 31 2.271 25 2.129 21 1.960
7.6.2.4 Macro-Invertebrates
The macro-invertebrate community contributes immensely to the functioning of the stream or
river ecosystem. It serves not only as a major source of food for fishes but also helps in
processing relatively large amounts of organic matter. The abundance of invertebrate fauna
mainly depends on physical and chemical properties of the substratum. Because of their
extended residency period in specific habitats and presence or absence of particular benthic
species in a particular environment, these can be used as bio-indicators of specific environment
and habitat conditions. The monitoring of macro-invertebrates populations provides an
important tool to assess the short and long term effects of a wide range of environmental
disturbances.
The macro-invertebrate fauna of the study area comprised of six Orders viz. Ephemeroptera,
Trichoptera, Diptera, Coleoptera, Plecoptera, and Odonata during the survey. The density of
macro-invertebrate were observed to be less during monsoon season as compared to summer
and winter which may be due to turbulent flow and deposition of silt on substratum habitat of
these fauna (Figure 7.15 and Tables 7.39).
The percentage composition of macro-invertebrate fauna during different seasins is given in
Tables 7.37 – 7.39.
Figure 7.15: Macro-invertebrates density (individuals/m2)
0 100 200 300 400 500 600
W1
W2
W3
W4
W5
W6
W7
W8
W9
W10
W11
Winter (Lean)
Summer (Pre-monsoon)
Monsoon
Sam
pli
ng
Site
s
Density (individuals/ sq m)

Environmental Impact Assessment (EIA) Report of Etalin HE Project
Proponent: M/s Etalin Hydro Electric Power Company Limited (EHEPCL) 7.57
Consultant: RS Envirolink Technologies Pvt. Ltd.
Table 7.39: Macro-invertebrates density (individuals/m2) in study area
Density (individuals/m2 )
Sites Winter Summer Monsoon
W1 99 33 29
W2 66 88 44
W3 110 88 143
W4 220 583 154
W5 165 253 55
W6 154 396 66
W7 77 264 143
W8 110 132 77
W9 187 440 77
W10 451 77 55
W11 444 99 44
7.6.2.5 Water Quality Assessment
The Macro-invertebrates are one of the indicators of water quality of freshwater streams. The
water quality assessment of Dri and Talo (Tangon) rivers was assessed by calculating BMWP,
ASPT and LQI values which are an indicative of river water qualiy. The methodology to calculate
these indicies has been given in Chaper 3-Methodology of the report.
The evaluation of the performance of the BMWP score in relation to a range of water quality
variables has described by Armitage et al. (1983). BMWP score calculated varied from as low as
4 & 6 a sites to highest at site W11 (Downstream of Dri and angon confluence) 88 during
winter sampling (see Tables 7.40-7.42 & Figure 7.16). However in general the average
BMWP scores during winters were very good (44) and good during pre-monsoon (27) and as
expected were lowest (20) during monsoon when the river flow is very high.
The average sensitivity of the families of the organisms present is known as the Average
Score per Taxon (ASPT). The ASP) index gives an indication of the evenness of community
diversity. ASPT is calculated by dividing the BMWP score for each site by the total number of
scoring families found there, so it is independent of sample size. Likewise BMWP scores, a
higher ASPT indicate better water quality. The ASPT score varied from 3 to 8.8 (Figure 7.17).
The average ASPT scores during differen seasons followed the patern of BMWP scores.
The Lincoln Quality Index (LQI) is biotic indices established to determine pollution effects in
river particularly from organic pollutants based on aquatic macro-invertebrate populations and
is expressed as A for excellent water quality, B for Good, C for Moderate, D as Poor and E as
very poor water quality.
The Lincoln Quality Index (LQI) is biotic indices established to determine pollution effects in
river particularly from organic pollutants based on aquatic macro-invertebrate populations and
is expressed as A for excellent water quality, B for Good, C for Moderate, D as Poor and E as
very poor water quality. As per the LQI the water quality of Dibang & Talo (Tangon) river is of
good quality as it is under Class A & B. No serious stress was observed in this river. Among the
biological characteristics, majority of the taxa were pollution intolerant. During the construction
phase of the hydro project, sedimentation load increase in the river which may affect the total

Environmental Impact Assessment (EIA) Report of Etalin HE Project
Proponent: M/s Etalin Hydro Electric Power Company Limited (EHEPCL) 7.58
Consultant: RS Envirolink Technologies Pvt. Ltd.
density, taxonomic richness and total biomass of the benthic diatoms and macro-invertebrates
which are important components of the food chain of aquatic ecosystem.
Figure 7.16: BMWP scores a different sites in different seasons
Figure 7.17: ASPT scores a different sites in different seasons
0
10
20
30
40
50
60
70
80
90
100
W1 W2 W3 W4 W5 W6 W7 W8 W9 W10 W11Sampling Sites
Winter Pre-monsoon Monsoon
5
7
9
11
13
15
17
19
21
23
25
W1 W2 W3 W4 W5 W6 W7 W8 W9 W10 W11Sampling Sites
Monsoon Pre-monsoon Winter

Environmental Impact Assessment (EIA) Report of Etalin HE Project
Proponent: M/s Etalin Hydro Electric Power Company Limited (EHEPCL) 7.59
Consultant: RS Envirolink Technologies Pvt. Ltd.
Table 7.40 : Percent composition of macro-invertebrates at different sampling locations (Winter Season)
Sampling
Locations W1 W2 W3 W4 W5 W6 W7 W8 W9 W10 W11 W9 W10 W11
Ephemeroptera
Heptageniidae 44.44 33.33
5.00 20.00 14.29 14.29 10.00 35.29 7.32 10.00 14.29
50
Baetidae 22.22
30.00 5.00 20.00 42.86 14.29 10.00
48.78 35.00
40 50
Caenidae
50.00 10.00 5.00
9.76 6.67
Ephemerellidae
Trichoptera
Brachycentridae 11.11
5.00
14.29 30.00 35.29
8.33
Sericostomatidae
30.00 10.00
7.32 5.00
Rhyacophilidae
6.67
3.33
Hydropsychidae 11.11
5.00
7.14
23.53
Psychomyiidae
28.57
Hydroptilidae
13.33
Leptoceridae
20.00 35.00
10.00
1.67 28.57
Diptera
Chironomidae
33.33 21.43
21.95 15.00
60
Simuliidae
Coleoptera
Elmidae
10.00 15.00 6.67
5.88
Plecoptera
Chloroperlidae
16.67
15.00
28.57 40.00
10.00
Perlidae 11.11
28.57
4.88 3.33 28.57
Nemouridae
Perlodidae
Leuctridae
Odonata
Aeshnidae
7.14
1.67
Libellulidae
7.14
Total 100 100 100 100 100 100 100 100 100 100 100 100 100 100
BMWP 29 27 36 71 34 37 44 44 30 43 88 30 6 14
ASPT 5.8 9 7.2 7.9 5.7 6.2 9 8.8 7.5 7.2 8 7.5 3 7
LQI A B B B A B B B B B B B A B

Environmental Impact Assessment (EIA) Report of Etalin HE Project
Proponent: M/s Etalin Hydro Electric Power Company Limited (EHEPCL) 7.60
Consultant: RS Envirolink Technologies Pvt. Ltd.
Table 7.41 : Percent composition of macro-invertebrates at different sampling locations (Pre-Monsoon)
Sampling Locations W1 W2 W3 W4 W5 W6 W7 W8 W9 W10 W11
Ephemeroptera
Heptageniidae
3.77 8.70
16.67 27.50
22.22
Baetidae 66.67 75 50 41.51 82.61 94.44 20.83 8.33 67.50 71.43 66.67
Caenidae
Ephemerellidae
4.17
Trichoptera
Brachycentridae 33.33 12.5
4.35
4.17 8.33
Sericostomatidae
Rhyacophilidae
Hydropsychidae
12.5 1.89
8.33
Psychomyiidae
5.66
25.00 8.33
Hydroptilidae
Leptoceridae
37.5 39.62
33.33
2.5
Diptera
Chironomidae
12.5
Simuliidae
5.66
8.33
Coleoptera
Elmidae
Plecoptera
Chloroperlidae
5.56
41.67 2.5
Perlidae
4.35
28.57
Nemouridae
1.89
Perlodidae
12.5
Leuctridae
11.11
Odonata
Aeshnidae
Libellulidae
Total 100 100 100 100 100 100 100 100 100 100 100
BMWP 14 16 19 41 34 14 44 44 34 14 24
ASPT 7 5.3 6.3 5.9 8.5 7 7.3 6.3 8.5 7 8
LQI B A B A B B B B B B B

Environmental Impact Assessment (EIA) Report of Etalin HE Project
Proponent: M/s Etalin Hydro Electric Power Company Limited (EHEPCL) 7.61
Consultant: RS Envirolink Technologies Pvt. Ltd.
Table 7.42 : Percent composition of macro-invertebrates at different sampling locations (Monsoon)
Sampling
Locations W1 W2 W3 W4 W5 W6 W7 W8 W9 W10 W11
Ephemeroptera
Heptageniidae
7.14
28.57 14.29
50
Baetidae 66.67 75 23.08 35.71 100 66.67 30.77
40 50
Caenidae
Ephemerellidae
Trichoptera
Brachycentridae
25 7.69
15.38 28.57
Sericostomatidae
Rhyacophilidae
Hydropsychidae 33.33
23.08 21.43
7.69 42.86
Psychomyiidae
14.29
28.57
Hydroptilidae
Leptoceridae
28.57
Diptera
Chironomidae
23.08
16.67 30.77
60
Simuliidae
15.38 14.29
Coleoptera
Elmidae
Plecoptera
Chloroperlidae
16.67 15.38
Perlidae
7.69 7.14
28.57
Nemouridae
Perlodidae
Leuctridae
Odonata
Aeshnidae
Libellulidae
Total 100 100 100 100 100 100 100 100 100 100 100
BMWP 9 14 36 34 4 16 31 25 30 6 14
ASPT 4.5 7 6 5.7 4 5.3 6.2 8.3 7.5 3 7
LQI A B B B A A B B B A B

Environmental Impact Assessment (EIA) Report of Etalin HE Project
Proponent: M/s Etalin Hydro Electric Power Company Limited (EHEPCL) 7.62
Consultant: RS Envirolink Technologies Pvt. Ltd.
7.7 FISH AND FISHERIES
The State of Arunachal Pradesh is rich in fresh water resources in the form of rivulets and lentic
water bodies that is reflected by the presence of rich fish diversity. Around 143 species
belonging to 61 genera, 21 families and 8 orders have been reported by various authors
(Jayram, 1963, Jayram, and Mazumdar, 1964; Srivastava, 1966; Sen, 2006, Nath and Dey
2000) in Arunachal Pradesh during their study.
There is no fish farming community in terms of caste or creed exists in the study area of Etalin
HE Project. For farmers forming the bulk of the population the fish farming is a secondary
employment. Almost the entire population of the state including the area of the project is fish
eater. Incidentally, the local people are dependent on the natural resources for fish protein and
resort to various illegal and spurious fishing methods (different types of traps, gears, fish
poison, blasting, etc.). There is no proper record of fish landings at all from the area. There is
no fish farming community in in the area. The agricultural farming is the main occupation in the
area and only few have taken to fish farming as a secondary employment.
However, some people from the area use cast net or fishing lines, fishing trap, blasting and
electric shock methods for fish capture in the Talo (Tangon) River. As per the discussion with
people, some fishes do migrate upstream during the rainy season of the year. These fishes
were easily captured by the people during the migration and used for self consumption.
To assess fish diversity of the Dri and Talo (Tangon) rivers, experimental fishing was conducted
during the field surveys. The fishing gears like cast and gill net were used at different locations
in Dri and Talo (Tangon) rivers. The fish fauna was caught and identified with the help of keys
given in Day (1878), Jayaram (1981), Menon (1987) and Talwar and Jhingran (1997). During
the experimental fishing, the average daily catch in the study area was maximum during winter
period which around about 1.5 kg/day/fishermen and was lowest during monsoon 0.4-0.8 kg at
different locations while during pre-monsoon sampling it was 0.6 to 1.2 kg/day/fishermen.
Fishes diversity of Dri and Talo (Tangon) Rivers comprises of 12 species belonging to 4 families
with Cyprinidae forming the largest family represented by 8 species (Table 7.43). Though
none of the mahseer species (Tor tor and T. putitora) could be found during experimental
fishing but their occurrence cannot be ruled out as according to local people they have caught
these species in the past. Schizothorax richardsonii and Labeo pangusia of Cyprinidae family fall
under the Near Threatened and Vulnerable category, respectively while all other fish species
falls under the category of Least Concern.
Table 7.43: Fish composition and their status in the Dri and Talo (Tangon) Rivers
S.No. Family/ Scientific Name Local Name River Conservation
Status as per
IUCN Ver 3.1
Cyprinidae
1 Barilius bendelisis Rabiotapia Dri/Talo (Tangon) LC
2 Crossocheilus latius latius Nagoyou Dri/Talo (Tangon) LC
3 Danio dangila Lauputi Dri/Talo (Tangon) LC
4 Garra annandalei Nagop Dri/Talo (Tangon) LC
5 Garra gotyla gotyla Nagoyoutotum Dri/Talo (Tangon) LC

Environmental Impact Assessment (EIA) Report of Etalin HE Project
Proponent: M/s Etalin Hydro Electric Power Company Limited (EHEPCL) 7.63
Consultant: RS Envirolink Technologies Pvt. Ltd.
6 Labeo pangusia Ghoria Dri/Talo (Tangon) NT
7 Schizothorax richardsonii Kadang Dri/Talo (Tangon) VU
8 Schizothorax progastus Dri/Talo (Tangon) LC
Balitoridae
9 Acanthocobitis botia Reibo Dri/Talo (Tangon) LC
Olyridae
10 Olyra longicaudata Himalayan loyra Dri/Talo (Tangon) LC
11 Xenentodon cancila Chowki Talo (Tangon) LC
Sisoridae
12 Glyptothorax pectinopterus Dri/Talo (Tangon) LC
Note: VU – Vulnerable; NT- Near Threatened; LC - Least Concern
Fish however plays a major role in the cultural practices of the Idu Mishmis. As per discussion
with the tribal people, a fish folk festival „Aayuha‟ celebrated in the rainy season when fishes
migrate from rivers to perennial nalas and other small tributaries for spawning and breeding
purposes. The people catch the fish from the river and celebrate with their relative and friends.
Plate 7.1: Blue green algae recorded from Dri and Talo(Tangon) rivers

Environmental Impact Assessment (EIA) Report of Etalin HE Project
Proponent: M/s Etalin Hydro Electric Power Company Limited (EHEPCL) 7.64
Consultant: RS Envirolink Technologies Pvt. Ltd.
Plate 7.2: Diatoms recorded from Dri and Talo (Tangon) rivers
1-2 : Achnanthes cranulata
3 Cocconeis placentula var. euglypta
4-5 Ceratoneis arcus var. amphioxus
6 Navicula radiosaffalax
7 Gomphonema clevei
8-9 Reimeria sinuata
10 Encyonema minutum
11 Cocconeis placentula var. placentula
12-13 Diatoma mesodon
14-15 Achnanthidium minutissima var. minutissima
16-17 Achnanthidium biasolettiana var. biasolettiana

Environmental Impact Assessment (EIA) Report of Etalin HE Project
Proponent: M/s Etalin Hydro Electric Power Company Limited (EHEPCL) 8.1
Consultant: RS Envirolink Technologies Pvt. Ltd.
8.1 GENERAL
Assessment of environmental impacts of any development activity is the key component of EIA
process. Environmental impacts are assessed based on understanding of the project
features/activities, environmental setting in the area and interaction of project activities with
environmental components leading to prediction of likely impacts due to development of project
in a particular area/region. Hydropower projects are location specific, leading to large-scale
construction activities in generally pristine areas. Therefore, impact assessment is carried out by
establishing site-specific environmental settings through baseline data collection and defining
project components from detailed project information. Baseline environmental status in the
project area is established through field studies in different seasons and also obtained from
various secondary sources as discussed in previous chapters. Project related information is
sourced from Detailed Project Report (DPR) of the project to carry out the impact assessment for
project construction and operation phase.
The proposed Etalin HEP would lead to generation of a number of environmental impacts owing
to the activities that would be undertaken during the construction of various project
appurtenances, e.g. drilling and blasting, quarrying for construction material, dumping of muck
generated from various project activities, transportation of material, material handling and
storage, waste generation from labour colonies, operation of construction machinery/equipment,
etc. Additionally, large-scale labour migration to the area, during the construction period,
impacts the local inhabitants. Operation phase of the hydroelectric project is much cleaner as far
as pollution generation is concerned; however a significant impact during operation phase is
permanent change in flow regime of the river impacting aquatic life, fish fauna and downstream
users.
All the likely impacts have been considered for various aspects of environment, including
physico-chemical, ecological and socio-economic aspects. Invariably there are two types of
impacts that occur due to construction and operation of hydroelectric projects viz. permanent
which generally lead to loss of plant species, change of land-use, change in flow regime, etc. and
temporary which can be minimized and mitigated by adopting environmental management plan.
Environmental protection measures can be best enforced through inclusion of relevant clauses in
the contract not only for the main contractors but also for sub-contractors as most of activities
are undertaken through various contractors.
Based on the project details and the baseline environmental status, potential impacts as a result
of the construction and operation of the proposed Etalin HE Project have been identified.
Wherever possible, the impacts have been quantified and otherwise, qualitative assessment has
been undertaken. This Chapter deals with the anticipated positive as well as negative impacts
during the construction as well as operation phase of the proposed Etalin HE project.
Chapter ASSESSMENT OF IMPACTS
8

Environmental Impact Assessment (EIA) Report of Etalin HE Project
Proponent: M/s Etalin Hydro Electric Power Company Limited (EHEPCL) 8.2
Consultant: RS Envirolink Technologies Pvt. Ltd.
8.2 IMPACTS DURING CONSTRUCTION
Majority of the environmental impacts attributed to construction works are temporary in nature,
lasting mainly during the construction phase and often do not extend much beyond the
construction period. However, as the construction phase of Hydroelectric Projects is fairly large
and extend into several years, if these issues are not properly addressed, the impacts can
continue even after the construction phase for longer duration. Even though the impacts due to
construction are temporary in nature, they need to be reviewed closely as they could be
significant due to the nature and intensity of the impacts.
Impacts can be discussed in terms of projects activities with their magnitude and potential
impacts on environmental resources or alternatively resource wise in terms of impact on each
environmental resource e.g. Ambient Air Quality and potential impact on this resource from
various project activities. However, as some of the project activities are quite critical and it is
important to understand them along with their impacts on environmental resources, therefore,
they are briefly discussed below to be followed by impacts on resources.
8.2.1 Impacts due to immigration of Construction Workers
At the time of peak construction work in the project, it is estimated to engage 3000 persons as
labour force and 800 as technical staff. Efforts will be made to engage local labour force, as far
as possible and rest will be brought from outside. Even the local population is expected to stay
near the construction sites in the construction camps/colonies. It is estimated that in the first
and second year 60% of the peak force will be required and in the third year 80% of the peak
force will be required, however, to assess the impact of migratory work force it is assumed that
entire labour force and technical staff will stay in the construction colony during the entire
duration of the project.
To calculate the human pressure during the construction phase of the project, the following
assumptions have been considered.
i. Family size is assumed as 5 membered; and 80% of labour and technical staff are
married
ii. Out of total workforce, 80% will be such that both husband and wife will work
iii. 50% of technical staff will come with their families and only husband will work
iv. 2% of total migrating population are assumed as service providers, and
v. 50% of service providers will have families.
Based on these assumptions the peak migrant population has been calculated as 10600 persons
(Table 8.1). This population is expected to reside in the project area at any given time.
Table 8.1: Calculation of Total Migratory Population
A. Migrant Population of Laborers
Total labour force 3000
Married laborers (80% of 3000) 2400
Single laborers (20% of 3000) 600
Husband and wife both working Labour (80% of 2400) 1920
Number of families where both husband and wife work (1920/2) 960

Environmental Impact Assessment (EIA) Report of Etalin HE Project
Proponent: M/s Etalin Hydro Electric Power Company Limited (EHEPCL) 8.3
Consultant: RS Envirolink Technologies Pvt. Ltd.
Number of families where only husband work (20% of 2400) 480
Total number of laborers families (960 + 480) 1440
Total Migrant Population of Laborers (1440 x 5 + 600) 7800
B. Migrant Population of Technical Staff
Total technical staff 800
Married technical staff 640
Single technical staff 160
Total migrant population of technical staff (320 x 5 + 320 + 160)
2080
Migrant Workforce (Labor plus Technical) 9880
C. Service Providers
Total service providers (2% of total migrant workforce) 198
Married service providers (50 % as assumed) 99
Single service providers 99
Total migrant population of service providers (99 x 5 + 99) 594
Total Migrant Population 10474
say 10600
Separate accommodation and related facilities for workers, service providers and technical staff
are to be arranged. Migration of 10600 persons during the peak construction period, in otherwise
scarcely populated and pristine area, is likely to create problems of sewage disposal, solid waste
management, tree cutting to meet fuel requirement, etc.
Impact of such activities on land environment arises due to indiscriminate disposal of waste,
littering, dumping of medical waste from dispensary/medical facilities, etc. In addition on
completion of construction work, these colonies needs to be dismantled and land reclaimed as
discussed in Environmental Management Plan.
8.2.2 Construction of Main Project Components
Etalin HEP (6 X 307 MW at Dri Limb + 4 X 307 MW at Talo (Tangon) Limb + 19.6 MW + 7.4 MW)
is a run-of-the-river project that will be using the waters of Dri and Talo (Tangon) rivers in
Dibang Valley district of Arunachal Pradesh. Dri and Talo (Tangon) rivers meet near Etalin
village; downstream of the confluence the river is named Dibang. The project is proposed to be
developed as a run-of-the-river scheme by constructing concrete gravity dams on Talo (Tangon)
and Dri rivers and diverting the water through two (2) separate waterway systems to utilize the
available head in a common underground powerhouse located just upstream of the confluence of
Dri and Tangon rivers.
A 101.5m high concrete gravity dam is proposed at this location to divert water of Dri river into
the water conductor system. The top level of the dam is at El 1047m. The total length of the dam
at top is 213.7m, with fourteen (14) concrete gravity blocks. The riverbed level at the dam site is
around El 968m.
The Full Reservoir Level (FRL) and Minimum Draw Down Level (MDDL) of the reservoir are El.
1045m and El 1039m, respectively. The total area of submergence is 83.32 ha.

Environmental Impact Assessment (EIA) Report of Etalin HE Project
Proponent: M/s Etalin Hydro Electric Power Company Limited (EHEPCL) 8.4
Consultant: RS Envirolink Technologies Pvt. Ltd.
The proposed Talo (Tangon) dam is a 80m high concrete gravity structure with top level at El
1052m. The total length of the dam at top is 184.1m, with twelve (12) concrete gravity blocks.
The riverbed level at the dam site is around El 1003m.
The Full Reservoir Level (FRL) and Minimum Draw Down Level (MDDL) of the reservoir are El
1050m and El 1040m, respectively. The total area of submergence is 36.12 ha.
8.2.3 Quarrying Operations
The total requirement of coarse and fine aggregates has been estimated as 32.82 Lakh m3 and
18.92 Lakh m3 respectively, to fulfill the requirement of construction material. Most of the
requirement of coarse aggregate will be met from the rock excavated from tunnels and
underground works and the remaining will be quarried from identified quarries. About 10.75 Lakh
m3 has been anticipated from 2 Nos. of identified Rock Quarries (RQ) (Table 8.2). Similarly the
requirements of fine aggregates will be met from the 4Nos. of identified Shoal & Sand quarries
(PQ). About 9.43 Lakh m3 is anticipated from the various identified quarries for fine aggregates
and the rest will obtained by crushing the potential muck generated from underground
excavation.
Table 8.2: Details of the quarry sites proposed in the Etalin H.E. Project
Quarry Sites Location of Quarry Sites Area needing
restoration (ha)
I. Rock Quarries
RQ1 Right & left bank of Akobe nala 3.12
RQ2 Left & right bank of Ayo Pani nala 10.12
Total rock quarries 13.24
II. Shoal & Sand
Quarries
PQ1 Right bank of Talo (Tangon) river
near Etalin village
6.07
PQ2 Right bank of Talo (Tangon) river
near
15.19
PQ3 Left bank of Talo (Tangon) river near 20.85
PQ4 Upstream of Dri dam 6.77
Total 48.88
Total Quarry Area
I+II
62.12
Opening of the quarries will cause visual impacts because they remove a significant part of the
hills. Other impacts will be the noise generated during aggregate acquisition through explosive and
crushing, which could affect wildlife in the area, air pollution is caused during the crushing
operation to get the aggregates to the appropriate size and transport of the aggregates to the site.
The quarrying operations will be semi-mechanized in nature. Normally, in a hilly terrain,
quarrying is done by cutting the hill face and this leaves a permanent scar, once the quarrying
activities are over with the passage of time, rock from the exposed face of the quarry under the
action of wind and other erosion forces, slowly gets weathered and they become a potential
source of landslide. Thus, it is necessary to implement appropriate slope stabilization measures
to prevent the possibility of soil erosion and landslides at the quarry sites.

Environmental Impact Assessment (EIA) Report of Etalin HE Project
Proponent: M/s Etalin Hydro Electric Power Company Limited (EHEPCL) 8.5
Consultant: RS Envirolink Technologies Pvt. Ltd.
8.2.4 Operation of Construction Plant and Equipment
During the construction phase, various types of equipment will be brought to the site and
construction plants and repair workshops will be set up. These include crushers, batching plant,
drillers, earth movers, rock bolters, etc. List of construction equipment to be deployed major
project component wise is given at Table 8.3. The siting of these construction equipments would
require significant amount of space. In addition, land will also be temporarily acquired, i.e. for
the duration of project construction; for storage of the quarried material before crushing, crushed
material, cement, steel, etc.
These construction plant and repair workshops will have impact on ambient air quality due to
fugitive emissions associated with operation of DG sets to meet the power requirements and
other equipment; impact on water quality due to wastewater generation and impact on soil due
to solid waste generation. Management of such impacts with operation control and appropriate
pollution control equipment is essential to minimize their effect on surrounding environment
including local population and wildlife and same is discussed in EMP. Additionally, proper siting of
these facilities can also reduce the impact due to their location. Their locations have been
identified during the preparation of Detailed Project Report, keeping in view the technical and
economic criteria; however, same can be further refined during set up, keeping in view:
Proximity to the site of use
Sensitivity of forests in the nearby areas
Wildlife, if any, in the nearby area
Proximity from habitations
Predominant wind direction
Natural slope and drainage
Table 8.3: List of Construction Equipment
Equipment required for open excavation
Description of Equipment Dri Limb Talo (Tangon)
Limb
Quantity Nos.
3.0 cum Excavator 6 4
25 T Dumpers 24 20
Dozers 90 HP 6 4
Jack Hammers 120 cfm 26 20
Compressors 500 cfm 17 13
Wagon drill 400 cfm 12 9
Equipment required for Construction of Diversion Tunnel per face
Description of Equipment Dri Limb Talo
(Tangon) Limb
Quantity Units
3.0 cum Excavator 1 1 Nos.
2-Boom Drill Jumbo 1 1 Nos.
Front End Loader 2.3 cum 1 1 Nos.
Wagon Drill 400 cfm 4 4 Nos.
Compressor 500 cfm / 1000 cfm 6 / -- 2 / 2 Nos.
25T capacity dumpers 5 5 Nos.
Jack Hammer (120 cfm capacity) 8 10 Nos.
Dozers 90 HP 1 2 Nos.
Gantry shutters 1 1 Set

Environmental Impact Assessment (EIA) Report of Etalin HE Project
Proponent: M/s Etalin Hydro Electric Power Company Limited (EHEPCL) 8.6
Consultant: RS Envirolink Technologies Pvt. Ltd.
Concrete pump 40cum/ hr 1 1 Nos.
Hydraulic Platform/Truck Jumbo 1 1 Nos.
Concrete Placer 1cum 1 1 Nos.
Transit Mixers (6 cum capacity) 4 5 Nos.
Needle Vibrators (65 mm dia. Needle) lot lot
Grout Pump 1 1 Nos.
Shotcrete Machine 1 1 Nos.
Welding sets 2 1 Set
Rib Bending Machine 1 1 Set
Blasting Accessories lot lot
Dewatering pumps of different capacity 1 1 Sets
JBC backhoe loader (for excavating the trench for laying gantry track)
1 1 Nos.
Ventilation Blower (110 kW) (One set in front of
each face) 1 1 Sets
Equipment required for cofferdam construction
Description of Equipment Dri Dam
Talo (Tangon)
Dam
1. Excavator 1.57 cum cap. 1 no 1 no.
2. Dumpers 25 MT cap. 4 nos 4 nos.
3. Concrete pump 40 cum /hr capacity 4 no, 4 nos.
4. Concrete mixers 6 cum 6 nos. 8 nos.
5. Drilling machines for curtain grouting 4 nos 4 nos.
6. Grout pumps 4 nos. 4 nos.
7. Hydra crane 8MT to handle concrete blocks 1 no. 1 no.
8. Tractor Trollies 2 nos. 2 nos.
9. Steel shutters, vibrators, welding sets, etc. Lot. Lot.
10. Diesel compressors 300 cfm 2 nos. 2 nos.
11. D.G. Set 500 KVA 1 no. 1 no.
12. Jet Grouting Set 2 no. 2 no.
Equipment Required for Intake works
Description of Equipment Dri Dam
Talo (Tangon)
Dam
1. Hyd. Excavators (1.57 cum) 1 nos. 2 nos.
2. Dumpers (25T) 5 nos. 8 nos.
3. Dozers (90 HP) 1 nos. 1 nos.
4. Wagon drills 2 no. 2 no.
5. Rough Terrain Crane (40T) 1 no. 1 no.
6. Concrete pumps (25 cum /hr) 1 nos. 3 nos.
7. Transit Mixers (6 cum) 10 nos. 15 nos.
8. Steel Formwork and Vibrators Lot Lot
9. Dewatering Pumps (40 kW) 3 nos. 3 nos.
Equipment required for Construction of Headrace Tunnel (Dri limb)
Description of Equipment Dri Limb Talo (Tangon)
Limb
Quantity Quantity
Two-boom drill jumbo 1 No. 1 No.
Front end loader 2.3 cum 1 No. 1 No.
Wagon drill 4 No. 4 Nos.
Compressor 500 cfm 2 No. 2 Nos.
Compressor 1000 cfm 1 No. 2 No.
25T capacity dumpers 8 No. 8 Nos.
Jackhammer (120 cfm capacity) 10 Nos. 10 Nos.
90 HP dozer (One dozer against two loaders has been
provided at muck disposal site for spreading the muck) 1 No. 1 No.

Environmental Impact Assessment (EIA) Report of Etalin HE Project
Proponent: M/s Etalin Hydro Electric Power Company Limited (EHEPCL) 8.7
Consultant: RS Envirolink Technologies Pvt. Ltd.
Gantry shutters 1 Set 1 Set
Concrete pump 40cum/ hr 1 No. 1 No.
Hydraulic platform/Truck jumbo 1 No. 1 No.
Concrete placer 1 Nos. 1 No.
Transit mixers (6 cum capacity) 4 Nos. 4 Nos.
Needle vibrators (65 mm dia. Needle) Lot Lot
Grout pump 1 No. 1 No.
Shotcrete machine 1 No. 1 No.
Welding sets 1 set 1 Set
Blasting accessories Lot Lot
Ventilation blower (One set in front of each adit) 1 set 1 Set
Rib bending machine 1 set 1 Set
Dewatering pumps of different capacities 1 1 1 Set
Wheel loader 5 Nos. -- --
Equipment required for Open Excavation in Surge Shaft (Dri & Talo (Tangon) limbs)
Description of Equipment Quantity Unit
Excavator 1.57 cum 1 Nos.
Jackhammers 120 cfm 5 Nos.
Dumpers 15 T 6 Nos.
Compressors 500 cfm 2 Nos.
Dozers 1 Nos.
Equipment required for Construction of Surge Shaft (Dri limb)
Description of Equipment Dri Limb Talo (Tangon) Limb
Quantity Units Quantity Units
Alimak Raise Climber 1 no 1 No.
Hydraulic excavator (2 cum) 1 no 1 No.
25T capacity dumpers 7 nos 7 Nos.
Jackhammer (120 cfm capacity) 15 nos 15 Nos.
Wagon drill 4 nos 2 Nos.
Compressor 500 cfm 7 nos 6 Nos.
Dozers 90 HP 1 no 1 No.
Concrete pump 40cum/ hr 2 no 1 No.
Transit mixers (6 cum capacity) 4 nos 4 Nos.
Needle vibrators (65 mm diameter needle)
4 nos 4 Nos.
Grout pump 1 no 1 No.
Shotcrete machine 1 no 1 No.
Blasting accessories 1 set 1 set
Winch (10T Capacity) 1 no 1 No.
Mobile crane (8/10T capacity) 1 no 1 No.
Gantry crane (30T capacity) 1 no 1 No.
Dewatering pumps of different
capacities 1 Set 1 Set
Loader 2.3 cum 1 no 1 no
Equipment required for Open Excavation in Surge Shaft (Talo (Tangon) limb)
Description of Equipments Quantity Unit
Excavator 1.57 cum 1 Nos.
Dumpers 25 T 6 Nos.
Dozers 1 Nos.
Total equipment required for Pressure Shaft (Dri limb)
Description of Equipment Quantity Unit
Two-boom hydraulic drill jumbo (as available) for horizontal excavation pressure shaft
6 Nos.
Alimak raise climber with stopper drills for excavation of vertical pressure shafts
4 Nos.

Environmental Impact Assessment (EIA) Report of Etalin HE Project
Proponent: M/s Etalin Hydro Electric Power Company Limited (EHEPCL) 8.8
Consultant: RS Envirolink Technologies Pvt. Ltd.
Wheel loader of 2.3cum capacity 6 Nos.
Jackhammers (120 cfm) 16 Nos.
Compressors 500 cfm 4 Nos
25T dumpers 12 Nos.
Crawler dozer (90HP) 6 No.
Shotcrete machine 6 Nos.
6 cum transit mixers 8 Nos.
40cum/hour capacity concrete pump 4 Nos.
Concrete placer 4 Nos.
Dewatering pumps of sort 6 Sets
Mobile crane (40T capacity) 4 Nos.
Welding sets 4 Sets.
Flexi shaft needle vibrators 10 Nos.
Winch (10T capacity) 4 Nos.
Winch (30T capacity) 4 Nos.
Rib bending machine 2 Set
Penstock fabrication yard 2
Testing equipment (Ultrasound, radiography, X ray) 4 Sets
Blasting accessories 6 Sets
Hydraulic platform/Truck jumbo 4 Nos.
Grout pump 6 Nos.
Sand blasting equipment 2 Sets.
Powerhouse
The equipment required for excavation of Stage I would be:
1. Two boom drilling Jumbo 2 No.
2. Rock Bolter 2 No.
3. Hyd. Excavator (1.84 cum) for benching 2 No.
4. Dumpers 25 T capacity 10 Nos.
5. Robojet Shotcrete Machine 2 No.
6. Transit mixers 6 cum 6 Nos.
7. Wagon Drills 6 Nos.
8. Compressors 1000 + 450 cfm 2 each
9. DG sets (1000 kVA) 2 No.
10. Scissor Platform 1 No .
The equipment required for excavation of Stage II would be:
1. Wagon drills (for benching) 2 nos.
2. Two boom drill jumbo 2 nos.
3. Hyd. excavator 1.84 cum 2 no.
4. Dumper 25 MT 10 nos.
5. Robojet Shotcrete machine 1 no.
6. Shotcrete machine manual 1 no.
7. Transit Mixers 5 nos.
9. Compressors and DG sets same as above
Equipment Required for Excavation of Transformer Hall from Each Side
Two boom drill jumbo for pilot tunnel 1 no.
Shotcreting Robojet 1 no.
Transit Mixers 6 cum 3 nos.
Hand-held rock drills 6 nos.
Hyd. Excavator 1.84 cum 1 no.
Dumpers 25 T 9 nos.
Bulldozer 90 HP 1 no.
Compressors 600 cfm 2 nos.
DG sets 1000 kVA 1 no.

Environmental Impact Assessment (EIA) Report of Etalin HE Project
Proponent: M/s Etalin Hydro Electric Power Company Limited (EHEPCL) 8.9
Consultant: RS Envirolink Technologies Pvt. Ltd.
8.2.5 Muck Disposal
The project would generate substantial quantity of muck from excavation of various structures.
The total quantity of muck generated from open excavation including construction and widening
of the roads is 165.65 lakh cum after considering swell factor of 45%. After the utilization of
muck for different project components as aggregates total estimated quantity to be disposed of
is about 117.35 lakh cum. Most of the excavated material is proposed to be dumped at 12
suitable locations identified specifically for this purpose with 7 sites along Dri limb, 1 site near
powerhouse location and 4 sites along Talo (Tangon) limb. The details of total muck generated
and to be disposed of are given in Table 8.4.
Table 8.4: Details of Excavation work in Etalin Hydroelectric Project
S. No. COMPONENT
Total muck to be
generated
including swell
factor
Muck to be
used as
aggregate
Muck to be
disposed after
aggregate use
Cum Cum Cum
A DRI LIMB
1 DAM- DRI 560725 112145 448580
2 Dam toe SHP- DRI 44675 8935 35740
3 Intake- DRI 36912 7382 29530
4 Coffer Dam- DRI 8754 0 8754
5 Diversion Tunnel Excavation from
U/S- DRI 456930 84188 372742
6 Diversion Tunnel Excavation from
D/S- DRI 345655 45242 300413
7 HRT Excavation from Intake 331197 115919 215278
8 HRT Excavation from Adit D-1 749380 256686 492694
9 HRT Excavation from Adit D-2 606961 206839 400122
10 HRT Excavation from Adit D-3 696393 238141 458252
11 HRT Excavation from Adit D-4 294571 97503 197068
12 Surge Shaft- DRI 180967 49341 131627
13 Valve Chamber- DRI 48363 16927 31436
14 Pressure Shaft-vertical- DRI 119411 41794 77617
15 Pressure Shaft-horizontal- DRI 74625 26119 48507
16 Power House Adits- DRI 136990 37268 99722
17 MAT- DRI 73752 24871 48881
18 Power House- DRI 434581 152103 282478
19 Transformer Hall- DRI 125429 43900 81529
20 D/s surge chamber- DRI 188705 66047 122658
21 Tailrace Tunnel- DRI 219963 57914 162049
B TALO (TANGON) LIMB
22 Power House Adits - TALO (TANGON) 329950 45134 284816
23 MAT – TALO (TANGON) 154382 46351 108031
24 Power House - TALO (TANGON) 388060 135821 252239
25 Transformer Hall - TALO (TANGON) 122200 42770 79430
26 D/s surge chamber- TALO (TANGON) 125803 44031 81772
27 Tailrace Tunnel- TALO (TANGON) 136907 39877 97030
28 Switchyard 192491 0 192491
29 HRT Excavation from Adit T-4 598502 202355 396147
30 HRT Excavation from Adit T-5 333808 109713 224096
31 Surge Shaft- TALO (TANGON) 130769 33568 97202
32 Valve Chamber- TALO (TANGON) 28979 10143 18837
33 Pressure Shaft-vertical- TALO
(TANGON) 62589 21906 40683
34 Pressure Shaft-horizontal- TALO
(TANGON) 65932 23076 42856

Environmental Impact Assessment (EIA) Report of Etalin HE Project
Proponent: M/s Etalin Hydro Electric Power Company Limited (EHEPCL) 8.10
Consultant: RS Envirolink Technologies Pvt. Ltd.
S. No. COMPONENT
Total muck to be
generated
including swell
factor
Muck to be
used as
aggregate
Muck to be
disposed after
aggregate use
35 HRT Excavation from Adit T-3 574065 193803 380263
36 HRT Excavation from Adit T-2 629156 213084 416071
37 HRT Excavation from Adit T-1 377623 115220 262403
38 Coffer Dam- TALO (TANGON) 5947 0 5947
39 Diversion Tunnel- open Excavation-
TALO (TANGON) 291697 0 291697
40 Diversion Tunnel Excavation from
U/S- TALO (TANGON) 178826 62589 116237
41 Diversion Tunnel Excavation from
D/S- TALO (TANGON) 178826 62589 116237
42 Desanding chamber- TALO
(TANGON) 831962 291187 540775
43 Inlet Tunnels- TALO (TANGON) 189617 66366 123251
44 Silt flushing tunnel- TALO (TANGON) 56285 19170 37115
45 Link Tunnels- TALO (TANGON) 34057 11920 22137
46 Desanding basin-Adits- TALO
(TANGON) 147213 49887 97327
47 DAM- TALO (TANGON) 789077 157815 631261
48 Dam toe SHP- TALO (TANGON) 28442 5688 22754
49 Intake- TALO (TANGON) 174567 34913 139654
C PROJECT ROADS
Roads leading to various project
components for both Dri & Talo
(Tangon) Limb
3671850 1101555 2570295
TOTAL 16564523 4829797 11734726
Muck, if not securely transported and dumped at pre-designated sites, can have serious
environmental impacts, such as:
Can be washed away into the main river which can cause negative impacts on the
aquatic ecosystem of the river.
Can lead to impacts on various aspects of environment. Normally, the land is cleared
before muck disposal. During clearing operations, trees are cut, and undergrowth
perishes as a result of muck disposal.
In many of the sites, muck is stacked without adequate stabilisation measures. In such a
scenario, the muck moves along with runoff and creates landslide like situations. Many a
times, boulders/large stone pieces enter the river/water body, affecting the benthic fauna
and other components of aquatic biota.
Normally muck disposal is done at low lying areas, which get filled up due to stacking of
muck. This can sometimes affect the natural drainage pattern of the area leading to
accumulation of water or partial flooding of some area which can provide ideal breeding
habitat for mosquitoes.
A detailed Muck Disposal Plan has been prepared to minimize the impact and is given in
Environmental Management Plan.
8.2.6 Road Construction
A network of roads is required to approach various locations of project site such as Dam sites,
Adits, surge shaft, powerhouse, pothead yard, Main Access Tunnel (MAT) and Tailrace Tunnel
(TRT) portal, Dumping yards, quarry locations etc. It has been assessed that about 50km length

Environmental Impact Assessment (EIA) Report of Etalin HE Project
Proponent: M/s Etalin Hydro Electric Power Company Limited (EHEPCL) 8.11
Consultant: RS Envirolink Technologies Pvt. Ltd.
of new road is required to be constructed to facilitate construction of various components. An
average gradient of 1(V) to 15(H) has been considered for proposed roads from the construction
point of view. Apart from the Project roads 35km stretch of existing roads with in project area
needs to be widened and strengthened for the movement of heavy equipment and machinery in
all weathers and round the year. All the major roads have been proposed of 40R loading class as
per IRC standards and allowing clearances on the sides, drains and parapets, the required
formation width of the road works out to be 7.5m for the free flow of traffic mostly comprising of
rear end dumpers, tippers, transit mixers and loading equipment like loaders, excavators,
backhoes. The details of the roads proposed to be constructed are given at Table 8.5.
Table 8.5: Details of Road Construction
S. No. Nomination Description of work
Road Length
based on
pegging (m)
Road alignment - Dri Limb
Upstream of dam
1 DRD1a Existing road to Ayo Pani Bridge DTB3 550
2 DRD1b DTB3 to Dri U/s Bridge DTB1 594
3 DRD1c DTB1 to DTR Inlet 585
4 DRD5 Realignment of Existing Road 672
DRD9a DTB1 to Dam top 690
DRD9b Dam top to DTB2 1240
Sub Total 4331
Downstream of Dam
5 DRD2a Existing Road to Dri D/s Bridge (DTB2) 4028
6 DRD2b DTB2 to DTL-1 Outlet 956
7 DRD2c DTL-1 Outlet to DTL-1 Inlet 638
8 DRD3 Dri Bridge DTB2 to Dam Top & Intake 1168
9 DRD4a Dri Bridge DTB2 to DTR Outlet 717
10 DRD4b Dri Bridge DTB2 to DMD3 1839
Sub Total 9346
Dri HRT
11 DRD6 Junction to Adit D1 (Kabo Pani) 1474
12 DRD7 Existing road to Adit D2 (Ru Pani) 1121
13 DRD8a Existing Road to junction (PHRD4a to
Adit D3) 2240
DRD8b Existing Road to New Dumping Yard 405
Sub Total 5240
Total (Dri Limb) 18917
Road alignment - Power House area
14 PHRD1a Existing Road to Power House Bridge
PTB1 239
15 PHRD1b Bridge PTB1 to Dri MAT MD1 861
16 PHRD2 Bridge PTB1 to Talo (Tangon) MAT MT1
than to Existing Road 995
17 PHRD3a Existing Road to Pot Head Yard 495
18 PHRD3b Pot Head Yard to Adit T9 (Talo (Tangon)
Pressure Shaft) 719
19 PHRD3c Adit T9 to Junction 1329
20 PHRD3d Junction to Dumping Yard TMD7 926

Environmental Impact Assessment (EIA) Report of Etalin HE Project
Proponent: M/s Etalin Hydro Electric Power Company Limited (EHEPCL) 8.12
Consultant: RS Envirolink Technologies Pvt. Ltd.
S. No. Nomination Description of work
Road Length
based on
pegging (m)
21 PHRD4a Adit D3 to Junction 2154
22 PHRD4b Junction to Adit D4 (Dri Surge Shaft
Bottom) 979
23 PHRD4c Adit D4 to Adit T5 (Talo (Tangon) Surge
Shaft Bottom) 1390
24 PHRD4d Adit T5 to Adit T4 (Masa Pani) 4074
25 PHRD5 Junction to Surge Shaft Top 1793
26 PHRD6 Existing Road to Adit D8 (Dri Pressure
Shaft) 750
Total (Power house area) 16704
Road alignment - Talo (Tangon) Limb
Talo (Tangon) Desilting basin
27 TRD1a Existing Road to TTB1 (Talo (Tangon)
River) 400
28 TRD1b TTB1 to TTB2 (Kun Nalla) 269
29 TRD1c TTB2 to Adit Ta (Desilting Basin) 61
30 TRD1d Adit Ta to SFT 420
Sub Total 1150
Talo (Tangon) Dam
32 TRD2 TTB1 to DT Outlet 405
33 TRD3 TTB1 to Dam Top & Intake 774
34 TRD4 Existing Road to DT Inlet 1064
Sub Total 2243
Talo (Tangon) HRT
35 TRD5a Existing Road to Talo (Tangon) Bridge
TTB3 640
36 TRD5b Talo (Tangon) Bridge TTB3 to Junction 928
37 TRD5c Junction to Dumping yard TMD6 3275
38 TRD5d TMD 6 to Adit T2 (Ron pani) 755
39 TRD6 Junction to Adit T3 (Maru Pani) 2652
TRD7 TMD 6 to Adit T1 3125
Sub Total 11375
Total (Talo (Tangon) Limb) 14768
Total Road Length for the Project 50389
The major impacts likely to accrue as a result of construction of the roads are:
Loss of forest and vegetation by cutting of trees
Geological disturbance due to blasting, excavation, etc.
Soil erosion as the slope cutting operation disturbs the natural slope and leads to land
slips and landslides.
Interruption of drainage and change in drainage pattern
Disturbance of water resources with blasting and discriminate disposal of fuel and
lubricants from road construction machinery
Siltation of water channels/ reservoirs from excavated debris
Effect on flora and fauna
Air pollution due to dust from debris, road construction machinery, etc.

Environmental Impact Assessment (EIA) Report of Etalin HE Project
Proponent: M/s Etalin Hydro Electric Power Company Limited (EHEPCL) 8.13
Consultant: RS Envirolink Technologies Pvt. Ltd.
The indirect impact of the construction of new roads is the increase in accessibility to otherwise
undisturbed areas, resulting in greater human interference and subsequent adverse impacts on
the ecosystem. Appropriate management measures required to mitigate adverse environmental
impacts during road construction have been recommended. The details of the same have been
covered in Environmental Management Plan.
8.2.7 Flora and Fauna
The most important direct impact will be the loss of forest area and other natural vegetation
coming directly under submergence; clearances for road construction, for construction of labour
camps, working areas, muck disposal sites and rock quarry sites. As there are patches of
degraded forest in the vicinity of project components due to shifting cultivation more areas will
come under degraded category due to clearing and project construction activities. The land
acquisition for project construction would require felling of large number of trees and along with
the ground vegetation too would be lost. This loss would adversely impact not only the
vegetation composition in the area but would also impact the birds and other faunal species
dependent on these forests. As from the study area 17 species of orchids were recorded and
except for 2 species all are epiphytes therefore felling of trees would lead to loss of their
populations and this aspect needs careful attention while clearing of vegetation.
Vegetation might also be lost due to erosion and land slips induced by the construction activities on
roads, camps and working sites. Excessive earth cutting along steep slopes could trigger landslides.
As already mentioned in section 8.2.1 among the indirect impacts would result from the influx
of large numbers of workers into the area during the construction period as this might will put an
additional burden on the natural resource base in the area, in particular the forest resources.
Unless otherwise provided for, the people will harvest fuel wood, timber for construction and
various plants and wildlife for food. The contractor is supposed to provide kerosene for light and
cooking in the camps. More difficult will be to control use of forest and land resources caused by
the influx of casual labourers and employment seekers.
Regarding the wildlife in the study area no significant impact however is foreseen as the habitats
of some of the large mammals reported from the area listed as vulnerable in IUCN Red list
(Asiatic Black Bear and Wild dog) will not be significantly influenced by the project development,
as they are found in the dense forests which are located on higher reaches part of the upper
catchment far away from the settlements and are restricted primarily in Dibang Wildlife
Sanctuary which is more than 28 km away (aerial distance) from the project area.
8.2.8 Impacts Summary during Construction Phase
Impact of above activities on various components of the environment during construction phase
of the project are tabulated and given at Table 8.6.

Environmental Impact Assessment (EIA) Report of Etalin HE Project
Proponent: M/s Etalin Hydro Electric Power Company Limited (EHEPCL) 8.14
Consultant: RS Envirolink Technologies Pvt. Ltd.
Table 8.6: Summary of Impacts During Construction Phase
Component of
Environment
Source/Reason of Impact Quantification, where possible
Air Environment
Fugitive Emissions from
storage of construction
material in open area
Fine and coarse aggregate requirement for construction has been estimated as 18.92 lakh m3 and
32.82 lakh m3; open storage in different construction areas will lead to generation of fugitive dust
in the area
Increase in movement of
vehicles
In addition to coarse and fine aggregate; structural steel, cement and other raw material will be
transported to the area requiring movement of heavy transport vehicles (trucks, dumpers, etc.) in
the area; additionally transport vehicles (jeeps) will be required for movement of manpower in the
area. This will substantially increase the traffic in other wise low traffic density area and hence lead
to air and noise pollution.
Operation of construction
Plants, Machineries, Workshops
For construction of project components plants and workshops will be set up and construction
machinery and equipment will be deployed. A list of such equipment is prepared project component
wise and is enclosed as Table 8.3. Their operation will generate pollution in all manifestations viz.
air, water, noise including solid and hazardous waste.
Operation of DG sets for power
Requirement
27MW of power supply through DG sets has to be arranged. 7 DG-Houses has been envisaged with
different capacities of DG sets to meet the project demand. It would lead to emissions due to fuel
burning in the area where ambient air is free from such pollutants.
Quarrying Operations 62.12 ha of land is identified as rock quarry area divided between two quarry sites viz. near Akobe
Nala and near Ayo Pani Nala. Quarrying operation and transportation of quarried material generate
air and noise pollution.
Muck handling and transport The project would generate substantial quantity of muck from excavation of various structures. The
total quantity of muck generated from open excavation including construction and widening of the
roads is 165.65 lakh cum and the utilization of muck for different project components and
considering the swell factor total estimated quantity to be disposed of is about 117.34 lakh cum.
Most of the excavated material is proposed to be dumped at 12 suitable locations identified
specifically for this purpose with 7 sites along Dri limb, 1 sites near powerhouse location and 4 sites
along Talo (Tangon) limb. Transportation and handling such large quantity of muck will lead to air
pollution in the area.
Noise and
Vibration
Increase in movement of
vehicles
As discussed above
Operation of construction
Plants, Machineries, Workshops
As discussed above
Operation of DG sets for power
Requirement
As discussed above
Blasting operations for
tunneling and quarrying
Potential environmental impacts of blasting include ground vibration (seismic waves), air
overpressure, noise, dust and fly rock. Vibrations transmitted through the ground and pressure
waves through the air are the most common impacts of blasting operations. Depending upon the

Environmental Impact Assessment (EIA) Report of Etalin HE Project
Proponent: M/s Etalin Hydro Electric Power Company Limited (EHEPCL) 8.15
Consultant: RS Envirolink Technologies Pvt. Ltd.
Component of
Environment
Source/Reason of Impact Quantification, where possible
location of the habitation, it can even damage the houses during the operation.
Water
Environment
Effluent from construction plant
and workshops
A list of construction equipment is prepared project component wise and is given at Table 8.3.
Their operation will generate pollution in all manifestations viz. air, water, noise and solid and
hazardous waste. As some of the equipment will use water and discharge effluent, uncontrolled
discharge will led to ground and surface water pollution.
Muck Disposal The project would generate substantial quantity of muck from excavation of various structures. The
total quantity of muck generated from open excavation including construction and widening of the
roads is 165.65 lakh cum and the utilization of muck for different project components and
considering the swell factor total estimated quantity to be disposed of is about 117.35 lakh cum.
Most of the excavated material is proposed to be dumped at 12 suitable locations identified
specifically for this purpose with 7 sites along Dri limb, 1 sites near powerhouse location and 4 sites
along Talo (Tangon) limb. As most of the operation is along the riverbank, spillage of muck will lead
to water pollution unless the operation is efficiently controlled.
Sewage from construction
camp and colonies
It is estimated that during the peak construction period, about 10600 persons will migrate to the
area to stay in construction camps and work on project. Sewage from workers colony/construction
camp can lead to serious water pollution if adequate treatment measures are not put in place.
Land
Environment
Change of Land use 1155.11 ha of land will be acquired for the project construction and land use of this land will
change permanently. This is a permanent impact and no mitigation/management measures can be
implemented for the entire land. However, land acquired for temporary construction camps, muck
dumping and quarrying, etc. will be restored to bring back it to its original land use.
Loss of top cover in
quarry/burrow area
62.12 ha of land is identified as burrow area. Quarrying operation lead to removal of top cover and
unless the area is restored it impacts the land environment and spoils the aesthetics of the region.
Restoration of quarrying area is included in the Environment Management Plan (EMP).
Land deterioration due to muck
disposal
12 dumping sites have been identified with 7 sites along Dri limb, 1 sites near powerhouse location
and 4 sites along Talo (Tangon) limb with total area of 113.70 ha. This land will be impacted due to
muck dumping; however, Muck Disposal Plan will ensure that area is restored on completion of the
muck dumping process so that impact remains temporary.
Land deterioration due at
construction sites, labour
camps/colonies
16 ha of land have been identified as construction facilities area. This land will get impacted due to
movement of vehicles, installation and use of construction equipment leading to discharge of
pollutants in atmosphere. However, these impacts will be temporary as the land can be restored
after completion of construction phase. Restoration of construction facility area is included in the
EMP.
Indiscriminate solid waste
disposal
About 10600 persons are expected to migrate in the area during peak construction period.
Construction and colony for workers and officers will generate solid waste - biodegradable as well as
non-biodegradable. Littering of solid waste on hill slopes creates an unaesthetic scene also.
Therefore, there is a need to implement a solid waste management plan to ensure that this waste
will not create serious land and ground water pollution.

Environmental Impact Assessment (EIA) Report of Etalin HE Project
Proponent: M/s Etalin Hydro Electric Power Company Limited (EHEPCL) 8.16
Consultant: RS Envirolink Technologies Pvt. Ltd.
Component of
Environment
Source/Reason of Impact Quantification, where possible
Disposal of hazardous and
biomedical waste on land
Hazardous waste will be generated during construction phase from machinery and equipment using
fuel, lubricating oil, batteries, etc. Empty oil drums, used oil, maintenance/cleaning clothes, used
batteries, etc. will constitute hazardous waste. Quantity of the hazardous waste expected to be
generated cannot be estimated at this stage however, it is not expected to be large and can be
managed by developing a temporary secured storage location and then transporting the waste to
the nearest available TSDF.
Biomedical Waste will be generated from the dispensaries set up to take care of workers medical
needs; however, quantity is not expected to be very large. Therefore, biomedical waste will be
securely kept in dispensary and will be transported to the nearest government/private hospital
where an incinerator is installed for disposal of biomedical waste. As the quantity is not expected to
be large, capacity of the host incinerator should not pose a constraint.
Flora
Loss of forest area due to
project construction
The project construction would require acquisition of 1165.66 ha of forest land (1074.329 ha
surface area including river bed + 91.331 ha underground area). All the vegetation on this land will
be cleared for construction of project component. This is a permanent impact and can only be
compensated by Compensatory Afforestation for which detailed plan shall be prepared by the State
Forest Department as per Forest (Conservation) Act, 1980.
Tree cutting by workers for fuel
wood/heating/furniture etc.
In addition to loss of forestland due to project construction, there is a potential impact of tree
cutting by migratory labour force that would have fuel wood requirement and timber requirement
for heating, furniture, etc. This impact can be mitigated by ensuring that labor’s fuel and timber
requirement is taken care of. A plan prepared in this regard is included as part of EMP.
Fauna
Impact on Fish migration The obstruction created by the dams would hinder the migration of certain commercial species
especially Schizothorax spp. These fishes undertake annual migration for feeding and breeding.
Therefore, fish migration path may be obstructed due to 101.5m and 80m high Dri and Talo
(Tangon) dams and fishes are expected to congregate below the dam walls. Under this situation
poaching activities may increase in the area.
Most of the species will shift to the section of the river where they find favorable environment for
breeding since the dams are 101.5m and 80m high, the construction of fish ladder is not feasible in
the proposed dams. However, it is proposed that the artificial seed production in hatchery may be
adopted which can be stocked in the river stretches downstream and upstream of the proposed
dams.
The Schizothorax species are steno-thermal. During winter months, they migrate from headwaters
near flood plains in search of suitable feeding and breeding grounds. The sampling in Dri and Talo
(Tangon) rivers both on upstream and downstream of the proposed dam sites for macro-benthic life
gave 2 units/sq m of fry of Schizothorax sp. This observation further strengthens the fact that
Schizothorax spp. migrate during winter months. With the onset of summer season, these species
migrates upstream. These species during project construction phase are likely to congregate in the
reservoir. It is expected that in due course of time these species will adapt themselves to the
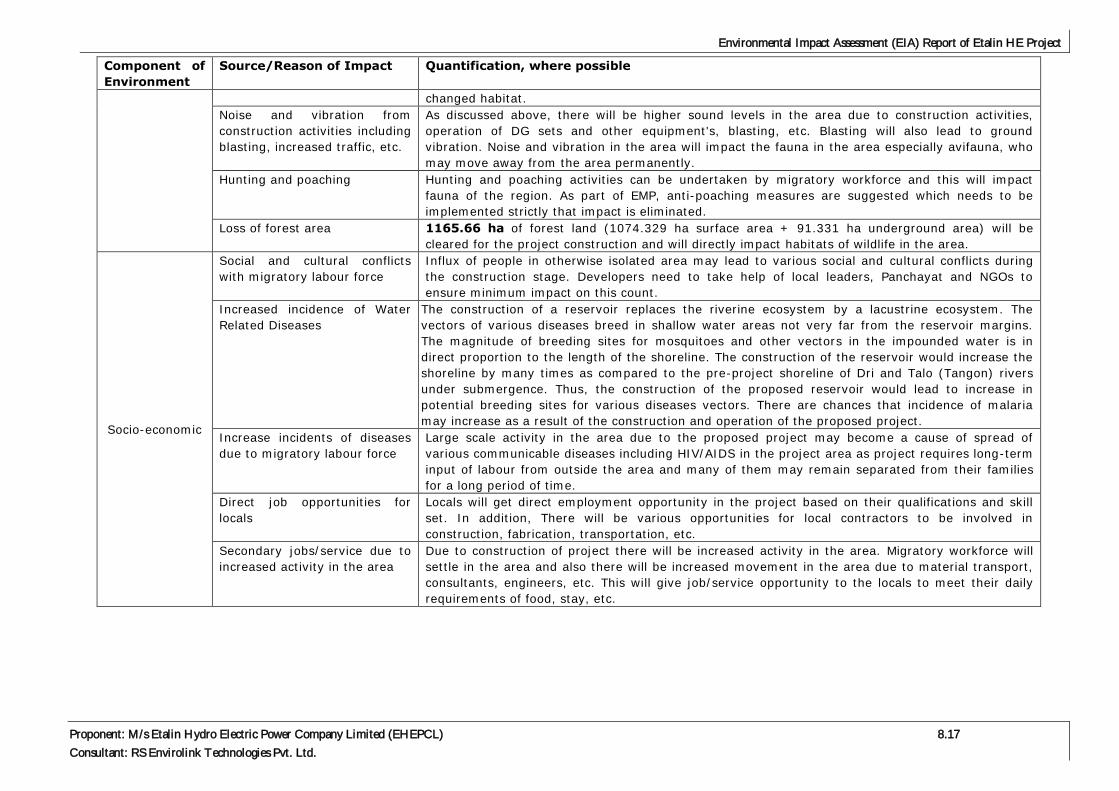
Environmental Impact Assessment (EIA) Report of Etalin HE Project
Proponent: M/s Etalin Hydro Electric Power Company Limited (EHEPCL) 8.17
Consultant: RS Envirolink Technologies Pvt. Ltd.
Component of
Environment
Source/Reason of Impact Quantification, where possible
changed habitat.
Noise and vibration from
construction activities including
blasting, increased traffic, etc.
As discussed above, there will be higher sound levels in the area due to construction activities,
operation of DG sets and other equipment's, blasting, etc. Blasting will also lead to ground
vibration. Noise and vibration in the area will impact the fauna in the area especially avifauna, who
may move away from the area permanently.
Hunting and poaching Hunting and poaching activities can be undertaken by migratory workforce and this will impact
fauna of the region. As part of EMP, anti-poaching measures are suggested which needs to be
implemented strictly that impact is eliminated.
Loss of forest area 1165.66 ha of forest land (1074.329 ha surface area + 91.331 ha underground area) will be
cleared for the project construction and will directly impact habitats of wildlife in the area.
Socio-economic
Social and cultural conflicts
with migratory labour force
Influx of people in otherwise isolated area may lead to various social and cultural conflicts during
the construction stage. Developers need to take help of local leaders, Panchayat and NGOs to
ensure minimum impact on this count.
Increased incidence of Water
Related Diseases
The construction of a reservoir replaces the riverine ecosystem by a lacustrine ecosystem. The
vectors of various diseases breed in shallow water areas not very far from the reservoir margins.
The magnitude of breeding sites for mosquitoes and other vectors in the impounded water is in
direct proportion to the length of the shoreline. The construction of the reservoir would increase the
shoreline by many times as compared to the pre-project shoreline of Dri and Talo (Tangon) rivers
under submergence. Thus, the construction of the proposed reservoir would lead to increase in
potential breeding sites for various diseases vectors. There are chances that incidence of malaria
may increase as a result of the construction and operation of the proposed project.
Increase incidents of diseases
due to migratory labour force
Large scale activity in the area due to the proposed project may become a cause of spread of
various communicable diseases including HIV/AIDS in the project area as project requires long-term
input of labour from outside the area and many of them may remain separated from their families
for a long period of time.
Direct job opportunities for
locals
Locals will get direct employment opportunity in the project based on their qualifications and skill
set. In addition, There will be various opportunities for local contractors to be involved in
construction, fabrication, transportation, etc.
Secondary jobs/service due to
increased activity in the area
Due to construction of project there will be increased activity in the area. Migratory workforce will
settle in the area and also there will be increased movement in the area due to material transport,
consultants, engineers, etc. This will give job/service opportunity to the locals to meet their daily
requirements of food, stay, etc.

Environmental Impact Assessment (EIA) Report of Etalin HE Project
Proponent: M/s Etalin Hydro Electric Power Company Limited (EHEPCL) 8.18
Consultant: RS Envirolink Technologies Pvt. Ltd.
8.3 IMPACTS DURING OPERATION PHASE
On completion of the construction of the project, the land used for construction activities, muck
dumping, quarrying, etc. will be restored. Construction workers who have resided in that area
will move to other areas. By ensuring all the mitigation and management measures, as planned
for this project, are implemented to minimize the impact of construction phase, large part of the
area will go back to its original form. However, there will be some permanent changes such as
dam across the river, reservoir formation, powerhouse and project colony. Hydropower projects
are considered as clean source of renewable energy as there are no significant pollution
generation sources during project operation. There is no air and water pollution from the project
operation. Similarly generation of solid and hazardous waste is also insignificant.
One critical impact of operation of hydropower projects has received substantial attention from
environmentalists in last two to three decades based on the observations made on operational
projects in developed countries is the decrease in flow in the downstream stretch. Diversion of
water from dams to powerhouse will make the intermediate stretch of the river almost dry
especially during lean season. Impact becomes significant if several projects are planned in
cascade and/or large headrace tunnels making the intermediate stretch (es) very large. Low flow
in the section of the river adversely impacts the aquatic ecology including fish fauna, riparian
vegetation and fauna dependent on it; and downstream users. These impacts cannot be totally
mitigated, however, they can be minimized by scientifically assessing the environmental flow
requirement of the intermediate stretch not only in lean season but also in other months.
8.3.1 Downstream Impacts
During construction phase the water of the river will be not stored and the natural flow of the
river will be available throughout the stretch. However during the operation phase, flow in the
stretch downstream of dam due to diversion of water through head race tunnel would lead to
reduction of water in the downstream river stretch. It will leave areas dry and the river water will
remain mainly in the centre portion especially in the 16.5 km downstream stretch of Dri river and
about 18 km stretch of Talo (Tangon) river (see Figure 8.1). Thereafter one small stream Ari
Pani joins Dri about 800m downstream but good contribution is made by Emi Pani on the right
bank about 1.8km downstream of Dri dam. Then another stream named Ayu Pani contributes
good amount of discharge on the right bank further 1.3 km d/s.
Similarly, in case of Talo (Tangon) limb also immediately about 800m downstream of dam axis
Kun Nala joins Talo (Tangon) on its right bank and adds significant flow into main channel.
Thereafter Anon Pani meets Talo (Tangon) river on its left bank at a distance of about 1.80 km
from the dam and significantly contributes to the discharge of Talo (Tangon) river. In addition 2
more tributaries contribute to the discharge of Talo (Tangon) within 3 km downstream of Talo
(Tangon) dam axis. These streams are Shu and Non nalas. Further about 4.7 km downstream 3
to 4 streams contribute significantly to the flow of Talo (Tangon) river.
Therefore, the reduced flow in river in the initial 1.8 km stretch on Dri Limb and about 3 km on
Talo (Tangon) limb will affect the habitat of many aquatic species which are located along the
shallow banks. At certain places in the river some water might remain in shallow pools subjecting
the fish to prey by birds and human beings. Such situations will result in indiscriminate fishing.
The condition will be more critical during the lean season when volume of water is significantly

Environmental Impact Assessment (EIA) Report of Etalin HE Project
Proponent: M/s Etalin Hydro Electric Power Company Limited (EHEPCL) 8.19
Consultant: RS Envirolink Technologies Pvt. Ltd.
reduced in the river. Certain stretches of the river may even create semi-desiccation condition
due to reduction of flow rate which ultimately affect the river ecology and some aquatic species
might perish due to arid conditions of the river. The inhabitants of downstream area villages will
also be affected which are involved in fishing activity for themselves and sometimes to sell in
local market as an alternative means for procurement of food and other requirement of daily
needs.
It is well established that running waters have a self-purifying capacity, which is directly related
to its flow regime. After the reduction in water discharge it loses its capacity of self-purify due to
the changes in chemical composition. Creation of a reservoir would lead to siltation; therefore,
downstream section would receive water with low turbidity and lower water current velocity. The
downstream stretch would receive lower nutrients in the water and free of any turbidity as silt
carries essential nutrients. The regulated flow of water in the downstream would lead to
instability in the biotic communities. The shallowness in water of downstream in lean season
would increase the water temperature, which would affect the dissolved oxygen contents
adversely. Aquatic life comprised of algae, macro-invertebrates, macrophytes, fish, etc. will be
affected adversely. The species like desmids, chironomids and loach fish can thrive
predominantly in downstream stretch that would carry low nutrient, high TDS, low DO and high
BOD in water.
8.3.2 Impact on Migratory Fishes
About 16.5 km and 18 km downstream of Dri and Talo (Tangon) river stretches, respectively will
experience comparative scarcity of water due to the diversion which would lead to changes in the
water quality. The proposed dams would act as permanent barrier in the way of fish movement.
Ichthyofauna of Dri and Talo (Tangon) rivers comprised of number of fish species out of which
Schizothorax richardsonii is only species which is harvested for fishery purpose. It undertakes
annual upward and downstream migration for feeding and breeding purposes. Therefore, fish
migration path may be obstructed due to 101.5 m and 80 m high Dri and Talo (Tangon) dams
and fishes are expected to congregate below the dam walls. Under this situation poaching
activities may increase in the area.
Most of the species will shift to the section of the river where they find favourable environment
for breeding and spawning. The Schizothorax species are steno-thermal fish and they migrate
during winter months from headwaters zone to near flood plains in search of suitable feeding and
breeding grounds. The present study indicated that the Schizothorax spp. found in the Dri and
Talo (Tangon) rivers only during the winter months of the year. This observation further
strengthens the fact that Schizothorax spp. undertakes migration during winter months when the
temperature of water reaches near freezing point. This induces them to migrate downstream and
frequent the warmer spring-fed streams in search of suitable spawning grounds and travels back
with the onset of summer season. During project construction phase this species is likely to
congregate in the reservoir. It is expected that in due course of time this species will adapt to the
changed habitat.
8.3.3 Impact on Downstream Users
Due to diversion of water for power generation the flow in the downstream stretch would be
considerably reduced and impact would most visible during lean. There are 5 villages viz. Emilin,

Environmental Impact Assessment (EIA) Report of Etalin HE Project
Proponent: M/s Etalin Hydro Electric Power Company Limited (EHEPCL) 8.20
Consultant: RS Envirolink Technologies Pvt. Ltd.
Akobe, Cheyo, Granli, and Ahunli which fall between Dri limb dam site and power house and who
could be directly or indirectly dependent upon river. In case of Talo (Tangon) limb axis 6 villages
cum hamlets are located in the downstream stretch viz. Punli, Echanli, Arumli, Amoli, Aninka,
and Emilin. A small population resides in this stretch. During the surveys it was observed that
people are not dependent on the main channel i.e. Dri and Talo (Tangon) rivers for their drinking
water needs or any other purpose except for occasional fishing. They instead are dependent upon
the streams that join the main river.
8.3.4 Impact on Reservoir Water Quality
The flooding of previously forest and agricultural land in the submergence area will increase the
availability of nutrients resulting from decomposition of the vegetative matter. Phytoplankton
productivity can supersaturate the euphotic zone with oxygen before contributing to the
accommodation of organic matter in the sediments. Enrichment of impounded water with organic
and inorganic nutrients will be the main water quality problem immediately on commencement of
the operation. However, this phenomenon is likely to last for a short duration of few years from
the filling up of the reservoir.
Other impacts of the operation phase include formation of reservoir impacting the water quality
and aquatic ecology, pollution generation from colony and plant and positive as well negative
impacts on socio-economic environment mainly due to improved infrastructure in the area. These
impacts are summarized at Table 8.7.
8.3.5 Minimum Environmental Flow Requirement
In order to conform to the guidelines of MoEF&CC regarding the minimum environmental flows to
be released especially during the lean season a provision of additional units of 19.6 MW on Dri
Limb and 7.4 MW on Talo (Tangon) Limb power stations have been planned in the design of
Etalin HE project to ensure that adequate flow is released for aquatic life in downstream stretch
at all the time. The proposed additional units totaling 27 MW would operate continuously
throughout the year (24 x 7). The rated discharge worked out as 30.64 m and 19.52 m3/s,
respectively. The rated discharge value has been taken as 20% of the average mean value of the
lean season (December – March: 4 months). In addition as already discussed in previous
sections there are number of tributaries that join Dri and Talo (Tangon) rivers immediately
downstream of respective dams. However the requirement of minimum environmental flow has
been assessed by Central Inland Fisheries Research Institute, (CIFRI), Barrackpore as per TOR
requirement. The Environmental Flow report of CIFRI, Barrackpore has been appended as a
separate report.

Environmental Impact Assessment (EIA) Report of Etalin HE Project
Proponent: M/s Etalin Hydro Electric Power Company Limited (EHEPCL) 8.21
Consultant: RS Envirolink Technologies Pvt. Ltd.
Table 8.7: Summary of Impacts During Operation Phase
Component of
Environment
Source/Reason of Impact Quantification, where possible
Air Environment No significant air pollution during operation phase
Noise and
Vibration
Noise and vibration from
turbines
A common underground power house of size 352m(L) x 23.5m(W) x 59.73m (H) with six
units of 307 MW at Dri Limb and four units of 307 MW at Talo (Tangon) Limb and two tail
race channel discharging into the river is envisaged. Noise and vibration inside the
powerhouse will be high especially during operation time when turbines are running at under
capacity. Noise levels are expected to be in the range of 95-100 dB(A) at 1m from the
source. These turbines will be housed within the underground powerhouse building, which
will provide sufficient attenuation, therefore, impact of noise outside the powerhouse on the
surface is not significant. Work instructions will be developed for workers working in the high
noise area so as to limit their exposure to high noise and encourage the use of PPEs.
Water
Environment
Reduced flow round the year
in the river stretch between
dams and powerhouse
This is one of the most serious impacts of hydropower projects during their operation phase.
Operation of the plant will involve diversion of water by 101.5m and 80m high Dri and Talo
(Tangon) dams, through HRTs of 10.722 km and 13.045 km lengths, respectively to a
underground powerhouse. The intermediate Dri river length of 16.5 km and 18 km of Talo
(Tangon) river will become dry throughout the year but for the mandatory environmental
flow releases. Reduced flow in the intermediate stretch will alter the aquatic ecology and
change the fish habitat altogether. To minimize this impact, a detailed environment flow
assessment exercise will be carried and recommended flow will be released.
Formation of reservoir The flooding of previously forest and agricultural land in the submergence area will increase
the availability of nutrients resulting from decomposition of the vegetative matter.
Phytoplankton productivity can supersaturate the euphotic zone with oxygen before
contributing to the accommodation of organic matter in the sediments. Enrichment of
impounded water with organic and inorganic nutrients will be the main water quality problem
immediately on commencement of the operation. However, this phenomenon is likely to last
for a short duration from the filling up of the reservoir.

Environmental Impact Assessment (EIA) Report of Etalin HE Project
Proponent: M/s Etalin Hydro Electric Power Company Limited (EHEPCL) 8.22
Consultant: RS Envirolink Technologies Pvt. Ltd.
Component of
Environment
Source/Reason of Impact Quantification, where possible
The damming of river Dri and Talo (Tangon) rivers will result in creation of 83.32 ha of Dri
reservoir 36.12 ha of Talo (Tangon) reservoir. The dams will change the fast flowing river to
a quiescent lacustrine environment. The creation of a pond will bring about a number of
alterations in physical, abiotic and biotic parameters both in upstream and downstream
directions of the proposed dam sites. The micro and macro benthic biota is likely to be most
severely affected as a result of the proposed project.
The positive impact of the project will be the formation of a water body which can be used
for fish stocks on commercial basis to meet the protein requirement of region. The
commercial fishing in the proposed reservoir would be successful, provided all tree stumps
and other undesirable objects are removed before submergence. The existence of tree
stumps and other objects will hinder the operation of deep water nets. The nets will get
entangled in the tree stumps and may be damaged.
The reduction in flow rate of Dri and Talo (Tangon) rivers especially during lean period is
likely to increase turbidity levels downstream of the dams. Further reduction in rate of flow
may even create condition of semi-desiccation in certain stretches of the river. This would
result in loss of fish life by poaching. Hence, it is essential to maintain minimum flow
required for sustenance of riverine fisheries till the disposal point of the tail race discharge
Sewage from project colony During the operation phase, due to absence of any large-scale construction activity, the
cause and source of water pollution will be much different. Since, only a small number of
O&M staff will reside in the area in a well-designed colony with sewage treatment plant and
other infrastructural facilities, the problems of water pollution due to disposal of sewage are
not anticipated. The treated sewage will be reused for gardening and green belt around the
colony.

Environmental Impact Assessment (EIA) Report of Etalin HE Project
Proponent: M/s Etalin Hydro Electric Power Company Limited (EHEPCL) 8.23
Consultant: RS Envirolink Technologies Pvt. Ltd.
Component of
Environment
Source/Reason of Impact Quantification, where possible
Land
Environment
There will not be any negative impact on land during operation phase. Change of land-use is
a permanent impact and has been covered under construction phase. There will be positive
impact on land as part of the land used for temporary activities will be restored to natural
conditions. This would include quarry areas (62.12 ha), muck disposal area (91.79 ha) and
land used for construction work.
Flora and fauna
There will be no negative impact on flora of region during the operation phase. Impact on
riparian vegetation and aquatic flora due to reduced flow in the intermediate stretch has been
covered under water environment. Implementation of biodiversity conservation and
management plan, catchment area treatment plan and compensatory afforestation plan will
have positive impacts on flora in the area. Development of green belt in the project activity
area and along the periphery of the reservoir will also have positive impact. Additionally,
restoration of land used for muck dumping, construction activity, etc. will also have positive
impact on the flora.
During project operation phase, the accessibility to the area will improve due to construction
of roads, which in turn may increase human interferences leading to marginal adverse
impacts on the terrestrial ecosystem. Since significant wildlife population is not found in the
region, no major adverse impacts are anticipated on this account.
Socio-economic
Project construction will lead to large-scale infrastructure development in the area. Due to
development of road network, accessibility to the area will significantly improve. Local area
development activities planned as part of the project will not only benefit the project-affected
families but also other people residing in the area including that of nearby villages. Setting up
of school, health care facilities, skill development activity center, vocational training center,
etc. will ensure higher education and skill levels of the local population. Provision of
scholarships will help deserving students to go for higher studies. Overall it is expected that
quality of life of the local population will improve due to setting up of the project in the area.

Environmental Impact Assessment (EIA) Report of Etalin HE Project
Proponent: M/s Etalin Hydro Electric Power Company Limited (EHEPCL) 8.24
Consultant: RS Envirolink Technologies Pvt. Ltd.
Figure 8.1: Drainage downstream of Dri and Talo (Tangon) dam sites
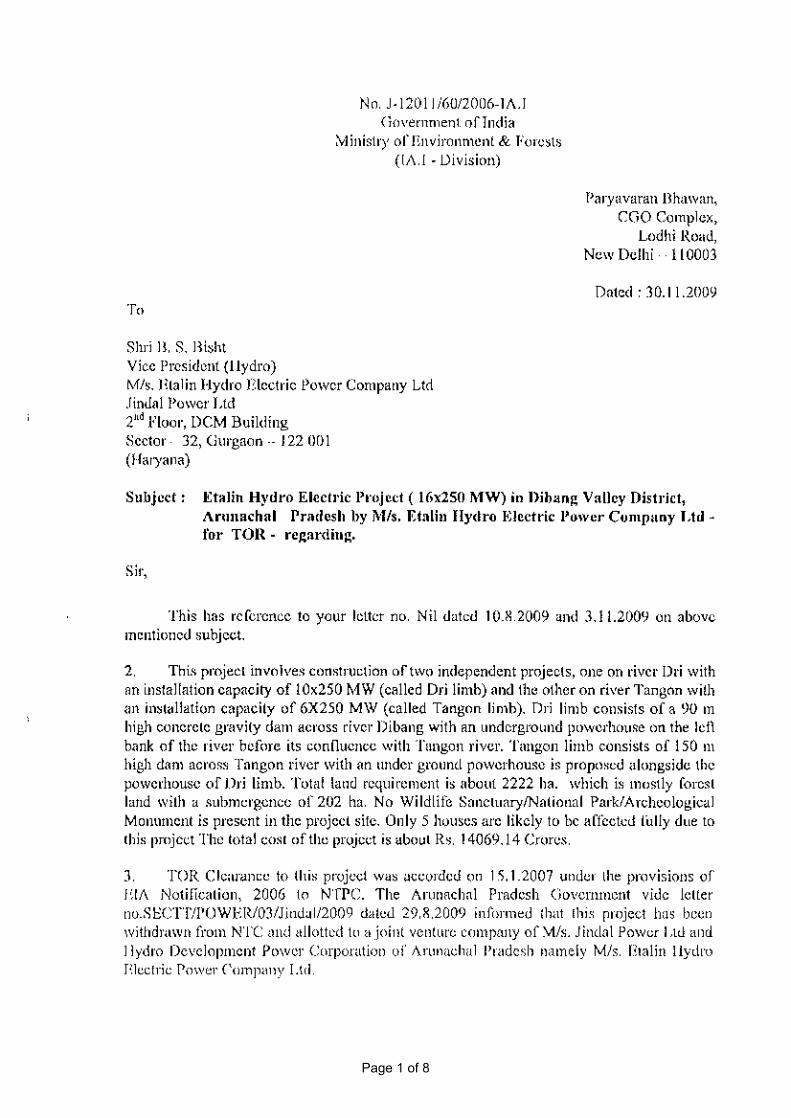
Page 1 of 8

Page 2 of 8
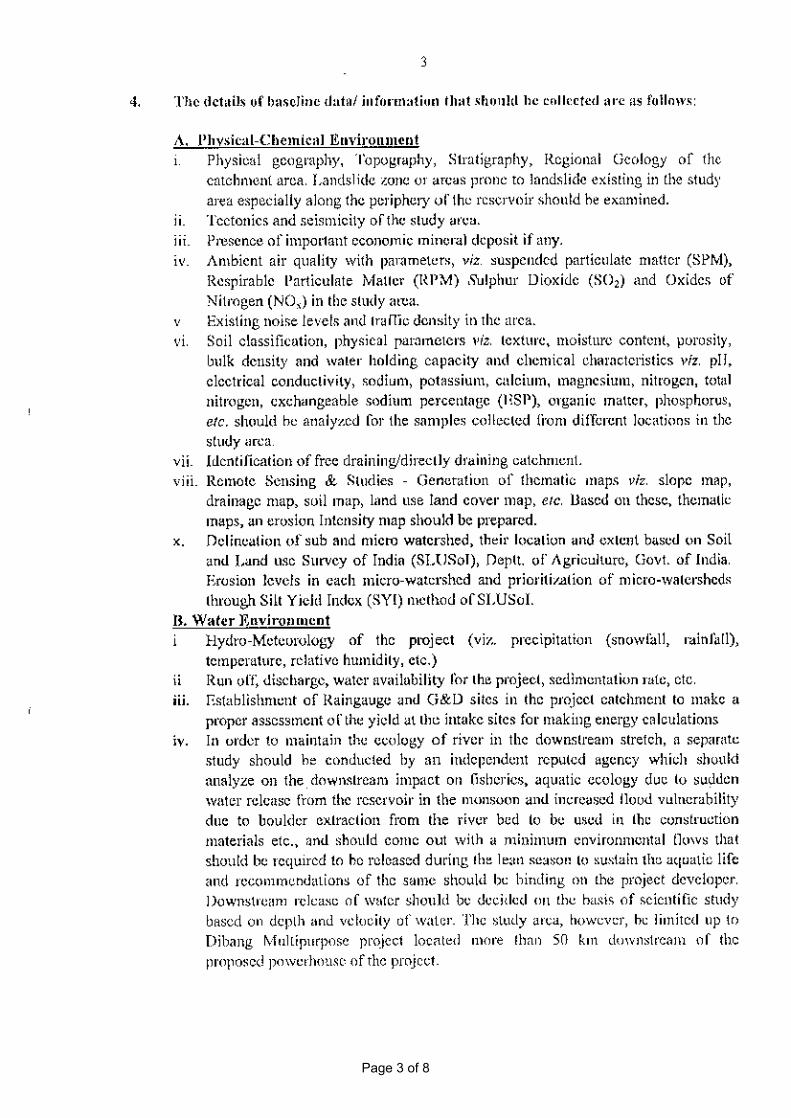
Page 3 of 8

Page 4 of 8

Page 5 of 8

Page 6 of 8
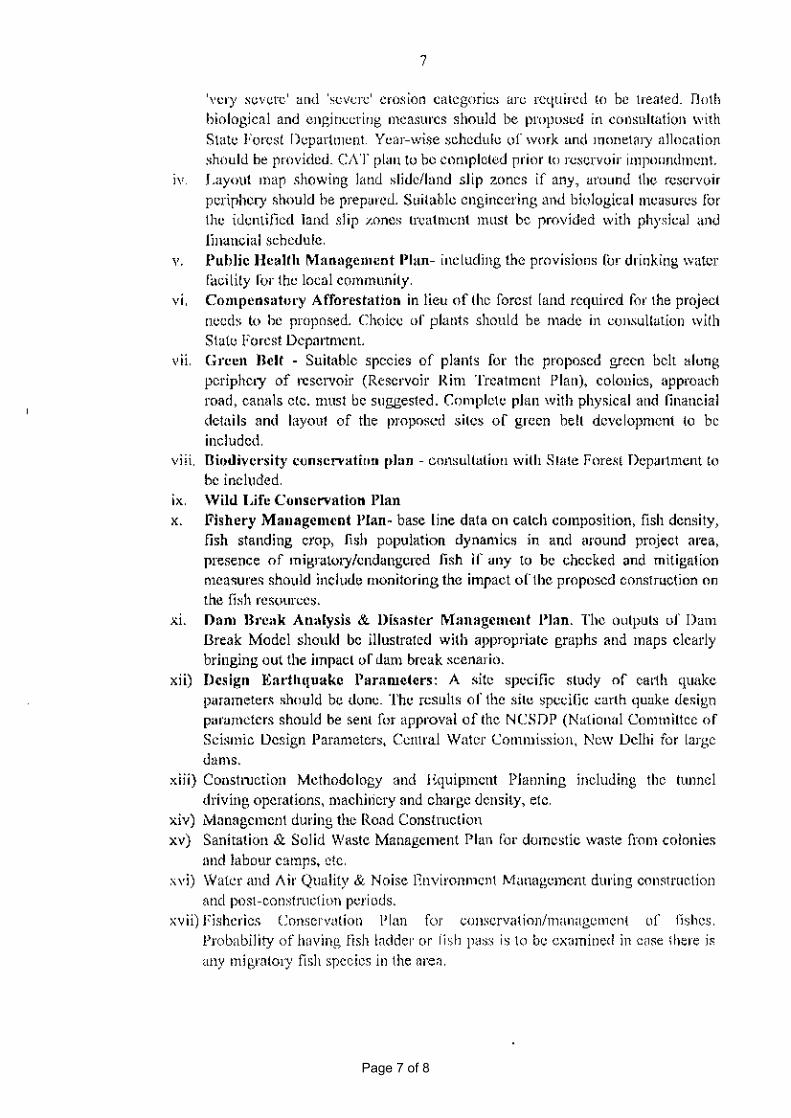
Page 7 of 8

Page 8 of 8


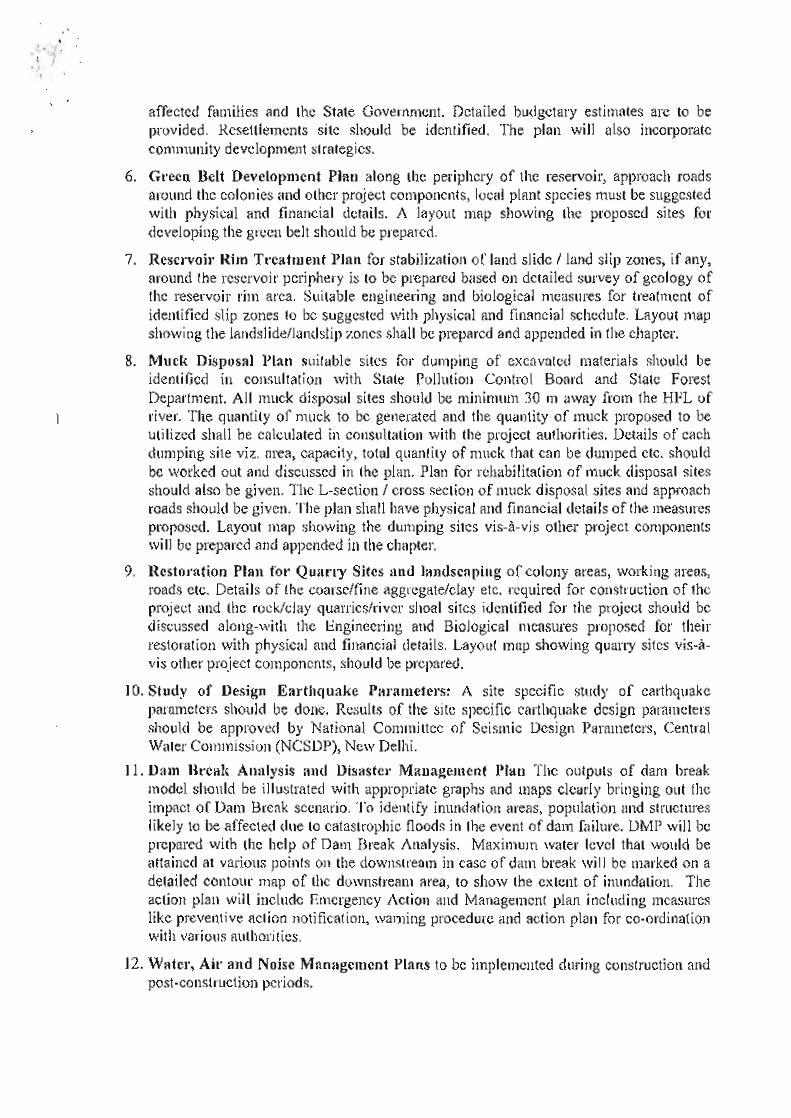
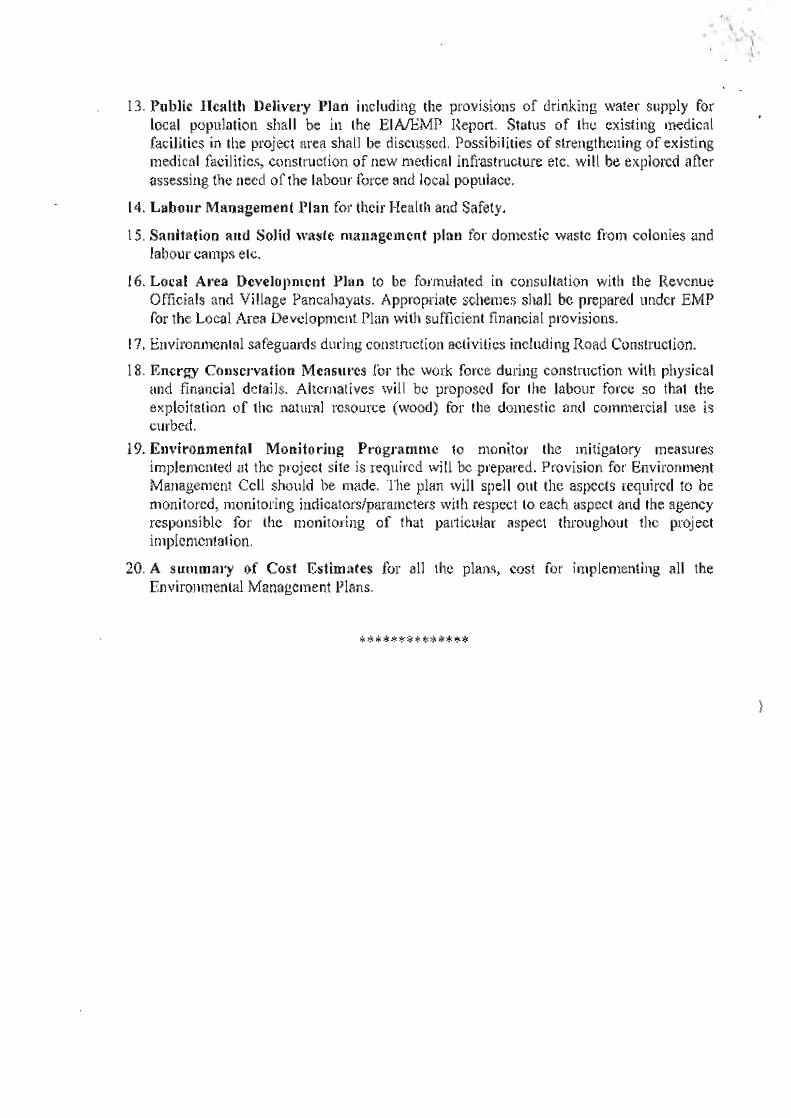

Annexure - III
ToR Compliance-Etalin HEP
S. No
Clause in ToR Compliance Remarks
ToR letter No.12011/60/2006-IA.I,
dated 30-11-2009
I General Introduction giving details of the salient features of the proposed project
Covered in Table 2.1 of EIA, Project Description, Chapter-2.
Layout map of the project to be given
along with contours with project
components clearly marked with a proper scale and printed at least on A3 scale for clarity, Study area to be demarcated properly on the appropriate scale map,
Sampling sites to be depicted on map for each parameter with proper legends
Covered in Figure 2.2 of EIA, Project
Description, Chapter-2.
Covered in Figure 3.1 of EIA,
Methodology, Chapter-3.
II Environmental Impact Assessment (EIA) Report
The baseline studies should consist of 3 seasons field data (i.e. Pre–monsoon, Post monsoon and winter season) covering one calendar year.
Covered in Environmental baseline status i.e. Chapter 6, Physico-Chemical Environment and Chapter- 7: Biological Environment.
Study Area:
1 The study area should comprise of the following: Catchment Area up to the dam site Submergence Area Project Area or the direct impact area should comprise of area within 10 km
radius of the main project components like dam, power house, etc. and also area within 10 km upstream of reservoir tail & 10 km distance from the reservoir rim along both the river banks.
Covered in 3.2 of Methodology i.e. Chapter 3.
2 Detailed methodology followed for the
analysis of various parameters required for EIA.
Covered in Chapter 3.
3 Various details regarding the project layout etc. should be depicted in proper scale maps at least at 1:15,000 like:
Location map of proposed HE project
Location map of the project area with contours indicating main project features,
Drainage map of the river catchment up to the proposed project site,
Soil map of the project area Geological and Seismo-
Location map is given in Figure 1.1 of Introduction i.e. Chapter 1
Drainage map covered in Fig no. 2.1 of CAT plan, Chapter- 2

tectonic map of the area surrounding the proposed project site showing location
of barrage site, power house site and tunnel alignment, and
False Color Composite (FCC) generated from satellite data of project area and land-
use/land-cover prepared from these images.
Soil map covered in Fig no. 2.6 of CAT plan, Chapter- 2
Land use/ land cover map covered in Fig no. 2.4 of CAT plan, Chapter- 2
4. The details of the baseline data/information that should be collected are as follows:
(A) Physical-Chemical Environment
i Physical geography, Topography, Stratigraphy, Regional Geology of the catchment area. Landslides zone or areas prone to landslide existing in
the study area especially along the periphery of the reservoir should be examined.
Covered in 6.3 of Baseline status-Physico–Chemical Parameters, Chapter-6
Geology covered in Chapter-5 as Annexure-V of EIA Volume
ii Tectonics and seismicity of the study area.
Covered in 5.1 of Chapter-5 as Annexure-V of EIA Volume
iii Presence of important economic mineral deposit if any.
Covered in 5.1 of Chapter-5 as Annexure-V of EIA Volume
iv Ambient air quality with parameters, viz suspended particulate
matter(SPM), Respirable Particulate
Matter(RPM), Sulphur Dioxide(SO2) and Oxides of Nitrogen) in the study area.
Covered in Air Environment, 6.5, Baseline status-Physico –Chemical
Parameters, Chapter-6.
v Existing noise levels and traffic density in the area.
Covered in Noise & Traffic, 6.6, Baseline status-Physico –Chemical Parameters, Chapter-6.
vi Soil classification, physical parameters, viz. texture, moisture content, porosity, bulk density and water holding capacity and chemical characteristics viz. pH, electrical conductivity, sodium, potassium,
calcium, magnesium, nitrogen, total
nitrogen, exchangeable sodium percentage (ESP), organic matter, phosphorus, etc should be analyzed for the samples collected from different locations in the study area.
Covered in 6.4 -Baseline status-Physico –Chemical chapter, Chapter-6
vii Identification of free draining/directly draining catchment.
Covered in 2.4 of CAT plan, Chapter-2 of EMP
viii Remote Sensing & Studies- Generation of thematic maps viz. slope map, drainage map, soil map,
land use land cover map, etc. Based on these, thematic maps, an erosion intensity map should be prepared.
Covered in Figures 2.1 to 2.6 of CAT plan, Chapter-2
x Delineation of sub and micro
watershed, their location and extent
based on soil and Land use Survey of
Covered in Figure 2.4.1 of CAT plan,
Chapter-2

India (SLUSoI), Deptt. Of Agriculture, Govt. of India. Erosion levels in each micro-watershed and prioritization of
micro-watersheds through Silt Yield Index(SYI) method of SLUSoI.
Covered in Fig 2.6 of CAT plan, Chapter-2
B Water Environment
i Hydro-Meteorology of the project (viz.
precipitation (snowfall, rainfall), temperature, relative humidity etc.)
Covered in 4.1 of Hydrology, Chapter
4 as Annexure – IV of EIA Volume
ii Run-off, discharge, water availability for the project, sedimentation rate, etc.
Covered in 4.1 of Hydrology, Chapter 4 as Annexure – IV of EIA Volume
iii Establishment of Raingauge and G&D sites in the project catchment to
make a proper assessment of the yield at the intake sites for making energy calculations
These have been established by the proponent
iv In order to maintain the ecology of river in the downstream stretch, a separate study should be conducted by an independent reputed agency which should analyze on the downstream impact on fisheries, aquatic ecology due to sudden water
release from the reservoir in the monsoon and increased flood vulnerability due to boulder extraction from the river bed to be used in the
construction materials etc. , and should come out with a minimum environmental flows that should be
required to be released during the lean season to sustain the aquatic life and recommendation of the same should be binding on the project developer. Downstream release of water should be decided on the basis
of scientific study based on depth and velocity of water. The study area, however, be limited up to Dibang Multipurpose project located more than 50 km downstream of the
proposed powerhouse of the project.
Covered in Chapter 8 Impacts under section 8.3 during Operation phase, Assessment of Impacts
v Basin Characteristics
vi Hydrology, sedimentation rate etc. Backwater level study along the tributaries at FRL should be conducted (pre- sedimentation
condition)
Covered in 4.1 of Hydrology, Chapter 4 as Annexure – IV of EIA Volume
vii Physical and chemical parameters of surface water quality. Physical parameters include temperature, pH, electrical conductivity, total dissolved solids (TDS), DO, turbidity. Chemical
parameters are salinity, alkalinity, Ca, Mg, and total hardness, chlorides,
nitrate nitrogen, phosphate, silicates, and total coliforms. Sampling should
Covered in water Quality,7.6, Environmental Baseline status-Biological Resources, Chapter-7

be covering entire area of influence, including main river system and important tributaries of the river.
C. Biological Environment
i Characterization of forest types in the study area. It should be based upon Forest Working Plan.
Covered in 7.3 Forest Types, of Environmental Baseline Status-Biological Resources, Chapter-7
ii Land details to be furnished both for Forest land as well as Community Land as most of the land to be acquired is Forest land and even community land also to be treated as Forest land and Compensatory
afforestation plan to be prepared
accordingly.
Given in Chapter 2 of EIA report and also in Chapter 13 of EMP report
iii General vegetation pattern and floral diversity viz. trees, shrubs, grasses, herbs, significant microflora, etc.
Vegetation should cover all groups of plants including lichens and orchids.
Covered in 7.4 of Environmental Baseline Status-Biological Resources, Chapter-7 of EIA Volume
iv Species frequency, density, abundance to be detailed. Biodiversity index (Shannon- Wiener Diversity index) and Importance Value Index
(IVI) of the species to be provided. Methodology used for calculating the various diversity indices along with details of locations of quadrates, size
of quadrates, etc. to be reported.
Covered in 3.2 of Methodology i.e. Chapter 3 of EIA Volume
v Economically important species viz. medicinal, timber, fuel wood etc.
Covered in 7.4.6 of Environmental Baseline Status-Biological Resources, Chapter-7 of EIA Volume
vi Flora under Rare, Endangered and Threatened (RET) categories should be documented using International
Union for the Conservation of Nature and Natural Resources (IUCN) criteria and Botanical Survey of India ‘s Red Data list along with economic significance.
Covered in Chapter-1, Biodiversity conservation & Management plan of EMP Volume.
vii Cropping and Horticulture pattern and
practices in the study area.
Covered under 6.8 of R&R plan of
EMP report
viii Faunal Elements a) Inventorisation of terrestrial wildlife including reptiles and Herpetofauna, their present status in
the project area b) Zoo-geographic distribution /affinities, Endemic, threatened and endangered species. c) Avifauna 1. Status 2.Resident/Migratory/Passage
migrants 3.Impact of project on threatened/endangered taxa, if any
d) Butterflies, if any found in the area
Covered in 7.5 of Environmental Baseline Status-Biological Resources, Chapter-7 of EIA Volume
ix For RET species, voucher specimens GPS reading of RET species not

should be collected along with GPS readings to facilitate rehabilitation. RET faunal species are to be classified
in two ways viz. as per IUCN Red Data list and as per different schedule of Indian Wildlife Protection Act, 1972.
Provided rather areas of occurrence have been given
x To document the existence of barriers
and corridors (if any) for wild animals, the habitat fragmentation and destruction of wild animals due to project.
Covered in Chap 7 of EIA report
xi Effect on fish migration and habitat degradation due to project.
Covered in Chapter 8 Impacts under section 8.3 during Operation phase,
Assessment of Impacts of EIA Volume
xii Existence of National Park, sanctuary, Biosphere, Reserve forest etc. in the study area if any, should be detailed.
Covered in 7.5.5, of Environmental Baseline Status-Biological Resources, Chapter-7 of EIA Volume
D Aquatic Biology
i) Aqua-fauna like macro-invertebrates, zooplankton, phytoplanktons, benthos, etc. ii) Conservation Status iii) Fish & Fisheries
iv) Fish migrations, if any v) Breeding grounds vi) Impact of dam building on fish migration and habitat degradation
Covered in 7.6.2, of Environmental Baseline Status-Biological Resources, Chapter-7 of EIA Volume Conservation covered in Biodiversity Management Plan,Chapter-1 of EMP
volume
Covered in Chapter 8, Assessment of Impacts of EIA Volume
E. Socio-economic Environment
i) Land details ii) Demographic profile iii) Ethnographic profile iv) Economic structure
v) Development profile vi) Agricultural practices vii) Cultural and aesthetic sites viii) Infrastructure facilities: education, health and hygiene, communication network, etc. * Report should include list of all the
project Affected families with their names, education, land holdings, other properties, occupation, source of income, land and other properties to be acquired, etc. In addition to socio-economic aspects
of the study area, a separate chapter on socio-cultural aspects based upon study on Ethnography of the area.
Covered in R&R plan, in a separate volume
5. Impact Prediction
Impact prediction is a way of
‘mapping’ the environmental consequences of the significant aspects of the project and its
alternative. Environmental Impact can never be predicted with absolute
Details are given in subsequent
paragraph. Alternatives have been discussed in
Chapter 1 of EIA report

certainity and this is all the more reason to consider all possible factors and take all possible precautions for
reducing the degree of uncertainity. The following impact of the project should be assessed.
Air
A. Changes in ambient levels and ground level concentrations due to total emissions from the point, line and the area sources B. Effects on soils, material, vegetation, and humen health
C. Impact of emissions DG sets used for construction power if any, on air environment
Covered in Chapter 8 Impacts under section 8.3 during Operation phase, Assessment of Impacts of EIA Volume
Noise -
a. Changes in ambient levels due to noise generated from equipments, blasting operations and movement of vehicles b. Effect on fauna and human health
Covered in Assessment of Impacts chapter -8 of EIA Volume
Water
a)Changes in quality b) Sedimentation of reservoir c) Impact on fish fauna d) Impact of sewage disposal
Covered in Assessment of Impacts chapter -8 of EIA Volume
Land
a)Changes in land use and drainage pattern b) Changes in land quality including effects of waste disposal c) Riverbank and their stability
d) Impact due to submergence
Covered in Assessment of Impacts chapter -8 of EIA Volume
Biological
a)Deforestation and shrinkage of animal habitat
b) Impact on fauna and flora (including aquatic species if any) due to decreased flow of water c) Impact on rare and endangered
species, endemic species, and migratory path/route of animals, if any
d) Impact on breeding and nesting grounds, if any e) Impact on animal distribution, migration routes (if any), habitat fragmentation and destruction due to dam building activity
Covered in Assessment of Impacts chapter -8 of EIA Volume
Socio – Economic Aspects
a)Impact on the local community including demographic changes b) Impact on economic status c) Impact on human health
d)Impact on increased traffic e) Impact on Holy Places and Tourism
Covered in Assessment of Impacts chapter -8 of EIA Volume

Downstream impact on water, land & human environment due to drying up of the river at least 10 km
downstream of the dam
Covered in 8.3.1 of Assessment of Impacts chapter -8 of EIA Volume
Positive as well as negative impacts likely to be accrued due to the project are to be listed
Covered in Assessment of Impacts chapter -8 of EIA Volume
Positive impacts like benefits from carbon trading.
Covered in Assessment of Impacts chapter -8 of EIA Volume
6 Environmental Management Plan (EMP)
i Resettlement and Rehabilitation(R&R) plan should be prepared with due
consultation with Project affected
Families (PAFs). It should include community development strategies and a list containing name of PAF’s age, educational qualification, family size, sex, religion, caste, source of income, house with type and amount
of land holding, house/land to be acquired, any other property, possession of cattle, etc. The R&R plan should be according to the National Resettlement & Rehabilitation Policy (NRRP-2007) as
well as State Resettlement and Rehabilitation Policy(SRRP 2008).
Detailed budgetary estimates are to be provided. The compensation to be paid for forest as well as community land.
Covered in R&R plan as a separate volume
ii Muck Disposal Plan
Cross-sections of muck disposal sites should be given in Auto CAD format.
Covered in Fig. 7.1, Dumping Sites, Muck Dumping plan,Chapter-7 of EMP Volume
iii CAT plan .
Cover both direct/indirectly draining catchment areas and CAT plan should be prepared micro-watershed wise. Areas/watersheds falling under ‘very
severe’ and ‘severe’ erosion categories are required to be treated. Both biological and engineering measures should be proposed in consultation with State Forest Department. Year wise schedule of work and monetary allocation should
be provided. CAT plan to be completed prior to reservoir impoundment.
Covered in CAT plan Chapter-2 of EMP report
iv Layout map showing land slide/ land slip zones if any, around the reservoir
periphery should be prepared. Suitable engineering and biological
measures for the identified land slip zones treatment must be provided
Covered in Chapter-9, Reservoir RIM Treatment Plan of EMP volume.

with physical and financial schedule.
v Public Health Management Plan-
including the provision for drinking water facility for the local community.
Covered in Public Health Delivery
system, Chapter-5 of EMP volume
vi Compensatory Afforestation
In lieu of the forest land required for
the project needs to be proposed. Choice of plants should be made in consultation with State Forest Department.
Covered in Compensatory
Afforestation Chapter 12 of EMP report
vii Green Belt
Suitable species of plants for the proposed green belt along periphery of reservoir (Reservoir Rim Treatment
Plan), colonies, approach road, canals etc. must be suggested. Complete plan with physical and financial
details with layout of the proposed sites of green belt development to be included.
Covered in Chapter-8, landscaping, restoration and Green belt development of EMP Volume.
viii Biodiversity Conservation Plan
Consultation with State Forest Department to be included.
Covered in Chapter-1, Biodiversity conservation & Management plan of EMP Volume.
ix Wildlife Conservation Plan Covered in Chapter-1, Biodiversity conservation & Management plan of
EMP Volume.
x Fishery Management Plan
Baseline data on catch composition, fish density, fish standing crop, fish population dynamics in and around
project area, presence of migratory/endangered fish if any to be checked and mitigation measures should include monitoring the impact of the proposed construction on the fish resources
Covered in Fishery Conservation & Management plan, Chapter-3.
Xi Dam Break Analysis & Disaster Management Plan
The output of the Dam Break Model should be illustrated with appropriate
graphs and maps clearly bringing out
the impact of the dam break scenario.
Covered in Dam Break modeling, Chapter-11.
Xii Design Earthquake Parameters
A site specific study of earth quake parameter should be done. The
results of the site specific earth quake design parameters should be sent for approval of the NCSDP (National Committee of Seismic Design Parameters, Central Water Commission, New Delhi for large dams.
Covered in Geology & Seismicity Chapter appended as Annexure – V in
EIA report
xiii Construction Methodology and Equipment Planning including the
tunnel driving operations, machinery and charge density etc.
Covered in Chapter 2 of EIA report

xiv Management during the Road Construction
Covered in Chapter 10 of EMP report
xv Sanitation & Solid Waste Management Plan for domestic waste from colonies and labour camps, etc.
Covered in Solid waste Management plan, Chapter-4.
xvi Water & Air Quality & Noise Environment Management during
construction and post construction periods.
Covered in Air, Water Environment Management plan, Chapter-10.
xvii Fisheries Conservation Plan for conservation/management of fishes. Probability of having fish ladder or fish pass is to be examined in case
there is any migratory fish species in
the area.
Covered in Fishery Conservation & Management plan, Chapter-3.
xviii Local Area Development Plan to be formulated in consultation with the Revenue Officials and Village
Panchayats.
Covered in R&R plan as a separate volume
xix Tribal area development plan as the area is predominantly tribal inhabited.
Covered in R&R plan as a separate volume
xx Mitigations measures to check shifting cultivation in the catchment area with
provision for alternative and better agricultural practices. CAT Plan should cover impact of shifting cultivation.
Covered in Chapter-2 of CAT Plan.
xxi Environmental Monitoring Programme (With physical & financial details
covering the aspects form EMP).
Covered in Environmental Monitoring programme of EMP, Chapter-13.
6. As per the provisions of the EIA Notification 2006, you are requested to submit draft EIA/EMP report as per the above terms of reference to the State
Pollution Control Board/ Committee for conducting the Public Hearings/Public Consultation.
The Public Hearing will be conducted as per EIA notification of Sep, 2006
7. All the issues discussed in the
Public Hearing/Public Consultations should be addressed to and incorporated in
the final EIA/EMP report and submitted to the Ministry for considering the proposal for Environmental Clearance.
The Public Hearing proceeding will be
attached with Final EIA report.
Revised ToR letter No.12011/60/2006-IA.I, dated 26-04-2013
A.
EIA/EMP reports should clearly give 90% flow series data along with 4 years observed data in form of a table along with ecological releases
Given in Hydrology Chapter and in Environmental Flow Assessment report by CIFRI
B.
The CIFRI should conduct the study during monsoon period also so as to establish ecological releases during monsoon season also. This is already there in the original TOR.
Environmental Flow Assessment report by CIFRI appended as a separate volume
C. A study on minimum Environmental flow requirement should be conducted
Environmental Flow Assessment report by CIFRI appended as a

by the project proponent. The study should include assessment of minimum environmental flow requirement for
three seasons i.e. lean, non-lean & non-monsoon and monsoon seasons. Ecological release shall take into account all downstream needs including sustenance of aquatic life. The cumulative release to the
downstream of both Dri and Tangon dam's supplemented release of dam toe powerhouse should be of the order of 25% and should attain 30% within 2 Km from the dams.
separate volume
D.
Daily observed flow data at site along
with the observed rainfall data to be submitted in hard copy as well as in soft format.
Covered in Annexure IV EIA,
Hydrology, Chapter-4.
E.
The Consultant engaged for preparation of EIA/EMP report has to be registered with Quality Council of
India (QCI)/NABET under the scheme of Accreditation & Registration of MoEF. This is a pre-requisite.
Attached at the beginning of EIA report
F.
Consultants shall include a "Certificate" in EIA/EMP report regarding portion of
EIA/EMP prepared by them and data provided by other organization(s)/
laboratories including status of approval of such laboratories.
Attached at the beginning of EIA report
G.
Information pertaining to Corporate Environmental Responsibility and
Environmental Policy shall be provided in the EIA/EMP Report as per this Ministry’s circular dated 19.5.2012
Covered in Annexure V & VI EMP, Environmental Monitoring Plan,
Chapter-13.
Details of the Project and Site General introduction about the
proposed project. Details of project and site giving L-
sections of all U/S and D/S projects of Dri/Dibang & Tangon Rivers with all relevant maps and
figures. Connect such information as to establish the total length of
interference of Natural River, the total length of the main of the river and the committed unrestricted release from the site of diversion into the main river.
A map of boundary of the project site giving details of protected
areas in the vicinity of project location.
Location details on a map of the project area with contours indicating main project features.
The project layout shall be
superimposed on a contour
Covered in Table 2.1 of EIA, Project Description, Chapter-2.
Covered in Section 3.1 of EIA, Introductin, Chapter-1.
Covered in Figure 2.2 of EIA, Project Description, Chapter-2.

map of ground elevation showing main project features (viz. Location of dam, Head works,
main canal, branch canals, quarrying etc.) shall be depicted in a scaled map.
Layout details and map of the project along with contours with project component clearly marked
with proper scale maps of at least a 1:50,000 scale and printed at least on A3 scale for clarity.
Existence of National Park, Sanctuary, Biosphere Reserve etc.
in the study area, if any, should be detailed and presented on a
map with distinct distances from the project components.
Drainage pattern and map of the river catchment up to the proposed project site.
Delineation of critically degraded areas in the directly draining
catchment on the basis of silt Yield Index as per the methodology of All India Soil and Land Use Survey of India.
Soil characteristics and map of the
project area.
Geological and seismo-tectonic details and maps of the area surrounding the proposed project site showing location of dam site and powerhouse site.
Remote Sensing studies, interpretation of satellite imagery,
topographic sheets along with ground verification shall be used to develop the land use/land cover pattern of the study using overlaying mapping techniques viz. Geographic Information
System (GIS), False Color
composite (FCC) generated from satellite data of project area.
Land details including forests, private and other land.
Demarcation of snow fed and rain fed areas for a realistic
estimate of the water availability.
Different riverine habitats like rapids, pools, side pools and variations in the river substratum - bedrocks, rocks, boulders, sand/silt or clay etc.
need to be covered under the
study.
Given at Figure 6.1 in Chapter 6- Environmental Baseline- Physico-
chemical Parameters Given in Chapter 2 of EMP Volume – Catchment Area Treatment Plan
Given at Figure 6.4 in Chapter 6- Environmental Baseline- Physico-chemical Parameters Given Geology Annexure –V of EIA Volume
Maps generated through Remote Sensing studies given at Figures 7.1 – 7.3 in Chapter 7- Environmental Baseline- Biological Parameters
Land details given in Chapter 2 of EIA
volume
Sampling for aquatic ecology covered all such habitats and details given in Chapter 3 on Methodology in EIA
Volume

Description of Environment and Baseline Data To know the present status of
environment in the area, baseline data with respect to Environmental components air, water, noise, soil, land and biology & biodiversity (flora & fauna), wildlife, socio-economic status etc. should be collected with I
0 km radius of the main components of the project/site i.e. dam site and power house site. The air quality and noise are to be monitored at such locations which are environmentally &
ecologically more sensitive in the study area. The baseline studies should be
collected for 3 seasons Pre-Monsoon, Monsoon and Post Monsoon seasons). The study area should comprise of the following: Catchment area up-to the dam site. Submergence Area
Project area or the direct impact area should comprise of area falling within 10 km radius from the periphery of reservoir, land coming under submergence and
area downstream of dam up-to the
point where Tail Race Tunnel (TRT) meets the river.
Downstream up to 10 km from tip of Tail Race Tunnel (TRT).
Covered in Figure 3.1 of EIA,
Methodology, Chapter-3
Details of the Methodology The methodology followed for
collection of base line data along with details of number of samples and their locations in the map should be included. Study area should be demarcated properly on the appropriate scale map. Sampling sites should be depicted on map
for each parameter with proper legends. For forest classification, Champion and Seth1968) classification should be followed .
Details given in Chapter 3= Methodology of EIA Volume.
Study area delineated according to norms defined in TOR
Methodology for collection of
Biodiversity Data The number of sampling locations should be adequate to get a reasonable idea of the diversity and other attributes of flora and fauna. The guiding principles should be the size of the study area
(larger area should have larger number of sampling locations) an
inherent diversity at the location, as known from secondary sources (e.g. eastern Himalayan and low
Sampling for Biodiversity was done according to standards terrestrial ecology techniques with detailed methodologies adopted for vegetation, mammals, avi-fauna, butterflies, insects and herpetofauna in Chapter 3 – Methodology in EIA Volume

altitude sites should have a larger number of sampling location owing to higher diversity).
The entire area should be divided in grids of 5km X 5km preferably on a GIS domain. Thereafter 25% of the grids should be randomly selected for sampling of which half should
be in the directly affected area (grids including project components such a reservoir, dam, powerhouse, tunnel, canal etc.) and the remaining in the rest of the area (areas of
influence in 10 km radius form project components). At such chosen
location the size and number of sampling units (e.g. quadrats in case of flora/transects in case o fauna) must be decided by species area curves and the details of the same (graphs an cumulative number of species in a tabulated form) should
be provided in the EIA report. Some of the grids on the edges may not be completely overlapping with the study area boundaries. However these should be counted and considered for
selecting 25% of the grids. The
number of grids to be surveyed may come out as a decimal number (i.e. it has an integral and a fractional part) which should be rounded to the next whole number. The conventional sampling is likely
to miss the presence of rare, endangered an threatened (R.E.T.) species since they often occur in low densities and in case of faunal species are usually secretive in behaviour. Reaching the conclusion about the
absence of such species in the study
area based on such methodology is misleading. It is very important to document the status of such species owing to their high conservation value Hence likely presence of such species should be ascertained from secondary
sources by proper literature survey for the said area including referring to field guides which are no available for many taxonomic groups in India. Even literature from studies/surveys in th larger landscapes which include the study area for the concerned project
must be referred to since most species
from adjoining catchments is likely to be present in the catchment in
This methodology was not possible and was not required for this project as sampling for all the biodiversity parameters had already been
completed and even twice according to the TOR already granted. The present TOR was granted only in April, 2013 when primary surveys were had already finished.
The identification of RET species was
done following this method only and same has been discussed in Chapter 3 under sections 3.2.5.5 and 3.2.5.6 in Methodology of EIA volume

question: In fact such literature form the entire state can be referred to. Once a listin of possible R.E.T. species
form the said area is developed, species specific methodologies should be adopted to ascertain their presence in the study area which would be far more conclusive as compared to the conventional sampling. If the need be,
modern method like camera trapping can be resorted to, particularly for areas in the eastern Himalayas an for secretive/nocturnal species. A detailed listing of the literature
referred to, for developing lists of R.E.T. species should be provided in
the EIA reports. The R.E.T. species referred to in this point should include species listed in Schedule I an II of Wildlife (Protection) Act, 1972 and those listed in the red data books (BSI, ZSI an IUCN).
Components of the EIA Study Various aspects to be studied and provided in the EIAIEMP report are as follow:
Physical and Chemical
Environment
Geological & Geophysical Aspects and Seismo - Tectonics
• Physical geography, Topography, Regional Geological aspects and structure of the Catchment.
• Tectonics, seismicity and history of past earthquakes in the area. A site specific study of the earthquake parameters will be done. The results of the site specific earthquake design shall be sent for approval of the
NCSDP (National committee of Seismic Design Parameters, Central Water Commission, New Delhi
for large dams. • Landslide zone or area prone to landslide existing in the study area should be examined.
• Presence of important economic mineral deposit, if any. • Justification for location & execution of the project in relation to structural components (dam height). • Impact of project on geological
environment.
Covered in Geology & Seismo-tectonics as Annexure –V of EIA Volume
Covered in Geology & Seismo-tectonics as Annexure –V of EIA Volume
Meteorology, Air and Noise:
• Meteorology (viz. Temperature,
Relative humidity, wind
speed/direction etc.) to be collected
Covered in Hydrology as Annexure –
IV of EIA Volume

from nearest IMD station. • Ambient Air Quality with parameters viz. Suspended Particulate Matter
(SPM), Respirable Suspended Particulate Matter (RSPM) i.e. suspended particulate materials <10 microns, Sulphur Dioxide (S02) and Oxides of Nitrogen (NOx) in the study area at 6 locations.
• Existing noise levels and traffic density in the study area at 6 locations
Covered in Air Environment, 6.5, Baseline status-Physico –Chemical
Parameters, Chapter-6.
Covered in Noise & Traffic, 6.6, Baseline status-Physico –Chemical Parameters, Chapter-6.
Soil Characteristics
• Soil classification, physical
parameters (viz., texture, porosity, bulk density and water holding capacity) and chemical parameters (viz. pH, electrical conductivity magnesium, calcium, total alkalinity, chlorides, sodium, potassium, organi carbon, available
potassium, available phosphorus, SAR, nitrogen and salinity etc.) (6 locations).
Covered in 6.4 -Baseline status-
Physico –Chemical chapter, Chapter-6
Remote sensing and GIS Studies
Generation of thematic maps viz., slope map, drainage map, soil map, land use and land cover map, etc.
Based on these, thematic map, an erosion intensity map should be prepared.
Covered in Fig nos. 2.1 to 2.6 of CAT plan, Chapter-2
Water Quality
History of the ground water table fluctuation in the study area. • Water quality for both surface water and ground water for (i)
Physical parameters (pH, temperature, electrical conductivity, TSS); (ii) Chemical parameters (Alkalinity, Hardness, BOD, COD, N02, P04, CI, S04, Na, K, Ca, Mg, Silica, Oil & Grease, phenolic compounds,
residual sodium carbonate); (iii)
Bacteriological parameter (MPN, Total coliform) and (iv) Heavy Metals (Pb, As, Hg, Cd, Cr-6, total Cr, Cu, Zn, Fe) (6 locations). • Delineation of sub and micro-watersheds, their locations and
extent based on the All India Soil and Land Use Survey of India (AISLUS), Depat1ment of Agriculture, Government of India. Erosion levels in each micro-watershed and prioritization of micro-watershed through silt yield
index (SYI) method of AISLUS.
Covered in water Quality,7.6, Environmental Baseline status-
Biological Resources, Chapter-7 Sampling done at 11 locations
Covered in Fig 2.4.1 of CAT plan, Chapter-2
Covered in Fig 2.6 of CAT plan, Chapter-2

Water Environment & Hydrology
• Hydro-Meteorology of the
project viz. precipitation (snowfall, rainfall), temperature, relative humidity, etc. Hydro-meteorological studies in the catclm1ent area should be established along-with real time telemetry and
data acquisition system for inflows monitoring. • Run off, discharge, water availability for the project, sedimentation rate, etc. • Basin characteristics
• Catastrophic events like cloud
bursts and flash floods, if any, should be documented. • For estimation of Sedimentation Rate, direct sampling of river flow is to be done during the EIA study. The study should be conducted for minimum one year.
Actual silt flow rate to be expressed in ha-m km2 year-1. • Set up a G&D monitoring station and a few rain gauge stations in the catchment area for collecting data during the investigation.
• Flow series, 10 daily with 90%, 75% and 50% dependable years discharges. • Information on the 10-daily flow basis for the 90 per cent dependable year the flow intercepted at the dam, the flow diverted to the power house and the spill comprising the
environmental flow and additional flow towards downstream of th dam for the project may be given. • The minimum environmental flow shall be 20% of the flow of four consecutive lean months of 90% dependable year, 30% of the average
monsoon flow. The flow for remaining months shall be in between 20-30%, depending on the site specific requirements. A site specific study shall be carried out by an expert organization.
• Hydrological studies/data as approved by CWC shall be utilized in the preparation of EIA/EMP report. Actual hydrological annual yield may also be given in the report. • Sedimentation data available with CWC may be used to find out the loss
in storage over the years.
• A minimum of 1 km distance from the tip of the reservoir to the tail race tunnel should be maintained between
Covered in 4.1 of Hydrology, Chapter
4 of EIA Volume
Covered in 4.1 of Hydrology, Chapter 4 of EIA Volume Covered in 4.1 of Hydrology, Chapter
4 of EIA Volume
Covered in 4.1 of Hydrology, Chapter 4 of EIA Volume
These have been established by the proponent
Covered in 4.1 of Hydrology, Chapter 4 of EIA Volume
Covered in Chapter 8 Impacts under section 8.3 during Operation phase, Assessment of Impacts. Separate study has been conducted by CIFRI
whose report is appended separately
Covered in 4.1 of Hydrology, Chapter 4 of EIA Volume Covered in 4.1 of Hydrology, Chapter 4 of EIA Volume
This condition has been complied and L-section given at Figures 1.2 and 1.3 in Chapter 1 of EIA Volume

upstream and downstream projects.
Biological Environment
Besides primary studies, review of secondary data/literature published for project area on flora & fauna including RET species shall be reported in EIA/EMP report
All these points covered in
Environmental Baseline Status-Biological Resources, Chapter-7
Flora • Characterization of forest types (as per Champion and Seth method) in the study area and extent of each forest type as per the Forest Working Plan. • Documentation of all plant species
i.e. Angiosperm, Gymnosperm, Pteriodophytes, Bryophytes (all groups). • General vegetation profile and floral diversity covering all groups of flora including lichens and orchids. A species wise list may be provided.
• Assessment of plant species with respect to dominance, density, frequency, abundance, diversity index, similarity index, importance value index (IVI) , Shannon Weiner index etc. of the species to be
provided. Methodology used for
calculating various diversity indices along with details of locations of quadrates, size of quadrates etc. to be reported within the study area in different ecosystems. • Existence of National park,
Sanctuary, Biosphere Reserve etc in the study area, if any, should be detailed. • Economically important species like medicinal plants, timber, fuel wood etc. • Details of endemic species found in
the project area.
• Flora under RET categories should be documented using International Union for the Conservation of Nature and Natural Resources (IUCN) criteria and Botanical Survey of India's
Red Data list along-with economic significance. Species diversity curve for RET species should be given. • Cropping pattern and Horticultural Practices in the study area.
Covered in 7.3 Forest Types, of Environmental Baseline Status-Biological Resources, Chapter-7 of EIA Volume Covered in 7.4 of Environmental
Baseline Status-Biological Resources, Chapter-7 of EIA Volume Covered in 7.4 of Environmental Baseline Status-Biological Resources, Chapter-7 of EIA Volume
Covered in sections 7.4.4 & 7.4.5 of Environmental Baseline Status-Biological Resources, Chapter-7 Methodology Covered in 3.2 of Methodology i.e. Chapter 3 of EIA
Volume
Covered in 7.5.4 of Environmental
Baseline Status-Biological Resources, Chapter-7 of EIA Volume Covered in 7.4.6 of Environmental Baseline Status-Biological Resources, Chapter-7 of EIA Volume Covered in 7.4.7 of Environmental
Baseline Status-Biological Resources,
Chapter-7 of EIA Volume
Covered under 6.8 of R&R plan of EMP report
Fauna:
• Fauna study and inventorisation should be carried out for all groups of animals in the study area. Their
present status alongwith Schedule of the species. • Documentation of fauna plankton
Covered in 7.5 of Environmental Baseline Status-Biological Resources, Chapter-7 of EIA Volume

(phyto and zooplankton), periphyton, benthos and fish should be done and analysed.
• Information (authenticated) on Avi-fauna and wildlife in the study area. • Status of avifauna their resident/ migratory/ passage migrants etc. • Documentation of butterflies, if any, found in the area. Details of endemic
species found in the project area RET species-voucher specimens should be collected along-with GPS readings to facilitate rehabilitation.
RET faunal species to be classified as per IUCN Red Data list and as
per different schedule of Indian Wildlife (Protection) Act, 1972. • Existence of barriers and corridors, if any, for wild animals. • Compensatory afforestation to compensate the green belt area that will be removed,
if any, as part of the proposed project development and loss of biodiversity. • Collection of primary data on agricultural activity, crop and their
productivity and irrigation facilities
components. • For categorization of sub-catchment into various erosion classes and for the consequent CAT plan, the entire Catchment (Indian Portion) is to be considered and not only the directly the draining
catchment.
GPS reading of RET species not Provided rather areas of occurrence have been given. Voucher specimen
not collected as it is prohibited RET faunal species identified as per
IUCN & WPA schedules in section 7.5.5 in 7.5 of Environmental Baseline Status-Biological Resources, Chapter-7 of EIA Volume Covered in Compensatory Afforestation Chapter 12 of EMP
volume Covered in R&R plan
Covered in CAT plan Chapter 2 of EMP volume
Aquatic Ecology • Documentation of aquatic fauna like macro-invertebrates, zooplankton, phytoplantktons, benthos etc. • Fish and fisheries, their migration
and breeding grounds. • Fish diversity composition and maximum length & weight of the measured populations to be studies for estimation of environmental flow. • Conservation status of aquatic
fauna. • Sampling for aquatic ecology and fisheries and fisheries must be conducted during three seasons - Pre-monsoon (summer), monsoon and winter. Sizes (length & weight) of important fish species
need to be collected and breeding
and feeding grounds should also be identified along the project site or in vicinity.
Covered in 7.6.2, of Environmental Baseline Status-Biological Resources, Chapter-7 of EIA Volume

Socio-Economic
• Collection of baseline data on human settlements, health status of the community and existing infrastructure facilities for social welfare including sources of livelihood, job opportunities and
safety and security of workers and surroundings population. • Collection of information with respect to social awareness about the developmental activity
in the area and social welfare measures existing and proposed by
project proponent. • Collection of information on sensitive habitat of historical, cultural and religious and ecological importance. • The socio-economic survey/ profile within 10 km of the
study area for demographic profile; Economic Structure; Developmental Profile; Agricultural Practices; Infrastructure, education facilities; health and sanitation facilities;
available communication network etc.
• Documentation of demographic, Ethnographic, Economic Structure and development profile of the area. • Information on Agricultural Practices, Cultural and aesthetic sites, Infrastucture facilities etc. • Information on the dependence of
the local people on minor forest produce and their cattle grazing rights in the forest land. • List of all the Project Affected Families with their name, age, educational qualification, family size,
sex, religion, caste, sources of
income, land & house holdings, other properties, occupation, source of income, house/land to be acquired for the project and house/land left with the family, any other property, possession of cattle, type of house
etc. • Special attention has to be given to vulnerable groups like women, aged persons etc. and to any ethnic/indigenous groups that are getting affected by the project.
Covered in R&R plan and SIA report, in a separate volume
Impact Prediction and Mitigation
Measures The adverse impact due to the proposed project should be
Covered in Chapter 8 Impacts under
section 8.3

assessed and effective mitigation steps to abate these impacts should be described.
Air Environment Changes in ambient and ground level concentrations due to total emissions from point, line and area sources.
• Effect on soil, material, vegetation and human health. • Impact of emissions from DO set used for power during the construction, if any, on air environment.
• Pollution due to fuel combustion in
equipments and vehicles • Fugitive emissions from various sources
Covered in Chapter 8 Impacts under section 8.3 during Operation phase, Assessment of Impacts of EIA Volume
Water Environment • Changes in surface and ground water quality
• Steps to develop pisci-culture and recreational facilities • Changes in hydraulic regime and downstream flow. • Water pollution due to disposal of sewage
• Water pollution fi:om labour
colonies/ camps and washing equipment.
Covered in Assessment of Impacts chapter -8 of EIA Volume
Land Environment
• Adverse impact on land stability, catchment of soil erosion, reservoir sedimentation and spring flow (if any) (a) due to considerable road construction I widening
activity (b) interference of reservoir with the inflowing stream (c) blasting for
commissioning ofHRT, TRT and some other structures. • Changes in land use I land cover and drainage pattern
• Immigration of labour population • Quarrying operation and muck disposal • Changes in land quality including effects of waste disposal • River bank and their stability • Impact due to submergence.
Covered in Assessment of Impacts
chapter -8 of EIA Volume
Biological Environment • Impact on forests, flora, fauna including wildlife, migratory avi-
fauna, rare and endangered species, medicinal plants etc.
Covered in Assessment of Impacts chapter -8 of EIA Volume

• Pressure on existing natural resources • Deforestation and disturbance to
wildlife, habitat fragmentation and wild animal's migratory corridors • Compensatory afforestation-identification of suitable native tree species for compensatory afforestation and green belt.
• Impact on fish migration and habitat degradation due to decreased flow of water • Impact on breeding and nesting grounds of animals and fish.
Socio-economic aspects • Impact on local community including demographic profile. • Impact on socio-economic status • Impact on economic status. • Impact on human health due to water I vector borne disease
• Impact on increase traffic • Impact on Holy Places and Tourism • Impacts of blasting activity during project construction which generally destabiliz the land mass and leads to landslides, damage
to propet1ies and drying up of natural springs and cause noise population will be studies. Proper record shall be maintained of the baseline information in the post project period. • Positive and negative impacts likely
to be accrued due to the project are listed
Covered in Assessment of Impacts chapter -8 of EIA Volume
Environmental Management Plans
Catchment Area Treatment (CAT)
Plan should be prepared micro-watershed wise. Identification of free draining/ directly
draining catclm1ent based upon Remote Sensing and Geographical Information System (GIS) methodology and Sediment Yield Index
(SYI) method of AISLUS, Deptt. of Agriculture, Govt. of India coupled with ground survey. Areas or watersheds falling under 'very severe' and 'severe' erosion categories should be provided and required to be treated. Both biological as well as engineering
measures should be proposed in consultation with State Forest Department for areas requiring
treatment. Year-wise schedule of work and monetary allocation should be provided. Mitigation
Covered in CAT plan Chapter-2 of EMP report

measures to check shifting cultivation in the catchment area with provision for alternative and better
agricultural practices should be included.
Compensatory Afforestation shall be prepared by the State Forest
Department in lie of the forest land proposed to be diverted for construction of the project as per the Forest (Conservation) Act, 1980. Choice of plants for afforestation should include
native and RET species,
if any. This will be a pat1of the forest clearance proposal.
Covered in Compensatory Afforestation Chapter 10 of EMP
report
Biodiversity and Wildlife Conservation and Management Plan for the conservation and preservation of rare, endangered or
endemic floral/faunal species or some National Park/Sanctuary/ Biosphere Reserve or other protected area is going to get affected directly or indirectly by construction of the project, then
suitable conservation measures should
be prepared in consultation with the State Forest Department and with th physical and financial details. Suitable conservation teclmiques (in-situ/ex-situ) will b proposed under the
plan and the areas where such conservation is proposed will be marked on a project layout map.
Covered in Chapter-1, Biodiversity conservation & Management plan of EMP Volume.
Fisheries Conservation and Management Plan - a specific fisheries management measures
should be prepared for river and reservoir. If the construction of fish ladder/ fish-way etc. is not feasible then measures for reservoir fisheries
will be proposed. The plan will detail out the number of hatcheries, nurseries, rearing ponds etc. proposed under the plan with proper drawings. If any migratory fish species is getting affected then the migratory routes, time/season of upstream and
downstream migration spawning grounds etc will be discussed in details.
Covered in Fishery Conservation & Management plan, Chapter-3 of EMP
volume
Resettlement and Rehabilitation Plan needed to be prepared on the
Covered in R&R plan as a separate

basis of finding of the socio-economic survey coupled with the outcome of public consultation held. Th
R&R package shall be prepared after consultation with the representatives of the project affected families and the State Government. Detailed budgetary estimates are to be provided. Resettlements site should
be identified. The plan will also incorporate community development strategies.
volume
Green Belt Development Plan along the periphery of the reservoir,
approach roads
around the colonies and other project components, local plant species must be suggested with physical and financial details. A layout map showing the proposed sites for developing the green belt should be prepared.
Covered in Chapter-8, landscaping,
restoration and Green belt
development chapter EMP Volume.
Reservoir Rim Treatment Plan for stabilization of land slide/ land slip zones, if any, around the reservoir periphery is to be prepared based on detailed survey of geology of the
reservoir rim area. Suitable
engineering and biological measures for treatment of identified slip zones to be suggested with physical and financial schedule. Layout map showing the landslide/landslip zones shall be prepared and appended in the
chapter.
Covered in Chapter-9, Reservoir Rim Treatment Plan chapter EMP Volume.
Muck Disposal Plan suitable sites for dumping of excavated materials should be identified in
consultation with State Pollution Control Board and State Forest Department. All muck disposal sites
should be minimum 30 m away from the HFL of river. The quantity of muck to be generated and the quantity of muck proposed to be utilized shall be
calculated in consultation with the project authorities. Details of each dumping site viz. area, capacity, total quantity of muck that can be dumped etc. should be worked out and discussed in the plan. Plan for rehabilitation of muck disposal sites
should also be given. The L-section I cross section of muck disposal sites and approach roads should be given.
The plan shall have physical and financial details of the measures proposed. Layout map showing the
Covered in Muck Dumping plan,Chapter-7 of EMP Volume
Covered in Figures 7.2 – 7.19,
Dumping Sites cross sections, Muck Dumping plan,Chapter-7 of EMP Volume
Covered in Figure 7.1, Layout map

dumping sites vis-a-vis other project components will be prepared and appended in the chapter.
showing Dumping Sites in Chapter Muck Dumping plan,Chapter-7 of EMP Volume
Restoration Plan for Quarry Sites and landscaping of colony areas, working areas, roads etc. Details of the coarse/fine aggregate/clay etc. required for construction of the project
and the rock/clay quarries/river shoal sites identified for the project should be discussed along-with the engineering and Biological measures proposed for their restoration with physical and financial
details. Layout map showing quarry
sites vis-a vis other project components, should be prepared
Covered in Landscaping and Restoration of Quarry areas, construction areas Chapter-8 of EMP Volume
Study of Design Earthquake Parameters: A site specific study of earthquake parameters should be done. Results of the site specific
earthquake design parameters should be approved by National Committee of Seismic Design Parameters, Central Water Commission (NCSDP), New Delhi.
Covered in Geology & Seismicity Chapter appended as Annexure – V in EIA report
Dam Break Analysis and
Disaster Management Plan The outputs of dam break model should be illustrated with appropriate graphs and maps clearly bringing out the impact of Dam Break scenario. To
identify inundation areas, population and structures likely to be affected due to catastrophic floods in the event of dam failure. DMP will be prepared with the help of Dam Break Analysis. Maximum water level that would be
attained at various points on the downstream in case of dam break will be marked on a detailed contour map
of the downstream area, to show the extent of inundation. The action plan will include Emergency Action and Management plan including measures
like preventive action notification, warning procedure and action plan for co-ordination with various authorities.
Covered in Dam Break modeling, Chapter-11.
Water, Air and Noise Management Plans to be implemented during
construction and post-construction periods.
Covered in Air, Water Environment Management plan, Chapter-10.
Public Health Delivery Plan including the provisions of drinking
water supply to local population
shall be in the EIA/EMP Report.
Covered in Public Health Delivery System, Chapter-5 of EMP volume

Status of the existing medical facilities in the project area shall be discussed. Possibilities of strengthening of
existing medical facilities, construction of new medical infrastructure etc. will be explored after assessing the need of the labour force and local populace.
Labour Management Plan for their Health and Safety. Sanitation and Solid waste management plan for domestic waste from colonies an labour camps
etc.
Covered in Solid waste Management plan, Chapter-4.
Local Area Development Plan to be formulated in consultation with the Revenue Officials and Village Pancahayats. Appropriate schemes shall be prepared under EM for the Local Area Development Plan with
sufficient financial provisions.
Covered in R&R plan as a separate volume
Environmental safeguards during construction activities including Road Construction.
Covered in Chapter 10 of EMP report
Energy Conservation Measures for the work force during construction with physical and financial details.
Alternatives will be proposed for the labour force so that the exploitation of the natural resource (wood) for the domestic and
commercial use i curbed.
Covered in Energy Conservation Measures Chapter-6 of EMP volume.
Environmental Monitoring Programme to monitor the mitigatory measure implemented at the project site is required will be
prepared. Provision for Environmental Management Cell should be made. The plan will spell out the aspects required to be monitored, monitoring indicators/parameters with respect to
each aspect and the agency responsible for the monitoring
of that particular aspect throughout the project implementation.
Covered in Environmental Monitoring programme of EMP, Chapter-13.
A summary of Cost Estimates for all the plans, cost for implementing all the
Environmental Management Plans.
Given in Cost Estimates of EMP, Chapter-14.

Etalin Hydroelectric Project (3097 MW) Detailed Project Report
Volume-I: Main Report Part-A: Chapters 1 to 9
169126-40ER-0009-00 i
TABLE OF CONTENTS
PAGE NO. 1. PROJECT HYDROLOGY ......................................................................................... 1-1
1.1 Introduction ...................................................................................................... 1-1
1.1.1 Adopted Conventions ........................................................................... 1-1
1.2 Basin Characteristics ....................................................................................... 1-2
1.2.1 River System and Basin Characteristics ............................................... 1-2
1.2.2 River Brahmaputra ............................................................................... 1-2
1.2.3 River Dibang ........................................................................................ 1-2
1.2.4 The Catchment ..................................................................................... 1-3
1.2.5 Hypsometric Details ............................................................................. 1-4
1.2.6 Assessment of Snowfed and Rainfed Catchment Areas ....................... 1-5
1.3 Water Availability Studies ................................................................................ 1-5
1.3.1 Data Availability .................................................................................... 1-5
1.3.2 Consistency Checks of Rainfall and Discharge Data ............................ 1-5
1.3.3 Type of Project ..................................................................................... 1-6
1.3.4 Period of Data Required ....................................................................... 1-6
1.3.5 Computation of Water Availability Series .............................................. 1-7
1.3.6 Flow Duration Curves ......................................................................... 1-13
1.4 Design Flood ................................................................................................. 1-14
1.4.1 General .............................................................................................. 1-14
1.4.2 Criteria for Estimation of Design Flood ............................................... 1-14
1.4.3 Computation of Design Flood - PMF .................................................. 1-14
1.4.4 Physiographic Parameters of the Catchment ..................................... 1-15
1.4.5 Derivation of Unit Hydrograph ............................................................ 1-16
1.4.6 Design Storm ..................................................................................... 1-18
1.4.7 Design Loss Rate ............................................................................... 1-20
1.4.8 Critical Sequence of Rainfall Excess .................................................. 1-20
1.4.9 Base flow and Snow melt ................................................................... 1-21
1.4.10 Surface Flow Hydrograph ................................................................... 1-21
1.4.11 Flood Hydrograph .............................................................................. 1-21
1.4.12 Design Flood for River Diversion Works ............................................. 1-24
1.4.13 Data ................................................................................................... 1-24
1.4.14 Statistical Parameters ........................................................................ 1-25
1.4.15 Flood Frequency Analysis .................................................................. 1-26
1.4.16 Selection of Diversion Flood ............................................................... 1-26
1.5 Sedimentation ................................................................................................ 1-30
1.5.1 Need for Sediment Evaluation ............................................................ 1-30
1.5.2 Reservoir Sediment Rate ................................................................... 1-30
Etalin Hydroelectric Project (3097 MW) Detailed Project Report
Volume-I: Main Report Part-A: Chapters 1 to 9
169126-40ER-0009-00 ii
1.5.3 Reservoir Elevation-Area-Capacity ..................................................... 1-30
1.5.4 Sedimentation Aspects of Reservoirs ................................................. 1-32
1.5.5 Type and Shape of the Reservoirs ..................................................... 1-32
1.5.6 Sediment Accumulation ...................................................................... 1-32
1.6 Glacial Lake Outburst Flood (GLOF) .............................................................. 1-34
1.7 References .................................................................................................... 1-35

Etalin Hydroelectric Project (3097 MW) Detailed Project Report
Volume-I: Main Report Part-A: Chapters 1 to 9
169126-40ER-0009-00 iii
LIST OF TABLES
PAGE NO. Table 1: Details of minimum length of flow data ................................................................. 1-7
Table 2: 10-Daily Average flow series (m3/s) for Dri Limb (1986-87 to 2008-09) ................ 1-9
Table 3: 10-Daily Average flow series (m3/s) for Talo (Tangon) Limb (1986-87 to 2008-09) . 1-11
Table 4: Classification Criteria of Hydraulic Structures ..................................................... 1-14
Table 5: Breakup of Catchment Area ............................................................................... 1-15
Table 6: River Length Parameters .................................................................................... 1-15
Table 7: Sub-Zone 2a Unit Hydrograph Parameters ......................................................... 1-16
Table 8: Standard Project Strom (SPS) and Probable Maximum Precipitation (PMP) Values ......................................................................................................................................... 1-19
Table 9: Temporal Distribution of the SPS and PMP ........................................................ 1-19
Table 10: PMP Distribution for Dri limb ............................................................................. 1-20
Table 11: PMP Distribution for Talo (Tangon) limb ........................................................... 1-20
Table 12: Design Flood (PMF) ......................................................................................... 1-21
Table 13: Design Flood Hydrograph (PMF) Values .......................................................... 1-23
Table 14: Transfer Factor for Elopa and Munli Peak Flows .............................................. 1-25
Table 15: Final Peak Flows at Dri and Talo (Tangon) Limbs ............................................ 1-25
Table 16: Statistical Parameters of Peak Flows at Dri and Talo (Tangon) Limbs .............. 1-26
Table 17: Detail of 25 year Return Period Flood (m3/s)..................................................... 1-26
Table 18: Diversion Flood (m3/s) at Etalin dam sites ........................................................ 1-27
Table 19: Revised Area Capacity of Dri Reservoir after Sediment Accumulation to Crest Level of El. 990 m ............................................................................................................ 1-33
Table 20: Revised Area Capacity of Talo (Tangon) Reservoir after Sediment Accumulation to Crest Level of El. 1018 m ............................................................................................. 1-34

Etalin Hydroelectric Project (3097 MW) Detailed Project Report
Volume-I: Main Report Part-A: Chapters 1 to 9
169126-40ER-0009-00 iv
LIST OF FIGURES PAGE NO
Figure 1: Hypsometric Curve of Etalin on Dri/Dibang .......................................................... 1-4
Figure 2: Hypsometric Curve of Etalin on Talo (Tangon) ................................................... 1-4
Figure 3: Details of Data Availability ................................................................................... 1-6
Figure 4: Flow Duration curve for Dri Limb of Etalin.......................................................... 1-13
Figure 5: Flow Duration curve for Talo (Tangon) Limb of Etalin ........................................ 1-13
Figure 6: SUH of Dri limb ................................................................................................. 1-17
Figure 7: SUH of Talo (Tangon) limb ................................................................................ 1-18
Figure 8: PMF Hydrograph for Dri Limb ............................................................................ 1-22
Figure 9: PMF Hydrograph for Talo (Tangon) Limb .......................................................... 1-22
Figure 10: Return Period Flood for Different Working Seasons on Dri Limb ..................... 1-28
Figure 11: Return Period Flood for Different Working Seasons on Talo (Tangon) Limb .... 1-29
Figure 12: Elevation-Area-Capacity Curve of Dri Reservoir .............................................. 1-31
Figure 13: Elevation-Area-Capacity Curve of Talo (Tangon) Reservoir ............................ 1-31

Etalin Hydroelectric Project (3097 MW) Detailed Project Report
Volume-I: Main Report Part-A: Chapters 1 to 9
169126-40ER-0009-00 1-1
1. PROJECT HYDROLOGY
1.1 Introduction
Hydrological inputs play a vital role in planning, execution and operation of any water
resources development project. Hydrological studies are carried out at all stages of project
development starting from the pre-feasibility stage and are continued even during the
operation of the project. Hydrological assessment of a river valley project is carried out with
a view to:
Assess quantity of water available in the river for power generation and its variation
with time.
Estimate design flood and diversion flood required for hydraulic design of spillway
and temporary diversion structure as well as for safety of the structure.
Assess impact of sedimentation on the live storage with reference to the life of
reservoir.
Etalin Hydroelectric Project envisages diversion of water of two rivers, namely Dri/Dibang
and Talo (Tangon), having their confluence at village Etalin. The project consists of two
limbs, one on Dri river and another on Talo (Tangon) river, each consisting of a diversion
structure and a water conductor system with the later culminating in a single powerhouse
located underground in hill mass at the confluence of the two rivers. The project is located
upstream of Dibang Multipurpose Project which is being developed by NHPC. The proposed
dam site of Dibang project is located at Munli village.
As per the project planning based on detailed reconnaissance of site and assessment of
topographic and geological features, the project envisages construction of a 101.5 m high
Concrete Gravity Dam on Dri/Dibang and a 80 m high Concrete Gravity Dam on Talo
(Tangon). The dam on Dri/Dibang is located at Latitude 28º42'24"N and Longitude
95º51'52"E, while the dam on Talo (Tangon) is located at Latitude 28º39'18"N and Longitude
96º00'07" E. Dam site of Dibang project is proposed at Munli village, with Latitude
28º20'07"N and Longitude 95º46'38"E.
1.1.1 Adopted Conventions
The following conventions have been adopted for the present study:
The hydrological year runs from June to May of the following calendar year;

Etalin Hydroelectric Project (3097 MW) Detailed Project Report
Volume-I: Main Report Part-A: Chapters 1 to 9
169126-40ER-0009-00 1-2
The monsoon season is defined from May to September;
The non-monsoon season is defined from October to April of the following calendar
year.
1.2 Basin Characteristics
1.2.1 River System and Basin Characteristics
The Dri and Talo (Tangon) rivers form part of the Dibang basin, which is situated in the
North Eastern part of India with its catchment entirely within the Indian Territory bordering
Tibet. Barring a small portion in the Tinsukia district of Assam, the basin mostly lies in the
Dibang Valley District / Lower Dibang Valley District of Arunachal Pradesh. The basin is
bounded by Tibet on its North, Lohit basin towards East, Siang basin on its West and
Lohit/Brahmaputra River on its South. Although, the whole of the catchment falls within the
Indian boundary, the Northern most catchment lies within the snowbelt. However, most of
the discharge contribution of the river comes from rainfall.
1.2.2 River Brahmaputra
Brahmaputra River which is known as Yarlung Tsangpo in Tibet originates from
Kailash Mansarovar Lake located in the western part of Tibet. This river traverses through
the Shigatse town and Yarlung Valley and crosses Lhasa, the capital of Tibet. It then takes
an eastern turn and crosses Kongpo area before turning to south and then enters Arunachal
Pradesh where it is known as Siang. After meeting its two important tributaries, Lohit and
Dibang this river enters the Assam plains, where it is called Brahmaputra. The river drains to
Bangladesh before joining the Ganga to form Meghna and also create a large delta called
Sunderbans.
1.2.3 River Dibang
The river Dibang is one of the major tributaries of the Brahmaputra river system, contributing
about 8.5% of its annual discharge. The river originates from the snow covered southern
flank of the Himalayas close to the Tibet border at an Elevation of more than 5000m. It cuts
through deep gorges and difficult terrain in its upper reach through the great Himalayan
range in Dibang Valley district of Arunachal Pradesh and finally meets the river Lohit near
Sadia in Assam. The combined flow meets Brahmaputra near Kobo Chapari.

Etalin Hydroelectric Project (3097 MW) Detailed Project Report
Volume-I: Main Report Part-A: Chapters 1 to 9
169126-40ER-0009-00 1-3
The river emerges from hills and enters the sloping plain areas near Nizamghat in Arunachal
Pradesh, from where the river flows for a distance of about 50 km to meet the river Lohit.
Although there is no hill in between this reach, the river gradient is very steep for such a
large river; in this 50 km reach, the river looses a height of about 160 m. In this portion, the
river is highly braided and destructive in nature. It branches out into a number of channels,
somewhere as many as 15 numbers and occupies a width of about 4 to 9 km. The river
changes its course quite often destroying large tracts of jungle and cultivable land and floods
occur in the low lying areas of Sadiya in Tinsukia District of Assam.
The Dri River after its confluence with Mathun near village Mathuli is known as Dri / Dibang
and has got a moderate to steep gradient. The river, as it flows down, is met by streams
called Ange from the left and Mathun from the right. Further downstream Talon/Talo
(Tangon) joins the river from the left and following this confluence the river is named as
Dibang.
Talo (Tangon) river, originate at an altitude of more than EL 5000 m and joins it near village
Etalin. The river after originating near Kayapass flows in Western direction before meeting
Dibang. Pothe Pani, Edzon River, Edza River, Ipi Pani, Davu Pani are some of the tributaries
of the Talo (Tangon) river.
1.2.4 The Catchment
The catchment area of Etalin project up to the proposed dam site on Dri/Dibang limb is
3685 km2 whereas the catchment area of the project up to proposed dam site on Talo
(Tangon) limb is 2573 km2. Dibang River has a total length 195 km from its origin to
confluence with Lohit. The length of the rivers up to the proposed diversion structures is
estimated as around 90 km and 74 km, respectively, on Dri/Dibang and Talo (Tangon) limbs.
The project is in highly mountainous terrain where NE-SW trending Himalayan ranges meet
with the Arakan Yoma range. The project area is marked by highly dissected topography
having precipitous hills and deep comparatively narrow valleys. Emra, Talo (Tangon) and
Mathun are the main tributaries in the upper reach of the river. Small tributaries like Ahi,
Ithun, Airi Pani, Ashu Pani, Ephi Pani, Deo Pani etc., meet the river in its lower reach.
The important feature is that all the tributaries barring Ephi Pani and Deo Pani join Dibang in
its hilly catchment. The catchment of the Dibang River is comparatively wider in its upper
reach.

Etalin Hydroelectric Project (3097 MW) Detailed Project Report
Volume-I: Main Report Part-A: Chapters 1 to 9
169126-40ER-0009-00 1-4
1.2.5 Hypsometric Details
The catchment area detail with elevation has been worked out for both the catchments on
Dri/Dibang and Talo (Tangon). The hypsometric curves for the two dam sites of the project
are given below:
HYPSOMETRIC CURVE OF ETALIN ON DRI (DIBANG)
0
1000
2000
3000
4000
5000
6000
0 500 1000 1500 2000 2500 3000 3500 4000Area above Elevation (km2)
Elev
atio
n (m
)
Figure 1: Hypsometric Curve of Etalin on Dri/Dibang
HYPSOMETRIC CURVE OF ETALIN ON TANGON
0
1000
2000
3000
4000
5000
6000
0 500 1000 1500 2000 2500 3000Area above Elevation (km2)
Elev
atio
n (m
)
Figure 2: Hypsometric Curve of Etalin on Talo (Tangon)
TALO (TANGON)

Etalin Hydroelectric Project (3097 MW) Detailed Project Report
Volume-I: Main Report Part-A: Chapters 1 to 9
169126-40ER-0009-00 1-5
1.2.6 Assessment of Snowfed and Rainfed Catchment Areas
The permanent snow line has been taken at an elevation of 4500 m as approved by CWC in
the case of Dibang Multipurpose Project, which, as mentioned earlier, is located just
downstream of this project. Using this assumption, the snowfed catchment area at Etalin on
Dri/Dibang has been worked out to be 128 km2 and at Etalin on Talo (Tangon) has been
worked out to be 176 km2. The rainfed catchment areas at Etalin on Dri/Dibang and Etalin on
Talo (Tangon) are 3557 and 2397 km2, respectively. It may therefore be concluded that only
3.5% and 6.8% of the total area at Etalin on Dri/Dibang and Etalin on Talo (Tangon) are
covered with permanent snow.
1.3 Water Availability Studies
1.3.1 Data Availability
Data relevant to hydrological assessment of the project, as available for the present study, is
shown in Figure 7-3. Most of the rainfall and G&D data of Dibang basin has been collected
from Brahmaputra Board. Data for Munli dam has been collected from NHPC, while the
rainfall data at Roing has been sourced locally.
1.3.2 Consistency Checks of Rainfall and Discharge Data
Detailed calculations on water availability and flood magnitude will lead to selecting the
design features of the project (installed capacity, turbine flow, spillway capacity, etc.).
Those features will directly reflect on the project cost and on the quantity and value of
energy produced. It is therefore necessary to confirm the validity of the basic data used in
the calculations. This verification was carried out for the two types of data, namely
precipitation and discharge, which is most likely to be subject to uncertainties. The details of
consistency checks has been provided in the Volume II (Hydrological Studies) of DPR.

Etalin Hydroelectric Project (3097 MW) Detailed Project Report
Volume-I: Main Report Part-A: Chapters 1 to 9
169126-40ER-0009-00 1-6
Chapakhowa
Epipani F F
Aharline
Anini
HunliRoing
Jiagaon
Elopa
Munli F
Asupani
Christian Basti F
LegendFull Year (>330 days)270 -330 days95 - 270 days
F < 95 days (Few data)
Daily precipitation data
1980
1981
1982
1983
1984
1985
1986
1987
1988
1989
1990
1997
1991
1992
1993
1994
1995
1996
2010
2003
2004
2005
2006
2009
1998
2007
2008
1999
2000
2001
2002
1980
1981
1982
1983
1984
1985
1986
1987
1988
1989
1990
1991
1992
1993
1994
1995
1996
1997
1998
1999
2000
2001
2010
2002
2003
2004
2005
2009
2006
2007
2008
Rain Gauge Station
Daily discharge data
G&D Station
Figure 3: Details of Data Availability
1.3.3 Type of Project
This project is a combination of two "run-of-the-river” Schemes which are being developed
purely for hydroelectric power generation purpose. Both the schemes involve a large dam
and a long water conductor system in the form of a headrace tunnels. The underground
powerhouse complex houses the turbine-generator units.
1.3.4 Period of Data Required
As per the Working Group constituted by the Ministry of Water Resources, Govt. of India for
setting “Guidelines for Preparation of Detailed Project Reports of Irrigation & Multipurpose
Projects”, minimum length of flow series at different project sites should be:

Etalin Hydroelectric Project (3097 MW) Detailed Project Report
Volume-I: Main Report Part-A: Chapters 1 to 9
169126-40ER-0009-00 1-7
Table 1: Details of minimum length of flow data
Type of Project Minimum length of data
Diversion Project 10 years
Within year storage project 25 Years
Over the year storage project 40 Years
However, perhaps these guidelines were evolved when Irrigation projects, requiring 75%
reliability in meeting the targets, were far more common. The hydroelectric projects are
generally required to meet the targets with 90% reliability, and thus only one failure here
would be allowable in a 10 year data. Thus, a 10 year series may perhaps be not very
representative of the failure years and it is felt that for run-of-the-river hydroelectric projects,
if possible, a longer series needs to be developed.
1.3.5 Computation of Water Availability Series
The methodologies of flow series assessment for the project at the two dam sites are as
follows:
Concurrent data of rainfall at Roing and discharge at Elopa for the period from
1998-2008/09 and concurrent data of average of rainfall at Roing and Jiagaon is
available for the period of 1998-2005.
Correlation between the standardized values of the concurrent period (1998-2008/09)
discharge data at Elopa with Roing rainfall has been done for the high flow months
i.e., May to October.
Correlation between the standardized values of the concurrent period (1998-2005)
discharge data at Elopa with the average of Roing and Jiagaon rainfall has been
done for the high flow months i.e., May to October.
Based on the correlation of Roing rainfall with Elopa discharge data, discharge at
Elopa has been extended for the month of May to Oct for the period of 1986 to 1991
and based on the correlation result obtained with the average of Roing and Jiagaon
rainfall, discharge at Elopa has been extended for the for the month of May to Oct for
period of 1991 to 1997. The details of correlations and analysis have been given in
the Volume II (Hydrological Studies) of DPR.
Because auto correlation and the earlier period flows forms a causative factor with
the current period rainfall, extension of low flow months i.e., Nov-Apr at Elopa for the

Etalin Hydroelectric Project (3097 MW) Detailed Project Report
Volume-I: Main Report Part-A: Chapters 1 to 9
169126-40ER-0009-00 1-8
period 1986 to 1997 has been carried out based on the percentage of ratio of non-
monsoon (low-flow) flow with that of monsoon (high-flow) period. The percentage of
ratio of non-monsoon (low-flow) flow with that of monsoon (high-flow) period for the
available discharge data (1998-2008) has been found to be 0.364 and proposed to
maintain the same ratio for the extended period also (1986-1997). The methodology
of extension of low flows has been arrived amid consultation with CWC.
Correlation between the total inflow of high flow months (May-Oct) and low flow
(Nov-Apr) months for the available discharge data at Elopa for the period from
1998 to 2008 has been worked out. Based on the correlation developed the total
inflow (MCM) for low-flow months has been worked out from the total inflow (MCM) of
high flow months for the extended period of 1986 to 1997.
Assuming that the low-flow months i.e., non-monsoon period flows behave in a
similar pattern for all the years, the total inflow for low-flow months (Nov-Apr) has
been distributed to 10-daily average values based on the percentage of each 10-daily
worked out from the available discharge data for the period from 1998 to 2008.
To this extended period of data, the observed data at Elopa from 1998-2008/09 were
appended. Thus a complete series from the period from 1986 to 2008/09 has been
developed at Elopa.
Finally, the discharge series at Elopa for the period from 1986-2008/09 has been
transposed to Etalin project sites i.e., Dri limb and Talo (Tangon) limb. The
methodology of transposition has been derived in consultation with CWC.
Elopa Series has been reduced by 10% for observational errors. After reducing Elopa
series by 10%, the flow series has been transposed to the respective dam sites of
Etalin by catchment area proportion with a rainfall variability of 0.958 for Dri limb and
0.874 for Talo (Tangon) limb.
Thus the flow series at Etalin has been worked out as per the methodology adopted/arrived
in consultation with CWC are given in Table 7-2 and Table 7-3, respectively.
The details of the methodology and subsequent analysis has been provided in the
Volume II (Hydrological Studies) of DPR.
CEA/CWC has already given the concurrence for the Water Availability and the
Methodology.

Etalin Hydroelectric Project (3097 MW) Detailed Project Report
Volume-I: Main Report Part-A: Chapters 1 to 9
169126-40ER-0009-00 1-9
Table 2: 10-Daily Average flow series (m3/s) for Dri Limb (1986-87 to 2008-09)
No of days 1986-87 1987-88 1988-89 1989-90 1990-91 1991-92 1992-93 1993-94 1994-95 1995-96 1996-97 1997-98
10 I 448.19 480.96 480.96 490.66 448.55 453.22 452.71 489.05 448.03 478.07 445.13 766.53
10 II 609.67 639.22 639.22 616.66 626.47 587.58 609.88 595.86 599.32 667.67 597.40 954.08
10 III 537.91 624.17 624.17 865.41 487.65 527.08 568.46 558.04 581.55 766.13 717.34 715.79
10 I 561.55 573.44 633.23 565.17 531.89 589.63 625.60 651.10 610.91 666.24 710.41 763.99
10 II 698.71 712.28 683.33 517.04 530.91 548.53 600.05 702.89 501.61 559.64 1,041.17 809.84
11 III 587.39 793.08 610.77 512.87 517.89 563.64 535.30 563.36 507.77 497.08 898.42 518.17
10 I 430.88 595.93 407.95 381.48 672.65 568.40 648.06 502.20 425.46 532.70 474.11 437.02
10 II 512.29 715.03 499.21 445.60 460.80 440.54 400.32 542.04 551.40 905.20 765.85 496.00
11 III 558.20 598.08 421.68 439.49 760.94 614.22 634.61 440.97 453.37 460.08 515.64 361.55
10 I 456.91 523.61 590.22 445.35 525.57 669.81 614.08 387.30 421.32 335.45 474.51 404.67
10 II 434.89 312.34 366.35 579.45 522.39 426.56 433.33 317.94 379.95 373.12 352.64 471.88
10 III 274.64 385.34 347.22 573.23 611.99 286.11 325.77 343.82 259.83 514.30 407.25 461.37
10 I 371.26 321.48 318.60 716.11 434.01 434.65 409.59 357.44 584.69 385.50 415.78 335.05
10 II 242.97 250.22 235.76 305.11 280.22 266.78 268.44 248.58 243.34 297.56 257.37 239.66
11 III 178.99 215.46 218.70 247.87 249.90 178.99 208.87 242.80 203.32 203.32 246.88 223.57
10 I 149.67 162.11 153.56 167.27 160.63 154.31 155.47 150.68 148.32 159.11 168.23 166.49
10 II 145.67 157.78 149.45 162.80 156.33 150.18 151.31 146.65 144.35 154.85 163.73 162.04
10 III 127.13 137.70 130.43 142.08 136.44 131.07 132.05 127.99 125.98 135.14 142.90 141.42
10 I 111.62 120.89 114.51 124.74 119.78 115.07 115.94 112.37 110.61 118.65 125.45 124.16
10 II 107.21 116.12 109.99 119.81 115.06 110.53 111.36 107.93 106.24 113.97 120.50 119.25
11 III 101.37 109.79 104.00 113.28 108.79 104.50 105.29 102.05 100.45 107.75 113.94 112.76
10 I 105.02 99.48 108.36 104.06 99.96 100.71 97.62 96.08 103.07 108.98 107.85 122.25
10 II 103.14 97.70 106.42 102.20 98.18 98.92 95.87 94.37 101.23 107.04 105.93 112.50
11 III 106.57 100.94 109.96 105.59 101.43 102.20 99.05 97.50 104.59 110.59 109.44 112.29
10 I 108.41 102.69 111.86 107.42 103.19 103.97 100.77 99.19 106.40 112.51 111.34 150.05
10 II 122.57 116.10 126.47 121.45 116.67 117.55 113.93 112.14 120.30 127.20 125.88 140.60
8 III 145.69 138.00 150.32 144.36 138.67 139.72 135.42 133.29 142.99 151.19 149.62 150.94
10 I 154.97 146.79 159.90 153.55 147.51 148.62 144.04 141.78 152.09 160.82 159.15 211.19
10 II 185.71 175.91 191.62 184.01 176.77 178.10 172.62 169.91 182.26 192.72 190.72 205.00
11 III 271.18 256.87 279.81 268.70 258.12 260.06 252.06 248.11 266.15 281.42 278.50 273.45
10 I 301.23 285.33 310.81 298.47 286.72 288.88 280.00 275.60 295.64 312.60 309.36 244.39
10 II 428.39 405.78 442.02 424.47 407.76 410.83 398.20 391.95 420.45 444.57 439.96 566.93
10 III 465.76 441.18 480.58 461.51 443.34 446.67 432.93 426.14 457.13 483.35 478.34 527.51
10 I 382.23 382.23 626.70 367.56 370.03 363.00 408.42 365.26 400.34 345.46 329.81 414.34
10 II 434.48 434.48 584.60 375.75 455.81 419.23 436.28 379.98 415.20 444.45 550.14 366.42
11 III 461.95 461.95 558.89 497.38 428.46 389.34 345.44 423.64 370.05 409.34 576.73 493.98
10041 10728 10703 10746 10633 10094 10204 9790 9778 10714 11596 11281
2724.9 2911.2 2904.5 2916.2 2885.4 2739.1 2769.1 2656.8 2653.6 2907.5 3146.9 3061.3 Runoff Depth (mm) =
Apr
May
Month
Nov
Dec
Jan
Feb
Jul
Aug
Inflow (MCM) =
Sep
Oct
Mar
Jun
Contd. on next page……

Etalin Hydroelectric Project (3097 MW) Detailed Project Report
Volume-I: Main Report Part-A: Chapters 1 to 9
169126-40ER-0009-00 1-10
Table 2 (Contd…): 10-Daily Average flow series (m3/s) for Dri Limb (1986-87 to 2008-09)
No of days 1998-99 1999-00 2000-01 2001-02 2002-03 2003-04 2004-05 2005-06 2006-07 2007-08 2008-09
10 I 636.45 466.63 796.32 376.86 179.60 428.14 381.81 589.85 751.43 458.02 401.30
10 II 840.42 539.95 894.03 399.67 301.44 652.61 663.69 803.21 883.03 905.53 510.83
10 III 569.25 694.65 1,065.74 348.15 282.87 825.62 968.93 683.03 510.48 596.13 448.19
10 I 777.01 921.03 612.87 375.65 483.45 815.36 962.18 608.13 530.51 402.69 406.03
10 II 1,339.46 387.51 501.85 364.86 607.24 577.34 1,449.22 565.00 471.35 749.32 357.11
11 III 1,053.98 244.32 560.25 551.36 555.72 413.10 714.09 439.59 441.08 1,089.84 561.87
10 I 717.92 348.09 774.65 454.63 354.56 334.47 455.24 689.51 285.88 519.97 314.47
10 II 1,391.50 442.84 607.88 452.17 379.99 429.94 383.03 661.75 248.21 566.30 711.27
11 III 1,153.36 496.65 496.13 531.31 200.56 287.24 364.49 1,168.12 360.62 355.65 772.10
10 I 979.16 267.82 437.84 464.69 138.68 374.84 356.73 735.98 423.23 883.32 678.61
10 II 211.21 270.78 377.00 353.62 252.83 362.23 321.22 651.86 625.53 476.99 300.16
10 III 179.72 158.87 318.78 256.09 559.51 262.87 335.80 1,137.94 260.17 207.23 208.11
10 I 200.94 192.07 303.44 326.98 849.07 368.72 616.77 434.78 291.82 213.52 466.59
10 II 234.29 187.31 233.34 234.41 315.61 259.73 309.02 278.73 139.41 312.63 271.26
11 III 394.48 186.38 216.24 144.69 167.03 209.03 210.85 430.33 103.64 157.18 213.96
10 I 183.76 175.93 158.35 200.81 115.64 146.56 192.45 246.81 86.65 89.49 145.42
10 II 163.26 169.76 154.12 208.07 130.31 116.86 193.01 214.61 90.39 110.85 144.06
10 III 158.85 165.30 134.50 186.31 99.20 101.90 132.78 192.37 113.26 75.28 119.79
10 I 146.67 159.12 118.09 173.35 94.60 93.62 122.76 172.40 88.19 63.24 66.92
10 II 145.12 154.78 113.43 185.81 90.67 80.84 104.62 148.47 90.25 57.56 76.14
11 III 132.07 148.18 107.24 168.45 88.12 75.07 117.61 140.71 77.17 52.39 72.68
10 I 141.57 144.60 131.92 153.61 82.49 66.11 107.07 58.97 71.13 48.70 85.24
10 II 128.82 145.41 130.16 137.38 78.48 67.20 114.42 72.52 67.07 54.31 83.91
11 III 116.44 146.21 131.15 173.24 73.17 71.87 107.44 62.90 63.35 86.99 83.96
10 I 117.61 146.53 124.54 131.31 82.28 62.97 120.19 73.98 63.09 92.34 91.86
10 II 114.37 142.43 121.30 142.81 110.31 62.19 239.44 68.34 77.21 98.04 96.19
8 III 133.02 142.74 124.51 140.09 118.12 59.03 233.11 303.46 75.06 85.33 273.03
10 I 157.90 161.03 146.10 122.60 127.93 123.64 256.63 158.59 102.99 96.51 254.03
10 II 118.22 164.98 137.12 136.01 180.74 130.24 332.91 211.84 111.51 266.85 287.99
11 III 99.61 174.84 196.26 173.85 221.47 504.10 564.75 159.21 183.81 362.46 257.97
10 I 248.04 359.56 233.84 165.10 290.09 277.49 534.86 296.31 323.10 263.92 319.01
10 II 299.90 623.41 263.88 354.75 337.35 251.88 839.10 414.14 240.99 410.74 366.57
10 III 466.75 677.36 271.62 257.65 400.28 214.89 587.50 446.86 602.23 551.98 357.70
10 I 449.37 438.93 287.19 212.67 483.49 201.47 467.98 453.47 309.02 511.88 335.27
10 II 396.37 398.73 215.68 246.23 341.85 833.31 602.19 546.82 487.40 466.29 277.49
11 III 603.23 524.08 220.67 220.27 344.96 293.97 636.45 807.75 591.20 430.04 339.79
13417 9791 10269 8375 8347 9167 13241 13296 8993 10719 9446
3641.0 2657.0 2786.8 2272.8 2265.2 2487.7 3593.2 3608.1 2440.4 2908.7 2563.3
Avg. Inflow (MCM) = 10494.34Avg. Runoff Depth (mm) = 2848
Runoff Depth (mm) =
Apr
May
Month
Nov
Dec
Jan
Feb
Jul
Aug
Inflow (MCM) =
Sep
Oct
Mar
Jun

Etalin Hydroelectric Project (3097 MW) Detailed Project Report
Volume-I: Main Report Part-A: Chapters 1 to 9
169126-40ER-0009-00 1-11
Table 3: 10-Daily Average flow series (m3/s) for Talo (Tangon) Limb (1986-87 to 2008-09)
No of days 1986-87 1987-88 1988-89 1989-90 1990-91 1991-92 1992-93 1993-94 1994-95 1995-96 1996-97 1997-98
10 I 285.50 306.38 306.38 312.56 285.73 288.71 288.38 311.53 285.40 304.54 283.55 488.29
10 II 388.37 407.19 407.19 392.82 399.07 374.30 388.50 379.57 381.78 425.31 380.55 607.76
10 III 342.66 397.61 397.61 551.28 310.64 335.75 362.11 355.48 370.45 488.04 456.96 455.97
10 I 357.72 365.29 403.37 360.02 338.82 375.60 398.52 414.76 389.16 424.40 452.54 486.67
10 II 445.09 453.73 435.29 329.36 338.20 349.42 382.24 447.75 319.53 356.50 663.24 515.88
11 III 374.18 505.20 389.07 326.71 329.90 359.04 340.99 358.87 323.46 316.65 572.30 330.08
10 I 274.47 379.61 259.87 243.01 428.49 362.07 412.82 319.91 271.03 339.33 302.02 278.39
10 II 326.34 455.48 318.00 283.86 293.53 280.63 255.01 345.29 351.25 576.62 487.85 315.96
11 III 355.58 380.99 268.62 279.96 484.73 391.27 404.26 280.90 288.80 293.08 328.47 230.31
10 I 291.06 333.55 375.98 283.70 334.79 426.68 391.18 246.72 268.38 213.68 302.27 257.78
10 II 277.03 198.97 233.37 369.12 332.77 271.73 276.03 202.53 242.03 237.68 224.63 300.59
10 III 174.95 245.47 221.18 365.16 389.85 182.26 207.52 219.02 165.52 327.61 259.43 293.90
10 I 236.50 204.79 202.95 456.17 276.47 276.88 260.91 227.69 372.45 245.57 264.86 213.43
10 II 154.78 159.39 150.18 194.36 178.51 169.94 171.00 158.35 155.01 189.55 163.95 152.67
11 III 114.02 137.25 139.31 157.90 159.19 114.02 133.05 154.67 129.52 129.52 157.27 142.42
10 I 95.34 103.27 97.82 106.55 102.32 98.29 99.03 95.99 94.48 101.35 107.17 106.06
10 II 92.79 100.50 95.20 103.70 99.59 95.67 96.39 93.42 91.95 98.64 104.30 103.22
10 III 80.99 87.71 83.09 90.51 86.91 83.49 84.12 81.53 80.25 86.09 91.03 90.08
10 I 71.10 77.01 72.94 79.46 76.30 73.30 73.85 71.58 70.46 75.58 79.92 79.09
10 II 68.29 73.97 70.07 76.32 73.29 70.41 70.94 68.76 67.68 72.60 76.76 75.97
11 III 64.57 69.94 66.25 72.16 69.30 66.57 67.07 65.01 63.99 68.64 72.58 71.83
10 I 66.90 63.37 69.03 66.29 63.68 64.16 62.18 61.21 65.66 69.42 68.70 77.87
10 II 65.70 62.24 67.79 65.10 62.54 63.01 61.07 60.11 64.48 68.18 67.48 71.66
11 III 67.88 64.30 70.04 67.26 64.61 65.10 63.10 62.11 66.63 70.45 69.72 71.53
10 I 69.06 65.42 71.26 68.43 65.73 66.23 64.19 63.18 67.78 71.67 70.93 95.58
10 II 78.08 73.96 80.56 77.37 74.32 74.88 72.58 71.44 76.63 81.03 80.19 89.56
8 III 92.80 87.91 95.76 91.96 88.34 89.00 86.26 84.91 91.08 96.31 95.31 96.15
10 I 98.72 93.51 101.86 97.81 93.96 94.67 91.76 90.32 96.89 102.44 101.38 134.53
10 II 118.30 112.06 122.06 117.22 112.60 113.45 109.96 108.23 116.10 122.76 121.49 130.59
11 III 172.74 163.63 178.24 171.16 164.43 165.66 160.57 158.05 169.54 179.27 177.41 174.19
10 I 191.89 181.76 197.99 190.13 182.65 184.02 178.36 175.56 188.33 199.13 197.07 155.68
10 II 272.89 258.49 281.57 270.40 259.75 261.71 253.66 249.67 267.83 283.19 280.26 361.14
10 III 296.70 281.04 306.14 293.98 282.41 284.54 275.78 271.46 291.20 307.90 304.71 336.03
10 I 243.49 243.49 399.21 234.14 235.71 231.24 260.17 232.68 255.02 220.06 210.09 263.94
10 II 276.77 276.77 372.40 239.35 290.36 267.05 277.92 242.05 264.49 283.12 350.45 233.41
11 III 294.27 294.27 356.02 316.84 272.94 248.01 220.05 269.86 235.73 260.75 367.39 314.67
6396 6834 6818 6845 6773 6430 6500 6236 6229 6825 7387 7186
2486.0 2656.0 2649.9 2660.5 2632.4 2499.0 2526.3 2423.8 2420.9 2652.5 2870.9 2792.9
Jun
Sep
Oct
Mar
Apr
May
Month
Nov
Dec
Jan
Feb
Jul
Aug
Inflow (MCM) =
Runoff Depth (mm) = Contd. on next page……

Etalin Hydroelectric Project (3097 MW) Detailed Project Report
Volume-I: Main Report Part-A: Chapters 1 to 9
169126-40ER-0009-00 1-12
Table 3 (Contd….): 10-Daily Average flow series (m3/s) for Talo (Tangon) Limb (1986-87 to 2008-09)
No of days 1998-99 1999-00 2000-01 2001-02 2002-03 2003-04 2004-05 2005-06 2006-07 2007-08 2008-09
10 I 405.43 297.25 507.27 240.07 114.41 272.73 243.22 375.74 478.67 291.77 255.63
10 II 535.36 343.96 569.51 254.59 192.02 415.72 422.78 511.65 562.50 576.83 325.41
10 III 362.62 442.50 678.89 221.78 180.19 525.93 617.22 435.10 325.18 379.74 285.50
10 I 494.96 586.71 390.41 239.29 307.96 519.40 612.92 387.39 337.94 256.52 258.64
10 II 853.26 246.85 319.68 232.42 386.82 367.77 923.17 359.92 300.26 477.32 227.48
11 III 671.40 155.63 356.89 351.22 354.00 263.15 454.88 280.02 280.98 694.25 357.92
10 I 457.33 221.74 493.46 289.60 225.86 213.06 289.99 439.22 182.11 331.23 200.32
10 II 886.40 282.10 387.23 288.04 242.06 273.87 244.00 421.54 158.11 360.74 453.09
11 III 734.70 316.37 316.04 338.45 127.76 182.98 232.19 744.11 229.72 226.56 491.84
10 I 623.73 170.60 278.91 296.01 88.34 238.78 227.24 468.83 269.60 562.69 432.29
10 II 134.55 172.49 240.16 225.26 161.06 230.75 204.62 415.24 398.47 303.85 191.21
10 III 114.49 101.20 203.07 163.13 356.41 167.45 213.91 724.88 165.73 132.01 132.57
10 I 128.00 122.35 193.30 208.29 540.87 234.88 392.89 276.96 185.89 136.01 297.22
10 II 149.25 119.32 148.64 149.32 201.05 165.45 196.85 177.55 88.81 199.15 172.80
11 III 251.29 118.73 137.75 92.17 106.40 133.16 134.32 274.12 66.02 100.13 136.29
10 I 117.06 112.07 100.87 127.92 73.66 93.36 122.60 157.22 55.20 57.00 92.63
10 II 104.00 108.14 98.18 132.54 83.01 74.44 122.95 136.71 57.58 70.61 91.77
10 III 101.19 105.30 85.68 118.68 63.19 64.91 84.59 122.54 72.15 47.95 76.31
10 I 93.43 101.36 75.22 110.42 60.26 59.64 78.20 109.82 56.18 40.29 42.63
10 II 92.45 98.60 72.25 118.36 57.76 51.50 66.65 94.58 57.49 36.67 48.50
11 III 84.13 94.39 68.32 107.31 56.13 47.82 74.92 89.64 49.16 33.37 46.30
10 I 90.18 92.11 84.03 97.85 52.55 42.11 68.20 37.57 45.31 31.03 54.30
10 II 82.06 92.63 82.91 87.51 49.99 42.81 72.89 46.20 42.72 34.60 53.45
11 III 74.17 93.14 83.55 110.36 46.61 45.78 68.44 40.07 40.35 55.41 53.48
10 I 74.92 93.34 79.33 83.65 52.41 40.12 76.56 47.13 40.19 58.82 58.51
10 II 72.86 90.73 77.27 90.97 70.27 39.62 152.52 43.53 49.18 62.45 61.28
8 III 84.73 90.93 79.32 89.24 75.24 37.60 148.50 193.31 47.81 54.36 173.92
10 I 100.59 102.58 93.07 78.10 81.49 78.76 163.48 101.03 65.60 61.48 161.82
10 II 75.31 105.09 87.35 86.64 115.13 82.96 212.07 134.95 71.03 169.98 183.45
11 III 63.45 111.37 125.02 110.74 141.08 321.12 359.75 101.42 117.09 230.89 164.33
10 I 158.01 229.04 148.96 105.17 184.79 176.76 340.71 188.75 205.82 168.12 203.22
10 II 191.04 397.12 168.09 225.98 214.89 160.45 534.52 263.81 153.52 261.65 233.51
10 III 297.33 431.49 173.03 164.12 254.98 136.89 374.24 284.66 383.63 351.62 227.86
10 I 286.25 279.61 182.94 135.47 307.99 128.34 298.11 288.87 196.85 326.07 213.57
10 II 252.50 254.00 137.39 156.85 217.76 530.83 383.60 348.33 310.48 297.03 176.76
11 III 384.27 333.85 140.57 140.31 219.74 187.26 405.43 514.55 376.60 273.94 216.45
8547 6237 6542 5335 5317 5840 8435 8470 5729 6828 6017
3321.7 2424.1 2542.5 2073.6 2066.6 2269.6 3278.2 3291.7 2226.4 2653.7 2338.5
Avg. Inflow (MCM) = 6685.03
Avg. Runoff Depth (mm) = 2598
Jun
Sep
Oct
Mar
Apr
May
Month
Nov
Dec
Jan
Feb
Jul
Aug
Inflow (MCM) =
Runoff Depth (mm) =

Etalin Hydroelectric Project (3097 MW) Detailed Project Report
Volume-I: Main Report Part-A: Chapters 1 to 9
169126-40ER-0009-00 1-13
1.3.6 Flow Duration Curves
Having prepared the long term 10-daily average flow series for Dri limb of Etalin and Talo
(Tangon) limb of Etalin, the flow duration curves for both these sites have been prepared
which are shown in the following figures.
10 Daily Flow Duration Curve-Etalin (Dri Limb)
0
200
400
600
800
1000
1200
1400
1600
0 10 20 30 40 50 60 70 80 90 100Percentage of Exceedence
Dis
char
ge (c
umec
)
Figure 4: Flow Duration curve for Dri Limb of Etalin
10 Daily Flow Duration Curve-Etalin (Tangon Limb)
0
100
200
300
400
500
600
700
800
900
1000
0 10 20 30 40 50 60 70 80 90 100Percentage of Exceedence
Dis
char
ge (c
umec
)
Figure 5: Flow Duration curve for Talo (Tangon) Limb of Etalin
TALO (TANGON)

Etalin Hydroelectric Project (3097 MW) Detailed Project Report
Volume-I: Main Report Part-A: Chapters 1 to 9
169126-40ER-0009-00 1-14
1.4 Design Flood
1.4.1 General
Estimation of design flood is a significant component of hydrological studies. Proper
selection of design flood value is important as an over-estimated value results in increase in
the cost of hydraulic structures, while an under-estimated value will place the structure and
population at risk.
1.4.2 Criteria for Estimation of Design Flood
As per the Manual on Estimation of Design Flood (CWC, 2001) as well as BIS: 11223-1985
(Reaffirmed 2004), “Guidelines for Fixing Spillway Capacity”, the inflow design flood for
safety of a dam is decided based on gross storage and static head at FRL (from FRL to the
minimum tail water level) at a given project. The following criteria are recommended.
Table 4: Classification Criteria of Hydraulic Structures
Classification Gross Storage ( x106 m3)
Hydraulic Head (m)
Inflow Design Flood
Small 0.5 - 10 7.5 –12 100 year return period
Intermediate 10 - 60 12 –30 SPF
Large > 60 > 30 PMF
The diversion structures proposed in the present project are dams. The hydraulic head on
Dri limb dam is about 77 m and that on Talo (Tangon) limb dam is about 47m. Therefore, as
per the above criteria, spillway capacity at both locations should be sufficient to pass
Probable Maximum Flood (PMF).
1.4.3 Computation of Design Flood - PMF
In the present case, the design floods at the project are estimated using the
Hydro-meteorological approach. Since site specific short interval rainfall-runoff records are
not available, the procedure for estimating unit hydrograph given in “Flood Estimation
Report for North Brahmaputra, subzone 2(a), Central Water Commission, 1991” has been
adopted.
The methodology comprises of the following steps:
First, the Probable Maximum Precipitation (PMP) is defined

Etalin Hydroelectric Project (3097 MW) Detailed Project Report
Volume-I: Main Report Part-A: Chapters 1 to 9
169126-40ER-0009-00 1-15
A typical unit hydrograph is then defined for the basin, and the flood hydrograph is
computed by convolution of this hydrograph.
1.4.4 Physiographic Parameters of the Catchment
a) Catchment Area (A):
The project catchment area is derived by delineating the relevant topo sheets. The snowline
elevation of 4500 m (suggested by IMD) has been taken to delineate the rain-fed area of the
project catchment. As mentioned above, the breakup of project catchment areas on the
Dri and Talo (Tangon) limbs is:
Table 5: Breakup of Catchment Area
Name of Project Catchment
Rain-fed Area (km2)
Snow-fed Area (km2)
Total Area (km2)
Dri limb 3557 128 3685
Talo (Tangon) limb 2397 176 2573
b) Parameters of the Main Stream (L & Lc):
River length (L) implies the longest length of the main river from the farthest watershed
boundary of rain-fed catchment to the downstream boundary point, whereas Lc is defined as
the length of the longest main stream from a point opposite to centroid of the catchment area
to the gauging site (i.e., the outlet point) along the main stream. The stream may or may not
pass through the centre of gravity but the point of the river nearest to the centre of gravity is
considered to find the length of the main river from the centre of gravity to the point of study
(Lc). In the present case, the details of these parameters as extracted from the available
information are given below.
Table 6: River Length Parameters
Name of Project Catchment L (km) Lc (km)
Dri limb 93.98 56.46
Talo (Tangon) limb 72.58 45.42
c) Equivalent Stream Slope (S):
This is one of the physiographic parameters used in the derivation of Synthetic
Unit Hydrograph. The L-section of the river is derived from relevant topo sheets. It is broadly

Etalin Hydroelectric Project (3097 MW) Detailed Project Report
Volume-I: Main Report Part-A: Chapters 1 to 9
169126-40ER-0009-00 1-16
divided into segments representing broad ranges of slopes. The following formula is used to
compute equivalent slope (S).
2
)1( )(
L
DDLS
iii
Elevations of riverbed at intersection points of contours reckoned from the bed elevation at
the diversion site are considered as datum. D(i-1) and Di are the heights of successive bed
locations at contour intersections. The equivalent slope thus computed for Dri limb is
21.17 m/km and that for Talo (Tangon) limb is 31.33 m/km.
1.4.5 Derivation of Unit Hydrograph
The Central Water Commission (CWC), in association with the Indian Meteorological
Department (IMD), Ministry of Railways and Ministry of Surface Transport, has prepared
flood estimation reports for small and medium rain-fed catchments for efficient
hydro-meteorological homogenous sub-zones. These reports illustrate the procedure for
derivation of synthetic unit hydrograph based on physiographic parameters. The unit
hydrograph for the rain-fed catchment area of the project has been derived as per
procedures and guidelines given in the regional flood report of sub zone 2a.
SUH parameters for the present project are derived using project specific information and
are included in Table 7-7.
Table 7: Sub-Zone 2a Unit Hydrograph Parameters
Parameter Definition Formula Unit Dri Limb
Talo (Tangon) Limb
L Length of longest main stream along the river course
Measured from Topographical Map km 93.98 72.58
Lc
Length of longest main stream from a point opposite to centroid of the catchment
area to intake site
Measured from Topographical Map km 56.46 45.42
A Rain fed Area Measured from Topographical Map km² 3557 2397
S Equivalent Stream Slope
2
1
L
DDLS
iii
m/km 21.17 31.33
qp Peak Discharge of unit
hydrograph per km²
409.0
272.2
S
LLq c
p m³/s/km² 0.24 0.34
Qp Peak Discharge of unit
hydrograph pp qAQ m³/s 844 811

Etalin Hydroelectric Project (3097 MW) Detailed Project Report
Volume-I: Main Report Part-A: Chapters 1 to 9
169126-40ER-0009-00 1-17
Parameter Definition Formula Unit Dri Limb
Talo (Tangon) Limb
tp Time from the centre of
effective rain fall duration to the unit hydrograph Peak
940.0164.2
pp qt hrs 8.37 5.99
tm Time from start of rise to the
peak of unit hydrograph 5.0 pm tt hrs 8.87 6.49
TB Base width of unit hydrograph 852.0428.5 pB tT hrs 33.16 24.96
W50 Width of unit hydrograph
measured at 50% of Peak Discharge Ordinate
065.1
50 084.2
pqW hrs 9.64 6.61
W75 Width of unit hydrograph measured at 75% of peak
discharge ordinate 071.1
75 028.1
pqW hrs 4.80 3.28
WR50
(Width of the rising limb of unit hydrograph measured at
50% of Peak Discharge Ordinate
865.0
50 856.0
pR qW hrs 2.97 2.19
WR75 Width of the rising limb of unit hydrograph measured at 75% of Peak Discharge Ordinate
918.0
75 44.0
pR qW hrs 1.65 1.19
The 1-hour Synthetic Unit Hydrograph (SUH) representing effective rainfall depth of 1 cm
has been obtained for both the catchments on the Dri and Talo (Tangon) limbs using the
above parameters. The SUH for Dri and Talo (Tangon) river catchments up to the proposed
dam sites are shown in figures below:
Unit Hydrograph - Dri Limb
0
100
200
300
400
500
600
700
800
900
0 2 4 6 8 10 12 14 16 18 20 22 24 26 28 30 32 34 36Time (hr)
Flow
(m³/s
)
Figure 6: SUH of Dri limb

Etalin Hydroelectric Project (3097 MW) Detailed Project Report
Volume-I: Main Report Part-A: Chapters 1 to 9
169126-40ER-0009-00 1-18
Unit Hydrograph - Tangon Limb
0
100
200
300
400
500
600
700
800
900
0 2 4 6 8 10 12 14 16 18 20 22 24 26Time (hr)
Flow
(m³/s
)
Figure 7: SUH of Talo (Tangon) limb
The important parameters for deciding critical storm duration are size and shape of the
catchment, travel time/base period of unit hydrograph and the direction of the storm
movement with reference to the direction of river flow. For all practical purposes, the UG
base governs the duration of the storm. As can be seen from the above figures, the base
period of unit hydrograph is 33 hours for Dri limb and 25 hours for Talo (Tangon) limb.
Therefore, design storm of 1 day has been used for the flood estimation of Talo (Tangon)
limb and design storm of 2 days has been used for the design flood estimation of Dri limb.
1.4.6 Design Storm
Design storm studies for the project have been carried out by the Indian Meteorological
Department (IMD), on the basis of the available rainfall data in the area. The Standard
Project Storm (SPS) and Probable Maximum Precipitation (PMP) values along with time
distribution for 1-day and 2-day storm, provided by IMD, are given in Table 7-8 and
Table 7-9, respectively.
TALO (TANGON)

Etalin Hydroelectric Project (3097 MW) Detailed Project Report
Volume-I: Main Report Part-A: Chapters 1 to 9
169126-40ER-0009-00 1-19
Table 8: Standard Project Strom (SPS) and Probable Maximum Precipitation (PMP) Values
Project Stages Duration Design SPS (cm) PMP (cm)
Dri limb 1 day 18.0 22.7
2 day 29.80 37.5
Talo (Tangon) limb 1 day 16.00 20.20
2 day 26.4 33.30
Note: As recommended by IMD, the above 1-day precipitation values may be increased by 15% to convert them into any 24 hour values.
Table 9: Temporal Distribution of the SPS and PMP
Duration (hrs) 24-hour (%) 48-hour (%)
3 35 25
6 53 38
9 65 46
12 74 52
15 82 58
18 89 63
21 95 68
24 100 73
27 77
30 81
33 85
36 88
39 91
42 94
45 97
48 100
The autographic records for storms in India are indicative of a pattern of two bells per day of
the storm with high intensity spells lasting for 9 to 12 hours. Therefore, the design storm of
1-day and 2-day values is distributed into 12-hour bells, which are given as under.

Etalin Hydroelectric Project (3097 MW) Detailed Project Report
Volume-I: Main Report Part-A: Chapters 1 to 9
169126-40ER-0009-00 1-20
Table 10: PMP Distribution for Dri limb
Design Storm (cm) Ratio of 12/24 hr rainfall
Storm Distribution (cm)
PMP I-Bell II-Bell I-Bell II-Bell
1st Day 22.7 0.74 0.26 16.80 (1A)
5.90 (1B)
2nd Day 14.8 (=37.5-22.7) 0.74 0.26 10.95
(2A) 3.85 (2B)
Table 11: PMP Distribution for Talo (Tangon) limb
Design Storm, cm
Ratio of 12/24 hr rainfall
Storm Distribution (cm)
PMP I-Bell II-Bell I-Bell II-Bell 1st Day 24-hr
23.23 (=1.15*20.2) 0.74 0.26 17.2
(1A) 6.0 (1B)
For obtaining the largest practicable value of the PMF, the bell arrangement (sequencing) for
Dri limb has been considered to follow the sequence like: 2B-2A-1B-1A. It has also been
ensured during bell sequencing that the summation of storm value of any two consecutive
bells doesn’t exceed the 24-hour value of 1-day PMP which has been obtained by adding
the clock hour correction factor of 15% on 1-day PMP storm. In other words the critical
sequencing of bells for Dri limb is done in such a way that no two consecutive bells exceeds
the value of 26.105 cm (=22.7*1.15) which is 1.15 times that of 1-day PMP of 22.7 cm.
For the Talo (Tangon) limb, the bell arrangement would be 1B-1A.
1.4.7 Design Loss Rate
In the present study, design loss rate of 0.1 cm/hr has been adopted for the computation of
design flood for both the dams.
1.4.8 Critical Sequence of Rainfall Excess
To obtain the critical sequence of rainfall excess, the highest rainfall depth has been placed
against the maximum UG ordinate and the next ranking rainfall depth has been placed
against the next ranking ordinate of hydrograph. This critical arrangement is then reversed to
obtain the maximum flood peak.

Etalin Hydroelectric Project (3097 MW) Detailed Project Report
Volume-I: Main Report Part-A: Chapters 1 to 9
169126-40ER-0009-00 1-21
1.4.9 Base flow and Snow melt
The total base-flow, including snowmelt, has been estimated as 246 m3/s for Dri and
181 m3/s for Talo (Tangon).
1.4.10 Surface Flow Hydrograph
The Surface Flow Hydrograph has been computed by convoluting 1-hour rainfall excess
increments with the ordinates of the 1-hr Unit Hydrograph. For this purpose, the rainfall
excess increments have been arranged in a critical sequence. Each of the individual
incremental hydrographs has been lagged 1-hour from the previous one in the assumed
critical sequence and added to obtain the surface flow hydrograph.
1.4.11 Flood Hydrograph
The Flood Hydrograph has been obtained by adding a uniform base flow, including
snowmelt, to the ordinates of the surface flow hydrograph. The Probable Maximum Flood
(PMF) for Dri and Talo (Tangon) limbs thus computed are given in the following table and
the PMF hydrograph are given in subsequent figures.
Table 12: Design Flood (PMF)
PMF (m3/s)
Dri Limb 11811
Talo (Tangon) Limb 10218

Etalin Hydroelectric Project (3097 MW) Detailed Project Report
Volume-I: Main Report Part-A: Chapters 1 to 9
169126-40ER-0009-00 1-22
PMF Hydrograph- DRI Limb11811
0
2000
4000
6000
8000
10000
12000
0 4 8 12 16 20 24 28 32 36 40 44 48 52 56 60 64 68 72 76 80
Time (hr)
Dis
char
ge (c
umec
)
Figure 8: PMF Hydrograph for Dri Limb
PMF Hydrograph- TANGON Limb
10218
0
2000
4000
6000
8000
10000
0 4 8 12 16 20 24 28 32 36 40 44 48 52
Time (hr)
Dis
char
ge (c
umec
)
Figure 9: PMF Hydrograph for Talo (Tangon) Limb
The tabulation of the PMF hydrograph for both Dri limb and Talo (Tangon) limb is given
below:
The detail calculation and analysis of design flood can be referred in Volume-II (Hydrological Studies) of DPR.
TALO (TANGON)

Etalin Hydroelectric Project (3097 MW) Detailed Project Report
Volume-I: Main Report Part-A: Chapters 1 to 9
169126-40ER-0009-00 1-23
Table 13: Design Flood Hydrograph (PMF) Values
Hours PMF of Dri limb (m3/s)
PMF of Talo (Tangon) limb
(m3/s)
Hours PMF of Dri limb (m3/s)
PMF of Talo (Tangon) limb
(m3/s) 0 246 181 41 5819 641 1 249 186 42 5762 494 2 254 200 43 5757 368 3 265 230 44 5955 277 4 283 285 45 6380 227 5 307 386 46 6928 200 6 347 534 47 7572 185 7 406 739 48 8290 181 8 498 1006 49 9085 9 633 1343 50 9981 10 792 1734 51 10935 11 969 2190 52 11704 12 1158 2675 53 11811 13 1384 3077 54 11321 14 1653 3297 55 10460 15 1968 3318 56 9447 16 2272 3270 57 8471 17 2459 3318 58 7563 18 2584 3520 59 6731 19 2728 3910 60 5991 20 2979 4498 61 5308 21 3364 5310 62 4676 22 3813 6298 63 4081 23 4312 7499 64 3538 24 4846 8803 65 3045 25 5434 9820 66 2620 26 6095 10218 67 2235 27 6806 9863 68 1918 28 7402 9018 69 1637 29 7574 7908 70 1394 30 7374 6739 71 1191 31 6968 5585 72 1016 32 6524 4559 73 859 33 6169 3692 74 705 34 5888 2971 75 557 35 5679 2389 76 433 36 5541 1913 77 331 37 5493 1541 78 278 38 5538 1248 79 255 39 5673 1017 80 246 40 5820 813 81

Etalin Hydroelectric Project (3097 MW) Detailed Project Report
Volume-I: Main Report Part-A: Chapters 1 to 9
169126-40ER-0009-00 1-24
1.4.12 Design Flood for River Diversion Works
In general, it is not economical to design the diversion works for the greatest flood which is
likely to occur. As per IS 14815:2000, the diversion design flood for concrete dams and
barrages must be the higher of the following two values:
Maximum non-monsoon flow observed at the dam site
25 years non-monsoon flow, calculated on the basis of non-monsoon yearly peaks.
However, the design flood selected is usually a compromise between the cost of diversion
works and the risk involved. In case of earth dam, overtopping of embankment during
construction may result in extensive damage, whereas in concrete dams, overtopping may
be tolerated to some extent if it results in minimal damages. In Etalin Hydroelectric Project,
both dams are concrete gravity type. As per IS 14815 – 2000, titled “Design flood for river
diversion works – Guidelines”, the following factors should be considered interalia.
The period of stoppage of work during flood season and number of flood seasons
which are to be managed during the work.
The cost of delay in completion of the work.
In addition to the above, the time required for all the activities to be completed in the riverbed
(such as excavation, foundation treatment and concreting up to about the original riverbed
level) plays an important role in selecting the diversion flood. If the aforesaid activities cannot
be completed in one lean season, then higher flood must be considered for diversion.
In view of the above, the diversion flood studies for the project have been carried out for both
non-monsoon and monsoon periods.
1.4.13 Data
At present, no observed flood peak data are available at the diversion sites. However, flood
peaks are available at Elopa and Munli dam sites, which are downstream of the proposed
project at Etalin. Therefore, the diversion flood studies have been carried out using these
available data at Elopa (CA = 11666 km2) and Munli (CA = 11276 km2) G&D sites. The flows
at both these sites have been transferred to the project at Etalin, based on Dicken’s formula.
The multiplying factors as used for transferring the Elopa and Munli peak flows to the
Etalin project site are given below:

Etalin Hydroelectric Project (3097 MW) Detailed Project Report
Volume-I: Main Report Part-A: Chapters 1 to 9
169126-40ER-0009-00 1-25
Table 14: Transfer Factor for Elopa and Munli Peak Flows
Dri Limb (CA=3685 km2)
Talo (Tangon) Limb (CA=2573 km2)
Elopa Peak Flow (CA = 11666 km2) 0.421 0.322
Munli Peak Flow (CA = 11276 km2) 0.432 0.330
Using the above multiplying factors to the available Elopa and Munli peak flows and
increasing them by 15% on account of instantaneous peak, the final peak flows (both for
monsoon and non-monsoon) on Dri and Talo (Tangon) are obtained as follows:
Table 15: Final Peak Flows at Dri and Talo (Tangon) Limbs
Period Monsoon Peak Flows (m3/s) Non-Monsoon (Oct-Apr) Peak
Flows (m3/s) Dri Limb Talo (Tangon)
Limb Dri Limb Talo (Tangon) Limb
1998-99 4037.23 2681.56 1530.54 1016.60
1999-00 2764.85 1836.43 1320.85 877.32
2000-01 3592.09 2385.89 593.70 394.34
2001-02 1978.65 1314.24 1213.98 806.33
2002-03 3885.75 2580.94 2030.44 1348.64
2003-04 3833.49 2546.23 1667.47 1107.55
2004-05 4743.74 3150.83 2426.22 1611.51
2005-06 4390.46 2916.17 3053.53 2028.18
2006-07 3373.97 2241.02 2202.45 1462.89
2007-08 3241.14 2152.79 2203.74 1463.74
2008-09 2646.48 1757.82 962.14 639.06
2009-10 2812.22 1867.90
1.4.14 Statistical Parameters
Details of important statistical parameters for the flood peaks at the two dam sites for the two
different periods (monsoon and non-monsoon) are given in the following table.

Etalin Hydroelectric Project (3097 MW) Detailed Project Report
Volume-I: Main Report Part-A: Chapters 1 to 9
169126-40ER-0009-00 1-26
Table 16: Statistical Parameters of Peak Flows at Dri and Talo (Tangon) Limbs
Parameters Monsoon Period Non-Monsoon Period (Oct-Apr)
Dri Limb Talo (Tangon) Limb Dri Limb Talo (Tangon) Limb
Mean(Xm) 3441.67 2628.88 1745.92 1333.60
SD (Sx) 797.47 609.13 716.22 547.08
Variance 635951 371045 512973 299294
Skewness -0.17 -0.17 0.17 0.17
Kurtosis -0.44 -0.44 -0.34 -0.34
No. of Data 12 12 11 11
1.4.15 Flood Frequency Analysis
For estimating the 25-year return period flood, Extreme Value Type-I i.e., Gumbel,
Log-Normal and Log Pearson Type-III distributions have been used to model the annual
maximum monsoon and non-monsoon flows in the present study. The results of the analysis
are shown in the table below.
Table 17: Detail of 25 year Return Period Flood (m3/s)
Log-Normal
Log-Pearson Gumbel Chow’s
Method Observed Maximum
Dri limb Monsoon 5171 4846 5627 5072 4743.74 Non-Monsoon 3634 3142 3744 3210 3053.53
Talo (Tangon) limb
Monsoon 3950 3701 4298 3874 3623.45 Non-Monsoon 2776 2400 2860 2452 2332.4
1.4.16 Selection of Diversion Flood
The Chi Square test confirms that distributions involving both observed and log-transformed
series fit well to the flood peak data. However, based on the skewed nature and kurtosis of
the data series, the Gumbel distribution has been adopted for selecting the diversion design
flood. The details of the return period flood for Monsoon and Non-Monsoon period has been
tabulated below.

Etalin Hydroelectric Project (3097 MW) Detailed Project Report
Volume-I: Main Report Part-A: Chapters 1 to 9
169126-40ER-0009-00 1-27
Table 18: Diversion Flood (m3/s) at Etalin dam sites
Return Period Years)
Flood (m3/s) at Dri Limb Flood (m3/s) at Talo (Tangon) Limb
Monsoon Non-Monsoon (Oct-Apr) Monsoon Non-Monsoon
(Oct-Apr) 2 3331 1647 2544 1258
5 4250 2486 3246 1899
10 4858 3042 3711 2323
20 5442 3575 4157 2730
25 5627 3744 4298 2860
50 6198 4264 4734 3257
100 6764 4781 5167 3652
In addition to the above mentioned two working periods, frequency analysis for different
working seasons have also been carried out and are presented in Figure 7-10 and
Figure 7-11 for both dam sites of Etalin HEP. The diversion floods for the present project at
Etalin can be used for planning of diversion works, depending on the period of construction.

Etalin Hydroelectric Project (3097 MW) Detailed Project Report
Volume-I: Main Report Part-A: Chapters 1 to 9
169126-40ER-0009-00 1-28
Return Period Floods for Different Working seasons-Dri Limb
0
1000
2000
3000
4000
5000
6000
7000
8000
Floo
d D
isch
arge
(m3 /s
)
2 Yr 3331 1647 1932 2035 2243 1558 1731 2192 1734 2461
5 Yr 4250 2486 3082 3407 3556 2421 2877 3537 2524 3774
10 Yr 4858 3042 3843 4314 4425 2992 3635 4428 3046 4643
20 Yr 5442 3575 4574 5185 5259 3541 4362 5282 3548 5477
25 Yr 5627 3744 4805 5462 5524 3714 4593 5552 3707 5742
50 Yr 6198 4264 5519 6313 6338 4250 5304 6387 4196 6557
100 Yr 6764 4781 6227 7158 7147 4782 6009 7215 4682 7366
12 months 7 months 7.5 months 8 months 8.5 months 6.5 months 7 months 8 months 6 months 7.5 months
FULL YEAR 1st Oct- 30 Apr 1st Oct- 15 May 1st Oct- 31 May 1st Oct- 15 June 16th Oct- 30 Apr 16th Oct- 15 May 16th Oct- 15 Jun 1st Nov - 30 Apr 1st Nov - 15 Jun
Figure 10: Return Period Flood for Different Working Seasons on Dri Limb

Etalin Hydroelectric Project (3097 MW) Detailed Project Report
Volume-I: Main Report Part-A: Chapters 1 to 9
169126-40ER-0009-00 1-29
Return Period Floods for Different Working seasons-Tangon Limb
0
1000
2000
3000
4000
5000
6000
Floo
d D
isch
arge
(m3 /s
)
2 Yr 2544 1258 1476 1555 1713 1190 1322 1675 1325 1880
5 Yr 3246 1899 2354 2602 2716 1849 2197 2702 1928 2883
10 Yr 3711 2323 2936 3296 3380 2286 2776 3382 2327 3547
20 Yr 4157 2730 3493 3961 4017 2704 3332 4034 2710 4184
25 Yr 4298 2860 3670 4172 4219 2837 3508 4241 2831 4386
50 Yr 4734 3257 4215 4822 4841 3246 4051 4879 3205 5008
100 Yr 5167 3652 4756 5467 5459 3653 4590 5511 3577 5626
12 months 7 months 7.5 months 8 months 8.5 months 6.5 months 7 months 8 months 6 months 7.5 months
FULL YEAR 1st Oct- 30 Apr 1st Oct- 15 May 1st Oct- 31 May 1st Oct- 15 June 16th Oct- 30 Apr 16th Oct- 15 May 16th Oct- 15 Jun 1st Nov - 30 Apr 1st Nov - 15 Jun
Figure 11: Return Period Flood for Different Working Seasons on Talo (Tangon) Limb
Talo (Tangon)

Etalin Hydroelectric Project (3097 MW) Detailed Project Report
Volume-I: Main Report Part-A: Chapters 1 to 9
169126-40ER-0009-00 1-30
1.5 Sedimentation
1.5.1 Need for Sediment Evaluation
Etalin Hydroelectric Project is located in the Himalayas where river gradients are steep and,
as a result, the rivers may have enormous capacity for sediment transportation.
Both the dams in the project will be high dams; however, the reservoir volumes will be quite
small due to the steepness of the slopes of the valley and river. It is anticipated to use the
reservoirs only for providing enough storage to allow daily peaking during the non-monsoon
season.
1.5.2 Reservoir Sediment Rate
Due to non-availability of site specific long-term data, total sediment rate of
0.075 ham/sq.km/year has been adopted based on the Preliminary Feasibility Report (PFR)
of the project. For Dibang multipurpose project which is downstream of the Etalin project, a
sediment rate of 0.1 ham/sq.km/year, i.e. 1mm/year, has been adopted and hence the same
has been proposed to be used for both the dam sites of Etalin.
1.5.3 Reservoir Elevation-Area-Capacity
The reservoir elevation-area-capacity curves for the project have been prepared from the
contour map of the reservoirs. The reservoir survey has been done in scale of 1:5000 with
5 m contour interval. The area enclosed within the contours has been evaluated using
AutoCAD. The volume between any two elevations is calculated using the cone formula:
2121*3
AAAAHV
Where
V =Volume between two contours
H =Contour interval
A1 =Area at level of first contour
A2 =Area at level of second contour
The resulting area capacity curve for Dri limb and Talo (Tangon) limb has been given in
subsequent figures.

Etalin Hydroelectric Project (3097 MW) Detailed Project Report
Volume-I: Main Report Part-A: Chapters 1 to 9
169126-40ER-0009-00 1-31
965
975
985
995
1005
1015
1025
1035
1045
1055
0 10 20 30 40 50 60 70 80 90 100Area (Ha)
Elev
atio
n (m
)036912151821242730
Capacity (MCM)
MDDL
Area Capacity
FRL
Figure 12: Elevation-Area-Capacity Curve of Dri Reservoir
1000
1005
1010
1015
1020
1025
1030
1035
1040
1045
1050
1055
1060
0 10 20 30 40 50 60Area (Ha)
Elev
atio
n (m
)
0369121518Capacity (MCM)
MDDL
FRL
CapacityArea
Figure 13: Elevation-Area-Capacity Curve of Talo (Tangon) Reservoir

Etalin Hydroelectric Project (3097 MW) Detailed Project Report
Volume-I: Main Report Part-A: Chapters 1 to 9
169126-40ER-0009-00 1-32
1.5.4 Sedimentation Aspects of Reservoirs
The total sediment inflow rate for the basin of Dri River is 3.685 MCM/year (Catchment
Area=3685 km2) and for Talo (Tangon) river is 2.573 MCM/year (Catchment Area = 2573
km2). The capacity-inflow ratio for the reservoirs on Dri River is 0.002 and on Talo (Tangon)
river is 0.0007. As per the codal provision of IS 12182:1987, the sedimentation problem is
usually said to be serious if the capacity-inflow ratio is more than 0.005. Hence, the
sedimentation problem at both Dri limb and Talo (Tangon) limb reservoirs is not serious.
The corresponding trap efficiency, as per Brune’s curve, is around 5% for Dri reservoir
whereas the trap efficiency for Talo (Tangon) reservoir is nil.
Assuming 20% of bed load which would be entirely trapped in the reservoir represents a
volume of (3.685-3.685/1.2) = 0.614 MCM/yr for Dri limb and a volume of (2.573-2.573/1.2) =
0.428 MCM/yr for Talo (Tangon) limb. Brune’s Curve showed a trap efficiency of 5% for the
suspended sediment which corresponds to a trap volume of (0.05*3.685/1.2) =
0.1535 MCM/yr for Dri limb reservoir whereas the trap volume for Talo (Tangon) limb
reservoir is nil. Thus, the total volume of trapped sediment in the reservoir of Dri limb is
0.614 + 0.1535 = 0.77 MCM/yr and for Talo (Tangon) limb is 0.428 MCM/yr.
1.5.5 Type and Shape of the Reservoirs
The reservoir operation is of type I, because the sediments are always submerged.
The reservoir shape is determined with the depth-capacity curve, based on the area-capacity
curve of the reservoir. Both the reservoir shape is of type II as per IS 5477 (Part 2): 1994.
The detail analysis of shape of reservoir has been given in Volume-II of DPR.
1.5.6 Sediment Accumulation
The average river bed level at Dri limb dam site is at El. 968m and under sluice type
spillways are proposed at El. 990 m which is about - 22 m above the river bed level.
The FRL and MDDL at dam site are at El. 1045 m and El. 1039 m, respectively.
The average river bed level at Talo (Tangon) limb dam site is at El. 1003 m and under sluice
type spillways are proposed at El. 1018 m which is about 15 m above the river bed level.
The FRL and MDDL at dam site are at El. 1050 m and El. 1040 m, respectively.
Since, both the dam is planned for enough storage to allow daily peaking during the
non-monsoon period, it is customary to determine the period at which the sediment

Etalin Hydroelectric Project (3097 MW) Detailed Project Report
Volume-I: Main Report Part-A: Chapters 1 to 9
169126-40ER-0009-00 1-33
accumulation would attain/reach the crest level. This is determined using empirical area
reduction method as described in IS: 5477 (part-II):1994 and the revised area capacity of
both the reservoirs are shown in the following tables.
Table 19: Revised Area Capacity of Dri Reservoir after Sediment Accumulation to Crest Level of El. 990 m
Elevation (m)
Original Area (Ha)
Original Capacity (MCM)
Revised Area (Ha)
Revised Capacity (MCM)
1045 83.320 21.97 83.32 15.74
1040 72.247 18.08 65.27 12.03
1039 69.953 17.42 62.49 11.39
1035 60.781 14.76 51.89 9.11
1030 53.805 11.90 43.75 6.72
1025 47.071 9.38 36.29 4.72
1020 39.069 7.23 27.86 3.12
1015 32.360 5.44 20.95 1.90
1010 23.688 4.05 12.29 1.08
1005 19.716 2.97 8.51 0.56
1000 15.914 2.08 5.09 0.22
995 12.543 1.37 2.29 0.04
990 9.487 0.82 0.00 0.00
985 6.229 0.43
980 4.326 0.17
975 1.409 0.03
970 0.041 0.0003
968 0.000 0.00
The time required to reach the crest level of El. 990m is 8.1 years (= [21.97-15.74]/0.77).

Etalin Hydroelectric Project (3097 MW) Detailed Project Report
Volume-I: Main Report Part-A: Chapters 1 to 9
169126-40ER-0009-00 1-34
Table 20: Revised Area Capacity of Talo (Tangon) Reservoir after Sediment Accumulation to Crest Level of El. 1018 m
Elevation (m)
Original Area (Ha)
Original Capacity (MCM)
Revised Area (Ha)
Revised Capacity (MCM)
1060 52.871 10.60 52.87 7.87
1055 44.721 8.17 40.08 5.55
1050 36.123 6.15 30.31 3.79
1045 28.857 4.53 22.42 2.48
1040 23.909 3.21 17.16 1.49
1035 18.525 2.15 11.72 0.77
1030 12.845 1.37 6.19 0.33
1025 9.621 0.81 3.31 0.09
1020 6.536 0.41 0.78 0.00
1018 5.466 0.29 0.00 0.00
1015 3.859 0.15
1010 1.353 0.03
1005 0.027 0.0002
1003 0.000 0.00
The time required to reach the crest level of El. 1018m is 5.5 years (= [6.15-3.79]/0.429).
Once, sediment deposition reaches the crest level, regular flushing of the reservoir is
foreseen to flush the sediments from the reservoir.
CEA/ CWC has already given the concurrence for the Design Flood & Sedimentation
Studies.
1.6 Glacial Lake Outburst Flood (GLOF)
The melt water released from glaciers is the main source of water for most Himalayan rivers.
The glaciers are vulnerable to climate changes and as the glaciers retreat due to global
warming, glacial lakes are formed behind at the exposed moraines. Several glacial lakes
have been reported to be formed in the past decades. The sudden break of a moraine
releases large volumes of water causing floods downstream. These floods are called Glacial
Lake Outburst Floods (GLOF).

Etalin Hydroelectric Project (3097 MW) Detailed Project Report
Volume-I: Main Report Part-A: Chapters 1 to 9
169126-40ER-0009-00 1-35
The tentative peak discharge estimated at the dam site on Dri limb is reported as
1170 cumec for an assumed condition that Lake Burst and 100 year flood (6764 cumec)
occur simultaneously. The time of travel of flood wave from lake to the dam site is
approximately 3.13 hours.
The tentative peak discharge estimated at the dam site on Talo (Tangon) limb is reported as
2143 cumecs for an assumed condition that lake burst and 100 year flood (5167 cumec)
occur simultaneously. The time of travel of flood wave from lake to the dam site is
approximately 1.75 hours. The details of GLOF study has been given in Volume-II (Hydrological Studies) of DPR. CEA/ CWC has already given the concurrence for GLOF
Studies and same has been used for planning purposes.
1.7 References
1) Bureau of Indian Standards, Indian Standard No. IS 11223-1985, “Guidelines for
Fixing Spillway Capacity”.
2) Bureau of Indian Standards, Indian Standard No. IS 14815-2000, “Design Flood for
River Diversion Works – Guidelines”.
3) Bureau of Indian Standards, Indian Standard No. IS 12182-1987, “Guidelines for
Determination of Effects of Sedimentation in Planning and Performance of
Reservoirs”.
4) Bureau of Indian Standards, Indian Standard No. IS 5477 (Part II)-1994, “Fixing the
Capacities of Reservoirs-Methods”.
5) Guide to Hydrological Practices, “WMO No-168”, 5th Edition, 1994.
6) Flood Estimation Report for North Brahmaputra Basin-Subzone 2(a), Hydrology
Directorate, CWC, New Delhi, 1991.
7) Manual on Estimation of Design Flood, CWC, New Delhi, March-2001.
8) Preliminary Feasibility Report, 4000 MW Etalin H.E. Project, April, 2004.


Etalin Hydroelectric Project (3097 MW) Detailed Project Report
Volume-I: Main Report Part-A: Chapters 1 to 9
169126-40ER-0009-00 i
TABLE OF CONTENTS PAGE NO.
6 PROJECT GEOLOGY .............................................................................................. 6-1
6.1 Introduction ...................................................................................................... 6-1
6.2 Geology of Project Area ................................................................................... 6-2
6.3 Field Investigations .......................................................................................... 6-2
6.3.1 Geological mapping.............................................................................. 6-3
6.3.2 Sub-surface Investigations ................................................................... 6-3
6.4 Geotechnical Appraisal of Project Components ............................................. 6-13
6.4.1 Dri Diversion site ................................................................................ 6-13
6.4.2 Headrace Tunnel (HRT) Dri Limb ....................................................... 6-17
6.4.3 Talo (Tangon) Diversion Site .............................................................. 6-18
6.4.4 Headrace Tunnel (HRT) Talo (Tangon) Limb ..................................... 6-25
6.4.5 Underground Powerhouse Complex ................................................... 6-26
6.5 Seismicity and Seismotectonics ..................................................................... 6-35
6.6 Conclusion ..................................................................................................... 6-36

Etalin Hydroelectric Project (3097 MW) Detailed Project Report
Volume-I: Main Report Part-A: Chapters 1 to 9
169126-40ER-0009-00 ii
LIST OF TABLES PAGE NO.
Table 6-1: List of Seismic Profiles at Etalin HEP ................................................................ 6-3
Table 6-2: Details of Exploratory Drill holes at Etalin HEP .................................................. 6-4
Table 6-3: Exploratory Drift details at Etalin HEP ............................................................... 6-9
Table 6-4: Laboratory Test Results .................................................................................. 6-12
Table 6-5: Insitu test results of the drifts ........................................................................... 6-13
Table 6-6: Average Orientation of Discontinuities at Dri Diversion Site ............................. 6-14
Table 6-7: Average orientation of discontinuities at Talo (Tangon) Diversion Site – Alternative-II .................................................................................................... 6-19
Table 6-8: Details of Discontinuity in the Desander Area – Talo (Tangon) Headworks ..... 6-23
Table 6-9: Average Orientation of Discontinuities Traversing the Rock Mass in Powerhouse Complex Area in order of Prominence ........................... 6-28
Table 6-10: Details of exploratory Drifts at powerhouse area ........................................... 6-28

Etalin Hydroelectric Project (3097 MW) Detailed Project Report
Volume-I: Main Report Part-A: Chapters 1 to 9
169126-40ER-0009-00 iii
LIST OF PLATES
Plate 6-1 Project Area - Geological Map
Plate 6-2 Dri Limb - Dam Site Geological Plan of
Plate 6-3 Dri Limb - Dri Dam Axis Geological Section
Plate 6-4 Talo (Tangon) Limb - Dam Site Geological Plan
Plate 6-5 Talo (Tangon) Limb - Talo (Tangon) Dam Axis Geological Section
Plate 6-6 Powerhouse Complex - Geological Plan of
Plate 6-7 Powerhouse Complex - Geological Section along Surge shaft, Pressure shaft, Powerhouse and TRT

Etalin Hydroelectric Project (3097 MW) Detailed Project Report
Volume-I: Main Report Part-A: Chapters 1 to 9
169126-40ER-0009-00 6-1
6 PROJECT GEOLOGY
6.1 Introduction
The proposed Etalin Hydroelectric Project is located in Dibang Valley district of
Arunachal Pradesh. To its west lies Upper Siang district and its southern boundary is shared
by Lower Dibang valley district. The Etalin Hydroelectric project envisages utilization of the
discharges of the rivers Dri and Talo (Tangon) to generate 3097 MW of power including 27
MW installed capacity contributed by two small hydro schemes at the toe of the Dams at Dri
river and Talo (Tangon) river. The project layout conceived by CEA during pre-feasibility
stage and subsequently reassessed by NHPC is more or less similar. The project envisaged
two separate diversion dams each on river Dri and Talo (Tangon) and a common
underground powerhouse at the confluence of Dri and Talo (Tangon) near Etalin village. The
layout has been studied further and the best suitable options for locating the project features
have been evolved.
Initially, two alternative sites were proposed for river diversion at Dri site. The Alternative-I
dam site is located near Eron village, about 1.5km downstream of the Ayo Pani nallah
confluence. Another Alternative-II dam site was proposed at about 250m downstream of
Alternative-I. Although the geological environs at both the alternative sites were almost
similar, but keeping in view the curvature in the course of river and grossly inadequate width
of the valley required to route 11811 cumecs of design flood at the diversion site
Alternative-I, it was felt that diversion site Alternative-II, where river flows along a straight
course through about 110m wide valley is adequate to route the design flood.
In case of Talo (Tangon) limb, the diversion site Alternative-I, identified by NHPC during PFR
stage, is located about 600m downstream of the Anon Pani nallah confluence. On the Talo
(Tangon) limb, the left bank at the selected dam axis did not appear very favorable due to
the existence of a large terrace. Upstream and downstream of this axis, the river flows along
the right bank in a width of 20m while shoal formation on the left bank extends up to 50m in
width at places and is covered by large boulders as big as 5 cubic meter in size. With the
riverbed elevation at this location being around El. 945m, the height of dam for an FRL of
El. 1050m would be around 110m above the existing riverbed level. Subsequent to
geological mapping and exploration at riverbed through two drill holes at Alternative-I site,
it was found that the thick terrace deposits extending upto a considerable height on the left
abutment and the thickness of overburden is more than 70m in the riverbed at this site.
Keeping in view the results of initial explorations and other aspects discussed above, It was

Etalin Hydroelectric Project (3097 MW) Detailed Project Report
Volume-I: Main Report Part-A: Chapters 1 to 9
169126-40ER-0009-00 6-2
decided not to pursue the site Alternative-I further and concentrate further explorations on
the identified Alternative-II site, located about 2.3 km upstream Based on the results of
subsequent detail investigations the Alternative-II site was found favourable for a concrete
dam which was finally adopted.
Finally, the project envisages construction of 101.5m and 80m high diversion dams across
rivers Dri and Talo (Tangon), respectively, and two separate water conductor systems
conveying the designed discharge to a common underground powerhouse located near the
confluence of both the rivers at Etalin.
6.2 Geology of Project Area
The area of the proposed project is located on the eastern limb of the Eastern Syntaxial
Bend (ESB) in eastern part of Arunachal Pradesh. The major rock units exposed in and
around the proposed project belong to Ithun Formation, Hunli Formation and Diorite –
Granodiorite – Granite Complex or Lohit Plutonic Complex and Mishmi Group. However,
rocks of Hunli Formation which are exposed on the southern side of Talo (Tangon) river are
not likely to be encountered in any of the project components. Ithun Formation comprises a
sequence of biotite gneiss with quartzite, amphibolite, calcareous quartzite, carbonate bands
and garnetiferous mica schist with kyanite and sillimanite. The Mishmi diorite - granodiorite –
granite complex, commonly known as the Lohit diorite - granodiorite – granite complex, is
characterized by a wide variation in rock types from diorite, granodiorite to granite, with
gradational contact between them.The diorite – granodiorite – granite complex in the area
has undergone polyphase deformation.
6.3 Field Investigations
After assessing and optimizing different alternative layouts suggested in PFR, preliminary
alternative layouts were identified for DPR stage and extensive surface and subsurface field
investigations were undertaken, since 2010, at different locations of both the limbs of
proposed project layout.
The investigations include detailed geological mapping of project components and reservoir
area, petrography of samples; exploratory drilling (46 no. of drill holes of cumulative length
2892.15m), exploratory drifting (7nos of cumulative length of 531m), geophysical exploration
(1342 m) and construction material survey .

Etalin Hydroelectric Project (3097 MW) Detailed Project Report
Volume-I: Main Report Part-A: Chapters 1 to 9
169126-40ER-0009-00 6-3
6.3.1 Geological mapping
Geological mapping on 1:1000 scale of the project area was carried out at Dri and Talo
(Tangon) dam, diversion tunnel, underground powerhouse sites. The HRT alignments and
reservoir area was covered on 1:10,000 and 1:5000 scale respectively. Efforts were made to
collect geotechnical parameters of each outcrop and interface of outcrops and overburden
delineated on the map as shown in Plate 6-1, 6-2, 6-4 and 6-6, in spite of constraints posed
by limited accessibility to the area and existence of dense forest.
6.3.2 Sub-surface Investigations
Geophysical Investigation
Geophysical investigation comprising seismic refraction profiling at the project area was
carried out by M/S Tojo Vikas International (Pvt.) Ltd during March - April, 2010. The seismic
refraction survey carried out in the area indicated that the P- wave velocity for compact
strata comprising of overburden or highly weathered rock varies from 2650 to 3370 m/s.
The detail report is appended in Volume-IIIC. The details of seismic refraction profile are
summarised in the Table 6-1 given below.
Table 6-1: List of Seismic Profiles at Etalin HEP
S.No. Site Seismic Line No.
Length (m)
1 Dri Diversion site DP-5 115
2 Dri Diversion site DP-6 115
3 Powerhouse Area EP-1 115
4 Powerhouse Area EP-2 445
5 Powerhouse Area EP-3 115
6 Powerhouse Area EP-4 115
7 Talo (Tangon) Diversion Site Alternative-1
TALO (TANGON)-
1 115
8 Talo (Tangon) Diversion Site Alternative-1
TALO (TANGON)-
2 115
9 Talo (Tangon) Diversion Site Alternative-1
TALO (TANGON)-
3 92
TOTAL 1342

Etalin Hydroelectric Project (3097 MW) Detailed Project Report
Volume-I: Main Report Part-A: Chapters 1 to 9
169126-40ER-0009-00 6-4
Exploratory Drilling
The summary of subsurface exploration carried out by exploratory drilling is given in the
Table 6-2.
Table 6-2: Details of Exploratory Drill holes at Etalin HEP
S. No. Drill hole No.
Location Collar Elevation
(m)
Total dept
h (m)
Depth of Overburden
& Bedrock
Elevation (m)
Dri Diversion Site
1 DH-D1 Riverbed; Dam Axis El. 972.030 93 17.7 & 956.39
2 DH-D2 Riverbed; Dam Axis El. 968.07 102 19.3 & 948.77
3 DH-D3A Left bank terrace; Dam
Axis
El. 970.17 102 10.5 & 959.67
4 DH-D4 Right bank; about 150m
D/S of Dri Dam Axis
El. 971.25 30 10.5 & 960.75
5 DH-D5 Left bank; about 150m
D/S Dri Dam Axis
El. 965.020 52.5 7 & 958.02
6 DH-D6 Riverbed; plunge pool
area
El. 962.79 46.5 7.22 & 955.57
7 DH-D9 Riverbed –upstream
cofferdam.
El. 976 48.5 15.5 & 961.85
8 DH-D10 Right bank –Diversion
tunnel Inlet area
El. 1000.28 29.3 12 & 988.28

Etalin Hydroelectric Project (3097 MW) Detailed Project Report
Volume-I: Main Report Part-A: Chapters 1 to 9
169126-40ER-0009-00 6-5
9 DH-D11 Riverbed – spillway area El. 969.715 36 18.76 &
950.955
10 DH-D12 Right bank - Diversion
tunnel outlet area
El. 1000 40.5 10.06 & 989.4
Talo (Tangon) Diversion Site Alternative-I
11 DH-T2 On left bank, Dam Axis El. 953.23 97.5 81 & 875.23
12 DH-T3 On left bank, Dam Axis Abandoned 21 Abandoned
13 DH-T4 On left bank, Dam Axis El. 957.159 102.5 61 & 896.159
Talo (Tangon) Diversion Site Alternative-II
14 DH-T5 On right abutment, Dam
Axis
El. 1050.35 60 18 & 1032.35
15 DH-T6 On right abutment, Dam
Axis
El.
1028.135
64.5 39.6 &
988.535
16 DH-T7 Riverbed on right side,
Dam Axis
El. 1003.15 80 26 & 977.2
17 DH-T8 Terrace on left side, Dam
Axis
El.
1006.741
19 5.30 &
1001.391
18 DH-T8A Riverbed on left side,
Dam Axis
El. 1006.43 100 13 & 993.423
19 DH-T9 Center of rive bed,
Upstream of Dam Axis
El. 1004.15 47 29 & 975.15

Etalin Hydroelectric Project (3097 MW) Detailed Project Report
Volume-I: Main Report Part-A: Chapters 1 to 9
169126-40ER-0009-00 6-6
20 DH-T10 Intake portal area El. 1032.02 60 40 & 992.02
21 DH-T11 Intake portal area El. 1080.23 40 18 & 1062.23
22 DH-T12 Left bank.Upstream of
Intake area
El. 1020.63 48.5 27 & 993.68
23 DH-T13 Riverbed, Upstream of
Intake area.
El. 1007.15 48 12 & 995.15
24 DH-T14 Left bank, Spillway area El.
1005.939
47.5 6 & 999.939
25 DH-T15 Riverbed, Spillway area El. 1000.35 47 33.5 & 966.85
26 DH-T16 Riverbed, Plunge pool
area
El. 1000.30 45 29 & 971.3
27 DH-T17 Left bank – diversion
tunnel outlet area
El. 1050.55 52.5 9.2 & 1041.35
28 DH-T18 Left bank – diversion
tunnel outlet area
El.
1019.714
26.5 7 & 1012.714
29 DH-T19 Left bank – diversion
tunnel inlet area
El.
1044.712
24.5 10 &
1034.712
30 DH-T20 Left bank – diversion
tunnel inlet area
El.
1021.138
35 22.1 &
999.038
31 DH-T21 Feeder tunnel crossing
with Kun nallah. Desilting
area
El.
1050.539
55 5 & 1045.644

Etalin Hydroelectric Project (3097 MW) Detailed Project Report
Volume-I: Main Report Part-A: Chapters 1 to 9
169126-40ER-0009-00 6-7
32 DH-T22 Feeder tunnel crossing
with Kun nallah, Desilting
area
El. 1075.50 70 11.5 &
1064.089
33 DH-T23 Feeder tunnel crossing
with Kun nallah, Desilting
area
El.
1085.954
60 3.5 &
1082.454
34 DH-T24 Right bank at about 100m
D/S of dam axis
El. 1040.16 43 26 & 1014.16
35 DH-T25 Desanding area El. 1095.20 140 9 & 1087.41
Dri Headrace Tunnel Area
36 DH-DHR1 HRT crossing with Kabo
Pani nallah – Old
alignment
El.
1257.346
65 21 &
1236.346
37 DH-DHR2 HRT crossing with Ru
Pani nallah at lower
elevation
El.
1100.975
93.5 42.5 &
1058.475
38 DH-DHR3 HRT crossing with
Chambo Pani nallah
El.
1100.541
100 0.0 &
1100.241
39 DH-DHR4 HRT crossing with Ru
Pani nallah.
El.
1115.068
142 15 & 1102.8
Talo (Tangon) Headrace Tunnel Area
40 DH-THR1 HRT crossing with Ron
Pani nallah
El. 1120m –
proposed
In progress

Etalin Hydroelectric Project (3097 MW) Detailed Project Report
Volume-I: Main Report Part-A: Chapters 1 to 9
169126-40ER-0009-00 6-8
41 DH-THR2 HRT crossing with Maru
Pani nallah
El. 1118.3 102 7.5 & 1110.80
42 DH-THR3 HRT crossing with Masa
Pani nallah
El. 1085m -
proposed
In progress
43 DH-T1 Adit T1 portal area In progress
44 DH-T2 Adit T2 portal area In progress
Surge Shaft and Penstock Area
45 DH-SS1 Surge Shaft area – Talo
(Tangon) limb
El. 1127.80 71 50.152 &
1077.68
46 DH-SS2 Surge Shaft area – Dri
limb
El.
1111.589
150 18 &
1093.589
47 DH-SS3 Surge Shaft area – Talo
(Tangon) limb
El.
1099.084
130.2 13.5 &
1086.34
48 DH-SS4 Surge Shaft area – Dri
side
El.
1126.298
40 4.5 & 1122.15
49 DH-PS1 Pressure Shaft area – Dri
limb
El. 978.407 45 4 & 974.407
50 DH-PS2 Pressure Shaft area –
Talo (Tangon) limb
El.
1109.371
90 59 &
1050.371
51 DH-PS3 Pressure Shaft area – Dri
limb
El.
1022.290
25 0.5 &1021.79
Powerhouse and TRT Area

Etalin Hydroelectric Project (3097 MW) Detailed Project Report
Volume-I: Main Report Part-A: Chapters 1 to 9
169126-40ER-0009-00 6-9
52 DH-TR2 TRT area El. 677.96 72.1 6 & 671.96
53 DH-AD1 Adit portal El. 857.256 25 11 & 846.256
54 DH-AD2 Adit portal El. 783.879 46.5 36.5 &
747.379
55 DH-MD1 MAT portal AREA – Dri
side
In progress
56 DH-MT1 MAT portal area – Talo
(Tangon) side
In progress
The drill hole log sheets appended in Volume-IIIC of the DPR.
Exploratory Drift
The following exploratory drifts were undertaken to study the nature of insitu rock mass at
major project component sites.The details are given below in Table 6-3.
Table 6-3: Exploratory Drift details at Etalin HEP
S. No. Drift No.
Location Elevation (m)
Total Length (m)
Dri Dam Site
1 DR -
D1
Left abutment of Dri
Dam axis
1030 40.5m (proposed 10m cross cut
upstream and downstream at RD
40.5m)
2 DR –
D2
Left abutment of Dri
Dam axis
1000 30m (proposed 10m cross cut
upstream and downstream at RD
30m)

Etalin Hydroelectric Project (3097 MW) Detailed Project Report
Volume-I: Main Report Part-A: Chapters 1 to 9
169126-40ER-0009-00 6-10
3 DR –
D3
Right abutment of Dri
Dam axis
1000 In progress (38m as on
02.07.2012) (proposed 10m
cross cut upstream and
downstream at RD 40m)
4 DR –
D4
Right abutment of Dri
Dam axis
1030 In progress(15m as on
02.07.2012) (proposed 10m
cross cut upstream and
downstream at RD 40m)
Talo (Tangon) Dam Site
5 DR -
T1
Right abutment of
Talo (Tangon) Dam
axis
1035 46m (proposed 10m cross cut
upstream and downstream at RD
46m)
6 DR –
T2
Left abutment of Talo
(Tangon) Dam axis
1033 40m (proposed 10m cross cut
upstream and downstream at RD
40m)
7 DR-T3 Desilting chamber 1023 In progress (130m as on
09.04.2013)
Surge Shaft area
8 DR -
SS1
Surge Shaft – Bottom
Drift
964 286m as on 09.04.2013
Powerhouse Area
9 DR –
EP1
Powerhouse
Chamber
628 In progress (436m as on
09.04.2013)
The 3D Geological logs of drifts are appended in Volume-IIIC of the DPR.

Etalin Hydroelectric Project (3097 MW) Detailed Project Report
Volume-I: Main Report Part-A: Chapters 1 to 9
169126-40ER-0009-00 6-11
Rock Mechanics Testing
Insitu and Laboratory rock mechanics tests were conducted in exploratory drifts and on core
samples of drill holes to determine physico mechanical properties of rock mass and intact
rock.The testing was carried by DBM, Mumbai.
The results of these tests are summarised in the Table 6-4 and 6-5 as given below.

Etalin Hydroelectric Project (3097 MW) Detailed Project Report
Volume-I: Main Report Part-A: Chapters 1 to 9
169126-40ER-0009-00 6-12
Table 6-4: Laboratory Test Results
Physical / Mechanical tests
DRI TALO (TANGON) POWERHOUSE
Granodioritic Gneiss
Hornblende Granodioritic
Gneiss Granodioritic
Gneiss Calcareous Quartzite
Micaceous Pegmatite
Granodioritic Gneiss Pegmatite Amphibolites Biotite
Gneiss Calcareous Quartzite
Dry Density gm/cm3 2.72 - 2.88 2.89 2.58 - 2.91 2.72 - 2.78 2.65 2.65 - 2.87 2.66 - 2.75 2.97 2.91 - 2.97 2.62
Bulk Density gm/cm3 2.72 - 2.89 2.9 2.59 - 2.91 2.72 - 2.78 2.66 2.66 - 2.86 2.66 - 2.75 2.9 – 2.97 2.91 - 2.98 2.62
Specific Gravity 2.71 - 2.98 - 2.78 - 2.93 2.78 - 2.86 2.77 2.71 - 2.93 2.74 - 2.8 2.93 – 2.97 2.96 - 2.99 2.69
Void Index % 0.03 0.01 0.08 0.02 - 0.03 0.04 0.01 - 0.04 0.02 - 0.03 - 0.01 - 0.02 0.03
Slake Durability Index % 97 - 98 - 95 - 98 98 98 95 - 99 96 – 98 98 98 - 99 98
Porosity % 0.29 - 0.38 0.24 0.3 - 0.65 0.04 - 0.17 0.34 0.25 - 0.78 0.1 - 0.39 0.05 – 0.43 0.06 - 0.77 0.23
Water Absorption % 0.11 - 0.13 0.08 0.05 - 0.22 0.02 - 0.06 0.13 0.09 - 0.28 0.04 - 0.14 0.02 – 0.15 0.02 - 0.26 0.09
UCS (kg / cm2) 232 - 587 240 - 300 188 - 562 177 - 498 262 279 - 1043 747 – 797 742 712 - 1239 -
Point load Index (kg/cm2) 30.21 - 47.78 - 3.67 - 50.97 19.49 -
59.13 37.01 35.15 - 81.07 26.29 - - 77.33
Tensile Strength (kg/cm2) 1.01 - 1.05 1.05 0.6 - 1.11 1.45 - 2.07 0.92 0.94 - 1.85 - - 1.02 -
Modulus of Elasticity (kg/cm2)
2.07x10⁵ - 5.79x10⁵ - 1.96x10⁵ - 4.27 x 10⁵ 4.50 x 10⁵ - 2.59x10⁵ - 6.40 x 10⁵ 2.59 x 10⁵ 5.17 x 10⁵
2.40 x 10⁵ 3.12 x 10⁵
Poisson's ratio 0.12 - 0.16 - 0.13 - 0.14 0.13 - 0.11 - 0.15 0.11 0.12 0.13 0.14
Triaxial Compression Test - 'C' kg/cm2
74.99 - 113.41 53.35 - 70.91 - 78.67 - 119.92 152 148.294 - 158 152 -
- ф Degree 24.11 - 45.87 24.22 - 50.96 - 31.33 - 33.32 37 30.2 - 34.6 - -

Etalin Hydroelectric Project (3097 MW) Detailed Project Report
Volume-I: Main Report Part-A: Chapters 1 to 9
169126-40ER-0009-00 6-13
The results of laborataoy test is appended in Vollume-IIID.
Table 6-5: Insitu test results of the drifts
Location Test Ed (Gpa) Ea (Gpa) Test C (Mpa) ф (Degree)
Peak Residual Peak Residual
Dri Dam DR-D2
Plate Load Test
2.23 - 3.64 3.05 - 5.79 Shear
Parameters Rock to Rock
0.44 0.16 46º 42o
Plate Jacking
Test 6.7 - 9.75 -
Shear Parameters Concrete to
Rock
0.41 0.15 44º 41o
Talo (Tangon) DR-T2
Plate Load Test
3.00 - 3.25 4.73 - 8.22 Shear
Parameters Rock to Rock
0.41 0.28 40º 38o
Plate Jacking
Test 4.5 - 5.0 -
Shear Parameters Concrete to
Rock
0.43 0.4 39.5º 35o
The detailed report appended in Volme-IIID of the DPR.
Petrography studies of about 26 rock samples were carried out by DBM, Mumbai and AECS
Noida. For this purpose the rock samples were collected from the drill cores, drifts, shoal
deposits and rock exposures in an around project area. The reports are appened in
Volume-IIID and Volume-VIII of the DPR.
Water Pressure Tests (WPT)
The water pressure tests were conducted in all the drill holes using double packer method in
assending order at 3m interval. All the data pertaining to respective drill holes are appended
in geological logs in Vol IIIC of the DPR. In general, the permeability of the bed rock is very
low and recorded up to 2 lugeons. Whereas in the case of closely jointed and fractured rock
mass higher values up to 41 lugeons are observed. The drilling for groutability tests in river
bed of both the dams are in progress the results will be appended in due course.
6.4 Geotechnical Appraisal of Project Components
6.4.1 Dri Diversion site
Two alternative axes at about 250m distance on Dri river have been considered for
identifying suitable location of Dri diversion site. Topography around the area and
preliminary over all assessment at Alternative-I site does not favour for placement of dam

Etalin Hydroelectric Project (3097 MW) Detailed Project Report
Volume-I: Main Report Part-A: Chapters 1 to 9
169126-40ER-0009-00 6-14
axis at this site as Dri river flows in meandering course through narrow to wide V-shaped
valley with westerly curvature and convexity towards left bank. Moreover, left bank of river
bank is covered with shoal deposit consisting of large size boulders (up to 3m diameter)
mixed with sand deposits. The Alternative-II site, located 250m down stream, was preferred
based on the topography and preliminary over all assessment.
The bedrock exposed at the site comprises granodiorite/ diorite gneiss, belonging to Mishmi
diorite-granodiorite-granite complex also known as Lohit plutonic Complex. Few exposures
of quartzites have also been mapped in the area along the road sections. Pegmatite veins
ranging in thickness from less than 1m to as much as 5m have been observed at road level
traversing the granodiorite-diorite-gneissic complex. They are mostly emplaced along the
foliation. The general strike of foliation on both the banks is almost N-S, which is across the
flow direction of the river Dri.
The rock discontinuity data, collected during the course of detailed geological mapping
(Plate 6-2) from rock outcrops on both banks of the river and exploratory drifts at the
diversion site has been analyzed with the help of “DIPS” software. The stereographic
projection based on the rock outcrop and exploratory difts data have been used to decipher
different sets of discontinuities as given in Table 6-6.
Table 6-6: Average Orientation of Discontinuities at Dri Diversion Site
Corrected Set No. Aver. Dip Amount Aver. Dip Direction
S2 64º 177º
S3 42º 352º
S4 86º 091º
S5 22º 302º
S1 78º 247º *S1 – Foliation indistinctly scattered developed, and at places gentle dips along it have been observed
It is observed from the analysis of discontinuity data that the granodiorite/diorite gneiss rock
mass is traversed by five prominent joint sets. Among the five joint sets, the joint set S1, S2
and S4 dip into the hill and the other two joint sets S3 and S5 dip valley ward in case of left
bank. In case of right bank the disposition of joint sets with respect to the valley will be just
reverse. While joint set S2 is found most vulnerable for right bank, the joint set S3 is
observed to be most vulnerable for left bank. Inter-section of valley-ward dipping joints may

Etalin Hydroelectric Project (3097 MW) Detailed Project Report
Volume-I: Main Report Part-A: Chapters 1 to 9
169126-40ER-0009-00 6-15
lead to formation of unstable planes and wedges during excavation on abutments. All these
aspects have been considered while planning the excavation on both the abutments.
Dam
The river bed is occupied by river borne material (RBM) consisting of boulders, cobbles,
pebbles of granodiorite, amphibolites, quartzite, granodioritic gneiss etc. embedded in sandy
matrix. The depth of overburden in the river section proved by exploratory drilling varies from
10.5m to 19.5m corresponding to EL 959.67m to 948.5m respectively. In order to found dam,
removal of about 19.5m thick RBM followed by about 2.5m weathered rock mass would be
required to achieve acceptable foundation grade at deepest foundation of the Dam. The bed
rock is expected to be reasonably fresh and strong in the riverbed portion and on the
adjoining banks. Provision of dental treatment has been kept where ever shear zone /weak
zones are encountered at foundation grade. In view of Lugeon values, drill core data and
blocky nature of rock mass, consolidation grounting and curtain grouting in dam foundation
will be provided up to a suitable depth for making the foundation monolithic. The geological
section along the dam axis is given in Plate 6-3.
The proposed concrete dam will be founded on strong, jointed, fresh granodioritic gneiss
rock mass. The bedrock exposed on both the banks is strong and generally fresh, however,
degree of weathering increases towards the valley side. Considerable stripping limit (10 to
12m) has been assessed on either bank and accordingly, excavation is required to be
planned to achieve the acceptable foundation grade. Minor rock excavation may be required
for accommodating the spillway for which excavated slopes need to be adequately protected
for proper restoration of stability.
Intake Site
The long axis of the intake structure is aligned suitably as per the requirement of hydraulics
and sediment management. However, in this area, the foundation for intake will have to be
raised from elevation of around El 995m to keep its alignment in line with spillway
arrangement to provide better sediment management and thus structure would have to be
founded on about 26m high concrete pedestal. The bedrock comprising slightly weathered,
jointed and medium strong to strong granodioritic/ dioritic gneiss is exposed at the site.
The rock mass is traversed by five sets of prominent joints including foliation joints. It is
observed that the joint sets S1, S2, and S4 dip into the hill and joint sets S3 and S5 dip
towards valley. Provision of rockbolts has been kept to stabilize the valley dipping joints sets.

Etalin Hydroelectric Project (3097 MW) Detailed Project Report
Volume-I: Main Report Part-A: Chapters 1 to 9
169126-40ER-0009-00 6-16
Cofferdams
A 20m high coffer dam from river bed has been proposed at about 57m upstream of dam
axis, to facilitate the river diversion. This structure is concrete-faced with plum concrete core.
Since the river borne deposits in the river bed are expected to be thick and highly
permeable, grouting as cut-off is proposed to minimize the seepage through the foundation
and jet grouting will be resorted in the foundation to bring its permeability to acceptable limit.
The depth of riverinne material at coffer dam is considered as per the exploration data at
dam axis. However a drill hole DH-D9 would be taken up shortly with the objective of
establishing the actual thickness of overburden (RBM) in the river bed.
The down stream coffer dam is proposed to be a random fill dam. Adequate pumping
arrangement may be kept to control the seapage from downstream side.
Diversion Tunnels
In order to divert river water during project construction, four circular shaped diversion tunnel
of 10.9m finished diameter is proposed out of which three are located on right bank and one
is located on left bank. The invert level of inlet structure is at El 975m, where as the outlet
level is EL 964m. Adequate rock cover varing between 40 and 90m is available above the
diversion tunnels along with sufficient lateral cover. The bed rocks anticipated to be
negotiated during tunneling are granodiorite /diorite gneiss with intrusions of pegmatite veins
at the places. Warping and folding on local scale have also been observed in outcrops.
Due to intersection of joint sets, unstable wedge on the roof of tunnels are anticipated and
accodingly suitable design measures are recommended. Based on the surface rock
exposures and exploratory drift data, the anticipated rock mass along the diversion tunnels
are categorized as about 25% of Class II (Good rock), 50% of Class III (Fair rock), 15% of
Class IV (Poor rock) and 10% of Class V (Very Poor rock).
Reservoir and rim study
The construction of 101.5m high concrete gravity dam across river Dri will develop 4.00km
long reservoir with FRL 1045m covering 83.32 hectare area. The geological mapping on
1 : 5000 scale was carried out for assessment of reservoir rim stability and possibility of
leakage of water from this reservoir to near by area. About 1.3km upstream of dam site,
major tributary known as Captain nalah joins the Dri river on left bank. It is very deep nallah
and has deposited a large fan deposit at its mouth near confluence with Dri river. Slopes are
covered with slope wash material and limited rock outcrop of granodiorite /dioritie gneiss and

Etalin Hydroelectric Project (3097 MW) Detailed Project Report
Volume-I: Main Report Part-A: Chapters 1 to 9
169126-40ER-0009-00 6-17
quartzite are exposed. In general slopes along the reservoir rim are moderate with
occasional steep rocky outcrops with a thin veneer of overburden cover.
Few landslides, observed along the Etalin-Anini road section at high above the reservoir rim,
have been mapped on 1:5000 scale. Among them, a very prominent landslide is observed
on the left bank of Captain/Ayopani nallah, with its crest at about El 1215m and the bottom at
El 1100m, which is about 55m above the reservoir rim. The width is about 80m on the road
cut and width reduces to 20m at the top. This is an active landslide and the materials
triggered in this slide are angular and sub-angular rock fragments of granodioritic gneiss,
micaceous schist with silty and clayey matrix. Similarly, just opposite to this landslide on the
right bank of Captain/Ayopani nallah, a comparatively small slide is mapped, which is more
or less similar in nature. Few more small slides are observed in the area but their location is
above the road and has almost no impact on the reservoir rim.
The ground above the reservoir rim is continuously rising and the river valley within the
submergence is water-tight and no pervious and cavernous rock formations are observed.
Therefore apprehension of leakage through reservoir to adjacent area is almost negligible.
6.4.2 Headrace Tunnel (HRT) Dri Limb
A 11.3m finished diameter and 10722m long circular shaped headrace tunnel (HRT) has
been proposed on left bank of river Dri, with a view to convey 480.3 cumecs of design
discharge from diversion site to the underground powerhouse.
The headrace tunnel, immediately downstream of the intake tunnels, for a length of about
400m, is aligned in N162º - N342º direction. Thereafter, the HRT is aligned in N062º - N242º
direction up to RD 2550m. Further downstream, between RD 2550m and 5700m, it is
aligned in N149º - N329º directions. The HRT, downstream of RD 5700m, follows
N194º - N014º direction up to RD 8100m where it again turns towards N175º and follows
N355º -N175º direction until it joins surge shaft at RD 10750m.
The proposed HRT at Dri limb is expected to encounter rock mass comprising granodioritic
gneiss and biotite gneiss in most of its lengths. However, a considerable stretch from
RD1400m to RD 2480m is expected to encounter rock mass with thick calcareous
quartzite/marble bands. Thickness of individual calcareous quartzite/marble bands may be
about 230m. The proposed HRT is expected to encounter a thick zone comprising
multiple/closely spaced shear seams within gneisses between RD 7200m and RD 7450m.
In addition to above, few more such shear seams and weak rock mass zones are expected

Etalin Hydroelectric Project (3097 MW) Detailed Project Report
Volume-I: Main Report Part-A: Chapters 1 to 9
169126-40ER-0009-00 6-18
to be encountered below nalah crossings. Bed rock is traversed by four sets of rock
discontinuities, in general. Developement of unstable wedges are expected mainly on roof
and left wall of the Headrace tunnel.
Drill hole DH-DHR1, DH-DHR2, DH-DHR3 and DH-DHR4 drilled along HRT alignment at its
intersection with major cross-drainages have indicated presence of bed rock at tunnel grade
along the proposed tunnel alignment and thickness of rock cover has been inferred as 70 to
200m.
Because of heavy precipitation, experienced in the area and presence of jointed rock mass
at the crossings of the major drainage, moist to heavy dripping water condition in genral
along with isolated pocket of water charged zones, may be encountered during tunneling.
About 10% of total length of tunnel has more than 500m superincumbent cover. Stress
related problems may encounter in such high cover reaches of HRT. A tentative estimate of
rock mass rating indicates that RMR values will mainly vary between 38 and 78 along HRT.
However, RMR values between 15 and 25 are expected in rock mass below major nallah
crossing and also in shear seams pegmatite zones and high cover reaches. Tentative rock
mass classes expected along the HRT are Class II, Class III, Class IV and Class V 25%,
47%, 20% and 8% repectively.
To fecilitate the excavation of 10722m long HRT, three intermediate construction adits at
Kabo pani, Rupani and Chabo pani nala of 301m, 740m and 355m length, joining at HRT at
RD 3045m, 5484m and 8322m repectively have been proposed. A fourth adit of length 267m
is at surge shaft. Although the proposed portals, more or less, are located suitably in bed
rock, yet considerable support measures are required to stabilize the portal slopes. All these
adits are having suffient cover and tunnel alignments are fair to favorable with respect to the
prominent discontinuity planes. All the proposed adits expected to encounter mainly good to
fair rock mass with RMR variying from 40 to78.
6.4.3 Talo (Tangon) Diversion Site
The investigations of Dam site on river Talo (Tangon) were taken up at two alternative dam
sites vide Alternative-I, located 600m downstream from the confluence of Annon pani and
Talo (Tangon) river, and Alternative-II, located 2.3km upstream of the Alternative-I. The
Alternative-I Site is charaterized by the presence of river terrace material on left bank and
limited granodiorite/diorite gneiss rock outcrop along the valley. Further the slopes are
moderate and covered with thin veneer of slope wash material. The subsurface investigation

Etalin Hydroelectric Project (3097 MW) Detailed Project Report
Volume-I: Main Report Part-A: Chapters 1 to 9
169126-40ER-0009-00 6-19
comprising three seismic profiling, two drill holes DH-T2 and DH-T4 (Vol IIIC) on left bank
terrace were carried out. The bed rock comprising gradioritic/diorite gneiss encountered at
81m (EL 875.23m) and 61m (EL 896.159m) depths repectively. This site was not found
suitable due to existence of thick overburden (RBM) on left bank terrace and very deep
overburden in river bed at Dam site. Consequent upon the above findings, the Alternative-I
site was abandoned and investigations at Alternative-II site were taken up. At this
Alternative-II site, Talo (Tangon) river flows in NNE - SSW directions with gentle gradient
and a more or less straight course for a considerable length through narrow valley and
moderate to steep abutments.
This area is occupied by slightly weathered granodioritic /dioritic gneiss, biotite gneiss and
quartzite which grade into calcareous quartzite and impure marble. All the rock mass
exposed in this area is characterized by profuse emplacement of pegmatite and silica veins.
The rock mass on both the abutments is prominently foliated, jointed with occasional
sheared and fractured zones. The river bed is covered by fluvial deposits (RBM) comprising
boulders cobbles and pebbles with sand matrix. The right bank is occupied by limited rock
outcrops of granodiorite/diorite gneiss and beyond this, the slope is covered by a thin veneer
of slope wash material.
Bed rock is traversed by four prominent sets of rock discontinuities at this site. The rock
discontinuity data collected during the course of surface mapping (Plate 6-4) and exploratory
drift mapping have been analysed using DIPS software. The details of Joints are
summarised as below in Table 6-7.
Table 6-7: Average orientation of discontinuities at Talo (Tangon) Diversion Site – Alternative-II
Set Aver. Strike Aver. Dip Amount
Aver. Dip Direction
Continuity (m)
Spacing (cm)
Aperture (mm) Roughness
S1 082º-262º 84º 352º >20 6-20 Tight to 0.5 RU**
S2 000º-180º 76º 090º >20 20 - 60 0.25 to 0.5 RU**
S3 052º-232º 36º 142º 10 - 20 >200 0.25 to 0.5 RU**
S4 000º-184º 25º 274º 03 - 10 >200 Tight SP*
*Smooth Planar ** Rough Undulatory
It is observed that joints belonging to sets S1 and S4 dipping at high and low angle towards
valley on the left bank. Similarly, other joints S2 and S3 dipping at steep to moderate angle

Etalin Hydroelectric Project (3097 MW) Detailed Project Report
Volume-I: Main Report Part-A: Chapters 1 to 9
169126-40ER-0009-00 6-20
towards valley on the right bank. The joint set dipping towards valley would need attention
while stripping the abutments in relation to possible unstable planes and wedges.
Dam
The proposed dam site on Talo (Tangon) River is characterized by presence of bed rock
exposures on both banks. While the left bank is occupied by bed rock exposures all along
the abutment, isolated bed rock outcrops are observed on the right bank at the site. The river
bed is occuipied by riverine material (RBM) consisting of boulders, cobbles and pebbles of
various rock type within sandy matrix which extends up to about 29m depth, as revealed
from drill hole DH-T9. In view of rock outcrops on both the banks, depth of overburden in
river bed and topography of this site, this site appears to be suitable for concrete gravity dam
with deepest foundation level at El. 972m, top of dam at El. 1052m and spillway located
within dam body. Based on the detailed study of rock mass characteristics on both banks
and exploratory drifts data, 10-12m stripping limit is recommended on abutments. Suitable
slope stability measures would be provided during the abutment excavation to avoid slope
instability due to the presence of vulnerable valley dipping joints. Water pressure test
conducted in drill holes indicates lugeon values of low order and in genral varies from 0.5 to
3.1. In few cases, where fracture zones are encountered, lugeon value has gone up to about
40 lugeon. The bed rock underneath the river bed is fresh and strong. The shear
seams/fractured rock mass or weak zones are anticipated at or near the contact between
calcareous quartzite and granodiorite/diorite gneiss mainly. Dental treatment would be
required along weak zones depending upon their extent and orientation. Provisions of
consolidation grouting and curtain grouting have been kept for making foundation monolithic
and impervious. Geological section along the proposed dam axis is given in Plate 6-5.
Diversion Tunnels
In order to divert river water for the construction of concrete dam, three 11.5m finished
diameters, circular shaped diversion tunnels ranging in length from 368m to 631m, are
proposed on the left bank at this site. The diversion tunnels are aligned in such a way that
sufficient lateral and superincumbent rock cover is available. The tunnels, in genral, are
anticipated to negotiate foliated and jointed granodiorite gneiss, calcareous quartzite and
biotite gneiss, with occasional shear seams and pegmatite veins. Inlet portal of the tunnels
are suitably located on bed rock. Outlet portals, although located on overburden, are
expected to encounter bed rock at depth of less than 20m and these tunnels at the outlet
portion will be designed as structural tunnels till adequate rock cover is available.
The alignment of the diversion tunnels are fair to favorable with repect to the strike of

Etalin Hydroelectric Project (3097 MW) Detailed Project Report
Volume-I: Main Report Part-A: Chapters 1 to 9
169126-40ER-0009-00 6-21
prominent rock discontinuities. Formation of unstable wedges is expected on the right wall
and roof of the tunnels. The proposed diversion tunnels are expected to encounter rock
mass of class II, III, IV and V for about 25%, 40%, 25% and 10% of their lengths,
respectively.
Cofferdams
The 22.5m high coffer dam having top elevation at El. 1028.5m and of plum concrete with a
upstream concrete face has been proposed at upstream of main dam. The left bank slope is
occupied by granodiorite rock with pegmatites and the right bank is occupied by huge shoal
deposit in the form of river borne material. This site has been explored by three dirll holes
DH T-10, DH T12 and DH T13. The depth of overburden is ranging from 12m to 40m. The
coffer dam is to be founded on riverine material which is highly permeable in nature. In order
to minimize the ingress of water, provision of cut-off extending to bed rock has been
proposed.
A 9m high embankment type down stream coffer dam is proposed about 200m down stream
of the main dam. A 28.9m (EL971.4m) deep riverine material has been encountered in drill
hole DH-T16 at this site. It is advisable to keep adequate pumping arrangement so that
seapage does not affect the working environment.
Intake Structure and Feeder Tunnels
Three intake structures are envisaged, about 20m upstream of the dam axis on the right
bank of river Talo (Tangon), to convey design discharge of 320.2 cumecs to HRT with invert
at El 1028m. Proposed intakes are followed by three feeder tunnels up to the underground
desilting chambers. The feeder tunnels are aligned in N111º - 291º direction in the initial
reaches. Thereafter, the tunnels turn towards N040º - 220º through a broad curve to join
desanding chambers
Thick fluvial deposits (river terraces) extend up to about 45m above the riverbed i.e., upto
El 1050m at the proposed Intake site. Isolated rock exposurs between EL 1070m and 1085m
are found in the area. The remaining portion of the hill slope above is covered with slope
wash material. The bedrock is traversed by four major joint sets including foliation joints.
This area has been investigated by three drill holes, DH-T10, DH-T11 and DH-T12 and the
bedrock levels were encountered at El. 992.02m, El 1062.23m and El 993.68m, respectively.

Etalin Hydroelectric Project (3097 MW) Detailed Project Report
Volume-I: Main Report Part-A: Chapters 1 to 9
169126-40ER-0009-00 6-22
The area is covered by fluvial deposits (RMB) comprising rounded to sub-rounded boulders,
cobbles and pebbles embedded in fine riverine sand. In order to locate the portals of intake
tunnels in the bedrock, an excavation for about 25m in the overburden would be required.
Shallow slope wash material along the gentle hill slope exists which may not cause major
slope stability problem. Suitable support arrangement has been kept to place the portals of
intake tunnels in view of the steeply inclined valley dipping joints.
Considering increasing thickness of the overburden towards the river, hydraulic and silt
management, and crest elevation of intake it was decided to keep the intake structure on a
concrete pedestal raised from about El 995m, where bedrock is expected to be available.
All the three feeder tunnels will be driven through granodioritic gneiss, biotite gneiss and
calcareous quartzite that grades to impure marble along their lengths up to the location of
desanding chambers. Granodioritic gneiss and quartzite, which is of calcareous nature, are
the predominent litho-units which are likely to be encountered along these tunnels.
Minor shear seams and pegmatite veins are also expected at few locations along the tunnel
alignments.
These feeder tunnels will cross below a surface drainage, namely Kun nallah. Three drill
holes DH-T21, DH-T22 and DH-T23, have been drilled in the Kun nallah with a view to
delineate the thickness of the overburden in the nallah section and assess the adequacy of
the rock cover. The rock covers above feeder tunnels are ranging from 35m to 65m. Based
on the data obtained from surface mapping and subsurface explorations carried out at site,
rock mass likely to be met along feeder tunnels are 25% of Class-II, 40% of Class-III, 25% of
Calss-IV and 10 % of Calss-V.
Desanding Arrangement
An underground desanding arrangement has been proposed on the right bank of Talo
(Tangon), beyond Kun nallah. Three numbers of desanding chambers each having size of
18.5m (W) x 26.5m (H) x 350m (L) have been propose. The silt flushing arrangement back to
river Talo (Tangon) will be through 5m (W) x 5.7m (H) x 515m (L) flushing tunnel at outlet
level El. 999.55m. The desanding chambers are aligned in N0400-N2200 direction with cover
varying from 80 to 270m above which is considered sufficient.
The area around the site proposed for the desanding arrangement is, in general, covered by
slope wash deposits consisting of fragments of granodiorite, quartzite and biotite gneiss in
sandy and silty matrix. Isolated rock outcrops comprising granodiorite gneiss with

Etalin Hydroelectric Project (3097 MW) Detailed Project Report
Volume-I: Main Report Part-A: Chapters 1 to 9
169126-40ER-0009-00 6-23
intercalated biotite gneiss and quartzite of calcareous nature which grades into impure
marble at places, is observed in the vicinity of Kun nallah. Pegmatite veins impregnating
extensively all the litho-units have been observed in the area. Rock mass is traversed by
three prominent joint sets in addition to foliation joints. The discontinuity data collected
during the course of geological mapping has been analysed using DIPS software, results of
which are given in Table 6-8.
Table 6-8: Details of Discontinuity in the Desander Area – Talo (Tangon) Headworks
Set Strike Average Strike
Aver. Dip Amount
Aver. Dip Direction
Continuity (m)
Spacing (cm)
Aperture (mm)
Rough-ness
S1 075º- 098º 089 º 88º 179º >20 6-20 Tight to 0.5 RU**
S2 037º- 065º 052º 70º 142º >20 20 - 60 0.25 to 0.5 RU**
S3 172º- 187º 180º 86º 270º 10 - 20 >200 0.25 to 0.5 RU**
S4 220º- 311º 271º 09º 001º 03 - 10 >200 Tight SP*
*Smooth Planar ** Rough Undulatory
This area has been explored through three drill holes, DH-T21, DH-T22 and DH-T23, and
exploratory drift DR-T3 (16m length) of which logs is appended in Volume-IIIC. Further the
drift excavation is under progress. The bedrock comprising granodiorite gneiss, biotite
gneiss, and quartzite intruded by pegmatites has been encountered at depth varying
between 3.5m and 11.5m, as revealed from drill hole logs.
Relationship of long axis of underground desilting chambers with strike of major rock
discontinuities indicates that it is fairly to favourably aligned with respect to the average
strike of joints belonging to sets S1, S3 and S4 is concerned, and the situation is adverse as
far as average strike of the joints belonging to set S2 is concerned.
Keeping in view the size of the underground desilting chambers and pattern of the rock
discontinuities, wedge analysis has been carried out. The results of the analysis for the most
adverse case indicate that altogether eight wedges are likely to form due to intersection of
joints belonging to sets S2, S3 and S4. Out of these, all the wedges are stable, except for
roof wedge which is found to be unstable. Provision of sufficient rock supports has been kept
accordingly.
The in-situ rock mechanics test such as hydrofrac test etc. would be conducted at
appropriate loation of chamber. The results of rock mechanics test and geological

Etalin Hydroelectric Project (3097 MW) Detailed Project Report
Volume-I: Main Report Part-A: Chapters 1 to 9
169126-40ER-0009-00 6-24
assessment of exploratory drifts will be utilized to optimize the alignment of the chamber and
design supports. However, the provision of dywidag rock bolts has been kept at present.
Based on the data obtained from surface mapping and subsurface explorations carried out
at site, percentage of rock mass classes with respect to total length of desilting chambers
are estimated as 30% of Class-II, 40% of Class-III, 20% of Class-IV and 10 % of Class-V.
However, in view of very limited rock outcrops around the proposed structure, the estimation
is based on such limited data. The rock support will be reviewed after the rock mechanics
test and data from the balance drifting is analysed.
Silt flushing arrangement for desanding chambers has been proposed downstream of
confluence of Kun nallah with Talo (Tangon) river. Flushing ducts, in the initial reaches, are
aligned in N177º - N357º direction. It is observed that alignment of the flushing ducts in the
upstream reaches is askew by 88º with respect to strike of joints belonging to set S1, which
is most favorable condition. It is askew with respect to joints belonging to sets S2, S3 and S4
by 55º, 03º and 86º, respectively. It indicates that flushing ducts, in this reach, are aligned
very favorably in case of joints belonging to sets S1, S2 and S4 and very unfavorably in case
of to set S3. Further alignment of the flushing ducts, downstream of the bend, and the single
flushing tunnel thererafter up to outlet portal is askew with respect to the strike of the joints
belonging to sets S1, S2, S3 and S4 by 43º, 80º, 48º and 41º, respectively which indicates
fair to favorable alignment for the feeder tunels. The proposed outlet portal of flushing tunnel
is suitably located on bed rock comprising granodioritic gneiss.
Based on the data obtained from surface mapping and subsurface explorations carried out
at site, percentage of different rock mass classes along flushing tunnel are estimated
tentatively as 35% Class for II, 40% for Class-III, 15% for Class-IV and 10 % for Calss-V.
Talo (Tangon) Reservoir
The construction of 80m high concrete gravity dam with Dam top at 1052m and FRL of
1050m across river Talo (Tangon) shall develop a reservoir inundating approximate 36.12 ha
area with respect to FRL and about 2.5km length.
The geological mapping of the reservoir area was carried out on 1:5,000 scale with a view to
assess the reservoir rim stability and identifying the vulnerable reaches with special
reference to landslides and possibility of any seepage after impounding of reservoir.
The traverses in the reservoir area indicated that along the valley slopes upto FRL
(Full Reservoir Level) and between FRL and MDDL (Minimum Draw Down Level), bedrock is

Etalin Hydroelectric Project (3097 MW) Detailed Project Report
Volume-I: Main Report Part-A: Chapters 1 to 9
169126-40ER-0009-00 6-25
exposed at few reaches and most of the area is occupied by river borne material at lower
reaches followed by slope wash material above. No major landslide scar or evidences of
slope instability were observed during surface geological mapping at this site except a few
small slide scars. Five minor slide scars on the left bank and one on the right bank have
been noticed. Slope instability around these slide zones due to heavy precipitation cannot be
ruled out; however, reservoir impoundment may not play any role for its activation.
Thus, protection measures to stabilize the slide may be kept for safety of the reservoir rim.
6.4.4 Headrace Tunnel (HRT) Talo (Tangon) Limb
A 9.7m finished diameter and 13045m long circular shaped headrace tunnel (HRT) has been
proposed on the right bank of Talo (Tangon) river with a view to convey 320.2 cumecs of
design discharge from diversion site to the underground powerhouse at the confluence of
Talo (Tangon) and Dri rivers near Etalin Village.
The headrace tunnel, immediately down stream of desanding chambers, is aligned in
N040º - N220º direction for about 320m length. Then it turns towards N094º - N274º
direction up to RD 3460m near Ron pani nallah crossing in Sector -1. From RD 3460m up to
RD 6500m near Maru pani nallah crossing, the Headrace tunnel is alingned in N088º -
N268º direction in Sector-2. Further down stream, from RD 6500m upto RD 9820m near
Masa pani nallah crossing the headrace tunnel is aligned in N052º - N232º direction in
Secter-3. The HRT down stream of RD 9820m upto the surge shaft is aligned in N061º -
N241º direction in Sector-4. Invert at Intake is at EL1028m and it joins surge shaft at
EL970m, and over all gradient along the HRT is 1in 235.13.
The proposed HRT at Talo (Tangon) limb is expected to encounter bed rock comprising
granodiorite gneiss and biotite gneiss with occasional quartz and pegmatite veins. Few
shear seams, fractured zone and weak rock mass are expected to be encountered below the
major nallah crossings and along litho-contacts. In general, the rock mass is jointed blocky
in nature and about 30% of total length of the tunnel has superincumbent cover of more than
500m. Possibilities of stress related problem in such high cover zones is anticipated. The
bed rock is traversed by more than four joint sets in general. Development of unstable
wedges are mainly expected on the roof and left wall.
The HRT, along its route, will pass under prominent cross drainages, Shu Pani, Ron pani,
Maru Pani and Masa pani. In order to assess the extent of rock cover available above HRT
at those nallah crossings, subsurface exploration by three deep drill holes has been

Etalin Hydroelectric Project (3097 MW) Detailed Project Report
Volume-I: Main Report Part-A: Chapters 1 to 9
169126-40ER-0009-00 6-26
proposed at Ron pani, Maru pani and Masa pani nallah crossings. The drilling activity at
Maru pani nallah crossings is under progress.
In general superincumbent cover varies from 90m to 966m. Tentative estimate of rock mass
class indicates that the RMR value varies between 30 and 83. However, RMR values
between 17 and 27 are expected at the tunnel stretches below major nallah crossings and in
shear seams/pegmatite zones and hign cover zones. The tentative rock mass classes
expected to meet along the HRT length are Class-II, III, IV and V as 27%, 44%, 19% and
10% of the tunnel length respectively.
To facilitate the excavation of 13045m long Headrace tunnel, four intermediate construction
adits of length 523,324,514 & 355m are proposed in addition to construction faces from both
ends of HRT. Another adit of length 372m from surge bottom is also foreseen. The bed rock
is exposed at the proposed portals sites for adit T3 but the area around proposed portals for
Adit T1, Adit T2 and Adit T4 is covered with overburden. However, the depth of overburden
is expected to be shallow at the portal site for Adit T1, Adit T2 and T4. The Adits are
expected to encounter good to fair rock mass mainly with RMR variying between 41 and 76.
Provision of suitable slope stabilization measures have been kept for developing portal
structures. The rock classes are almost to be encountered similar to anticipated in HRT.
6.4.5 Underground Powerhouse Complex
The proposed underground powerhouse will be housing 10 units of 307 MW each and is
located within the hill ridge between Talo (Tangon) and Dri rivers, near their confluence.
The underground powerhouse complex has the following componants.
a) Two separate restricted orifice type underground surge shafts - one on Dri limb (26m
diameter and 132m high) and another on Talo (Tangon) limb (21m diameter and 137m
high).
b) Three pressure shafts are proposed on dri limb (each with 5.6m diameter) followed by
six unit pressure shafts (each having 4m dia. and 512m length).
c) Similarly, two pressure shafts are proposed on Talo (Tangon) limb, each with 5.6m
diameter. These preassure shafts further branch into four unit pressure shafts (each
having 4m diameter and 512m length).
d) An underground powerhouse cavern of dimensions 352m(L) X 23.5m(W) X 59.73m(H),
with installed capacity of 3070MW (10X307 MW) is proposed. A 349.6m long, 16.5m

Etalin Hydroelectric Project (3097 MW) Detailed Project Report
Volume-I: Main Report Part-A: Chapters 1 to 9
169126-40ER-0009-00 6-27
wide and 24m high underground transformer hall is also proposed about 50m
downstream of powerhouse cavern.
e) Two numbers of Main Access Tunnels were proposed for the project, one accessing the
powerhouse from Dri Side (473m long) and another from Talo (Tangon) side (779m
long). Both the access tunnes are D shapped 8m (H) and 8m (W).
f) Tailwater discharge arrangement from the proposed powerhouse up to the tailrace
outfall on Dri side includes three connecting tunnels followed by one 555m long and
11.3m diameter circular shaped main tailrace tunnel, for discharging the tailwater back
into the river.
g) Similarly, the proposed tailwater discharge arrangement from powerhouse up to the
tailrace outfall on Talo (Tangon) side includes, two connecting tunnels followed by one
544m long and 9.5m diameter circular shaped main tailrace tunnel, for discharging the
tailwater back into the river.
The area around proposed powerhouse complex is confined to a ridge delimited by the
rivers Dri and Talo (Tangon) on either side. Most of the area is covered by thick overburden
that supports very dense vegetation. The rock outcrops are scanty in general and mostly
confined to lower level near confluence of both the rivers and in the slope cut along the
existing road.
Detailed geological map of the powerhouse site (Plate 6-6) indicates that the left bank slope
of Dri river is moderate up to the Etalin – Anini road, above which it is moderate to steep and
becomes very steep as one approaches the crest of the ridge. The hill slope in the area is
covered by slope wash deposits.The slope wash material is mainly composed of angular to
sub-angular fragments of granodioritic gneiss, calcareous quartzites, biotite gneiss and
pegmatites with silty and clayey matrix. Two small ephemeral nallahs descend on the slope
and join river Dri at about 500m and 850m upstream of the confluence. These nallahs have
limited catchment and are of little consequence. Sporadic bedrock exposures are observed
on the valley slope above Etalin-Anini road. However, the bedrock is extensively exposed
along the road cuts and below, mainly upto the riverbed near the confluence.
The right bank slope of river Talo (Tangon) is, in general, gentle and gradually becomes
moderate to steep above El. 775m. The right bank slope of Talo (Tangon) river rises steeply
along the ridge. The hill slope is covered by slope wash deposits comprising angular to sub-
angular fragments of calcareous quartzite, biotite gneiss, granodiorite and pegmatite with
clayey and silty matrix.

Etalin Hydroelectric Project (3097 MW) Detailed Project Report
Volume-I: Main Report Part-A: Chapters 1 to 9
169126-40ER-0009-00 6-28
Bedrock comprising granodiorite gneiss, diorite gneiss, calcareous quartzite, biotite gneiss,
and pegmatite has been observed along the river edge and/or along the road cuts near
Etalin village and downstream of Etalin village, near the confluence. Besides this, bedrock
on the valley slope is also occasionally observed in patches at higher elevations.
The foliation is not very well developed within the rock mass in this area. However, the
general strike of the foliation is E-W with sub-vertical dips swinging its dip direction from
north to south due to warping. The rock mass in the area is traversed by four major sets of
joints (Table 6-9). The geological map of powerhouse area is given in Plate 6-6.
Table 6-9: Average Orientation of Discontinuities Traversing the Rock Mass in Powerhouse Complex Area in order of Prominence
Joint set
Strike Dip Dip direction
Average Range Average Range Average Range
S1 263º 276º - 245º 88º 63º - 89º 353º 335º -006º
S2 166º 140º - 187º 52º 35º - 65º 256º 230º - 277º
S3 346º 315º - 010º 20º 12º - 28º 076º 045º - 100º
S4 006º 358º - 014º 82º 75º – 86º 096º 088º - 104º
In addition to eight drill holes as mentioned in Table 6-2, this area has been further
invesitigated by two exploratory drifts to understand rock mass condition and assessment of
support requirement. Subsurface exploration plan of the powerhouse includes two
exploratory drifts with a view to explore the actual rock mass condition and assess the
support requirement. The details of the drifts are given below in Table 6-10.
Table 6-10: Details of exploratory Drifts at powerhouse area
Drift No. Location Total Length (m) Remarks
DR – SS1 Up to surge shaft bottom – Dri Limb - Completed 286m
DR – EP1 Upto powerhouse 800 (proposed) Completed 436m
The details 3D geological logs of these drifts are appended in Vol-IIIC of the DPR. These
drifts are still in progress. The hydrofrac test in powerhouse drift is to be undertaken by
NIRM, Bangalore shortly to measure stresses and substantiate the orientation of the loger
axis of the powerhouse cavern.

Etalin Hydroelectric Project (3097 MW) Detailed Project Report
Volume-I: Main Report Part-A: Chapters 1 to 9
169126-40ER-0009-00 6-29
Surge Shaft
As conceived, the project has two headrace tunnels (HRTs) – the Talo (Tangon) limb HRT
located within the right bank of Talo (Tangon) river and the Dri limb HRT is located within the
left bank of Dri river. Each HRT has been planned to terminate into their respective surge
shafts located with sufficient lateral distance from each other on the ridge between Talo
(Tangon) and Dri rivers near confluence.
The HRT on Dri limb would terminate at El 970m into an open to sky surge shaft with top
elevation at El 1107m. Similarly, other open to sky surge shaft is proposed with the bottom of
surge shaft at El 970m and top at El 1107m.
Since slope wash deposits mostly cover the entire area, four drill holes (DH SS-1, DH SS-2,
DH SS-3 and SS-4) were drilled to determine the depth to bedrock and assess the rock
mass condition likely to be encountered during the excavation of surge shafts. The drill holes
indicated the presence of granodioritic/dioritic gneiss predominently intruded by pegmatite
veins. From the summary of drill hole data at powerhouse complex, it is evident that rock
mass likely to be encountered during the excavation of surge shafts would, in general, be fair
to good. In the drill hole DH SS-2 overburden thickness of about 50.15m is recorded and,
thereafter, bedrock of granodioritic/dioritic gneiss with numerous pegmatite are observed.
The depth of overburden comprising slope wash deposits varies between 4.5m and 20m at
the proposed surge shaft top area.
Apart from this, an exploratory drift DR SS-1 of 230m length have been proposed from invert
level El 964.39m and it is already driven up to 286m length. The over all rock mass in this
drift is granodiorite with pegmatite and quartz vein intrusions. These geological sections
(Plate 6-7) also indicate that the surge shafts would be excavated mostly through fresh, hard
and jointed blocky rock mass. A pegmatite zone may be encountered at the bottom level of
the surge shaft at El 970m; otherwise surge shaft will be mainly excavated through
granodioritic/dioritic gneiss rock mass. As the rock mass is traversed by four sets of joints,
formation of unstable wedges along the surge shaft walls is anticipated, wherein S2 joint set
will play important role for north-east wall and S4 joint will play as failure surface for
north-west wall. Thus, necessary protection measures will be taken to contain the wedges
formed during excavation.

Etalin Hydroelectric Project (3097 MW) Detailed Project Report
Volume-I: Main Report Part-A: Chapters 1 to 9
169126-40ER-0009-00 6-30
The entire surge shaft of Dri limb will be excavated in granodioritic/dioritic gneiss rock mass
traversed by pegmatite bands and small amphibolites bodies. Formation of wedges would be
similar to that of the surge shaft of Talo (Tangon) limb
Both the surge shafts are proposed as open to sky structures. A platform connecting both
the surge shaft is to be developed by removing the overburden and thereby stabilizing the
back slope towards the northern side. As such, no major problem is anticipated, as rock
mass likely to be encountered during excavation has been assessed as fair to good class.
Two adits have been proposed one from Dri side and other from Talo (Tangon) side up to
the bottom of two surge shafts to facilitate construction. Geological Section along surge
shaft, pressure shaft, power house and Tailrace tunnel is given as Plate 6-7.
Pressure shafts
Two pressure shafts are proposed to originate from Talo (Tangon) limb surge shaft, which
will be bifurcated into total four unit pressure shafts. The pressure shafts are proposed to be
steel lined throughout entire length. A valve chamber has been envisaged downstream of
surge shaft. Keeping this in view, an intermediate construction adit has been provided at El
775m. Drill holes DH-SS1 and DH-SS3 indicate availability of bedrock at El 1077.68m and
El 086.34m, respectively whereas DH PS-2 indicates presence of bedrock at El 1050.37m.
Result of all the three drill holes are taken in to consideration, while deciding the alignment of
the pressure shafts. It is apparent that the pressure shafts will be excavated in a rock mass
of granodiorite/diorite gneiss intruded by pegmatite veins and amphibolites. The initial reach
of about 15m, the pressure shaft may encounter pegmatite. The rock mass is traversed by
four prominant joint sets including those oriented along the foliation. The horizontal limbs of
pressure shafts are aligned in N39º-N219º direction and are askew with respect to the strike
of the joints belonging to sets S1, S2, S3 and S4 by 44º, 54º, 53º and 33º, respectively.
This indicates that the horizontal limbs of the pressure shaft will be aligned fair to favourable
with respect to the strike of major joint sets. The vertical limbs of the pressure shafts will also
be excavated through fair to good granodioritic/dioritic gneiss. However if any thin shear or
weak zone is encountered in the vertical limb, it may have to be negotiated for a
considerable length as the foliation is steeply dipping.
The geological section reveals that the pressure shafts will be excavated through
granodioritc/dioritic gneiss intruded by pegmatite and amphibolite. Similarly, three steel lined
pressure shafts are envisaged to originate from the Dri limb surge shaft, each of which will
bifurcate in to total six unit pressure shafts. As the arrangement of Dri limb pressure shafts is

Etalin Hydroelectric Project (3097 MW) Detailed Project Report
Volume-I: Main Report Part-A: Chapters 1 to 9
169126-40ER-0009-00 6-31
similar to those of Talo (Tangon) limb and the rock attitude in this area is also same, it is
evident that similar geological condition will be prevailed during construction of these
stretches. One valve chamber each has been envisaged downstream of the two surge shafts
in upper horizontal limb. Beyond the valve chamber, the pressure shafts are designed to
have vertical drop in two stages. Drill hole indicates availability of bedrock at El 1053.589m
(DH SS-2) and El 974.047m (DH PS-1) at proposed penstock area. An intermediate
construction adit has been provided at El 775m. Geological Section along surge shaft,
pressure shaft, powerhouse and Tailrace tunnel is given as Plate-6.7.
Powerhouse Cavern
A 3070MW (installed capacity) underground powerhouse is proposed within the hill ridge
between Talo (Tangon) river and Dri river near the confluence of the said two rivers.
It is observed that bedrock in powerhouse area is traversed by four sets of rock
discontinuities. Joints belonging to set S1 are parallel to foliations with strike nearly E-W and
dipping on an average by 88º towards 353º. Joints belonging to next prominent joint set S2
dip on an average by 52º towards N256º. The joint set S3 dips towards N076º by 20º and set
S4, on an average, dips by 82º towards N096º.
Based on the analysis of discontinuity data, the long axis of the powerhouse cavern
orientation has been aligned at N130º – N310º. In this case, rock discontinuities with respect
to powerhouse alignment indicates that the orientation of long axis of powerhouse is askew
by 47º, 36º, 36º and 56º, with the strike of joints sets S1, S2, S3 and S4. At this juncture, the
orientation of powerhouse with respect to the rock attitude has been optimized. However,
the final orientation of the powerhouse cavity will be further optimized when the discontinuity
data from rest of the exploratory drift is obtained and analyzed in conjunction with results of
in-situ rock mechanics tests including in situ stress measurement proposed to be carried out
at RD 225m and RD 540m, repectively.
The geological map of the area and geological sections along the long axis of powerhouse
cavern (Plates 6-6 & 6-7) indicate that the rock cover above crown of the powerhouse
cavern is around 315m to 440m. Bedrock in the area is characterized by granodioritic gneiss
with occasional amphibolites intrusives and emplaced pegmatite veins. Bedrock likely to be
encountered in powerhouse cavern is foliated, jointed along with pegmatite and silica veins
emplaced within it can be observed at several places. In addition to joints, some shear/

Etalin Hydroelectric Project (3097 MW) Detailed Project Report
Volume-I: Main Report Part-A: Chapters 1 to 9
169126-40ER-0009-00 6-32
fracture zone, mostly oriented along the foliation, have been observed traversing the rock
mass.
The proposed powerhouse cavern will encounter bedrock comprising granodioritic gneiss
with pegmatite and amphibolites bodies along its full length and width. However, based on
surface outcrop studies and nearby drill hole results, a pegmatitic zone of about 20m
thickness comprising thin pegmatite veins intruded in close intervals within the parent
granodioritic rock mass is interpreted towards the Talo (Tangon) side of the powerhouse
cavern. This zone is expected to be encounterd at the lower reaches of the powerhouse
cavern below El 585m. Based on surface manifestation of isolated bedrock outcrops around
the area and results of geological logging, it is estimated that the proposed powerhouse
cavern will encounter rock mass belonging to Class II and Class III with RMR varying
between 51 and 78. Tentatively, the powerhouse cavern is likely to encounter rock mass
belonging to Class II for 35% and Class III for about 65% of total length.
Keeping in view the size of the openings and pattern of the discontinuities, wedge analysis
has been carried out in case of powerhouse cavern, considering different combinations of
joint sets. Analysis has been done by assuming unit weight of rock as 2.7 tons/m3, friction
angle as 42º, cohesion as 0.16 tons/m3 and water as 0.981tons/m3.
Wedge analysis has been carried out considering two different combinations of joint sets out
of all four joint sets observed in the area. Result of the wedge analysis considering
combination of joint sets S1, S2 and S3 was found to be unstable. The results of analysis
carried out by considering the sets S1, S2 and S3 indicate formation of seven wedges
altogether. Out of those, four wedges including two roof wedges (unstable) with factor of
safety 1.854 and 0.0, one Upper Left side wedge (unstable) with factor of safety 2.223, and
one far End wedge (marginally stable) with factor of safety 3.942, are considered vulnerable.
This aspect has considered in the designing the supports so that these unstable wedges will
be taken care of during excavation.
Transformer hall cavern of dimensions 349.6m (L) x 16.5m (W) x 24m (H) is proposed to be
located about 50m downstream of powerhouse cavern and is oriented in the same direction.
Therefore, geotechnical aspects of both the caverns are more or less similar.

Etalin Hydroelectric Project (3097 MW) Detailed Project Report
Volume-I: Main Report Part-A: Chapters 1 to 9
169126-40ER-0009-00 6-33
Main Access Tunnels
Keeping in view the length of the proposed powerhouse cavern (352m) it has been decided
to access it through two Main Access Tunnels (MATs) located one each on Dri and Talo
(Tangon) sides.
Main Access Tunnel – Dri side
The proposed portal area of this access tunnel is characterized by bedrock outcrop
comprising granodioritic gneiss from El. 625m to El. 650m. Thereafter, the hill slope along
access tunnel alignment is mostly covered with overburden, except for a small portion at
about El 745m above the road section, where a small rock outcrop of granodioritic gneiss is
present. Bed rock below the overburden at this area is comprised of granodioritic gneiss with
pegmatite veins at places.
The hill slope along the access tunnel follows a slope of about 50º up to the elevation of
about 675m. Thereafter, the hill slope maintains a gentle slope of about 5º along a high level
terrace. The hill slope above this terrace again maintains a slope of about 45º upto the
elevation of El 975m. The cover above the tunnel varies between 10m and 360m. It is
observed that the portal is suitably located on bedrock.
The proposed access tunnel is likely to encounter granodioritic gneiss traversed by
pegmatite veins as tunneling media. One such thin pegmatite vein is expected at the portal
area. One more pegmatitic zone of considerable thickness comprising numerous pegmatite
veins within gneisses is also expected at about 450m from portal area. Thickness of this
pegmatitic zone is expected to be 20m.
Unstable wedges on the right wall and roof of the tunnel resulting from the combination of
prevailing joint sets is anticipated.
The proposed access tunnel will encounter Class II and Class III rock mass of fair to good
quality mainly with RMR varying between 55 and 70. Few stretches along this tunnel may
encounter rock mass having Class IV with RMR value between 30 and 38. The anticipated
rock Classes to be encountered in the entire tunnel length are estimateted tentatively as
Class II for15%, Class III for 65%, Class IV for 15% and Class V for 5%.

Etalin Hydroelectric Project (3097 MW) Detailed Project Report
Volume-I: Main Report Part-A: Chapters 1 to 9
169126-40ER-0009-00 6-34
Main Access Tunnel – Talo (Tangon) side
The proposed portal area for this access tunnel is characterized by overburden. The bedrock
comprising biotite gneiss is exposed in this area at a lower elevation than the proposed
portal invert elevation. Main Access Tunnel is likely to encounter bedrock including biotite
gneiss, calcareous quartzite with chlorite bands and granodioritic gneiss with pegmatite
veins at places. Occasional shear seams varying in thickness from a few millimeters and
0.5m may also be encountered. The ground cover above the tunnel varies between 10m and
448m. The bedrock has been encountered at 36m depth from the ground surface based on
drill hole DH-AD2. Seismic profile EP- 4 meeting the hill slope above this access tunnel at
about 625m from the portal has also inferred depth of overburden is of the order of about
32m along the proposed tunnel alignment. It is indicated that initially open excavation will be
required for a length of about 70m in overburden for locating the portal in the bedrock.
Thereafter it will be followed by structural tunnel till adequate rock cover is available above
the tunnel overt. The slope cuts resulting from this excavation would be suitably designed for
restoring the stability.
The proposed access tunnel is expected to negotiate biotite gneiss, calcareous quartzite and
granodioritic gneiss as the tunneling media. Initially from portal up to about 200m, the tunnel
will pass through biotite gneiss. Thereafter, the tunneling media is expected to be quartzite
for a stretch of about 130m. Rest of the tunnel is expected to encounter granodioritic gneiss
as tunneling media. Few thin pegmatite veins and small amphibolites intrusive bodies are
also expected to be encountered along the proposed alignment.
The bedrock is traversed by four sets of rock discontinuites. The most prominent
discontinuity S1 shows favorable orientation with the proposed tunnel alignment. The set S2
shows fair orientation with the tunnel alignment. The third discontinuity set S3 shows fair
orientation due to very low dip angle and set S4 show very unfavourable orientation with
tunnel alignment. Unstable wedges on the right wall and roof of the tunnel resulting from the
combination of above joint sets may occur.
Based on surface manifestation of isolated bedrock outcrops around the area, it is estimated
that the proposed access tunnel will encounter Class II and Class III rock mass of fair to
good quality mainly with RMR varying between 51 and 70. However, few stretches along this
tunnel may encounter rock mass having Class IV with RMR value between 32 and 38.
Tentatively, this access tunnel is likely to encounter rock mass of Class II -15%, Class III
55%, Class - IV 20% and Class V-10% of total length respectively.

Etalin Hydroelectric Project (3097 MW) Detailed Project Report
Volume-I: Main Report Part-A: Chapters 1 to 9
169126-40ER-0009-00 6-35
Tailrace Tunnels
Two numbers of Tailrace tunnels; one of 11.3m diameter for Dri side and another of 9.5m
diameter for Talo (Tangon) side have been proposed to take the discharge water from
powerhouse back into Talo (Tangon) river near confluence with Dri and Talo (Tangon) river.
The bedrock exposed in this area comprises granodioritic gneiss with intrusion of
amphibolite, calcareous quartzite, quartzite with chlorite schist bands and biotite gneiss with
pegmatite veins at places. Biotite gneiss is well exposed at both the portal locations and
beyond EL 625m the hill slopes are covered by overburden comprises slope wash material.
Few shears along the road cuts at about El. 720m are observed along chloritic schistose
band, the same formation shall be encountered during the exacavation of Tailrace tunnel as
depicted in Plate 6-7. Bedrock is traversed by four sets of discontinuities in this area.
The ground cover above the tunnel varies between 25m in the initial reaches up to maximum
of about 290m. Formation of unstable wedges due to intersection of prevailing joints in the
crown portion are observed and due care has been taken in the design. The proposed TRT
is likely to negotiate good to fair quality rock mass along major portion of the tunnel length
excluding the initial reaches of about 15-20m from the out fall portal where the rock mass
appeared to be disturbed. The alignment of both (Dri and Tanogn limb) TRT are almost
parallel to each other and hence the rock mass properties of both TRT remain same.
Geological Section along surge shaft, pressure shaft, powerhouse and Tailrace tunnel is
given as Plate 6-7.
A tentative rock mass classification indicates that both the Tailrace tunnels are likely to
encounter rock mass Class II for 15%, Class III for 55%, Class IV for 20% and Class V for
10% of total length.
6.5 Seismicity and Seismotectonics
The project area lies in the seismic Zone V of the seimic zoning map of India [IS1893:
part-1(2002)]. The seismic Zone V is broadly associated with seismic intensity IX and above
on MMI scale. It may be mentioned that the intensity IX corresponds to horizontal ground
acceleration of greater than 250cm/sec2 in any direction. The ground acceleration and,
hence, seismic intensity of an earthquake at a place depends on the magnitude of
earthquake, distance from the focus, duration of earthquake, type of underlying soil and its
damping characteristics. The damage to the buildings founded on soft or filled up earth will
be higher than that in similar types of buildings founded on hard bedrock. Also, the damage

Etalin Hydroelectric Project (3097 MW) Detailed Project Report
Volume-I: Main Report Part-A: Chapters 1 to 9
169126-40ER-0009-00 6-36
will be higher for higher magnitude and long duration earthquakes, less epicentral distance,
soft soil conditions and areas with high liquefaction potential.
Keeping in view the high seismicity of the area, the site specific seismic studies for the
project have been carried out by Department of Earthquake engineering, IIT Roorkee.
Based on parameters like regional geology, seismotectonic setup, characteristics of various
seismogenic sources present in the region and seismic history of the area (IMD data), the
following recommendatios have been made.
The maximum credible earthquake (MCE) that can occur in the area with peak ground
acceleration has been estimated to be of magnitude 8.5, occurring along Lohit Thrust.
By obtaining spectra and time history for MCE conditions, the design basis spectra is
evaluated by using appropriate reduction factors.
The PGA values for MCE and DBE has been estimated as 0.56g and 0.32g,for horizondal
and 0.37g and 0.21g fro vertical components respectively.
Conclusion
The proposed Etalin HE Project area is located on the eastern limb of the Eastern
Syntaxial Bend (ESB) in the eastern part of Arunachal Pradesh that exposes rocks
ranging in age from Proterozoic to Tertiary and Recent deposits. The major rock units
exposed in and around the project area belong to Ithun Formation, Hunli Formation
and Diorite – Granodiorite – Granite Complex or Lohit Plutonic Complex.
Notwithstanding, rocks of Hunli Formation, exposed on the southern side of Talo
(Tangon) river, are not likely to be encountered in any of the project components.
Extensive sub-surface investigations were undertaken which includes 46 Nos. of drill
holes with cumulative depth/length of 2892.15m, exploratory drifting (7 Nos.) with
cumulative length of 531m and geophysical exploration comprising of seismic
refraction profiling aggregating to 1539m length. Apart from this, laboratory tests on
core samples including petrography, insitu permeability test/water percolation test in
drill holes and insitu rock mechanic tests in drifts were also conducted.
Ithun Formation comprises a sequence of biotite gneiss with quartzite, amphibolite,
calcareous quartzite, carbonate bands and garnetiferous mica schist with kyanite and
sillimanite. The diorite - granodiorite – granite complex is characterized by a wide

Etalin Hydroelectric Project (3097 MW) Detailed Project Report
Volume-I: Main Report Part-A: Chapters 1 to 9
169126-40ER-0009-00 6-37
variation in gneissic rocks from diorite, granodiorite to granite with gradational contact
between them. These rocks have undergone polyphase deformation.
The project envisages diversion of water from Dri river and Talo (Tangon) river
through two separate water conductor systems up to powerhouse. Initially two
separate powerhouse caverns were proposed for Dri limb and Talo (Tangon) limb
water conductor system. However, considering the construction and operational point
of view and limitation of space, it was decided to have one single powerhouse cavern
for both the limbs of the water conducting systems.
Two alternative sites (Alternative-I and Alternative-II) were proposed for river
diversion at Dri site near Eron village. However, keeping in view the curvature in the
course of river, inadequate width of the valley required to route design flood the
diversion site Alternative-II was preferred.
The proposed Dam site on Dri River has been found suitable where rocks comprising
granodioritic gneiss are exposed on either abutment and overburden in the riverbed
vary in thickness between 10.5m and 19.5m which is confirmed by drilling.
The permeability of rock mass is also of low order and varies between 0.1 and
0.97 lugeon. Exploration by drifting on the abutments has established an admissible
stripping limit up to 10m and 12m. Based on the geological explorations carried out,
the site is found suitable for concrete gravity dam as diversion structure with the
deepest foundation at El 945.5m and top of the dam at El 1047m. The height of the
dam above deepest foundation would be 101.5m.
Investigations indicate that bedrock is present at the foundation level of spillway and
plunge pool and no major excavation would be required on the abutments in order to
accommodate the width of spillway except on the right bank to accommodate the
plunge pool which is at lower level and occupied by riverine deposit. The cut slopes
are to be properly designed and adequately protected wherever required.
The proposed intake structure is located in the rock mass comprising foliated and
jointed blocky granodioritic / dioritic gneiss. The rock mass is traversed by four sets
of prominent joints including those oriented along the foliation. It is also observed
from geological section along the intake structure that all the joints, except those of
set S3 are dipping towards valley. This indicates that slope cuts above the structure
would have to be stabilized. The proposed intake is found to be favorably aligned
with respect to the strike of the most prominent rock discontinuities, except the valley
dipping joints of set S3 which needs to be stabilized by rock bolts.

Etalin Hydroelectric Project (3097 MW) Detailed Project Report
Volume-I: Main Report Part-A: Chapters 1 to 9
169126-40ER-0009-00 6-38
At the site of upstream coffer dam a concrete faced structure with plum concrete core
is proposed. It is proposed to explore the river bed at the site through a drill hole
DH- D9 to decipher overburden thickness in the riverbed so that grouting is planned
to minimize the seepage through foundation. The downstream coffer dam is
proposed to be a random fill dam.
Three numbers of diversion tunnels are proposed at Dri diversion site on the right
bank and one diversion tunnel is proposed on the left bank at this site. Portals of all
tunnels are sited on bed rock. In case of the diversion tunnel on left bank, sufficient
gap is maintained between the HRT and the diversion tunnel at crossing over portion.
Based on the surface and subsurface explorations carried out so far, it is expected
that about 25% of Class II (Good quality), 50% of Class III (Fair quality), 15% of
Class IV (Poor quality) and 10% of Class V (Very Poor quality) rock mass may be
encountered in the diversion tunnels.
The proposed HRT at Dri limb is likely to encounter rock mass comprising
granodiorite gneiss and biotite gneiss in most of its’ length. However, a considerable
stretch from about RD 1400m to RD 2480m is expected to encounter rock mass with
thick (about 230 m) calcareous quartzite/marble bands and a zone comprising
closely spaced shear seams within gneisses between RD 7200m and RD 7450m.
Shear seams and weak zones are also expected to be encountered below the nala
crossings. Bed rock is traversed by four sets of structural discontinuities.
Development of unstable wedges are expected on the roof and left wall mainly.
About 10% of the total length of the tunnel is having cover more than 500m above
HRT alignment. Stress related condition may be encountered here. Tentative rock
mass class expected along the HRT indicates that Rock mass of Class II (RMR >60),
Class III (RMR >40), Class IV (RMR >20) and Class V (RMR <20) are expected by
25%, 47%, 20% and 8% respectively along the total length of HRT.
In case of Talo (Tangon) limb also, two alternative sites (Alternative-I and Alternative-
II) were identified. However, during geological mapping and exploration by drilling in
river bed at Alternative-I site the thickness of overburden was found to be more than
70m and thus it was decided not to pursue the site Alternative-I further.
The Alternative-II site (about 2.3 kms. upstream) has been finally adopted after
achieving satisfactory results of detailed investigations.
The proposed Dam site on Talo (Tangon) river is characterized by presence of bed
rock exposures on both the banks. Maximum depth of overburden in the riverbed

Etalin Hydroelectric Project (3097 MW) Detailed Project Report
Volume-I: Main Report Part-A: Chapters 1 to 9
169126-40ER-0009-00 6-39
proved by drilling is 29.0m. The site has been found to be suitable for concrete
gravity dam with top of dam at El 1052m, deepest foundation level at El 972m and
spillway located in the dam body. The valley ward dipping joints on either abutment
on the cut slopes beyond the stripping limits will be stabilized by rock bolting
wherever needed. Based on detailed study of rock mass on both the banks, through
exploratory drifts, abutment stripping limit of 10m to 12m is recommended. The
results of the water percolation tests indicate that permeability of the foundation is of
low order. It is recommended that, since the rock mass is foliated and jointed;
consolidation grouting may be carried out in the foundation to make it monolith.
Proposed diversion tunnels on left bank (3 Nos.) are expected to encounter foliated
and jointed granodiorite gneiss, calcareous quartzite and boitite gneiss with
occasional shear seams and pegmatite veins as tunneling media. Inlet portal of the
tunnels are suitably located on bed rock. Outlet portal, when located on overburden,
are expected to encounter depth of overburden less than 20m and for the initial
lengths of the tunnels structural tunnel is required until adequate rock cover is
obtained. Formation of unstable wedges is expected on the right wall and roof of the
tunnels. The proposed diversion tunnels are expected to encounter rock mass of
Class II, III, IV, and V for about 25%, 40%, 25% and 10% respectively.
The proposed underground desilting chambers on right bank are expected to
encounter tunneling media as granodioritic/diorite gneiss, biotite gneiss and
calcareous quartzite with minor pegmatite veins and thin shear seams occasionally.
It is observed that long axis of the proposed desanding chambers is aligned favorably
with respect to most of rock discontinuity sets except the joint set 2 in which case the
alignment is fair. However, the final orientation of the desilting chamber cavity will be
reviewed after results of in-situ rock mechanics test in the drift at structure grade are
obtained along with the discontinuity data available. The ground cover over the
proposed chambers varies between 80m and 270m. It is also observed that
formation of unstable wedges in the roof and on the left walls is expected and
therefore same have to be designed and support has to be provided accordingly.
The proposed desilting chambers are expected to encounter rock mass of Class II,
III, IV, and V for about 30%, 40%, 20% and 10% respectively.
The proposed HRT at Talo (Tangon) limb is expected to encounter rock mass
comprising granodiorite gneiss and biotite gneiss with occasional silica and
pegmatite veins. Few shear seams and weak zones are expected to be encountered

Etalin Hydroelectric Project (3097 MW) Detailed Project Report
Volume-I: Main Report Part-A: Chapters 1 to 9
169126-40ER-0009-00 6-40
below the nala crossings and along lithological contacts. In general, the rock mass is
jointed, blocky; however, at few locations it may become very blocky. About 33% of
the total length of the Headrace tunnel is having more than 500m cover above overt.
Hence, stress related problem cannot be ruled out. Bed rock is traversed by more
than four sets of rock discontinuities.
A tentative estimate of rock mass class along the HRT alignment indicates that the
RMR values will vary between 30 and 83. However, RMR value between 17 and 27
is expected at the tunnel stretches below major nala crossings and shear
seam/pegmatite zones. Tentative rock mass class expected along the HRT indicates
that Rock mass of Class II (RMR >60), Class III (RMR >40), Class IV (RMR >20) and
Class V (RMR <20) are expected by 27%, 44%, 19% and 10% respectively along the
total length of HRT.
Both surge shafts will be excavated through granodioritic gneiss mainly with
pegmatite bands intruded within the rock mass. Formation of unstable wedges along
the surge shaft walls is anticipated. Bedrock likely to be fair to good in general during
the excavation of surge shafts. Two self draining construction adits from either side of
surge shafts have been planned to access the surge shaft at bottom elevation to
facilitate its construction. The tunneling media for the adits are expected to be of fair
to good quality comprising granodioritic/dioritc gneiss associated with pegmatite
bands. The portals of both the adits will be suitably founded on bed rock.
The proposed underground powerhouse complex is located within a ridge delimited
by the rivers Dri and Talo (Tangon) on either side. Most of the area is covered by
thick overburden that supports very dense vegetation. Depth of loose overburden
encountered in this area widely varies between 4m and 60m along the hill slopes.
The underlying rocks mainly comprise granodiorite, diorite, calcareous quartzite,
biotite gneiss with pegmatite veins and minor shear seams present occasionally.
Bed rock is traversed by four prominent sets of discontinuities. Localized warping of
foliation is present at many places.
The proposed underground powerhouse is located under the ridge between Dri river
and Talo (Tangon) river near confluence. The proposed powerhouse cavern will
encounter rocks comprising granodioritic gneiss with pegmatite veins and
amphibolites bodies along its’ full length and width. The long axis of the powerhouse
cavern is orientated at N130º – N310º direction which is most suitable as per the
strike of prominent discontinuity sets as observed in the surface outcrops and also in

Etalin Hydroelectric Project (3097 MW) Detailed Project Report
Volume-I: Main Report Part-A: Chapters 1 to 9
169126-40ER-0009-00 6-41
the exploratory drift driven at the Powerhouse location. However, the final orientation
of the powerhouse cavity will be reviewed after results of in-situ rock mechanics test
in the drift at structure grade are obtained along with the discontinuity data available.
Unstable wedged are expected on the roof and left wall in the powerhouse cavern.
The extent of rock cover over the crown of the powerhouse cavern is around 315m to
440m which is adequate. A zone with thin pegmatite veins intruded in close intervals
within the parent gneissic rock mass is interpreted at the lower reaches towards the
Talo (Tangon) side end of the powerhouse cavern. The powerhouse cavern is likely
to encounter rock mass belonging to Class II 35%, III 65% of total length.
Transformer Hall cavern of 350m (L) X 16.5m (W) and 24M (H) size is located about
50m downstream of Powerhouse cavern and is oriented in the same direction.
Two numbers of Main access tunnels (MAT) are proposed for the powerhouse, one
from Talo (Tangon) side and one from Dri side. Both the access tunnels are having
sufficient cover above the overt and are oriented favorably with respect to prominent
rock discontinuities. The tunnels are expected to encounter biotite gneiss, calcareous
quartzite and granodioritic gneiss as the tunneling media mainly with minor inclusions
of pegmatite veins.
Two numbers of Tailrace Tunnels are proposed for the project to discharge tail water
from powerhouse into the Talo (Tangon) river. Both the alignments of tailrace tunnels
are more or less parallel to each other. Portals of the Tailrace tunnels are suitably
located within bed rock and the tunnels are having sufficient cover above overt level.
The likely tunneling media is biotite gneiss, calcareous quartzite and granodioritic
gneiss intruded by pegmatite veins/ bands and small amphibolites bodies that have
intruded into parent rock. Both the tunnels are found to be oriented favorably in most
of its portion. Expected rock mass class along the Tailrace tunnels are Class II to
Class III mainly and as Class IV and Class V also due to presence of shear seams.
As per the seismic zoning map of India (IS 1893: Part- I (2002)), the area around the
proposed Etalin Hydroelectric Project is located in Zone V. The maximum credible
earthquake (MCE) that can occur in the area with peak ground acceleration has been
estimated to be of magnitude 8.5. The PGA values for MCE and DBE has been
estimated as 0.56g and 0.32g, for horizondal and 0.37g and 0.21g for vertical
components respectively. The valley slopes between FRL and MDDL in most of the
reaches of Dri reservoir area, comprise river borne deposits and bedrock with
occasional presence of slope wash materials. No major landslide is observed along

Etalin Hydroelectric Project (3097 MW) Detailed Project Report
Volume-I: Main Report Part-A: Chapters 1 to 9
169126-40ER-0009-00 6-42
the reservoir rim. Hence, no major problem due to reservoir rim stability is
anticipated. Possibility of any reservoir leakage is not anticipated due to a low order
of permeability observed in drill holes as well as absence of any saddles or any other
avenue through which water can escape out.

ANNEXURE-VI
I. ANGIOSPERMS
Trees
S. No. Family
Name of Species
1 Adoxaceae Viburnum nervosum
2 Anacardiaceae Lannea coromandelica
3 Anacardiaceae Spondias pinnata
4 Anacardiaceae Mangifera sylvatica
5 Araliaceae Aralia armata
6 Araliaceae
Brassaiopsis
glomerulata
7 Araliaceae Macropanax dispermus
8 Araliaceae Macropanax undulatus
9 Araliaceae
Parapentapanax subcordatum
10 Araliaceae Schefflera hypoleuca
11 Arecaceae Caryota urens
12 Arecaceae Livistona jenkinsiana
13 Averrhoaceae Averrhoa carambola
14 Betulaceae Alnus nepalensis
15 Bignoniaceae Oroxylum indicum
16 Bombacaceae Bombax ceiba
17 Burseraceae Canarium strictum
18 Burseraceae Garuga floribunda
19 Caesalpinaceae Acrocarpus fraxinifolius
20 Caesalpinaceae Cynometra polyandra
21 Caesalpiniaceae Bauhinia purpurea
22 Clusiaceae Kayea assamica
23 Clusiaceae Garcinia cowa
24 Combretaceae Terminalia bellirica
25 Combretaceae Terminalia chebula
26 Combretaceae Terminalia myriocarpa
27 Datiscaceae Tetrameles nudiflora
28 Dilleniaceae Dillenia indica
29 Dilleniaceae Dillenia scabrella
30 Dipterocarpaceae Dipterocarpus gracilis
31 Elaeocarpaceae
Elaeocarpus floribundus
32 Euphorbiaceae Bischofia javanica
33 Euphorbiaceae Macaranga denticulata
34 Euphorbiaceae Mallotus philippinensis
35 Euphorbiaceae Ostodes paniculata
S. No. Family
Name of Species
36 Fabaceae Dalbergia pinnata
37 Fabaceae Erythrina variegata
38 Fagaceae Castanopsis indica
39 Fagaceae Castanopsis tribuloides
40 Fagaceae Castanopsis hystrix
41 Fagaceae Castonopsis lanceifolia
42 Fagaceae Lithocarpus dealbatus
43 Fagaceae
Lithocarpus pachyphyllus
44 Fagaceae Lithocarpus fenestratus
45 Fagaceae Lithocarpus falconeri
46 Flacourtiaceae Gynocardia odorata
47 Hammamelidaceae Altingia excelsa
48 Iteaceae Itea macrophylla
49 Juglandaceae Engelhardtia spicata
50 Lamiaceae Premna bengalensis
51 Lythraceae
Lagerstroemia
minuticarpa
52 Lythraceae
Lagerstroemia parviflora
53 Lauraceae Actinodaphne obovata
54 Lauraceae
Cinnamomum glanduliferum
55 Lauraceae
Cinnamomum obtusifolium
56 Lauraceae Phoebe cooperiana
57 Magnoliaceae Magnolia campbellii
58 Magnoliaceae Magnoila griffithii
59 Magnoliaceae Michelia champaca
60 Magnoliaceae Michelia excelsa
61 Magnoliaceae Talauma hodgsonii
62 Malvaceae Kydia calycina
63 Meliaceae Amoora wallichii
64 Meliaceae Chukrasia tabularis
65 Meliaceae Dysoxylum hamiltonii
66 Meliaceae Toona hexandra
67 Mimosaceae Cassia nodosa
68 Mimosaceae Albizia chinensis
69 Mimosaceae Albizia lucida

S. No. Family
Name of Species
70 Mimosaceae Albizia procera
71 Moraceae Artocarpus chaplasha
72 Moraceae Ficus cunia
73 Moraceae Ficus roxburghii
74 Moraceae Ficus semicordata
75 Moraceae Morus laevigata
76 Myrtaceae Psidium guajava
77 Myrtaceae Syzygium formosum
78 Pandanaceae Pandanus odoratissima
79 Primulaceae Maesa chisia
80 Primulaceae Maesa indica
81 Rhamnaceae Hovenia acerba
82 Rutaceae Citrus aurantium
S. No. Family
Name of Species
83 Rutaceae Citrus lemon
84 Salicaceae Populus gamblei
85 Sapotaceae Sarcosperma griffithii
86 Saurauriaceae Saurauia roxburghii
87 Simaroubaceae Ailanthus integrifolia
88 Simaroubaceae Alangium begoniifolium
89 Sonneratiaceae Duabanga grandiflora
90 Sterculiaceae
Pterospermum acerifolium
91 Sterculiaceae Sterculia villosa
92 Ulmaceae Trema orientalis
93 Verbenaceae Callicarpa arborea
94 Verbenaceae Gmelina arborea
95 Verbenaceae Vitex altissima
Shrubs
S. No.
Family Name of Species
1 Acanthaceae Adhatoda vasica
2 Acanthaceae Anisomeles ovata
3 Acanthaceae Phlogacanthus tubiflorus
4 Acanthaceae Strobilanthes coloratus
5 Anacardiaceae Rhus wallichii
6 Apocynaceae Thevetia peruviana
7 Araliaceae Trevesia palmata
8 Arecaceae Calamus erectus
9 Arecaceae Calamus flagellum
10 Arecaceae Calamus floribundus
11 Arecaceae Calamus inermis
12 Arecaceae Calamus leptospadix
13 Asclepiadaceae Calotropis gigantea
14 Asclepiadaceae Marsdenia roylei
15 Asteraceae Artemisia nilagirica
16 Asteraceae Artemisia indica
17 Asteraceae Eupatorium odoratum
18 Asteraceae
Veronica anagallis-
aquatica
19 Bischofiaceae Bischofia javanica
20 Buddlejaceae Buddleja asiatica
21 Cactaceae Opuntia dillenii
22 Caesalpinaceae Cassia occidentalis
23 Canabinacae Cannabis sativa
S. No.
Family Name of Species
24 Cannaceae Canna indica
25 Costaceae Costus speciosus
26 Ericaceae Agapetes forrestii
27 Ericaceae Agapetes griffithii
28 Euphorbiaceae Euphorbia pulcherrima
29 Euphorbiaceae Ricinus communis
30 Fabaceae Desmodium laxiflorum
31 Hydrangeaceae Hydrangea serrata
32 Hypericaceae Hypericum hookerianum
33 Lamiaceae Plectranthus striatus
34 Melastomataceae
Melastoma malabathricum
35 Melastomataceae Oxyspora paniculata
36 Mimosaceae Acacia pennata
37 Moraceae Ficus heterophylla
38 Musaceae Musa acuminata
39 Musaceae Musa balbisiana
40 Musaceae Musa paradisiaca
41 Myrsinaceae Myrsine semiserrata
42 Oleaceae Jasminum amplexicaule
43 Piperaceae Piper clarkei
44 Piperaceae Piper griffithii
45 Poaceae Arundinaria falcata
46 Poaceae Bambusa pallida
47 Poaceae Bambusa tulda
48 Poaceae Cephalostachyum

S. No.
Family Name of Species
latifolium
49 Poaceae Chimnobambusa callosa
50 Poaceae
Dendrocalamus giganteus
51 Poaceae
Dendrocalamus
hamiltonii
52 Poaceae Dendrocalamus strictus
53 Poaceae Phragmites karka
54 Poaceae Saccharum spontaneum
55 Poaceae
Schizostachyum
capitatum
56 Poaceae
Schizostachyum
polymorphum
57 Rhamnaceae Rhamnus nepalensis
58 Rosaceae Rubus ellipticus
59 Rosaceae Rubus foliolosus
60 Rosaceae Rubus burkillii
61 Rubiaceae Luculia pinceana
62 Rutaceae Murraya paniculata
S. No.
Family Name of Species
63 Rutaceae Zanthoxylum armatum
64 Saxifragaceae Saxifraga sarmentosa
65 Solanaceae Datura suaveolens
66 Solanaceae Lycianthes rantonei
67 Solanaceae Solanum ciliatum
68 Solanaceae Solanum viarum
69 Sterculiaceae Abroma augusta
70 Thymelaeaceae Edgeworthia gardneri
71 Tiliaceae Grewia disperma
72 Tiliaceae Triumfetta bartramia
73 Urticaceae Boehmeria longifolia
74 Urticaceae Boehmeria macrophylla
75 Urticaceae Girardinia diversifolia
76 Verbenaceae Callicarpa arborea
77 Verbenaceae
Clerodendrum colebrookianum
Herbs
S.
No. Family Name of Species
1 Acanthaceae Andrographis paniculata
2 Acanthaceae Asystasia neesiana
3 Acanthaceae Justicia khasiana
4 Acanthaceae Justicia parviflora
5 Acanthaceae
Strobilanthes rhombifolius
6 Acanthaceae Thunbergia coccinea
7 Amaranthaceae Achyranthes bidentata
8 Amaranthaceae Amaranthus viridis
9 Amaranthaceae Cyathula prostrata
10 Amaranthaceae Amaranthus hybridus
11 Apiaceae Centella asiatica
12 Apiaceae Oenanthe javanica
13 Araceae Aglaonema hookerianum
14 Araceae Alocasia fallax
15 Araceae Ariopsis peltata
16 Araceae Arisaema concinnum
17 Araceae Arisaema decipiens
18 Araceae Arisaema jacquemontii
19 Araceae Arisaema nepenthoides
20 Araceae Arisaema speciosum
S. No.
Family Name of Species
21 Araceae Arisaema wallichianum
22 Araceae Colocasia forniculata
23 Araceae Lasia spinosa
24 Araceae Pothos scandens
25 Araceae Rhaphidophora decursiva
26 Asclepiadaceae Periploca calophylla
27 Asteraceae Ageratum conyzoides
28 Asteraceae Anaphalis contorta
29 Asteraceae Anaphalis busua
30 Asteraceae Artemisia indica
31 Asteraceae Artemisia maritima
32 Asteraceae Aster himalaicus
33 Asteraceae Bidens biternata
34 Asteraceae Bidens pilosa
35 Asteraceae Blumea procera
36 Asteraceae
Crassocephalum crepidioides
37 Asteraceae Erigeron bonariensis
38 Asteraceae Eupatorium odoratum
39 Asteraceae Gnaphalium affine
40 Asteraceae Gynura nepalensis
41 Asteraceae Lactuca virosa

S. No.
Family Name of Species
42 Asteraceae Senecio cappa
43 Asteraceae Siegesbeckia orientalis
44 Asteraceae Sonchus oleraceus
45 Asteraceae Spilanthes oleracea
46 Asteraceae Tagetes minuta
47 Asteraceae Mikania micrantha
48 Asteraceae Spilanthes paniculata
49 Balsaminaceae Euodia trichotoma
50 Balsaminaceae Impatiens brachycentra
51 Balsaminaceae Impatiens acuminata
52 Balsaminaceae Impatiens bicornuta
53 Balsaminaceae Impatiens racemosa
54 Basellaceae Basella alba
55 Begoniaceae Begonia griffithiana
56 Begoniaceae Begonia nepalensis
57 Begoniaceae Begonia palmata
58 Begoniaceae Begonia roxburghii
59 Boraginaceae
Cynoglossum
glochidiatum
60 Brassicaceae Cardamine hirsuta
61 Caesalpinaceae Bauhinia ovalifolia
62 Caesalpinaceae Caesalpinia spinosa
63 Campanulaceae Campanumaea parviflora
64 Campanulaceae Lobelia succulenta
65 Caryophyllaceae Cerastium cerastoides
66 Caryophyllaceae Drymaria cordata
67 Caryophyllaceae Stellaria monosperma
68 Commelinaceae Commelina appeniculata
69 Commelinaceae Commelina benghalensis
70 Commelinaceae Cyanotis cristata
71 Commelinaceae Cyanotis vaga
72 Commelinaceae Murdannia nudiflora
73 Convolvulaceae
Ipomoea fistulsa ssp. fistulosa
74 Convolvulaceae Ipomoea nil
75 Convolvulaceae Porana paniculata
76 Convolvulaceae Argyreia nervosa
77 Convolvulaceae Ipomoea batatas
78 Cucurbitaceae Solena heterophylla
79 Cucurbitaceae
Momordica
cochinchinensis
80 Cucurbitaceae Hodgsonia macrocarpa
81 Cucurbitaceae Solena amplexicaulis
S. No.
Family Name of Species
82 Cucurbitaceae Thladiatha calcarata
83 Cyperaceae Carex longipes
84 Cyperaceae Cyperus brevifolius
85 Cyperaceae Cyperus exaltatus
86 Cyperaceae Cyperus alulatus
87 Cyperaceae Cyperus rotundus
88 Cyperaceae Kyllinga brevifolia
89 Dioscoreaceae Dioscorea glabra
90 Dioscoreaceae Dioscorea pentaphylla
91 Dioscoreaceae Dioscorea belophylla
92 Dioscoreaceae Dioscorea alata
93 Ephedraceae Ephedra aspera
94 Fabaceae Mucuna bracteata
95 Fabaceae Pueraria wallichii
96 Fumariaceae Corydalis geraniifolia
97 Gentianaceae Exacum tetragonum
98 Gesneriaceae Platystoma violoides
99 Lamiaceae Clinopodium capitellatum
100 Lamiaceae Ajuga macrosperma
101 Lamiaceae Anisomeles indica
102 Lamiaceae Elsholtzia ciliata
103 Lamiaceae Leucas ciliata
104 Lamiaceae Leucas aspera
105 Lamiaceae
Pogostemon
benghalensis
106 Liliaceae
Chlorophytum tuberosum
107 Liliaceae Ophiopogon intermedius
108 Malvaceae Abutilon indicum
109 Malvaceae Sida rhombifolia
110 Malvaceae Urena lobata
111 Melastomataceae Osbeckia nutans
112 Melastomataceae Osbeckia stellata
113 Menispermaceae Cissampeos pariera
114 Menispermaceae Diploclisia glaucescens
115 Menispermaceae Stephania elegans
116 Menispermaceae Tinospora crispa
117 Mimosaceae Acacia pruinescens
118 Mimosaceae Acacia pennata
119 Mimosaceae Entada phaseoloides
120 Myrsinaceae Embelia ribes
121 Oleaceae Jasminum dispermum
122 Orchidaceae Aerides multiflora

S. No.
Family Name of Species
123 Orchidaceae Arundina graminifolia
124 Orchidaceae Bulbophyllum affine
125 Orchidaceae
Bulbophyllum careyanum
126 Orchidaceae
Bulbophyllum
cauliflorum
127 Orchidaceae Bulbophyllum guttulatum
128 Orchidaceae Calanthe griffithii
129 Orchidaceae Coelogyne barbata
130 Orchidaceae Coelogyne corymbosa
131 Orchidaceae Cymbidium aloifolium
132 Orchidaceae Cymbidium eberneum
133 Orchidaceae Cymbidium elegans
134 Orchidaceae Cymbidium cyperifolium
135 Orchidaceae Cymbidium iridioides
136 Orchidaceae Dendrobium densiflorum
137 Orchidaceae
Dendrobium hookerianum
138 Orchidaceae Dendrobium moschatum
139 Orchidaceae Dendrobium lituiflorum
140 Orchidaceae Goodyera procera
141 Orchidaceae Eria flava
142 Orchidaceae Lepanthes pedunculata
143 Orchidaceae Liparis delicatula
144 Orchidaceae Phaius flavus
145 Orchidaceae Pholidota imbricata
146 Orchidaceae Rhynchostylis retusa
147 Orchidaceae Spiranthes sinensis
148 Oxalidaceae Oxalis corniculata
149 Piperaceae Piper betle
150 Plantaginaceae Plantago erosa
151 Poaceae Cynodon dactylon
152 Poaceae Imperata cylindrica
153 Poaceae Miscanthus sinensis
154 Poaceae Molinera cuboides
155 Poaceae Poa annua
156 Poaceae Pogonatherum paniceum
157 Poaceae Themeda anathera
158 Poaceae Thysanolaena maxima
159 Polygonaceae Fagopyrum dibotrys
160 Polygonaceae Persicaria chinensis
S. No.
Family Name of Species
161 Polygonaceae Polygonum capitatum
162 Polygonaceae Polygonum flaccidum
163 Primulaceae Diploclisia glaucescens
164 Ranunculaceae Ranunculus sikkimensis
165 Ranunculaceae Coptis teeta
166 Ranunculaceae Clematis gauriana
167 Rosaceae Agrimonia pilosa
168 Rosaceae Fragaria indica
169 Rosaceae Potentilla microphylla
170 Rubiaceae Paederia foetida
171 Rubiaceae Paederia foetida
172 Scrophulariaceae Lindenbergia indica
173 Scrophulariaceae Mazus pumilus
174 Smilacaceae Smilax aspera
175 Solanaceae Nicandra physaloides
176 Solanaceae Physalis minima
177 Solanaceae Physalis peruviana
178 Solanaceae Solanum indicum
179 Solanaceae Solanum nigrum
180 Urticaceae Elatostema sessile
181 Urticaceae Pilea scripta
182 Urticaceae Pouzolzia fulgens
183 Urticaceae Pouzolzia glaberrima
184 Urticaceae Urtica dioica
185 Verbenaceae
Clerodendrum colebrookianum
186 Violaceae Viola betonicifolia
187 Violaceae Viola diffusa
188 Violaceae Viola hediniana
189 Vitaceae Vitis flexuosa
190 Zingiberaceae Acorus calamus
191 Zingiberaceae Alpinia allughas
192 Zingiberaceae Alpinia zerumbet
193 Zingiberaceae Curcuma montana
194 Zingiberaceae Globba clarkei
195 Zingiberaceae Hedychium densiflorum
196 Zingiberaceae
Hedychium longipedunculatum
197 Zingiberaceae Hedychium spicatum
198 Zingiberaceae Phrynium pubinerve

II. GYMNOSPERMS
S. No. Family Name of species
1 Cupressaceae Cupressus torulosa
2 Gnetaceae Gnetum montanum
3 Pinaceae Abies densa
4 Pinaceae Pinus wallichiana
5 Pinaceae Tsuga dumosa
6 Pinaceae Pinus merkusii
7 Taxaceae Cephalotaxus griffithii
III. PTERIDOPHYTES
S. No.
Family Botanical Name
1 Adiantaceae Adiantum caudatum
2 Adiantaceae Adiantum philippense
3 Angiopteridaceae Angiopteris evecta
4 Polypodiaceae Arthromeris wallichiana
5 Aspleniaceae Asplenium nidus
6 Cyatheaceae Cyathea gigantea
7 Cyatheaceae Cyathea spinulosa
8 Gleichiaceae Dicranopteris linearis
9 Athyriaceae Diplazium bentamense
10 Polypodiaceae Drymoglossum heterophyllum
11 Athyriaceae Dryoathyrium
boryanum
12 Equisetaceae
Equisetum ramossimum
13 Gleicheniaceae Gleichenia longissima
14 Polypodiaceae Lepisorus excavata
S. No.
Family Botanical Name
15 Polypodiaceae Lepisorus sordidus
16 Polypodiaceae Lepisorus nudus
17 Lycopodiaceae Lycopodium clavatum
18 Polypodiaceae
Microsorum membranaceum
19 Polypodiaceae Microsorum punctctum
20 Polypodiaceae Microsorum pteropus
21 Nephrolepdaceae Nephrolepis cordifolia
22 Cryptogrammaceae Onychium siliculosum
23 Polypodiaceae Polypodium amoenum
24 Aspidiaceae Polystichum aculeatum
25 Thelypteridaceae
Pronephrium affine
26 Hypoleppidaceae Pteridium aquilinum
27 Pteridaceae Pteris quadriaurita
28 Pteridaceae Pteris vittata
29 Selaginellaceae Selaginella indica
IV. BRYOPHYTES S. No. Family Botanical name
1 Anthocerotaceae Anthoceros sp.
2 Funariaceae Funaria hygromerica
3 Leucodontaceae Leucodon sp.
4 Marchantiaceae Marchantia palmata
5 Marchantiaceae Marchantia
polymorpha
S. No. Family Botanical name
6 Pelliaceae Pellia scripta
7 Polytrichaceae Polytrichum commune
8 Polytrichaceae Atrichum undulatum
9 Polytrichaceae Pogonatum inflexum
10 Ricciaceae Riccia fluitans
11 Sphagnaceae Sphagnum strictum

V. LICHENS
S.
No.
Family
Species
1 Coccocarpaceae Coccocapia sp.
2 Collemataceae Leptogium sp.
3 Cryptotheciaceae Cyptothecia sp.
4 Graphidaceae Phaeographina sp.
5 Letrouitiaceae Letrouitia sp.
6 Parmeliaceae Parmelina wallichaina.
7 Physciaceae Physcia sp.
S.
No.
Family
Species
8 Pilocarpaceae Byssolma sp.
9 Pyrenulaceae Anthracothecium sp.
10 Rhizocarpaceae Rhizocarpon sp.
11 Teloschistaceae Brigantiaea sp.
12 Thelotremataceae Diplochistes sp.
13 Usneaceae Bryonia sp.
14 Usneaceae Usnea baileyi
VI. MACRO-FUNGI
S. No. Family Botanical name
1 Agariceae Agaricus campestris
2 Dacrymycetaceae Calocera viscosa
3 Hymenochaetaceae Hymenochaete rubiginosa
4 Polyporaceae Polyporussquamosus
5 Tricholomataceae Armillaria tabescens
6 Xylariaceae Daldinia concentrica
VII. ALGAE
S. No. Family Botanical Names
1 Characeae Chara sp.
2 Chlamydomonadaceae Chlamydomonas sp.
3 Hydrodictyaceae Hydrodictyon sp.
4 Nostocaceae Anabaena sp.
5 Nostocaceae Nostoc sp.
6 Oedogoniaceae Oedogonium sp.
7 Sargassaceae Sargassum sp.
8 Vaucheriaceae Vaucheria sp.
9 Zygnemataceae Spirogyra sp.
10 Zygnemataceae Zygnema sp.

Environmental Impact Assessment (EIA) Report of Etalin HE Project
Proponent: M/s Etalin Hydro Electric Power Company Limited (EHEPCL) i
Consultant: RS Envirolink Technologies Pvt. Ltd.
PHOTOGRAPHS

Environmental Impact Assessment (EIA) Report of Etalin HE Project
Proponent: M/s Etalin Hydro Electric Power Company Limited (EHEPCL) ii
Consultant: RS Envirolink Technologies Pvt. Ltd.
Dri Limb Dam Site on Dri River
Tangon Limb Dam Site on Tangon River

Environmental Impact Assessment (EIA) Report of Etalin HE Project
Proponent: M/s Etalin Hydro Electric Power Company Limited (EHEPCL) iii
Consultant: RS Envirolink Technologies Pvt. Ltd.
Catchment Area of Dri River along Dri Limb
Catchment Area of Tangon River along Tangon Limb
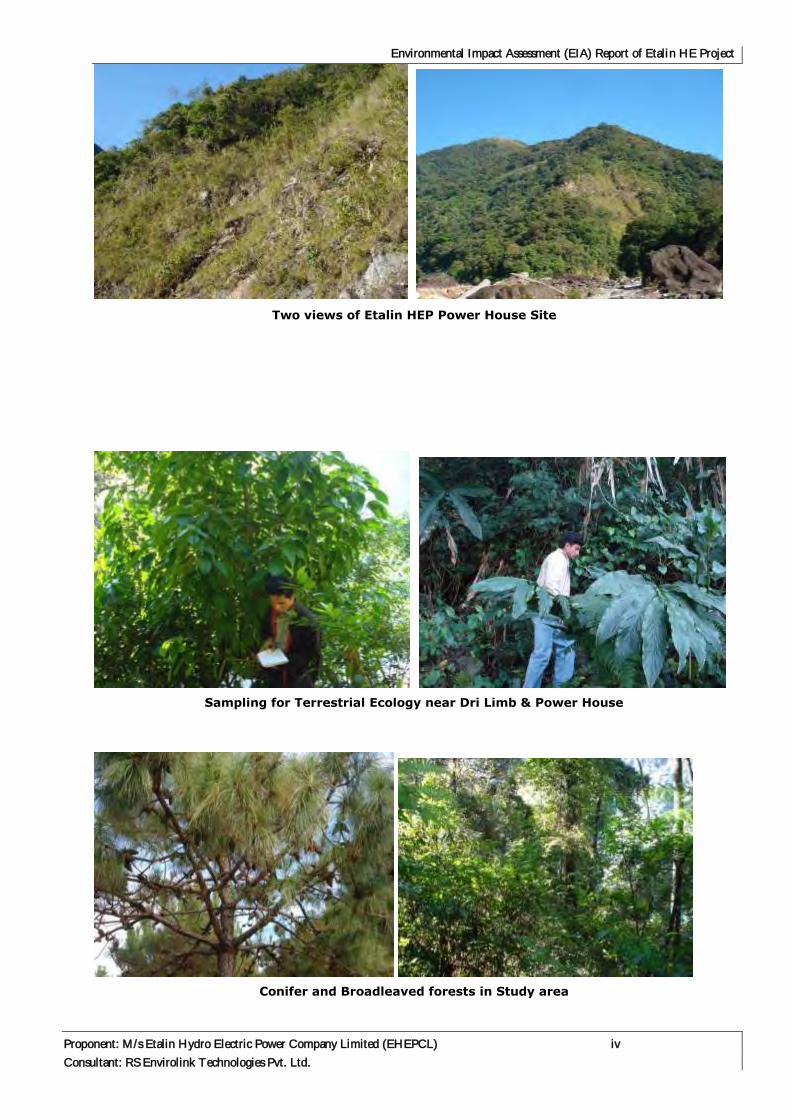
Environmental Impact Assessment (EIA) Report of Etalin HE Project
Proponent: M/s Etalin Hydro Electric Power Company Limited (EHEPCL) iv
Consultant: RS Envirolink Technologies Pvt. Ltd.
Two views of Etalin HEP Power House Site
Sampling for Terrestrial Ecology near Dri Limb & Power House
Conifer and Broadleaved forests in Study area

Environmental Impact Assessment (EIA) Report of Etalin HE Project
Proponent: M/s Etalin Hydro Electric Power Company Limited (EHEPCL) v
Consultant: RS Envirolink Technologies Pvt. Ltd.
Jhummed slopes and Ground vegetation in forests in Study area
Viola sp. Gaultheria sp.
Clematis sp. Rubus ellipticus

Environmental Impact Assessment (EIA) Report of Etalin HE Project
Proponent: M/s Etalin Hydro Electric Power Company Limited (EHEPCL) vi
Consultant: RS Envirolink Technologies Pvt. Ltd.
Pteridophyte Marchantia polymorpha
Lichens
Fungi

Environmental Impact Assessment (EIA) Report of Etalin HE Project
Proponent: M/s Etalin Hydro Electric Power Company Limited (EHEPCL) vii
Consultant: RS Envirolink Technologies Pvt. Ltd.
Trophy of Tahr
Mithun
Scanning for birds during surveys

Environmental Impact Assessment (EIA) Report of Etalin HE Project
Proponent: M/s Etalin Hydro Electric Power Company Limited (EHEPCL) viii
Consultant: RS Envirolink Technologies Pvt. Ltd.
Red Whiskered Bulbul near Etalin village Red Headed Trogon
BUTTERFLIES
Indian Cabbage White Orange Oakleaf
Common Cerulean Common Hedge Blue

Environmental Impact Assessment (EIA) Report of Etalin HE Project
Proponent: M/s Etalin Hydro Electric Power Company Limited (EHEPCL) ix
Consultant: RS Envirolink Technologies Pvt. Ltd.
INSECTS
Bug Beetle
AQUATIC ECOLOGY
Water Sampling in Dri river at Dam Site of Dri Limb
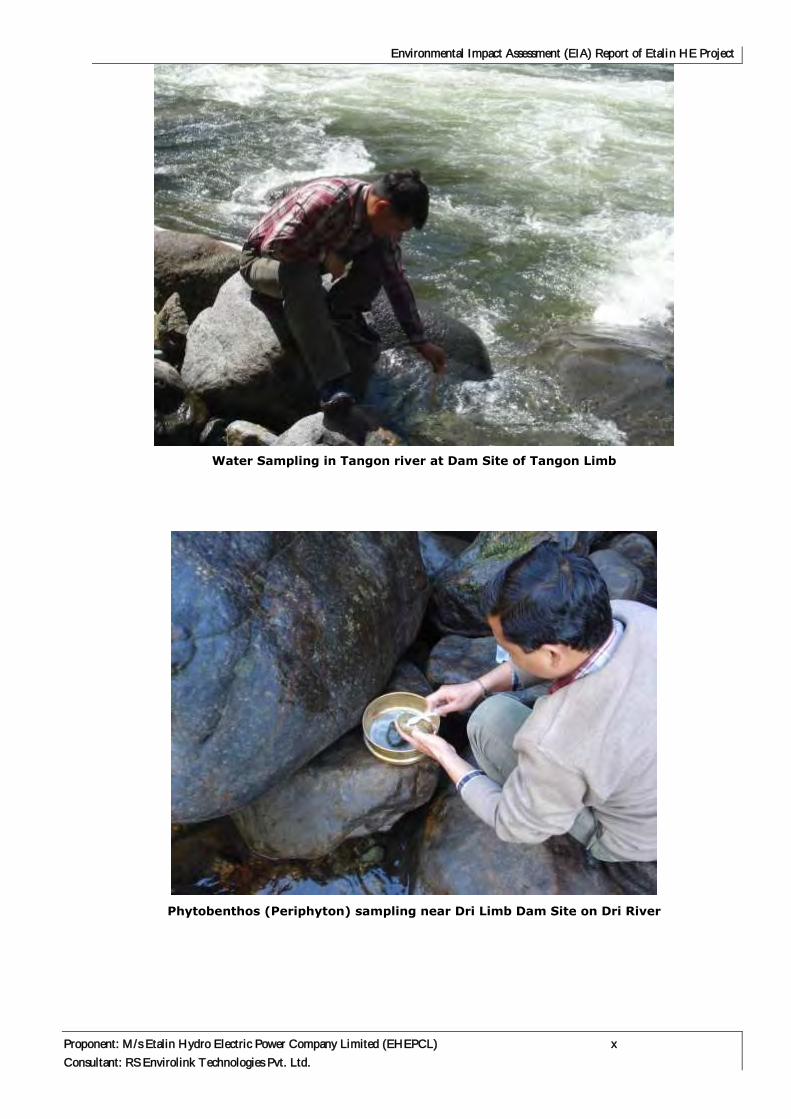
Environmental Impact Assessment (EIA) Report of Etalin HE Project
Proponent: M/s Etalin Hydro Electric Power Company Limited (EHEPCL) x
Consultant: RS Envirolink Technologies Pvt. Ltd.
Water Sampling in Tangon river at Dam Site of Tangon Limb
Phytobenthos (Periphyton) sampling near Dri Limb Dam Site on Dri River

Environmental Impact Assessment (EIA) Report of Etalin HE Project
Proponent: M/s Etalin Hydro Electric Power Company Limited (EHEPCL) xi
Consultant: RS Envirolink Technologies Pvt. Ltd.
Water sampling in of downstream of Power House Site
Experimental fishing in Dri River
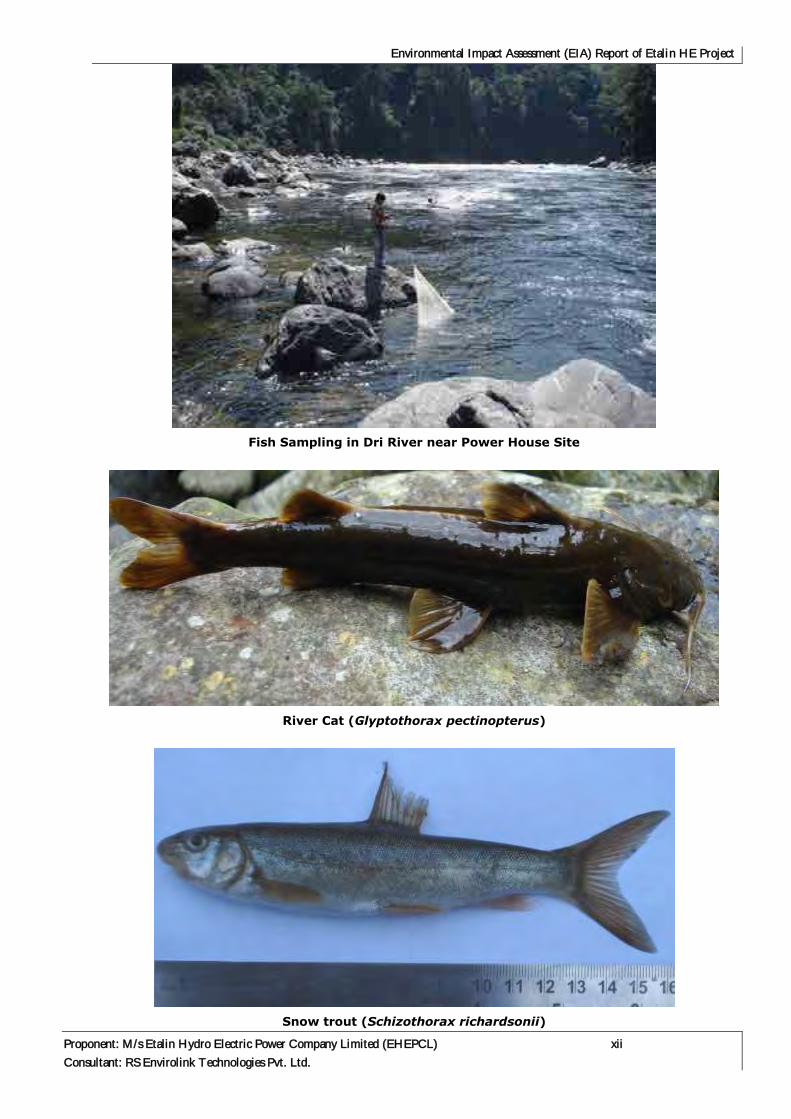
Environmental Impact Assessment (EIA) Report of Etalin HE Project
Proponent: M/s Etalin Hydro Electric Power Company Limited (EHEPCL) xii
Consultant: RS Envirolink Technologies Pvt. Ltd.
Fish Sampling in Dri River near Power House Site
River Cat (Glyptothorax pectinopterus)
Snow trout (Schizothorax richardsonii)

References
Ali, S. and Ripley, S.D. 1983. Handbook of birds of India and Pakistan. Oxford (Delhi & New York).
APHA, Standard methods for the examination of water and wastewater, 18th ed. Washington,
DC:American Public Health Association, 1992
Bagra K., Kadu K., Nebeshwar K., Sharma, Laskar B. A., Sarkar U. K. and Das D. N. 2009. Ichthyological
survey and review of the checklist of fish fauna of Arunachal Pradesh, India. Check List 5(2):
330–350.
Bagra K.,Laskar B.A. and Das D.N. 2009. Dimorphic Morphological Features between Sexes of
Semiplotus semiplotus McClelland. Our Nature, 7:158-162.
Battish, S.K. 1992. Fresh Water Zooplankton of India. Oxford and IBH Publications.
BirdLife International (2001) Threatened Birds of Asia: The BirdLife International Red Data Book.
BirdLife International, Cambridge, U.K.
Champion, H.G. and Seth, S.K. 1968. A revised survey of the forest types of India. Manager of
Publications, New Delhi. Govt. of India
Curtis, J. T., McIntosh R. P. 1950. The interrelations of certain analytic and synthetic
photosociological characters. Ecology 31: 434-455.
Edington J.M, Hildrew A.G, (1995) A revised key to the caseless caddids larvae of the British Isles. With
Notes on Their Ecology. Freshwat. Biol. Assoc., 1-135
Edmondson, W.T. 1959. Freshwater Biology. John Wiley & Sons, New York
Fleming, R. L. 2006. Notes on some Butterflies and Natural History of the Siang Valley, Arunachal
Pradesh, India.
Gandhi, H. P. 1998. Freshwater diatoms of Central Gujarat – With a review and some others. Bishen
Singh Mahendra Pal, Dehradun.
Grewal, B., Harvey B. and Pfister O. 2002. A photographic Guide to The Birds of India. Periplus Editions
(HK) Ltd. Singapore, pp 512.
Grimmett, R., C. Inskipp and T. Inskipp. 1998. Birds of the Indian Subcontinent. London: Oxford
University Press. 384 p.Grimmett, R., C. Inskipp and T. Inskipp. 2011. Birds of the Indian
Subcontinent. London: Oxford University Press. 528 p.
Hustedt, F. 1943. Die Diatomeenflora einiger Hochgebirgsseen der Landschaft Davos in den schweizer
Alpen. Internationale Revue der gesamten Hydrobiologie und Hydrographie 43: 124-197, 225-
280.
Jayaram, K. C. 1981. The freshwater fishes of India, Pakistan, Bangladesh, Burma and Sri Lanka.
Handbook Zoological Survey of India. No. 2: 475.
Hustedt, F. and Jensen, N. G. 1985. The Pennate Diatoms. Koeltz Scientific Books, Koenigstein. 918
pp.
Kazmierczak, K. and B. van Perlo. 2000. A field guide to the birds of India, Sri Lanka, Pakistan, Nepal,
Bhutan, Bangladesh and the Maldives. Sussex: Pica Press.
Kaul, R.N. and Haridasan, K. 1987. Forest types of Arunachal Pradesh – A preliminary study. Journal of
Economic and Taxonomic Botany 9(2): 379-388.
Kehmikar I., (2008): The book of Indian Butterflies, Bombay Natiral History Society; oxford University
press, New Delhi.
Krammer, K. & Lange-Bertalot, H. (1985). Naviculaceae. Bibliotheca Diatomologia 9: 1-230.
Krammer, K. & Lange-Bertalot, H. (1986). Die Süßwasserflora von Mitteleuropa 2: Bacillariophyceae 1
Teil: Naviculaceae. pp. 876. Stuttgart & Jena: Gustav Fischer
Krammer, K., Lange-Bertalot H. 1986. Süßwasserflora von Mitteleuropa. Band 2. Bacillariophyceae.
Teil 1. Naviculaceae. Gustav Fischer Verlag, Stuttgart.
Krammer, K., Lange-Bertalot, H. 1991. Süßwasserflora von Mitteleuropa. Band 2. Bacillariophyceae.
Teil 3. Centrales, Fragilariaceae, Eunotiaceae. Gustav Fischer Verlag, Stuttgart.
Krammer, K., Lange-Bertalot, H. 2000, Süßwasserflora von Mitteleuropa. Band 2/5. Bacillariophyceae.
Part 5. English and French Translation of the Keys. Gustav Fischer Verlag, Stuttgart.
Krammer, K. (2000). Diatoms of Europe. Diatoms of the European Inland Waters and Comparable
Habitats. Volume 1. The genus Pinnularia. pp. 703, 217 Plates.: H. Lange-Bertalot (Ed.). ARG
Gantner Verlag K.G
Macan, T. T. 1979. A key to the nymphs of the British species of Ephemeroptera with notes on their
ecology. Scient. Pubis Freshwat. biol. Ass. No. 20: 1-80.
Martin, P. & Bateson P. 1993. Measuring behaviour. An introductory guide. 2. ed.Cambridge University
Press.
Metzeltin, D. & Lange-Bertalot, H. 2005. Diatoms of Uruguay. Compared with other taxa from South
America and elsewhere. In: Lange-Bertalot, H. (Ed.). Iconografia Diatomologica 15:1-736.
Metzeltin, D. and Lange-Bertalot, H. 2003. "2002": Diatoms from the "Island Continent" Madagascar –
Iconogr. Diatomol. 11:1-286.
Metzeltin, D., Lange–Bertalot, H. and Garcia–Rodriguez, F. 2005: Diatoms of Uruguay compared with
other taxa from South America and elsewhere. – Iconographia Diatomologica 15: 1–736.
Mishra, R. 1968. Ecology Work Book. Oxford & IBH Publication, New Delhi.
Nautiyal, R. and Nautiyal, P. 1999. Altitudinal variations in the pennate diatom flora of the Alaknanda-
Ganga river system in the Himalayan stretch of Garhwal region. Pages 85-100, In: Proceedings
of Fourteenth International Diatom Symposium (S. Mayama, M. Idei and I. Koizumi, eds.),
Koeltz Scientific Books, Koenigstein.
Nath, P. and S. C. Dey. 2000. Fish and fisheries of North Eastern India (Arunachal Pradesh). New Delhi.
Narendra Publishing House. 217 p.
Pennak, R. W. 1953. Freshwater Invertebrates of United States (2nd edition). John Willey & Sons, New
York.
Prasad, B. N. Misra, P. K. 1992. Freshwater Algal Flora of Andaman & Nicobar Islands. Bishen Singh
Mahendra Pal, Dehradun.

Prater, S.H. 1980. The Book of Indian animals. Third ed. Bombay Natural History Society. Bombay, 428
pp.
Rao, R.R. & Hajra, P.K. 1986. Floristic diversity of Eastern Himalaya- in a conservation perspective.
Proc. Ind. Sci. (Anim. Sci. / Plant Sci.) Suppl. (November). Pp. 103 –125.
Sanyal, D.P. and Gayen, N.C. 2006. Reptilia. In: Fauna of Arunachal Pradesh, State Fauna Series, 13
(1), 247-284. Zool. Surv. India
Sarkar, A.K. and Ray, S. 2006. Amphibia. In: Fauna of Arunachal Pradesh, State Fauna Series, 13 (1),
285-316. Zool. Surv. India.
Sarode PT and Kamat ND, 1984. Fresh water diatoms from Maharashtra. Saikripa Prakashan, Auran
gabad
Shannon CE and W. Wiener (1963). The Mathematical Theory of Communication. University of Illinois
Press, Urbana, IL, USA, pp. 117.
Talwar, P. K. and A. G. Jhingran. 1991. Inland fishes of the India and adjacent countries. New Delhi.
Oxford and IBH publishing co. 541 p.
Ward, H. B. and G. C. Whipple. 1959. Freshwater Biology, Second Edition. Wiley and Sons, Inc. New
York. Pg 589-592, 594-596
WPA (Wildlife Protection Act). 1972. Wildlife Protection Act of India; Amendment Act, 2002
(http://www.nethan-valley.co.uk/insectgroups.doc).