Embed Size (px)
Citation preview
Carbon Footprint and environmental impact of Railway In-frastructure
Matthias Tuchschmid
Heidelberg – Zürich – Berlin
04.11.2011
Authors: Matthias Tuchschmid Wolfram Knörr (IFEU) Alexander Schacht (IFEU) Moritz Mottschall (Öko-Institut) Martin Schmied (Öko-Institut)
commissioned by International Union of Railways (UIC
Matthias Tuchschmid Fellenbergweg 14 CH-8057 Zürich [email protected] IFEU-Institut Wilckensstraße 3 D-69120 Heidelberg Tel.+49 (0) 6221-4767-0 Fax+49 (0) 6221-4767-19 www.ifeu.de Öko-Institut e.V. Büro Berlin Schicklerstr. 5-7 D-10179 Berlin Tel. +49 (0) 30 – 40 50 85-380 Fax +49 (0) 30 – 40 50 85-388 www.oeko.de
Öko-Institut e.V. Matthias Tuchschmid IFEU Heidelberg
Carbon footprint of railway infrastructure –20.10.2011 II
Content:
List of figures ............................................................................................ V
List of tables ............................................................................................ VI
List of abbreviations ............................................................................. VIII
1 Introduction ............................................................................... 1
1.1 Goals & Scope ............................................................................................ 1
1.2 Structure of report ........................................................................................ 2
2 Literature review ....................................................................... 3
3 Methodology for assessment of rail infrastructure ............... 5
3.1 Indicators ..................................................................................................... 5 3.1.1 Primary energy ............................................................................................ 5 3.1.2 CO2 as an indicator of greenhouse gas potential ......................................... 6
3.1.3 Particulate matter: PM10 und PM2.5 .............................................................. 6 3.1.4 Non-methane volatile organic compounds: NMVOC .................................... 6 3.1.5 Nitrogen oxides: NOx ................................................................................... 7 3.2 Modeling principles ...................................................................................... 8 3.2.1 Modeling Approach ...................................................................................... 8 3.2.2 System Boundaries ..................................................................................... 8 3.2.3 Lifespan of considered elements ................................................................. 9 3.2.4 Modelling the impact of rail infrastructure................................................... 10 3.2.5 Modelling the impact of rolling stock .......................................................... 13 3.2.6 Modelling the impact of train operation ...................................................... 14 3.2.7 Modelling transport services ...................................................................... 15 3.2.8 Transport on different networks, e.g. local trains........................................ 15
3.2.9 Considerations .......................................................................................... 15 3.3 Data sources & Impact factors ................................................................... 17
4 Assessing the rail infrastructure........................................... 18
4.1 Construction and maintenance of tracks .................................................... 18 4.1.1 Earthwork .................................................................................................. 19 4.1.2 Bridges: viaduct, concrete bridge over a road and iron bridge ................... 20 4.1.3 Tunnel: mining and open-pit procedure ..................................................... 21 4.1.4 Sleeper & Ballast: concrete, wood, iron and closed lane............................ 23
IFEU Heidelberg Matthias Tuchschmid Öko-Institut e.V.
III
4.1.5 Rail: UIC 60, S54 and S49 ......................................................................... 24
4.1.6 Mast, catenaries and overhead wiring........................................................ 25 4.1.7 Signalisation & communication .................................................................. 26 4.1.8 Construction and maintenance of relevant buildings .................................. 27 4.2 Construction and maintenance of trains ..................................................... 28 4.3 Train operation and energy provision for building....................................... 29
5 Relevance of rail infrastructure in several European countries ................................................................ 30
5.1 Embedded Calculator / Online-Calculator .................................................. 30 5.2 Country specific networks .......................................................................... 31 5.2.1 Germany .................................................................................................... 31 5.2.2 Switzerland ................................................................................................ 34 5.2.3 France ....................................................................................................... 36 5.2.4 Italy ............................................................................................................ 37 5.2.5 Spain ......................................................................................................... 38 5.2.6 Norway ...................................................................................................... 39 5.2.7 Belgium ..................................................................................................... 40 5.2.8 Japan......................................................................................................... 41
5.2.9 India........................................................................................................... 42 5.3 Overview and Comparison ......................................................................... 43 5.3.1 Carbon Footprint of rail infrastructure per km of line. ................................. 43 5.3.2 Carbon Footprint of rail infrastructure per pkm ........................................... 43 5.3.3 Carbon footprint of rolling stock ................................................................. 44 5.3.4 Carbon footprint of Operation .................................................................... 44
6 Summary & Recommendations ............................................. 45
6.1 Share of rail infrastructure .......................................................................... 45 6.2 UIC-Tools “EcoPassenger” & “EcoTransIT” and the infrastructure ............. 47
7 Literature & References ......................................................... 49
7.1 Literature ................................................................................................... 49 7.2 Picture Credits ........................................................................................... 51
7.3 Literature Review ....................................................................................... 53 7.3.1 Overview ................................................................................................... 53 7.3.2 Description of sources ............................................................................... 55
Öko-Institut e.V. Matthias Tuchschmid IFEU Heidelberg
Carbon footprint of railway infrastructure –20.10.2011 IV
8 Annex ....................................................................................... 77
8.1 Further Data sources ................................................................................. 77 8.2 Questionnaire ............................................................................................ 78
IFEU Heidelberg Matthias Tuchschmid Öko-Institut e.V.
V
List of figures
Figure 1.1 Scheme of relevant processes for rail transport....................................... 2 Figure 3.1 Impact calculation of the rail infrastructure ............................................ 12 Figure 3.2 Impact calculation of the rolling stock .................................................... 13 Figure 3.3: Impact calculation of the operation ............................................................. 14 Figure 4.1: Scheme of rail track .............................................................................. 18 Figure 4.2: Earthwork as precondition for the track construction ............................. 19 Figure 4.3: Assessed types of rail bridges: viaducts, smaller bridges and iron
bridges .................................................................................................. 20 Figure 4.4: Assessed types of tunnels: mining and open pit tunnels........................ 21 Figure 4.5: Assessed types of sleepers: concrete sleepers, wooden sleepers,
iron sleepers and closed lane ................................................................ 23
Figure 4.6: Assessed types of rails: UIC60, S54 and S49 ....................................... 24 Figure 4.7: Assessed types of overhead system: Mast, Catenary and overhead
wiring .................................................................................................... 25 Figure 4.8: Assessed types of signalization and communication ............................. 26 Figure 4.9: Assessed types of buildings: concrete sleepers, wooden sleepers,
iron sleepers and closed lane ................................................................ 27 Figure 4.10: Assessed types of trains: Regional trains, intercity trains and freight
trains ..................................................................................................... 28 Figure 4.11: Assessed types of energy: electricity, Natural Gas and oil .................... 29 Figure 5.1 30 Figure 5.2: Online Calculator for the determination of the environmental impact
of railway infrastructure ......................................................................... 31
Figure 5.3: Carbon Footprint per km of line and year .............................................. 43 Figure 5.4: Carbon Footprint per passenger kilometre ............................................ 44 Figure 5.5: Carbon Footprint of the train operation in selected countries ................. 44 Figure 6.1: Carbon Footprint of rail transport in selected countries.......................... 45 Figure 8.1: Overview of the Questionnaire .............................................................. 78 Figure 8.2: Questionnaire for the determination of bridges & tunnels ...................... 79

Öko-Institut e.V. Matthias Tuchschmid IFEU Heidelberg
Carbon footprint of railway infrastructure –20.10.2011 VI
List of tables
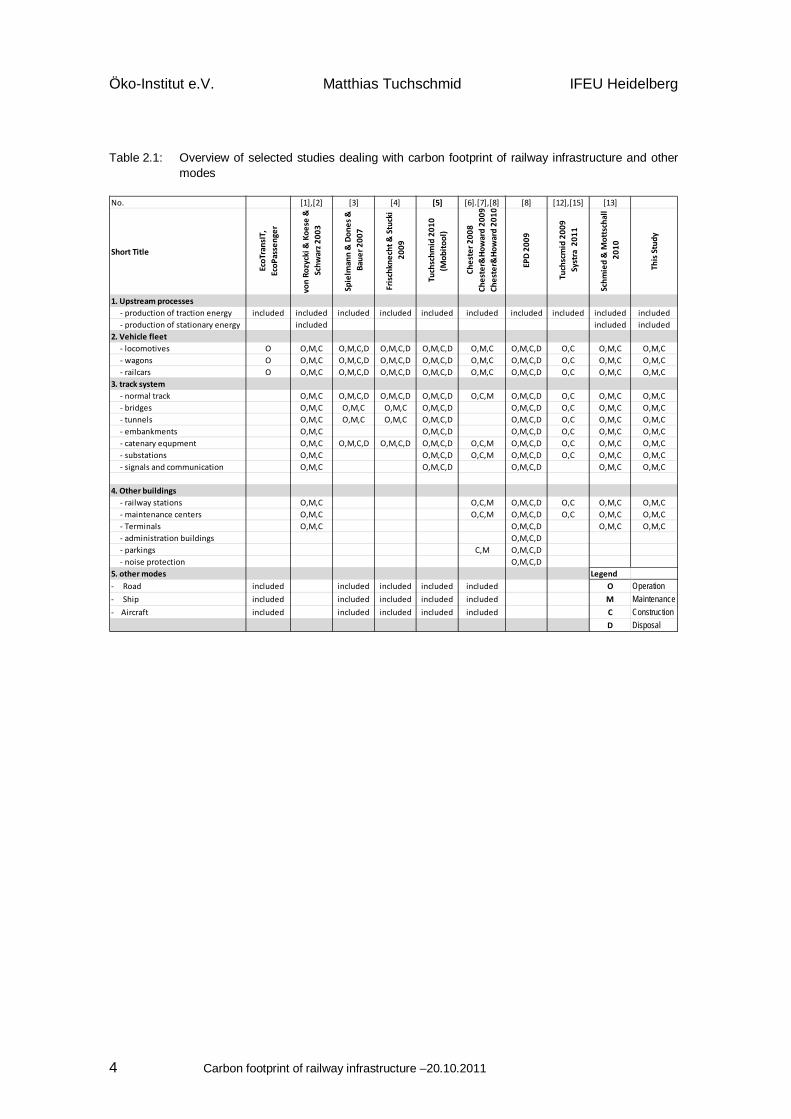
Table 2.1: Overview of selected studies dealing with carbon footprint of railway infrastructure and other modes.................................................... 4
Table 3.1: Considered lifespan of the assessed elements ..................................... 10 Table 3.2: Selected emission factors from Ecoinvent v2.2 ..................................... 17 Table 4.1: Impact from the earthwork per km and year .......................................... 19 Table 4.2: Impact of bridges per km and year ........................................................ 20 Table 4.3: Impact of tunnels per km and year ........................................................ 21 Table 4.4: Sensitivity analysis of steel production with other electricity mixes ........ 22 Table 4.5: Impact of sleeper and ballast per km and year ...................................... 23 Table 4.6: Impact of rail per km and year ............................................................... 24 Table 4.7: Impact of mast, catenary and overhead wiring per km and year ............ 25
Table 4.8: Impact of Signals and communication per km and year ........................ 26 Table 4.9: Impact from the construction and maintenance of railway buildings,
per unit and year ................................................................................... 27 Table 4.10: Impact from the construction and maintenance of trains, per unit
and year ................................................................................................ 28 Table 4.11: Impact from the construction and maintenance of trains, per Gtkm
passenger train ..................................................................................... 28 Table 4.12: Impact from the energy provision per kWh used energy ........................ 29 Table 5.1: Data for Germany ................................................................................. 32 Table 5.2: Carbon Footprint of Rail in Germany ..................................................... 32 Table 5.3: Bottom up vs. Top-down: Example of a rail network .............................. 33 Table 5.4: Data for Switzerland .............................................................................. 34 Table 5.5 Carbon Footprint of Rail in Switzerland ................................................. 34 Table 5.6: Carbon footprint of rail in Switzerland with a lifespan of building and
civil engineering constructions of 100 years instead of 60 years ........... 35 Table 5.7: Data for France ..................................................................................... 36 Table 5.8: Carbon Footprint of Rail in France ........................................................ 36 Table 5.9: Data for Italy ......................................................................................... 37 Table 5.10: Carbon Footprint of Rail in Italy ............................................................. 37 Table 5.11: Data for Spain ....................................................................................... 38 Table 5.12: Carbon Footprint of Rail in Spain .......................................................... 38 Table 5.13: Data for Norway .................................................................................... 39 Table 5.14: Carbon Footprint of Rail in Norway ....................................................... 39 Table 5.15: Data for Norway .................................................................................... 40
Table 5.16: Carbon Footprint of Rail in Norway ....................................................... 40
IFEU Heidelberg Matthias Tuchschmid Öko-Institut e.V.
VII
Table 5.17: Data for Japan ...................................................................................... 41
Table 5.18: Carbon Footprint of Rail in Japan .......................................................... 41 Table 5.19: Data for India ........................................................................................ 42 Table 5.20: Carbon Footprint of Rail in India ............................................................ 42
Öko-Institut e.V. Matthias Tuchschmid IFEU Heidelberg
Carbon footprint of railway infrastructure –20.10.2011 VIII
List of abbreviations
Abbr. Explanation
CH4 methane
CO carbon monoxide
CO2 carbon dioxide
EU European Union
EPD Environmental Product Declarations
g gram
GHG greenhouse gas
GWP Global Warming Potential
HDPE High Density Polyethylen
HSR high-speed rail
ICE Inter City Express
IPCC International Panel on Climate Change
ISO International Organization for Standardization
Kg kilogram
km/h kilometre per hour
kWh kilowatt-hour
N2O nitrous oxide (laughing gas or sweet air)
NMVOC non-methane volatile organic compounds
NOx nitrogen oxide
pkm passenger-kilometres
PCR Product Category Rules
PM10 particulate matter
PVC Polyvinylchlorid
SF6 sulphur hexafluoride
SO2 sulphur dioxide
TGV Train á Grande Vitesse
tkm tonne-kilometres
UIC Union Internationale des Chemins de fer
IFEU Heidelberg Matthias Tuchschmid Öko-Institut e.V.
1
1 Introduction
Comprehensive tools for the comparison of the environmental impact of different trans-port modes have been developed. The International Union of Railways UIC has worked out two tools: “EcoTransIT” for freight- and “EcoPassenger” for passenger transport. Both on-line calculators focus on the operation of vehicles and take the upstream emis-sions from energy supply into account. Infrastructure such as track system or the pro-duction of vehicles (see Figure 1.1) is excluded. Especially within large rail projects, policy makers and the public wondered if the share of track and vehicles construction is significant. Relevant issues are: What is the carbon footprint of the construction of viaducts and tunnels? What is the environmental impact of transport network density, rail utilization num-
bers, and composition of the electricity mix in proportion to the carbon footprint of the infrastructure?
Does the inclusion of infrastructure (tracks, vehicles) significantly change the rela-tion of greenhouse gas emissions between road and rail?
1.1 Goals & Scope
The purpose of the study is: to develop a methodology and a calculation tool in order to determine the carbon
footprint and the environmental impact for railway infrastructure, based on a comprehensible and easily applicable methodology,
to identify and collect data needed to determine the carbon footprint of railway infrastructure of different European countries,
to determine the carbon footprint of infrastructure for selected countries compared to the total impact of railway transport (operation and infrastructure).
Öko-Institut e.V. Matthias Tuchschmid IFEU Heidelberg
Carbon footprint of railway infrastructure –20.10.2011 2
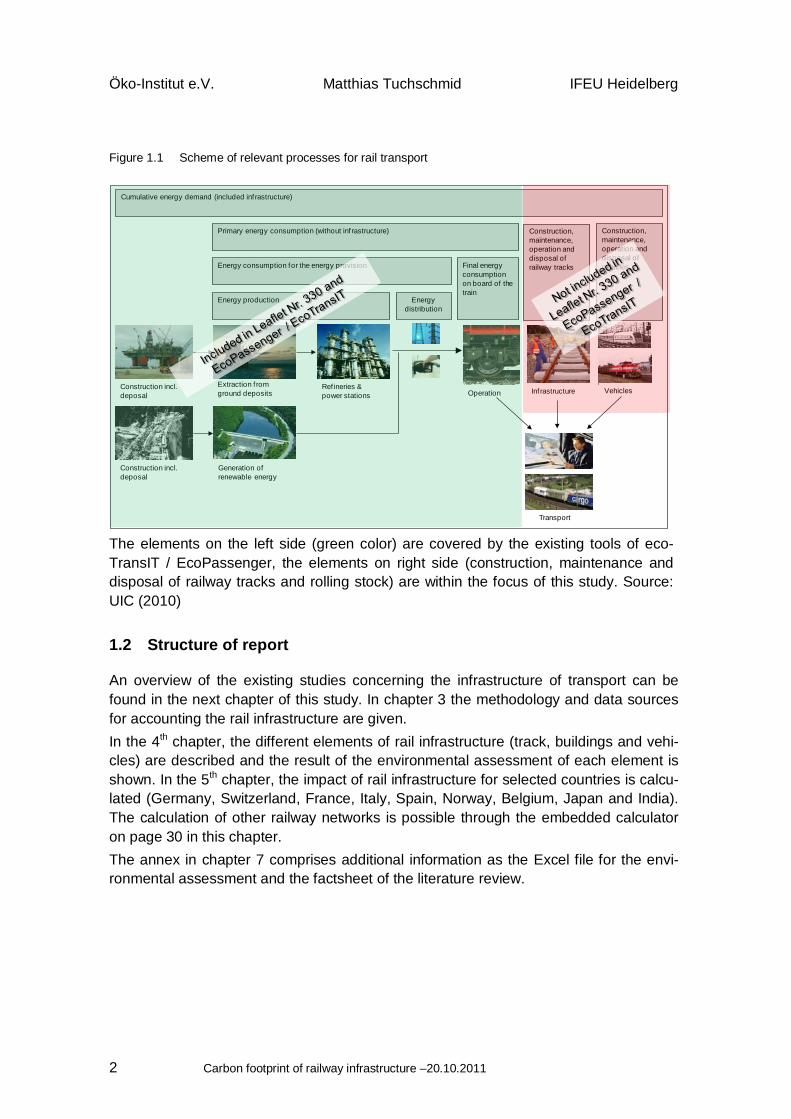
Figure 1.1 Scheme of relevant processes for rail transport
Cumulative energy demand (included inf rastructure)
Primary energy consumption (without inf rastructure)
Energy consumption for the energy provision
Energy production Energy distribution
Extraction f rom ground deposits
Ref ineries & power stations
Construction incl. deposal
Construction incl. deposal
Generation of renewable energy
Construction, maintenance, operation and disposal of railway tracks
Inf rastructure
Construction, maintenance, operation and disposal of vehicles
Vehicles
Final energy consumption on board of the train
Operation
Transport The elements on the left side (green color) are covered by the existing tools of eco-TransIT / EcoPassenger, the elements on right side (construction, maintenance and disposal of railway tracks and rolling stock) are within the focus of this study. Source: UIC (2010)
1.2 Structure of report
An overview of the existing studies concerning the infrastructure of transport can be found in the next chapter of this study. In chapter 3 the methodology and data sources for accounting the rail infrastructure are given. In the 4th chapter, the different elements of rail infrastructure (track, buildings and vehi-cles) are described and the result of the environmental assessment of each element is shown. In the 5th chapter, the impact of rail infrastructure for selected countries is calcu-lated (Germany, Switzerland, France, Italy, Spain, Norway, Belgium, Japan and India). The calculation of other railway networks is possible through the embedded calculator on page 30 in this chapter. The annex in chapter 7 comprises additional information as the Excel file for the envi-ronmental assessment and the factsheet of the literature review.
IFEU Heidelberg Matthias Tuchschmid Öko-Institut e.V.
3
2 Literature review
Several studies concerning infrastructure of transport modes have been published re-cently. The following literature has been analysed for this study: High Speed Rail (Germany)
by Rozycki, Koeser & Schwarz (2003); Uni Halle (2002) Ecoinvent: Sources & Compilations (Switzerland)
Spielmann, Dones & Bauer (2007); Tuchschmid & Halder (2010); Frischknecht & Stucki (2009)
Environmental Inventory of Passenger Transportation (USA) Chester (2008); Chester & Howarth (2009), Chester & Howarth (2010)
Product Category Rules for Railways (Sweden) EPD (2009); EPD (2010)
Whole Carbon Footprint of Railways (Great Britain & Germany) RSSB (2010); Schmied & Mottschall (2010)
Carbon Footprint of High Speed Transport (France & California) Tuchschmid (2010); SNCF & Ademe (2009); UIC (2011); Chang & Kendall (2011)
various Kendall, Harvey & Lee (2009); Keoleian et al. (2005); EPD (2011); Stripple (2001) Loffredo & Fedele & Severini (2011); Zimmer et al. (2009)
Each study was analysed and is described in a structured table with similar format in Annex 7.3. This allows a good overview and a quick cross check for the content of each study. However, it was not possible to read and evaluate all studies in detail or to ana-lyse and compare the different approaches and data sources. The following conclusions can be drawn from the review: During the last decade a lot of efforts have been made to examine the environ-
mental impact of transport infrastructure with a clear focus on new highspeed rail-way lines.
The developped methodologies are applicable and comparable, although the sys-tem boundaries often differ. This is the reason, why a direct comparison of the val-ues between the studies is not possible.
The Ecoinvent database is a very common source of impact factors in European studies with regard to all transport modes.
Surveys from Chester et. al. for passenger transport in the USA found higher shares of CO2-emissions for transport infrastructure than European studies. The reasons for the difference are not clear and need deeper analysis.
A systematic research of the environmental impacts of infrastructure of road, ship and aircraft for European countries is still missing
In Table 2.1 you find an overview of different studies and their subject. Please note that not all surveys listed here were used in this study.
Öko-Institut e.V. Matthias Tuchschmid IFEU Heidelberg
Carbon footprint of railway infrastructure –20.10.2011 4
Table 2.1: Overview of selected studies dealing with carbon footprint of railway infrastructure and other modes
No. [1],[2] [3] [4] [5] [6].[7],[8] [8] [12],[15] [13]
Short TitleEc
oTra
nsIT
, Ec
oPas
seng
er
von
Rozy
cki &
Koe
se &
Sc
hwar
z 200
3
Spie
lman
n &
Don
es &
Ba
uer 2
007
Fris
chkn
echt
& S
tuck
i 20
09
Tuch
schm
id 2
010
(Mob
itool
)
Ches
ter 2
008
Ches
ter&
How
ard
2009
Ch
este
r&Ho
war
d 20
10
EPD
2009
Tuch
scm
id 2
009
Sy
stra
201
1
Schm
ied
& M
otts
chal
l 20
10
This
Stu
dy
1. Upstream processes - production of traction energy included included included included included included included included included included - production of stationary energy included included included2. Vehicle fleet - locomotives O O,M,C O,M,C,D O,M,C,D O,M,C,D O,M,C O,M,C,D O,C O,M,C O,M,C - wagons O O,M,C O,M,C,D O,M,C,D O,M,C,D O,M,C O,M,C,D O,C O,M,C O,M,C - railcars O O,M,C O,M,C,D O,M,C,D O,M,C,D O,M,C O,M,C,D O,C O,M,C O,M,C3. track system - normal track O,M,C O,M,C,D O,M,C,D O,M,C,D O,C,M O,M,C,D O,C O,M,C O,M,C - bridges O,M,C O,M,C O,M,C O,M,C,D O,M,C,D O,C O,M,C O,M,C - tunnels O,M,C O,M,C O,M,C O,M,C,D O,M,C,D O,C O,M,C O,M,C - embankments O,M,C O,M,C,D O,M,C,D O,C O,M,C O,M,C - catenary equpment O,M,C O,M,C,D O,M,C,D O,M,C,D O,C,M O,M,C,D O,C O,M,C O,M,C - substations O,M,C O,M,C,D O,C,M O,M,C,D O,C O,M,C O,M,C - signals and communication O,M,C O,M,C,D O,M,C,D O,M,C O,M,C
4. Other buildings - railway stations O,M,C O,C,M O,M,C,D O,C O,M,C O,M,C - maintenance centers O,M,C O,C,M O,M,C,D O,C O,M,C O,M,C - Terminals O,M,C O,M,C,D O,M,C O,M,C - administration buildings O,M,C,D - parkings C,M O,M,C,D - noise protection O,M,C,D5. other modes Legend- Road included included included included included O Operation- Ship included included included included included M Maintenance- Aircraft included included included included included C Construction
D Disposal

IFEU Heidelberg Matthias Tuchschmid Öko-Institut e.V.
5
3 Methodology for assessment of rail infrastructure
Based on the Pre-Study (UIC, 2010) and the report by Schmied & Mottschall (2010) a framework for assessing the traffic infrastructure has been developed. While developing the methodology, the following considerations have been taken into account: The methodology can be applied with normal office tools among the railways. This
means that no new software or databases are needed The core ideas and calculations are widely accepted within the scientific community,
government and the public opinion. Within the first section, a short description of the indicators is given. The second section describes the modeling principles and the allocation of the impact. In the last section, the used data sources have been described.
3.1 Indicators
The method chosen in this study allows the impact assessment of any emissions or resources. For the sake of practicality, it is appropriate to make a selection. The follow-ing six key indicators cover a broad range of environmental criteria. Primary energy CO2 (global warming potential) Particulate matter (PM10) Non-methane hydrocarbons (NMHC) Nitrogen oxide (NOx)
These six indicators are also in use for the two UIC-Tools EcoPassenger and EcoTran-sIT. The calculation with other impact categories can be done with almost none addi-tional effort.
3.1.1 Primary energy Description: The primary energy includes the direct energy consumed for the train op-eration, the energy used in the upstream energy production processes as well as losses from electric power generation and distribution. All processes involved in extracting the energy from the environment are traced back to the point of origin, i.e. the place where the energy is extracted. For petrol or diesel, for example, this would be when the oil is taken out of the ground. Rotational or mechanical energy is considered to be the pri-mary source of energy for renewable energy systems such as hydropower and wind power (Hischier et al., 2009). Relevance to society: It is considered highly likely that global oil production will peak within the coming decades; after this point oil production will go into decline. This was predicted over 50 years ago by Hubbert (1949). Moreover, subsequent generations will be deprived of the opportunity of using petroleum as the chemical basis for a variety of products. Unit: MJ-equivalents
Öko-Institut e.V. Matthias Tuchschmid IFEU Heidelberg
Carbon footprint of railway infrastructure –20.10.2011 6
3.1.2 CO2 as an indicator of greenhouse gas potential Description: The anthropogenic greenhouse effect is caused mainly by the emission of carbon dioxide (CO2) from the burning of fossil fuels, although other greenhouse gases, principally methane (CH4) and nitrous oxide (NO2, also contribute significantly to global warming. Irrespective of the engine technology employed, CO2 is the largest component of the transport sector's contribution to the greenhouse effect. Relevance to society: It is considered proven that the heightened greenhouse effect is changing the climate and heating up the atmosphere. This has far-reaching conse-quences for mankind and for the biosphere and endangers the well-being of future gen-erations (IPCC, 2007). Unit: kilogram
3.1.3 Particulate matter: PM10 und PM2.5 Description: Particulate matter (PM10 and PM2,5) is the term for all airborne solid or liquid particles measuring between 10 micrometres (PM10) and 2.5 micrometres (PM2,5) in diameter that do not immediately settle to the ground. In addition to natural sources (pollen, forest fires, Saharan dust), a variety of human induced sources (traffic, wood heaters, electricity and thermal power stations) are responsible for increasing the con-centration of particulates in the atmosphere (PSI, 2008). Particulate emissions from combustion processes are typically smaller than 2.5 micrometres. Transport is also re-sponsible for the emission of particles as a result of abrasion processes, although these particles are normally larger than 10 micrometres. In urban areas, traffic is estimated to be responsible for around 20 percent of the emissions of particulates, although it is around 30% on average (BGBI, 2006). Relevance to society: Particulate matter is a problem mainly because of its adverse health effects. These include temporary irritation of breathing passages (e.g. coughing), an increased need for medication by asthma sufferers and increased mortality from illnesses of the respiratory and circulatory systems. The toxicity of the particles depends both on their composition and their size. The increased health risk from diesel exhaust particulates comes from their carcinogenic components and the very small size of the particles (Frischknecht, Steiner, & Jungbluth, 2008; Knörr, 2008a). Fine particles can migrate to the alveolar region of the lungs. For reasons of data availability and practical-ity, no weighting has been applied to the location of the emissions1. Unit: Gram. The properties of the particles are not taken into account, as the life-cycle inventories contained in the ecoinvent database do not distinguish between different types of fine particulates.
3.1.4 Non-methane volatile organic compounds: NMVOC Description: Volatile organic compounds are organic materials that vaporise easily (i.e. they are volatile) and exist in gaseous form at low (e.g. ambient) temperatures. For pur-poses of analysis, the gas methane is often excluded from the group of VOCs, which
1 Particulates are a particular problem in urban areas.
IFEU Heidelberg Matthias Tuchschmid Öko-Institut e.V.
7
results in a group known as NMVOC (non-methane volatile organic compounds).2 NMVOCs are emitted into the atmosphere by a wide range of anthropogenic biopro-cesses. Relevance to society: Alongside nitrogen oxides, NMVOCs are a precursor of "sum-mer smog" (ground-level ozone), making them relevant even when their source is pre-dominantly outside cities. Some of the substances in this group (such as benzene) are also carcinogenic. Unit: Gram
3.1.5 Nitrogen oxides: NOx Description: Nitrogen oxides are gaseous oxides of nitrogen. They are often abbrevi-ated to NOx because of the many oxidation states of nitrogen and the number of nitro-gen-oxygen compounds. Nitrogen oxides are formed when nitrogen is exposed to oxy-gen under external energy input, typically from combustion processes. Relevance to society: Nitrogen oxides have a range of adverse effects that are so-cially relevant. For example, nitrogen oxide reacts with moisture in the air to form nitric acid, which contributes to the formation of acid rain. The same mechanism can act upon the human mucous membranes and cause irritation of the respiratory organs (or, follow-ing chronic exposure, even damage). Moreover, nitrogen oxides are an important con-tributor to the formation of smog, ground-level ozone (in combination with NMVOC and UV radiation) and secondary particles (particulates). Unit: Gram
2 There is, however, no standard definition of what NMVOCs actually contain. Some definitions include information on steam pressure, while others define NMVOCs and VOCs in terms of their photochemical reactivity as a precursor in the formation of ground-level ozone. In Switzerland, emissions of VOCs are subject to the fiscal ordinance of November 12, 1997 (VOCV, 2009). In this project only the elementary flow 'NMVOC, unspecified "of ecoinvent dataset has been ana-lyzed. This means that the emission tends to be underestimated (eg. for passenger transport by car: + 25.7%, respec-tively long-distance train. +20.9%).

Öko-Institut e.V. Matthias Tuchschmid IFEU Heidelberg
Carbon footprint of railway infrastructure –20.10.2011 8
3.2 Modeling principles
The assessment of the railway infrastructure is mainly based on the Pre-Study (UIC, 2010), Schmied & Mottschall (2010) and the Ecoinvent-methodology (Spielmann u. a., 2007). Please note, that this methodology can be applied for every network or transport service, see also section 3.2.8
3.2.1 Modeling Approach This study follows the approach of Schmied & Mottschall (2010) for Germany “Treib-hausgasemissionen durch die Schieneninfrastruktur und Schienenfahrzeuge in Deutschland” (Greenhouse gas emissions of railway infrastructure and vehicles in Ger-many). In principle, the estimation of the environmental impacts is carried out using an orienting material flow analysis3.
3.2.2 System Boundaries The choice of the system boundaries is essential: If the boundaries have been too nar-rowly defined, the result is not a complete assessment. In contrast, the assessment may focus on any processes but not the core product / core service if too many proc-esses are in the system boundaries. In addition, the effort for data collection will rise rapidly as well as the calculation of the processes. Basically, one needs to ask oneself the question whether an outside activity is directly associated with the core process or not.4 The following processes of rail infrastructure were considered, they are briefly de-scribed in chapter 4: Upstream processes: production of traction and stationary energy (see Figure
1.1), Vehicle fleet: construction, operation and maintenance of locomotives, wagons and
railcars, Track system: construction, operation and maintenance of rail track, bridges, tun-
nels, embankments, catenary equipment, substations, telecommunication & sig-nalization, energy equipment, buildings,
Other Buildings: construction, operation and maintenance of railway stations, maintenance centers and terminals (optional).5
Some processes have not been taken into account: Abrasion of wheels, brakes and the overhead contact line
3 A detailed life cycle assessment is beyond the scope of this study. The methods used in this study (material flow analysis) are in line with the product category rules for rail infrastructure and rail vehicles (EPD, 2009). These PCR-Rules are in close connection with the ISO standard 14025 (environmental declarations) and the ISO standard 14040 (Life Cycle Assessment). 4 An example: The refining of crude oil for diesel production is directly linked (material flow) for operating the rolling stock. In contrary, the daily displacement of the railway workers to their offices for securing a proper operation of the trains is not linked with the transport performance itself. 5 A railway station also fulfils the functions of shopping malls, restaurants and service centres today. These services are not linked with the core service of transporting passenger. Within this study, the operation of buildings can be taken into account as an option
IFEU Heidelberg Matthias Tuchschmid Öko-Institut e.V.
9
first mile / last-mile of the passenger Before a passenger may board a train, he has to get to the station with some other means of transportion(first mile). Similarly, the destination station is rarely the de-sired destination (last-mile).6
infrastructure of stations / parking Buildings and structures for the smooth connection to public transport as buses and parking lots to private transports are necessary. Within this study, it is assumed that these facilities are part of the respective network of public buses, respectively pri-vate cars.
3.2.3 Lifespan of considered elements All elements of rail infrastructure have to be replaced after some time due to technical problems or material fatigue. Therefore, the question of the appropriate lifespan rises. In this study an average lifespan of 60 years has been considered for the construction of civil engineering (e.g. tunnels, buildings). This is in line with PCR for railways (EPD, 2009). However, a sensitivity analysis was done for a lifespan of 100 years, as many tunnels and bridges are still operated today even 100 years after construction (see page 34 in chapter 5.2.2).
6 If national data in comparable quality is available for the first mile / last mile, a complete carbon footprint can be calculated. However, within this study the first mile / last mile could not be considered due to the limited data access and missing values for the infrastructure of cars, buses and trams
Öko-Institut e.V. Matthias Tuchschmid IFEU Heidelberg
Carbon footprint of railway infrastructure –20.10.2011 10
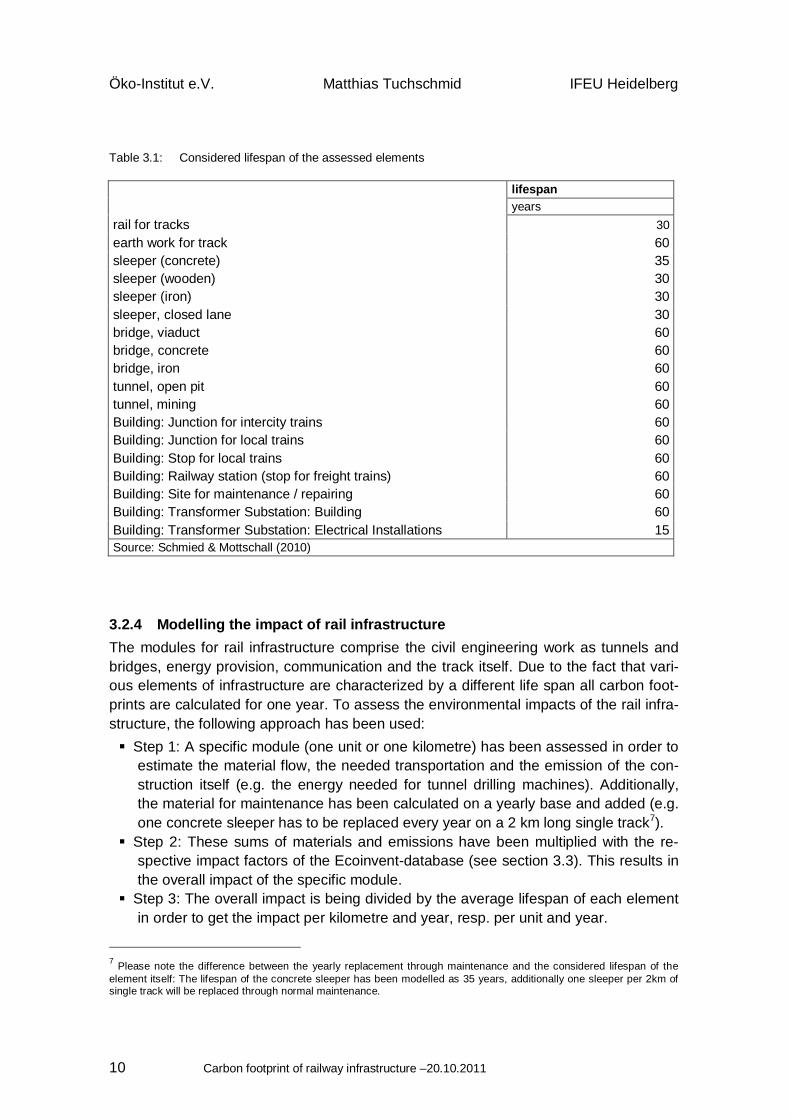
Table 3.1: Considered lifespan of the assessed elements
lifespan years rail for tracks 30 earth work for track 60 sleeper (concrete) 35 sleeper (wooden) 30 sleeper (iron) 30 sleeper, closed lane 30 bridge, viaduct 60 bridge, concrete 60 bridge, iron 60 tunnel, open pit 60 tunnel, mining 60 Building: Junction for intercity trains 60 Building: Junction for local trains 60 Building: Stop for local trains 60 Building: Railway station (stop for freight trains) 60 Building: Site for maintenance / repairing 60 Building: Transformer Substation: Building 60 Building: Transformer Substation: Electrical Installations 15 Source: Schmied & Mottschall (2010)
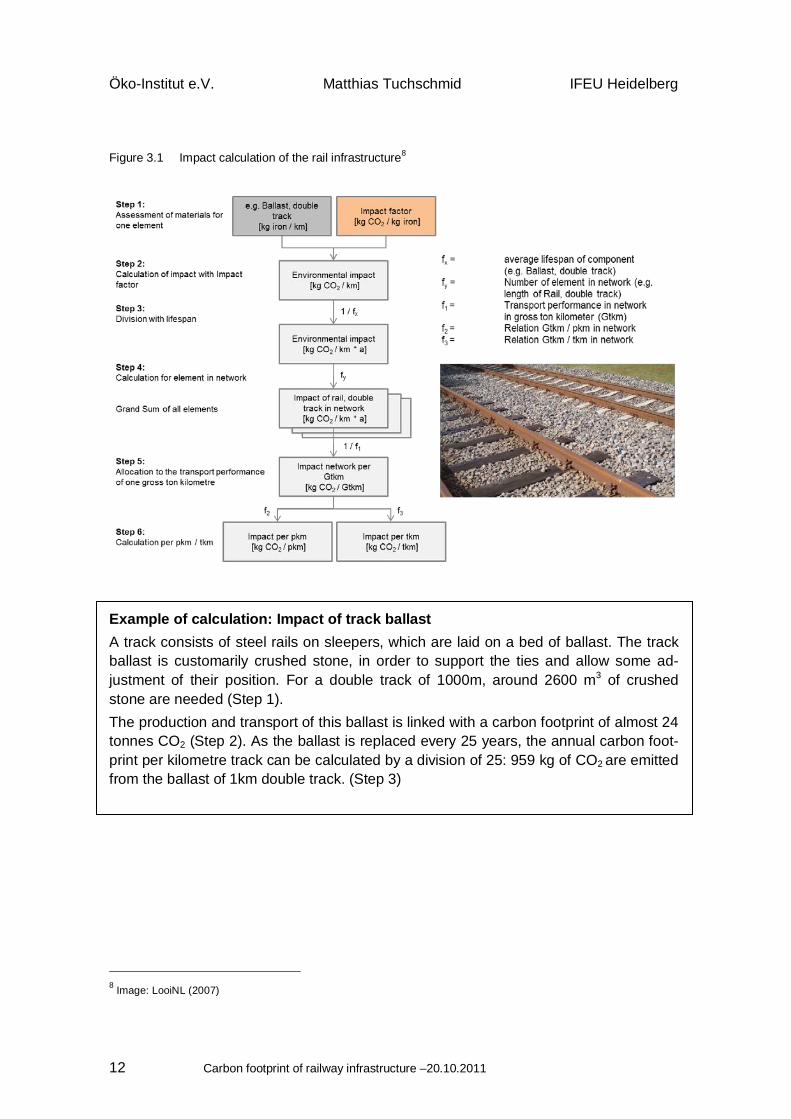
3.2.4 Modelling the impact of rail infrastructure The modules for rail infrastructure comprise the civil engineering work as tunnels and bridges, energy provision, communication and the track itself. Due to the fact that vari-ous elements of infrastructure are characterized by a different life span all carbon foot-prints are calculated for one year. To assess the environmental impacts of the rail infra-structure, the following approach has been used: Step 1: A specific module (one unit or one kilometre) has been assessed in order to
estimate the material flow, the needed transportation and the emission of the con-struction itself (e.g. the energy needed for tunnel drilling machines). Additionally, the material for maintenance has been calculated on a yearly base and added (e.g. one concrete sleeper has to be replaced every year on a 2 km long single track7).
Step 2: These sums of materials and emissions have been multiplied with the re-spective impact factors of the Ecoinvent-database (see section 3.3). This results in the overall impact of the specific module.
Step 3: The overall impact is being divided by the average lifespan of each element in order to get the impact per kilometre and year, resp. per unit and year.
7 Please note the difference between the yearly replacement through maintenance and the considered lifespan of the element itself: The lifespan of the concrete sleeper has been modelled as 35 years, additionally one sleeper per 2km of single track will be replaced through normal maintenance.
IFEU Heidelberg Matthias Tuchschmid Öko-Institut e.V.
11
Functional unit for rail infrastructure modules: [impact per km and year] resp. [impact per unit and year]
Step 4: This step includes the multiplication of the specific module emissions with the number of modules of the considered network. In this way, the overall emis-sions of a specific network (e.g. in a country / a high-speed track / the network for regional trains / a specific line) can be calculated according to the respective condi-tions and topography.
Step 5: As different kinds of trains (e.g. freight vs. passenger trains) are operated in the network, one has to allocate the impact to each transport service. This alloca-tion of the network impact is done by gross tonne kilometre. Therefore, one has to divide the total emission of the network per year by the total transport performance of the network in gross tonne km to get the specific impact.
Step 6: The last step is the calculation to the unit of passenger kilometre, respec-tively net tonne kilometre: The impact per gross tonne kilometre is being multiplied with the ratio of gross tonne kilometre / passenger kilometre, resp. gross tonne kilometre / net tonne kilometre
Functional unit for using the rail network: [impact per pkm] resp. [impact per tkm]
Öko-Institut e.V. Matthias Tuchschmid IFEU Heidelberg
Carbon footprint of railway infrastructure –20.10.2011 12
Figure 3.1 Impact calculation of the rail infrastructure8
Example of calculation: Impact of track ballast A track consists of steel rails on sleepers, which are laid on a bed of ballast. The track ballast is customarily crushed stone, in order to support the ties and allow some ad-justment of their position. For a double track of 1000m, around 2600 m3 of crushed stone are needed (Step 1). The production and transport of this ballast is linked with a carbon footprint of almost 24 tonnes CO2 (Step 2). As the ballast is replaced every 25 years, the annual carbon foot-print per kilometre track can be calculated by a division of 25: 959 kg of CO2 are emitted from the ballast of 1km double track. (Step 3)
8 Image: LooiNL (2007)
IFEU Heidelberg Matthias Tuchschmid Öko-Institut e.V.
13
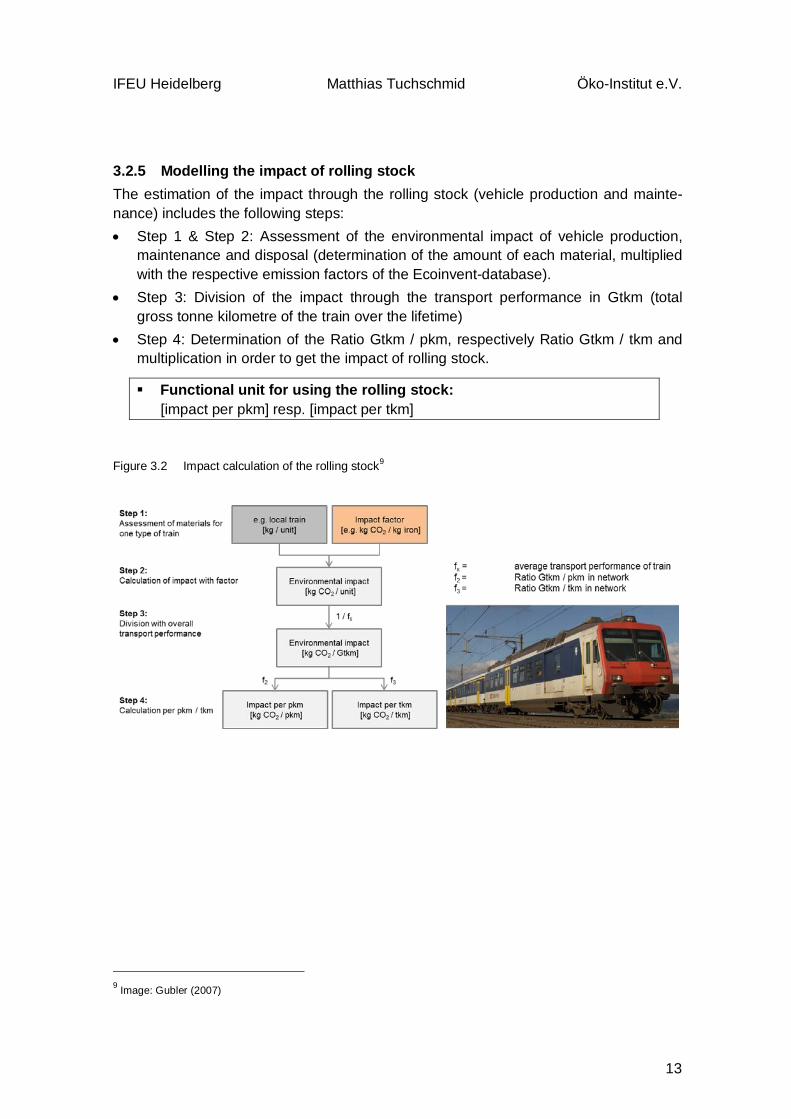
3.2.5 Modelling the impact of rolling stock The estimation of the impact through the rolling stock (vehicle production and mainte-nance) includes the following steps: • Step 1 & Step 2: Assessment of the environmental impact of vehicle production,
maintenance and disposal (determination of the amount of each material, multiplied with the respective emission factors of the Ecoinvent-database).
• Step 3: Division of the impact through the transport performance in Gtkm (total gross tonne kilometre of the train over the lifetime)
• Step 4: Determination of the Ratio Gtkm / pkm, respectively Ratio Gtkm / tkm and multiplication in order to get the impact of rolling stock.
Functional unit for using the rolling stock: [impact per pkm] resp. [impact per tkm]
Figure 3.2 Impact calculation of the rolling stock9
9 Image: Gubler (2007)
Öko-Institut e.V. Matthias Tuchschmid IFEU Heidelberg
Carbon footprint of railway infrastructure –20.10.2011 14
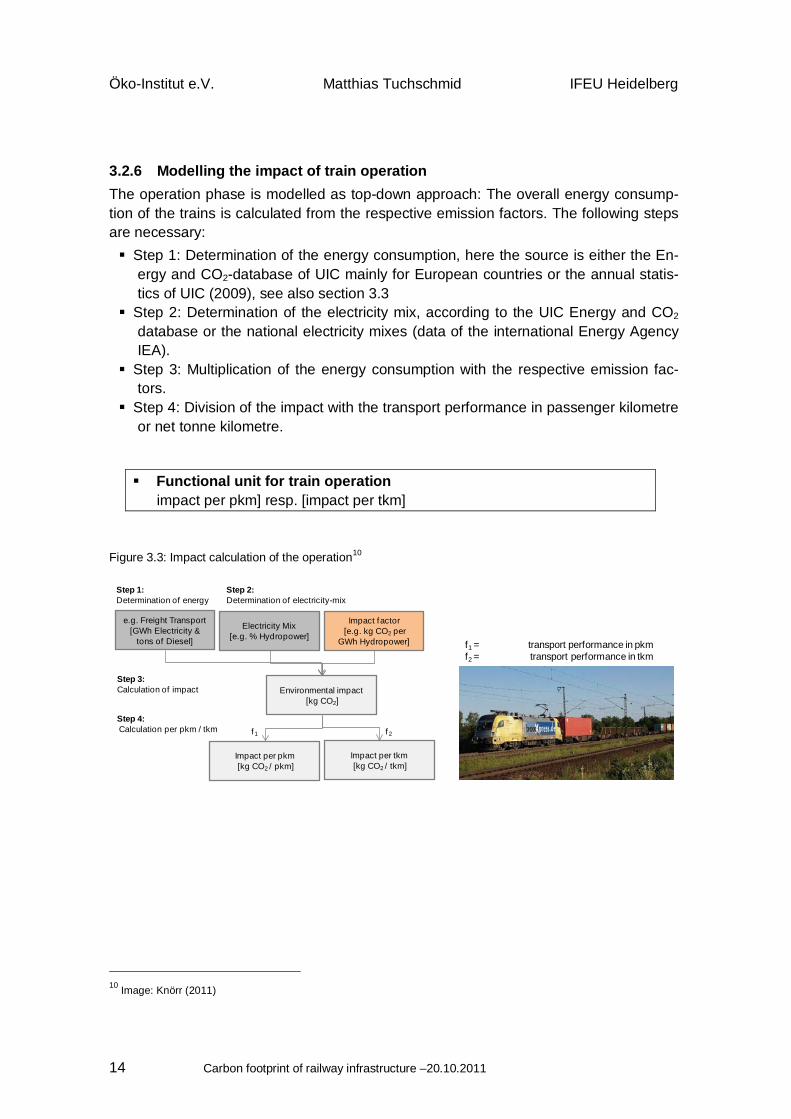
3.2.6 Modelling the impact of train operation The operation phase is modelled as top-down approach: The overall energy consump-tion of the trains is calculated from the respective emission factors. The following steps are necessary: Step 1: Determination of the energy consumption, here the source is either the En-
ergy and CO2-database of UIC mainly for European countries or the annual statis-tics of UIC (2009), see also section 3.3
Step 2: Determination of the electricity mix, according to the UIC Energy and CO2 database or the national electricity mixes (data of the international Energy Agency IEA).
Step 3: Multiplication of the energy consumption with the respective emission fac-tors.
Step 4: Division of the impact with the transport performance in passenger kilometre or net tonne kilometre.
Functional unit for train operation impact per pkm] resp. [impact per tkm]
Figure 3.3: Impact calculation of the operation10
Electricity Mix[e.g. % Hydropower]
f1 = transport performance in pkmf2 = transport performance in tkm
Impact factor[e.g. kg CO2 per
GWh Hydropower]
Environmental impact[kg CO2]
Step 4: Calculation per pkm / tkm
Step 3: Calculation of impact
Step 1: Determination of energy
Impact per pkm[kg CO2 / pkm]
Impact per tkm[kg CO2 / tkm]
f1 f 2
e.g. Freight Transport [GWh Electricity &
tons of Diesel]
Step 2: Determination of electricity-mix
10 Image: Knörr (2011)
IFEU Heidelberg Matthias Tuchschmid Öko-Institut e.V.
15
3.2.7 Modelling transport services The impact of the transport service of a passenger kilometre or a net tonne kilometre is the grand sum of the rail infrastructure, the rolling stock and the operation. As an option, the impact of the building operation11 can be added.
3.2.8 Transport on different networks, e.g. local trains The transport by rail consists of passenger and freight transport, within passenger transport, one may further distinguish local trains, intercity trains and high speed trains. These different transport services uses different parts of the network, e.g. on the high speed track between Strasbourg and Paris hardly any local train is operated. The de-scribed methodology is valid for all kinds of networks and transport services: The rail transport of a single line between two stations can be assessed, e.g. the
impact of a new built high speed line. A detailed bottom-up analysis of the network can be done with the impact estimation
of single lines then aggregated to a distinct network12.With this bottom-up ap-proach, one would get locally dispersed data in a high quality.
A country-specific network may be assessed in a top-down approach. Due to the limited data availability, this study consists of the analysis of 7 country-specific net-works as top-down approach. Section 5.2.1 highlights the differences between a bottom-up and a top-down approach.
3.2.9 Considerations
Assumption on temporal scope A crucial assumption is to model past processes of material inputs as they would hap-pen today. Two implications result from this assumption: Past emissions have the same emission values and are equally accounted as actual
emissions. This is contrary to the normal calculations of the UNFCC body in the framework of the Kyoto-protocol, where only actual emissions are taken into ac-count.
Technological changes of production processes are not considered: For instance, concrete, which has been used in the construction of tunnels in 1980, is represented by a state of the art production in 2000.
11 The impact calculation of the buildings operation consist the following steps: 1) Determination of the consumed energy 2) Multiplication with the emission factors 3) Division by the overall transport performance in gross tonne kilometre 4) Determination of the ratio Gtkm / pkm, resp. Gtkm / tkm and multiplication. 12 This would require the determination of the specific network details and its transport performance on each section. Then the impact can be calculated for each section of the rail network. The study bySchmied & Mottschall (2010) fol-lowed this approach, see also section 5.2.1
Öko-Institut e.V. Matthias Tuchschmid IFEU Heidelberg
Carbon footprint of railway infrastructure –20.10.2011 16
No consideration of deforestation The impact of the deforestation generated by the track construction was not taken into account. According to environmental specialists, only a growing vegetation absorbs CO2 and in most cases it is very difficult to estimate feasible emissions if the vegetation is not burned.
Cut-off criteria According to the Product Category Rules, products and activities of no more than 1% of the total environment can be neglected. If the direct environmental effects are not known, the 1% rule may base on the amount of material. In rail vehicles, a variety of materials are used, but of which a majority covers only very small amounts. These ma-terials are therefore not taken into account.
IFEU Heidelberg Matthias Tuchschmid Öko-Institut e.V.
17
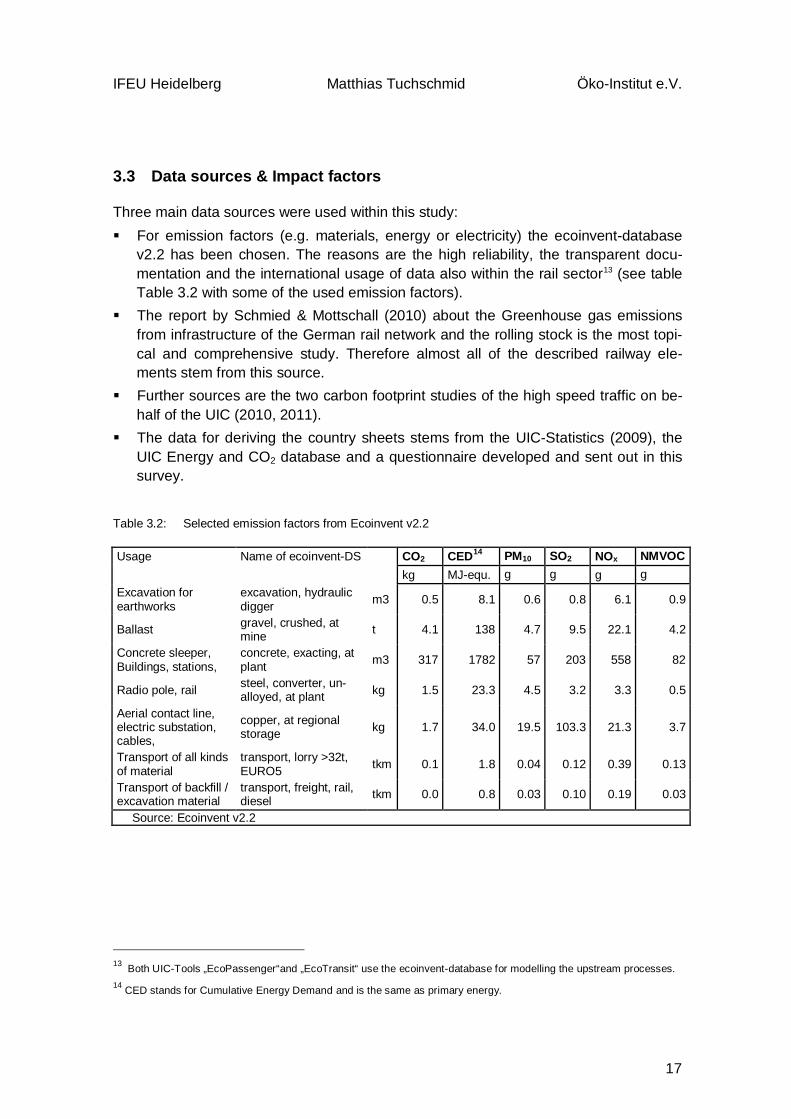
3.3 Data sources & Impact factors
Three main data sources were used within this study: For emission factors (e.g. materials, energy or electricity) the ecoinvent-database
v2.2 has been chosen. The reasons are the high reliability, the transparent docu-mentation and the international usage of data also within the rail sector13 (see table Table 3.2 with some of the used emission factors).
The report by Schmied & Mottschall (2010) about the Greenhouse gas emissions from infrastructure of the German rail network and the rolling stock is the most topi-cal and comprehensive study. Therefore almost all of the described railway ele-ments stem from this source.
Further sources are the two carbon footprint studies of the high speed traffic on be-half of the UIC (2010, 2011).
The data for deriving the country sheets stems from the UIC-Statistics (2009), the UIC Energy and CO2 database and a questionnaire developed and sent out in this survey.
Table 3.2: Selected emission factors from Ecoinvent v2.2
Usage Name of ecoinvent-DS CO2 CED14 PM10 SO2 NOx NMVOC kg MJ-equ. g g g g Excavation for earthworks
excavation, hydraulic digger m3 0.5 8.1 0.6 0.8 6.1 0.9
Ballast gravel, crushed, at mine t 4.1 138 4.7 9.5 22.1 4.2
Concrete sleeper, Buildings, stations,
concrete, exacting, at plant m3 317 1782 57 203 558 82
Radio pole, rail steel, converter, un-alloyed, at plant kg 1.5 23.3 4.5 3.2 3.3 0.5
Aerial contact line, electric substation, cables,
copper, at regional storage kg 1.7 34.0 19.5 103.3 21.3 3.7
Transport of all kinds of material
transport, lorry >32t, EURO5 tkm 0.1 1.8 0.04 0.12 0.39 0.13
Transport of backfill / excavation material
transport, freight, rail, diesel tkm 0.0 0.8 0.03 0.10 0.19 0.03
Source: Ecoinvent v2.2
13 Both UIC-Tools „EcoPassenger“and „EcoTransit“ use the ecoinvent-database for modelling the upstream processes. 14 CED stands for Cumulative Energy Demand and is the same as primary energy.
Öko-Institut e.V. Matthias Tuchschmid IFEU Heidelberg
Carbon footprint of railway infrastructure –20.10.2011 18
4 Assessing the rail infrastructure
4.1 Construction and maintenance of tracks
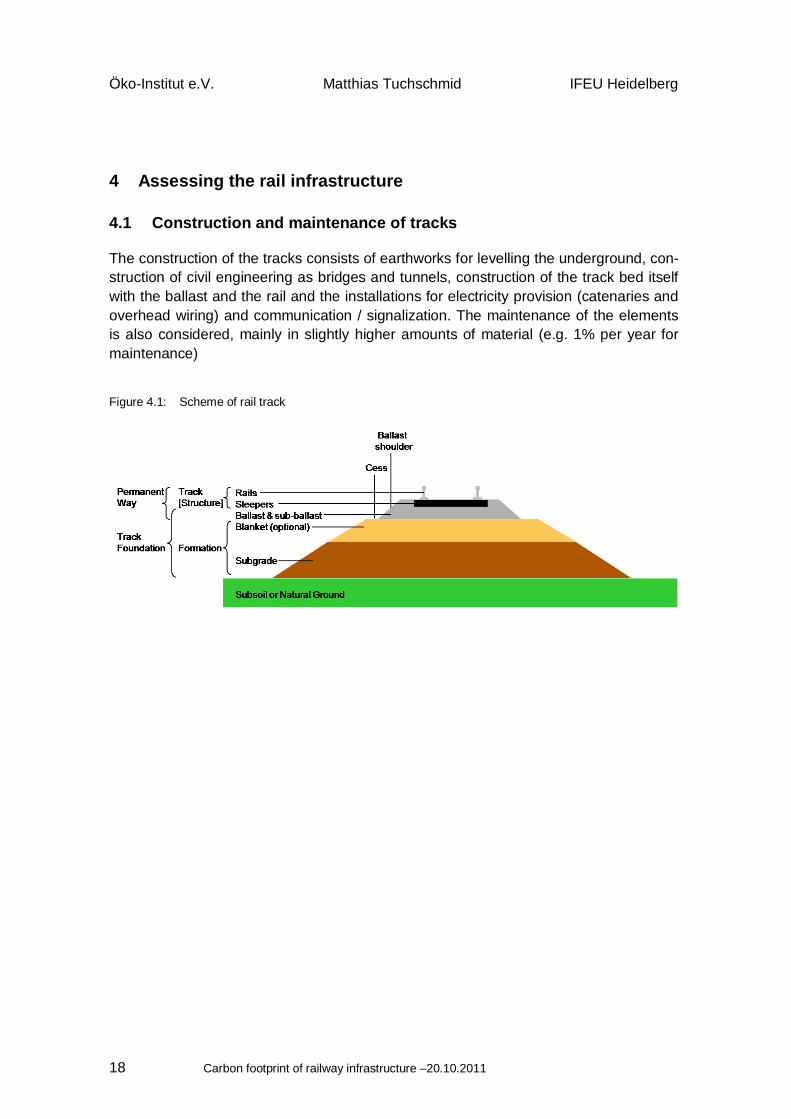
The construction of the tracks consists of earthworks for levelling the underground, con-struction of civil engineering as bridges and tunnels, construction of the track bed itself with the ballast and the rail and the installations for electricity provision (catenaries and overhead wiring) and communication / signalization. The maintenance of the elements is also considered, mainly in slightly higher amounts of material (e.g. 1% per year for maintenance)
Figure 4.1: Scheme of rail track
IFEU Heidelberg Matthias Tuchschmid Öko-Institut e.V.
19
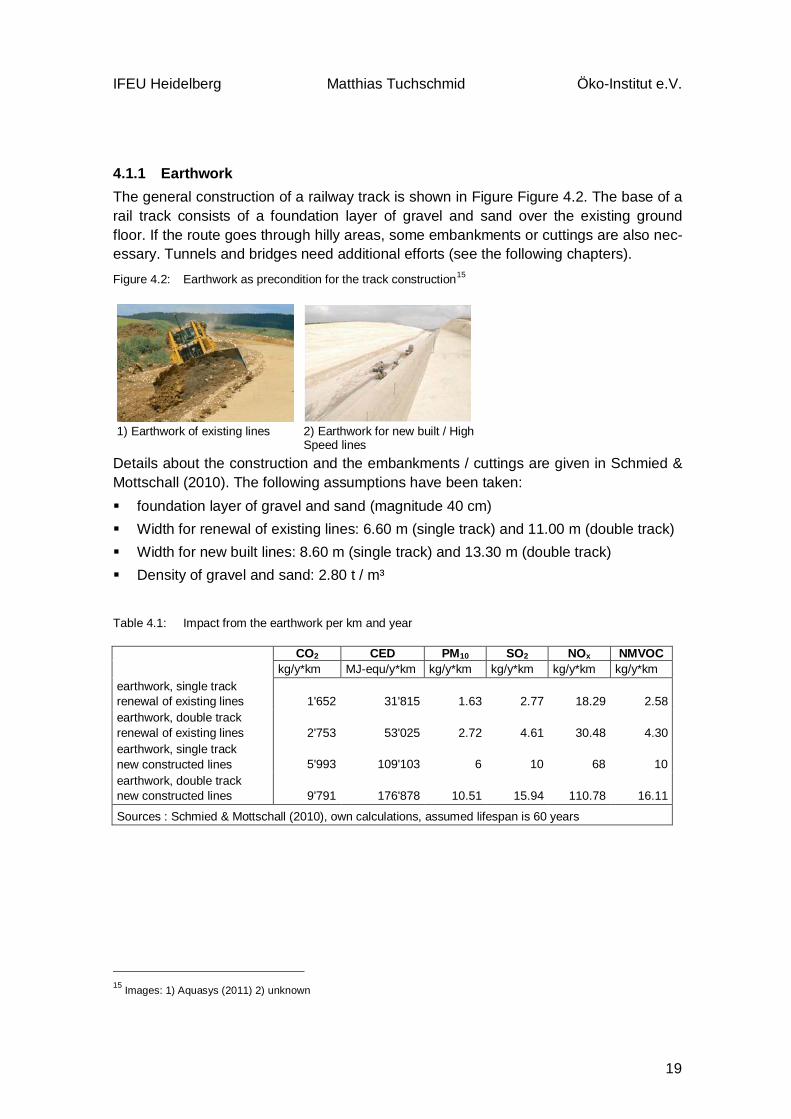
4.1.1 Earthwork The general construction of a railway track is shown in Figure Figure 4.2. The base of a rail track consists of a foundation layer of gravel and sand over the existing ground floor. If the route goes through hilly areas, some embankments or cuttings are also nec-essary. Tunnels and bridges need additional efforts (see the following chapters).
Figure 4.2: Earthwork as precondition for the track construction15
1) Earthwork of existing lines 2) Earthwork for new built / High
Speed lines Details about the construction and the embankments / cuttings are given in Schmied & Mottschall (2010). The following assumptions have been taken: foundation layer of gravel and sand (magnitude 40 cm) Width for renewal of existing lines: 6.60 m (single track) and 11.00 m (double track) Width for new built lines: 8.60 m (single track) and 13.30 m (double track) Density of gravel and sand: 2.80 t / m³
Table 4.1: Impact from the earthwork per km and year
CO2 CED PM10 SO2 NOx NMVOC kg/y*km MJ-equ/y*km kg/y*km kg/y*km kg/y*km kg/y*km
earthwork, single track renewal of existing lines 1'652 31'815 1.63 2.77 18.29 2.58 earthwork, double track renewal of existing lines 2'753 53'025 2.72 4.61 30.48 4.30 earthwork, single track new constructed lines 5'993 109'103 6 10 68 10 earthwork, double track new constructed lines 9'791 176'878 10.51 15.94 110.78 16.11
Sources : Schmied & Mottschall (2010), own calculations, assumed lifespan is 60 years
15 Images: 1) Aquasys (2011) 2) unknown
Öko-Institut e.V. Matthias Tuchschmid IFEU Heidelberg
Carbon footprint of railway infrastructure –20.10.2011 20
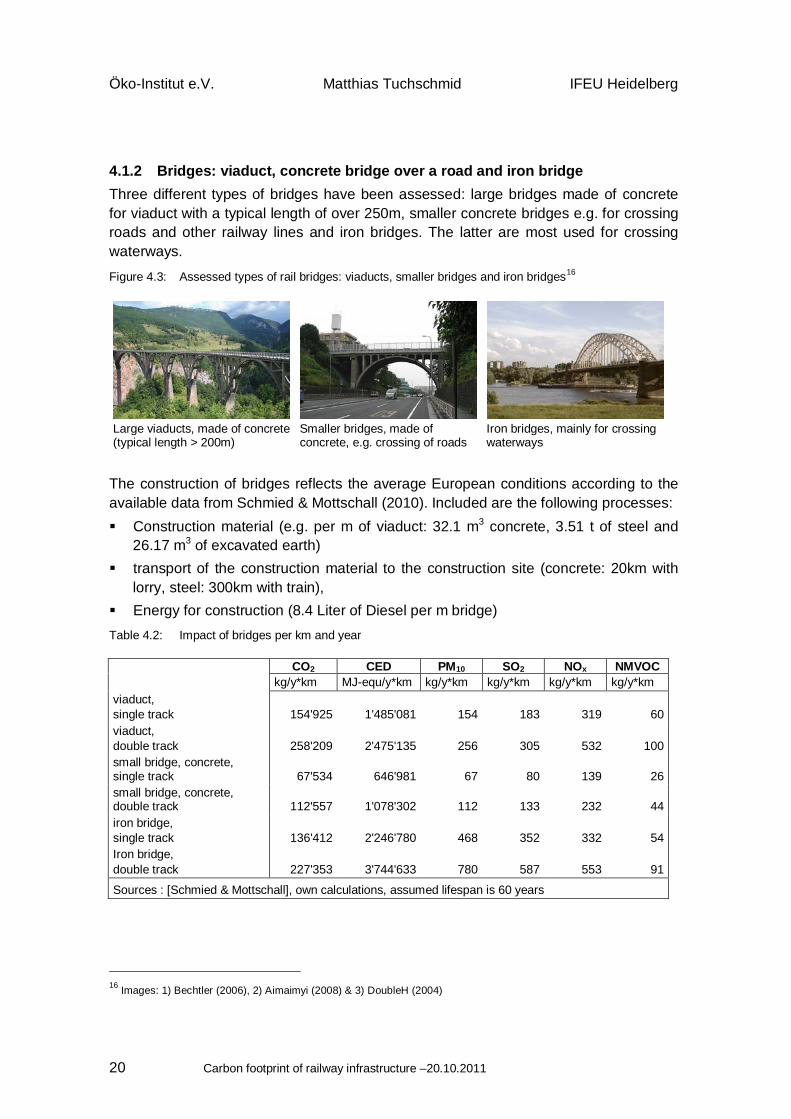
4.1.2 Bridges: viaduct, concrete bridge over a road and iron bridge Three different types of bridges have been assessed: large bridges made of concrete for viaduct with a typical length of over 250m, smaller concrete bridges e.g. for crossing roads and other railway lines and iron bridges. The latter are most used for crossing waterways.
Figure 4.3: Assessed types of rail bridges: viaducts, smaller bridges and iron bridges16
Large viaducts, made of concrete (typical length > 200m)
Smaller bridges, made of concrete, e.g. crossing of roads
Iron bridges, mainly for crossing waterways
The construction of bridges reflects the average European conditions according to the available data from Schmied & Mottschall (2010). Included are the following processes: Construction material (e.g. per m of viaduct: 32.1 m3 concrete, 3.51 t of steel and
26.17 m3 of excavated earth) transport of the construction material to the construction site (concrete: 20km with
lorry, steel: 300km with train), Energy for construction (8.4 Liter of Diesel per m bridge) Table 4.2: Impact of bridges per km and year
CO2 CED PM10 SO2 NOx NMVOC kg/y*km MJ-equ/y*km kg/y*km kg/y*km kg/y*km kg/y*km viaduct, single track 154'925 1'485'081 154 183 319 60 viaduct, double track 258'209 2'475'135 256 305 532 100 small bridge, concrete, single track 67'534 646'981 67 80 139 26 small bridge, concrete, double track 112'557 1'078'302 112 133 232 44 iron bridge, single track 136'412 2'246'780 468 352 332 54 Iron bridge, double track 227'353 3'744'633 780 587 553 91
Sources : [Schmied & Mottschall], own calculations, assumed lifespan is 60 years
16 Images: 1) Bechtler (2006), 2) Aimaimyi (2008) & 3) DoubleH (2004)
IFEU Heidelberg Matthias Tuchschmid Öko-Institut e.V.
21
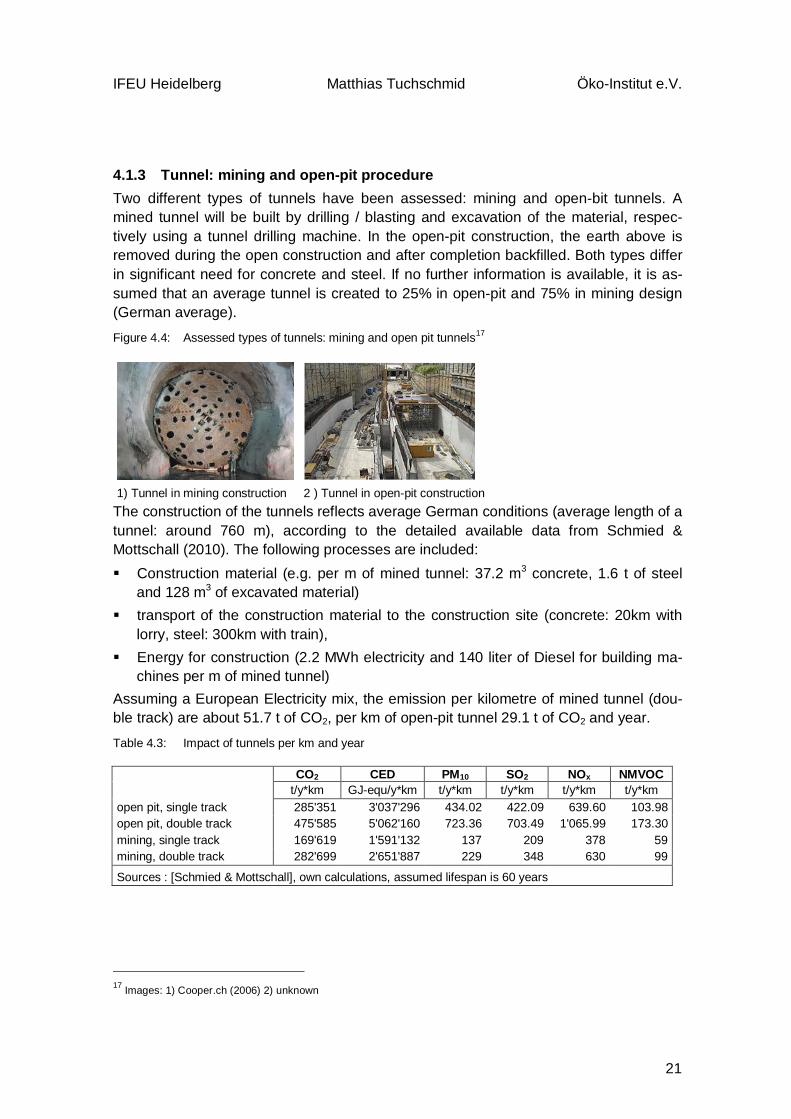
4.1.3 Tunnel: mining and open-pit procedure Two different types of tunnels have been assessed: mining and open-bit tunnels. A mined tunnel will be built by drilling / blasting and excavation of the material, respec-tively using a tunnel drilling machine. In the open-pit construction, the earth above is removed during the open construction and after completion backfilled. Both types differ in significant need for concrete and steel. If no further information is available, it is as-sumed that an average tunnel is created to 25% in open-pit and 75% in mining design (German average).
Figure 4.4: Assessed types of tunnels: mining and open pit tunnels17
1) Tunnel in mining construction 2 ) Tunnel in open-pit construction The construction of the tunnels reflects average German conditions (average length of a tunnel: around 760 m), according to the detailed available data from Schmied & Mottschall (2010). The following processes are included: Construction material (e.g. per m of mined tunnel: 37.2 m3 concrete, 1.6 t of steel
and 128 m3 of excavated material) transport of the construction material to the construction site (concrete: 20km with
lorry, steel: 300km with train), Energy for construction (2.2 MWh electricity and 140 liter of Diesel for building ma-
chines per m of mined tunnel) Assuming a European Electricity mix, the emission per kilometre of mined tunnel (dou-ble track) are about 51.7 t of CO2, per km of open-pit tunnel 29.1 t of CO2 and year.
Table 4.3: Impact of tunnels per km and year
CO2 CED PM10 SO2 NOx NMVOC t/y*km GJ-equ/y*km t/y*km t/y*km t/y*km t/y*km open pit, single track 285'351 3'037'296 434.02 422.09 639.60 103.98 open pit, double track 475'585 5'062'160 723.36 703.49 1'065.99 173.30 mining, single track 169'619 1'591'132 137 209 378 59 mining, double track 282'699 2'651'887 229 348 630 99
Sources : [Schmied & Mottschall], own calculations, assumed lifespan is 60 years
17 Images: 1) Cooper.ch (2006) 2) unknown
Öko-Institut e.V. Matthias Tuchschmid IFEU Heidelberg
Carbon footprint of railway infrastructure –20.10.2011 22
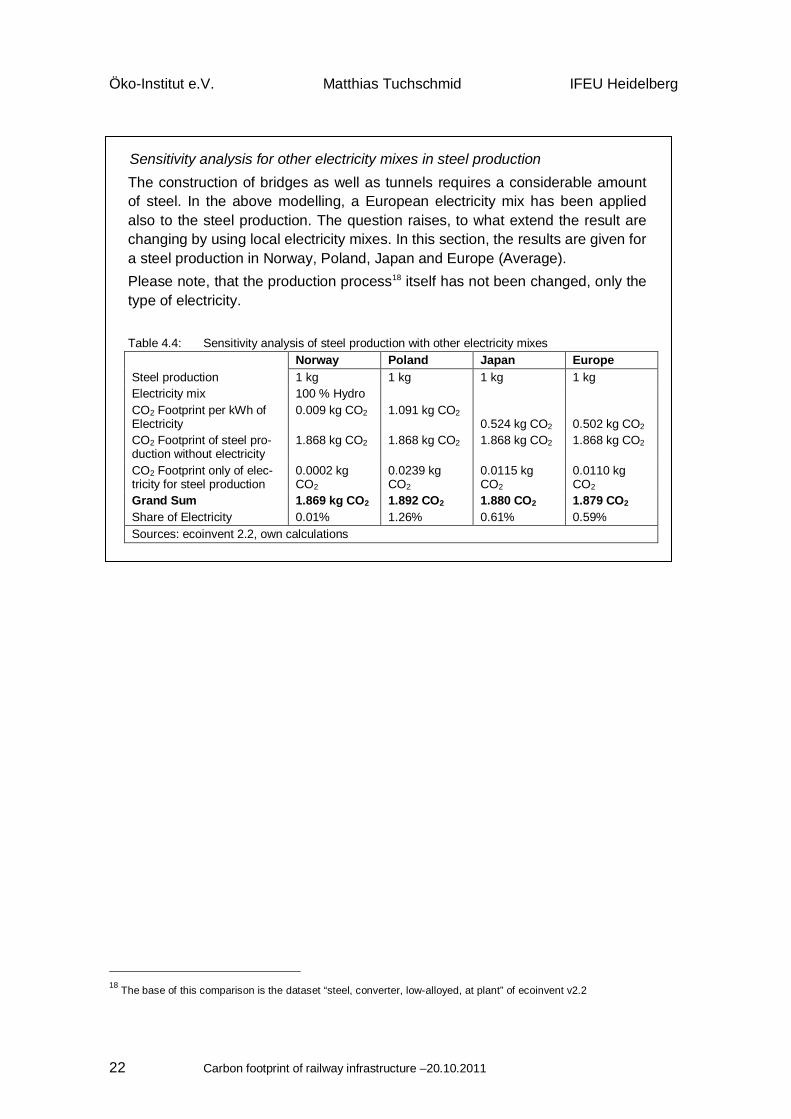
Sensitivity analysis for other electricity mixes in steel production The construction of bridges as well as tunnels requires a considerable amount of steel. In the above modelling, a European electricity mix has been applied also to the steel production. The question raises, to what extend the result are changing by using local electricity mixes. In this section, the results are given for a steel production in Norway, Poland, Japan and Europe (Average). Please note, that the production process18 itself has not been changed, only the type of electricity.
Table 4.4: Sensitivity analysis of steel production with other electricity mixes Norway Poland Japan Europe Steel production 1 kg 1 kg 1 kg 1 kg Electricity mix 100 % Hydro CO2 Footprint per kWh of Electricity
0.009 kg CO2 1.091 kg CO2 0.524 kg CO2 0.502 kg CO2
CO2 Footprint of steel pro-duction without electricity
1.868 kg CO2 1.868 kg CO2 1.868 kg CO2 1.868 kg CO2
CO2 Footprint only of elec-tricity for steel production
0.0002 kg CO2
0.0239 kg CO2
0.0115 kg CO2
0.0110 kg CO2
Grand Sum 1.869 kg CO2 1.892 CO2 1.880 CO2 1.879 CO2 Share of Electricity 0.01% 1.26% 0.61% 0.59% Sources: ecoinvent 2.2, own calculations
18 The base of this comparison is the dataset “steel, converter, low-alloyed, at plant” of ecoinvent v2.2
IFEU Heidelberg Matthias Tuchschmid Öko-Institut e.V.
23
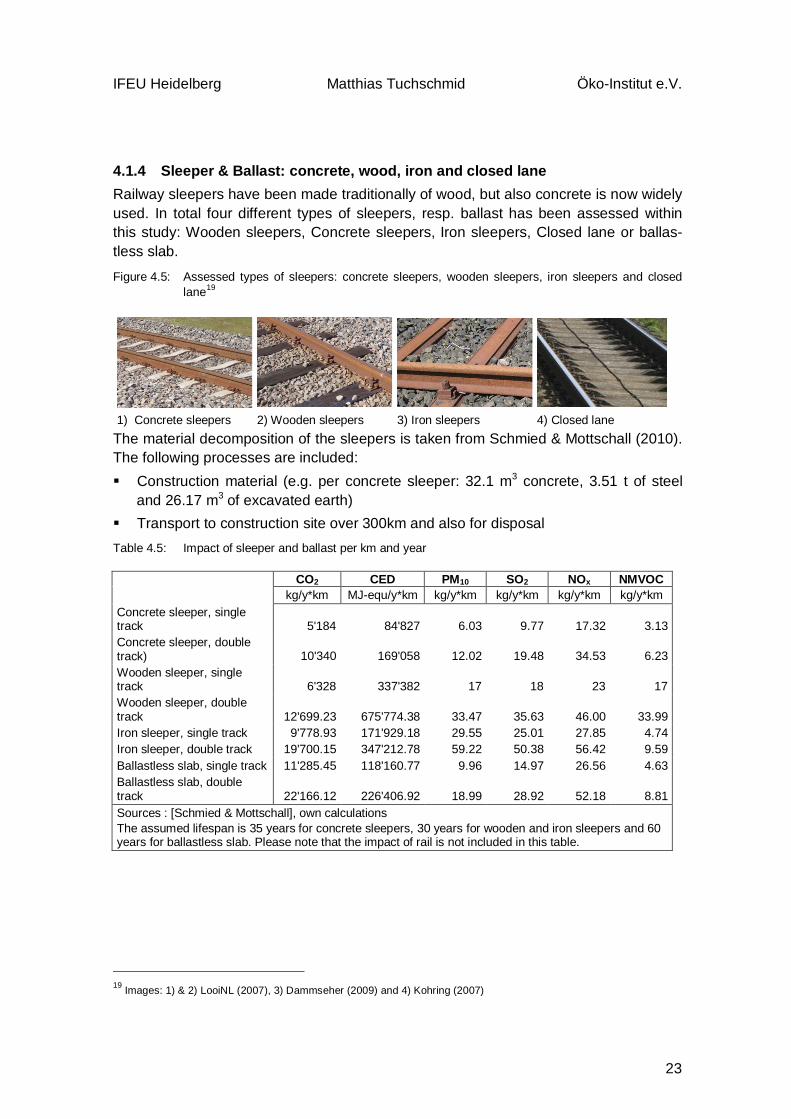
4.1.4 Sleeper & Ballast: concrete, wood, iron and closed lane Railway sleepers have been made traditionally of wood, but also concrete is now widely used. In total four different types of sleepers, resp. ballast has been assessed within this study: Wooden sleepers, Concrete sleepers, Iron sleepers, Closed lane or ballas-tless slab.
Figure 4.5: Assessed types of sleepers: concrete sleepers, wooden sleepers, iron sleepers and closed lane19
1) Concrete sleepers 2) Wooden sleepers 3) Iron sleepers 4) Closed lane The material decomposition of the sleepers is taken from Schmied & Mottschall (2010). The following processes are included: Construction material (e.g. per concrete sleeper: 32.1 m3 concrete, 3.51 t of steel
and 26.17 m3 of excavated earth) Transport to construction site over 300km and also for disposal Table 4.5: Impact of sleeper and ballast per km and year
CO2 CED PM10 SO2 NOx NMVOC kg/y*km MJ-equ/y*km kg/y*km kg/y*km kg/y*km kg/y*km Concrete sleeper, single track 5'184 84'827 6.03 9.77 17.32 3.13 Concrete sleeper, double track) 10'340 169'058 12.02 19.48 34.53 6.23 Wooden sleeper, single track 6'328 337'382 17 18 23 17 Wooden sleeper, double track 12'699.23 675'774.38 33.47 35.63 46.00 33.99 Iron sleeper, single track 9'778.93 171'929.18 29.55 25.01 27.85 4.74 Iron sleeper, double track 19'700.15 347'212.78 59.22 50.38 56.42 9.59 Ballastless slab, single track 11'285.45 118'160.77 9.96 14.97 26.56 4.63 Ballastless slab, double track 22'166.12 226'406.92 18.99 28.92 52.18 8.81 Sources : [Schmied & Mottschall], own calculations The assumed lifespan is 35 years for concrete sleepers, 30 years for wooden and iron sleepers and 60 years for ballastless slab. Please note that the impact of rail is not included in this table.
19 Images: 1) & 2) LooiNL (2007), 3) Dammseher (2009) and 4) Kohring (2007)
Öko-Institut e.V. Matthias Tuchschmid IFEU Heidelberg
Carbon footprint of railway infrastructure –20.10.2011 24
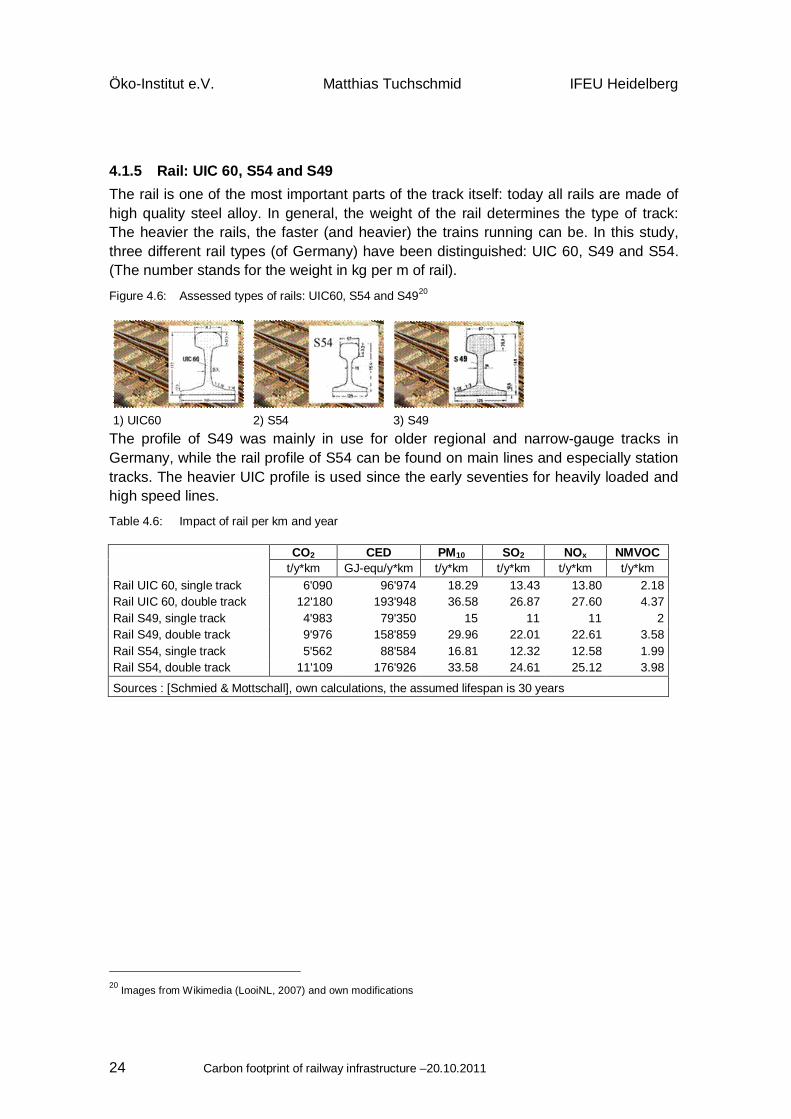
4.1.5 Rail: UIC 60, S54 and S49 The rail is one of the most important parts of the track itself: today all rails are made of high quality steel alloy. In general, the weight of the rail determines the type of track: The heavier the rails, the faster (and heavier) the trains running can be. In this study, three different rail types (of Germany) have been distinguished: UIC 60, S49 and S54. (The number stands for the weight in kg per m of rail).
Figure 4.6: Assessed types of rails: UIC60, S54 and S4920
1) UIC60 2) S54 3) S49 The profile of S49 was mainly in use for older regional and narrow-gauge tracks in Germany, while the rail profile of S54 can be found on main lines and especially station tracks. The heavier UIC profile is used since the early seventies for heavily loaded and high speed lines.
Table 4.6: Impact of rail per km and year
CO2 CED PM10 SO2 NOx NMVOC t/y*km GJ-equ/y*km t/y*km t/y*km t/y*km t/y*km Rail UIC 60, single track 6'090 96'974 18.29 13.43 13.80 2.18 Rail UIC 60, double track 12'180 193'948 36.58 26.87 27.60 4.37 Rail S49, single track 4'983 79'350 15 11 11 2 Rail S49, double track 9'976 158'859 29.96 22.01 22.61 3.58 Rail S54, single track 5'562 88'584 16.81 12.32 12.58 1.99 Rail S54, double track 11'109 176'926 33.58 24.61 25.12 3.98
Sources : [Schmied & Mottschall], own calculations, the assumed lifespan is 30 years
20 Images from Wikimedia (LooiNL, 2007) and own modifications

IFEU Heidelberg Matthias Tuchschmid Öko-Institut e.V.
25
4.1.6 Mast, catenaries and overhead wiring Electric locomotives and railcars collect the current from the overhead system; it con-sists of the mast (concrete or iron), the catenaries and the overhead wiring itself. Addi-tionally some devices for line tensioning are also needed, however, in this study these extra items are not considered.
Figure 4.7: Assessed types of overhead system: Mast, Catenary and overhead wiring21
1) Wire of Cantenary incl. Overhead wiring
2) Mast (Concrete or Iron)
3) only overhead wiring
Table 4.7: Impact of mast, catenary and overhead wiring per km and year
CO2 CED PM10 SO2 NOx NMVOC t/y*km GJ-equ/y*km t/y*km t/y*km t/y*km t/y*km Wire of catenary, single track 353 6'938 3.91 18.46 4.04 0.70 Wire of catenary, double track 706 13'875 7.83 36.91 8.08 1.41 mast & overhead wiring, concrete, single track 1'367 23'578 3.02 3.82 3.04 0.68 mast & overhead wiring, concrete, double track 2'734 47'155 6.05 7.63 6.08 1.36 mast & overhead wiring, iron, single track 1'235 21'974 3.14 3.57 2.83 0.60 mast & overhead wiring, iron, double track 2'469 43'948 6.28 7.14 5.65 1.20 overhead wiring, single track, tunnel 536 10'413 0.96 1.97 1.16 0.21 overhead wiring, double track, tunnel 1'071 20'826 1.93 3.94 2.32 0.41 Sources : [Schmied & Mottschall], own calculations, assumed lifespan is 10 years for the overhead wiring and 60 years for the mast
21 Images: 1) chelseagirl (2006) 2) AlexHe34 (2010) 3) DBZ2313 (2010)
Öko-Institut e.V. Matthias Tuchschmid IFEU Heidelberg
Carbon footprint of railway infrastructure –20.10.2011 26
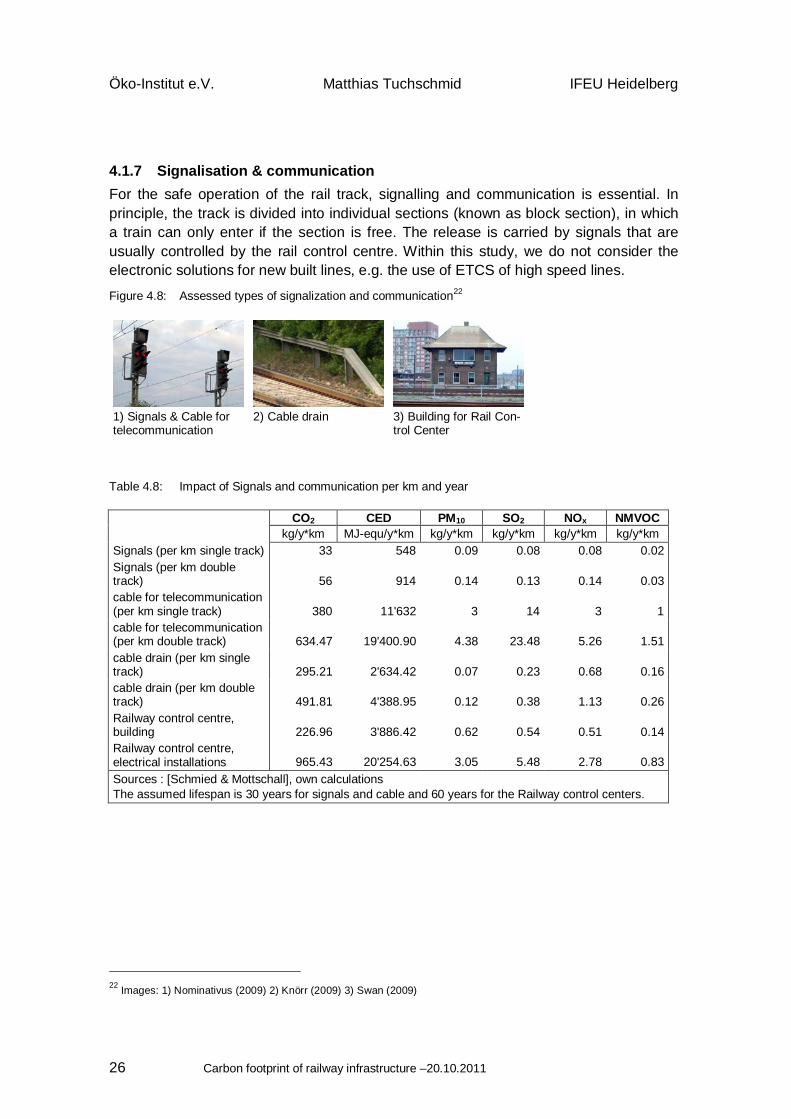
4.1.7 Signalisation & communication For the safe operation of the rail track, signalling and communication is essential. In principle, the track is divided into individual sections (known as block section), in which a train can only enter if the section is free. The release is carried by signals that are usually controlled by the rail control centre. Within this study, we do not consider the electronic solutions for new built lines, e.g. the use of ETCS of high speed lines.
Figure 4.8: Assessed types of signalization and communication22
1) Signals & Cable for telecommunication
2) Cable drain 3) Building for Rail Con-trol Center
Table 4.8: Impact of Signals and communication per km and year
CO2 CED PM10 SO2 NOx NMVOC kg/y*km MJ-equ/y*km kg/y*km kg/y*km kg/y*km kg/y*km Signals (per km single track) 33 548 0.09 0.08 0.08 0.02 Signals (per km double track) 56 914 0.14 0.13 0.14 0.03 cable for telecommunication (per km single track) 380 11'632 3 14 3 1 cable for telecommunication (per km double track) 634.47 19'400.90 4.38 23.48 5.26 1.51 cable drain (per km single track) 295.21 2'634.42 0.07 0.23 0.68 0.16 cable drain (per km double track) 491.81 4'388.95 0.12 0.38 1.13 0.26 Railway control centre, building 226.96 3'886.42 0.62 0.54 0.51 0.14 Railway control centre, electrical installations 965.43 20'254.63 3.05 5.48 2.78 0.83 Sources : [Schmied & Mottschall], own calculations The assumed lifespan is 30 years for signals and cable and 60 years for the Railway control centers.
22 Images: 1) Nominativus (2009) 2) Knörr (2009) 3) Swan (2009)
IFEU Heidelberg Matthias Tuchschmid Öko-Institut e.V.
27
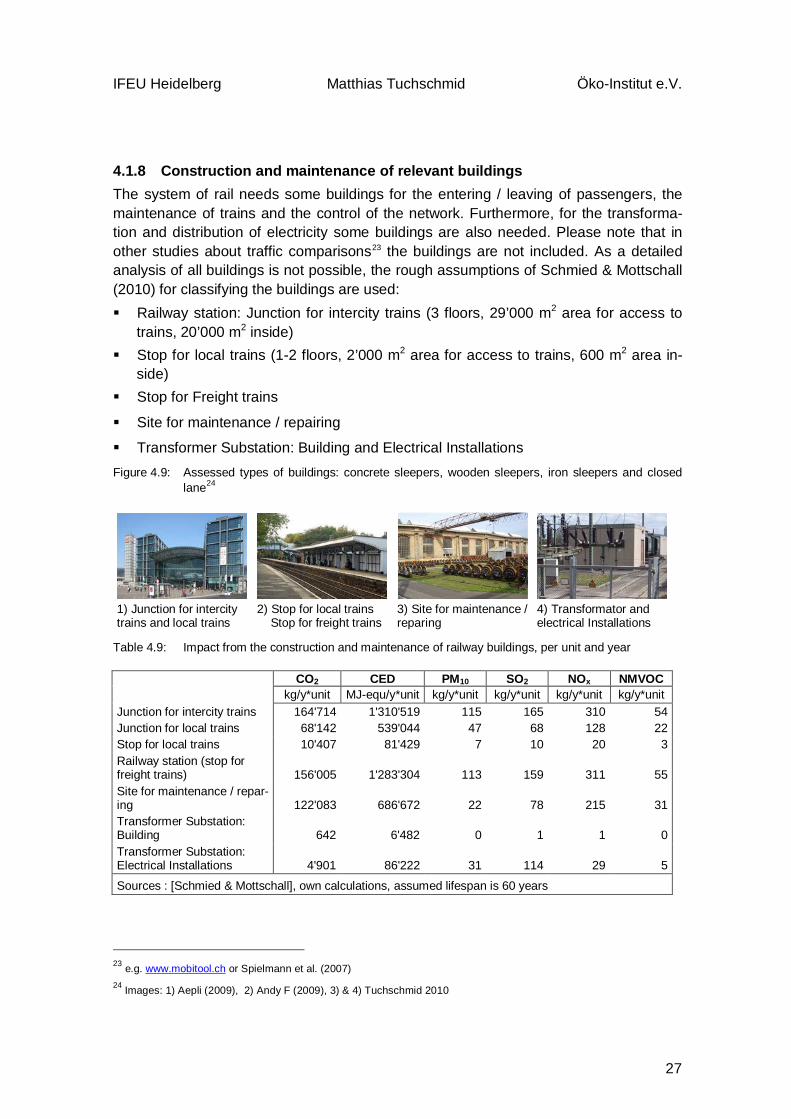
4.1.8 Construction and maintenance of relevant buildings The system of rail needs some buildings for the entering / leaving of passengers, the maintenance of trains and the control of the network. Furthermore, for the transforma-tion and distribution of electricity some buildings are also needed. Please note that in other studies about traffic comparisons23 the buildings are not included. As a detailed analysis of all buildings is not possible, the rough assumptions of Schmied & Mottschall (2010) for classifying the buildings are used: Railway station: Junction for intercity trains (3 floors, 29’000 m2 area for access to
trains, 20’000 m2 inside) Stop for local trains (1-2 floors, 2’000 m2 area for access to trains, 600 m2 area in-
side) Stop for Freight trains
Site for maintenance / repairing
Transformer Substation: Building and Electrical Installations Figure 4.9: Assessed types of buildings: concrete sleepers, wooden sleepers, iron sleepers and closed
lane24
1) Junction for intercity trains and local trains
2) Stop for local trains Stop for freight trains
3) Site for maintenance / reparing
4) Transformator and electrical Installations
Table 4.9: Impact from the construction and maintenance of railway buildings, per unit and year
CO2 CED PM10 SO2 NOx NMVOC kg/y*unit MJ-equ/y*unit kg/y*unit kg/y*unit kg/y*unit kg/y*unit Junction for intercity trains 164'714 1'310'519 115 165 310 54 Junction for local trains 68'142 539'044 47 68 128 22 Stop for local trains 10'407 81'429 7 10 20 3 Railway station (stop for freight trains) 156'005 1'283'304 113 159 311 55 Site for maintenance / repar-ing 122'083 686'672 22 78 215 31 Transformer Substation: Building 642 6'482 0 1 1 0 Transformer Substation: Electrical Installations 4'901 86'222 31 114 29 5
Sources : [Schmied & Mottschall], own calculations, assumed lifespan is 60 years
23 e.g. www.mobitool.ch or Spielmann et al. (2007) 24 Images: 1) Aepli (2009), 2) Andy F (2009), 3) & 4) Tuchschmid 2010
Öko-Institut e.V. Matthias Tuchschmid IFEU Heidelberg
Carbon footprint of railway infrastructure –20.10.2011 28
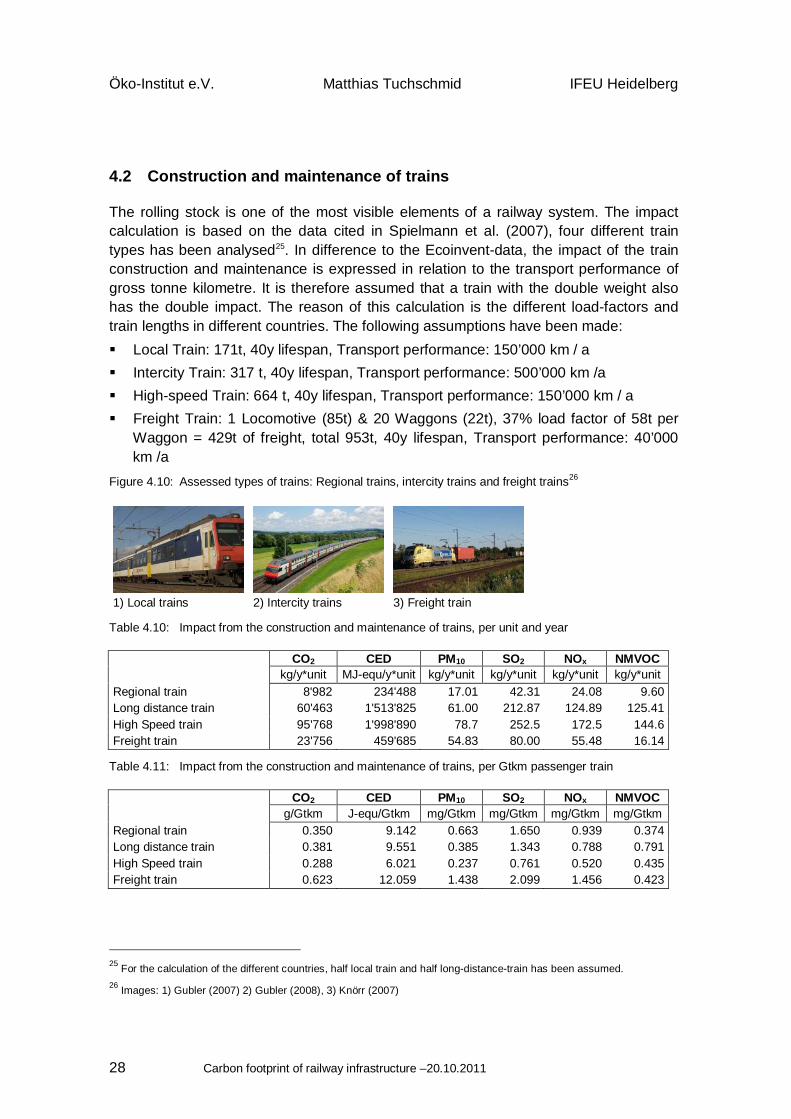
4.2 Construction and maintenance of trains
The rolling stock is one of the most visible elements of a railway system. The impact calculation is based on the data cited in Spielmann et al. (2007), four different train types has been analysed25. In difference to the Ecoinvent-data, the impact of the train construction and maintenance is expressed in relation to the transport performance of gross tonne kilometre. It is therefore assumed that a train with the double weight also has the double impact. The reason of this calculation is the different load-factors and train lengths in different countries. The following assumptions have been made: Local Train: 171t, 40y lifespan, Transport performance: 150’000 km / a Intercity Train: 317 t, 40y lifespan, Transport performance: 500’000 km /a High-speed Train: 664 t, 40y lifespan, Transport performance: 150’000 km / a Freight Train: 1 Locomotive (85t) & 20 Waggons (22t), 37% load factor of 58t per
Waggon = 429t of freight, total 953t, 40y lifespan, Transport performance: 40’000 km /a
Figure 4.10: Assessed types of trains: Regional trains, intercity trains and freight trains26
1) Local trains 2) Intercity trains 3) Freight train
Table 4.10: Impact from the construction and maintenance of trains, per unit and year
CO2 CED PM10 SO2 NOx NMVOC kg/y*unit MJ-equ/y*unit kg/y*unit kg/y*unit kg/y*unit kg/y*unit Regional train 8'982 234'488 17.01 42.31 24.08 9.60 Long distance train 60'463 1'513'825 61.00 212.87 124.89 125.41 High Speed train 95'768 1'998'890 78.7 252.5 172.5 144.6 Freight train 23'756 459'685 54.83 80.00 55.48 16.14
Table 4.11: Impact from the construction and maintenance of trains, per Gtkm passenger train
CO2 CED PM10 SO2 NOx NMVOC g/Gtkm J-equ/Gtkm mg/Gtkm mg/Gtkm mg/Gtkm mg/Gtkm Regional train 0.350 9.142 0.663 1.650 0.939 0.374 Long distance train 0.381 9.551 0.385 1.343 0.788 0.791 High Speed train 0.288 6.021 0.237 0.761 0.520 0.435 Freight train 0.623 12.059 1.438 2.099 1.456 0.423
25 For the calculation of the different countries, half local train and half long-distance-train has been assumed. 26 Images: 1) Gubler (2007) 2) Gubler (2008), 3) Knörr (2007)
IFEU Heidelberg Matthias Tuchschmid Öko-Institut e.V.
29
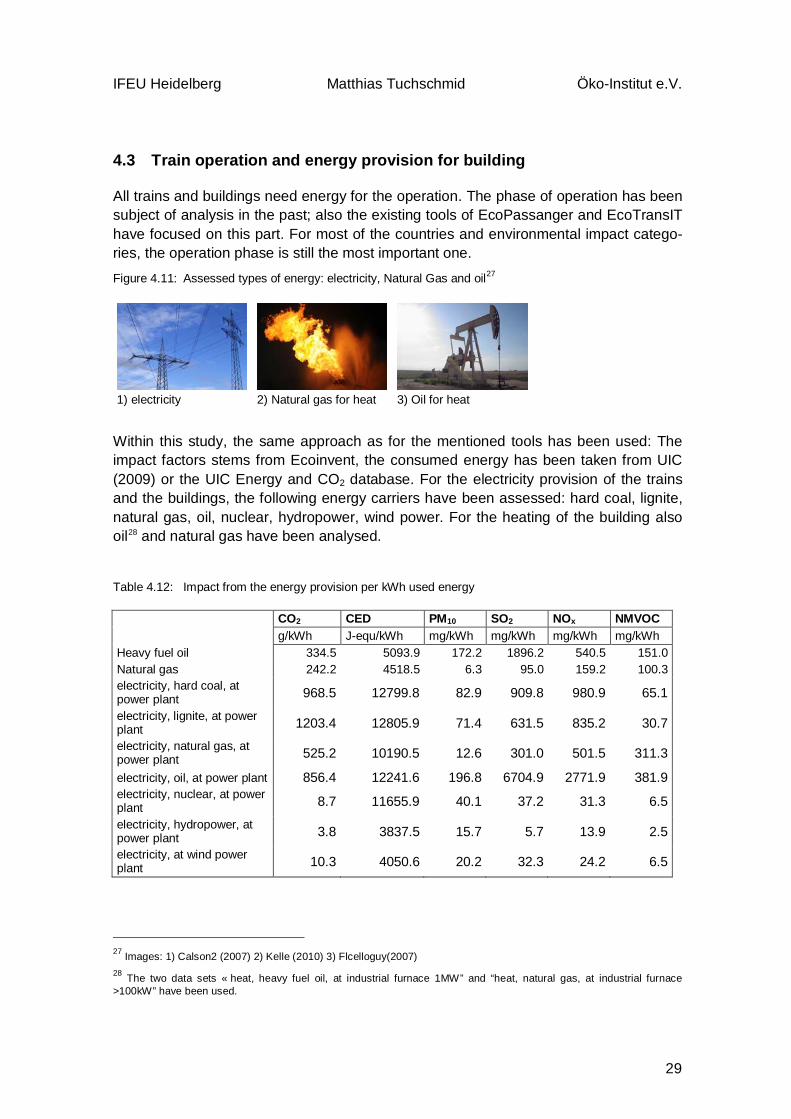
4.3 Train operation and energy provision for building
All trains and buildings need energy for the operation. The phase of operation has been subject of analysis in the past; also the existing tools of EcoPassanger and EcoTransIT have focused on this part. For most of the countries and environmental impact catego-ries, the operation phase is still the most important one.
Figure 4.11: Assessed types of energy: electricity, Natural Gas and oil27
1) electricity 2) Natural gas for heat 3) Oil for heat Within this study, the same approach as for the mentioned tools has been used: The impact factors stems from Ecoinvent, the consumed energy has been taken from UIC (2009) or the UIC Energy and CO2 database. For the electricity provision of the trains and the buildings, the following energy carriers have been assessed: hard coal, lignite, natural gas, oil, nuclear, hydropower, wind power. For the heating of the building also oil28 and natural gas have been analysed.
Table 4.12: Impact from the energy provision per kWh used energy
CO2 CED PM10 SO2 NOx NMVOC g/kWh J-equ/kWh mg/kWh mg/kWh mg/kWh mg/kWh Heavy fuel oil 334.5 5093.9 172.2 1896.2 540.5 151.0 Natural gas 242.2 4518.5 6.3 95.0 159.2 100.3 electricity, hard coal, at power plant 968.5 12799.8 82.9 909.8 980.9 65.1
electricity, lignite, at power plant 1203.4 12805.9 71.4 631.5 835.2 30.7
electricity, natural gas, at power plant 525.2 10190.5 12.6 301.0 501.5 311.3
electricity, oil, at power plant 856.4 12241.6 196.8 6704.9 2771.9 381.9 electricity, nuclear, at power plant 8.7 11655.9 40.1 37.2 31.3 6.5
electricity, hydropower, at power plant 3.8 3837.5 15.7 5.7 13.9 2.5
electricity, at wind power plant 10.3 4050.6 20.2 32.3 24.2 6.5
27 Images: 1) Calson2 (2007) 2) Kelle (2010) 3) Flcelloguy(2007) 28 The two data sets « heat, heavy fuel oil, at industrial furnace 1MW” and “heat, natural gas, at industrial furnace >100kW” have been used.
Öko-Institut e.V. Matthias Tuchschmid IFEU Heidelberg
Carbon footprint of railway infrastructure –20.10.2011 30
5 Relevance of rail infrastructure in several European countries
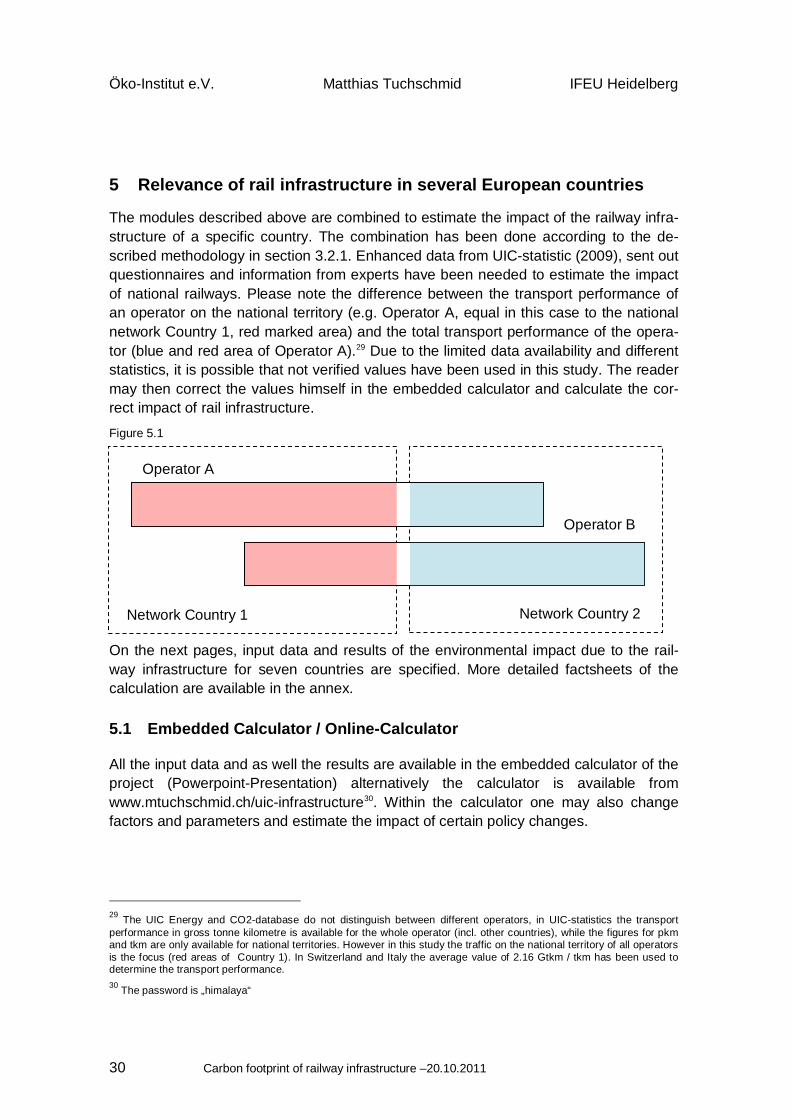
The modules described above are combined to estimate the impact of the railway infra-structure of a specific country. The combination has been done according to the de-scribed methodology in section 3.2.1. Enhanced data from UIC-statistic (2009), sent out questionnaires and information from experts have been needed to estimate the impact of national railways. Please note the difference between the transport performance of an operator on the national territory (e.g. Operator A, equal in this case to the national network Country 1, red marked area) and the total transport performance of the opera-tor (blue and red area of Operator A).29 Due to the limited data availability and different statistics, it is possible that not verified values have been used in this study. The reader may then correct the values himself in the embedded calculator and calculate the cor-rect impact of rail infrastructure.
Figure 5.1
On the next pages, input data and results of the environmental impact due to the rail-way infrastructure for seven countries are specified. More detailed factsheets of the calculation are available in the annex.
5.1 Embedded Calculator / Online-Calculator
All the input data and as well the results are available in the embedded calculator of the project (Powerpoint-Presentation) alternatively the calculator is available from www.mtuchschmid.ch/uic-infrastructure30. Within the calculator one may also change factors and parameters and estimate the impact of certain policy changes.
29 The UIC Energy and CO2-database do not distinguish between different operators, in UIC-statistics the transport performance in gross tonne kilometre is available for the whole operator (incl. other countries), while the figures for pkm and tkm are only available for national territories. However in this study the traffic on the national territory of all operators is the focus (red areas of Country 1). In Switzerland and Italy the average value of 2.16 Gtkm / tkm has been used to determine the transport performance. 30 The password is „himalaya“
Network Country 1 Network Country 2
Operator A
Operator B
IFEU Heidelberg Matthias Tuchschmid Öko-Institut e.V.
31
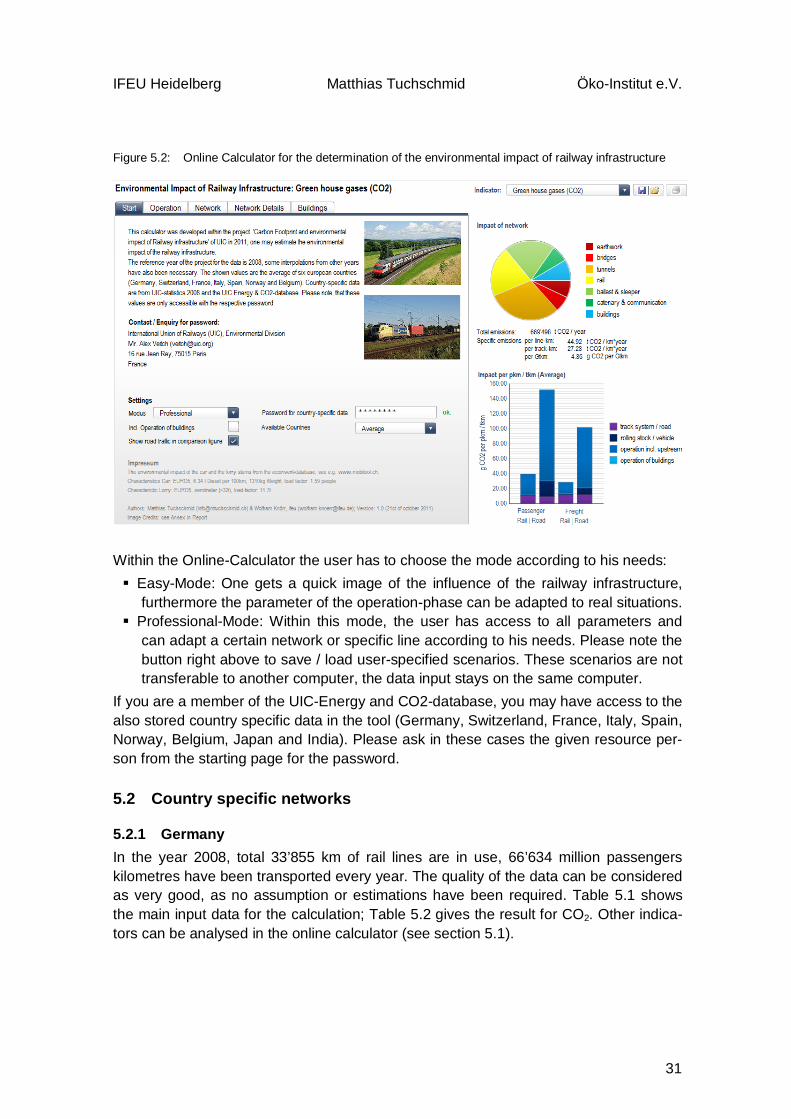
Figure 5.2: Online Calculator for the determination of the environmental impact of railway infrastructure
Within the Online-Calculator the user has to choose the mode according to his needs: Easy-Mode: One gets a quick image of the influence of the railway infrastructure,
furthermore the parameter of the operation-phase can be adapted to real situations. Professional-Mode: Within this mode, the user has access to all parameters and
can adapt a certain network or specific line according to his needs. Please note the button right above to save / load user-specified scenarios. These scenarios are not transferable to another computer, the data input stays on the same computer.
If you are a member of the UIC-Energy and CO2-database, you may have access to the also stored country specific data in the tool (Germany, Switzerland, France, Italy, Spain, Norway, Belgium, Japan and India). Please ask in these cases the given resource per-son from the starting page for the password.
5.2 Country specific networks
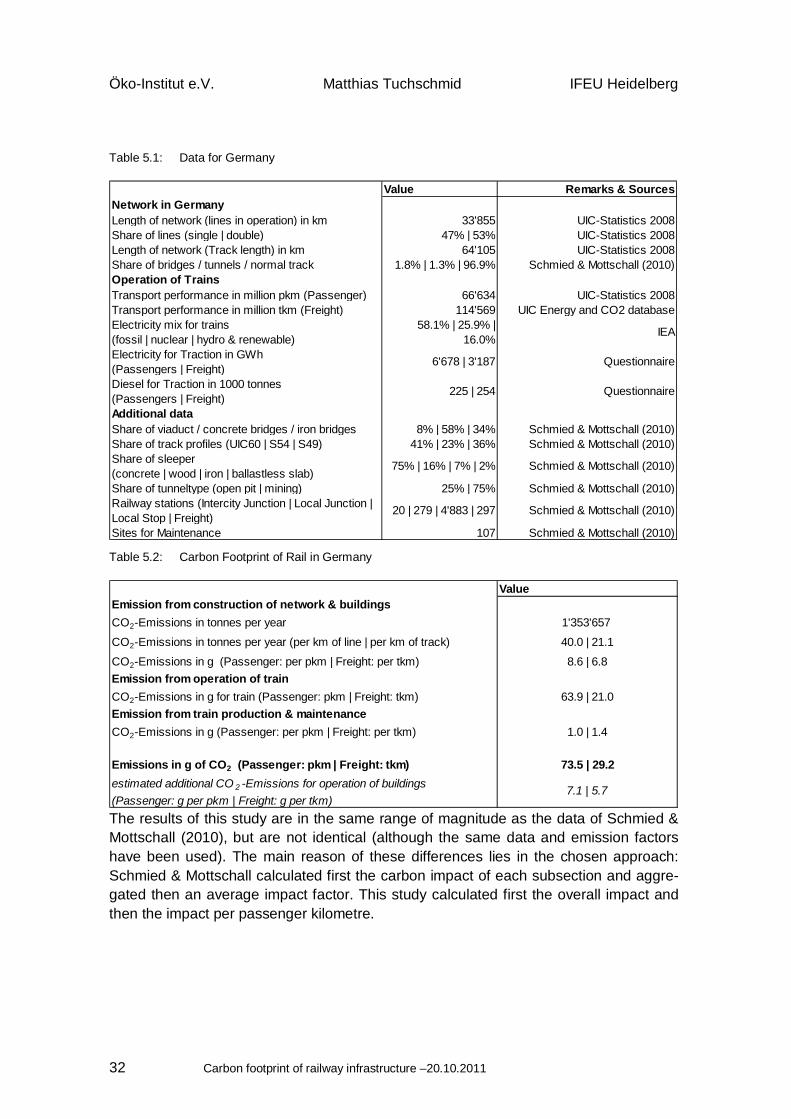
5.2.1 Germany In the year 2008, total 33’855 km of rail lines are in use, 66’634 million passengers kilometres have been transported every year. The quality of the data can be considered as very good, as no assumption or estimations have been required. Table 5.1 shows the main input data for the calculation; Table 5.2 gives the result for CO2. Other indica-tors can be analysed in the online calculator (see section 5.1).
Öko-Institut e.V. Matthias Tuchschmid IFEU Heidelberg
Carbon footprint of railway infrastructure –20.10.2011 32
Table 5.1: Data for Germany
Value Remarks & SourcesNetwork in GermanyLength of network (lines in operation) in km 33'855 UIC-Statistics 2008Share of lines (single | double) 47% | 53% UIC-Statistics 2008Length of network (Track length) in km 64'105 UIC-Statistics 2008Share of bridges / tunnels / normal track 1.8% | 1.3% | 96.9% Schmied & Mottschall (2010) Operation of TrainsTransport performance in million pkm (Passenger) 66'634 UIC-Statistics 2008Transport performance in million tkm (Freight) 114'569 UIC Energy and CO2 databaseElectricity mix for trains (fossil | nuclear | hydro & renewable)
58.1% | 25.9% | 16.0%
IEA
Electricity for Traction in GWh (Passengers | Freight)
6'678 | 3'187 Questionnaire
Diesel for Traction in 1000 tonnes (Passengers | Freight)
225 | 254 Questionnaire
Additional dataShare of viaduct / concrete bridges / iron bridges 8% | 58% | 34% Schmied & Mottschall (2010) Share of track profiles (UIC60 | S54 | S49) 41% | 23% | 36% Schmied & Mottschall (2010) Share of sleeper (concrete | wood | iron | ballastless slab)
75% | 16% | 7% | 2% Schmied & Mottschall (2010)
Share of tunneltype (open pit | mining) 25% | 75% Schmied & Mottschall (2010) Railway stations (Intercity Junction | Local Junction | Local Stop | Freight)
20 | 279 | 4'883 | 297 Schmied & Mottschall (2010)
Sites for Maintenance 107 Schmied & Mottschall (2010)
Table 5.2: Carbon Footprint of Rail in Germany
ValueEmission from construction of network & buildingsCO2-Emissions in tonnes per year 1'353'657
CO2-Emissions in tonnes per year (per km of line | per km of track) 40.0 | 21.1
CO2-Emissions in g (Passenger: per pkm | Freight: per tkm) 8.6 | 6.8Emission from operation of trainCO2-Emissions in g for train (Passenger: pkm | Freight: tkm) 63.9 | 21.0Emission from train production & maintenanceCO2-Emissions in g (Passenger: per pkm | Freight: per tkm) 1.0 | 1.4
Emissions in g of CO2 (Passenger: pkm | Freight: tkm) 73.5 | 29.2estimated additional CO 2 -Emissions for operation of buildings (Passenger: g per pkm | Freight: g per tkm)
7.1 | 5.7
The results of this study are in the same range of magnitude as the data of Schmied & Mottschall (2010), but are not identical (although the same data and emission factors have been used). The main reason of these differences lies in the chosen approach: Schmied & Mottschall calculated first the carbon impact of each subsection and aggre-gated then an average impact factor. This study calculated first the overall impact and then the impact per passenger kilometre.
IFEU Heidelberg Matthias Tuchschmid Öko-Institut e.V.
33
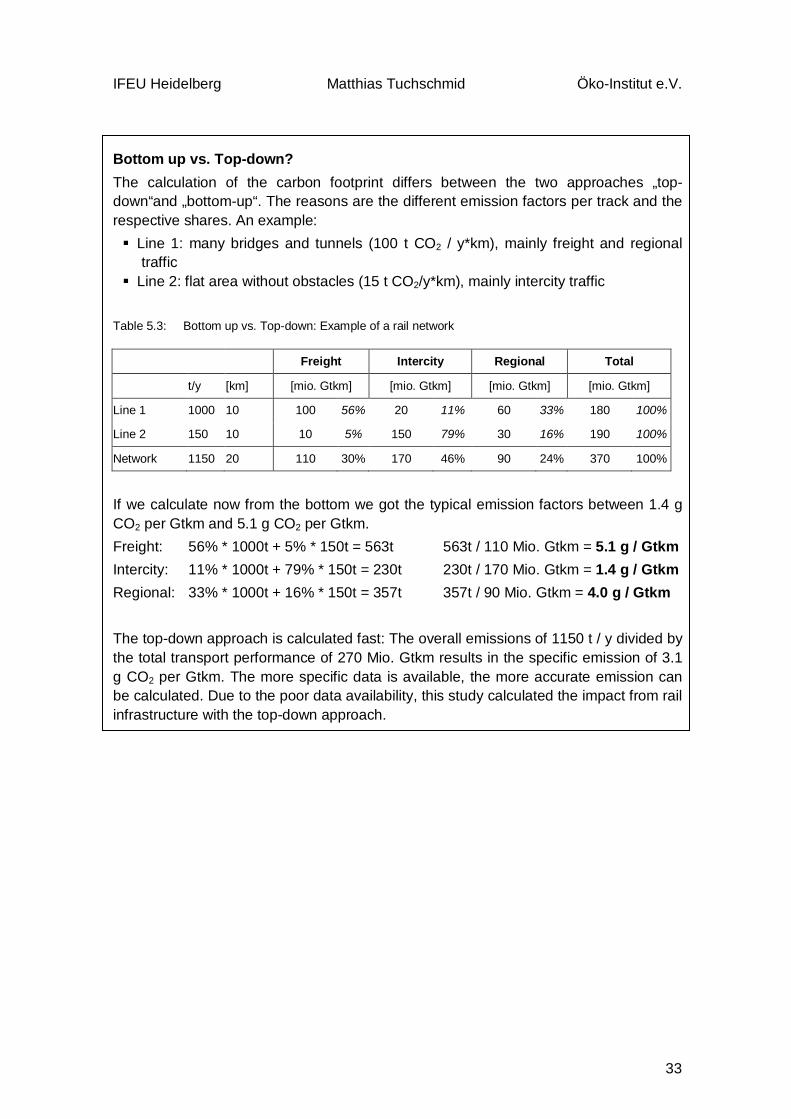
Bottom up vs. Top-down? The calculation of the carbon footprint differs between the two approaches „top-down“and „bottom-up“. The reasons are the different emission factors per track and the respective shares. An example: Line 1: many bridges and tunnels (100 t CO2 / y*km), mainly freight and regional
traffic Line 2: flat area without obstacles (15 t CO2/y*km), mainly intercity traffic
Table 5.3: Bottom up vs. Top-down: Example of a rail network
Freight Intercity Regional Total
t/y [km] [mio. Gtkm] [mio. Gtkm] [mio. Gtkm] [mio. Gtkm]
Line 1 1000 10 100 56% 20 11% 60 33% 180 100%
Line 2 150 10 10 5% 150 79% 30 16% 190 100%
Network 1150 20 110 30% 170 46% 90 24% 370 100%
If we calculate now from the bottom we got the typical emission factors between 1.4 g CO2 per Gtkm and 5.1 g CO2 per Gtkm. Freight: 56% * 1000t + 5% * 150t = 563t 563t / 110 Mio. Gtkm = 5.1 g / Gtkm Intercity: 11% * 1000t + 79% * 150t = 230t 230t / 170 Mio. Gtkm = 1.4 g / Gtkm Regional: 33% * 1000t + 16% * 150t = 357t 357t / 90 Mio. Gtkm = 4.0 g / Gtkm The top-down approach is calculated fast: The overall emissions of 1150 t / y divided by the total transport performance of 270 Mio. Gtkm results in the specific emission of 3.1 g CO2 per Gtkm. The more specific data is available, the more accurate emission can be calculated. Due to the poor data availability, this study calculated the impact from rail infrastructure with the top-down approach.
Öko-Institut e.V. Matthias Tuchschmid IFEU Heidelberg
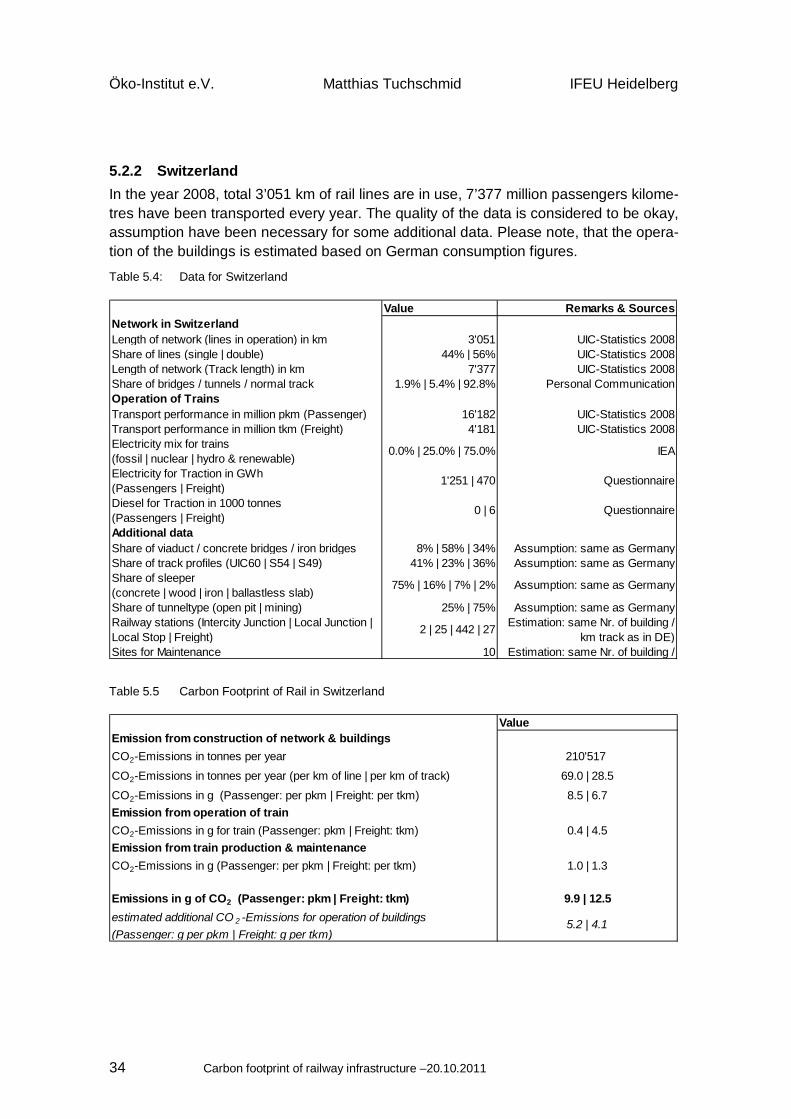
Carbon footprint of railway infrastructure –20.10.2011 34
5.2.2 Switzerland In the year 2008, total 3’051 km of rail lines are in use, 7’377 million passengers kilome-tres have been transported every year. The quality of the data is considered to be okay, assumption have been necessary for some additional data. Please note, that the opera-tion of the buildings is estimated based on German consumption figures.
Table 5.4: Data for Switzerland
Value Remarks & SourcesNetwork in SwitzerlandLength of network (lines in operation) in km 3'051 UIC-Statistics 2008Share of lines (single | double) 44% | 56% UIC-Statistics 2008Length of network (Track length) in km 7'377 UIC-Statistics 2008Share of bridges / tunnels / normal track 1.9% | 5.4% | 92.8% Personal Communication Operation of TrainsTransport performance in million pkm (Passenger) 16'182 UIC-Statistics 2008Transport performance in million tkm (Freight) 4'181 UIC-Statistics 2008Electricity mix for trains (fossil | nuclear | hydro & renewable)
0.0% | 25.0% | 75.0% IEA
Electricity for Traction in GWh (Passengers | Freight)
1'251 | 470 Questionnaire
Diesel for Traction in 1000 tonnes (Passengers | Freight)
0 | 6 Questionnaire
Additional dataShare of viaduct / concrete bridges / iron bridges 8% | 58% | 34% Assumption: same as Germany Share of track profiles (UIC60 | S54 | S49) 41% | 23% | 36% Assumption: same as Germany Share of sleeper (concrete | wood | iron | ballastless slab)
75% | 16% | 7% | 2% Assumption: same as Germany
Share of tunneltype (open pit | mining) 25% | 75% Assumption: same as Germany Railway stations (Intercity Junction | Local Junction | Local Stop | Freight)
2 | 25 | 442 | 27 Estimation: same Nr. of building / km track as in DE)
Sites for Maintenance 10 Estimation: same Nr. of building /
Table 5.5 Carbon Footprint of Rail in Switzerland
ValueEmission from construction of network & buildingsCO2-Emissions in tonnes per year 210'517
CO2-Emissions in tonnes per year (per km of line | per km of track) 69.0 | 28.5
CO2-Emissions in g (Passenger: per pkm | Freight: per tkm) 8.5 | 6.7Emission from operation of trainCO2-Emissions in g for train (Passenger: pkm | Freight: tkm) 0.4 | 4.5Emission from train production & maintenanceCO2-Emissions in g (Passenger: per pkm | Freight: per tkm) 1.0 | 1.3
Emissions in g of CO2 (Passenger: pkm | Freight: tkm) 9.9 | 12.5estimated additional CO 2 -Emissions for operation of buildings (Passenger: g per pkm | Freight: g per tkm)
5.2 | 4.1
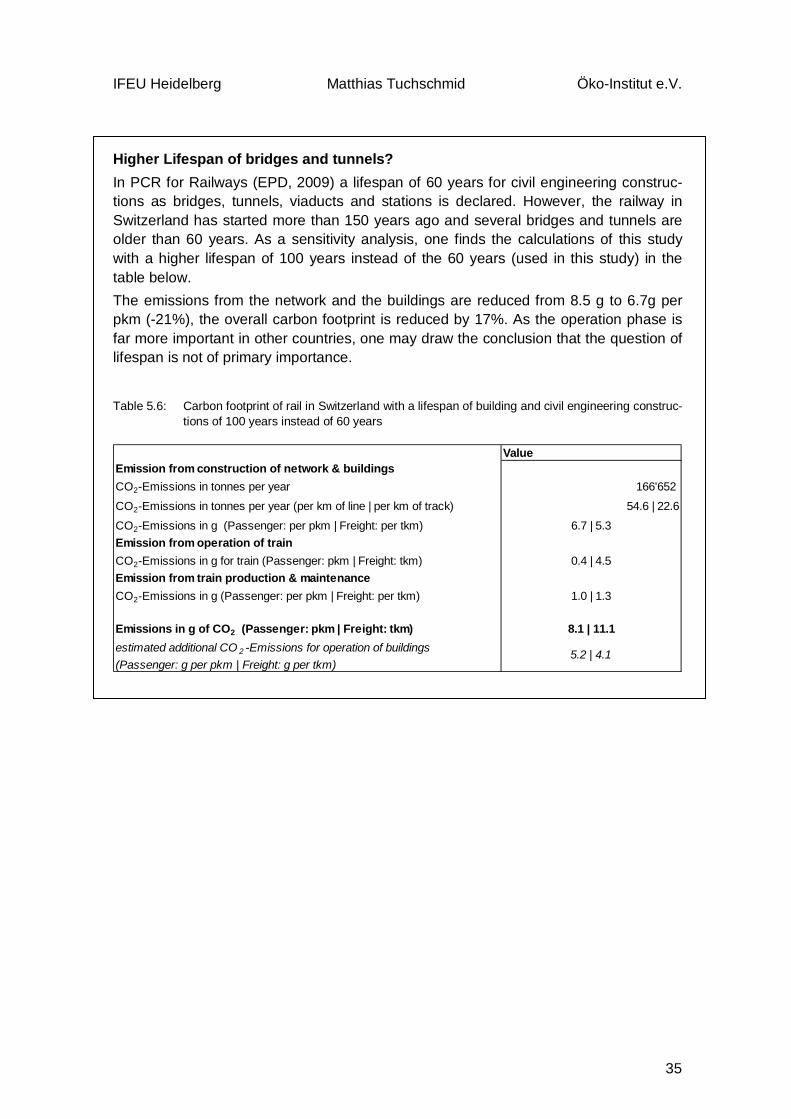
IFEU Heidelberg Matthias Tuchschmid Öko-Institut e.V.
35
Higher Lifespan of bridges and tunnels? In PCR for Railways (EPD, 2009) a lifespan of 60 years for civil engineering construc-tions as bridges, tunnels, viaducts and stations is declared. However, the railway in Switzerland has started more than 150 years ago and several bridges and tunnels are older than 60 years. As a sensitivity analysis, one finds the calculations of this study with a higher lifespan of 100 years instead of the 60 years (used in this study) in the table below. The emissions from the network and the buildings are reduced from 8.5 g to 6.7g per pkm (-21%), the overall carbon footprint is reduced by 17%. As the operation phase is far more important in other countries, one may draw the conclusion that the question of lifespan is not of primary importance.
Table 5.6: Carbon footprint of rail in Switzerland with a lifespan of building and civil engineering construc-tions of 100 years instead of 60 years
ValueEmission from construction of network & buildingsCO2-Emissions in tonnes per year 166'652
CO2-Emissions in tonnes per year (per km of line | per km of track) 54.6 | 22.6
CO2-Emissions in g (Passenger: per pkm | Freight: per tkm) 6.7 | 5.3Emission from operation of trainCO2-Emissions in g for train (Passenger: pkm | Freight: tkm) 0.4 | 4.5Emission from train production & maintenanceCO2-Emissions in g (Passenger: per pkm | Freight: per tkm) 1.0 | 1.3
Emissions in g of CO2 (Passenger: pkm | Freight: tkm) 8.1 | 11.1estimated additional CO 2 -Emissions for operation of buildings (Passenger: g per pkm | Freight: g per tkm)
5.2 | 4.1
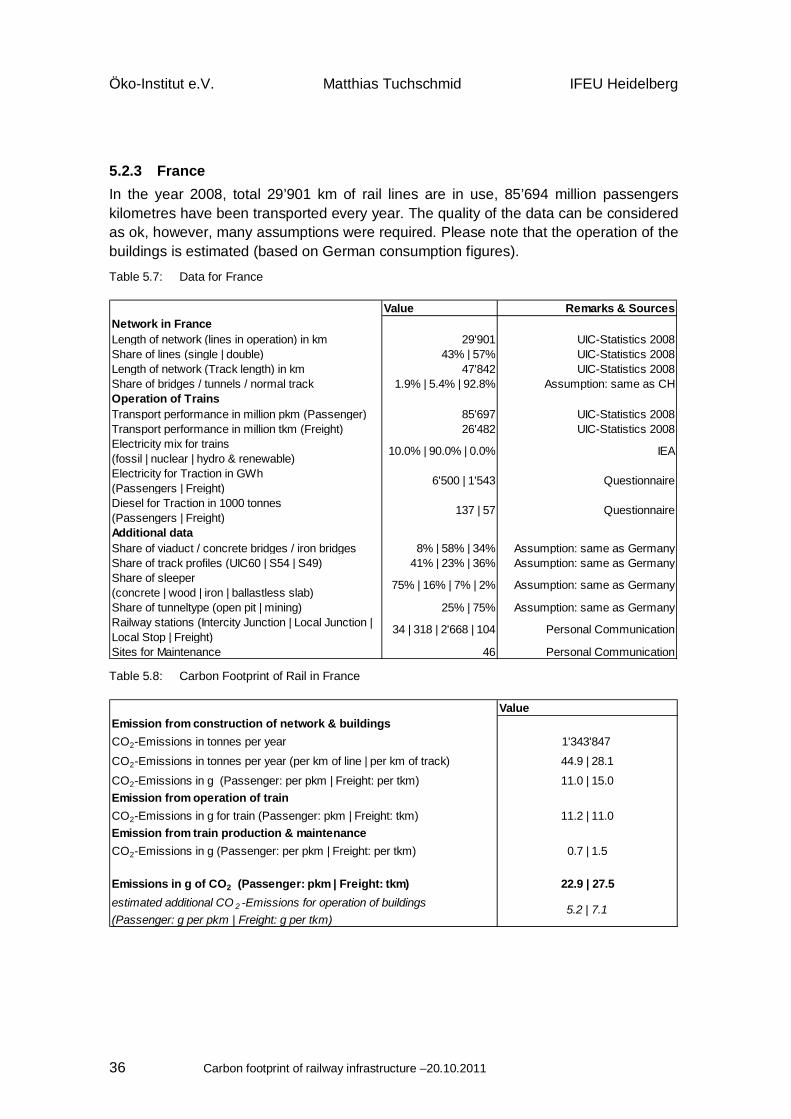
Öko-Institut e.V. Matthias Tuchschmid IFEU Heidelberg
Carbon footprint of railway infrastructure –20.10.2011 36
5.2.3 France In the year 2008, total 29’901 km of rail lines are in use, 85’694 million passengers kilometres have been transported every year. The quality of the data can be considered as ok, however, many assumptions were required. Please note that the operation of the buildings is estimated (based on German consumption figures).
Table 5.7: Data for France
Value Remarks & SourcesNetwork in FranceLength of network (lines in operation) in km 29'901 UIC-Statistics 2008Share of lines (single | double) 43% | 57% UIC-Statistics 2008Length of network (Track length) in km 47'842 UIC-Statistics 2008Share of bridges / tunnels / normal track 1.9% | 5.4% | 92.8% Assumption: same as CH Operation of TrainsTransport performance in million pkm (Passenger) 85'697 UIC-Statistics 2008Transport performance in million tkm (Freight) 26'482 UIC-Statistics 2008Electricity mix for trains (fossil | nuclear | hydro & renewable)
10.0% | 90.0% | 0.0% IEA
Electricity for Traction in GWh (Passengers | Freight)
6'500 | 1'543 Questionnaire
Diesel for Traction in 1000 tonnes (Passengers | Freight)
137 | 57 Questionnaire
Additional dataShare of viaduct / concrete bridges / iron bridges 8% | 58% | 34% Assumption: same as Germany Share of track profiles (UIC60 | S54 | S49) 41% | 23% | 36% Assumption: same as Germany Share of sleeper (concrete | wood | iron | ballastless slab)
75% | 16% | 7% | 2% Assumption: same as Germany
Share of tunneltype (open pit | mining) 25% | 75% Assumption: same as Germany Railway stations (Intercity Junction | Local Junction | Local Stop | Freight)
34 | 318 | 2'668 | 104 Personal Communication
Sites for Maintenance 46 Personal Communication
Table 5.8: Carbon Footprint of Rail in France
ValueEmission from construction of network & buildingsCO2-Emissions in tonnes per year 1'343'847
CO2-Emissions in tonnes per year (per km of line | per km of track) 44.9 | 28.1
CO2-Emissions in g (Passenger: per pkm | Freight: per tkm) 11.0 | 15.0Emission from operation of trainCO2-Emissions in g for train (Passenger: pkm | Freight: tkm) 11.2 | 11.0Emission from train production & maintenanceCO2-Emissions in g (Passenger: per pkm | Freight: per tkm) 0.7 | 1.5
Emissions in g of CO2 (Passenger: pkm | Freight: tkm) 22.9 | 27.5estimated additional CO 2 -Emissions for operation of buildings (Passenger: g per pkm | Freight: g per tkm)
5.2 | 7.1
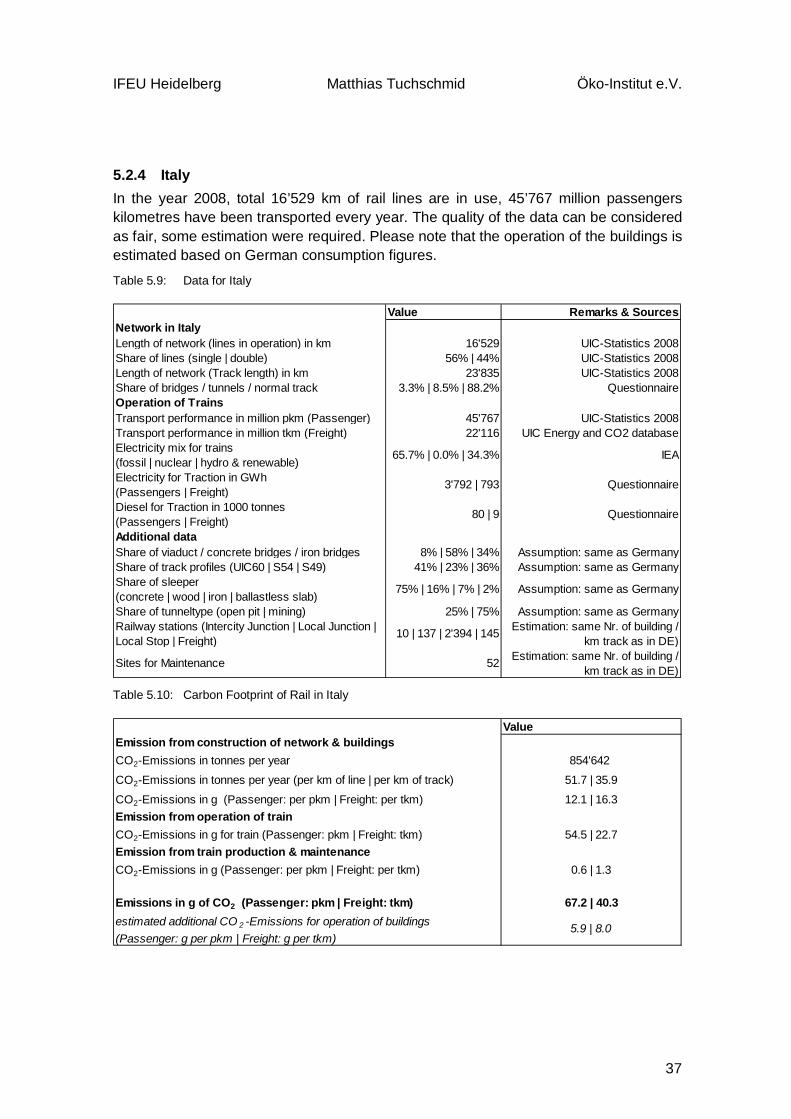
IFEU Heidelberg Matthias Tuchschmid Öko-Institut e.V.
37
5.2.4 Italy In the year 2008, total 16’529 km of rail lines are in use, 45’767 million passengers kilometres have been transported every year. The quality of the data can be considered as fair, some estimation were required. Please note that the operation of the buildings is estimated based on German consumption figures.
Table 5.9: Data for Italy
Value Remarks & SourcesNetwork in ItalyLength of network (lines in operation) in km 16'529 UIC-Statistics 2008Share of lines (single | double) 56% | 44% UIC-Statistics 2008Length of network (Track length) in km 23'835 UIC-Statistics 2008Share of bridges / tunnels / normal track 3.3% | 8.5% | 88.2% Questionnaire Operation of TrainsTransport performance in million pkm (Passenger) 45'767 UIC-Statistics 2008Transport performance in million tkm (Freight) 22'116 UIC Energy and CO2 databaseElectricity mix for trains (fossil | nuclear | hydro & renewable)
65.7% | 0.0% | 34.3% IEA
Electricity for Traction in GWh (Passengers | Freight)
3'792 | 793 Questionnaire
Diesel for Traction in 1000 tonnes (Passengers | Freight)
80 | 9 Questionnaire
Additional dataShare of viaduct / concrete bridges / iron bridges 8% | 58% | 34% Assumption: same as Germany Share of track profiles (UIC60 | S54 | S49) 41% | 23% | 36% Assumption: same as Germany Share of sleeper (concrete | wood | iron | ballastless slab)
75% | 16% | 7% | 2% Assumption: same as Germany
Share of tunneltype (open pit | mining) 25% | 75% Assumption: same as Germany Railway stations (Intercity Junction | Local Junction | Local Stop | Freight)
10 | 137 | 2'394 | 145 Estimation: same Nr. of building / km track as in DE)
Sites for Maintenance 52 Estimation: same Nr. of building / km track as in DE)
Table 5.10: Carbon Footprint of Rail in Italy
ValueEmission from construction of network & buildingsCO2-Emissions in tonnes per year 854'642
CO2-Emissions in tonnes per year (per km of line | per km of track) 51.7 | 35.9
CO2-Emissions in g (Passenger: per pkm | Freight: per tkm) 12.1 | 16.3Emission from operation of trainCO2-Emissions in g for train (Passenger: pkm | Freight: tkm) 54.5 | 22.7Emission from train production & maintenanceCO2-Emissions in g (Passenger: per pkm | Freight: per tkm) 0.6 | 1.3
Emissions in g of CO2 (Passenger: pkm | Freight: tkm) 67.2 | 40.3estimated additional CO 2 -Emissions for operation of buildings (Passenger: g per pkm | Freight: g per tkm)
5.9 | 8.0
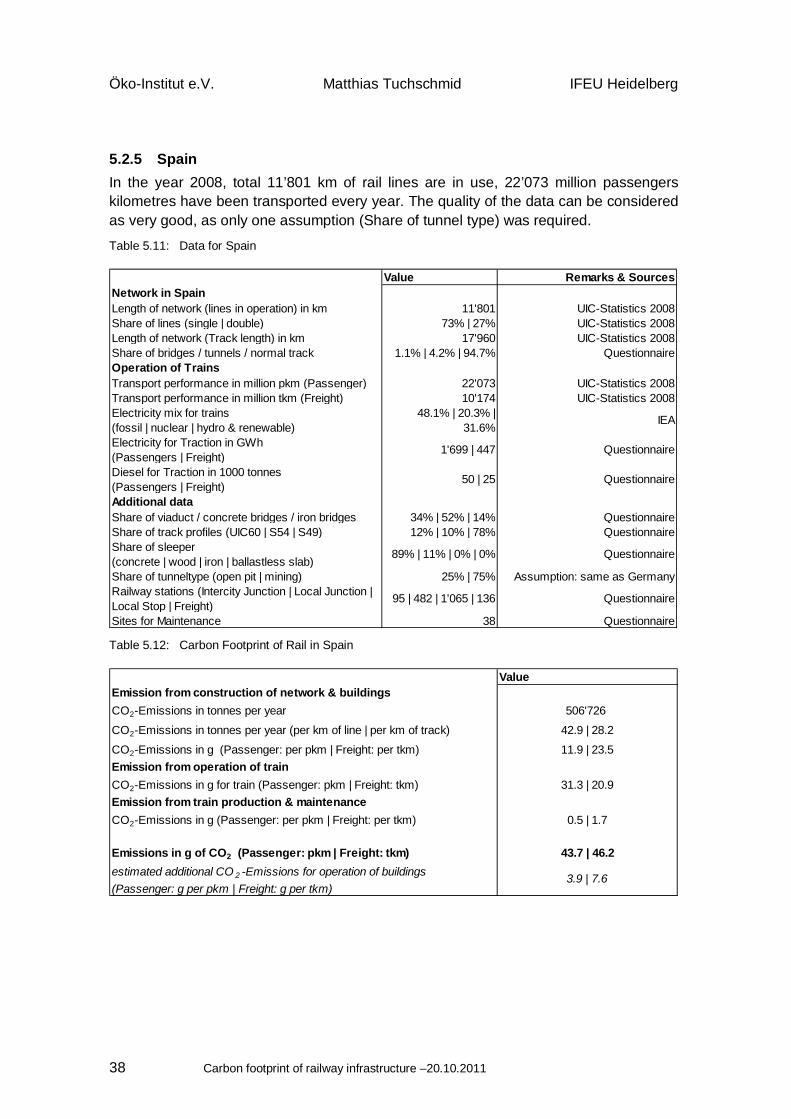
Öko-Institut e.V. Matthias Tuchschmid IFEU Heidelberg
Carbon footprint of railway infrastructure –20.10.2011 38
5.2.5 Spain In the year 2008, total 11’801 km of rail lines are in use, 22’073 million passengers kilometres have been transported every year. The quality of the data can be considered as very good, as only one assumption (Share of tunnel type) was required.
Table 5.11: Data for Spain
Value Remarks & SourcesNetwork in SpainLength of network (lines in operation) in km 11'801 UIC-Statistics 2008Share of lines (single | double) 73% | 27% UIC-Statistics 2008Length of network (Track length) in km 17'960 UIC-Statistics 2008Share of bridges / tunnels / normal track 1.1% | 4.2% | 94.7% Questionnaire Operation of TrainsTransport performance in million pkm (Passenger) 22'073 UIC-Statistics 2008Transport performance in million tkm (Freight) 10'174 UIC-Statistics 2008Electricity mix for trains (fossil | nuclear | hydro & renewable)
48.1% | 20.3% | 31.6%
IEA
Electricity for Traction in GWh (Passengers | Freight)
1'699 | 447 Questionnaire
Diesel for Traction in 1000 tonnes (Passengers | Freight)
50 | 25 Questionnaire
Additional dataShare of viaduct / concrete bridges / iron bridges 34% | 52% | 14% Questionnaire Share of track profiles (UIC60 | S54 | S49) 12% | 10% | 78% Questionnaire Share of sleeper (concrete | wood | iron | ballastless slab)
89% | 11% | 0% | 0% Questionnaire
Share of tunneltype (open pit | mining) 25% | 75% Assumption: same as Germany Railway stations (Intercity Junction | Local Junction | Local Stop | Freight)
95 | 482 | 1'065 | 136 Questionnaire
Sites for Maintenance 38 Questionnaire
Table 5.12: Carbon Footprint of Rail in Spain
ValueEmission from construction of network & buildingsCO2-Emissions in tonnes per year 506'726
CO2-Emissions in tonnes per year (per km of line | per km of track) 42.9 | 28.2
CO2-Emissions in g (Passenger: per pkm | Freight: per tkm) 11.9 | 23.5Emission from operation of trainCO2-Emissions in g for train (Passenger: pkm | Freight: tkm) 31.3 | 20.9Emission from train production & maintenanceCO2-Emissions in g (Passenger: per pkm | Freight: per tkm) 0.5 | 1.7
Emissions in g of CO2 (Passenger: pkm | Freight: tkm) 43.7 | 46.2estimated additional CO 2 -Emissions for operation of buildings (Passenger: g per pkm | Freight: g per tkm)
3.9 | 7.6
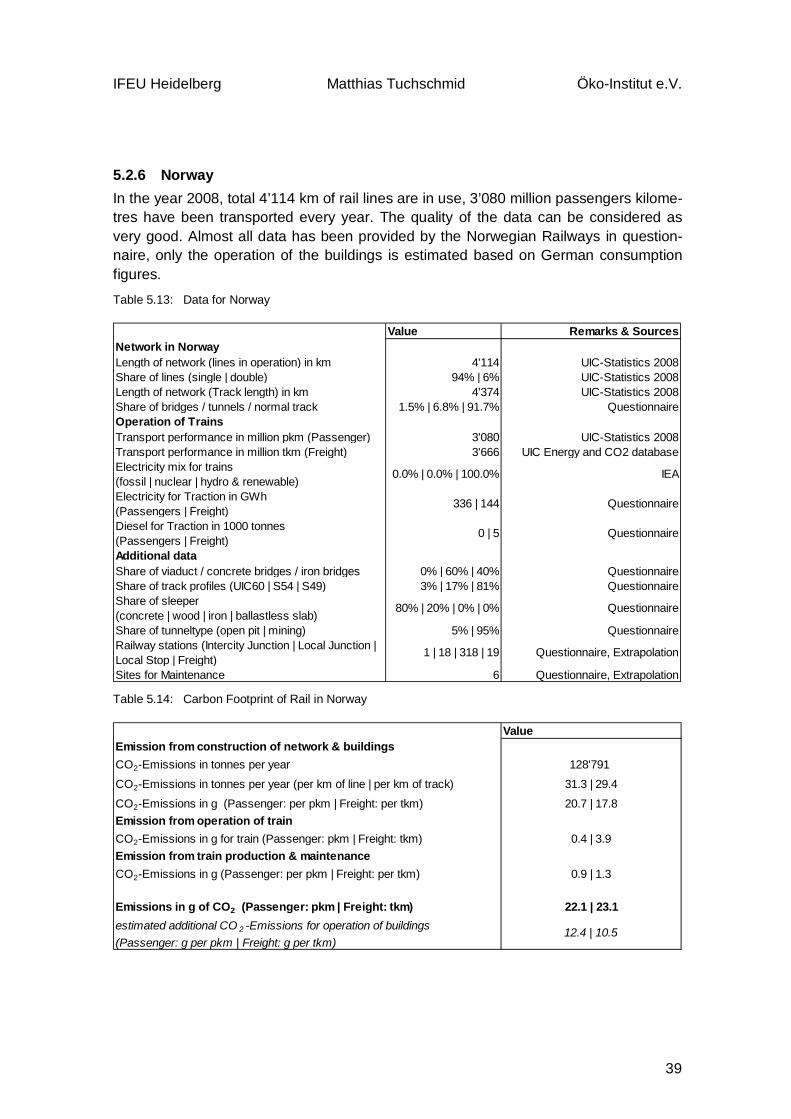
IFEU Heidelberg Matthias Tuchschmid Öko-Institut e.V.
39
5.2.6 Norway In the year 2008, total 4’114 km of rail lines are in use, 3’080 million passengers kilome-tres have been transported every year. The quality of the data can be considered as very good. Almost all data has been provided by the Norwegian Railways in question-naire, only the operation of the buildings is estimated based on German consumption figures.
Table 5.13: Data for Norway
Value Remarks & SourcesNetwork in NorwayLength of network (lines in operation) in km 4'114 UIC-Statistics 2008Share of lines (single | double) 94% | 6% UIC-Statistics 2008Length of network (Track length) in km 4'374 UIC-Statistics 2008Share of bridges / tunnels / normal track 1.5% | 6.8% | 91.7% Questionnaire Operation of TrainsTransport performance in million pkm (Passenger) 3'080 UIC-Statistics 2008Transport performance in million tkm (Freight) 3'666 UIC Energy and CO2 databaseElectricity mix for trains (fossil | nuclear | hydro & renewable)
0.0% | 0.0% | 100.0% IEA
Electricity for Traction in GWh (Passengers | Freight)
336 | 144 Questionnaire
Diesel for Traction in 1000 tonnes (Passengers | Freight)
0 | 5 Questionnaire
Additional dataShare of viaduct / concrete bridges / iron bridges 0% | 60% | 40% Questionnaire Share of track profiles (UIC60 | S54 | S49) 3% | 17% | 81% Questionnaire Share of sleeper (concrete | wood | iron | ballastless slab)
80% | 20% | 0% | 0% Questionnaire
Share of tunneltype (open pit | mining) 5% | 95% Questionnaire Railway stations (Intercity Junction | Local Junction | Local Stop | Freight)
1 | 18 | 318 | 19 Questionnaire, Extrapolation
Sites for Maintenance 6 Questionnaire, Extrapolation
Table 5.14: Carbon Footprint of Rail in Norway
ValueEmission from construction of network & buildingsCO2-Emissions in tonnes per year 128'791
CO2-Emissions in tonnes per year (per km of line | per km of track) 31.3 | 29.4
CO2-Emissions in g (Passenger: per pkm | Freight: per tkm) 20.7 | 17.8Emission from operation of trainCO2-Emissions in g for train (Passenger: pkm | Freight: tkm) 0.4 | 3.9Emission from train production & maintenanceCO2-Emissions in g (Passenger: per pkm | Freight: per tkm) 0.9 | 1.3
Emissions in g of CO2 (Passenger: pkm | Freight: tkm) 22.1 | 23.1estimated additional CO 2 -Emissions for operation of buildings (Passenger: g per pkm | Freight: g per tkm)
12.4 | 10.5

Öko-Institut e.V. Matthias Tuchschmid IFEU Heidelberg
Carbon footprint of railway infrastructure –20.10.2011 40
5.2.7 Belgium In the year 2008, total 3’513 km of rail lines are in use, 10’404 million passengers kilo-metres have been transported every year. The quality of the data can be considered as fair, some estimation were required. Please note that the operation of the buildings is estimated based on German consumption figures.
Table 5.15: Data for Belgium
Value Remarks & SourcesNetwork in BelgiumLength of network (lines in operation) in km 3'513 UIC-Statistics 2008Share of lines (single | double) 12% | 88% UIC-Statistics 2008Length of network (Track length) in km 6'283 UIC-Statistics 2008Share of bridges / tunnels / normal track 2.2% | 1.3% | 96.5% Questionnaire Operation of TrainsTransport performance in million pkm (Passenger) 10'404 UIC-Statistics 2008Transport performance in million tkm (Freight) 7'882 UIC Energy and CO2 databaseElectricity mix for trains (fossil | nuclear | hydro & renewable)
39.6% | 58.4% | 2.0% IEA
Electricity for Traction in GWh (Passengers | Freight)
1'083 | 324 Questionnaire
Diesel for Traction in 1000 tonnes (Passengers | Freight)
11 | 26 Questionnaire
Additional dataShare of viaduct / concrete bridges / iron bridges 26% | 57% | 17% Questionnaire Share of track profiles (UIC60 | S54 | S49) 37% | 63% | 0% Questionnaire Share of sleeper (concrete | wood | iron | ballastless slab)
77% | 23% | 0% | 0% Questionnaire
Share of tunneltype (open pit | mining) 25% | 75% Assumption: same as Germany Railway stations (Intercity Junction | Local Junction | Local Stop | Freight)
2 | 29 | 509 | 31 Estimation: same Nr. of building / km track as in DE)
Sites for Maintenance 11 Estimation: same Nr. of building / km track as in DE)
Table 5.16: Carbon Footprint of Rail in Belgium
ValueEmission from construction of network & buildingsCO2-Emissions in tonnes per year 130'441
CO2-Emissions in tonnes per year (per km of line | per km of track) 37.1 | 20.8
CO2-Emissions in g (Passenger: per pkm | Freight: per tkm) 6.4 | 5.5Emission from operation of trainCO2-Emissions in g for train (Passenger: pkm | Freight: tkm) 31.4 | 19.9Emission from train production & maintenanceCO2-Emissions in g (Passenger: per pkm | Freight: per tkm) 0.9 | 1.3
Emissions in g of CO2 (Passenger: pkm | Freight: tkm) 38.8 | 26.7estimated additional CO 2 -Emissions for operation of buildings (Passenger: g per pkm | Freight: g per tkm)
59.5 | 50.5
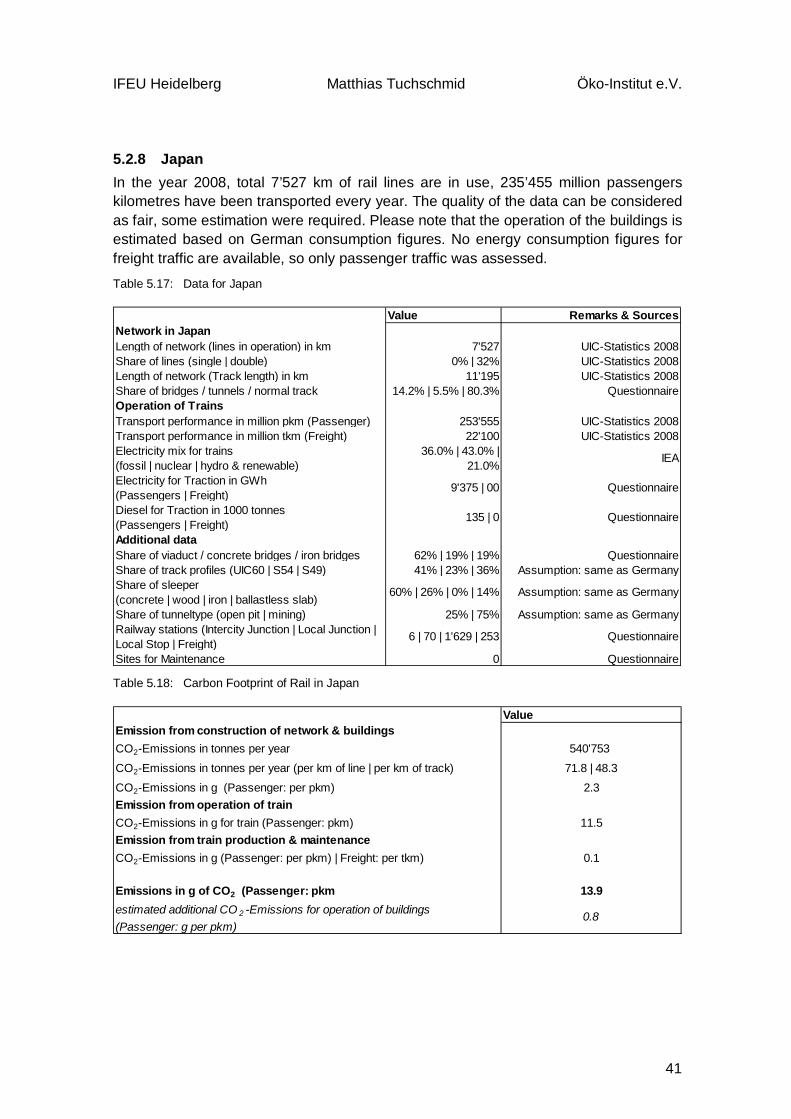
IFEU Heidelberg Matthias Tuchschmid Öko-Institut e.V.
41
5.2.8 Japan In the year 2008, total 7’527 km of rail lines are in use, 235’455 million passengers kilometres have been transported every year. The quality of the data can be considered as fair, some estimation were required. Please note that the operation of the buildings is estimated based on German consumption figures. No energy consumption figures for freight traffic are available, so only passenger traffic was assessed.
Table 5.17: Data for Japan
Value Remarks & SourcesNetwork in JapanLength of network (lines in operation) in km 7'527 UIC-Statistics 2008Share of lines (single | double) 0% | 32% UIC-Statistics 2008Length of network (Track length) in km 11'195 UIC-Statistics 2008Share of bridges / tunnels / normal track 14.2% | 5.5% | 80.3% Questionnaire Operation of TrainsTransport performance in million pkm (Passenger) 253'555 UIC-Statistics 2008Transport performance in million tkm (Freight) 22'100 UIC-Statistics 2008Electricity mix for trains (fossil | nuclear | hydro & renewable)
36.0% | 43.0% | 21.0%
IEA
Electricity for Traction in GWh (Passengers | Freight)
9'375 | 00 Questionnaire
Diesel for Traction in 1000 tonnes (Passengers | Freight)
135 | 0 Questionnaire
Additional dataShare of viaduct / concrete bridges / iron bridges 62% | 19% | 19% Questionnaire Share of track profiles (UIC60 | S54 | S49) 41% | 23% | 36% Assumption: same as Germany Share of sleeper (concrete | wood | iron | ballastless slab)
60% | 26% | 0% | 14% Assumption: same as Germany
Share of tunneltype (open pit | mining) 25% | 75% Assumption: same as Germany Railway stations (Intercity Junction | Local Junction | Local Stop | Freight)
6 | 70 | 1'629 | 253 Questionnaire
Sites for Maintenance 0 Questionnaire
Table 5.18: Carbon Footprint of Rail in Japan
ValueEmission from construction of network & buildingsCO2-Emissions in tonnes per year 540'753
CO2-Emissions in tonnes per year (per km of line | per km of track) 71.8 | 48.3
CO2-Emissions in g (Passenger: per pkm) 2.3Emission from operation of trainCO2-Emissions in g for train (Passenger: pkm) 11.5Emission from train production & maintenanceCO2-Emissions in g (Passenger: per pkm) | Freight: per tkm) 0.1
Emissions in g of CO2 (Passenger: pkm 13.9estimated additional CO 2 -Emissions for operation of buildings (Passenger: g per pkm)
0.8
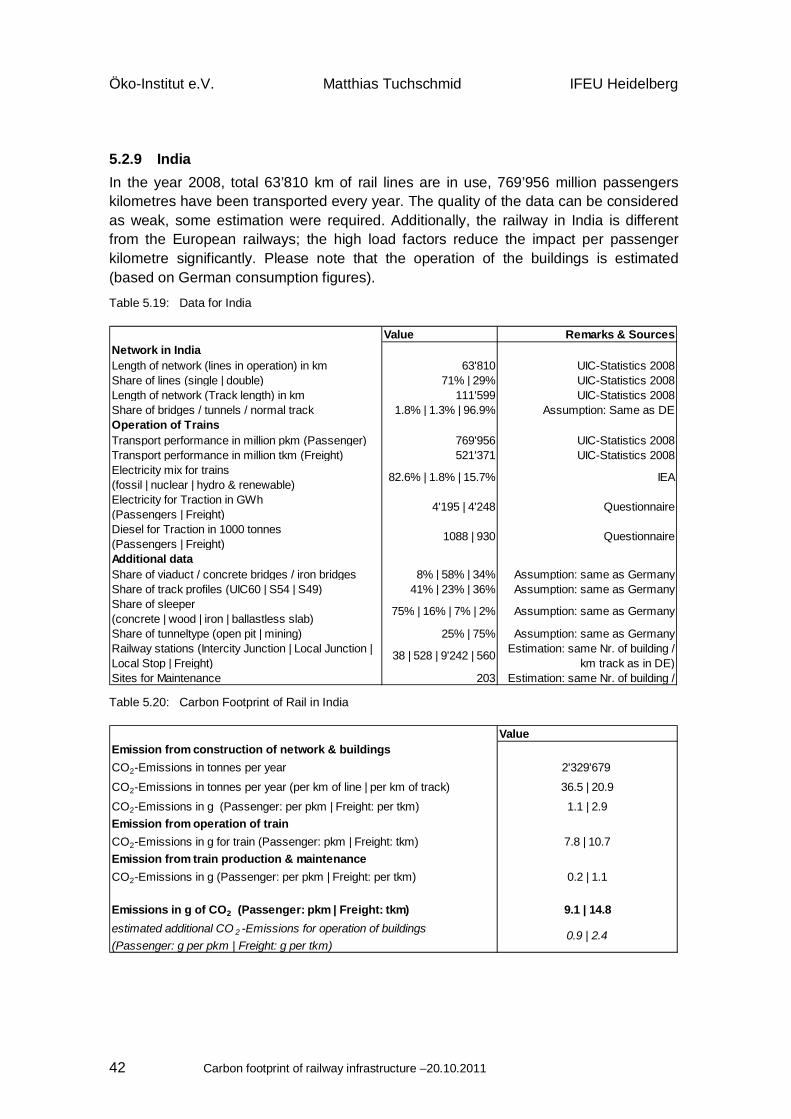
Öko-Institut e.V. Matthias Tuchschmid IFEU Heidelberg
Carbon footprint of railway infrastructure –20.10.2011 42
5.2.9 India In the year 2008, total 63’810 km of rail lines are in use, 769’956 million passengers kilometres have been transported every year. The quality of the data can be considered as weak, some estimation were required. Additionally, the railway in India is different from the European railways; the high load factors reduce the impact per passenger kilometre significantly. Please note that the operation of the buildings is estimated (based on German consumption figures).
Table 5.19: Data for India
Value Remarks & SourcesNetwork in IndiaLength of network (lines in operation) in km 63'810 UIC-Statistics 2008Share of lines (single | double) 71% | 29% UIC-Statistics 2008Length of network (Track length) in km 111'599 UIC-Statistics 2008Share of bridges / tunnels / normal track 1.8% | 1.3% | 96.9% Assumption: Same as DE Operation of TrainsTransport performance in million pkm (Passenger) 769'956 UIC-Statistics 2008Transport performance in million tkm (Freight) 521'371 UIC-Statistics 2008Electricity mix for trains (fossil | nuclear | hydro & renewable)
82.6% | 1.8% | 15.7% IEA
Electricity for Traction in GWh (Passengers | Freight)
4'195 | 4'248 Questionnaire
Diesel for Traction in 1000 tonnes (Passengers | Freight)
1088 | 930 Questionnaire
Additional dataShare of viaduct / concrete bridges / iron bridges 8% | 58% | 34% Assumption: same as Germany Share of track profiles (UIC60 | S54 | S49) 41% | 23% | 36% Assumption: same as Germany Share of sleeper (concrete | wood | iron | ballastless slab)
75% | 16% | 7% | 2% Assumption: same as Germany
Share of tunneltype (open pit | mining) 25% | 75% Assumption: same as Germany Railway stations (Intercity Junction | Local Junction | Local Stop | Freight)
38 | 528 | 9'242 | 560 Estimation: same Nr. of building / km track as in DE)
Sites for Maintenance 203 Estimation: same Nr. of building /
Table 5.20: Carbon Footprint of Rail in India
ValueEmission from construction of network & buildingsCO2-Emissions in tonnes per year 2'329'679
CO2-Emissions in tonnes per year (per km of line | per km of track) 36.5 | 20.9
CO2-Emissions in g (Passenger: per pkm | Freight: per tkm) 1.1 | 2.9Emission from operation of trainCO2-Emissions in g for train (Passenger: pkm | Freight: tkm) 7.8 | 10.7Emission from train production & maintenanceCO2-Emissions in g (Passenger: per pkm | Freight: per tkm) 0.2 | 1.1
Emissions in g of CO2 (Passenger: pkm | Freight: tkm) 9.1 | 14.8estimated additional CO 2 -Emissions for operation of buildings (Passenger: g per pkm | Freight: g per tkm)
0.9 | 2.4
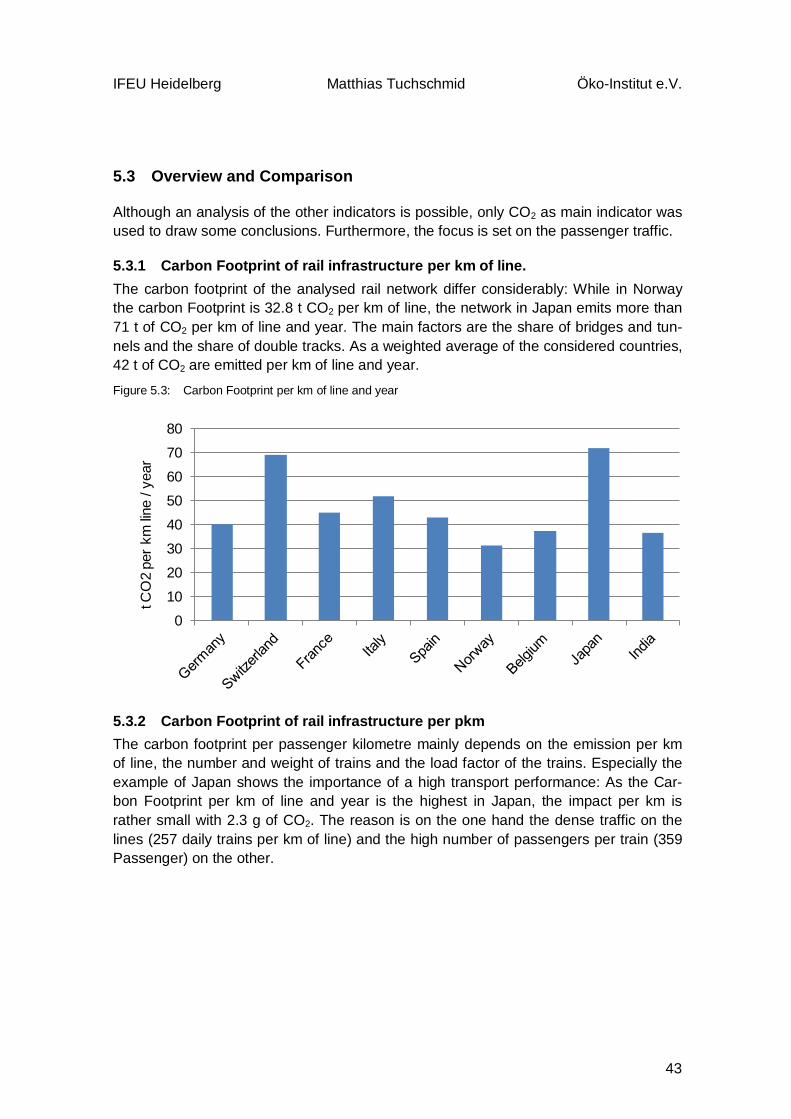
IFEU Heidelberg Matthias Tuchschmid Öko-Institut e.V.
43
5.3 Overview and Comparison
Although an analysis of the other indicators is possible, only CO2 as main indicator was used to draw some conclusions. Furthermore, the focus is set on the passenger traffic.
5.3.1 Carbon Footprint of rail infrastructure per km of line. The carbon footprint of the analysed rail network differ considerably: While in Norway the carbon Footprint is 32.8 t CO2 per km of line, the network in Japan emits more than 71 t of CO2 per km of line and year. The main factors are the share of bridges and tun-nels and the share of double tracks. As a weighted average of the considered countries, 42 t of CO2 are emitted per km of line and year.
Figure 5.3: Carbon Footprint per km of line and year
01020304050607080
t CO
2 pe
r km
line
/ yea
r
5.3.2 Carbon Footprint of rail infrastructure per pkm The carbon footprint per passenger kilometre mainly depends on the emission per km of line, the number and weight of trains and the load factor of the trains. Especially the example of Japan shows the importance of a high transport performance: As the Car-bon Footprint per km of line and year is the highest in Japan, the impact per km is rather small with 2.3 g of CO2. The reason is on the one hand the dense traffic on the lines (257 daily trains per km of line) and the high number of passengers per train (359 Passenger) on the other.
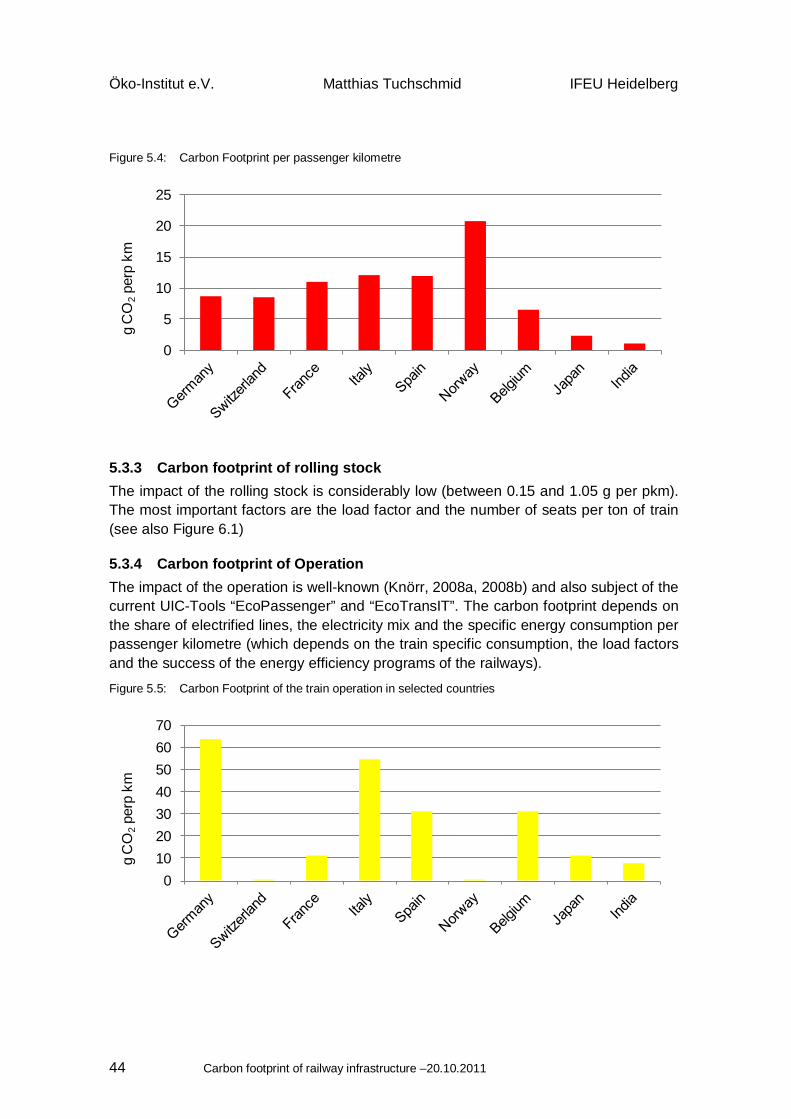
Öko-Institut e.V. Matthias Tuchschmid IFEU Heidelberg
Carbon footprint of railway infrastructure –20.10.2011 44
Figure 5.4: Carbon Footprint per passenger kilometre
0
5
10
15
20
25
gC
O2
perp
km
5.3.3 Carbon footprint of rolling stock The impact of the rolling stock is considerably low (between 0.15 and 1.05 g per pkm). The most important factors are the load factor and the number of seats per ton of train (see also Figure 6.1)
5.3.4 Carbon footprint of Operation The impact of the operation is well-known (Knörr, 2008a, 2008b) and also subject of the current UIC-Tools “EcoPassenger” and “EcoTransIT”. The carbon footprint depends on the share of electrified lines, the electricity mix and the specific energy consumption per passenger kilometre (which depends on the train specific consumption, the load factors and the success of the energy efficiency programs of the railways).
Figure 5.5: Carbon Footprint of the train operation in selected countries
010203040506070
gC
O2
perp
km
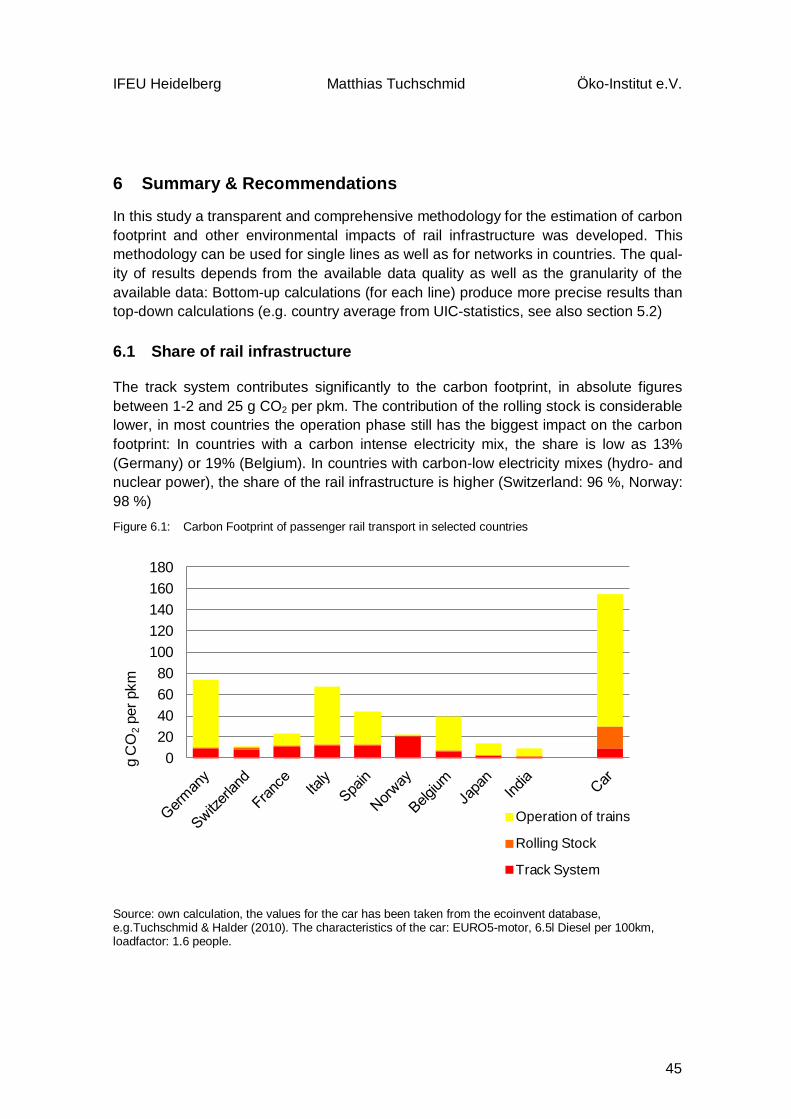
IFEU Heidelberg Matthias Tuchschmid Öko-Institut e.V.
45
6 Summary & Recommendations
In this study a transparent and comprehensive methodology for the estimation of carbon footprint and other environmental impacts of rail infrastructure was developed. This methodology can be used for single lines as well as for networks in countries. The qual-ity of results depends from the available data quality as well as the granularity of the available data: Bottom-up calculations (for each line) produce more precise results than top-down calculations (e.g. country average from UIC-statistics, see also section 5.2)
6.1 Share of rail infrastructure
The track system contributes significantly to the carbon footprint, in absolute figures between 1-2 and 25 g CO2 per pkm. The contribution of the rolling stock is considerable lower, in most countries the operation phase still has the biggest impact on the carbon footprint: In countries with a carbon intense electricity mix, the share is low as 13% (Germany) or 19% (Belgium). In countries with carbon-low electricity mixes (hydro- and nuclear power), the share of the rail infrastructure is higher (Switzerland: 96 %, Norway: 98 %)
Figure 6.1: Carbon Footprint of passenger rail transport in selected countries
020406080
100120140160180
Operation of trains
Rolling Stock
Track System
gC
O2
per p
km
Source: own calculation, the values for the car has been taken from the ecoinvent database, e.g.Tuchschmid & Halder (2010). The characteristics of the car: EURO5-motor, 6.5l Diesel per 100km, loadfactor: 1.6 people.
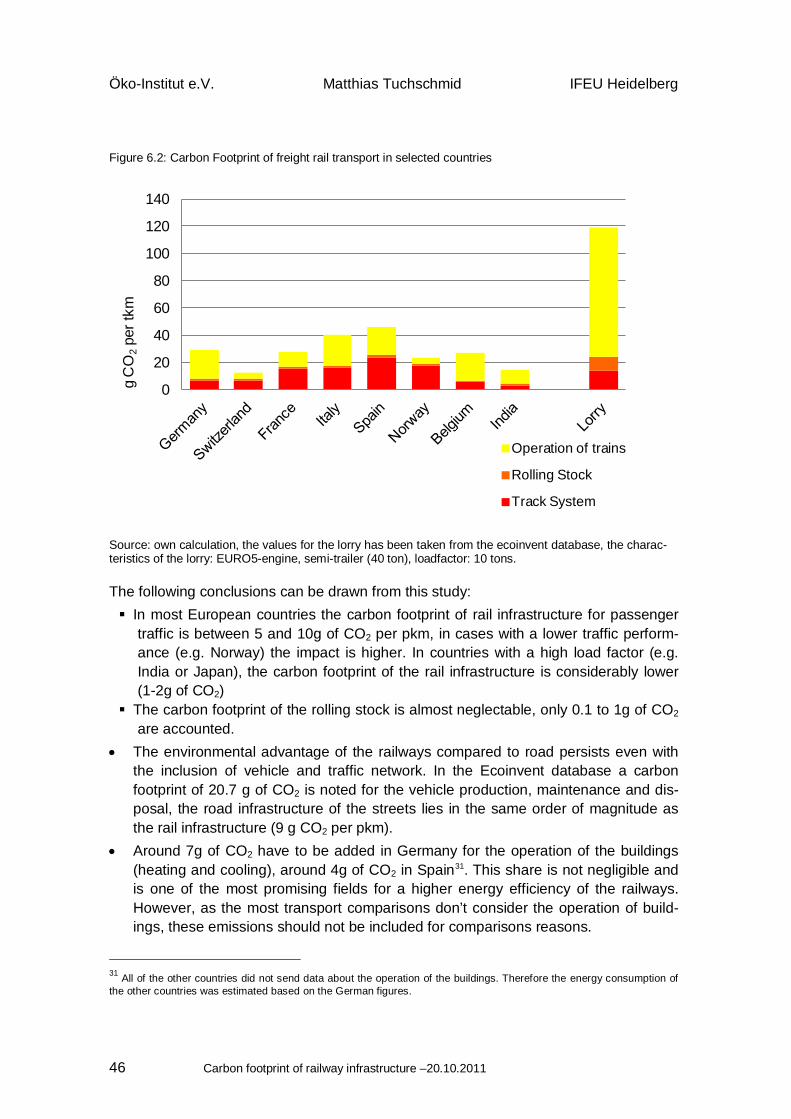
Öko-Institut e.V. Matthias Tuchschmid IFEU Heidelberg
Carbon footprint of railway infrastructure –20.10.2011 46
Figure 6.2: Carbon Footprint of freight rail transport in selected countries
0
20
40
60
80
100
120
140
Operation of trains
Rolling Stock
Track System
gC
O2
per t
km
Source: own calculation, the values for the lorry has been taken from the ecoinvent database, the charac-teristics of the lorry: EURO5-engine, semi-trailer (40 ton), loadfactor: 10 tons.
The following conclusions can be drawn from this study: In most European countries the carbon footprint of rail infrastructure for passenger
traffic is between 5 and 10g of CO2 per pkm, in cases with a lower traffic perform-ance (e.g. Norway) the impact is higher. In countries with a high load factor (e.g. India or Japan), the carbon footprint of the rail infrastructure is considerably lower (1-2g of CO2)
The carbon footprint of the rolling stock is almost neglectable, only 0.1 to 1g of CO2 are accounted.
• The environmental advantage of the railways compared to road persists even with the inclusion of vehicle and traffic network. In the Ecoinvent database a carbon footprint of 20.7 g of CO2 is noted for the vehicle production, maintenance and dis-posal, the road infrastructure of the streets lies in the same order of magnitude as the rail infrastructure (9 g CO2 per pkm).
• Around 7g of CO2 have to be added in Germany for the operation of the buildings (heating and cooling), around 4g of CO2 in Spain31. This share is not negligible and is one of the most promising fields for a higher energy efficiency of the railways. However, as the most transport comparisons don’t consider the operation of build-ings, these emissions should not be included for comparisons reasons.
31 All of the other countries did not send data about the operation of the buildings. Therefore the energy consumption of the other countries was estimated based on the German figures.

IFEU Heidelberg Matthias Tuchschmid Öko-Institut e.V.
47
• CO2-emissions of operation are low in countries with a high share of renewable or nuclear energy for electricity production. In these cases the impact of infrastructure has a high share on total emissions. Therefore the assumptions for estimating the impact of infrastructure are more sensitive than in countries with a higher contribu-tion of operation.
• The infrastructure emissions for the freight transport are as well as the passenger transport country specific, but in general the same conclusions can be drawn: The higher the load factor and usage of rail, the lower the rail infrastructure.
6.2 UIC-Tools “EcoPassenger” & “EcoTransIT” and the infrastructure
Currently, the UIC-Tools “EcoPassenger” and “EcoTransIT” do not show any impact of the infrastructure. With this study, the needed methodology and values for rail transport has been developed and are available also for integration in both tools. The authors propose one of he following options: Option A: Use the average values per country
The impact of infrastructure can be determined for each country and shown in the UIC-Tools with the methodology developed in this survey and the available statisti-cal data sources. . To calculate the environmental impacts of rail infrastructure, at least the share of bridges, tunnels and normal tracks and the transport performance (Gtkm, pkm, tkm) have to be gathered for each represented country in the UIC-Tools . For the other transport modes (road, ship and air), corresponding infrastructure data have to be determined.
Option B: Use values per train type (regional / intercity / high speed trains) The differentiation of the impacts into train types (e.g. the rail infrastructure for re-gional trains) is the adequate methodology for EcoPassenger, because the impacts of operation are also differentiated into train types. It can be calculated with the current methodology, but more statistical data is re-quired: For each represented country, the following network specific details has to be gathered for each line of the network: length of tracks, share of electrified lines, share of bridges / tunnels / normal track, transport performance in Gtkm (all operators), transport performance in pkm (all operators), transport performance in tkm (all operators). For the other transport modes (road, ship and air), the infrastructure data have to be calculated more in detail (separate analysis for highways, regional streets and streets in cities). So far thise information is only available for the railway system in Germany.
For both options we propose the following constraints: Show the impact of infrastructure with an additional selector (similar to the
consideration of the RFI for the air traffic). Show the impact of infrastructure always as separate values

Öko-Institut e.V. Matthias Tuchschmid IFEU Heidelberg
Carbon footprint of railway infrastructure –20.10.2011 48
Show the impact of infrastructure always for all modes in a comparable classification (methodology, boundaries)
Include a comprehensible documentation of the methodology used for the assessment of infrastructure into the methodology report.
IFEU Heidelberg Matthias Tuchschmid Öko-Institut e.V.
49
7 Literature & References
7.1 Literature
BGBI. (2006). Verordnung zum Erlass und zur Änderung von Vorschriften über die Kennzeichnung emissionsarmer Kraftfahrzeuge. Abgerufen von http://www.bgblportal.de/BGBL/bgbl1f/bgbl106s2218.pdf
Chang, & Kendall. (2011). Life cycle greenhouse gas assessment of infrastructure construction for California’s high-speed rail system.
Chester, & Horvath. (2010). Life-cycle assessment of high-speed rail - the case of California. Abgerufen von http://iopscience.iop.org/1748-9326/5/1/014003/media
Chester, & Howarth. (2009). Environmental assessment of passenger transportation should include infrastructure and supply chains.
Chester, M. V. (2008). Life-cycle Environmental Inventory of Passenger Transportation in the United States. Institute of Transportation Studies, University of California, Berkeley. Abgerufen von http://www.escholarship.org/uc/item/7n29n303
EPD. (2009). Product Category Rules for preparing an Environmental Product Declara-tion (EPD) for Interurban railway transport services of passengers, Railway transport services of freight and Railways. PCR 2009:03.
EPD. (2010). Environmental Product Declaration for the railway infrastructure on the Bothnia Line. Abgerufen von 2010
EPD. (2011). Spactum – The Climate is Right for Trains.
Frischknecht, R., & Stucki, M. (2009). Primärenergiefaktoren von Transportleistungen, Version 1.4. Abgerufen von http://www.esu-services.ch/cms/fileadmin/download/frischknecht-2008-Transportsysteme.pdf
Frischknecht, R., Steiner, R., & Jungbluth, N. (2008). Ökobilanzen: Methode der öko-logischen Knappheit – Ökofaktoren 2006 ( No. SR 28/2008). Zürich: Öbu.
Hischier et al. (2009). Implementation of Life Cycle Impact Assessment Methods. Final report ecoinvent v2.1 No. 3. Dübendorf, CH.: Swiss Centre for Life Cycle Inven-tories,.
Hubbert, M. K. (1949). Energy from Fossil Fuels. Science, 109(2823), 103-109.
IPCC. (2007). Contribution of Working Group I to the Fourth Assessment Report of the Intergovernmental Panel on Climate Change. Abgerufen Februar 17, 2010, von http://www.ipcc.ch/publications_and_data/publications_ipcc_fourth_assessment_report_wg1_report_the_physical_science_basis.htm

Öko-Institut e.V. Matthias Tuchschmid IFEU Heidelberg
Carbon footprint of railway infrastructure –20.10.2011 50
Kendall, Harvey, & Lee. (2009). A Critical Review of Life Cycle Assessment Practice for Infrastructure Materials.
Keoleian et al. (2005). Life Cycle Modelling of Concrete Bridge Design.
Knörr, W. (2008a). EcoPassenger: Environmental Methodology and Data. Heidelberg: Commissioned by International Union of Railways (UIC).
Knörr, W. (2008b). EcoTransIT: Ecological Transport Information Tool Environmental, Methodology and Data. Heidelberg: ifeu - Institut für Energieund Umweltfor-schung Heidelberg GmbH.
Loffredo, Fedele, & Severini. (2011). The climatic mark of railway infrastructural projects. Ingegneria Ferroviaria 3/2011.
PSI. (2008). Vorsicht Feinstaub. Energie-Spiegel: Fakten für die Energiepolitik von morgen. Paul-Scherrer-Institut, Villingen.
RSSB. (2010). Whole Life Carbon Footprint of the Great Britain Rail Industry.
Schmied, & Mottschall. (2010). Treibhausgasemissionen durch die Schieneninfra-struktur und Schienen-fahrzeuge in Deutschland.
SNCF, & Ademe. (2009). Bilan carbone ferroviaire global: La Ligne a Grande Vitesse Rhin-Rhone au service d’une Europe durable. Abgerufen von http://www.bilan-carbone-lgvrr.fr/documents-dinformation
Spielmann, M., Dones, R., & Bauer, C. (2007). Life Cycle Inventories of Transport Services. Final report ecoinvent v2.0 No. 14. Dübendorf, CH: Swiss Centre for Life Cycle Inventories.
Stripple. (2001). Life Cycle Assessment of Road. A Pilot Study for Inventory Analysis.
Tuchschmid, M., & Halder, M. (2010, März 30). mobitool – Grundlagenbericht: Hinter-grund, Methodik & Emissionsfaktoren. Abgerufen von www.mobitool.ch
UIC. (2009). International Railway statistics. Paris.
UIC. (2010). Carbon Footprint of High-Speed railway infrastructure (Pre-Study). Zürich: Author: Matthias Tuchschmid.
UIC. (2011). High Speed Rail contribution. Carbon footprint methodology and results. Zürich & Paris: Authors: Thomas Baron, Matthias Tuchschmid.
Uni Halle. (2002). Ökobilanzierung von Schienenverkehrssystemen am Bsp. des ICE-Verkehrs / Ecology Profile of the German High Speed Passenger Trains (von Rozycki, 2003).
VOCV. (2009). Verordnung über die Lenkungsabgabe auf flüchtigen organischen Ver-bindungen (VOCV). 814.018 (S. Bundesrat).
IFEU Heidelberg Matthias Tuchschmid Öko-Institut e.V.
51
von Rozycki, C., Koeser, H., & Schwarz, H. (2003). Ecology Profile of the German High-speed Rail Passenger Transport System, ICE. Int J LCA, 8(2), 83-91.
Zimmer et al. (2009). RENEWBILITY: „Stoffstromanalyse nachhaltige Mobilität im Kon-text erneuerbarer Energien bis 2030".
7.2 Picture Credits
Aimaimyi. (2008). Concrete Bridge. Abgerufen von http://commons.wikimedia.org/wiki/File:Hibikibasi_01.jpg
Andy F. (2009). Local Stop for trains. Abgerufen von http://commons.wikimedia.org/wiki/File:St_Erth_railway_station_photo-survey_(30)_-_geograph.org.uk_-_1554941.jpg
AlexHe34. (2010). Iron mast for Overheadline - (Wikimedia). Abgerufen von http://en.wikipedia.org/wiki/File:Overhead-lines-railway.JPG
Aquasys. (2011). Earthwork of upgrading existing lines. Abgerufen von http://www.aquasys-zs.cz/en
Calson2. (2007). High tension line. Abgerufen von http://de.wikipedia.org/w/index.php?title=Datei:Bahnstromleitung_Viererbuendel2.jpg&filetimestamp=20110328203316
chelseagirl. (2006). Overhead wiring (Flickr). Abgerufen von http://www.flickr.com/photos/chelseagirlphotos/251664372/§
Cooper.ch. (2006). Tunnelbohrmaschine (TBM S-210 Alptransit) - Wikimedia. Abgeru-fen von http://de.wikipedia.org/w/index.php?title=Datei:TBM_S-210_Alptransit_Faido_East.jpg&filetimestamp=20060919165800
Cornelius Bechtler. (2006). Viadukt. Abgerufen von http://commons.wikimedia.org/wiki/File:Montenegro_Tara_bridge.JPG
Dammseher. (2009). Iron Sleeper. Abgerufen Juli 17, 2011, von http://www.drehscheibe-foren.de/foren/read.php?2,4337921
DBZ2313. (2010). Overhead Wire - (Wikimedia). Abgerufen Juli 19, 2011, von http://en.wikipedia.org/wiki/File:Transperth_Sets.JPG
DoubleH. (2004). Iron Bridge. Abgerufen von http://commons.wikimedia.org/wiki/File:Nijmegen3.jpg
Flcelloguy. (2007). Oil Well (Wikimedia). Abgerufen von http://de.wikipedia.org/w/index.php?title=Datei:Oil_well.jpg&filetimestamp=20070705080454
Gubler, D. (2007). Regional train (Wikimedia). Abgerufen von http://de.wikipedia.org/w/index.php?title=Datei:Npz_portrait.jpg&filetimestamp=20071028202014
Öko-Institut e.V. Matthias Tuchschmid IFEU Heidelberg
Carbon footprint of railway infrastructure –20.10.2011 52
Gubler, D. (2008). Intercity Train (Wikimedia). Abgerufen von http://de.wikipedia.org/w/index.php?title=Datei:IC2000_Z%C3%BCrich_-_Luzern.jpg&filetimestamp=20100426200445
Kelle. (2010). Natural Gas. Abgerufen Juli 20, 2011, von http://commons.wikimedia.org/wiki/File:Burning_gas_from_Deepwater_Horizon_oil_spill_2010-05-16.jpg
Kohring. (2007). Slabless Track - (Wikimedia). Abgerufen Juli 17, 2011, von http://commons.wikimedia.org/wiki/File:Rheda_Wiedenbrueck_train_station_platform9.jpg?uselang=de
LooiNL. (2007). Concrete & Wooden Sleeper (Wikimedia Commons). Abgerufen Juli 17, 2011, von http://commons.wikimedia.org/wiki/File:Railroad_tieswoodconcrete.jpg
Nominativus. (2009). Signal (Wikimedia). Abgerufen von http://en.wikipedia.org/wiki/File:German_HP_signals.jpg
Norbert Aepli. (2009). Main Station. Abgerufen von http://de.wikipedia.org/w/index.php?title=Datei:2009-04-10_Berlin_657.jpg&filetimestamp=20100329222753
Swan, G. (2009). Railway control tower (Wikimedia). Abgerufen von http://en.wikipedia.org/wiki/File:Cherry_Street_Railway_control_tower_--_Toronto_-a.jpg
IFEU Heidelberg Matthias Tuchschmid Öko-Institut e.V.
53
7.3 Literature Review
7.3.1 Overview [1] Uni Halle 2002
Ökobilanzierung von Schienenverkehrssystemen am Bsp. des ICE-Verkehrs; von Rozycki (2003): Ecology Profile of the German High Speed Passenger Train
[2] von Rozycki & Koese & Schwarz 2003
Ecology Profile of the German High-speed Rail. Passenger Transport System, ICE
[3] Spielmann & Do-nes & Bauer 2007
Life Cycle Inventories of Transport Services. Final report ecoinvent v2.0 No. 14. Swiss Centre for Life Cycle Inventories, Dübendorf, CH.
[4] Frischknecht&Stucki 2009
Primärenergiefaktoren von Transportleistungen Version 1.4, 27. Juli 2009
[5] Tuchschmid 2010
Grundlagenbericht: Hintergrund, Methodik & Emissionsfaktoren. www.mobitool.ch
[6] Chester 2008
Life-cycle Environmental Inventory of Passenger Transportation in the USA. http://www.escholarship.org/uc/item/7n29n303
[7] Chester & Howarth 2009
Environmental assessment of passenger transportation should include infrastructure and supply chains.
[8] Chester & Horvath 2010
Life-cycle assessment of high-speed rail - the case of California. http://iopscience.iop.org/1748-9326/5/1/014003/media
[9] EPD 2009
Product Category Rules (PCR). Version 1.0
[10] EPD 2010
Environmental Product Declaration for the railway infrastructure on the Bothnia Line
[11] RSSB 2010
Whole Life Carbon Footprint of the Great Britain Rail Industry.
[12] Tuchschmid 2009
Carbon Footprint of High-Speed railway infrastructure (Pre-Study)
[13] Schmied & Mottschall 2010
Treibhausgasemissionen durch die Schieneninfrastruktur und Schie-nenfahrzeuge in Deutschland
[14] SNCF & Ademe 2009
Bilan carbone ferroviaire global: La Ligne a Grande Vitesse Rhin-Rhone au service d’une Europe durable. http://www.bilan-carbone-lgvrr.fr/documents-dinformation
[15] Systra 2011
High Speed Rail contribution. Carbon footprint methodology and results
[16] Loffredo,& Fedele
Loffredo, F., Fedele, P., Severini, M.: The climatic mark of railway infra-structural projects; in: Ingegneria Ferroviaria 3/2011
Öko-Institut e.V. Matthias Tuchschmid IFEU Heidelberg
Carbon footprint of railway infrastructure –20.10.2011 54
& Severini 2011
[17] Zimmer et al. 2009
RENEWBILITY „Stoffstromanalyse nachhaltige Mobilität im Kontext erneuerba-rer Energien bis 2030
[18] EPD 2011
Spactum – The Climate is Right for Trains
[19] Stripple 2001
Life Cycle Assessment of Road. A Pilot Study for Inventory Analysis
[20] Keoleian et al. 2005
Life Cycle Modelling of Concrete Bridge Design
[21] Kendall & Harvey & Lee 2009
A Critical Review of Life Cycle Assessment Practice for Infrastructure Materials
[22] Chang & Kendall 2011
Life cycle greenhouse gas assessment of infrastructure construction for California’s high-speed rail system
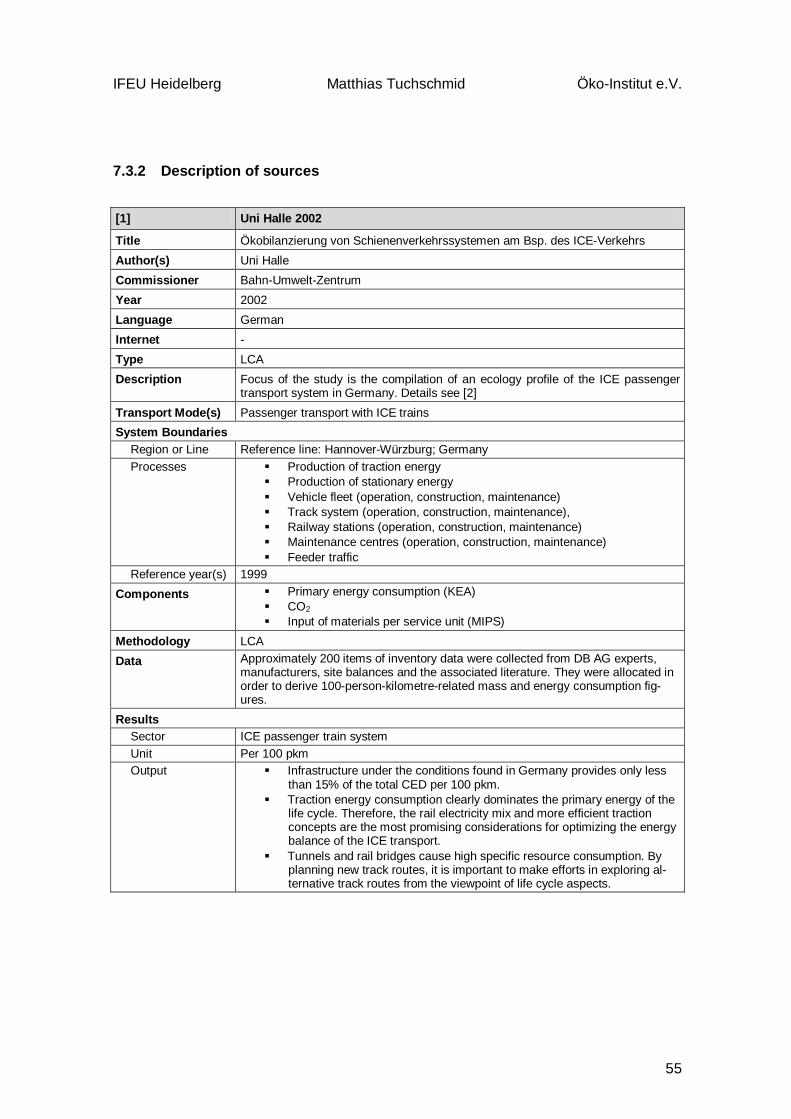
IFEU Heidelberg Matthias Tuchschmid Öko-Institut e.V.
55
7.3.2 Description of sources [1] Uni Halle 2002
Title Ökobilanzierung von Schienenverkehrssystemen am Bsp. des ICE-Verkehrs Author(s) Uni Halle Commissioner Bahn-Umwelt-Zentrum Year 2002 Language German Internet - Type LCA Description Focus of the study is the compilation of an ecology profile of the ICE passenger
transport system in Germany. Details see [2] Transport Mode(s) Passenger transport with ICE trains System Boundaries
Region or Line Reference line: Hannover-Würzburg; Germany Processes Production of traction energy
Production of stationary energy Vehicle fleet (operation, construction, maintenance) Track system (operation, construction, maintenance), Railway stations (operation, construction, maintenance) Maintenance centres (operation, construction, maintenance) Feeder traffic
Reference year(s) 1999 Components Primary energy consumption (KEA)
CO2 Input of materials per service unit (MIPS)
Methodology LCA Data Approximately 200 items of inventory data were collected from DB AG experts,
manufacturers, site balances and the associated literature. They were allocated in order to derive 100-person-kilometre-related mass and energy consumption fig-ures.
Results Sector ICE passenger train system Unit Per 100 pkm Output Infrastructure under the conditions found in Germany provides only less
than 15% of the total CED per 100 pkm. Traction energy consumption clearly dominates the primary energy of the
life cycle. Therefore, the rail electricity mix and more efficient traction concepts are the most promising considerations for optimizing the energy balance of the ICE transport.
Tunnels and rail bridges cause high specific resource consumption. By planning new track routes, it is important to make efforts in exploring al-ternative track routes from the viewpoint of life cycle aspects.

Öko-Institut e.V. Matthias Tuchschmid IFEU Heidelberg
Carbon footprint of railway infrastructure –20.10.2011 56
[2] von Rozycki & Koese & Schwarz 2003
Title Ecology Profile of the German High-speed Rail. Passenger Transport System, ICE Author(s) von Rozycki & Koese & Schwarz Commissioner Martin-Luther-University, Halle-Wittenberg
DB AG, Railway-Environmental-Center Year 2003 Language English Internet - Type LCA Case Study Description A screening LCA, called ecology profile, of the German high-speed passenger
train system, the ICE, is presented here, based on a study conducted by the Uni-versity of Halle and the Deutsche Bahn AG, the major German rail operator. In this study, the resource consumption caused by traction, manufacturing and mainte-nance of ICE trains, as well as construction and operation of the supporting rail infrastructure and buildings, have been evaluated using cumulative energy de-mand (CED), cumulative material input per service unit (MIPS) and CO2 emissions as indicators.
Transport Mode(s) Railway System Boundaries
Region or Line Hannover-Würzburg, Germany Processes Production of traction energy
Production of stationary energy Vehicle fleet (operation, construction, maintenance) Track system (operation, construction, maintenance), Railway stations (operation, construction, maintenance) Maintenance centres (operation, construction, maintenance) Feeder traffic
Reference year(s) 1999 Components Direct masses and end energies, cumulative energy demand (CED)
Material input per service unit (MIPS; w/o water and air) CO2 emissions
Methodology LCA Data Approximately 200 items of inventory data were collected from DB AG experts,
manufacturers, site balances and the associated literature. They were allocated in order to derive 100-person-kilometre-related mass and energy consumption fig-ures.
Results Sector ICE Passenger transport long distance Unit rtkm, tukm, tdkm, kg/100 pkm, MJ/100 pkm, kWh/100 pkm Output Infrastructure under the conditions found in Germany provides only less
than 15% of the total CED per 100 pkm. Traction energy consumption clearly dominates the primary energy of the
life cycle. Therefore, the rail electricity mix and more efficient traction concepts are the most promising considerations for optimizing the energy balance of the ICE transport.
Tunnels and rail bridges cause high specific resource consumption. By planning new track routes, it is important to make efforts in exploring al-ternative track routes from the viewpoint of life cycle aspects.
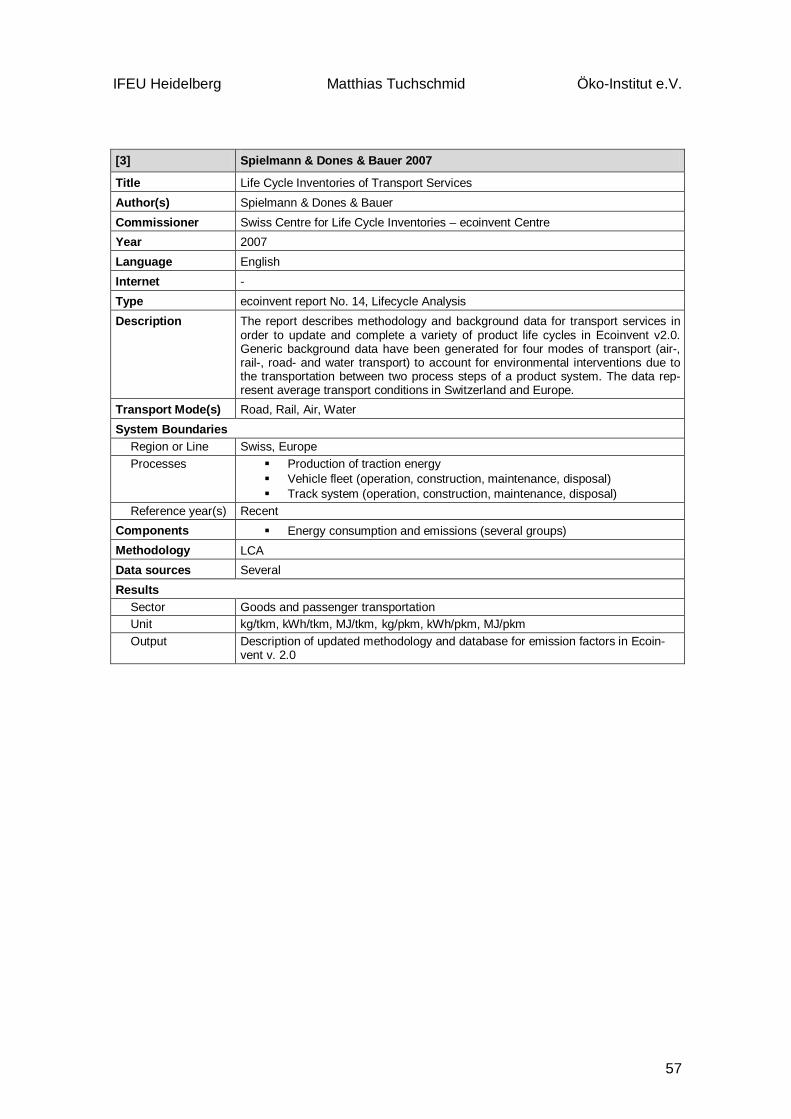
IFEU Heidelberg Matthias Tuchschmid Öko-Institut e.V.
57
[3] Spielmann & Dones & Bauer 2007
Title Life Cycle Inventories of Transport Services Author(s) Spielmann & Dones & Bauer Commissioner Swiss Centre for Life Cycle Inventories – ecoinvent Centre Year 2007 Language English Internet - Type ecoinvent report No. 14, Lifecycle Analysis Description The report describes methodology and background data for transport services in
order to update and complete a variety of product life cycles in Ecoinvent v2.0. Generic background data have been generated for four modes of transport (air-, rail-, road- and water transport) to account for environmental interventions due to the transportation between two process steps of a product system. The data rep-resent average transport conditions in Switzerland and Europe.
Transport Mode(s) Road, Rail, Air, Water System Boundaries
Region or Line Swiss, Europe Processes Production of traction energy
Vehicle fleet (operation, construction, maintenance, disposal) Track system (operation, construction, maintenance, disposal)
Reference year(s) Recent Components Energy consumption and emissions (several groups) Methodology LCA Data sources Several Results
Sector Goods and passenger transportation Unit kg/tkm, kWh/tkm, MJ/tkm, kg/pkm, kWh/pkm, MJ/pkm Output Description of updated methodology and database for emission factors in Ecoin-
vent v. 2.0
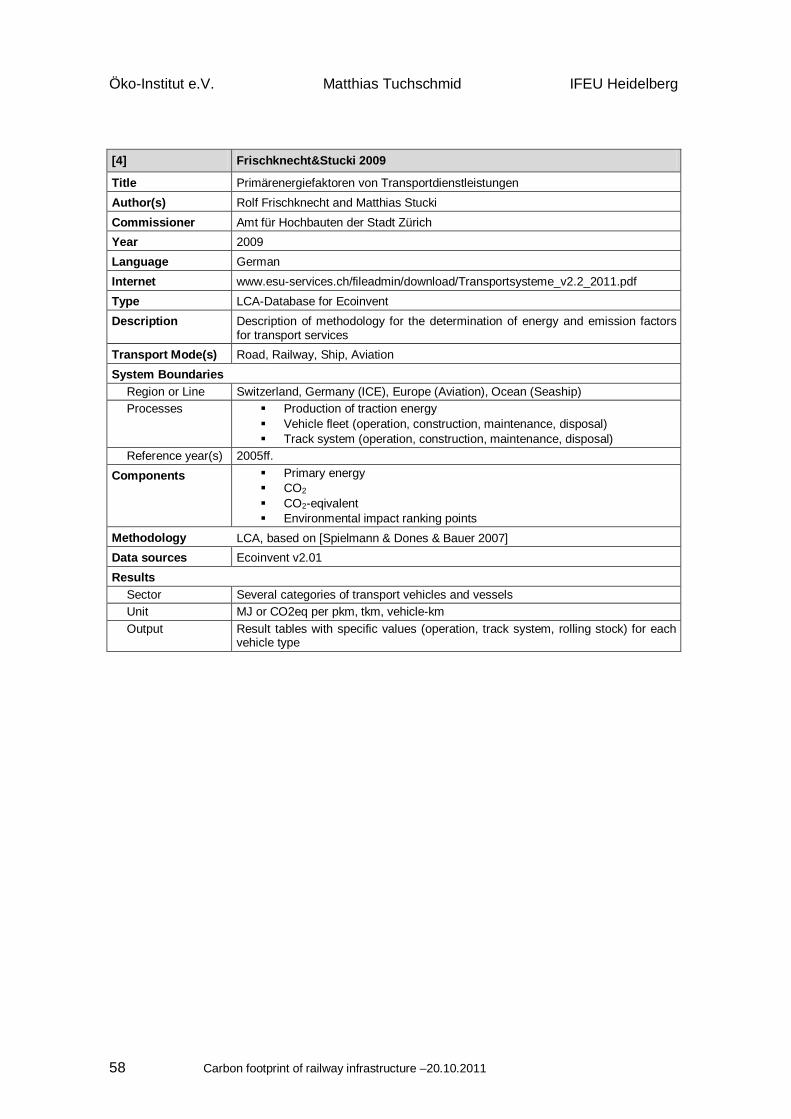
Öko-Institut e.V. Matthias Tuchschmid IFEU Heidelberg
Carbon footprint of railway infrastructure –20.10.2011 58
[4] Frischknecht&Stucki 2009
Title Primärenergiefaktoren von Transportdienstleistungen Author(s) Rolf Frischknecht and Matthias Stucki Commissioner Amt für Hochbauten der Stadt Zürich Year 2009 Language German Internet www.esu-services.ch/fileadmin/download/Transportsysteme_v2.2_2011.pdf Type LCA-Database for Ecoinvent Description Description of methodology for the determination of energy and emission factors
for transport services Transport Mode(s) Road, Railway, Ship, Aviation System Boundaries
Region or Line Switzerland, Germany (ICE), Europe (Aviation), Ocean (Seaship) Processes Production of traction energy
Vehicle fleet (operation, construction, maintenance, disposal) Track system (operation, construction, maintenance, disposal)
Reference year(s) 2005ff. Components Primary energy
CO2 CO2-eqivalent Environmental impact ranking points
Methodology LCA, based on [Spielmann & Dones & Bauer 2007] Data sources Ecoinvent v2.01 Results
Sector Several categories of transport vehicles and vessels Unit MJ or CO2eq per pkm, tkm, vehicle-km Output Result tables with specific values (operation, track system, rolling stock) for each
vehicle type
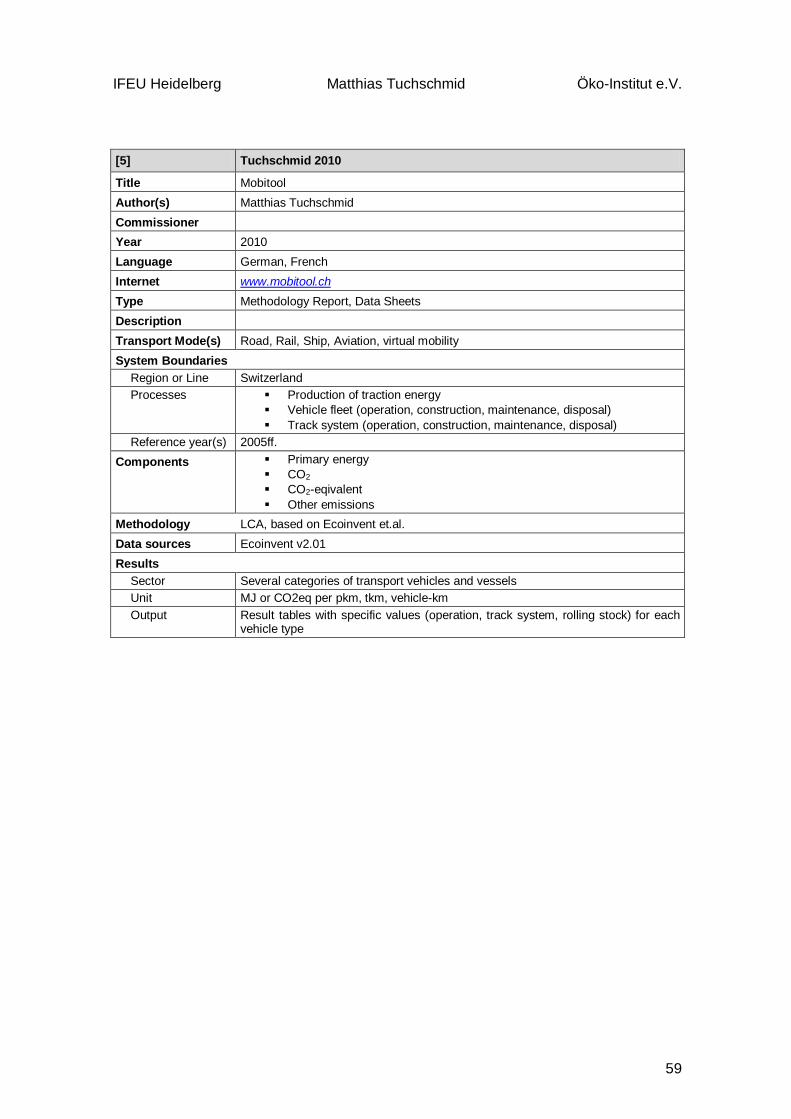
IFEU Heidelberg Matthias Tuchschmid Öko-Institut e.V.
59
[5] Tuchschmid 2010
Title Mobitool Author(s) Matthias Tuchschmid Commissioner Year 2010 Language German, French Internet www.mobitool.ch Type Methodology Report, Data Sheets Description Transport Mode(s) Road, Rail, Ship, Aviation, virtual mobility System Boundaries
Region or Line Switzerland Processes Production of traction energy
Vehicle fleet (operation, construction, maintenance, disposal) Track system (operation, construction, maintenance, disposal)
Reference year(s) 2005ff. Components Primary energy
CO2 CO2-eqivalent Other emissions
Methodology LCA, based on Ecoinvent et.al. Data sources Ecoinvent v2.01 Results
Sector Several categories of transport vehicles and vessels Unit MJ or CO2eq per pkm, tkm, vehicle-km Output Result tables with specific values (operation, track system, rolling stock) for each
vehicle type
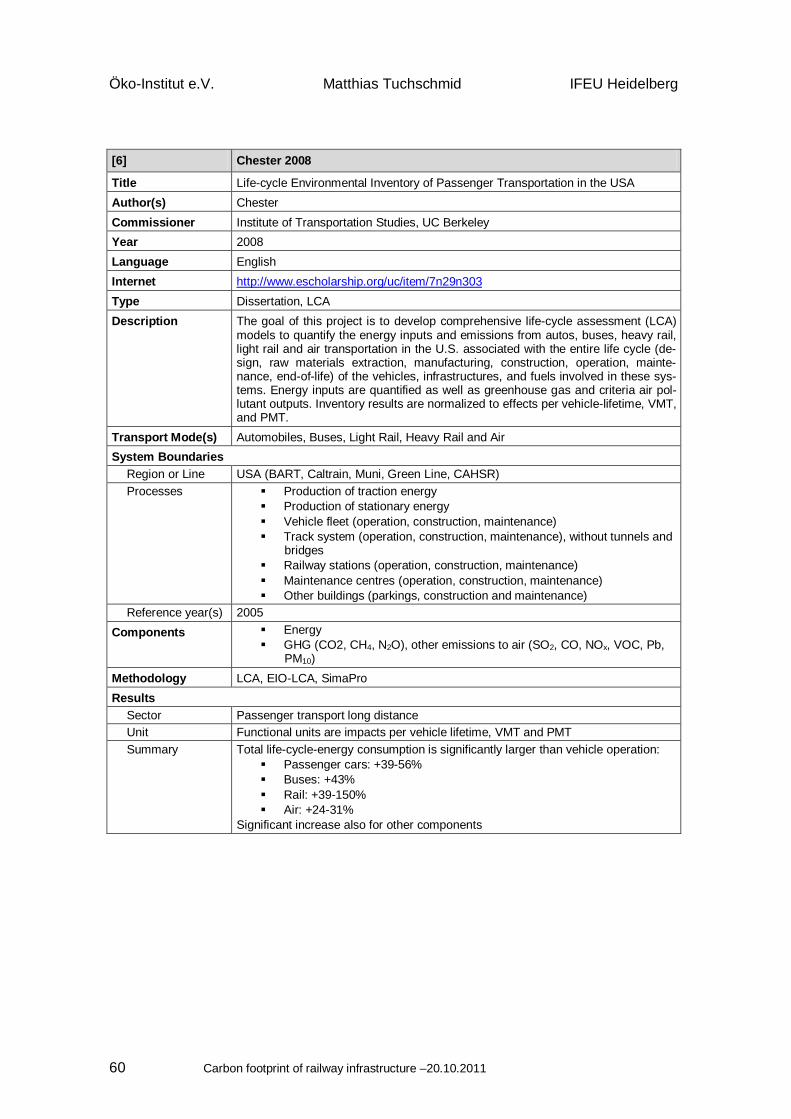
Öko-Institut e.V. Matthias Tuchschmid IFEU Heidelberg
Carbon footprint of railway infrastructure –20.10.2011 60
[6] Chester 2008
Title Life-cycle Environmental Inventory of Passenger Transportation in the USA Author(s) Chester Commissioner Institute of Transportation Studies, UC Berkeley Year 2008 Language English Internet http://www.escholarship.org/uc/item/7n29n303 Type Dissertation, LCA Description The goal of this project is to develop comprehensive life-cycle assessment (LCA)
models to quantify the energy inputs and emissions from autos, buses, heavy rail, light rail and air transportation in the U.S. associated with the entire life cycle (de-sign, raw materials extraction, manufacturing, construction, operation, mainte-nance, end-of-life) of the vehicles, infrastructures, and fuels involved in these sys-tems. Energy inputs are quantified as well as greenhouse gas and criteria air pol-lutant outputs. Inventory results are normalized to effects per vehicle-lifetime, VMT, and PMT.
Transport Mode(s) Automobiles, Buses, Light Rail, Heavy Rail and Air System Boundaries
Region or Line USA (BART, Caltrain, Muni, Green Line, CAHSR) Processes Production of traction energy
Production of stationary energy Vehicle fleet (operation, construction, maintenance) Track system (operation, construction, maintenance), without tunnels and
bridges Railway stations (operation, construction, maintenance) Maintenance centres (operation, construction, maintenance) Other buildings (parkings, construction and maintenance)
Reference year(s) 2005 Components Energy
GHG (CO2, CH4, N2O), other emissions to air (SO2, CO, NOx, VOC, Pb, PM10)
Methodology LCA, EIO-LCA, SimaPro Results
Sector Passenger transport long distance Unit Functional units are impacts per vehicle lifetime, VMT and PMT Summary Total life-cycle-energy consumption is significantly larger than vehicle operation:
Passenger cars: +39-56% Buses: +43% Rail: +39-150% Air: +24-31%
Significant increase also for other components
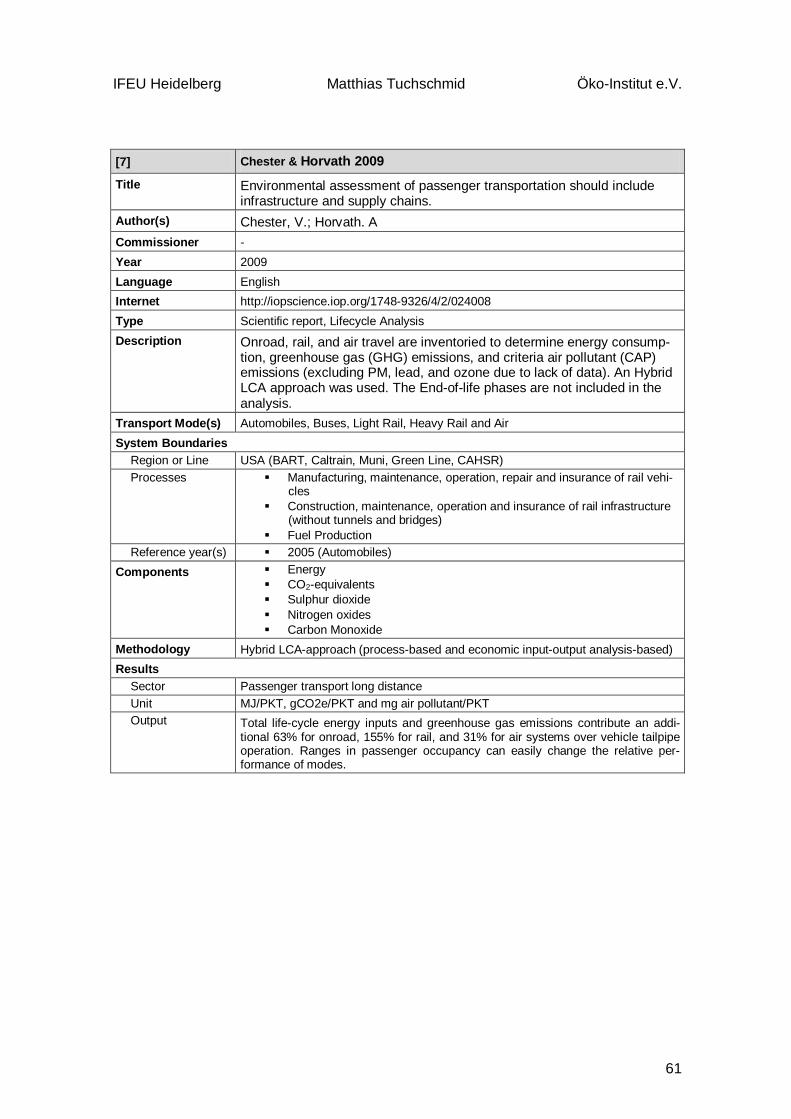
IFEU Heidelberg Matthias Tuchschmid Öko-Institut e.V.
61
[7] Chester & Horvath 2009
Title Environmental assessment of passenger transportation should include infrastructure and supply chains.
Author(s) Chester, V.; Horvath. A Commissioner - Year 2009 Language English Internet http://iopscience.iop.org/1748-9326/4/2/024008 Type Scientific report, Lifecycle Analysis Description Onroad, rail, and air travel are inventoried to determine energy consump-
tion, greenhouse gas (GHG) emissions, and criteria air pollutant (CAP) emissions (excluding PM, lead, and ozone due to lack of data). An Hybrid LCA approach was used. The End-of-life phases are not included in the analysis.
Transport Mode(s) Automobiles, Buses, Light Rail, Heavy Rail and Air System Boundaries
Region or Line USA (BART, Caltrain, Muni, Green Line, CAHSR) Processes Manufacturing, maintenance, operation, repair and insurance of rail vehi-
cles Construction, maintenance, operation and insurance of rail infrastructure
(without tunnels and bridges) Fuel Production
Reference year(s) 2005 (Automobiles) Components Energy
CO2-equivalents Sulphur dioxide Nitrogen oxides Carbon Monoxide
Methodology Hybrid LCA-approach (process-based and economic input-output analysis-based) Results
Sector Passenger transport long distance Unit MJ/PKT, gCO2e/PKT and mg air pollutant/PKT Output Total life-cycle energy inputs and greenhouse gas emissions contribute an addi-
tional 63% for onroad, 155% for rail, and 31% for air systems over vehicle tailpipe operation. Ranges in passenger occupancy can easily change the relative per-formance of modes.
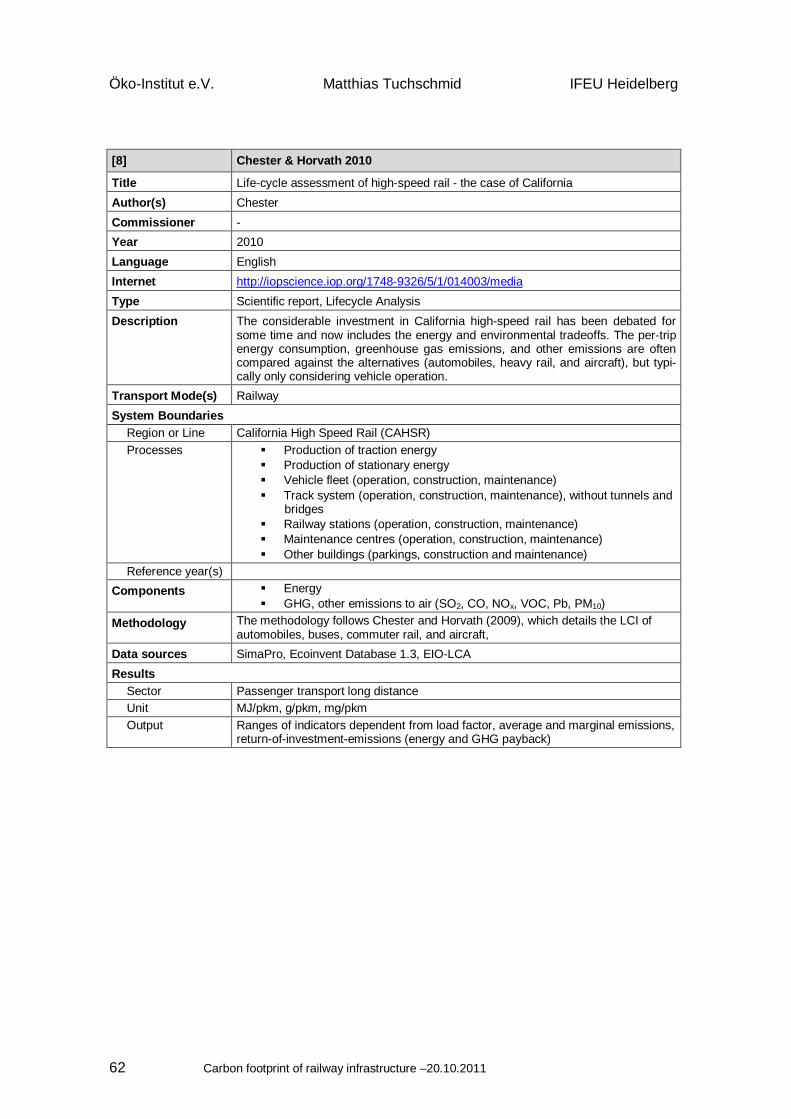
Öko-Institut e.V. Matthias Tuchschmid IFEU Heidelberg
Carbon footprint of railway infrastructure –20.10.2011 62
[8] Chester & Horvath 2010
Title Life-cycle assessment of high-speed rail - the case of California Author(s) Chester Commissioner - Year 2010 Language English Internet http://iopscience.iop.org/1748-9326/5/1/014003/media Type Scientific report, Lifecycle Analysis Description The considerable investment in California high-speed rail has been debated for
some time and now includes the energy and environmental tradeoffs. The per-trip energy consumption, greenhouse gas emissions, and other emissions are often compared against the alternatives (automobiles, heavy rail, and aircraft), but typi-cally only considering vehicle operation.
Transport Mode(s) Railway System Boundaries
Region or Line California High Speed Rail (CAHSR) Processes Production of traction energy
Production of stationary energy Vehicle fleet (operation, construction, maintenance) Track system (operation, construction, maintenance), without tunnels and
bridges Railway stations (operation, construction, maintenance) Maintenance centres (operation, construction, maintenance) Other buildings (parkings, construction and maintenance)
Reference year(s) Components Energy
GHG, other emissions to air (SO2, CO, NOx, VOC, Pb, PM10) Methodology The methodology follows Chester and Horvath (2009), which details the LCI of
automobiles, buses, commuter rail, and aircraft, Data sources SimaPro, Ecoinvent Database 1.3, EIO-LCA Results
Sector Passenger transport long distance Unit MJ/pkm, g/pkm, mg/pkm Output Ranges of indicators dependent from load factor, average and marginal emissions,
return-of-investment-emissions (energy and GHG payback)
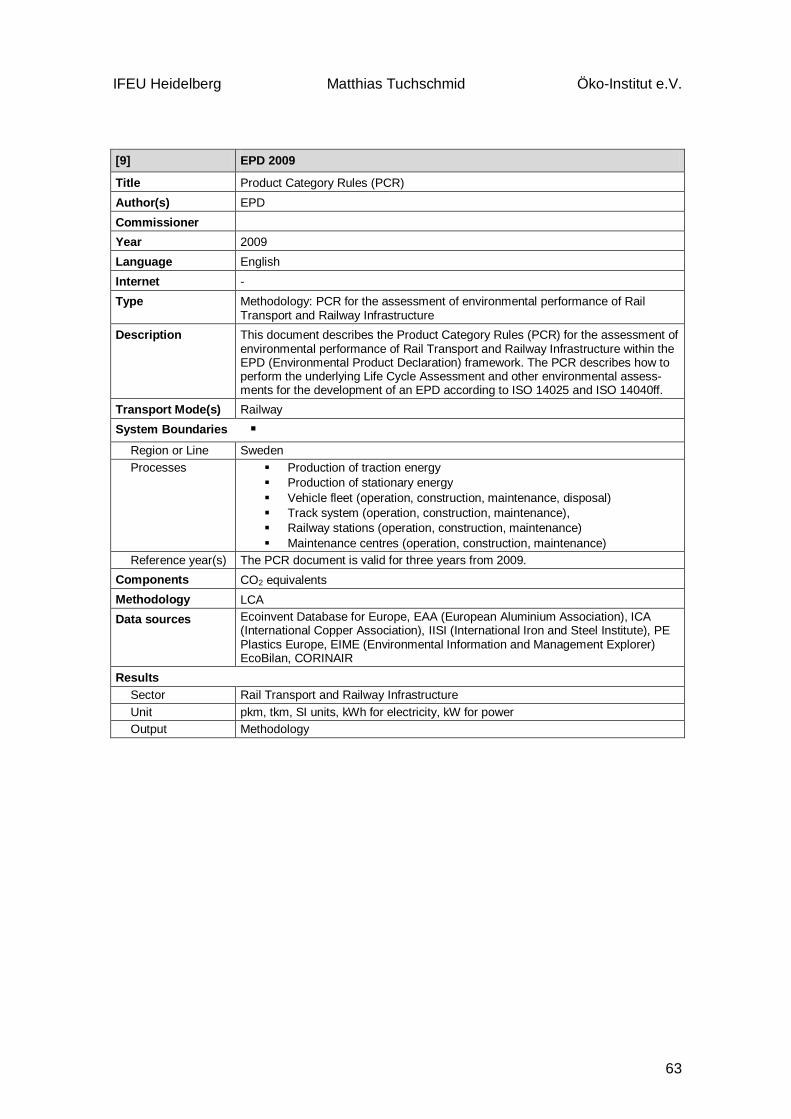
IFEU Heidelberg Matthias Tuchschmid Öko-Institut e.V.
63
[9] EPD 2009
Title Product Category Rules (PCR) Author(s) EPD Commissioner Year 2009 Language English Internet - Type Methodology: PCR for the assessment of environmental performance of Rail
Transport and Railway Infrastructure Description This document describes the Product Category Rules (PCR) for the assessment of
environmental performance of Rail Transport and Railway Infrastructure within the EPD (Environmental Product Declaration) framework. The PCR describes how to perform the underlying Life Cycle Assessment and other environmental assess-ments for the development of an EPD according to ISO 14025 and ISO 14040ff.
Transport Mode(s) Railway System Boundaries
Region or Line Sweden Processes Production of traction energy
Production of stationary energy Vehicle fleet (operation, construction, maintenance, disposal) Track system (operation, construction, maintenance), Railway stations (operation, construction, maintenance) Maintenance centres (operation, construction, maintenance)
Reference year(s) The PCR document is valid for three years from 2009. Components CO2 equivalents Methodology LCA Data sources Ecoinvent Database for Europe, EAA (European Aluminium Association), ICA
(International Copper Association), IISI (International Iron and Steel Institute), PE Plastics Europe, EIME (Environmental Information and Management Explorer) EcoBilan, CORINAIR
Results Sector Rail Transport and Railway Infrastructure Unit pkm, tkm, SI units, kWh for electricity, kW for power Output Methodology
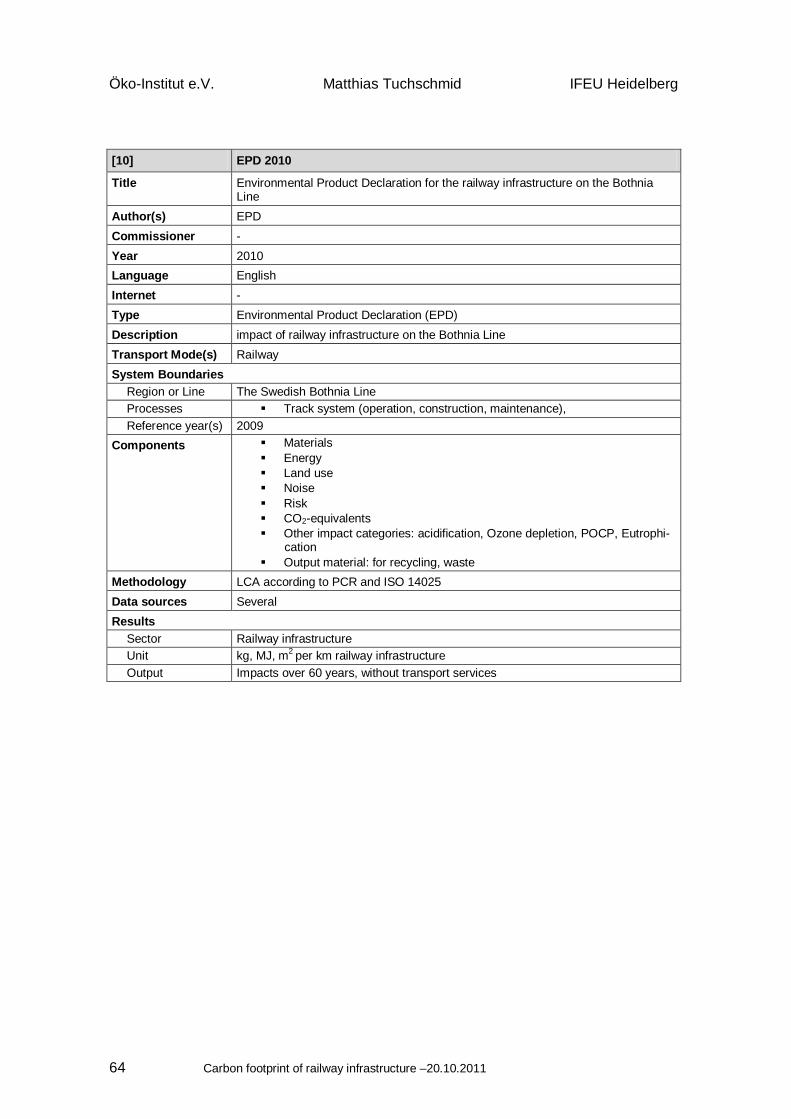
Öko-Institut e.V. Matthias Tuchschmid IFEU Heidelberg
Carbon footprint of railway infrastructure –20.10.2011 64
[10] EPD 2010
Title Environmental Product Declaration for the railway infrastructure on the Bothnia Line
Author(s) EPD Commissioner - Year 2010 Language English Internet - Type Environmental Product Declaration (EPD) Description impact of railway infrastructure on the Bothnia Line Transport Mode(s) Railway System Boundaries
Region or Line The Swedish Bothnia Line Processes Track system (operation, construction, maintenance), Reference year(s) 2009
Components Materials Energy Land use Noise Risk CO2-equivalents Other impact categories: acidification, Ozone depletion, POCP, Eutrophi-
cation Output material: for recycling, waste
Methodology LCA according to PCR and ISO 14025 Data sources Several Results
Sector Railway infrastructure Unit kg, MJ, m2 per km railway infrastructure Output Impacts over 60 years, without transport services
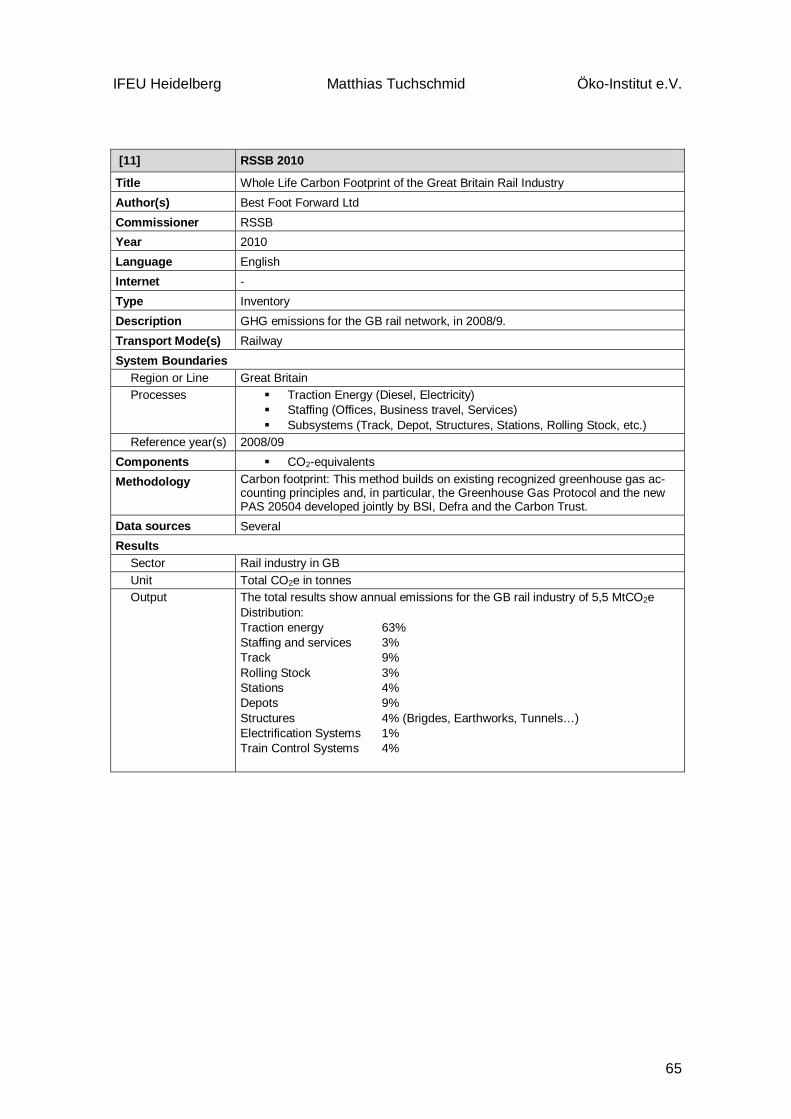
IFEU Heidelberg Matthias Tuchschmid Öko-Institut e.V.
65
[11] RSSB 2010
Title Whole Life Carbon Footprint of the Great Britain Rail Industry Author(s) Best Foot Forward Ltd Commissioner RSSB Year 2010 Language English Internet - Type Inventory Description GHG emissions for the GB rail network, in 2008/9. Transport Mode(s) Railway System Boundaries
Region or Line Great Britain Processes Traction Energy (Diesel, Electricity)
Staffing (Offices, Business travel, Services) Subsystems (Track, Depot, Structures, Stations, Rolling Stock, etc.)
Reference year(s) 2008/09 Components CO2-equivalents Methodology Carbon footprint: This method builds on existing recognized greenhouse gas ac-
counting principles and, in particular, the Greenhouse Gas Protocol and the new PAS 20504 developed jointly by BSI, Defra and the Carbon Trust.
Data sources Several Results
Sector Rail industry in GB Unit Total CO2e in tonnes Output The total results show annual emissions for the GB rail industry of 5,5 MtCO2e
Distribution: Traction energy 63% Staffing and services 3% Track 9% Rolling Stock 3% Stations 4% Depots 9% Structures 4% (Brigdes, Earthworks, Tunnels…) Electrification Systems 1% Train Control Systems 4%
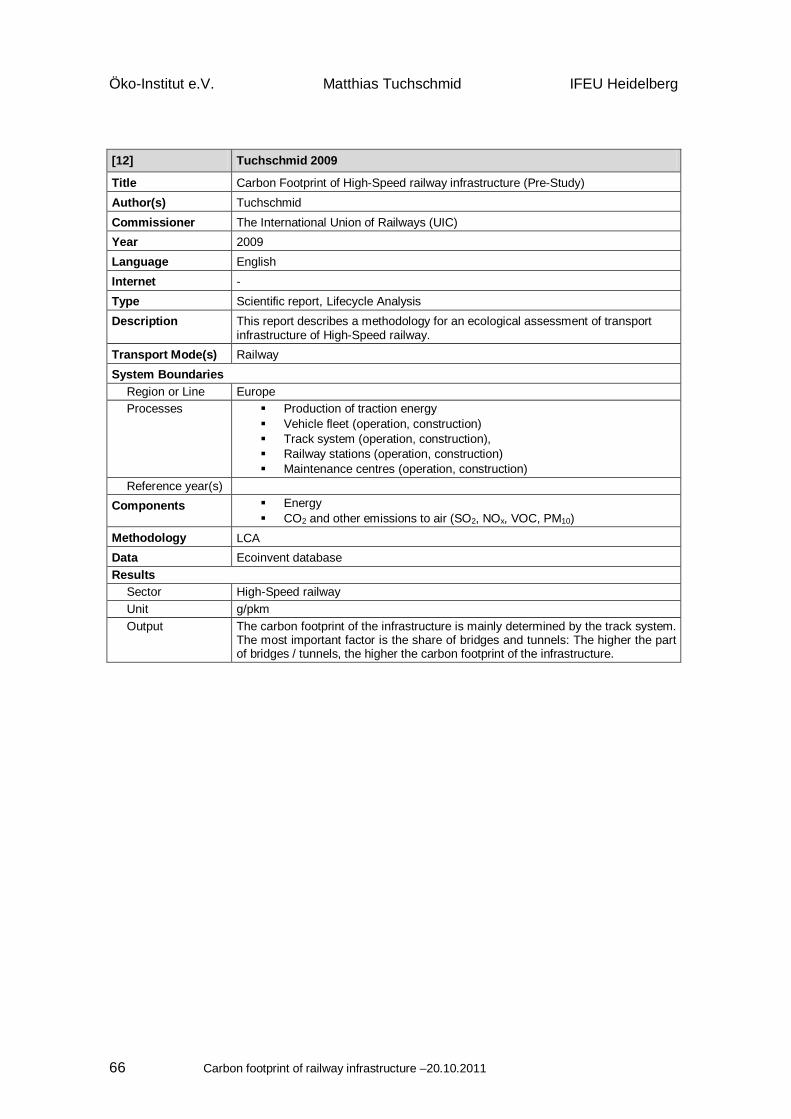
Öko-Institut e.V. Matthias Tuchschmid IFEU Heidelberg
Carbon footprint of railway infrastructure –20.10.2011 66
[12] Tuchschmid 2009
Title Carbon Footprint of High-Speed railway infrastructure (Pre-Study) Author(s) Tuchschmid Commissioner The International Union of Railways (UIC) Year 2009 Language English Internet - Type Scientific report, Lifecycle Analysis Description This report describes a methodology for an ecological assessment of transport
infrastructure of High-Speed railway. Transport Mode(s) Railway System Boundaries
Region or Line Europe Processes Production of traction energy
Vehicle fleet (operation, construction) Track system (operation, construction), Railway stations (operation, construction) Maintenance centres (operation, construction)
Reference year(s) Components Energy
CO2 and other emissions to air (SO2, NOx, VOC, PM10) Methodology LCA Data Ecoinvent database Results
Sector High-Speed railway Unit g/pkm Output The carbon footprint of the infrastructure is mainly determined by the track system.
The most important factor is the share of bridges and tunnels: The higher the part of bridges / tunnels, the higher the carbon footprint of the infrastructure.
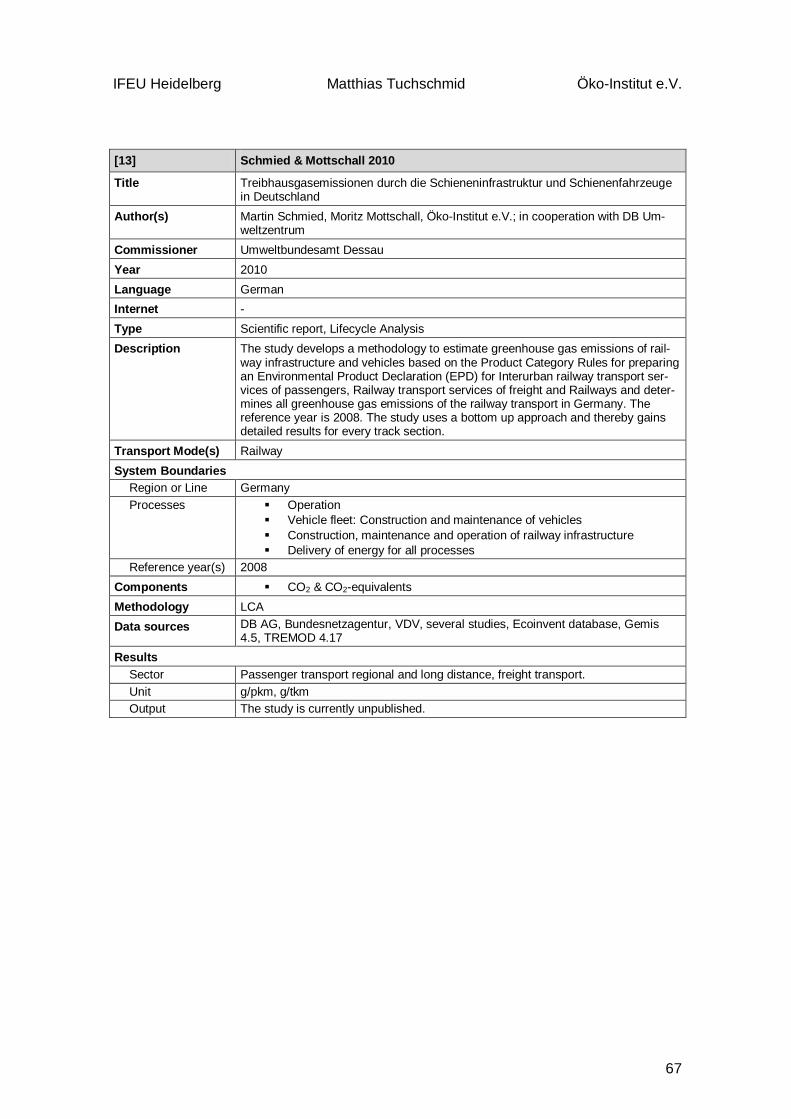
IFEU Heidelberg Matthias Tuchschmid Öko-Institut e.V.
67
[13] Schmied & Mottschall 2010
Title Treibhausgasemissionen durch die Schieneninfrastruktur und Schienenfahrzeuge in Deutschland
Author(s) Martin Schmied, Moritz Mottschall, Öko-Institut e.V.; in cooperation with DB Um-weltzentrum
Commissioner Umweltbundesamt Dessau Year 2010 Language German Internet - Type Scientific report, Lifecycle Analysis Description The study develops a methodology to estimate greenhouse gas emissions of rail-
way infrastructure and vehicles based on the Product Category Rules for preparing an Environmental Product Declaration (EPD) for Interurban railway transport ser-vices of passengers, Railway transport services of freight and Railways and deter-mines all greenhouse gas emissions of the railway transport in Germany. The reference year is 2008. The study uses a bottom up approach and thereby gains detailed results for every track section.
Transport Mode(s) Railway System Boundaries
Region or Line Germany Processes Operation
Vehicle fleet: Construction and maintenance of vehicles Construction, maintenance and operation of railway infrastructure Delivery of energy for all processes
Reference year(s) 2008 Components CO2 & CO2-equivalents Methodology LCA Data sources DB AG, Bundesnetzagentur, VDV, several studies, Ecoinvent database, Gemis
4.5, TREMOD 4.17 Results
Sector Passenger transport regional and long distance, freight transport. Unit g/pkm, g/tkm Output The study is currently unpublished.
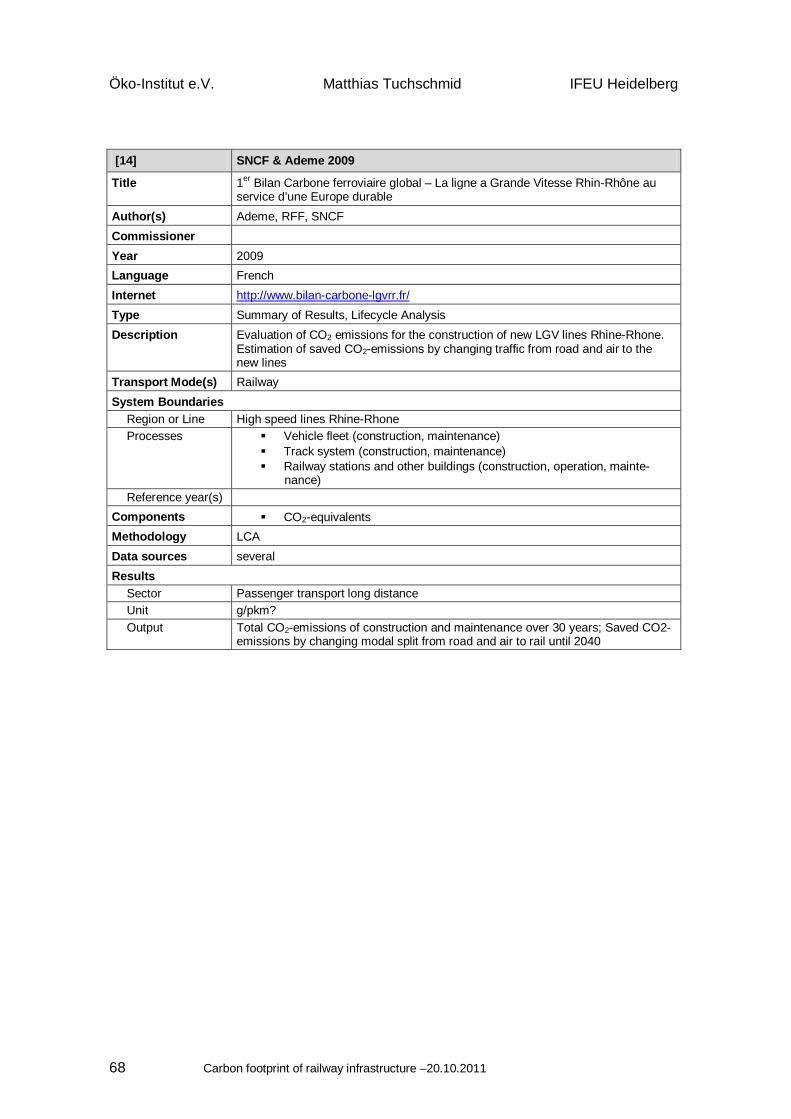
Öko-Institut e.V. Matthias Tuchschmid IFEU Heidelberg
Carbon footprint of railway infrastructure –20.10.2011 68
[14] SNCF & Ademe 2009
Title 1er Bilan Carbone ferroviaire global – La ligne a Grande Vitesse Rhin-Rhône au service d’une Europe durable
Author(s) Ademe, RFF, SNCF Commissioner Year 2009 Language French Internet http://www.bilan-carbone-lgvrr.fr/ Type Summary of Results, Lifecycle Analysis Description Evaluation of CO2 emissions for the construction of new LGV lines Rhine-Rhone.
Estimation of saved CO2-emissions by changing traffic from road and air to the new lines
Transport Mode(s) Railway System Boundaries
Region or Line High speed lines Rhine-Rhone Processes Vehicle fleet (construction, maintenance)
Track system (construction, maintenance) Railway stations and other buildings (construction, operation, mainte-
nance) Reference year(s)
Components CO2-equivalents Methodology LCA Data sources several Results
Sector Passenger transport long distance Unit g/pkm? Output Total CO2-emissions of construction and maintenance over 30 years; Saved CO2-
emissions by changing modal split from road and air to rail until 2040

IFEU Heidelberg Matthias Tuchschmid Öko-Institut e.V.
69
[15] Systra 2011
Title High Speed Rail contribution. Carbon footprint methodology and results Author(s) Systra, Matthias Tuchschmid Commissioner The International Union of Railways (UIC) Year 2011 Language English Internet - Type LCA Description The study aims to investigate the global warming impact of High Speed Rail
through a detailed study of the carbon footprint of four high speed line projects in France and Asia and a simplified modal comparison with road and air transport.
Transport Mode(s) Railway System Boundaries
Region or Line High Speed Lines over the world Processes Production of traction energy
Vehicle fleet (operation, construction) Track system (operation, construction), Railway stations (operation, construction) Maintenance centers (operation, construction)
Reference year(s) 2004 Components CO2-equivalents Methodology LCA Data Data collection from Systra’s archives, but also on investigation in research litera-
ture on the subject. The Ecoinvent database has been chosen to provide emission factors.
Results Sector Passenger transport long distance Unit Emissions/pkm Output CO2 –emissions for the following Lines:
LGV Med in France: Valence - Marseille LGV SEA in France: Tours - Bordeaux HSR in Taiwan: Taipeh – Kaohsiung HSR in China: Bejing – Tianjin

Öko-Institut e.V. Matthias Tuchschmid IFEU Heidelberg
Carbon footprint of railway infrastructure –20.10.2011 70
[16] Loffredo,& Fedele & Severini 2011
Title The climatic mark of railway infrastructural projects Author(s) Loffredo, F., Fedele, P., Severini, M. Commissioner Italferr Year 2011 Language Italian, English Internet - Type Describtion of Methodology Description Description of a methodology for the determination of the carbon footprint of rail-
way infrastructural projects, based on ISO 14064.1:2006. Transport Mode(s) Railway System Boundaries
Region or Line Bari S. Andrea-Biletto (application case) Processes Development of the project
Use of building material and precasts transport of materials Processing, installation and building Clearings and avoided emissions
Reference year(s) - Components CO2 emissions Methodology LCA, based on ISO 14064.1:2006 Data Results
Sector Railway Infrastructure Unit Tonnes CO2 Output Case Study: More than 80% of CO2-emissions originates from the production of
building materiel, 13% from operational activities performed at the building site and 5% from transport of materials
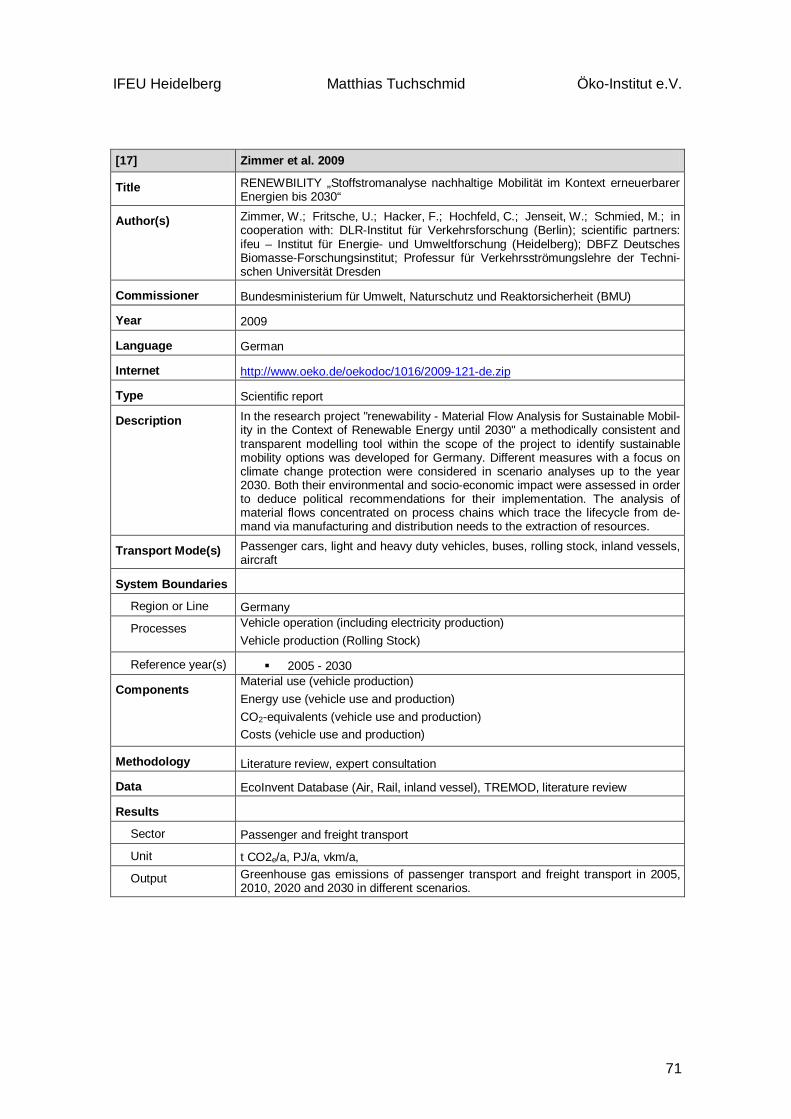
IFEU Heidelberg Matthias Tuchschmid Öko-Institut e.V.
71
[17] Zimmer et al. 2009
Title RENEWBILITY „Stoffstromanalyse nachhaltige Mobilität im Kontext erneuerbarer Energien bis 2030“
Author(s) Zimmer, W.; Fritsche, U.; Hacker, F.; Hochfeld, C.; Jenseit, W.; Schmied, M.; in cooperation with: DLR-Institut für Verkehrsforschung (Berlin); scientific partners: ifeu – Institut für Energie- und Umweltforschung (Heidelberg); DBFZ Deutsches Biomasse-Forschungsinstitut; Professur für Verkehrsströmungslehre der Techni-schen Universität Dresden
Commissioner Bundesministerium für Umwelt, Naturschutz und Reaktorsicherheit (BMU)
Year 2009
Language German
Internet http://www.oeko.de/oekodoc/1016/2009-121-de.zip
Type Scientific report
Description In the research project "renewability - Material Flow Analysis for Sustainable Mobil-ity in the Context of Renewable Energy until 2030" a methodically consistent and transparent modelling tool within the scope of the project to identify sustainable mobility options was developed for Germany. Different measures with a focus on climate change protection were considered in scenario analyses up to the year 2030. Both their environmental and socio-economic impact were assessed in order to deduce political recommendations for their implementation. The analysis of material flows concentrated on process chains which trace the lifecycle from de-mand via manufacturing and distribution needs to the extraction of resources.
Transport Mode(s) Passenger cars, light and heavy duty vehicles, buses, rolling stock, inland vessels, aircraft
System Boundaries
Region or Line Germany
Processes Vehicle operation (including electricity production) Vehicle production (Rolling Stock)
Reference year(s) 2005 - 2030
Components Material use (vehicle production) Energy use (vehicle use and production) CO2-equivalents (vehicle use and production) Costs (vehicle use and production)
Methodology Literature review, expert consultation
Data EcoInvent Database (Air, Rail, inland vessel), TREMOD, literature review
Results
Sector Passenger and freight transport
Unit t CO2e/a, PJ/a, vkm/a,
Output Greenhouse gas emissions of passenger transport and freight transport in 2005, 2010, 2020 and 2030 in different scenarios.
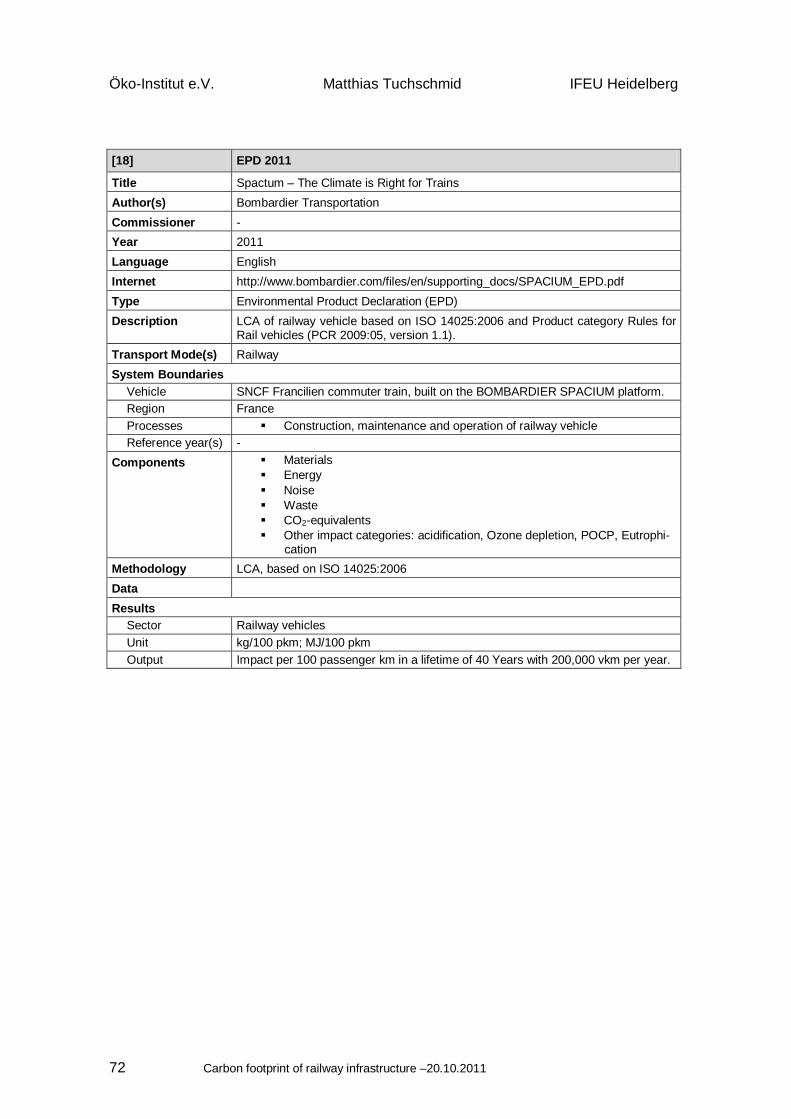
Öko-Institut e.V. Matthias Tuchschmid IFEU Heidelberg
Carbon footprint of railway infrastructure –20.10.2011 72
[18] EPD 2011
Title Spactum – The Climate is Right for Trains Author(s) Bombardier Transportation Commissioner - Year 2011 Language English Internet http://www.bombardier.com/files/en/supporting_docs/SPACIUM_EPD.pdf Type Environmental Product Declaration (EPD) Description LCA of railway vehicle based on ISO 14025:2006 and Product category Rules for
Rail vehicles (PCR 2009:05, version 1.1). Transport Mode(s) Railway System Boundaries
Vehicle SNCF Francilien commuter train, built on the BOMBARDIER SPACIUM platform. Region France Processes Construction, maintenance and operation of railway vehicle Reference year(s) -
Components Materials Energy Noise Waste CO2-equivalents Other impact categories: acidification, Ozone depletion, POCP, Eutrophi-
cation Methodology LCA, based on ISO 14025:2006 Data Results
Sector Railway vehicles Unit kg/100 pkm; MJ/100 pkm Output Impact per 100 passenger km in a lifetime of 40 Years with 200,000 vkm per year.
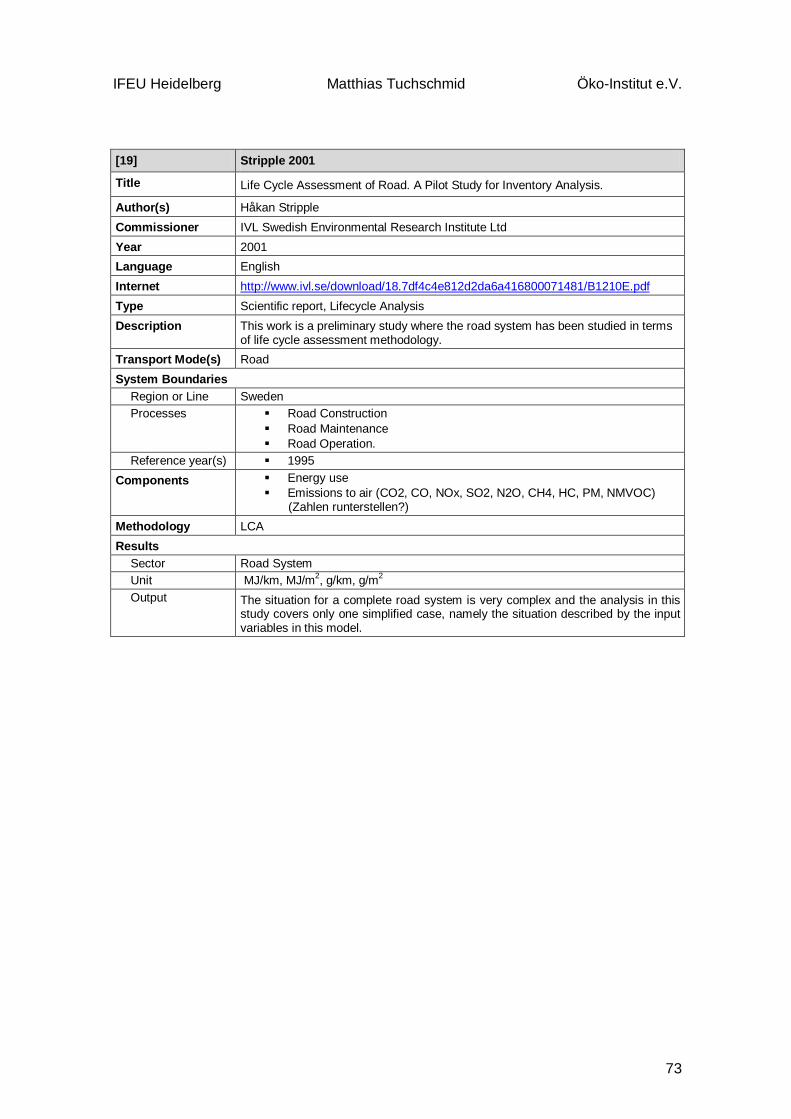
IFEU Heidelberg Matthias Tuchschmid Öko-Institut e.V.
73
[19] Stripple 2001
Title Life Cycle Assessment of Road. A Pilot Study for Inventory Analysis.
Author(s) Håkan Stripple Commissioner IVL Swedish Environmental Research Institute Ltd Year 2001 Language English Internet http://www.ivl.se/download/18.7df4c4e812d2da6a416800071481/B1210E.pdf Type Scientific report, Lifecycle Analysis Description This work is a preliminary study where the road system has been studied in terms
of life cycle assessment methodology. Transport Mode(s) Road System Boundaries
Region or Line Sweden Processes Road Construction
Road Maintenance Road Operation.
Reference year(s) 1995 Components Energy use
Emissions to air (CO2, CO, NOx, SO2, N2O, CH4, HC, PM, NMVOC) (Zahlen runterstellen?)
Methodology LCA Results
Sector Road System Unit MJ/km, MJ/m2, g/km, g/m2 Output The situation for a complete road system is very complex and the analysis in this
study covers only one simplified case, namely the situation described by the input variables in this model.
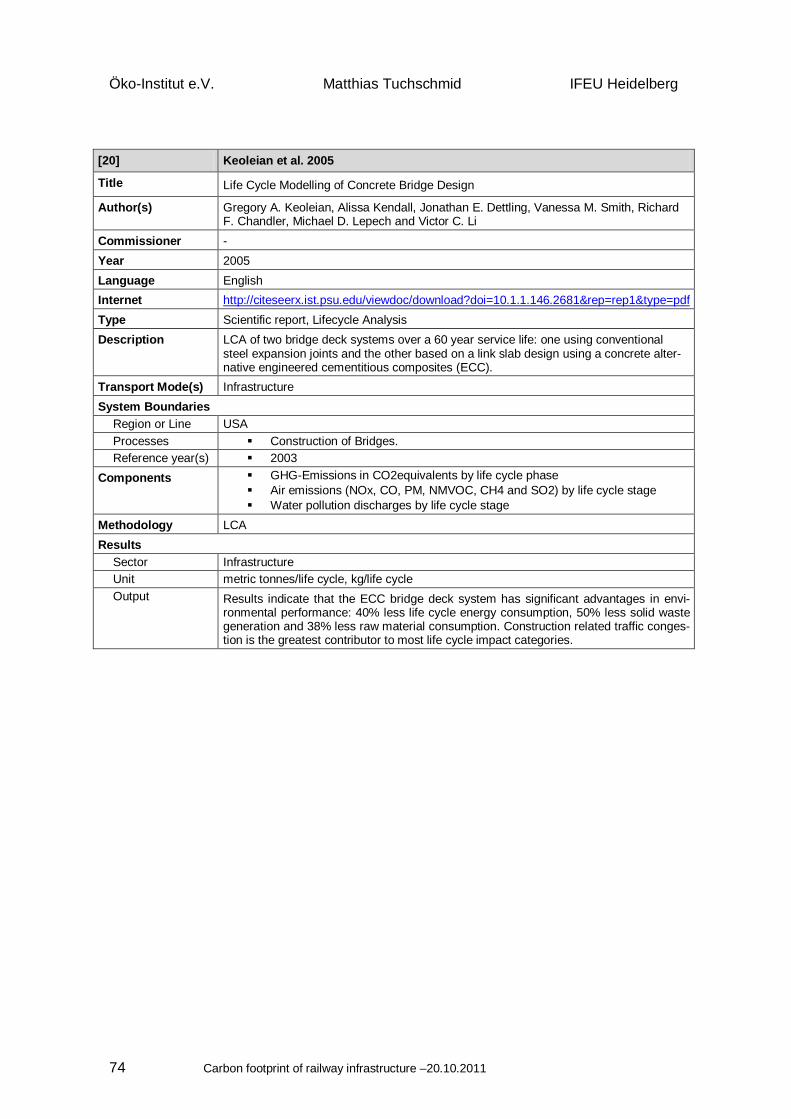
Öko-Institut e.V. Matthias Tuchschmid IFEU Heidelberg
Carbon footprint of railway infrastructure –20.10.2011 74
[20] Keoleian et al. 2005
Title Life Cycle Modelling of Concrete Bridge Design
Author(s) Gregory A. Keoleian, Alissa Kendall, Jonathan E. Dettling, Vanessa M. Smith, Richard F. Chandler, Michael D. Lepech and Victor C. Li
Commissioner - Year 2005 Language English Internet http://citeseerx.ist.psu.edu/viewdoc/download?doi=10.1.1.146.2681&rep=rep1&type=pdf Type Scientific report, Lifecycle Analysis Description LCA of two bridge deck systems over a 60 year service life: one using conventional
steel expansion joints and the other based on a link slab design using a concrete alter-native engineered cementitious composites (ECC).
Transport Mode(s) Infrastructure System Boundaries
Region or Line USA Processes Construction of Bridges. Reference year(s) 2003
Components GHG-Emissions in CO2equivalents by life cycle phase Air emissions (NOx, CO, PM, NMVOC, CH4 and SO2) by life cycle stage Water pollution discharges by life cycle stage
Methodology LCA Results
Sector Infrastructure Unit metric tonnes/life cycle, kg/life cycle Output Results indicate that the ECC bridge deck system has significant advantages in envi-
ronmental performance: 40% less life cycle energy consumption, 50% less solid waste generation and 38% less raw material consumption. Construction related traffic conges-tion is the greatest contributor to most life cycle impact categories.
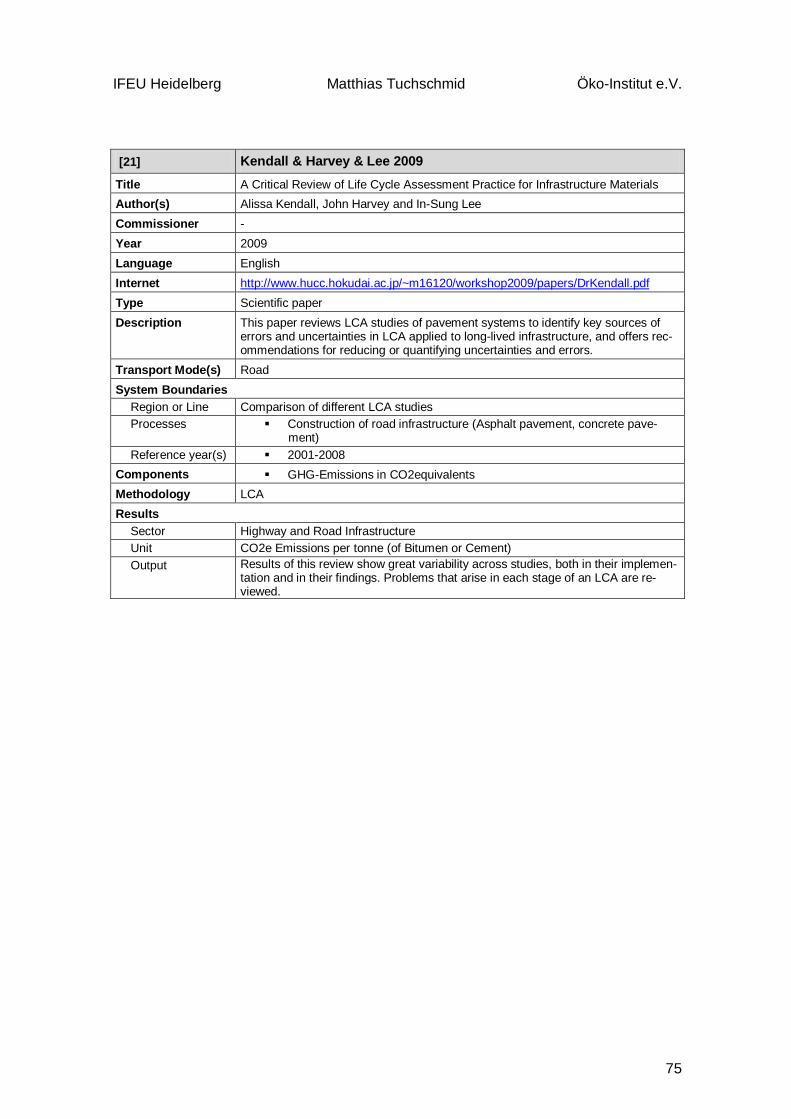
IFEU Heidelberg Matthias Tuchschmid Öko-Institut e.V.
75
[21] Kendall & Harvey & Lee 2009
Title A Critical Review of Life Cycle Assessment Practice for Infrastructure Materials Author(s) Alissa Kendall, John Harvey and In-Sung Lee Commissioner - Year 2009 Language English Internet http://www.hucc.hokudai.ac.jp/~m16120/workshop2009/papers/DrKendall.pdf Type Scientific paper Description This paper reviews LCA studies of pavement systems to identify key sources of
errors and uncertainties in LCA applied to long-lived infrastructure, and offers rec-ommendations for reducing or quantifying uncertainties and errors.
Transport Mode(s) Road System Boundaries
Region or Line Comparison of different LCA studies Processes Construction of road infrastructure (Asphalt pavement, concrete pave-
ment) Reference year(s) 2001-2008
Components GHG-Emissions in CO2equivalents Methodology LCA Results
Sector Highway and Road Infrastructure Unit CO2e Emissions per tonne (of Bitumen or Cement) Output Results of this review show great variability across studies, both in their implemen-
tation and in their findings. Problems that arise in each stage of an LCA are re-viewed.
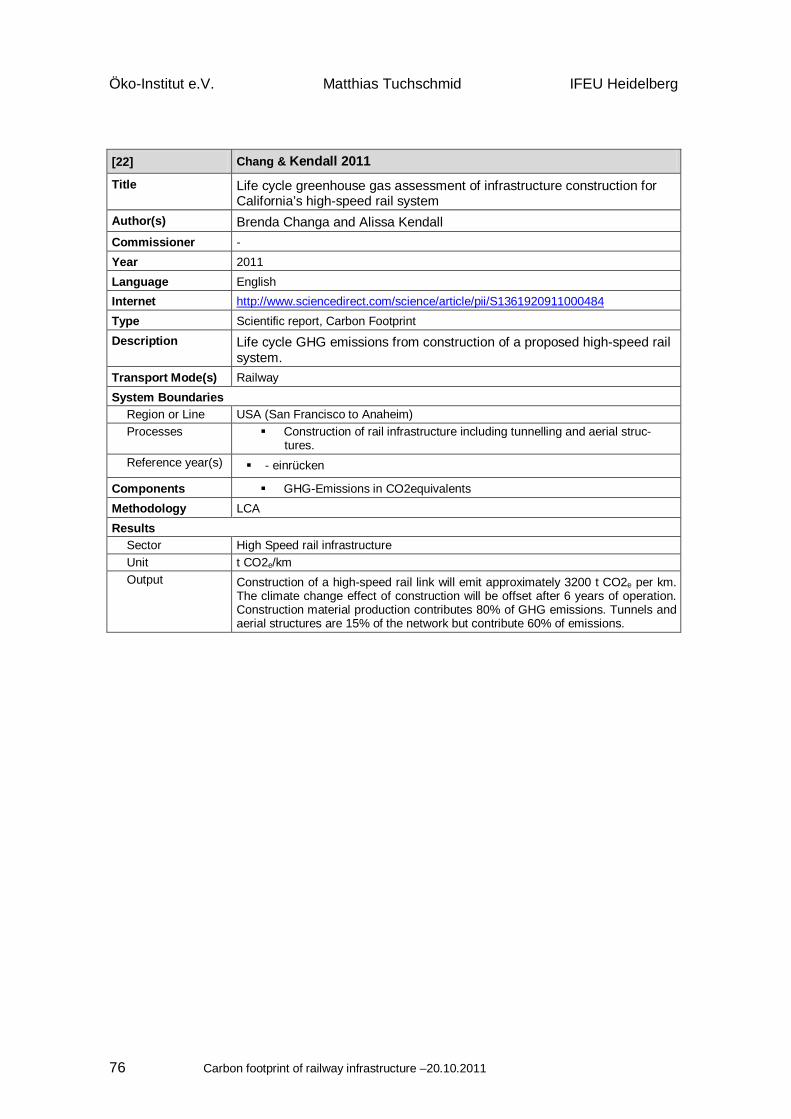
Öko-Institut e.V. Matthias Tuchschmid IFEU Heidelberg
Carbon footprint of railway infrastructure –20.10.2011 76
[22] Chang & Kendall 2011
Title Life cycle greenhouse gas assessment of infrastructure construction for California’s high-speed rail system
Author(s) Brenda Changa and Alissa Kendall Commissioner - Year 2011 Language English Internet http://www.sciencedirect.com/science/article/pii/S1361920911000484 Type Scientific report, Carbon Footprint Description Life cycle GHG emissions from construction of a proposed high-speed rail
system. Transport Mode(s) Railway System Boundaries
Region or Line USA (San Francisco to Anaheim) Processes Construction of rail infrastructure including tunnelling and aerial struc-
tures. Reference year(s) - einrücken
Components GHG-Emissions in CO2equivalents Methodology LCA Results
Sector High Speed rail infrastructure Unit t CO2e/km Output Construction of a high-speed rail link will emit approximately 3200 t CO2e per km.
The climate change effect of construction will be offset after 6 years of operation. Construction material production contributes 80% of GHG emissions. Tunnels and aerial structures are 15% of the network but contribute 60% of emissions.
IFEU Heidelberg Matthias Tuchschmid Öko-Institut e.V.
77
8 Annex
8.1 Further Data sources
The following project sheets delivered useful additional information about material use for the construction of railway infrastructure:
Project 1: Austria: ÖBB (2009): Umbau Arlbergeisenbahntunnel
Project 2: Belgian: Boxheimer & Mignon (2009): Liefkenshoek Railway Tunnel in Antwerpen
Project 3: France & Italy: LTF (2001): THE SAINT-MARTIN-LA-PORTE ACCESS TUNNEL
Project 4: France: RFF (2008): Contournement de Nîmes et Montpellier
Project 5: France: RFF (2008): Rhine-Rhone high-speed line
Project 6: Germany: DB (2007): Neubaustrecke Ebensfeld-Erfurt. Eisenbahnüberführung Fuellbach-talbrücke Coburg-Süd
Project 7: Germany: Krebs und Kiefer (1997): Neuer Mainzer Tunnel (Fernbahntunnel)
Project 8: Great Britain: INGENIA ISSUE (2007): High Speed 1. The UKs First High Speed Railway
Project 9: Italy: CHRYSO (2003): TGV Bologna-Milan
Project 10: Italy: CHRYSO (2004): TGV Milan-Naples
Project 11: Italy: RFI & TAV (2005): The new high speed TURIN - MILAN line
Project 12: Spain: ADIF Tunel Guadarrama
Project 13: Spain: ADIF Tuneles de Montblanc
Project 14: Sweden: EPD (2010): Environmental Product Declaration for railway bridges on the Bothnia Line
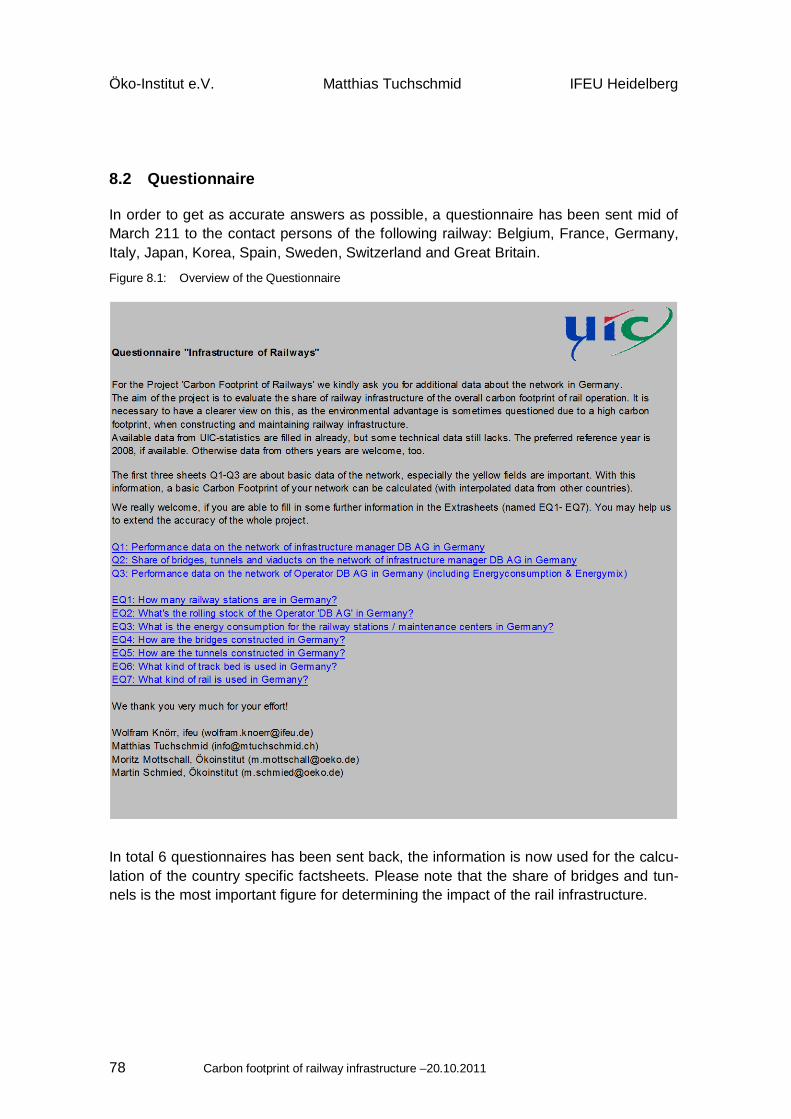
Öko-Institut e.V. Matthias Tuchschmid IFEU Heidelberg
Carbon footprint of railway infrastructure –20.10.2011 78
8.2 Questionnaire
In order to get as accurate answers as possible, a questionnaire has been sent mid of March 211 to the contact persons of the following railway: Belgium, France, Germany, Italy, Japan, Korea, Spain, Sweden, Switzerland and Great Britain.
Figure 8.1: Overview of the Questionnaire
In total 6 questionnaires has been sent back, the information is now used for the calcu-lation of the country specific factsheets. Please note that the share of bridges and tun-nels is the most important figure for determining the impact of the rail infrastructure.
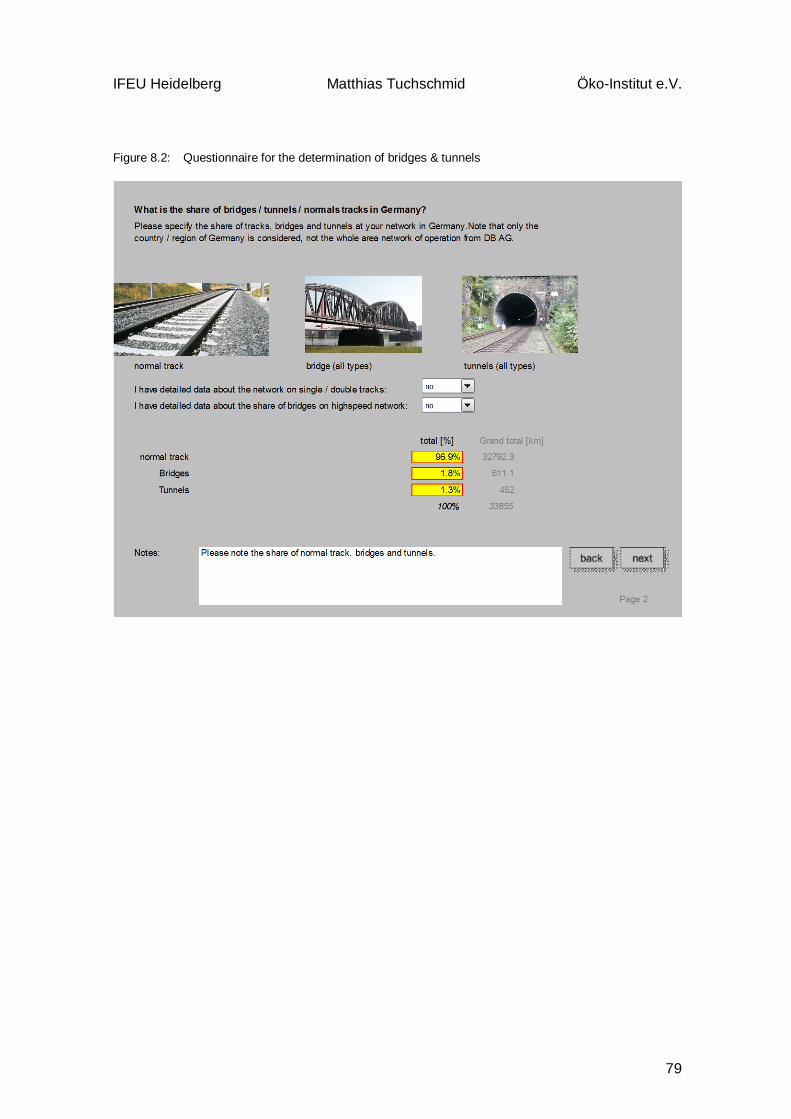
IFEU Heidelberg Matthias Tuchschmid Öko-Institut e.V.
79
Figure 8.2: Questionnaire for the determination of bridges & tunnels