Embed Size (px)
Citation preview
Environmental impacts of extensive outdoor pig production systems in
Corsica
Sandrine Espagnol1,*, Julie Demartini2
1 IFIP French institute for pig and pork production 2 ODARC Corresponding author. E-mail: [email protected]
ABSTRACT
The extensive outdoor pig production systems in Corsica are quite different from the conventional production of Europe. Because of the
longer lifetime of pigs and the lower technical performance of animals, the environmental impacts of a kilogram of pig until it leaves the
farm gates could be expected to be greater. The diets of pig have to be considered because the animals are fed partly with natural feed like
acorns and chestnuts. The hypothesis is made that those feedstuffs which grow naturally without any human mediation do not have any
environmental impact. Three Corsican systems with an increasing amount of natural feed in the diet were assessed using Life Cycle As-
sessment (LCA). The results per kg of pig indicate a decrease of 62-81% for selected impacts from the system with the least amount of
natural feeding to the more extensive system. By comparison, the conventional production systems of Europe previously assessed by
Dourmad et al. (2012) have intermediate results.
Keywords: outdoor pig production, LCA, natural feed
1. Introduction
The extensive outdoor pig production systems in Corsica are quite different from the standard production sys-
tems of Europe which have been described and assessed by Dourmad et al. (2012). The animals are raised out-
doors, on extensive areas and partially fed with chestnuts and acorns that have fallen directly from trees. Ani-
mals can also be left free in the mountain for a transhumance period. Compared to standard production, the
technical performance of the pigs is lower, and their lifetime (18-24 months) longer. Therefore, the Corsican
pigs are expected to have a higher environmental impact per kilogram of pig, despite an improved quality (Ed-
ward 2005).Their natural feed could partially reduce the environmental impact. It is not cultivated or transported
by humans. The chestnuts and acorns grow naturally on trees, with no maintenance.
This study performed an environmental assessment by Life Cycle Assessment (LCA) of three outdoor pig
production systems in Corsica. The objectives were to quantify the environmental gain on the kilogram of pig
produced, reached by the use of natural feed, and also to identify the specific data to collect on such systems to
be able to make an evaluation (Webb et al. 2014).
2. Methods
2.1. Description of the three Corsican pig systems
Three extensive outdoor pig production systems in Corsica were investigated (Table 1) and compared to the
average conventional system in Europe (Dourmad et al. 2012). The technical data of husbandry methods was
collected from farms. Two systems (Farm1 and Farm2) keep the animals on extensive areas where produced
feedstuffs are regularly provided to the pigs by the farmer. The pigs supplement their diet by taking acorns and
chestnuts from the ground. In a third system (Farm3) a part of the fattening pigs (64%) goes into the mountains
for a transhumance period of 135 days per year. During this period, the pigs are not fed at all by the farmer and
are dependent on natural feed found in the mountains.
Animal products sold by the Corsican farms are diverse: fattened pigs, piglets and maiden sows. The systems
were compared on their common product with results expressed for fattened pigs and sows.
The systems differed by the type and the proportion of produced feedstuffs in the pig diets: grains from crops
cultivated in Corsica (maize, barley …), feeds produced in Corsica with Corsican feedstuffs, and feeds coming
from metropolitan France. Their amounts and characteristics were considered to estimate the ingestion by the
pigs of purchased feeds (Table 2). The Corsican feeds given to the pigs are specific to extensive diets. It is elabo-
rated to complement the seasonal starchy diets with chestnuts and acorns. It takes into consideration the growing
Proceedings of the 9th International Conference on Life Cycle Assessment in the Agri-Food Sector
364
characteristics of the pigs and their energy needs. For this reason, the crude protein content of the feeds is higher
than in standard production (average content of 13.4% given by Dourmad et al. 2012).
Per sow and compared to Farm1, the amount of produced feedstuffs given to the pigs is respectively lower by
half for Farm3 and higher by 18% for Farm 2 (Figure 1). The main difference between Farm1 and Farm2 is the
type of diet and its protein content. Farm1 gives mainly concentrated feeds to sows with less quantity of feed and
more protein content than in Farm2. Farm 2 gives grains (barley, maize) which correspond to higher quantities
of feed with less protein content. For the three systems, the amount of feedstuffs and protein is largely below the
amount given in the conventional system of Dourmad et al. (2012) (1330 kg of feed /sow/year and 28 kg
N/sow/year). This could be partly explained by the fact that the pigs also ingested natural feed (chestnuts and
acorns) which was not considered. But the total protein amount ingested by sows (even with the natural feed in-
cluded) is known to be less than in standard conditions.
Table 1. Description of the three Corsican pig production systems assessed and comparison with the average
conventional system of Europe described by Dourmad et al. (2012) Units Description data Farm 1 Farm 2 Farm 3 Conventional
system of Eu-
rope (Dourmad
et al. 2012)
Pig unit Products
- Finished pigs (nb/year – kg LW)
- Primary sows (nb/year – LW kg)
- Culled sows (nb/year – LW kg)
- Piglets (nb/year – LW kg)
- Boar (nb/year – LW kg)
Pig areas (ha)
104 – 120 kg
10 – 65 kg
5 – 155 kg
70 – 8 kg
1 – 176 kg
170
65 – 140 kg
15 – 65 kg
5 – 170 kg
338 – 20 kg
219
204 – 120 kg
16 – 85 kg
16 – 170 kg
0.5 – 176 kg
220
4910 - 113 kg
0
Farrowing
unit
Number of sows (nb) 21 30 40 395
Housing Outdoor /
sheds
Outdoor /
sheds
Outdoor /
sheds
Building - slat-
ted floor
Piglets per sow per year (nb) 5.7 14.1 5.8
Produced feed per sow* (kg/year)
Produced feed intake (%):
- Growing diet
- Finishing diet
- Corsican maize
- Corsican triticale
- Corsican barley
- Corsican diet 80-20
546
66%
23%
11%
645
42%
7%
51%
278
93%
7%
1330
Fattening
unit
Housing Outdoor Outdoor Outdoor +
transhumance
Building - slat-
ted floor
Age at slaughter of fattening pigs (d) 540 503-720 549
Live weight of fattening pigs at slaughter (kg LW) 120 140 120 113
Produced feed conversion ratioa (kg/kg)
Produced feed intake (kg/year) :
- Growing diet
- Finishing diet
- Corsican maize
- Corsican triticale
- Corsican barley
- Birth diet
- Corsican diet 80-20
- Corsican diet 60-20-20
4.1
61%
21%
18%
7.3
2%
2%
30%
0.4%
1%
37%
28%
1.4
15%
69%
9%
7%
2.5
a without natural feed which corresponds to a part of the diet for the Corsican pigs
For the fattening pigs, from weaning to selling, Farm3 is still the most extensive system with lower quantities
of produced feedstuffs and nitrogen given to pigs. Farm1 and Farm2 give a close amount of nitrogen coming
from the produced feedstuffs, but with half as many feedstuffs for Farm1. This is due to the type of feedstuffs
provided with mainly concentrated feeds in Farm1 and with grains in Farm2. The comparison with the European
standard production of Dourmad et al. (2012) (267 kg of feed/pig and 6.8 kg N/pig) shows higher amounts of
feedstuffs and nitrogen given to the pigs for Farm1 and Farm2 (Figure 1). This is due to the lifetime of the pigs
which is three times longer (18-24 months) than in standard production. The amount of feed could also be ex-
Proceedings of the 9th International Conference on Life Cycle Assessment in the Agri-Food Sector
365
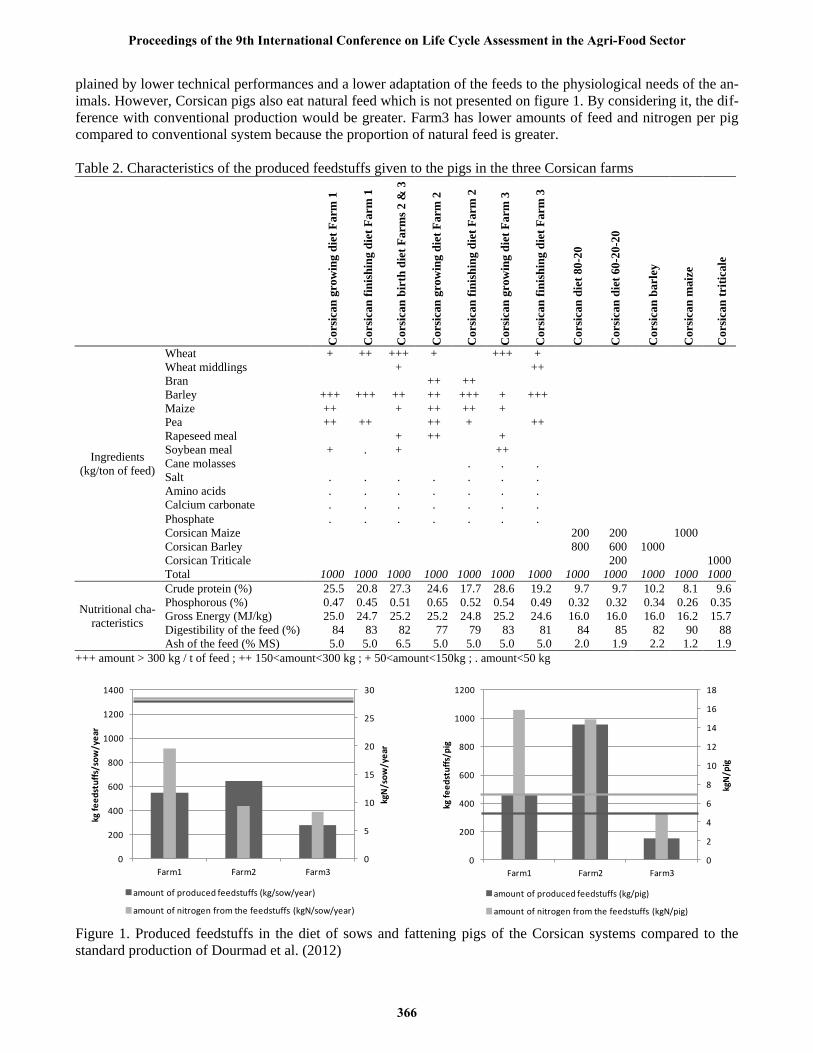
plained by lower technical performances and a lower adaptation of the feeds to the physiological needs of the an-
imals. However, Corsican pigs also eat natural feed which is not presented on figure 1. By considering it, the dif-
ference with conventional production would be greater. Farm3 has lower amounts of feed and nitrogen per pig
compared to conventional system because the proportion of natural feed is greater.
Table 2. Characteristics of the produced feedstuffs given to the pigs in the three Corsican farms
Cors
ican
gro
win
g d
iet
Farm
1
Cors
ican
fin
ish
ing d
iet
Farm
1
Cors
ican
bir
th d
iet
Farm
s 2 &
3
Cors
ican
gro
win
g d
iet
Farm
2
Cors
ican
fin
ish
ing d
iet
Farm
2
Cors
ican
gro
win
g d
iet
Farm
3
Cors
ican
fin
ish
ing d
iet
Farm
3
Cors
ican
die
t 80
-20
Cors
ican
die
t 60
-20-2
0
Cors
ican
barl
ey
Cors
ican
maiz
e
Cors
ican
tri
ticale
Ingredients
(kg/ton of feed)
Wheat + ++ +++ + +++ +
Wheat middlings + ++
Bran ++ ++
Barley +++ +++ ++ ++ +++ + +++
Maize ++ + ++ ++ +
Pea ++ ++ ++ + ++
Rapeseed meal + ++ +
Soybean meal + . + ++
Cane molasses . . .
Salt . . . . . . .
Amino acids . . . . . . .
Calcium carbonate . . . . . . .
Phosphate . . . . . . .
Corsican Maize 200 200 1000
Corsican Barley 800 600 1000
Corsican Triticale 200 1000
Total 1000 1000 1000 1000 1000 1000 1000 1000 1000 1000 1000 1000
Nutritional cha-
racteristics
Crude protein (%) 25.5 20.8 27.3 24.6 17.7 28.6 19.2 9.7 9.7 10.2 8.1 9.6
Phosphorous (%) 0.47 0.45 0.51 0.65 0.52 0.54 0.49 0.32 0.32 0.34 0.26 0.35
Gross Energy (MJ/kg) 25.0 24.7 25.2 25.2 24.8 25.2 24.6 16.0 16.0 16.0 16.2 15.7
Digestibility of the feed (%) 84 83 82 77 79 83 81 84 85 82 90 88
Ash of the feed (% MS) 5.0 5.0 6.5 5.0 5.0 5.0 5.0 2.0 1.9 2.2 1.2 1.9
+++ amount > 300 kg / t of feed ; ++ 150<amount<300 kg ; + 50<amount<150kg ; . amount<50 kg
0
5
10
15
20
25
30
0
200
400
600
800
1000
1200
1400
Farm1 Farm2 Farm3
kgN
/so
w/y
ear
kg f
ee
dst
uff
s/so
w/y
ear
amount of produced feedstuffs (kg/sow/year)
amount of nitrogen from the feedstuffs (kgN/sow/year)
0
2
4
6
8
10
12
14
16
18
0
200
400
600
800
1000
1200
Farm1 Farm2 Farm3
kgN
/pig
kg f
ee
dst
uff
s/p
ig
amount of produced feedstuffs (kg/pig)
amount of nitrogen from the feedstuffs (kgN/pig)
Figure 1. Produced feedstuffs in the diet of sows and fattening pigs of the Corsican systems compared to the
standard production of Dourmad et al. (2012)
Proceedings of the 9th International Conference on Life Cycle Assessment in the Agri-Food Sector
366
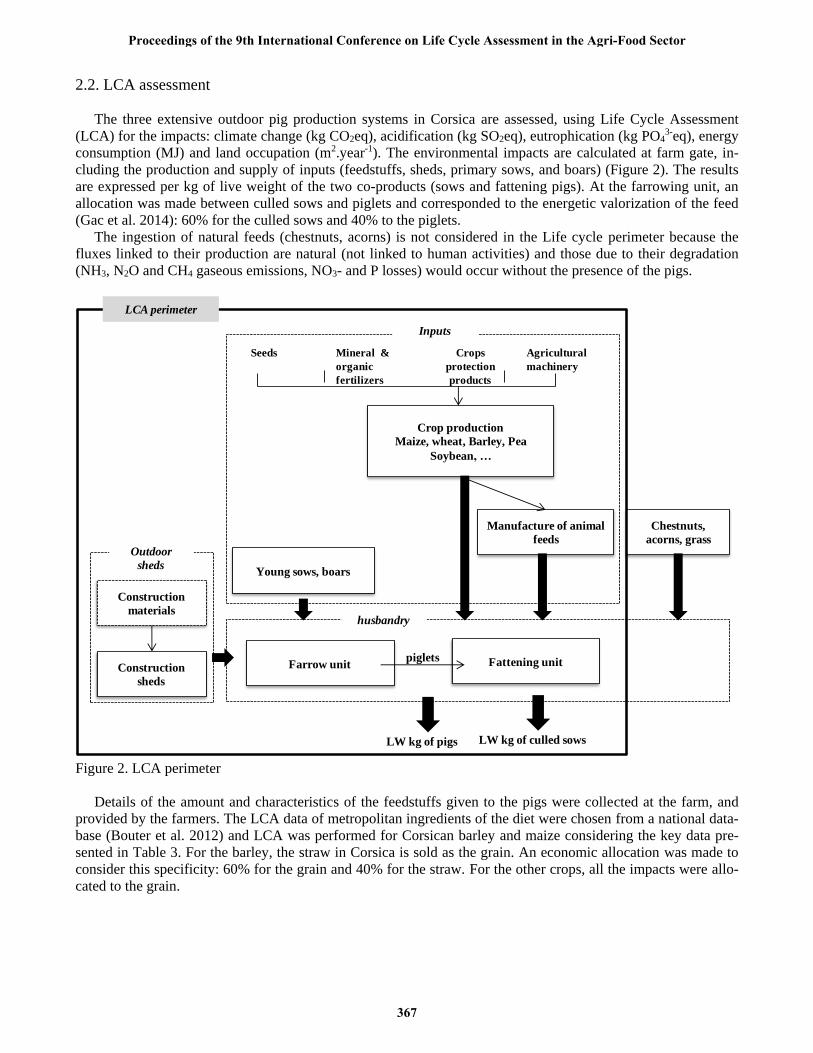
2.2. LCA assessment
The three extensive outdoor pig production systems in Corsica are assessed, using Life Cycle Assessment
(LCA) for the impacts: climate change (kg CO2eq), acidification (kg SO2eq), eutrophication (kg PO43-eq), energy
consumption (MJ) and land occupation (m2.year-1). The environmental impacts are calculated at farm gate, in-
cluding the production and supply of inputs (feedstuffs, sheds, primary sows, and boars) (Figure 2). The results
are expressed per kg of live weight of the two co-products (sows and fattening pigs). At the farrowing unit, an
allocation was made between culled sows and piglets and corresponded to the energetic valorization of the feed
(Gac et al. 2014): 60% for the culled sows and 40% to the piglets.
The ingestion of natural feeds (chestnuts, acorns) is not considered in the Life cycle perimeter because the
fluxes linked to their production are natural (not linked to human activities) and those due to their degradation
(NH3, N2O and CH4 gaseous emissions, NO3- and P losses) would occur without the presence of the pigs.
Seeds Mineral &
organic
fertilizers
Crops
protection
products
Agricultural
machinery
Manufacture of animal
feeds
Young sows, boars
Construction
materials
Construction
sheds
EFarrow unit
Outdoor
sheds
Inputs
Crop production
Maize, wheat, Barley, Pea
Soybean, …
Fattening unitpiglets
LW kg of pigs LW kg of culled sows
Chestnuts,
acorns, grass
LCA perimeter
husbandry
Figure 2. LCA perimeter
Details of the amount and characteristics of the feedstuffs given to the pigs were collected at the farm, and
provided by the farmers. The LCA data of metropolitan ingredients of the diet were chosen from a national data-
base (Bouter et al. 2012) and LCA was performed for Corsican barley and maize considering the key data pre-
sented in Table 3. For the barley, the straw in Corsica is sold as the grain. An economic allocation was made to
consider this specificity: 60% for the grain and 40% for the straw. For the other crops, all the impacts were allo-
cated to the grain.
Proceedings of the 9th International Conference on Life Cycle Assessment in the Agri-Food Sector
367
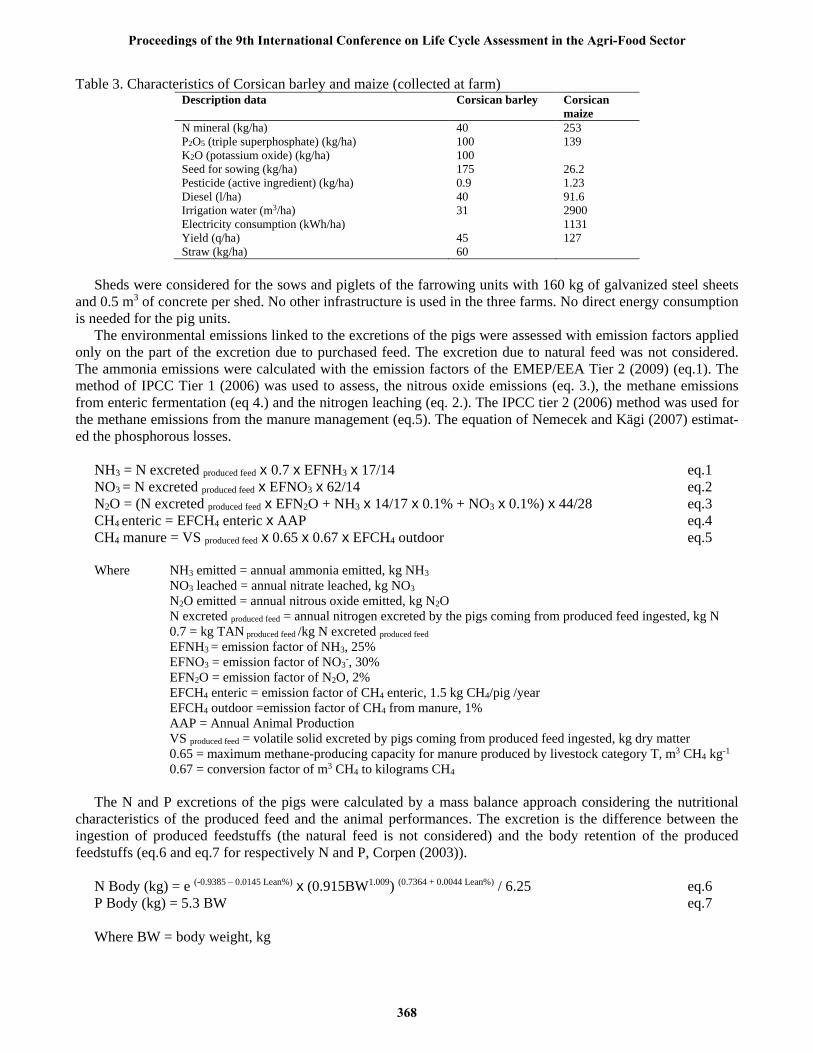
Table 3. Characteristics of Corsican barley and maize (collected at farm) Description data Corsican barley Corsican
maize
N mineral (kg/ha)
P2O5 (triple superphosphate) (kg/ha)
K2O (potassium oxide) (kg/ha)
Seed for sowing (kg/ha)
Pesticide (active ingredient) (kg/ha)
Diesel (l/ha)
Irrigation water (m3/ha)
Electricity consumption (kWh/ha)
Yield (q/ha)
Straw (kg/ha)
40
100
100
175
0.9
40
31
45
60
253
139
26.2
1.23
91.6
2900
1131
127
Sheds were considered for the sows and piglets of the farrowing units with 160 kg of galvanized steel sheets
and 0.5 m3 of concrete per shed. No other infrastructure is used in the three farms. No direct energy consumption
is needed for the pig units.
The environmental emissions linked to the excretions of the pigs were assessed with emission factors applied
only on the part of the excretion due to purchased feed. The excretion due to natural feed was not considered.
The ammonia emissions were calculated with the emission factors of the EMEP/EEA Tier 2 (2009) (eq.1). The
method of IPCC Tier 1 (2006) was used to assess, the nitrous oxide emissions (eq. 3.), the methane emissions
from enteric fermentation (eq 4.) and the nitrogen leaching (eq. 2.). The IPCC tier 2 (2006) method was used for
the methane emissions from the manure management (eq.5). The equation of Nemecek and Kägi (2007) estimat-
ed the phosphorous losses.
NH3 = N excreted produced feed x 0.7 x EFNH3 x 17/14 eq.1
NO3 = N excreted produced feed x EFNO3 x 62/14 eq.2
N2O = (N excreted produced feed x EFN2O + NH3 x 14/17 x 0.1% + NO3 x 0.1%) x 44/28 eq.3
CH4 enteric = EFCH4 enteric x AAP eq.4
CH4 manure = VS produced feed x 0.65 x 0.67 x EFCH4 outdoor eq.5
Where NH3 emitted = annual ammonia emitted, kg NH3
NO3 leached = annual nitrate leached, kg NO3
N2O emitted = annual nitrous oxide emitted, kg N2O
N excreted produced feed = annual nitrogen excreted by the pigs coming from produced feed ingested, kg N
0.7 = kg TAN produced feed /kg N excreted produced feed
EFNH3 = emission factor of NH3, 25%
EFNO3 = emission factor of NO3-, 30%
EFN2O = emission factor of N2O, 2%
EFCH4 enteric = emission factor of CH4 enteric, 1.5 kg CH4/pig /year
EFCH4 outdoor =emission factor of CH4 from manure, 1%
AAP = Annual Animal Production
VS produced feed = volatile solid excreted by pigs coming from produced feed ingested, kg dry matter
0.65 = maximum methane-producing capacity for manure produced by livestock category T, m3 CH4 kg-1
0.67 = conversion factor of m3 CH4 to kilograms CH4
The N and P excretions of the pigs were calculated by a mass balance approach considering the nutritional
characteristics of the produced feed and the animal performances. The excretion is the difference between the
ingestion of produced feedstuffs (the natural feed is not considered) and the body retention of the produced
feedstuffs (eq.6 and eq.7 for respectively N and P, Corpen (2003)).
N Body (kg) = e (-0.9385 – 0.0145 Lean%) x (0.915BW1.009) (0.7364 + 0.0044 Lean%) / 6.25 eq.6
P Body (kg) = 5.3 BW eq.7
Where BW = body weight, kg
Proceedings of the 9th International Conference on Life Cycle Assessment in the Agri-Food Sector
368
3. Results
3.1. Life cycle inventories
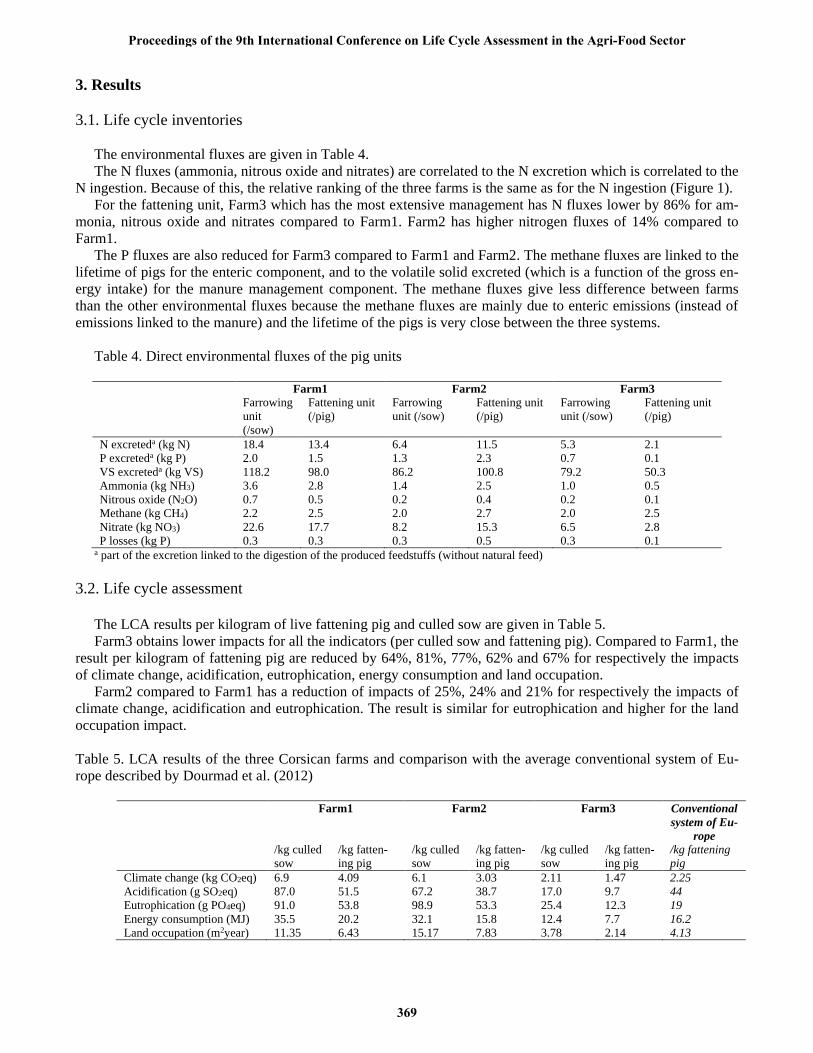
The environmental fluxes are given in Table 4.
The N fluxes (ammonia, nitrous oxide and nitrates) are correlated to the N excretion which is correlated to the
N ingestion. Because of this, the relative ranking of the three farms is the same as for the N ingestion (Figure 1).
For the fattening unit, Farm3 which has the most extensive management has N fluxes lower by 86% for am-
monia, nitrous oxide and nitrates compared to Farm1. Farm2 has higher nitrogen fluxes of 14% compared to
Farm1.
The P fluxes are also reduced for Farm3 compared to Farm1 and Farm2. The methane fluxes are linked to the
lifetime of pigs for the enteric component, and to the volatile solid excreted (which is a function of the gross en-
ergy intake) for the manure management component. The methane fluxes give less difference between farms
than the other environmental fluxes because the methane fluxes are mainly due to enteric emissions (instead of
emissions linked to the manure) and the lifetime of the pigs is very close between the three systems.
Table 4. Direct environmental fluxes of the pig units
Farm1 Farm2 Farm3
Farrowing
unit
(/sow)
Fattening unit
(/pig)
Farrowing
unit (/sow)
Fattening unit
(/pig)
Farrowing
unit (/sow)
Fattening unit
(/pig)
N excreteda (kg N)
P excreteda (kg P)
VS excreteda (kg VS)
Ammonia (kg NH3)
Nitrous oxide (N2O)
Methane (kg CH4)
Nitrate (kg NO3)
P losses (kg P)
18.4
2.0
118.2
3.6
0.7
2.2
22.6
0.3
13.4
1.5
98.0
2.8
0.5
2.5
17.7
0.3
6.4
1.3
86.2
1.4
0.2
2.0
8.2
0.3
11.5
2.3
100.8
2.5
0.4
2.7
15.3
0.5
5.3
0.7
79.2
1.0
0.2
2.0
6.5
0.3
2.1
0.1
50.3
0.5
0.1
2.5
2.8
0.1 a part of the excretion linked to the digestion of the produced feedstuffs (without natural feed)
3.2. Life cycle assessment
The LCA results per kilogram of live fattening pig and culled sow are given in Table 5.
Farm3 obtains lower impacts for all the indicators (per culled sow and fattening pig). Compared to Farm1, the
result per kilogram of fattening pig are reduced by 64%, 81%, 77%, 62% and 67% for respectively the impacts
of climate change, acidification, eutrophication, energy consumption and land occupation.
Farm2 compared to Farm1 has a reduction of impacts of 25%, 24% and 21% for respectively the impacts of
climate change, acidification and eutrophication. The result is similar for eutrophication and higher for the land
occupation impact.
Table 5. LCA results of the three Corsican farms and comparison with the average conventional system of Eu-
rope described by Dourmad et al. (2012)
Farm1 Farm2 Farm3 Conventional
system of Eu-
rope
/kg culled
sow
/kg fatten-
ing pig
/kg culled
sow
/kg fatten-
ing pig
/kg culled
sow
/kg fatten-
ing pig
/kg fattening
pig
Climate change (kg CO2eq)
Acidification (g SO2eq)
Eutrophication (g PO4eq)
Energy consumption (MJ)
Land occupation (m2year)
6.9
87.0
91.0
35.5
11.35
4.09
51.5
53.8
20.2
6.43
6.1
67.2
98.9
32.1
15.17
3.03
38.7
53.3
15.8
7.83
2.11
17.0
25.4
12.4
3.78
1.47
9.7
12.3
7.7
2.14
2.25
44
19
16.2
4.13
Proceedings of the 9th International Conference on Life Cycle Assessment in the Agri-Food Sector
369
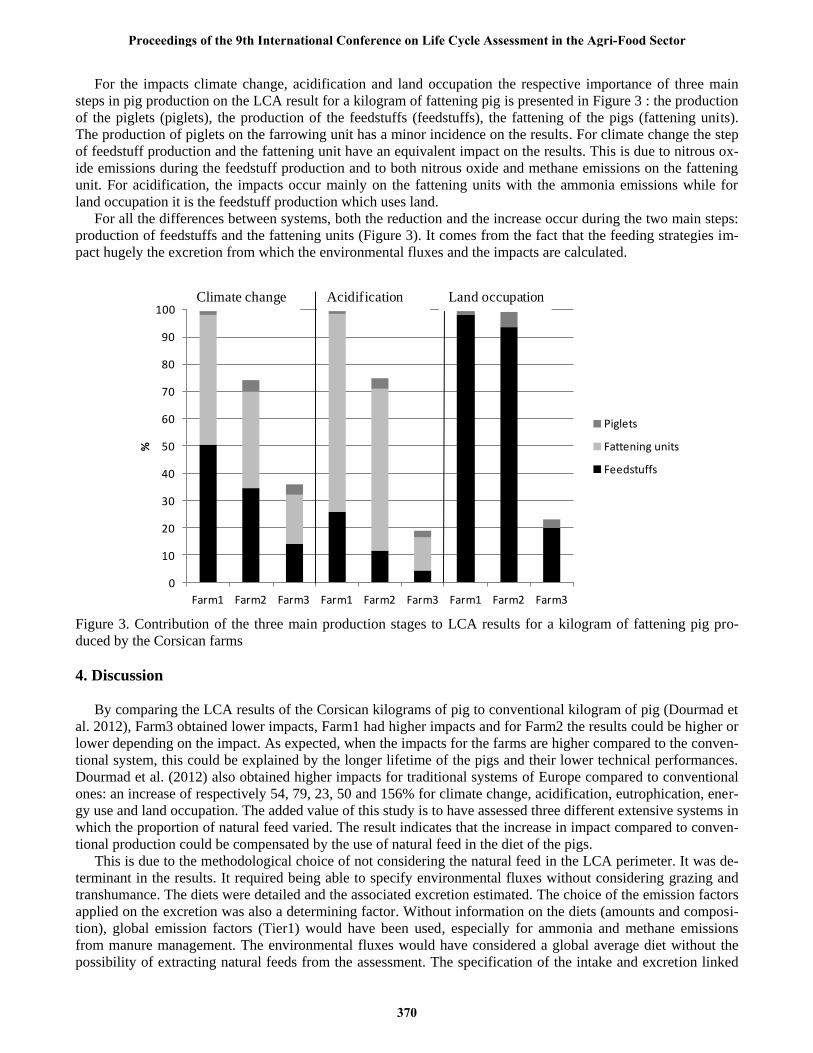
For the impacts climate change, acidification and land occupation the respective importance of three main
steps in pig production on the LCA result for a kilogram of fattening pig is presented in Figure 3 : the production
of the piglets (piglets), the production of the feedstuffs (feedstuffs), the fattening of the pigs (fattening units).
The production of piglets on the farrowing unit has a minor incidence on the results. For climate change the step
of feedstuff production and the fattening unit have an equivalent impact on the results. This is due to nitrous ox-
ide emissions during the feedstuff production and to both nitrous oxide and methane emissions on the fattening
unit. For acidification, the impacts occur mainly on the fattening units with the ammonia emissions while for
land occupation it is the feedstuff production which uses land.
For all the differences between systems, both the reduction and the increase occur during the two main steps:
production of feedstuffs and the fattening units (Figure 3). It comes from the fact that the feeding strategies im-
pact hugely the excretion from which the environmental fluxes and the impacts are calculated.
0
10
20
30
40
50
60
70
80
90
100
Farm1 Farm2 Farm3 Farm1 Farm2 Farm3 Farm1 Farm2 Farm3
%
Piglets
Fattening units
Feedstuffs
Climate change Acidification Land occupation
Figure 3. Contribution of the three main production stages to LCA results for a kilogram of fattening pig pro-
duced by the Corsican farms
4. Discussion
By comparing the LCA results of the Corsican kilograms of pig to conventional kilogram of pig (Dourmad et
al. 2012), Farm3 obtained lower impacts, Farm1 had higher impacts and for Farm2 the results could be higher or
lower depending on the impact. As expected, when the impacts for the farms are higher compared to the conven-
tional system, this could be explained by the longer lifetime of the pigs and their lower technical performances.
Dourmad et al. (2012) also obtained higher impacts for traditional systems of Europe compared to conventional
ones: an increase of respectively 54, 79, 23, 50 and 156% for climate change, acidification, eutrophication, ener-
gy use and land occupation. The added value of this study is to have assessed three different extensive systems in
which the proportion of natural feed varied. The result indicates that the increase in impact compared to conven-
tional production could be compensated by the use of natural feed in the diet of the pigs.
This is due to the methodological choice of not considering the natural feed in the LCA perimeter. It was de-
terminant in the results. It required being able to specify environmental fluxes without considering grazing and
transhumance. The diets were detailed and the associated excretion estimated. The choice of the emission factors
applied on the excretion was also a determining factor. Without information on the diets (amounts and composi-
tion), global emission factors (Tier1) would have been used, especially for ammonia and methane emissions
from manure management. The environmental fluxes would have considered a global average diet without the
possibility of extracting natural feeds from the assessment. The specification of the intake and excretion linked
Proceedings of the 9th International Conference on Life Cycle Assessment in the Agri-Food Sector
370
to manufactured feeds gave the information that made it possible to conclude on the specific impacts of exten-
sive pig systems in Corsica. The more specific the system, the more detailed the information about the LCI
should be, because average references are not valid.
5. Conclusion
This study shows the interest of natural feed in extensive pig systems. By not considering it in the LCA as-
sessment, the environmental impacts of the kilogram of pig at farm gate are reduced and could reach a level be-
low the impacts of conventional production. The results also underline a huge difference among the three sys-
tems studied which could change the conclusions of a comparison with conventional production. The sensitivity
of the results to the diet of these systems is relevant because the importance of natural feed modifies all invento-
ry data such as the amount of feed, the excretion and the associated environmental fluxes. To reach such a con-
clusion made it necessary to detail the diet without the natural feed and the associated excretion.
6. References
Edwards SA (2005) Product quality attributes associated with outdoor pig production. Livestock Production Sci-
ence 94:5-14
Bouter A, Gac A, Tailleur A, Wilfart A, Espagnol S (2012). The French Agricultural LCA Platform. LCA food,
Saint Malo, October 2012, poster session.
CORPEN (2003) Estimation des rejets d’azote, phosphore, potassium, cuivre et zinc des porcs – Influence de la
conduite alimentaire et du mode de logement des animaux sur la nature et la gestion des déjections. COR-
PEN, Paris, France
Dourmad JY, Ryschawy J, Trousson T, Bonneau M, Gonzales J, Houwers HWJ, Hviid M., Zimmer C, Nguyen
TLT, Morgensen L (2012) Evaluation of the environmental sustainability of different Europen pig production
systems using life cycle assessement. LCA food, Saint Malo, October 2012, parallel session 6c: poultry and
pork productions systems.
EMEP/EEA (2009) Air pollutant emission inventory guidebook. Technical report No 9. Ed European Environ-
ment Agency (EEA), Copenhagen, Denmark
Gac A, Salou T, Espagnol S, Ponchant P, Dollé J-B, van der Werf HMG (2014) An original way of handling co-
products with a biophysical approach in LCAs of livestock systems, In: Schenck R, Huizenga D (Eds.),
Proceedings of the 9th International Conference on Life Cycle Assessment in the Agri-Food Sector (LCA
Food 2014), 8-10 October 2014, San Francisco, USA. ACLCA, Vashon, WA, USA, p. 443-449.
IPCC (2006) Guidelines for national greenhouse gas inventories. Vol No 4: Agriculture, forestry and other land
use (AFOLU). Eggleston S, Buendia L, Miwa K, Ngara T, Tanabe K (eds). IGES, Kanagawa, Japan
Nemecek T, Kägi T (2007) Life Cycle Inventories of Swiss and European Agricultural Production Systems - Da-
ta v2.0 (2007). Ecoinvent® report No. 15a. Swiss Center for Life Cycle Inventories, Zurich and Dübendorf,
Switserland
Webb J, Broomfield M, Jones S, Donovan B (2014) Ammonia and odour emissions from UK pig farms and ni-
trogen leaching from outdoor pig production: A review. Science of the Total Environment 470–471: 865–
875.
Proceedings of the 9th International Conference on Life Cycle Assessment in the Agri-Food Sector
371
This paper is from:
Proceedings of the 9th International Conference on
Life Cycle Assessment in the Agri-Food Sector
8-10 October 2014 - San Francisco
Rita Schenck and Douglas Huizenga, Editors
American Center for Life Cycle Assessment
The full proceedings document can be found here:
http://lcacenter.org/lcafood2014/proceedings/LCA_Food_2014_Proceedings.pdf
It should be cited as:
Schenck, R., Huizenga, D. (Eds.), 2014. Proceedings of the 9th International Conference on Life
Cycle Assessment in the Agri-Food Sector (LCA Food 2014), 8-10 October 2014, San Francisco,
USA. ACLCA, Vashon, WA, USA.
Questions and comments can be addressed to: [email protected]
ISBN: 978-0-9882145-7-6