Embed Size (px)
Citation preview
“Uncontrolled Copy When Printed”
Date printed: 9/03/2018
Caroona Feedlot- Environmental Monitoring Report Page 1 of 15
Date of last revision: 7 March 2018
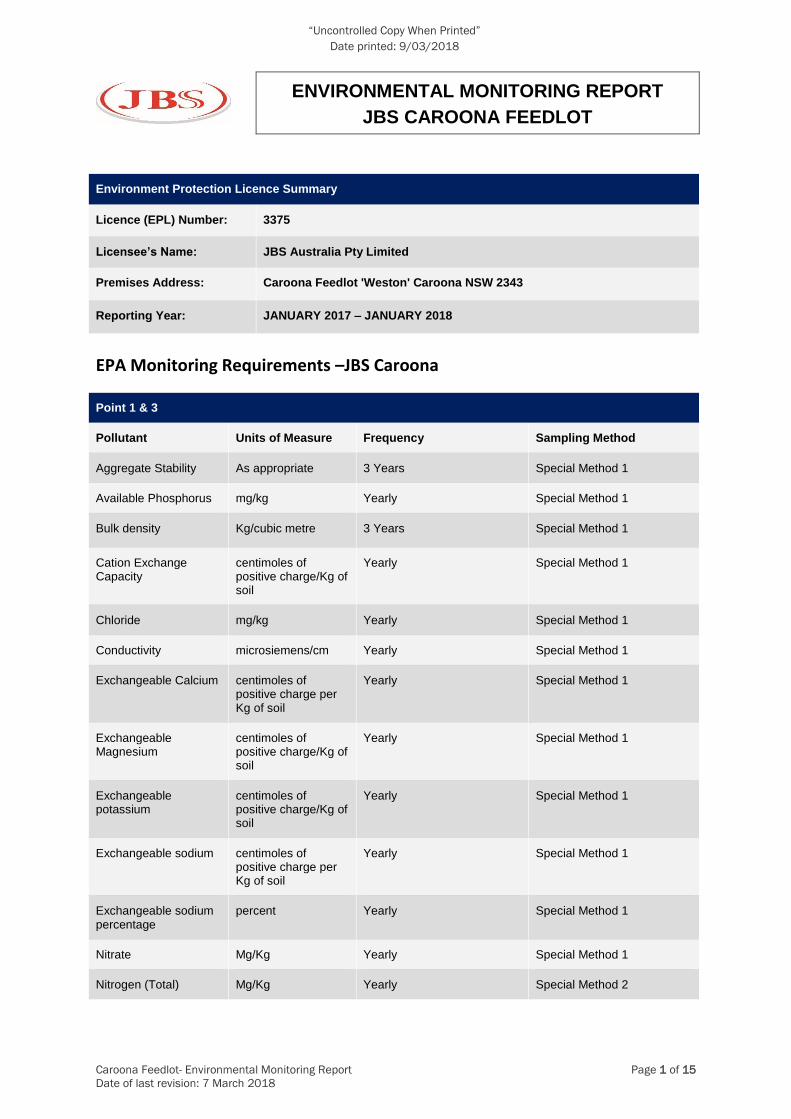
ENVIRONMENTAL MONITORING REPORT
JBS CAROONA FEEDLOT
Environment Protection Licence Summary
Licence (EPL) Number: 3375
Licensee’s Name: JBS Australia Pty Limited
Premises Address: Caroona Feedlot 'Weston' Caroona NSW 2343
Reporting Year: JANUARY 2017 – JANUARY 2018
EPA Monitoring Requirements –JBS Caroona
Point 1 & 3
Pollutant Units of Measure Frequency Sampling Method
Aggregate Stability As appropriate 3 Years Special Method 1
Available Phosphorus mg/kg Yearly Special Method 1
Bulk density Kg/cubic metre 3 Years Special Method 1
Cation Exchange Capacity
centimoles of positive charge/Kg of soil
Yearly Special Method 1
Chloride mg/kg Yearly Special Method 1
Conductivity microsiemens/cm Yearly Special Method 1
Exchangeable Calcium centimoles of positive charge per Kg of soil
Yearly Special Method 1
Exchangeable Magnesium
centimoles of positive charge/Kg of soil
Yearly Special Method 1
Exchangeable potassium
centimoles of positive charge/Kg of soil
Yearly Special Method 1
Exchangeable sodium centimoles of positive charge per Kg of soil
Yearly Special Method 1
Exchangeable sodium percentage
percent Yearly Special Method 1
Nitrate Mg/Kg Yearly Special Method 1
Nitrogen (Total) Mg/Kg Yearly Special Method 2
“Uncontrolled Copy When Printed”
Date printed: 9/03/2018
Caroona Feedlot- Environmental Monitoring Report Page 2 of 15
Date of last revision: 7 March 2018
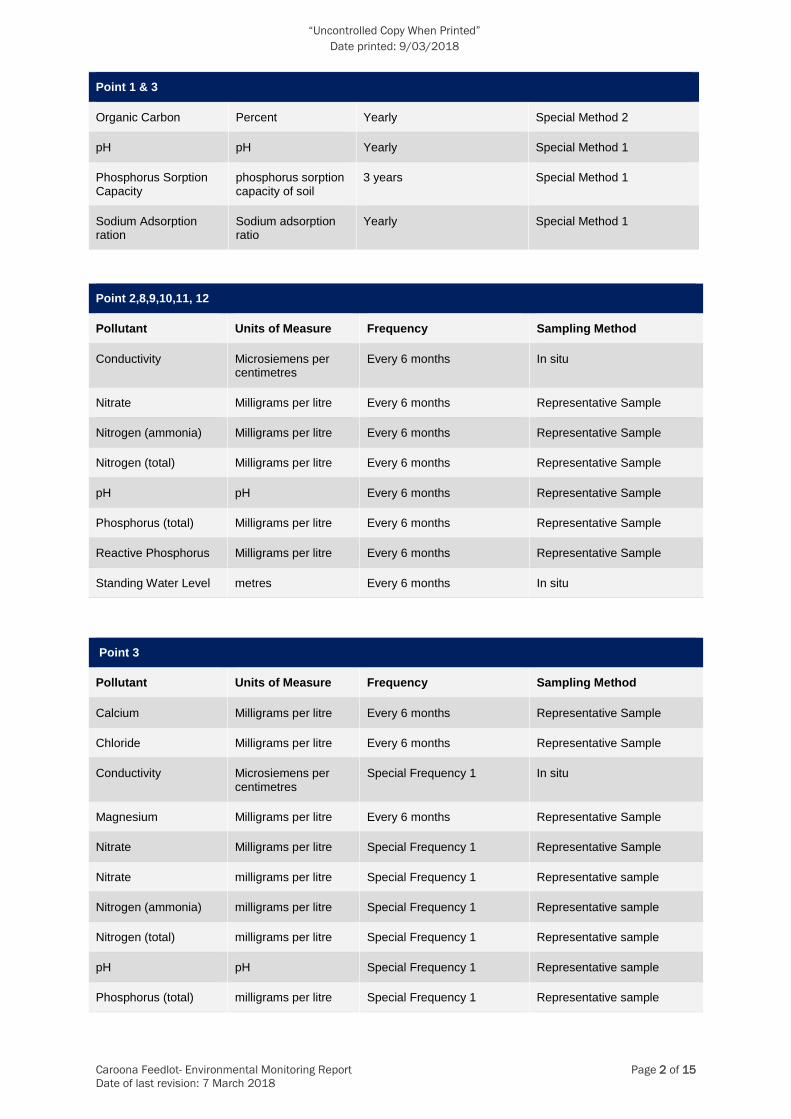
Point 1 & 3
Organic Carbon Percent Yearly Special Method 2
pH pH Yearly Special Method 1
Phosphorus Sorption Capacity
phosphorus sorption capacity of soil
3 years Special Method 1
Sodium Adsorption ration
Sodium adsorption ratio
Yearly Special Method 1
Point 2,8,9,10,11, 12
Pollutant Units of Measure Frequency Sampling Method
Conductivity Microsiemens per centimetres
Every 6 months In situ
Nitrate Milligrams per litre Every 6 months Representative Sample
Nitrogen (ammonia) Milligrams per litre Every 6 months Representative Sample
Nitrogen (total) Milligrams per litre Every 6 months Representative Sample
pH pH Every 6 months Representative Sample
Phosphorus (total) Milligrams per litre Every 6 months Representative Sample
Reactive Phosphorus Milligrams per litre Every 6 months Representative Sample
Standing Water Level metres Every 6 months In situ
Point 3
Pollutant Units of Measure Frequency Sampling Method
Calcium Milligrams per litre Every 6 months Representative Sample
Chloride Milligrams per litre Every 6 months Representative Sample
Conductivity Microsiemens per centimetres
Special Frequency 1 In situ
Magnesium Milligrams per litre Every 6 months Representative Sample
Nitrate Milligrams per litre Special Frequency 1 Representative Sample
Nitrate milligrams per litre Special Frequency 1 Representative sample
Nitrogen (ammonia) milligrams per litre Special Frequency 1 Representative sample
Nitrogen (total) milligrams per litre Special Frequency 1 Representative sample
pH pH Special Frequency 1 Representative sample
Phosphorus (total) milligrams per litre Special Frequency 1 Representative sample
“Uncontrolled Copy When Printed”
Date printed: 9/03/2018
Caroona Feedlot- Environmental Monitoring Report Page 3 of 15
Date of last revision: 7 March 2018
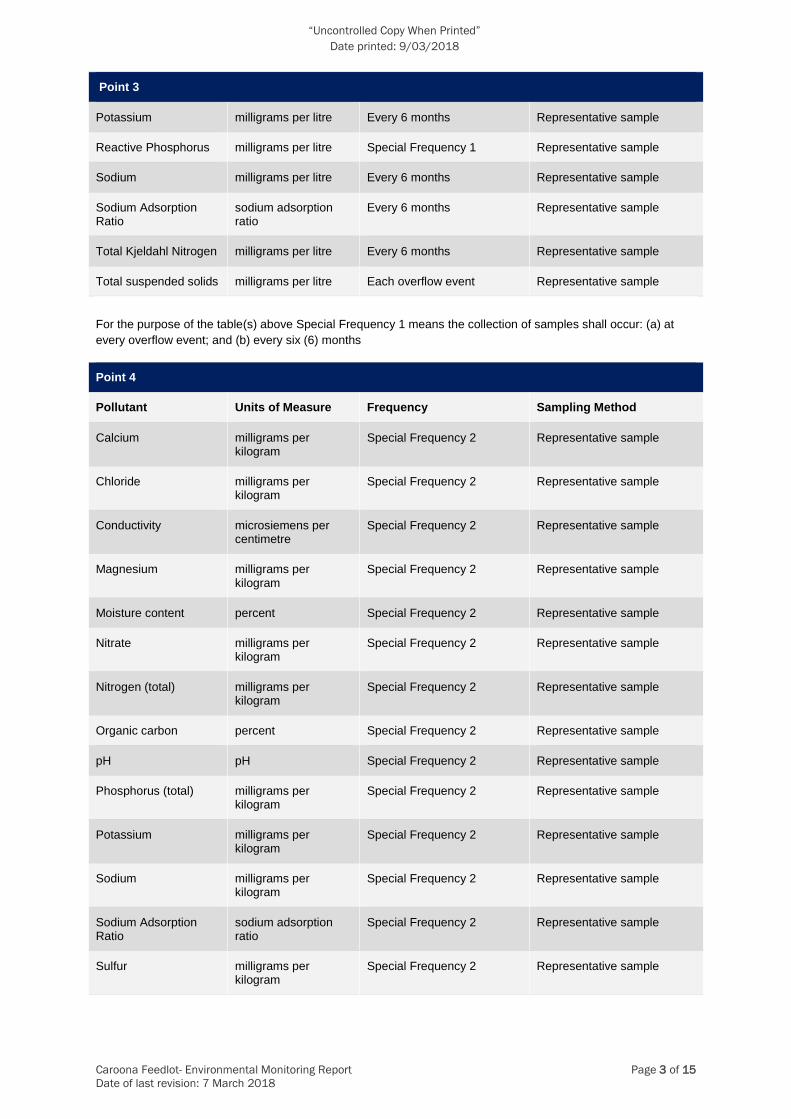
Point 3
Potassium milligrams per litre Every 6 months Representative sample
Reactive Phosphorus milligrams per litre Special Frequency 1 Representative sample
Sodium milligrams per litre Every 6 months Representative sample
Sodium Adsorption Ratio
sodium adsorption ratio
Every 6 months Representative sample
Total Kjeldahl Nitrogen milligrams per litre Every 6 months Representative sample
Total suspended solids milligrams per litre Each overflow event Representative sample
For the purpose of the table(s) above Special Frequency 1 means the collection of samples shall occur: (a) at
every overflow event; and (b) every six (6) months
Point 4
Pollutant Units of Measure Frequency Sampling Method
Calcium milligrams per kilogram
Special Frequency 2 Representative sample
Chloride milligrams per kilogram
Special Frequency 2 Representative sample
Conductivity microsiemens per centimetre
Special Frequency 2 Representative sample
Magnesium milligrams per kilogram
Special Frequency 2 Representative sample
Moisture content percent Special Frequency 2 Representative sample
Nitrate milligrams per kilogram
Special Frequency 2 Representative sample
Nitrogen (total) milligrams per kilogram
Special Frequency 2 Representative sample
Organic carbon percent Special Frequency 2 Representative sample
pH pH Special Frequency 2 Representative sample
Phosphorus (total) milligrams per kilogram
Special Frequency 2 Representative sample
Potassium milligrams per kilogram
Special Frequency 2 Representative sample
Sodium milligrams per kilogram
Special Frequency 2 Representative sample
Sodium Adsorption Ratio
sodium adsorption ratio
Special Frequency 2 Representative sample
Sulfur milligrams per kilogram
Special Frequency 2 Representative sample
“Uncontrolled Copy When Printed”
Date printed: 9/03/2018
Caroona Feedlot- Environmental Monitoring Report Page 4 of 15
Date of last revision: 7 March 2018
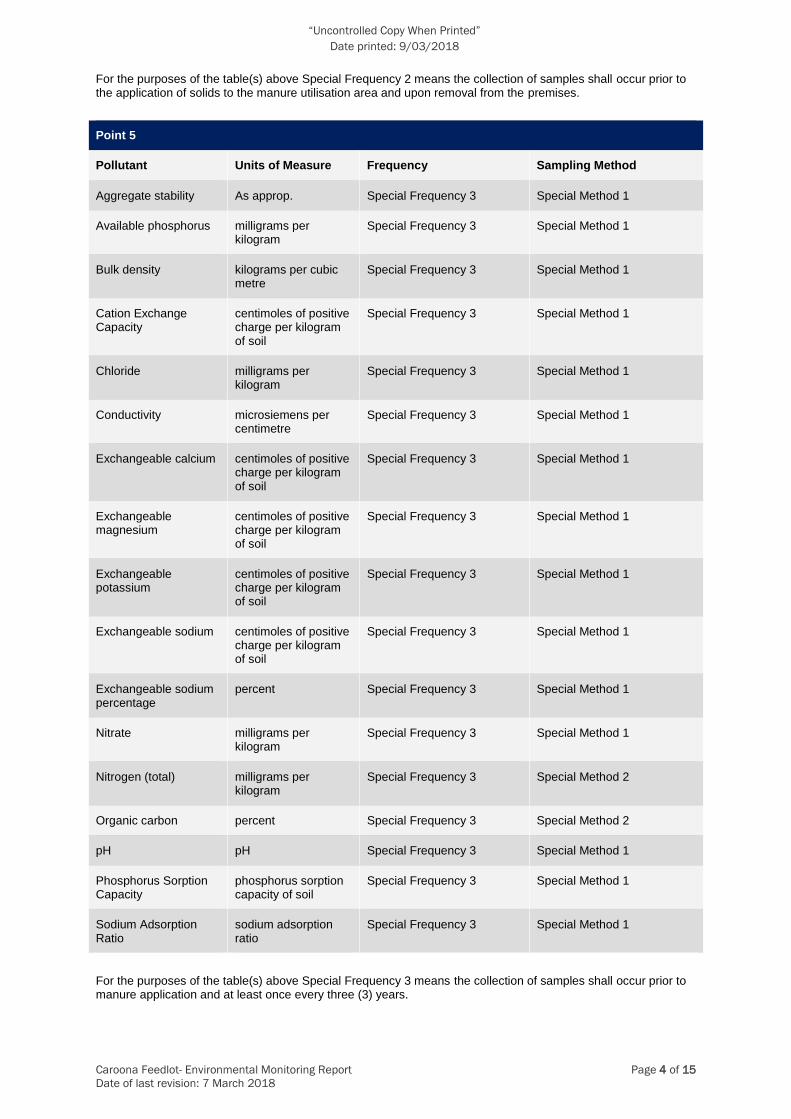
For the purposes of the table(s) above Special Frequency 2 means the collection of samples shall occur prior to the application of solids to the manure utilisation area and upon removal from the premises.
Point 5
Pollutant Units of Measure Frequency Sampling Method
Aggregate stability As approp. Special Frequency 3 Special Method 1
Available phosphorus milligrams per kilogram
Special Frequency 3 Special Method 1
Bulk density kilograms per cubic metre
Special Frequency 3 Special Method 1
Cation Exchange Capacity
centimoles of positive charge per kilogram of soil
Special Frequency 3 Special Method 1
Chloride milligrams per kilogram
Special Frequency 3 Special Method 1
Conductivity microsiemens per centimetre
Special Frequency 3 Special Method 1
Exchangeable calcium centimoles of positive charge per kilogram of soil
Special Frequency 3 Special Method 1
Exchangeable magnesium
centimoles of positive charge per kilogram of soil
Special Frequency 3 Special Method 1
Exchangeable potassium
centimoles of positive charge per kilogram of soil
Special Frequency 3 Special Method 1
Exchangeable sodium centimoles of positive charge per kilogram of soil
Special Frequency 3 Special Method 1
Exchangeable sodium percentage
percent Special Frequency 3 Special Method 1
Nitrate milligrams per kilogram
Special Frequency 3 Special Method 1
Nitrogen (total) milligrams per kilogram
Special Frequency 3 Special Method 2
Organic carbon percent Special Frequency 3 Special Method 2
pH pH Special Frequency 3 Special Method 1
Phosphorus Sorption Capacity
phosphorus sorption capacity of soil
Special Frequency 3 Special Method 1
Sodium Adsorption Ratio
sodium adsorption ratio
Special Frequency 3 Special Method 1
For the purposes of the table(s) above Special Frequency 3 means the collection of samples shall occur prior to manure application and at least once every three (3) years.
“Uncontrolled Copy When Printed”
Date printed: 9/03/2018
Caroona Feedlot- Environmental Monitoring Report Page 5 of 15
Date of last revision: 7 March 2018
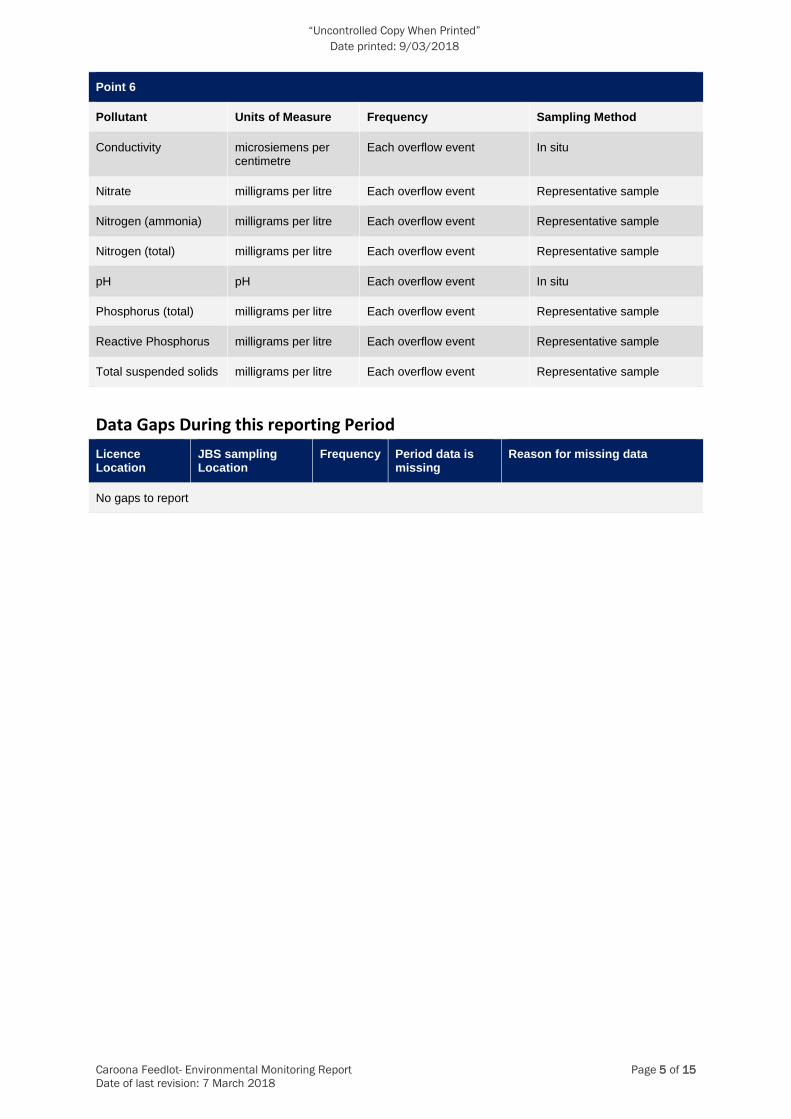
Point 6
Pollutant Units of Measure Frequency Sampling Method
Conductivity microsiemens per centimetre
Each overflow event In situ
Nitrate milligrams per litre Each overflow event Representative sample
Nitrogen (ammonia) milligrams per litre Each overflow event Representative sample
Nitrogen (total) milligrams per litre Each overflow event Representative sample
pH pH Each overflow event In situ
Phosphorus (total) milligrams per litre Each overflow event Representative sample
Reactive Phosphorus milligrams per litre Each overflow event Representative sample
Total suspended solids milligrams per litre Each overflow event Representative sample
Data Gaps During this reporting Period
Licence Location
JBS sampling Location
Frequency Period data is missing
Reason for missing data
No gaps to report
“Uncontrolled Copy When Printed”
Date printed: 9/03/2018
Caroona Feedlot- Environmental Monitoring Report Page 6 of 15
Date of last revision: 7 March 2018
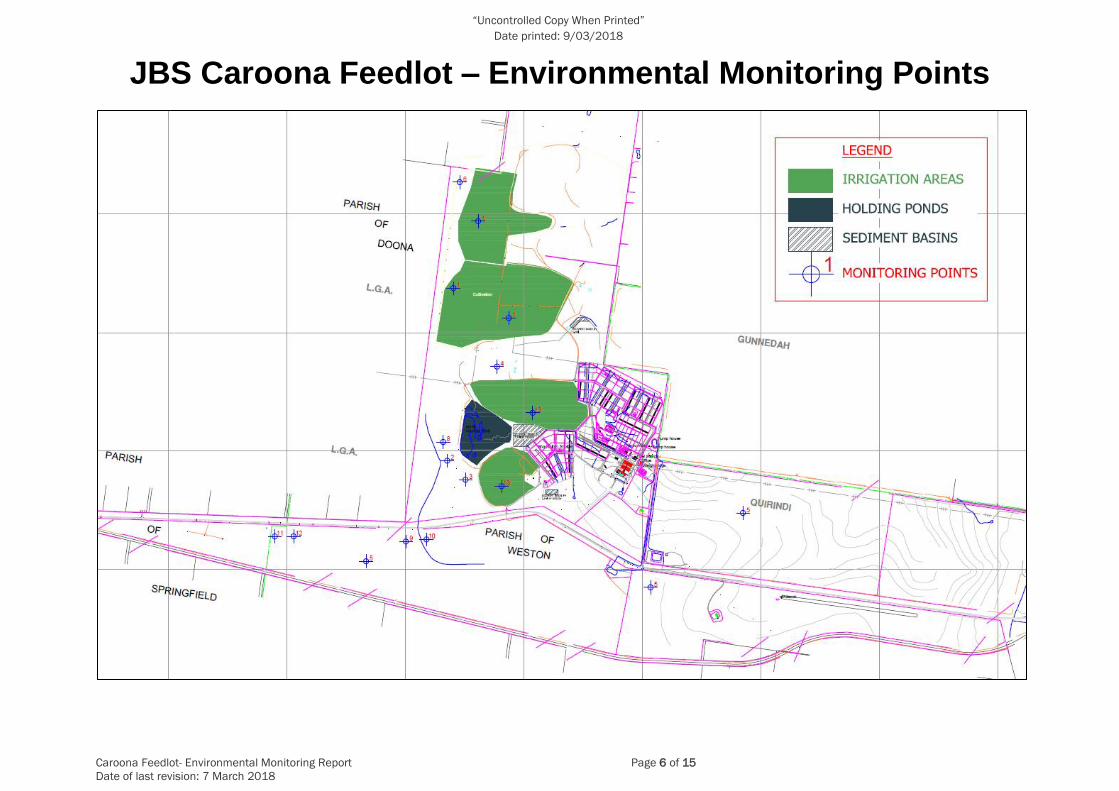
JBS Caroona Feedlot – Environmental Monitoring Points
“Uncontrolled Copy When Printed”
Date printed: 9/03/2018
Caroona Feedlot- Environmental Monitoring Report Page 7 of 15
Date of last revision: 7 March 2018
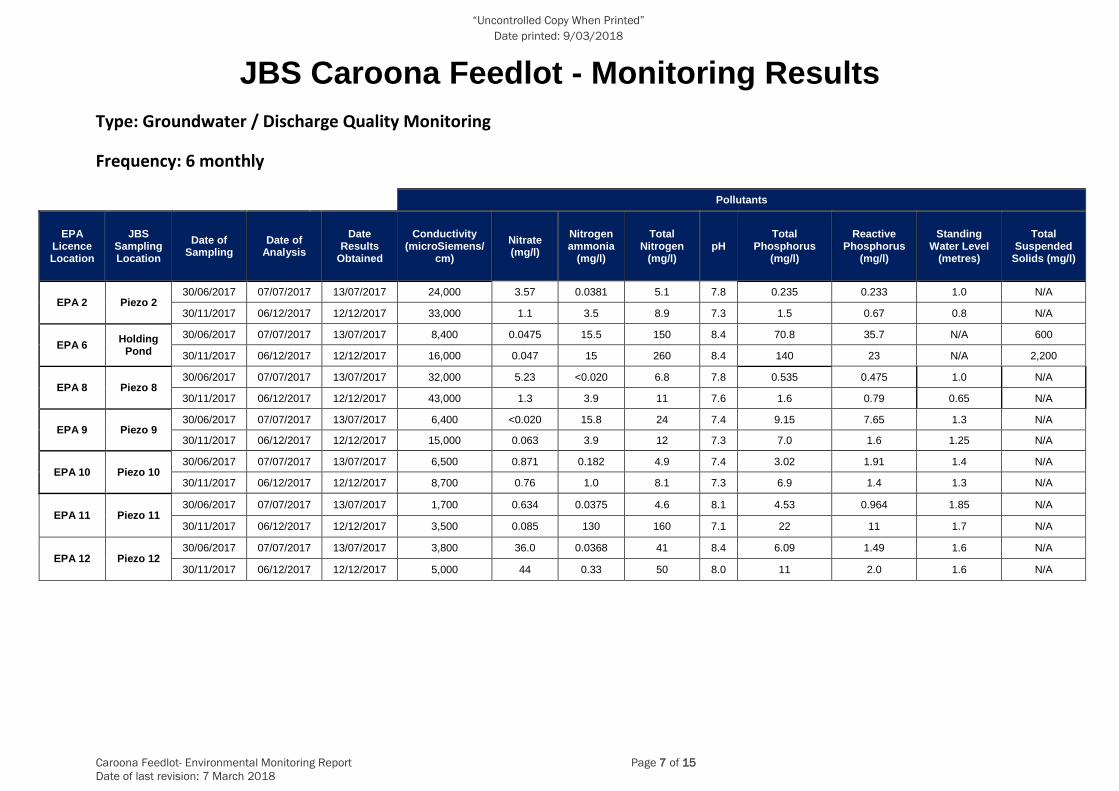
JBS Caroona Feedlot - Monitoring Results
Type: Groundwater / Discharge Quality Monitoring
Frequency: 6 monthly
Pollutants
EPA Licence Location
JBS Sampling Location
Date of Sampling
Date of Analysis
Date Results
Obtained
Conductivity (microSiemens/
cm)
Nitrate (mg/l)
Nitrogen ammonia
(mg/l)
Total Nitrogen
(mg/l) pH
Total Phosphorus
(mg/l)
Reactive Phosphorus
(mg/l)
Standing Water Level
(metres)
Total Suspended
Solids (mg/l)
EPA 2 Piezo 2 30/06/2017 07/07/2017 13/07/2017 24,000 3.57 0.0381 5.1 7.8 0.235 0.233 1.0 N/A
30/11/2017 06/12/2017 12/12/2017 33,000 1.1 3.5 8.9 7.3 1.5 0.67 0.8 N/A
EPA 6 Holding
Pond
30/06/2017 07/07/2017 13/07/2017 8,400 0.0475 15.5 150 8.4 70.8 35.7 N/A 600
30/11/2017 06/12/2017 12/12/2017 16,000 0.047 15 260 8.4 140 23 N/A 2,200
EPA 8 Piezo 8 30/06/2017 07/07/2017 13/07/2017 32,000 5.23 <0.020 6.8 7.8 0.535 0.475 1.0 N/A
30/11/2017 06/12/2017 12/12/2017 43,000 1.3 3.9 11 7.6 1.6 0.79 0.65 N/A
EPA 9 Piezo 9 30/06/2017 07/07/2017 13/07/2017 6,400 <0.020 15.8 24 7.4 9.15 7.65 1.3 N/A
30/11/2017 06/12/2017 12/12/2017 15,000 0.063 3.9 12 7.3 7.0 1.6 1.25 N/A
EPA 10 Piezo 10 30/06/2017 07/07/2017 13/07/2017 6,500 0.871 0.182 4.9 7.4 3.02 1.91 1.4 N/A
30/11/2017 06/12/2017 12/12/2017 8,700 0.76 1.0 8.1 7.3 6.9 1.4 1.3 N/A
EPA 11 Piezo 11 30/06/2017 07/07/2017 13/07/2017 1,700 0.634 0.0375 4.6 8.1 4.53 0.964 1.85 N/A
30/11/2017 06/12/2017 12/12/2017 3,500 0.085 130 160 7.1 22 11 1.7 N/A
EPA 12 Piezo 12 30/06/2017 07/07/2017 13/07/2017 3,800 36.0 0.0368 41 8.4 6.09 1.49 1.6 N/A
30/11/2017 06/12/2017 12/12/2017 5,000 44 0.33 50 8.0 11 2.0 1.6 N/A
“Uncontrolled Copy When Printed”
Date printed: 9/03/2018
Caroona Feedlot- Environmental Monitoring Report Page 8 of 15
Date of last revision: 7 March 2018
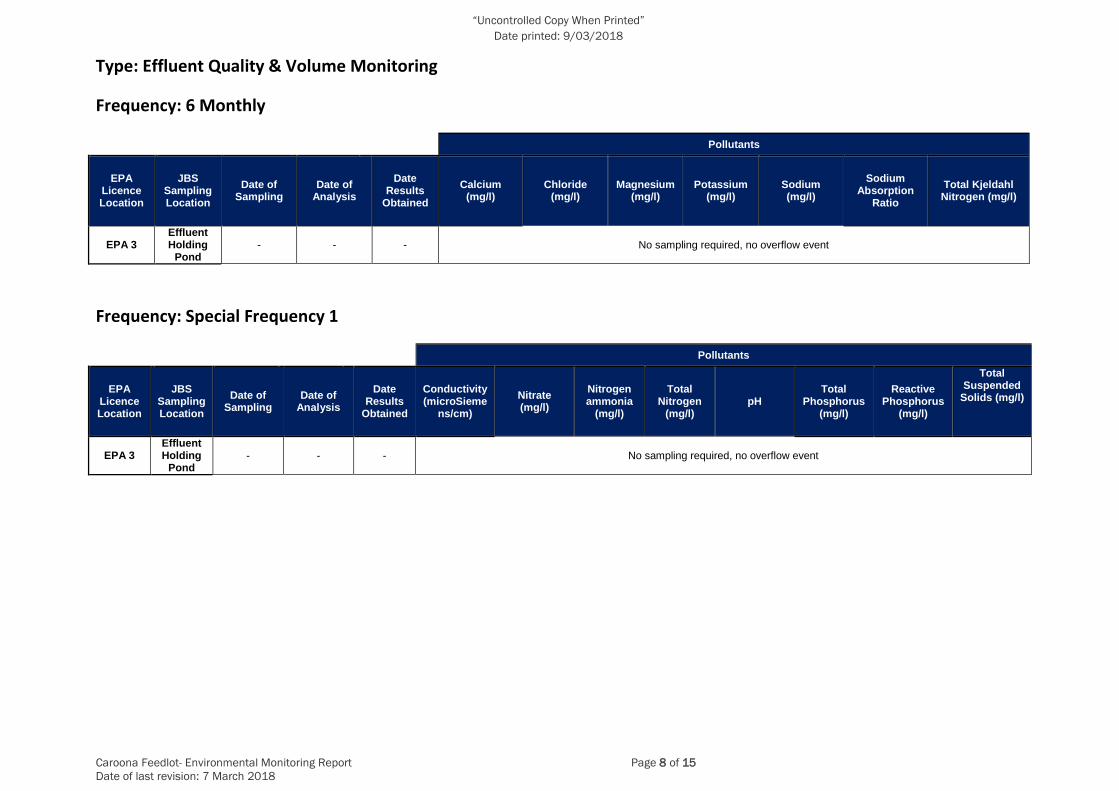
Type: Effluent Quality & Volume Monitoring
Frequency: 6 Monthly
Pollutants
EPA Licence Location
JBS Sampling Location
Date of Sampling
Date of Analysis
Date Results
Obtained
Calcium (mg/l)
Chloride (mg/l)
Magnesium (mg/l)
Potassium (mg/l)
Sodium (mg/l)
Sodium Absorption
Ratio
Total Kjeldahl Nitrogen (mg/l)
EPA 3 Effluent Holding
Pond - - - No sampling required, no overflow event
Frequency: Special Frequency 1
Pollutants
EPA Licence Location
JBS Sampling Location
Date of Sampling
Date of Analysis
Date Results
Obtained
Conductivity (microSieme
ns/cm)
Nitrate (mg/l)
Nitrogen ammonia
(mg/l)
Total Nitrogen
(mg/l) pH
Total Phosphorus
(mg/l)
Reactive Phosphorus
(mg/l)
Total Suspended
Solids (mg/l)
EPA 3 Effluent Holding
Pond - - - No sampling required, no overflow event
“Uncontrolled Copy When Printed”
Date printed: 9/03/2018
Caroona Feedlot- Environmental Monitoring Report Page 9 of 15
Date of last revision: 7 March 2018
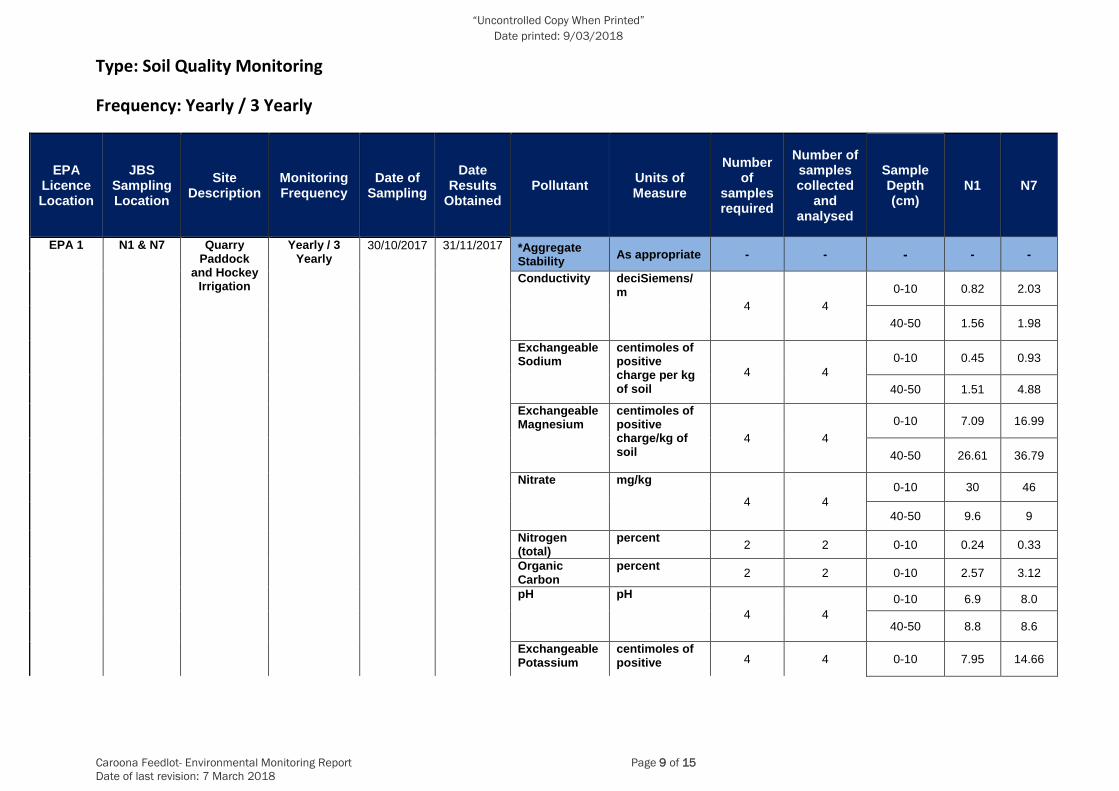
Type: Soil Quality Monitoring
Frequency: Yearly / 3 Yearly
EPA Licence Location
JBS Sampling Location
Site Description
Monitoring Frequency
Date of Sampling
Date Results
Obtained Pollutant
Units of Measure
Number of
samples required
Number of samples collected
and analysed
Sample Depth (cm)
N1 N7
EPA 1 N1 & N7 Quarry Paddock
and Hockey Irrigation
Yearly / 3 Yearly
30/10/2017 31/11/2017 *Aggregate Stability
As appropriate - - - - -
Conductivity deciSiemens/m
4 4
0-10 0.82 2.03
40-50 1.56 1.98
Exchangeable Sodium
centimoles of positive charge per kg of soil
4 4
0-10 0.45 0.93
40-50 1.51 4.88
Exchangeable Magnesium
centimoles of positive charge/kg of soil
4 4
0-10 7.09 16.99
40-50 26.61 36.79
Nitrate mg/kg
4 4
0-10 30 46
40-50 9.6 9
Nitrogen (total)
percent 2 2 0-10 0.24 0.33
Organic Carbon
percent 2 2 0-10 2.57 3.12
pH pH
4 4
0-10 6.9 8.0
40-50 8.8 8.6
Exchangeable Potassium
centimoles of positive 4 4 0-10 7.95 14.66
“Uncontrolled Copy When Printed”
Date printed: 9/03/2018
Caroona Feedlot- Environmental Monitoring Report Page 10 of 15
Date of last revision: 7 March 2018
EPA Licence Location
JBS Sampling Location
Site Description
Monitoring Frequency
Date of Sampling
Date Results
Obtained Pollutant
Units of Measure
Number of
samples required
Number of samples collected
and analysed
Sample Depth (cm)
N1 N7
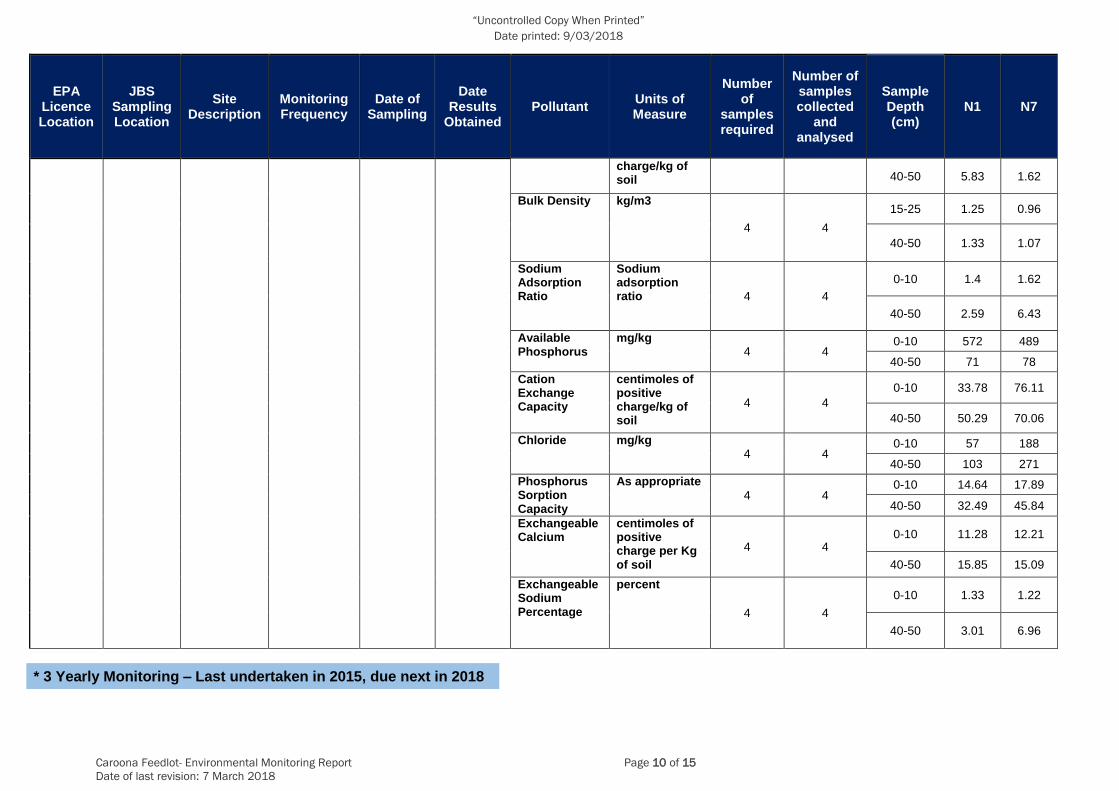
charge/kg of soil 40-50 5.83 1.62
Bulk Density kg/m3
4 4
15-25 1.25 0.96
40-50 1.33 1.07
Sodium Adsorption Ratio
Sodium adsorption ratio 4 4
0-10 1.4 1.62
40-50 2.59 6.43
Available Phosphorus
mg/kg 4 4
0-10 572 489
40-50 71 78
Cation Exchange Capacity
centimoles of positive charge/kg of soil
4 4
0-10 33.78 76.11
40-50 50.29 70.06
Chloride mg/kg 4 4
0-10 57 188
40-50 103 271
Phosphorus Sorption Capacity
As appropriate
4 4 0-10 14.64 17.89
40-50 32.49 45.84
Exchangeable Calcium
centimoles of positive charge per Kg of soil
4 4 0-10 11.28 12.21
40-50 15.85 15.09
Exchangeable Sodium Percentage
percent
4 4
0-10 1.33 1.22
40-50 3.01 6.96
* 3 Yearly Monitoring – Last undertaken in 2015, due next in 2018
“Uncontrolled Copy When Printed”
Date printed: 9/03/2018
Caroona Feedlot- Environmental Monitoring Report Page 11 of 15
Date of last revision: 7 March 2018
EPA Licence Location
JBS Sampling Location
Site Description
Monitoring Frequency
Date of Sampling
Date Results
Obtained Pollutant
Units of Measure
Number of
samples required
Number of samples collected
and analysed
Sample Depth (cm)
N16 C1
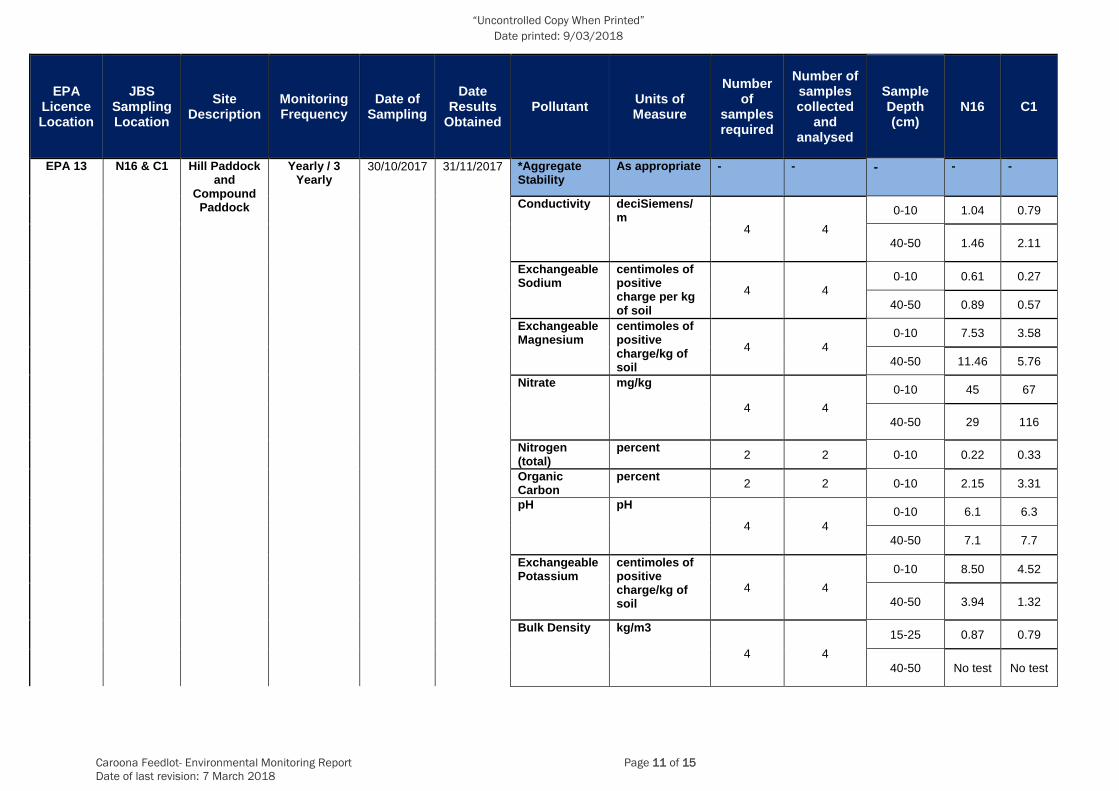
EPA 13 N16 & C1 Hill Paddock and
Compound Paddock
Yearly / 3 Yearly
30/10/2017 31/11/2017 *Aggregate Stability
As appropriate - - - - -
Conductivity deciSiemens/m
4 4
0-10 1.04 0.79
40-50 1.46 2.11
Exchangeable Sodium
centimoles of positive charge per kg of soil
4 4
0-10 0.61 0.27
40-50 0.89 0.57
Exchangeable Magnesium
centimoles of positive charge/kg of soil
4 4
0-10 7.53 3.58
40-50 11.46 5.76
Nitrate mg/kg
4 4
0-10 45 67
40-50 29 116
Nitrogen (total)
percent 2 2 0-10 0.22 0.33
Organic Carbon
percent 2 2 0-10 2.15 3.31
pH pH
4 4
0-10 6.1 6.3
40-50 7.1 7.7
Exchangeable Potassium
centimoles of positive charge/kg of soil
4 4
0-10 8.50 4.52
40-50 3.94 1.32
Bulk Density kg/m3
4 4
15-25 0.87 0.79
40-50 No test No test
“Uncontrolled Copy When Printed”
Date printed: 9/03/2018
Caroona Feedlot- Environmental Monitoring Report Page 12 of 15
Date of last revision: 7 March 2018
EPA Licence Location
JBS Sampling Location
Site Description
Monitoring Frequency
Date of Sampling
Date Results
Obtained Pollutant
Units of Measure
Number of
samples required
Number of samples collected
and analysed
Sample Depth (cm)
N16 C1
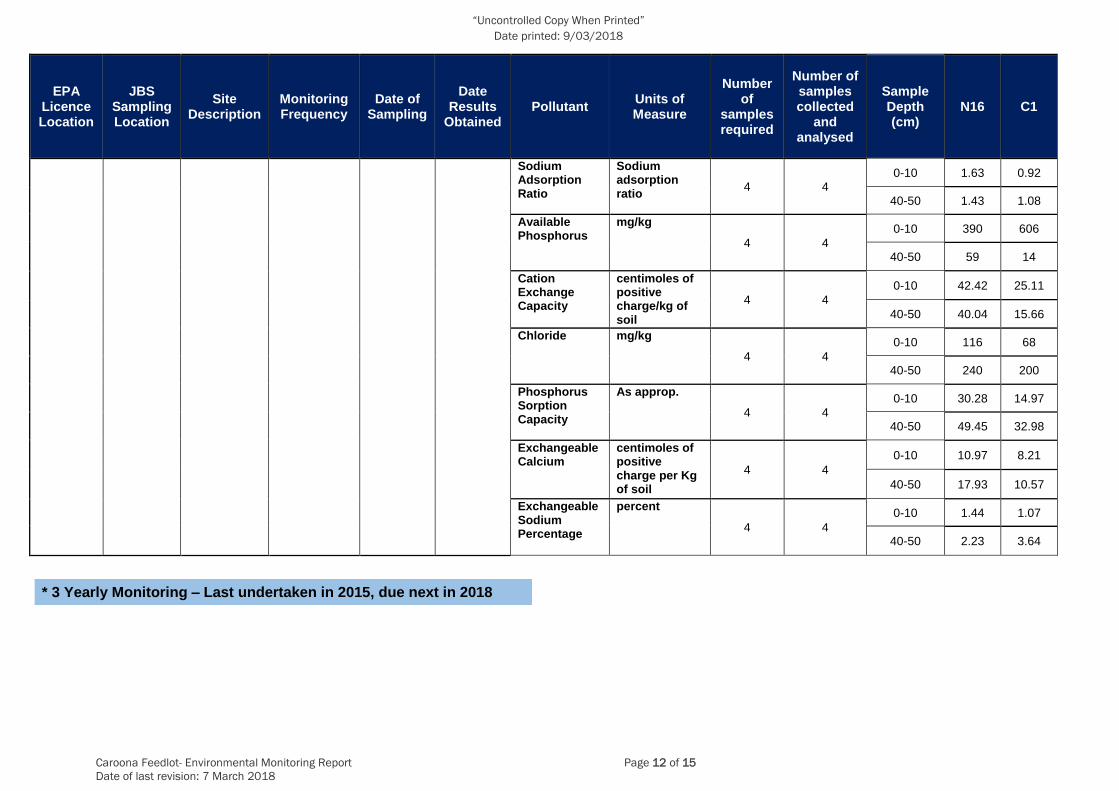
Sodium Adsorption Ratio
Sodium adsorption ratio
4 4 0-10 1.63 0.92
40-50 1.43 1.08
Available Phosphorus
mg/kg
4 4
0-10 390 606
40-50 59 14
Cation Exchange Capacity
centimoles of positive charge/kg of soil
4 4
0-10 42.42 25.11
40-50 40.04 15.66
Chloride mg/kg
4 4
0-10 116 68
40-50 240 200
Phosphorus Sorption Capacity
As approp.
4 4
0-10 30.28 14.97
40-50 49.45 32.98
Exchangeable Calcium
centimoles of positive charge per Kg of soil
4 4
0-10 10.97 8.21
40-50 17.93 10.57
Exchangeable Sodium Percentage
percent
4 4
0-10 1.44 1.07
40-50 2.23 3.64
* 3 Yearly Monitoring – Last undertaken in 2015, due next in 2018
“Uncontrolled Copy When Printed”
Date printed: 9/03/2018
Caroona Feedlot- Environmental Monitoring Report Page 13 of 15
Date of last revision: 7 March 2018
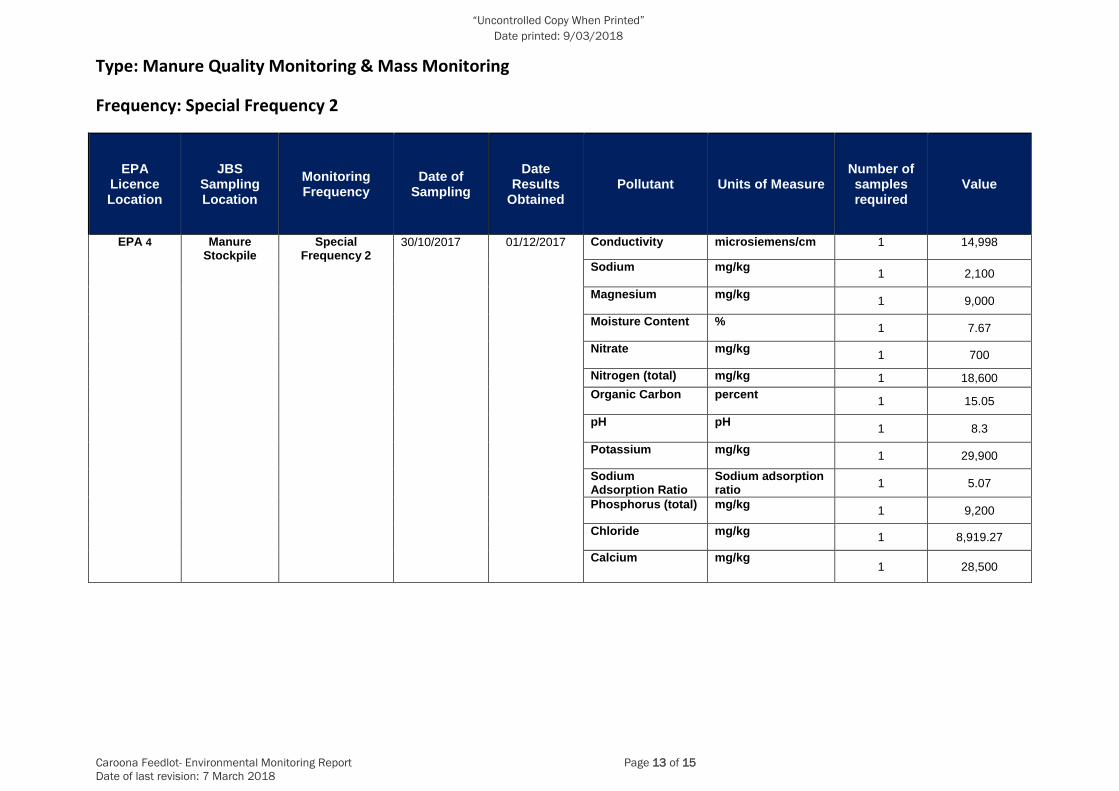
Type: Manure Quality Monitoring & Mass Monitoring
Frequency: Special Frequency 2
EPA Licence Location
JBS Sampling Location
Monitoring Frequency
Date of Sampling
Date Results
Obtained Pollutant Units of Measure
Number of samples required
Value
EPA 4 Manure Stockpile
Special Frequency 2
30/10/2017 01/12/2017 Conductivity microsiemens/cm 1 14,998
Sodium mg/kg 1 2,100
Magnesium mg/kg 1 9,000
Moisture Content % 1 7.67
Nitrate mg/kg 1 700
Nitrogen (total) mg/kg 1 18,600
Organic Carbon percent 1 15.05
pH pH 1 8.3
Potassium mg/kg 1 29,900
Sodium Adsorption Ratio
Sodium adsorption ratio
1 5.07
Phosphorus (total) mg/kg 1 9,200
Chloride mg/kg 1 8,919.27
Calcium mg/kg 1 28,500
“Uncontrolled Copy When Printed”
Date printed: 9/03/2018
Caroona Feedlot- Environmental Monitoring Report Page 14 of 15
Date of last revision: 7 March 2018
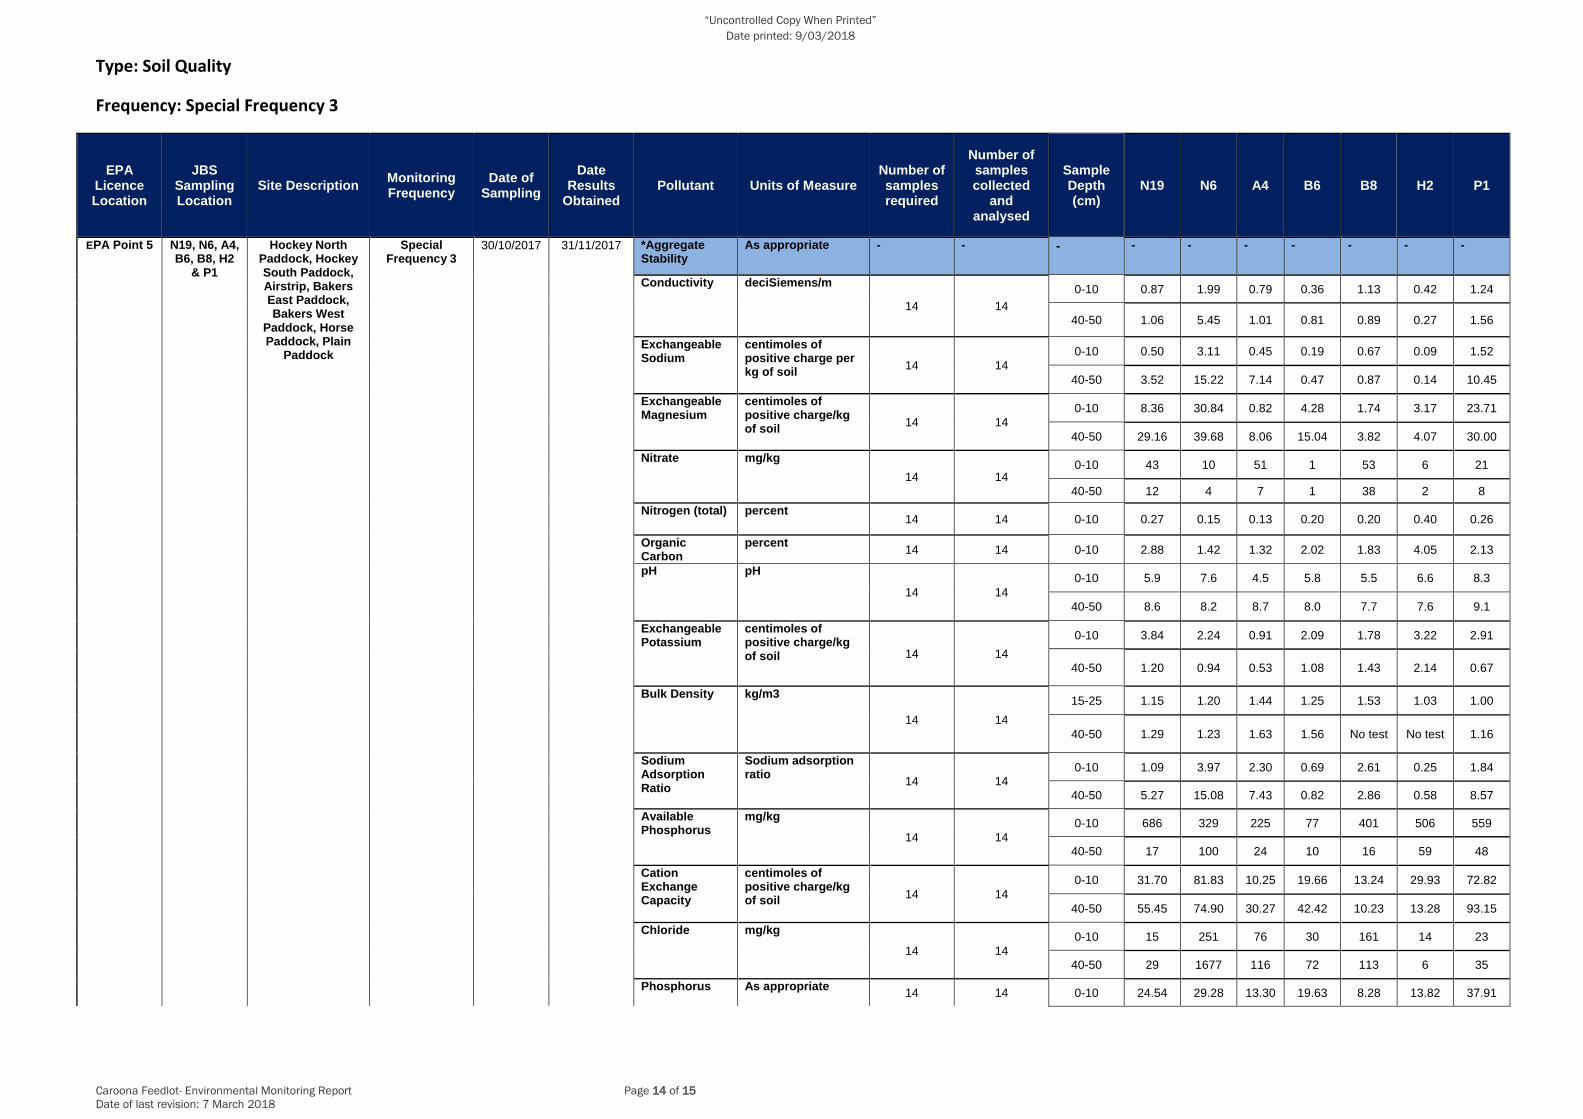
Type: Soil Quality
Frequency: Special Frequency 3
EPA Licence Location
JBS Sampling Location
Site Description Monitoring Frequency
Date of Sampling
Date Results
Obtained Pollutant Units of Measure
Number of samples required
Number of samples collected
and analysed
Sample Depth (cm)
N19 N6 A4 B6 B8 H2 P1
EPA Point 5 N19, N6, A4, B6, B8, H2
& P1
Hockey North Paddock, Hockey South Paddock, Airstrip, Bakers East Paddock, Bakers West
Paddock, Horse Paddock, Plain
Paddock
Special Frequency 3
30/10/2017 31/11/2017 *Aggregate Stability
As appropriate - - - - - - - - - -
Conductivity deciSiemens/m
14 14
0-10 0.87 1.99 0.79 0.36 1.13 0.42 1.24
40-50 1.06 5.45 1.01 0.81 0.89 0.27 1.56
Exchangeable Sodium
centimoles of positive charge per kg of soil
14 14
0-10 0.50 3.11 0.45 0.19 0.67 0.09 1.52
40-50 3.52 15.22 7.14 0.47 0.87 0.14 10.45
Exchangeable Magnesium
centimoles of positive charge/kg of soil
14 14
0-10 8.36 30.84 0.82 4.28 1.74 3.17 23.71
40-50 29.16 39.68 8.06 15.04 3.82 4.07 30.00
Nitrate mg/kg
14 14 0-10 43 10 51 1 53 6 21
40-50 12 4 7 1 38 2 8
Nitrogen (total) percent 14 14 0-10 0.27 0.15 0.13 0.20 0.20 0.40 0.26
Organic Carbon
percent 14 14 0-10 2.88 1.42 1.32 2.02 1.83 4.05 2.13
pH pH
14 14
0-10 5.9 7.6 4.5 5.8 5.5 6.6 8.3
40-50 8.6 8.2 8.7 8.0 7.7 7.6 9.1
Exchangeable Potassium
centimoles of positive charge/kg of soil 14 14
0-10 3.84 2.24 0.91 2.09 1.78 3.22 2.91
40-50 1.20 0.94 0.53 1.08 1.43 2.14 0.67
Bulk Density kg/m3
14 14
15-25 1.15 1.20 1.44 1.25 1.53 1.03 1.00
40-50 1.29 1.23 1.63 1.56 No test No test 1.16
Sodium Adsorption Ratio
Sodium adsorption ratio
14 14 0-10 1.09 3.97 2.30 0.69 2.61 0.25 1.84
40-50 5.27 15.08 7.43 0.82 2.86 0.58 8.57
Available Phosphorus
mg/kg
14 14
0-10 686 329 225 77 401 506 559
40-50 17 100 24 10 16 59 48
Cation Exchange Capacity
centimoles of positive charge/kg of soil
14 14
0-10 31.70 81.83 10.25 19.66 13.24 29.93 72.82
40-50 55.45 74.90 30.27 42.42 10.23 13.28 93.15
Chloride mg/kg
14 14
0-10 15 251 76 30 161 14 23
40-50 29 1677 116 72 113 6 35
Phosphorus As appropriate 14 14 0-10 24.54 29.28 13.30 19.63 8.28 13.82 37.91
“Uncontrolled Copy When Printed”
Date printed: 9/03/2018
Caroona Feedlot- Environmental Monitoring Report Page 15 of 15
Date of last revision: 7 March 2018
EPA Licence Location
JBS Sampling Location
Site Description Monitoring Frequency
Date of Sampling
Date Results
Obtained Pollutant Units of Measure
Number of samples required
Number of samples collected
and analysed
Sample Depth (cm)
N19 N6 A4 B6 B8 H2 P1
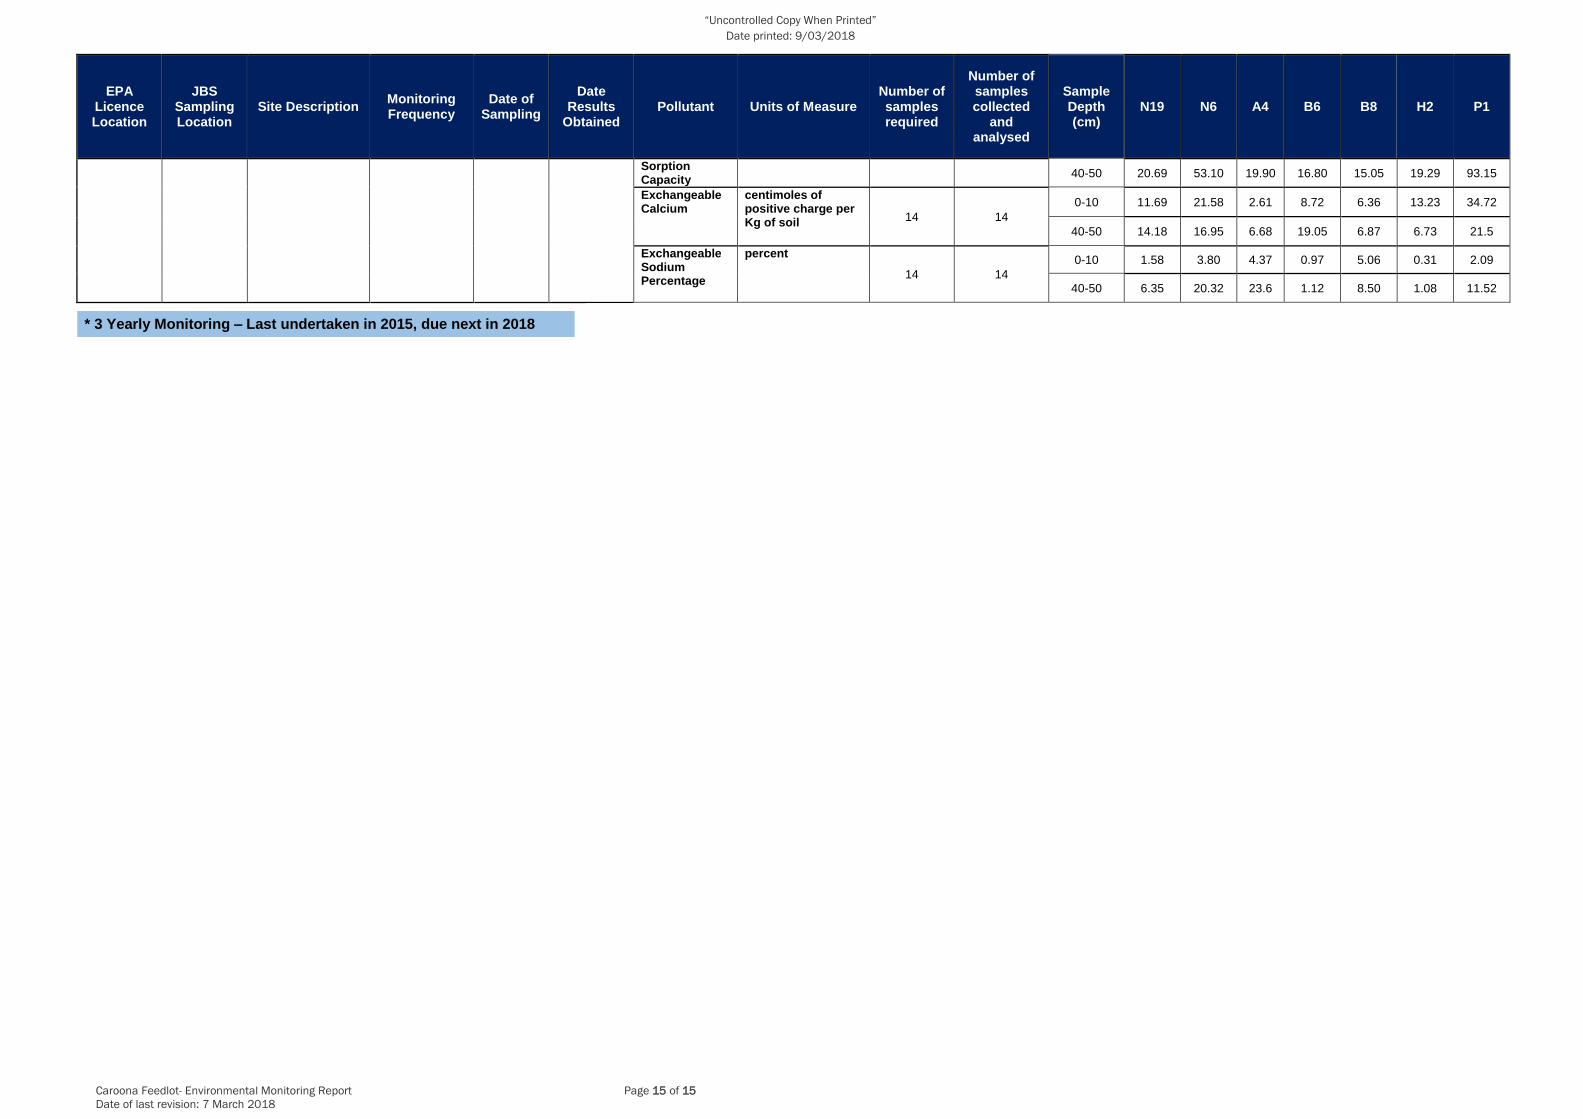
Sorption Capacity
40-50 20.69 53.10 19.90 16.80 15.05 19.29 93.15
Exchangeable Calcium
centimoles of positive charge per Kg of soil 14 14
0-10 11.69 21.58 2.61 8.72 6.36 13.23 34.72
40-50 14.18 16.95 6.68 19.05 6.87 6.73 21.5
Exchangeable Sodium Percentage
percent
14 14
0-10 1.58 3.80 4.37 0.97 5.06 0.31 2.09
40-50 6.35 20.32 23.6 1.12 8.50 1.08 11.52
* 3 Yearly Monitoring – Last undertaken in 2015, due next in 2018