Embed Size (px)
Citation preview
i
ENVIRONMENTAL RISK ASSESSMENT ASSOCIATED WITH UNREGULATED LANDFILLS IN THE ALBERT LUTHULI MUNICIPALITY,
MPUMALANGA PROVINCE, RSA
by
FANNIE MNISI
Submitted in fulfilment of the requirements for the degree of
MASTER OF SCIENCE
in the subject
ENVIRONMENTAL SCIENCES
at the
UNIVERSITY OF SOUTH AFRICA (UNISA)
SUPERVISOR: IT RAMPEDI JOINT SUPERVISOR: M JORDAAN
August, 2008

ii
DECLARATION
STUDENT NO: 3654-791-3 I hereby declare that “Environmental risk assessment associated with unregulated landfills in the Albert Luthuli Municipality, Mpumalanga Province, RSA ” is my own research work and that all sources that I have used have been indicated and acknowledged by means of complete references.
SIGNATURE: Mr F MNISI DATE: SIGNATURE: Mr IT RAMPEDI DATE:

iii
ABSTRACT
Integrated management of municipal and hazardous waste is one of the challenges facing the new municipalities in South Africa, especially those located in previously disadvantaged rural areas. However, much of the research on solid and hazardous waste management in South Africa has examined waste management problematics in urban areas, the majority of which are located within the jurisdiction of local governments which are comparatively effective in terms of providing adequate disposal services. By contrast, this study has examined the environmental risk assessment associated with unregulated landfill sites in the Albert Luthuli municipality, in the Mpumalanga province. The determination of the environmental risk was achieved by the use of questionnaire surveys and landfill analysis forms in selected study areas. The findings have highlighted a very high environmental risk, nearly four times and above, the threshold limits set by the Department of Environmental Affairs and Tourism (DEAT, 2005:15) for all of the landfill sites examined. Several exposure pathways stemming from associated environmental impacts have also been identified for the study. The higher environmental risk determined for the problem sites is ascribed to numerous factors, including their ill-planned location, the sensitivity and vulnerability of the natural environment and adjacent rural settlements, the lack of appropriate waste pre-treatment processes prior to disposal, and most significantly, the lack of regulatory and control measures to contain the myriad of environmental problems generated. In conclusion, it is recommended that several measures (including closure) should be taken in order to reduce and contain the magnitude of environmental risks involved.

iv
ACKNOWLEDGEMENTS
I am indebted to my research supervisors, IT Rampedi and M Jordaan, in the Department of Environmental Sciences at UNISA, for their guidance and constructive criticism throughout the course of the research period. Lynne Meyer, also in the Department of Environmental Sciences at UNISA, is kindly acknowledged for preparing and finalising some of the sketches and figures used in the presentation of this thesis.
I would also like to express my sincere thanks to Mnisi family members, particularly my wife, Mrs G Mnisi, my parents, Mr P Mnisi and Mrs LZ Mnisi, and my brother, TG Mnisi, for their unfailing support, encouragement, and assistance during the course of the study. I further acknowledge the financial support received from Isaiah Dladla and Evelyn N Manamela. Special thanks also go to Wisdom Mnisi and Naledi Mnisi for the contributions they have made regarding the success of the research project. Similarly, members of the Environmental Health Department, at Embhuleni Hospital, HD Manganyi; NOS Ngubane, and MJ Ngoepe, who assisted in the study are gratefully acknowledged. Finally, and most significantly, I acknowledge the providence, grace and peace stemming from the Almighty God, the Father of our Lord Jesus Christ, for keeping me sane and industrious during the duration of the research project and the compilation of the dissertation.

v
TABLE OF CONTENTS Page
CHAPTER 1: RESEARCH BACKGROUND 1.1 INTRODUCTION 1 1.2 RATIONALE AND MOTIVATION FOR THE STUDY 3 1.3 RESEARCH HYPOTHESIS 6 1.4 RESEARCH AIMS AND OBJECTIVES 7 1.5 SCOPE OF THE RESEARCH 7 1.6 RESEARCH METHODOLOGY 8 1.6.1 Population and samples 9 1.6.2 Data collection 9 1.7 LIMITATIONS OF THE STUDY 10 1.8 STRUCTURE AND PRESENTATION OF THE DISSERTATION 10 CHAPTER 2: LITERATURE REVIEW 2.1 GENERAL TRENDS IN WASTE MANAGEMENT 11 2.2 WASTE MANAGEMENT TRENDS IN DEVELOPED COUNTRIES 11 2.3 WASTE MANAGEMENT TRENDS IN SUB-SAHARAN AFRICA 13 2.4 WASTE MANAGEMENT TRENDS IN SOUTH AFRICA 15 2.5 WASTE MANAGEMENT PROBLEMATICS IN THE ALBERT LUTHULI MUNICIPALITY
20 2.5.1 Waste minimisation in the municipal areas 21 2.5.2 Waste treatment by the municipality 22 2.5.3 Management of hazardous waste 22 2.5.4 Municipal solid waste facilities in affected municipal areas 24

vi
2.6 THE SOUTH AFRICAN REGULATORY FRAMEWORK 25 2.7 INTEGRATED WASTE MANAGEMENT 27 2.7.1 Waste avoidance 30 2.7.2 Waste minimisation 31 2.7.3 Waste treatment 33 2.7.4 Waste disposal 33 2.8 CONCLUSION 34
CHAPTER 3: DERMACATION OF THE STUDY AREA
3.1 MPUMALANGA PROVINCE 36 3.2 ALBERT LUTHULI MUNICIPALITY 37 3.2.1 Demographic status 38 3.2.2 Environmental features 40 3.2.3 Water supply 45 3.2.4 State of three landfill sites 45 3.4 CONCLUSION 51 CHAPTER 4: RESEARCH METHODOLOGY 4.1 INTRODUCTION 52 4.1.1 Research method for Objective 1 53 4.1.2 Research method for Objective 2 54 4.1.3 Research method for Objective 3 57 4.1.4 Research method for Objective 4 57 4.2 DATA COLLECTION 58 4.3 DATA ANALYSIS 58 4.4 RISK ASSESSMENT 59 4.4.1 Toxicity assessment 60 4.4.2 Exposure assessment 61

vii
4.4.3 Risk characterisation 62 4.5 CONCLUSION 63 CHAPTER 5: RESEARCH RESULTS AND DISCUSSION 5.1 INTRODUCTION 64 5.2 DEMOGRAPHICS 64 5.3 RISK ASSESSMENT 67 5.3.1 Sources of waste material disposed of in unregulated landfills 67 5.3.2 Classes and types of waste disposed of in the unregulated landfill sites 68 5.3.3 Exposure pathways in and around the landfill sites 71 5.3.4 Assessment and characterisation of the environmental risks associated with unregulated
landfills 74
CHAPTER 6: CONCLUSION AND RECOMMENDATIONS 6.1 CONCLUDING REMARKS 86 6.2 RECOMMENDATIONS 87 6.2.1 Priority 1: Strategic issues 87 6.2.2 Priority 2: Operational issues 88 6.2.3 Priority 3: General issues 90 LIST OF FIGURES, TABLES & PLATES Plate 1.1: Elukwatini landfill site 5 Figure 2.1: Integrated solid waste hierarchy 29 Table 2.1: South Africa’s waste quantities 16 Table 2.2: Regulatory framework 26

viii
Figure 3.1: South African provinces 36 Figure 3.2: Location of the district and local municipalities 38 Figure 3.3: Economic activities for the communities 39 Figure 3.4: Map of the Badplaas Township 46 Figure 3.5 Map of the Carolina Township 48 Figure 3.6: Map of the Elukwatini Township 50 Table 3.1: Annual incomes 40 Plate 3.1: Soil types 42 Plate 3.2: Vegetation types 43 Plate 3.3: Geology map 44 Figure 4.1: Stratified random sampling plan 53 Figure 4.2: Risk assessment model 60 Table 4.1: Industrial groups 55 Table 4.2: Hazardous substance classes 56
Figure 5.1: Profile of the number of participants per study area 65
Figure 5.2: Total proportions of the different sources contributing to the waste stream reaching the unregulated landfill sites 68 Figure 5.3: Types of waste disposed of at the municipal landfills 69 Figure 5.4: Domestic water supply for the communities 74 Figure 5.5: Public perceptions on the probability of the various exposure pathways 82 Figure 5.6: Risk distribution in the landfills of the municipality 84 Table 5.1: Number of respondents per study area 66 Table 5.2: Potability of untreated water samples 75 Table 5.3: Quantitative risk assessment 83 Table 5.4: Risk classification 83 Plate 5.1: Sporadic fires and other waste materials at Elukwatini landfill 78
Plate 5.2: Some of the susceptible reclaimers at Badplaas landfill 79

ix
Plate 5.3: Waste materials dumped at the Carolina landfill 80
LIST OF REFERENCES 91 ANNEXURE A: SITE ANALYSIS FORM 98 ANNEXURE B: RESEARCH QUESTIONNAIRE 100

1
CHAPTER 1
RESEARCH BACKGROUND 1.1 INTRODUCTION
One of the development and environmental challenges facing the new and often poorly-resourced
local municipalities in South Africa relates to solid waste management in previously disadvantaged
rural areas. Solid waste refers to refuse and other discarded materials and semi-solid material
emanating from households, industrial, commercial, as well as agricultural activities (Hill, 2004).
The generation of solid waste is bound to be of concern to all of us due to the unfavourable
environmental consequences such as unpleasant smells, fire potential, contamination and the
possible transfer of pathogens. Solid waste that is not properly managed, therefore, can pose
greater environmental risk, with negative implications for human life and environmental
sustainability (Kum et al., 2005). Unfortunately, most of the research on solid and hazardous waste
management in South Africa has focussed on urban areas that are located within the jurisdiction of
local governments, which are relatively efficient and cost-effective in terms of centralised disposal
services (Van der Merwe & Steyl, 2005; Dalvie & Ehrlich, 2006)
The reasons why urban areas, especially in provinces like Gauteng, the Western Cape, and Kwa-
Zulu Natal, receive more attention in terms of research and resource commitment, stem from the
fact that they have a massive stream of solid and hazardous waste generated by a rapidly growing
number of households, polluting manufacturing industries, as well as commercial activities. There
is also scarcity of land for providing waste disposal services in mostly urban environments
(Kutlaca, 1994).

2
By contrast, too little attention is focused on the rural areas where the waste management system
is fairly typical of the situation in developing countries. This is characterized by highly inefficient
waste collection practices, variable and inadequate levels of service due to limited resources,
indiscriminate and illegal dumping, widespread littering and scavenging, and most of all, poor
environmental and waste awareness of the general public (Matete & Trios, 2007).
Against this backdrop, the waste management framework in South Africa is founded on a range of
legislation, which is intended to manage and prevent environmental pollution, the most relevant
among them being the laws on the disposal and treatment of hazardous substances (Hazardous
Substances Act 1973 (RSA Act No 15, 1973). Other relevant legislations include the Environment
Conservation Act 1989 (RSA Act No. 73, 1989); and the National Environmental Management Act
1998 (RSA Act 107, 1998). Furthermore, the Local Government: Municipal Systems Act 2000
(RSA Act 32, 2000) requires that waste management services be provided to all local communities
in a financially and environmentally responsible manner, in order to promote basic service
accessibility as well as sustainable waste management services.
However, as already intimated, in South Africa there is a dichotomy regarding the implementation
and regulation of waste management systems based on these legal instruments, with urban areas
receiving relatively greater attention than rural areas although nearly 40 per cent of the South
African population still resides in rural areas (Van der Merwe & Steyl, 2005). There is, therefore, a
growing research need to examine waste mismanagement in mostly small countryside towns and
rural settings, where the need for reliable, effective, and sustainable waste management has been
predominantly neglected.

3
This research need augers well with the so-called Millenium Development Goals that are aimed at,
amongst other things, reversing the loss of environmental resources and biodiversity, improving the
proportion of people with access to safe drinking water as well as the reduction of areas with slum
living conditions (United Nations, 2008). Consequently, the current research has examined the
neglected state of solid waste management and associated environmental risks in at least three
unregulated landfill sites in the Albert Luthuli Municipality in the Gert Sibande District, Mpumalanga
Province.
1.2 RATIONALE AND MOTIVATION FOR THE STUDY
According to Mpumalanga Department of Agriculture and Land Administration (Mpumalanga
DACE, 2003), Mpumalanga Province is the largest producer of hazardous waste in South Africa
because of the historical existence of coal-fired power stations and the relatively high number of
petro-chemical factories. In addition, the amount of municipal solid waste generated by various
land-users has been increasing rapidly in recent years given the growth of polluting industries and
the development of informal settlements in the province.
The development of informal settlements in this province, as in other parts of South Africa,
especially since the abolition of influx control measures during the period 1986-1994, has invariably
led to new focal areas of accelerated population growth. Unfortunately, these areas are often
inhabited through informal processes of land invasion, characteristic of certain urban centres in
some of the provinces of South Africa (Krige, 1998). Such processes have resulted in the erection
of shacks in areas without basic infrastructure for the provision of municipal services, including
waste management.

4
The widespread lack of formal collection and management of waste in such areas within under-
resourced municipalities sometimes give rise to outbreaks of diseases such as cholera and typhoid
fever, with horrendous negative impacts on human well-being and environmental sustainability.
The Albert Luthuli Municipality is one of the new local municipalities established in the Gert
Sibande District, which is predominantly rural in terms of the scope of economic activities. This
municipality has to deal effectively with the poor waste management practices prevailing in its area
of jurisdiction. However, this is not always feasible without the design and implementation of a
sound and integrated waste management framework. This shortfall is evidenced by the sporadic
development of unregulated and improperly managed landfill sites in the associated municipal
areas.
Moreover, site inspections during the fieldwork of the current research project have revealed
several signs of environmental neglect at these landfill sites, whose geographical location and
management is poorly planned. In terms of morphology and shape, the landfills are in the form of
freshly dug circular and linear trenches while others occur on open spaces, very close to residential
areas, wetlands, streams and underground water sources. Generally, the solid waste dumped in
these landfills appears to be a mixture of bio-degradable and non-biodegradable forms of waste
from neighbouring households, hospitals and clinics, schools, the informal business sector, formal
commercial enterprises and other industries. More seriously, sporadic fires and associated smoke
have been observed in these landfill sites (see Plate 1.1).

5
Plate1.1 Elukwatini landfill site
Worldwide, landfills are known to release a broad range of harmful pollutants such as leachate,
gases and particle matter with great potential to cause human illness and contamination of the air,
soil and bodies of water (Koshy et al., 2007). Furthermore, other studies have shown that the
location of landfills cannot be a random process and neither can it be driven by sheer socio-
economic imperatives (Lerche & Paleogos, 2001; Slack et al., 2005). The design of modern
landfills is carried out in such a way that they are as self-containing as is technologically feasible,
although it is acknowledged that at some time some leakages may occur (Koshy et al., 2007).
During site inspections in the current research, it was observed that the landfills in the Albert
Luthuli Municipality are not fenced off from the general public, thus allowing for a situation in which
anyone can drop off waste material regardless of its nature and without any precautionary

6
treatment. Moreover, groups of pickers or reclaimers, some with visible signs of skin lesions, roam
the landfill sites in the Albert Luthuli municipal areas, to select and collect recyclable material, as
well as spoiled pieces of food for direct consumption. The degree of environmental risk posed by
these landfill sites is drastically increased if the quantities of waste generated from various sources
and their likely environmental impacts are not known. Without a proper scientific knowledge of what
is going on in these landfill sites and adjacent settlements, the prospect of successfully
implementing an effective waste management strategy in the rural areas of Mpumalanga Province,
remains bleak.
1.3 RESEARCH HYPOTHESIS
The research hypothesis is as follows:
The uncontrolled and illegal dumping of various forms of waste materials at the unregulated landfill sites in the Albert Luthuli municipality has potential to pose greater environmental risk to neighbouring land-users and the natural environment.
Environmental risk assessment attempts to characterize the potential negative impacts of human
exposure to environmental hazards (Sykes et al., 2007). Risk assessment involves a process of
identifying the number and characteristics of current environmental hazards, establishing the
probability and magnitude of the likely environmental harm, and determining what should be done
to reduce or eliminate the risk (Environment Agency, 2005).

7
1.4 RESEARCH AIMS AND OBJECTIVES
The primary aim of the current research was to assess the environmental risks associated with three unregulated landfill sites under the jurisdiction of the Albert Luthuli Municipality. This research aim was addressed by means of the following objectives, namely to:
1) Identify the different sources of waste materials entering unregulated landfill sites of the Municipality;
2) Classify and evaluate the type of waste disposed at the landfill sites;
3) Identify different exposure pathways of environmental hazards;
4) Characterize and quantify the magnitude of environmental risks associated with the identified hazards;
5) Suggest possible mitigations measures to implement a sustainable and integrated waste management strategy for the municipality.
1.5 SCOPE OF THE RESEARCH
Although this study was conducted in the Mpumalanga Province, the research only focused on the
Albert Luthuli Municipality in the Gert Sibande District. The three unregulated landfill sites, as well
as the contributing land-uses, constituted the study area for the research. The local municipality
has already expressed the intension to close some of the problem landfill sites such as Ekulindeni
and eMpuluzi, while those in Badplaas, Carolina and Elukwatini are earmarked for licensing should
they comply with regulatory standards. The latter three landfill sites were selected for a detailed
study in order to investigate their base-line status and associated environmental risks.

8
1.6 RESEARCH METHODOLOGY
In order to achieve the objectives of the research, various sources and generators of solid waste
and the three unregulated landfill sites in the Albert Luthuli Municipality were selected for an in-
depth study. Both qualitative and a quantitative study designs were adopted for the research. This
research design replicates procedures followed in other studies of solid waste management and
associated landfill sites. For example, in a study of households’ perspectives of the effectiveness of
the private sector in the management of solid waste in Dar es Salaam, this approach involved the
use of questionnaire surveys (Kassim & Ali, 2005).
Questionnaires were used to study different perspectives of households and private solid waste
collectors involved in the solid waste management problem. Their sample was drawn from nearly
300 households, about 100 people from each municipality. In addition, various criteria served to
select the locations in order to conduct the survey (Kassim & Ali, 2005). Aspects such as the
following were included in the surveys: collection methods, awareness of the problem of solid
waste, and the effectiveness of the services rendered. Furthermore, questionnaire interviews were
conducted with stakeholders in the private sector who had formal contracts with the Dar es Salaam
local municipality.
Another important aspect of the approaches followed was observations relating to the various
aspects of the solid waste management problem in the study area. Subsequently, these
approaches were adapted for the study of solid and hazardous waste mismanagement in the Albert

9
Luthuli Municipality, with some modifications in that other target groups such as hospitals, hotels,
abattoirs were also surveyed in order to gauge not only their perspectives but also the type of
waste they generate. Furthermore, the three landfill sites were assessed by means of site analysis
forms.
1.6.1 Population and samples
The entire study included two major sources from whom and where data would be collected. The
first data source was comprised of the general public (n=375) who consisted of the directly affected
residents located within a radius of about 5 km from the landfill sites, commercial institutions and
health care institutions within the area wherein refuse collection services are rendered by the
municipality. Representative samples were drawn by means of a stratified random sampling
technique and comprised of at least 20 % of the entire population. The second population group
consisted of the three selected landfill sites (n=3) in Badplaas, Carolina and Elukwatini.
1.6.2 Data collection
Questionnaires were applied to collect data from possible waste generators. This data was
analysed by means of descriptive statistics. Site analysis forms were used to collect data from the
three selected landfill sites. Secondary data was also used in the study and it was based on water
quality, air pollution and health-related problems reported for the study areas. Accordingly, the risk
assessment was broken down into three components, namely toxicity assessment, exposure
assessment and risk characterization. These components were used to calculate quantitatively the
risk related to each landfill site. Thereafter, the risk values obtained were used to compute risk
levels using a grading system of risk analysis (DEAT, 2005:15)

10
1.7 LIMITATIONS OF THE STUDY
The study was confined to Albert Luthuli municipal boundaries and to the exclusion of areas
beyond this. Furthermore, the study did not involve laboratory analysis of samples except where
secondary data was available.
1.8 STRUCTURE AND PRESENTATION OF THE DISSERTATION
The chapters of the thesis to follow are:
Chapter 2: Literature review Chapter 3: Demarcation of the study area Chapter 4: Research methodology Chapter 5: Research results and discussion Chapter 6: Conclusion and recommendations

11
CHAPTER 2 LITERATURE REVIEW 2.1 GENERAL TRENDS IN WASTE MANAGEMENT
Solid and hazardous waste cannot be managed efficiently and effectively, unless its origin or
sources, composition, quantities, processes and the associated environmental risks are thoroughly
understood (Kum et al., 2005). The improper management of waste materials is a global
environmental challenge arising from unrestrained human activities. This challenge affects various
communities and environmental quality in developed as well as developing countries. However, the
challenges faced by the developed countries are not necessarily the same as those experienced in
the developing countries. The differences between these countries are mainly attributed to
discrepancies in their socio-economic status, levels of industrialisation, urbanisation and levels of
education (Kassim & Ali, 2005).
2.2 WASTE MANAGEMENT TRENDS IN DEVELOPED COUNTRIES
The inappropriate management of solid and hazardous waste does not only affect developing
countries such as those located on the African continent. For instance, nearly 500 years ago,
European cities were spawned with outbreaks of cholera, typhoid and plague epidemics resulting
from widespread accumulation of waste along roadsides (Yong-Chung et al., 2005). Moreover,
some of the developed countries find it difficult to establish new landfill sites due to land scarcity
and large-scale opposition from the general public because of the negative perceptions associated
with landfill sites and other waste disposal sites (EI-Fadel et al., 1995).

12
However, most developed countries such as the United States of America (USA) still dispose about
95 per cent of their solid waste by means of landfills, while approximately 80 per cent of the waste
is hazardous (EI-Fadel et al., 1995). In the USA, landfill sites continue to be the most convenient
and cost effective method for waste disposal despite the history of environmental disasters that
have negatively affected some of the populations living there (Yong-Chung et al., 2005 & El-Fadel
et al., 1995). Inevitably, some of the developed countries, like Japan and Canada, are gradually
shifting their waste disposal practices from establishing landfills towards incineration.
In general, incinerators are used for the treatment of hazardous waste substances, mainly toxic
industrial and healthcare waste. Although, incineration has become a popular means of waste
disposal, especially in countries where land is scarce, it is also accompanied by the release of high
levels of carbon monoxide, hydrogen chlorine, metallic (e.g. lead, arsenic, cadmium & mercury)
and particulate matters into the natural and human environment. These by-products result mainly
from incomplete combustion in incinerators. The emission, movement, and circulation of these
pollutants in the biosphere often produce negative environmental and health impacts. Furthermore,
the release of greenhouse gases from incinerators is currently contributing to climate change in the
form of global warming, which has adverse effects for human settlements and environmental
quality. More seriously, such pollutants have been negatively implicated in a variety of acute,
chronic and/or sub-chronic illnesses because they have the properties of carcinogens, teratogens
as well as mutagens (Yong-Chung et al., 2005).
13
Beyond the use of landfills and incinerators, the global trend in waste management is towards
sustainable waste management with an emphasis on recycling, reusing, reduction, and prevention
of waste materials. However, only a few developed countries have witnessed considerable
progress in this practice. For instance, Denmark is reputed to be the first country in the world to
launch a comprehensive waste taxation scheme in their waste management policy in order to
inculcate the reusing and recycling of waste as early as the mid-1980s (Middleton, 2004). This
trend is also apparent in countries such as Switzerland and Germany, whereby there are
successful initiatives to recycle bottle containers. In fact, the average recovery rate for the recycling
of glass containers has increased from 22 per cent in 1980 to 32 per cent in the late 1980s, for
most of the OECD countries. In addition, many countries worldwide are now attempting to reach
waste prevention in their different manufacturing industries through an emphasis on cleaner
production. This is achieved through processes that are summarised by Middleton (2004:248) as:
o Conservation of energy and raw materials
o Reduction in the use of toxic or environmentally harmful substances
o Reduction of the quantity and toxicity of wastes and pollutant discharges
o Extension of product durability
2.3 WASTE MANAGEMENT TRENDS IN SUB-SAHARAN AFRICA
In the sub-Saharan African region, the rate of solid waste generation exceeds the management
capacities of municipalities. However, only 35 per cent of the population lives in urban areas where
refuse removal services are rendered.

14
Currently, thousands of tons of solid waste are generated daily in the region and the highest
amount of the waste produced ends up in open spaces and neglected street corners. The rate at
which solid waste is generated in developing countries ranges between 0.5 to 0.8 kilograms per
person per day, as compared to 1 to 2 kilograms per person per day generated in the developed
countries.
Generally, high waste generation is commonly associated with the throwaway culture associated
with rapid urbanization, accelerated economic and population growth (Middleton, 2004; Yong-
Chung et al., 2005). Unfortunately, the general waste streams frequently contain hazardous waste
materials, often emanating from local industries, health care facilities, commercial and residential
institutions. As a result, toxic and infectious materials are discarded along with general waste
throughout the region. The presence of hazardous waste materials in the general waste streams is
a critical issue that complicates the management of solid waste, especially with regard to land
filling. In the rural and poor communities of the African continent, uncollected solid wastes
accumulate illegally along roadsides whilst another fraction is burnt within household yards. This
trend has the potential to reduce environmental quality in neighborhoods and can also pose a
threat to public health and the environment.
At present, only a small amount of solid waste is disposed of safely in sanitary landfills, while most
of the waste is deposited in open dumps, semi-controlled and unlined landfills which do not have
access control, groundwater protection measures, leachate management and/or gas collection.
More disturbingly, most of the waste dumps are located in ecologically sensitive areas whereby
toxins may find their way into groundwater resources.

15
Consequently, if the existing solid waste practices in the region do not improve, the following
associated environmental and health risks may be experienced continuously (Jung et al., 2005):
• Foul smells,
• Dust emissions,
• Environmental nuisances,
• Pollution of ground and surface water,
• Attraction of vermin, vectors and/or pests,
• Chemical instability on affected sites,
• Emission of landfill gases (methane gases) and other green house gases,
• Severe health risks to human beings and animals.
2.4 WASTE MANAGEMENT TRENDS IN SOUTH AFRICA
South Africa is one of the countries experiencing faster economical growth rates in the SADCC
region. Unfortunately, economic growth is always accompanied by the generation of large
quantities of solid waste. As a result, it is estimated that an amount of 42 230 000 cubic meters of
solid waste is generated per annum in South Africa (Table 2.1). However, from the total solid waste
quantities generated per annum in the country, about 3 831 000 cubic meters of the waste is
produced in Mpumalanga Province (Mpumalanga DACE, 2003).

16
Table 2.1: South Africa’s waste quantities
General waste Hazardous waste Province
m3/annum % m3/annum %
Mpumalanga 3 831 000 9.1 3 039 873 31.8 Eastern Cape 2 281 000 5.4 52 088 0.5 Free State 1 675 000 4.0 30 530 0.3 Gauteng 17 899 000 42.4 2 829 643 29.6 KwaZulu-Natal 4 174 000 9.9 1 702 934 17.8 North West 1 625 000 3.8 1 618 383 16.9 Northern Cape 733 000 1.7 1 149 0.0 Limpopo 1 470 000 3.5 5 814 0.1 Western Cape 8 543 000 20.2 283 887 3.0
TOTAL 42 231 000 100% 9 564 301 100%
Adopted from Mpumalanga DACE (2003: 53)
The country also disposes about 99 per cent of its solid waste through landfill methods. In this
instance, different ways of waste disposal by land are used, the most common being trenches,
open dumps, unprotected landfill and sanitary landfill methods. Indiscriminate dumping of waste in
neglected open spaces also occurs in small, resource-poor rural municipalities (Mahlangu, 2007).
Even so, sometimes the municipalities themselves are responsible for the indiscriminate dumping
of waste. Presently, South Africa has about 1 200 landfill sites of which 86 per cent are operated by
municipalities, while 14 per cent are privately owned (McLean et al., 2003). However, about 88 per
cent of the landfill sites are not legally permitted to exist and are, therefore, not operated according
to statutory requirements (DWAF, 1998b; McLean et al., 2003; Mahlangu, 2007).

17
Based on the quantities of solid waste generated for general and hazardous waste in South Africa,
as well as the existing status of landfill sites, there is no doubt that the overall management of solid
waste in the country has not reached satisfactory standards (DEAT, 1999). Thus, South Africa is
faced with a serious challenge of delivering efficient and effective solid waste services to needy
communities, in both urban and rural areas. Due to this challenge, large quantities of solid waste
are dumped on open spaces as well as along street corners within settlements, than at landfills.
This trend is especially true for vulnerable rural and urban settlements, who often bear the brunt of
the negative impacts associated with improper and unsafe disposal of toxic waste (DEAT, 1999).
In the current South African government, the primary responsibility of solid waste management lies
with the local government sphere or municipalities. However, the management of hazardous waste
remains a competency of the provincial government (DWAF, 1998b). However, an estimated
amount of 9 564 301 cubic meters of hazardous waste materials are presently generated in South
Africa per annum. From the total quantities of hazardous waste generated in the country, 3039873
cubic meters of this waste is generated from Mpumalanga Province (Mpumalanga DACE, 2003).
This shows that the Mpumalanga Province is the highest producer of hazardous waste material in
South Africa.
Furthermore, of the 3 039 873 cubic meters of hazardous waste generated in the province per
annum, only 2 923 cubic meters of the waste actually reaches a hazardous waste site. This
accounts for 0.1 per cent of the total hazardous waste generated in the province, while the
remainder portion of 99.9 per cent is disposed somewhere in undocumented areas (Mpumalanga
DACE, 2003).

18
Inevitably, this huge quantity of hazardous waste makes a significant contribution to the burden of
solid waste management in the municipalities within the province. In fact, health care risk waste is
the most common type of hazardous waste that is dumped with general waste in most parts of the
province, while the other types of waste are transported to the Gauteng Province for disposal
(Finlay, 2007). Improper management of health care waste has a negative impact on the
manageability of landfill sites in the South African municipalities (Slack et al., 2005; GSDM, 2006).
The other type of hazardous waste often found mixed with municipal solid waste is household
hazardous waste. These waste materials are often present in smaller quantities and result from
household appliances, sprays, body lotions, furniture polish, vehicle batteries and other household
accessories (Nriagu et al., 1997; Rosqvist et al., 2003; Slack et al., 2005). General waste materials
can be sub-categorized as:
• Domestic or household waste: Waste generated on premises used for residential
purposes and community amenities and which is collected as part of a routine service
provided by the municipality;
• Commercial / Business waste: Waste generated in office blocks, retail stores,
restaurants and other commercial properties;
• Industrial waste: Waste generated by industries which is largely determined by the
type of industry where it is generated, and may be hazardous or non-hazardous;
• Rubble: Waste generated where construction and road building activities are
undertaken. Generally, contractors remove this waste to disposal sites and are often

19
suitable for daily cover at landfill sites where sufficient quantities of soil cannot be
obtained;
• Garden refuse: This waste is generated when maintaining gardens or cutting grass,
trimming trees, shrubs and is typically collected in a mixture of domestic waste as
part of the routine collection service.
Similarly, hazardous waste materials can be categorized into the following nine sub-categories or
classes:
• Class 1: Explosives,
• Class 2: Gases,
• Class 3: Flammable liquids,
• Class 4: Flammable solids or substances,
• Class 5: Oxidizing substances,
• Class 6: Toxic and infectious substances,
• Class 7: Radioactive substances,
• Class 8: Corrosives,
• Class 9: Miscellaneous substances.
When all these materials react physically and chemically during decomposition processes, a
heavily mineralized liquid flow known as leachate occurs. The uncontrolled flow and circulation of

20
this fluid in unprotected landfill sites, poses greater environmental risk to the environment and
human health (Thomson, 1999). In addition, hazardous waste materials are also grouped into four
toxic or hazard levels (DWAF, 1998a):
• Hazard rating 1: Extreme hazard
• Hazard rating 2: Highly hazard
• Hazard rating 3: Moderate hazard
• Hazard rating 4: Low hazard
When examining the impact of hazardous waste in relation to the definition of hazardous and
general waste, general waste is regarded as the waste materials that do not pose a significant
threat to health or the environment, if managed properly. However, hazardous waste has the
potential, even in low concentrations, to have a significant adverse effect on public health and the
environment because of its inherent toxicological, chemical and physical characteristics (DWAF,
1998a).
2.5 WASTE MANAGEMENT PROBLEMATICS IN THE ALBERT LUTHULI MUNICIPALITY
In the Albert Luthuli Municipality, solid waste management is a competency of the Department of
Community Health Services, which is one of the administrative units of the Municipality. The
Department is meant to handle only general waste. Currently the Municipality has only 22
employees, while 31 posts are vacant. As an alternative, the Municipality outsources refuse
removal services to private contractors.

21
However, the Municipality is able to provide a similar service to Carolina and Badplaas by means
of municipal trucks and tractors, while contractors collect refuse from the Elukwatini, Ekulindeni
and eMpuluzi townships. Unfortunately, other areas of the municipality do not have access to
refuse removal services. These areas are primarily low income and informal residential areas.
Some of these areas are provided with bulk refuse containers, which are removed on an ad hoc
basis. Solid waste removal services are only accessible to 11 per cent of the total households
within the municipal area of jurisdiction. According to the study conducted by the Gert Sibande
District Municipality (2006: 47): “the Municipality acknowledges that there is a lack of
communication and understanding between them and the contractor (Beauty Construction)”. To
this extent, it has been established that the contractor does not dispose waste in all of the allocated
areas probably due to capacity constraints.
2.5.1 Waste minimization in the municipal areas
A study conducted by the district municipality revealed that a number of re-claimers frequently sort
and collect waste materials at the Carolina landfill. During the interviews carried out by the district
consultants, the re-claimers indicated that they had been working on the neglected site for about
three weeks and were paid 30 cents per kilogram of reclaimed plastic and tins (GSDM, 2006). In
addition, a team of other re-claimers, who collected metals, indicated that they sold it to the local
scrap contractor in town. According to one of the local scrap yard contractor, ABCON Metals, the
reclaimed goods bought from reclaimers are further sold at approximately 30 tons of steel to
Highveld Steel in Middelburg at least once a month (GSDM, 2006).

22
However, the re-claimers were unable to provide the quantities of recycling material collected, as
they did not keep records. Re-claimers also indicated that their recycling undertakings are limited
as the landfill is at times set alight, thus placing them in a vulnerable position (GSDM, 2006). In the
district study, it was reported that: “a municipal foreman has confirmed that there is always smoke
coming from underneath the site, suggesting that the site was set alight or uncontrolled fires occur
and that these developments are not supported by the municipality” (GSDM, 2006: 49).
Furthermore, the re-claimers did not make use of any personal protection equipment when entering
the landfill sites.
2.5.2 Waste treatment by the Municipality
The Municipality does not practice any formal waste treatment nor does it have an infrastructural
and human capital capacity to deal effectively with solid waste treatment. The only treatment facility
in the Albert Luthuli municipal area is the incinerator at the Carolina and eMbhuleni hospitals that
are also not capable of burning at the highest temperature that is required to destroy toxic or
infectious waste materials.
2.5.3 Management of hazardous waste
The management of hazardous waste is a responsibility of the provincial government
(Mpumalanga DACE, 2003). However, it is the responsibility of the local municipality to ensure that
general landfills are correctly managed and that human health and the environment are not
negatively affected by poor management of solid waste.

23
The municipality has the responsibility to ensure that all potential hazardous waste generated in its
area of jurisdiction comply fully with the relevant legislation and statutes. In order to achieve its
obligation, Albert Luthuli Municipality must ensure that:
• Waste is correctly segregated into hazardous and non-hazardous waste streams to
ensure that the hazardous waste does not end up in the general waste stream,
• Hazardous waste is stored correctly and safely on site,
• Hazardous waste is removed on a regular basis and is not allowed to accumulate on
site,
• Hazardous waste is handled, classified, treated and disposed of by a registered
person or institution,
• All hazardous waste generators must have a proof that their hazardous waste
collecting person has a Safe Disposal Certificate.
The greatest challenge facing the local municipality currently is that there is no adequate
information relating to the generation, disposal and management of hazardous waste within its
area of jurisdiction. Despite the fact that the Municipality does not have capacity and the authority
to handle or dispose of hazardous waste, it was identified during the study by the district that there
is an area adjacent to the main landfill at Carolina which is used for the disposal of animal remains.
Veterinary waste such as animal remains, is classified as hazardous waste and may have a
significant adverse effect on public health and/or the environment (McLean, et al., 2006). Due to

24
the lack of security at the problem landfills, unregulated reclaimers often dig up the remains of the
buried animal carcasses for direct consumption.
2.5.4 Municipal solid waste facilities in affected municipal areas
The majority of residential, commercial and industrial waste is collected and disposed of at the
general landfill sites. The general condition of the landfills, as observed during the site visits by the
district, is not satisfactory. None of the landfills in the Albert Luthuli Municipality are permitted and
are not formally classified. This cannot be achieved as none of the landfill sites within the Albert
Luthuli Municipality have any weighbridges. General waste disposal sites only receive general
waste. However, it is required by existing legislation that prior to waste being accepted at a landfill
site, suitably qualified staff must monitor the site for compliance. However, this is not undertaken
at any of the landfill sites. Furthermore, it has been reported that the landfills experience problems
with the illegal disposal of hazardous waste (GSDM, 2006).
In addition, tyres are burned on the landfill site, while daily compaction and covering is not done
due to lack of machinery. The Municipality does not have any transfer station. The plan of the
Municipality is, however, to have only two landfill sites, Carolina and Elukwatini, where all the
waste generated in the municipal area will be disposed of, and to construct transfer stations at
some of the other towns (GSDM, 2006). The waste generated per household, when taking into
account the population growth rate, is 1 per cent where the calculation of the waste volume (in tons
per month) is based on the assumption that each person in the formal areas of Albert Luthuli
generates 1.2 kilograms of waste per day and each person in the informal settlements in Albert
Luthuli generates 0.3 kilograms of waste per day. It must be noted that most of the informal areas
25
in Albert Luthuli do not have a refuse removal service and their waste is not disposed on the landfill
sites. Most of the informal settlements handle their own waste by digging and burning it (GSDM,
2006).
2.6 THE SOUTH AFRICAN REGULATORY FRAMEWORK
A few national statutes relevant and most pertinent to solid and hazardous waste management are
briefly summarized in Table 2.2. According to Section 24 of the Constitution of the Republic of
South Africa (Act 108 of 1996):
Everyone has a right to an environment that is not harmful to health or well being. The Government
is, therefore, obliged to act reasonably to protect the environment by taking appropriate measures
to prevent pollution of all types, and to ensure that polluting agents take precautionary measures to
balance industrial development with environmental protection to the mutual and socio-economic
benefit of all stakeholders involved.
To achieve this goal, the National Environmental Management Act (NEMA of 1998) provides an
over-arching framework towards the attainment of integrated and co-operative environmental
governance. Furthermore, this Act supersedes several sections of the Environmental Conservation
Act of 1989 and it includes the so-called “Polluter must Pay Principle” as well as the remediation of
environmental damage (South Africa Year Book, 2000/01). In particular, the Hazardous Substance
Act (RSA 1973) as well as the Environmental Conservation Act (RSA 1989) provides for the control
of substances which may cause injury or human illnesses due to their toxic and corrosive nature;
as well as the regulating of dumping of waste in registered landfill sites, respectively.
In addition, the National Environment Management: Air Quality Act (RSA, 2004), provides national
norms and associated standards in order to control and regulate air quality monitoring,

26
management of all government spheres involved, the goal being to achieve environmentally
sustainable development (Mc Clean, et al. 2003). Other relevant legislations are succinctly
summarised in Table 2.2.
Table 2.2: Regulatory framework
Constitution of the Republic of South Africa Act 108 of 1996
The Constitution, as the principal piece of legislature in South Africa, obligate all activities to take place in accordance with environmentally sound practices to prevent the violation of the environmental right. Local government has to do refuse removal, waste/refuse dumps and disposal.
National Environmental Management Act 107 of 1998
The National Environmental Management Act (NEMA) provides for co-operative governance. Chapter 3 makes specific reference to the responsibilities of local government with respect to waste management. Chapter 7 imposes a duty of care in respect of pollution and environmental degradation.
National Waste Strategy and Action Plans
The overall strategy is to reduce the generation of waste and the impact on the environment of all forms of waste. Again, concepts such as Integrated Waste Management planning, Waste Minimization and Recycling are emphasized repeatedly.
National Environmental Management: Waste Management Bill 2007
The Bill has a significant impact on Waste Management in South Africa. It requires municipalities to have a comprehensive integrated waste management plan, and industries to develop an industry waste management plan.
DWAF Minimum Requirements for Landfill, 2nd Edition, 1998
The Minimum Requirements provide applicable waste management standards or specifications that must be met, as well as providing a point of departure against which environmentally acceptable waste disposal practices can be assessed.
Environment Conservation Act 73 of 1989
The Act specifies the requirement of a permit to establish and operate any waste disposal. The permit sets conditions pertaining to the design, construction, monitoring and closure of a waste disposal site. In Section 20 specific reference is made to waste management, including the establishment and operation of waste disposal sites.
Municipal Systems Act 32 of 2000
The Act regards Municipalities as service authorities, responsible for the effective delivery of services and must provide appropriate policy and regulatory frameworks.
National Environmental Management: Air Quality Act 39 of 2004
The Act deals with the control of ambient air quality. It clearly spells out the responsibilities of each sphere of government in ambient air quality management.
National Water Act 36 of 1998 The Act contains provisions directly addressing waste management operations that impact on a water resource.
White Paper on Integrated pollution and Waste Management for South Africa, Notice 227 of 2000
In this document the focus is shifted towards integrated pollution and waste management, as well as waste minimization. Concepts such as cradle-to-grave, waste minimization at source and integrated waste and pollution management are emphasized throughout.
Adopted from Govan Mbeki Municipality (2003:100)

27
2.7 INTEGRATED WASTE MANAGEMENT
According to Slack et al. (2005), the adverse impacts of waste management are best addressed by
establishing integrated programs for solid waste management. In these programs, all types of
waste and all facets thereof are considered together. Slack et al. (2005) further highlights that
despite the importance of the programs, limited resources can prevent or hamper the
implementation of such programs. The long-term goal should be that each municipality develops
an integrated waste management plan (IWMP). Integrated waste management ensures that the
management of solid waste is planned cross-sectorally and in advance. Thus, the objectives of
integrated waste management planning are as follows (Slack et al., 2005):
• Optimization of waste management;
• Minimization or total mitigation of environmental impacts;
• Minimization of environmental costs and maximizing environmental savings or
income generation;
• Capacity building amongst communities to develop proactive plans for efficient
management of waste;
• Establishment of waste information systems within municipalities; and
• That sound financial planning is practiced and implemented.

28
According to the guidelines of the Department of Environmental Affairs and Tourism (DEAT), an
integrated waste management plan should consider, inter alia, the following aspects (Slack et al.,
2005):
• Identification of national, provincial and local statutes that are governing waste
management within municipalities;
• Demographic information of municipalities;
• An assessment of quantities and characteristics of waste generated, collected,
recycled, treated and disposed of within the municipalities;
• An assessment of existing waste management strategies, systems and practices
within municipalities;
• Economical and financial costs of waste management;
• The waste management organizational structure within the municipalities;
• Identification and prioritization of community needs;
• Strategies for waste prevention, minimization and recycling;
• Implementation of a program for IWMPs; and
• Mechanisms for monitoring performance in respect of targets and strategies set.
An integrated waste management system is one of the national principles that regulate
environmental matters (National Environmental Management Act 107 of 1998).
The principle also requires that waste should be avoided, or where it cannot be altogether avoided,
it should be minimized and reused or recycled, where possible and otherwise treated and/or

29
disposed of in a responsible manner (Jain et al., 2005). Thus, integrated waste management
involves the following four priorities (see figure 2.1) in order of preference (Slack et al., 2005):
• Waste avoidance;
• Waste minimization: reduce, re-use and recycling.
• Waste treatment;
• Waste disposal.
Figure 2.1: Integrated solid waste hierarchy
(Adopted from DEAT, 2002a)
Integrated waste management promotes integrated planning for solid waste management and
prioritization of waste management hierarchy. The main aim of integrated waste management
Priority 4: Waste disposal
Priority 3: Waste treatment
Priority 2: Waste minimization
Priority 1: Waste avoidance

30
strategy is to reach the objective of Integrated Pollution and Waste Management, which is the
national police regulating pollution and waste management. It also aims at achieving world-class
commitments on sustainable development as in the Polokwane Declaration of September 2001,
which works towards a waste free environment (DEAT, 2002b). In terms of the integrated pollution
and waste management, solid waste management priorities are geared towards preventing waste
generation and pollution, waste reduction, material recovery and reclamation of waste material
(DWAF, 1998b). The implications of these approaches are serious if it is considered that it has
been predicted already that the generation of waste will exceed existing landfill capacity in five of
the nine provinces of South Africa, by up to nearly 70 per cent before the year 2010 (South Africa
YearBook, 2000/01).
2.7.1 Waste avoidance
Waste avoidance can be achieved in different ways, such as the prevention of waste at a point of
generation through cleaner production or cleaner technology. These technologies mainly involve
the use of good quality raw materials and the generation of very small amounts of by-products or
no by-products at all. It is also achieved through strong legislative measures for waste reduction
(Jain et al., 2005). Waste avoidance is a first step and a priority in the waste management
hierarchy. Priority should be given mainly to the avoidance of waste generation, and it must be a
priority before the other three measures that can be applied to ensure the best management of
waste, while waste disposal is the last priority (Sugni, et al., 2005).

31
2.7.2 Waste minimization
Waste minimization simply means reduce, reuse and recycle. The primary goal of waste
minimization is to reduce waste quantities that could otherwise be transported and disposed of in
the landfill sites. Waste minimization is also called resource recovery or waste reclamation (DEAT,
2002a). Traditionally, the practice focused more on material reclamation from disposed waste in
the landfill sites. This was uncontrolled, and informally done by reclaimers who were mainly from
economically disadvantaged communities. There is an indication; however, that municipalities,
private industries, and communities are starting to give support to initiatives of resource or material
recovery. This involves amongst others, biodegradation, biostabilization, biodrying, composting and
energy generation from landfill gas, as well as other advanced technologies (DEAT, 2002a).
Recovery of waste at the source is strongly recommended, but it can also be done during
transportation or at the disposal site. However, the earlier the separation, the cleaner the material,
and ultimately, the higher its quality and the economic value of recyclables. When waste recyclers
are allowed access to landfill sites, significant amounts of material are recovered. However,
because they interfere with efficient operation of dumps and landfills, recyclers are usually
prohibited, yet in turn it leads to lowering recovery rates and causing severe economic hardship in
local communities. Some sites provide a measure of structured access, for instance at the Bisasar
Road landfill in Durban, where registered recyclers are allowed onto the site after hours. This
allows recycling to help build capacity among local micro-enterprises and to reduce the waste
handled by landfills and dumps (Adani et al., 2004; Jain et al., 2005; Sugni et al., 2005).

32
Hence, different waste reduction or recovery projects are emerging. One of the recent technologies
is the use of landfill gas for energy generation either through incineration of waste or direct
extraction of methane gas from the landfill site (Jain et al., 2005).
South Africa does not only recycle solid waste but also other types of waste such as liquid and
gaseous waste (DEAT, 2002b). This is in keeping with the integrated pollution and waste
management policy (reduce, reuse, recycle & repair), which encourages waste minimization and
resource recovery (DEAT, 2002a). Subsequently, South Africa is the seventh highest per capita
emitter of carbon dioxide in the world. Consequently, there are efforts to reduce emissions. For
instance, eThekwini Municipality is the first municipality in South Africa to generate electricity from
landfill gas. This initiative helps to reduce green house gas such as carbon dioxide and others,
which in turn addresses the challenge of global warming (Strachan, et al., 2007).
This literature review revealed that different countries use different methods to recover and reduce
waste quantities. The focus is often to reduce waste quantity or quality. Quantity reduction
measures are aimed towards minimising the amount of waste generated, while quality reduction
ones attempts to lessen toxic levels (Kassim & Ali, 2005; Sugni et al., 2005). Whereas the
emphasis in most countries is to recycle only general waste, industrialised countries such as
Korea, also attempt to recycle hazardous waste. For example, some of the health care waste, such
as human placentas, are recycled in Korea and are used as raw material in the production of
pharmaceutical products (Yong-Chung et al., 2005).

33
2.7.3 Waste treatment
Waste treatment is the third priority in the waste management hierarchy. It follows waste
minimization and precedes waste disposal, the fourth and the last step in the waste management
hierarchy. Different methods are used by countries for waste treatment ranging from chemical
treatment, thermal treatment, sterilization and many more. Waste treatment is also used as waste
disposal and hence the two waste management steps are dealt with concurrently in order to create
good coherence. Although practices for solid waste treatment or disposal also vary from country to
country, the most common method for waste disposal are landfill sites. Japan, China, Sweden,
Denmark and some other countries use incineration as a preferred method for waste treatment
and/or disposal. This method is mainly used in developed countries, especially in countries where
land is scarce. Incineration is a waste treatment method that uses high temperatures to combust
waste. This method is both a treatment and disposal method. During the incineration process,
waste materials are converted into gas, heat, emissions and residual ash (Middleton, 2004). The
use of incinerators, chemical treatment, physical treatment, immobilization, solidification and
encapsulation are some of the methods that are often used for solid waste treatment in the country.
However, given the negative environmental impacts associated with incineration processes, this
form of waste treatment is discouraged (McLean et al., 2003).
2.7.4 Waste disposal
After the first three priorities of the waste management hierarchy are applied, the final and last
option in the hierarchy is waste disposal. Waste disposal is done in various ways, such as the
landfill method, incineration, encapsulation and others.

34
According to EI-Fadel et al. (1995), landfill sites are historically the most used method for waste
disposal in the world. Some activities in the waste management priorities also fall between waste
treatment and waste disposal, because they have the potential to treat and also finally deal with
waste as a disposal facility (McLean et al., 2003). Despite the challenges facing the country, there
has been a remarkable improvement in both regulatory framework and implementation of
developmental plans for solid waste management. Disposal of waste by landfill is the most
economic way of waste disposal for many developed and developing countries (Middleton, 2004;
Kum et al., 2005). Landfill sites continue to be the most convenient method for waste disposal (EI-
Fadel et al., 1995). Numerous developed and developing countries still rely on the landfill method
for waste disposal since approximately, 95 per cent of the world’s solid waste is disposed of
through the landfills (EI-Fadel et al., 1995).
In Africa, most solid waste is disposed of indiscriminately and in an environmentally unacceptable
manner through open or controlled dumps. The ultimate goal for waste disposal by landfill is to
separate disposal of hazardous and non-hazardous materials, and to construct clean and properly
sited landfills with diligent management, including leachate and methane management, during
operation and after closure. When these conditions are met, the landfill becomes a sanitary landfill.
2.8 CONCLUSION
The review of relevant literature on waste management shows that it is not only a technical
problem for the municipalities, but that it involves other aspects, such as the social, political,
economical considerations and others. In the review of legislation, it was highlighted that the
disposal of waste is a listed legally regulated activity in terms of South African law. This implies that

35
the undertaking of this activity by any person or an organ of state is prohibited, unless authorized
by the Minister through the Environmental Impact Assessment regulations. There is sound
evidence available from waste management studies involving different approaches or new
technologies of minimizing waste and the conversion of waste material to useful resources.

36
CHAPTER 3
DEMARCATION OF THE STUDY AREA
3.1 MPUMALANGA PROVINCE
The Mpumalanga Province (as illustrated on Figure 3.1), meaning “place of the rising sun”, lies in
the northern eastern region of South Africa (Mpumalanga DACE, 2003:1). The capital of the
Province is Nelspruit, which is located 450 km east of Johannesburg. The Province occupies 6.5
per cent of the total surface of the Republic of South Africa and has a population of approximately
3 million people (Mpumalanga DACE, 2003:1).
Figure 3.1: South African provinces
(Constitution Act 108 of 1996)

37
The population is dominated largely by siSwati- and isiNdebele-speaking people, although
language groups of Xitsonga, seSotho, isiZulu, Afrikaans and English are also prominent in the
province (Mpumalanga DACE, 2003:1). The province is divided into three districts, namely
Ehlanzeni, Nkangala and Gert Sibande. The study was conducted in one of the seven local
municipalities in the Gert Sibande District Municipality (GSDM). The district municipality is located
on the eastern Highveld of the province, bordering the KwaZulu-Natal Province, Gauteng Province,
Free State Province and Swaziland. The district has a total of 25 landfill sites, yet in all seven local
municipalities only two of the landfill sites are licensed. Presently, there are plans to develop four
regional landfill sites for the district (Mpumalanga DACE, 2003).
3.2 ALBERT LUTHULI MUNICIPALITY
Albert Luthuli Municipality as part of the Gert Sibande district comprises of the towns of Carolina,
Badplaas, Elukwatini, Ekulindeni and eMpuluzi (Figure 3.2). The main town in Albert Luthuli
Municipality is Carolina, which hosts the municipal headquarters. The municipal area consists of
the following: 42 settlements, which have been categorized into 22 wards. The area stretches from
Diepdale and Ekulindeni along the Swaziland border. It also borders South Africa in the east
towards Hendrina and to the west from Nooitgedatch and Vygeboom dams in the north to
Warburton in the south. Three provincial routes, namely R33, R36 and R38 pass through this area.
The municipal land occupies an area of about 557 279 hectors. Albert Luthuli is predominately rural
in the degree of functional specialisation, with small scale socio-economic activities. There are
numerous development-related concentrations scattered across the region that can be categorized
into five sub-regions namely, Carolina/Silobela, Elukwatini, eMpuluzi, Ekulindeni and

38
Tjakastad/Badplaas (Albert Luthuli Municipality, 2006). Approximately 80 per cent of the total area
is used for agriculture with limited fragmented human settlements scattered throughout the region
(Mpumalanga DALA, 2006).
Figure 3.2: Location of the district and local municipalities
3.2.1 Demographic status
The Municipality has a population of 187 936 based on the 2001 census, which constitutes 98.2
per cent Africans, 0.2 per cent Coloureds, 0.1 per cent Indians and 1, 5 per cent Whites (Albert
Luthuli Municipality, 2006: 9).
5
Free State
Albert Luthuli Municipality
North West
KwaZulu-Natal
Limpopo
Gauteng3 2
476
1
Gert Sibande District Municipality
Mpumalanga

39
The gender balance of the population is represented by 54 per cent females and 46 per cent
males, while approximately 98.5 per cent of the population is from previously disadvantaged
groups (Albert Luthuli Municipality, 2006). At present, approximately 61.4 per cent of the
inhabitants of the municipal area are living below the reconstructive development program (RDP)
standard of sanitation, with the exception of Carolina, part of Badplaas, Elukwatini and Mayflower
(Albert Luthuli Municipality, 2006). The socio economic data reflecting employment, employment
per economic sector, annual income and per capita income are presented in Figure 3.3 and Table
3.1.
20%
22%58%
Employed Unemployed Economically inactive
Figure 3.3: Economic activities for the communities (Albert Luthuli Municipality, 2006: 33)

40
Table 3.1: Annual incomes
Households
Income Households %
None 12 357 30.0 R1 – 4 800 6 352 15.4 R4 801 – 9 600 10 132 24.6 R9 601 – 19 200 5 998 14.6 R19 201 – 38 400 3 268 7.9 R38 401 – 76 800 1 795 4.4 R76 801 – 153 600 770 1.9 R153 601 – 307 200 257 0.6 R307 201 – 614 400 75 0.2 R614 401 – 1 228 800 51 0.1 R1 228 801 – 2 457 600 93 0.2 Over R2 457 600 38 0.1
TOTAL 41 186 100
(Taken from Albert Luthuli Municipality, 2006: 33)
3.2.2 Environmental features
The Albert Luthuli municipal area spans the eastern part of Mpumalanga within the Highveld,
Lowveld and eastern region. It has a sub-tropical climate with hot summers and mild to cold
winters. The average daily temperature in summer is 24oC, while in winter the average day
temperature is 14.8oC (Mpumalanga DACE, 2003). The average rainfall is 767 mm per annum,
with approximately 10 times more rainfall in summer than in winter. The rainfall increases from
West to East from as little as 600 mm to more than 1600 mm annually (Mpumalanga Province
DALA, 2006).

41
A total area of 5600 km2 is covered by grass land with patches of forest in the lower lying areas.
Bodies of water cover 2 968.3 ha, wetlands 555.7 ha, the urban or residential area is 5 900.7 ha,
mines and quarries cover 183.7ha and the remainder is utilized for other activities (Plates 3.1, 3.2,
3.3).

42
Pl
ate 3
.1: S
oil t
ypes
(A
dapte
d fro
m the
Insti
tute o
f Geo
-Scie
nce,
2007
: 13)
◙ El
ukw
atin
i
◙ B
adpl
aas
◙ C
arol
ina

43
Pl
ate 3
.2: V
eget
atio
n ty
pe
(Ada
pted f
rom
the In
stitut
e of G
eo-S
cienc
e, 20
07: 1
3)
◙ C
arol
ina
◙ El
ukw
atin
i
◙ B
adpl
aas

44
Pl
ate 3
.3: G
eolo
gy m
ap
(Ada
pted
from
the
Inst
itute
of G
eo-S
cien
ce, 2
007:
14)
◙ C
arol
ina
◙ El
ukw
atin
i
◙ B
adpl
aas

45
3.2.3 Water supply
The Albert Luthuli Municipality has provided communities in the deep rural areas with 180 boreholes, while
several bulk water supply schemes exist at different localities. The Department of Water Affairs and Forestry
currently own the existing water supply schemes, with the exception of the Carolina treatment plant. The
following are the water supply schemes that exist in the municipal area:
• Elukwatini water scheme supplies water to Elukwatini, Nhlazatshe, Mooiplaas, Arnhemburg and
Avontuur with its catchment area downstream from the Badplaas old and new landfill sites, as well as
the private landfill sites of the Badplaas Aventura Hotel;
• Badplaas water scheme supplies Badplaas with its catchment area upstream;
• eMpuluzi water scheme supplies Izindonga, Dumbarton, Mayflower, Glenmore, Dundonald 1 and 2,
Zwallusnest, Bettysgoed and Robbins dale.
• Ekulindeni supply scheme supplies water to Ekulindeni/Kromdraai, Moddergat, Rossville, Steynsdorp,
Vlakplaas, Kalwerskraal, Kranskop, Maanhaar, Nhlaba and Ngonini. Ekulindeni water supply scheme
also fetches its water at about 4km downstream of Elukwatini landfill site and 8km of the Badplaas
landfill sites.
• Carolina water scheme supplies the town of Carolina, Silobela Township and Caro Park.
3.2.4 State of three landfill sites
3.2.4.1 Badplaas township/landfill site

46
Fi
gure
3.4:
Map
of t
he B
adpl
aas T
owns
hip
(In
stitut
e of G
eo-S
cienc
e, 20
07: 1
5)

47
Asbestos structures were found disposed at the new landfill site established in October 2005. As is evident in
Plate 5.1, reclaimers or scavengers are without proper protective equipment. They are in direct contact with
broken asbestos structures. The landfill site is located adjacent to Nkomati River, which is approximately 100
m from the landfill site and flows to Elukwatini. Nkomati River is also bordered by a private landfill site, which
belongs to Badplaas Aventura Hotel. The Badplaas landfill site is not permitted, nor fenced, nor lined, no
leachate collection system is in place and there is no access control. The old Badplaas landfill site was closed
two weeks after this study was initiated. It was closed without proper rehabilitation and no closure plan or
permit was issued. The old Badplaas landfill site was not originally made for waste disposal, but was a borrow
pit. It was located approximately 10m from households, adjacent to and opposite the New Badplaas clinic,
Manzana cultural village and 100m from the Badplaas Aventura Hotel. The same landfill site, located within a
wetland, was not fenced, with no gas or leachate collection systems, no covering of refuse after disposal and
many more challenges. Even though the site is now closed, there is no monitoring or auditing. The type of
waste buried in the landfill site is not well known.
It is evident, according to the details in Figure 3.4, that at the new Badplaas landfill site, electronic waste is
within a distance of approximately 100m from the residential areas. During site visits, it was established that
material recovery is done throughout the day at all times, seven days a week. However, the lack of personal
protective clothing is a challenge at all landfill sites. In the new landfill site, the Municipality is applying a trench
method for waste disposal.
3.2.4.2 Carolina landfill site
The Carolina landfill site is located approximately 100m from the residents of Caro Park (Fig. 3.5). Smoke is
visible in the air and the prevailing wind blows in the direction of the residents of Caro Park.

48
Fi
gure
3.5:
Map
of t
he C
arol
ina T
owns
hip
(Insti
tute o
f Geo
-Scie
nce,
2007
: 15)

49
3.2.4.3 Elukwatini township
The Figure 3.6, illustrates the activities that are undertaken at Elukwatini landfill site and the state of the landfill site. Elukwatini landfill site is not fenced, there is no access control, nor is a gas or leachate collection system in place and it is located ±500m from the catchment and drainage area of Nkomati River. Elukwatini landfill site is located in an ideal position, away from residential areas, with a buffer zone and it is not close to bodies of water.

50
Fi
gure
3.6:
Map
of E
lukw
atin
i Tow
nshi
p
(Insti
tute o
f Geo
-Scie
nce,
2007
: 15)

51
3.4 CONCLUSION
This chapter has described the demographics of the Municipality, its location within South Africa, Mpumalanga
Province as well as the Gert Sibande District Municipality. Details of the size of the area, population dynamics,
the locations of the three landfill sites, affected rivers and communities have been provided. Furthermore,
significant environmental features of the area have also been highlighted.

52
CHAPTER 4
RESEARCH METHODOLOGY
4.1 INTRODUCTION
This study aimed to investigate the solid and hazardous waste disposal trends and the associated
environmental risks in the Albert Luthuli Municipality. In order for the study to achieve set objectives, a
triangulated research design was followed. A triangulated research design is a concurrent combination of
qualitative and quantitative research designs (White, 2003). According to Babbie (1998) the motivation for the
use of this research design is to enable the study to provide multidimensional perspectives about the research
phenomena in question. The qualitative aspect of the design attempted to holistically examine the
environmental and health risks associated with unregulated landfills. The methods used for primary data
collection involved site visits with the purpose of gathering data by means of observation, photos and landfill
analysis forms. The purpose was to capture the base-line state of unregulated landfills, environmental
degradation and the associated environmental risks (Nissim et al., 2005). The quantitative aspects of the
research design focused more on the specific aspects of the research problem. It is descriptive in nature;
hence it attempted to provide further insights about the research problem, mainly in respect of toxicity
assessment, exposure assessment and risk characterisation. In this study surveys were used to investigate
the existing and potential risks that are associated with unregulated landfill sites. This methodology was also
used by Mutuki et al. (1997) to investigate solid waste management challenges in Tanzania.
However, in the current study, primary data was collected through site analysis forms and questionnaires.
Biophysical data on water quality aspects was obtained from the Municipality. The information was used to
draw inferences about the inherent environmental and health risks. In particular, a stratified random sampling
technique was used to select participants or respondents from the total population group (see figure 4.1). A
total of 400 questionnaires were administered to participants (Huysamen, 1998). The research was purely

53
non-experimental and descriptive in nature. The primary goal was to examine the prevailing environmental
conditions, practices, attitudes, as well as processes and impacts related to the unregulated landfills in the
Municipality (Nachmias et al., 1992).
Randomized 20% Randomized 20% Randomized 20%
Figure 4.1: Stratified random sampling plan (Adapted from White, 2003:5
In order to adequately address the set study objectives, the methods used are outlined below.
4.1.1 Research method for Objective 1:
The purpose with this method was to identify different sources of waste materials entering unregulated landfills
of the municipality. In Annexure A and B, the data collection tools used are presented which, amongst other
things, required the following information:
• The types of waste generated by the local communities,
• The waste materials collected by the Municipality,
• Whether or not all waste collected by the Municipality is disposed at the landfills under the study,
Sample (n=52)
Population sample (N=375
Total sample (n=75
Commercial (N=75)
Sample (n=15
Residents (N=260)
Health Care (N=40)
Sample (n=08)

54
• Whether waste materials are sorted into general or hazardous,
• Whether waste generated from hazardous waste producing institutions was collected by the
Municipality and/or not,
• Whether the hazardous generating institutions disposed their waste at the municipal landfills.
4.1.2 Research method for Objective 2:
The purpose with this method was to classify and evaluate the types of waste that are disposed in the landfills. To achieve this goal, three groups of participants were classified into hazardous or general waste producing institutions according to the industrial group list approved by the Department of Water Affairs and Forestry (Table 4.1 & 4.2). This list classifies the type, category and hazard rating of all waste produced by different industries.

55
Tabl
e 4.1:
Ind
ustri
al gr
oups
Indu
stria
l gro
up
Indu
stria
l pro
cess
A:
Agr
icultu
re, F
ores
try &
Foo
d Pro
ducti
on
•
Agric
ultur
al, p
lant
and
anim
al pr
oduc
tion
as w
ell a
s for
est m
anag
emen
t, fis
herie
s an
d ma
nufac
turing
of
anim
al fee
d B:
Mine
ral E
xtrac
tion &
Upg
radin
g •
Quar
rying
of m
etallic
and n
on-m
etallic
mine
rals
C: E
nerg
y •
Gas w
orks
, cok
ing, p
etrole
um a
nd pr
oduc
tion o
f elec
tricity
D:
Meta
l man
ufactu
rer
• Fe
rrous
and n
on –f
erro
us m
etallu
rgy
• Fo
undr
y, me
tal w
orkin
g ope
ratio
ns, m
etal fi
nishin
g and
elec
tropla
ting
E: M
anufa
cture
of N
on M
etal M
inera
l Pro
ducts
•
Cons
tructi
on m
ateria
ls, ce
rami
cs, g
lass,
salt r
ecov
ery a
nd re
fining
•
Asbe
stos g
oods
and a
bras
ive pr
oduc
ts F:
Che
mica
l & R
elated
Indu
stries
•
Petro
chem
icals,
feed
stoc
k and
prod
uctio
n of in
ks, v
arnis
h, pa
int &
glue
•
Fabr
icatio
n of p
hotog
raph
ic pr
oduc
ts •
Prod
uctio
n of p
harm
aceu
ticals
and c
osme
tics
• Ru
bber
& pl
astic
mate
rials
• Pr
oduc
tion o
f exp
losive
s and
prop
ellan
ts •
Prod
uctio
n of B
iocide
s •
Was
te &
water
trea
tmen
t •
Analy
tical,
bioc
hemi
cal a
nd ch
emica
l labo
rator
ies
G: M
etal G
oods
, Eng
ineer
ing &
Veh
icle
Indus
tries
• Me
chan
ical, e
lectro
nic &
elec
trical
engin
eerin
g •
Manu
factur
e of m
otor v
ehicl
es &
parts
H:
Tex
tile, L
eathe
r & W
ood
Indus
tries
•
Texti
le, cl
othing
& fo
otwea
r indu
stry
• Hi
de &
leath
er in
dustr
y •
Timbe
r, wo
od &
furn
iture
indu
stry
J: Ma
nufac
ture o
f Pap
er P
rodu
cts, P
rintin
g & P
ublis
hing
• Pa
per &
card
boar
d Ind
ustry
•
ing, p
ublis
hing &
photo
grap
hic la
bora
tories
K:
Med
ical, S
anita
ry &
Othe
r Hea
lth S
ervic
es
• He
alth,
hosp
itals,
med
ical c
entre
s & la
bora
tories
•
Veter
inary
servi
ces
L: Co
mmer
cial &
Per
sona
l Ser
vices
•
Laun
dries
, dye
rs &
dry c
leane
rs •
Dome
stic s
ervic
es &
cosm
etic i
nstitu
tions
(Ada
pted f
rom
DWAF
, 199
8a)

56
Tabl
e 4.2:
Haz
ardo
us su
bsta
nce c
lasse
s
Clas
s De
scrip
tion
Clas
s 1
• Ex
plosiv
es
Clas
s 2
2.1
2.2
2.3
• Ga
ses:
comp
ress
ed, li
quefi
ed or
diss
olved
unde
r pre
ssur
e. •
Flamm
able
gase
s •
Non-
flamm
able
gase
s •
Poiso
nous
gase
s Cl
ass 3
3.1
3.2
3.3
• Fla
mmab
le liq
uids
• Lo
w fla
shpo
int gr
oup o
f liqu
ids, fl
ashp
oint b
elow
– 18o C
•
Inter
media
te fla
shpo
int gr
oup o
f liqu
ids, fl
ashp
oint o
f – 18
o C up
to, b
ut no
t inclu
ding 2
3o C c.
c. •
High
flash
point
grou
p of li
quids
flash
point
of 23
o C up
to, d
o inc
luding
, 61o C
c.c.
Clas
s 4
4.1
4.2
4.3
• Fla
mmab
le so
lids o
r sub
stanc
es
• Fla
mmab
le so
lids
• Fla
mmab
le so
lids l
iable
to sp
ontan
eous
comb
ustio
n •
Flamm
able
solid
s, wh
ich em
it flam
mable
gase
s whe
n in c
ontac
t with
wate
r. Cl
ass 5
5.1
5.2
• Ox
idizin
g Sub
stanc
es
• Ox
idizin
g age
nts
• Or
ganic
pero
xides
Cl
ass 6
6.1
6.2
• Po
isono
us (t
oxic)
and i
nfecti
ous s
ubsta
nces
•
Toxic
subs
tance
s •
Infec
tious
subs
tance
s Cl
ass 7
•
Radio
activ
e sub
stanc
es
Clas
s 8
• Co
rrosiv
e Cl
ass 9
•
Othe
r misc
ellan
eous
subs
tance
s, tha
t is a
ny o
ther s
ubsta
nce
which
exp
erien
ce h
as sh
own,
or m
ay sh
ow, t
o be
of s
uch
dang
erou
s cha
racte
r tha
t the
pro
vision
of
this S
ectio
n sho
uld ap
ply to
it.
(Ada
pted f
rom
DWAF
, 199
8a)

57
4.1.3 Research method for Objective 3:
The purpose in this instance was to identify different exposure pathways related to the waste
hazards, which were identified in research objective 1. Furthermore, the following issues were
addressed:
• The landfill designs, location, leachate and gas management, as well as the proximity
of the landfills to water bodies, communities and sensitive environmental resources,
• The landfill operation such as waste sorting, pre-treatment of waste, scavenging, waste
burning, presence of explosives in the waste stream, and
• Possibilities of environmental and human exposure through inhalation, ingestion,
contact/skin and/or non-dietary digestion.
4.1.4 Research method for Objective 4:
The goal was to characterize and quantify the environmental risks associated with the current
disposal practices. The outcomes of the previous three methods are used to synthesize
possible environmental risks to the natural environment and to human health. This is done by
combining:
• identified sources of hazardous waste entering the landfills,
• possible exposure routes,
• public perception about the landfills, and
• possible environmental and health risks associated with the existing hazards and
exposure routes.

58
4.2 DATA COLLECTION
Two data collection tools were used for the study namely; a questionnaire and a site analysis
form (Annexure A & B). The tools were designed taking into consideration the “Minimum
Requirements for Waste Disposal by Landfill” (DWAF, 1998b). In the study, only one participant
was selected in each sampled waste generating institution. Data collectors were environmental
officers, who were responsible for the completion of site analysis form during each visit to site
landfills. In this manner every landfill was visited and assessed at least three times per year.
The same team collected data by means of a questionnaire and site analysis form. A
questionnaire was given only to a participant in charge of a waste generating institution, which
was sampled to participate in the study, such as chief executive officers, directors, managers,
or their delegates. In the case of residents, only participants aged 18 and above were allowed
to participate. Participation was limited to participants residing within the area of study (Albert
Luthuli Municipality, 2006).
4.3 DATA ANALYSIS
The results were descriptively analysed. The descriptive analysis helped to reduce the large
amount of data or numbers and also to easily draw conclusions using numbers. The analysis
involved the use of frequency distribution of scores converted to percentages (White, 2003). At
the end, all the replies to questions were grouped into three risk assessment components
namely, toxicity assessment, exposure assessment, and risk characterisation.

59
4.4 RISK ASSESSMENT
Risk is the likelihood that an adverse outcome can occur. Thus, risk assessment is a process
that seeks to evaluate the risk levels posed by the landfills to the environment and human
health and then compare them with acceptable or tolerable risk levels. It is also called an
organized quantitative or qualitative process of ascertaining risk levels and evaluating risk
tolerability (Butt & Oduyemi, 2003). Risk assessment is also viewed as a scientific
quantification or qualification of risk from data and understanding the processes involved. It is a
process that gathers all relevant information and identifies substances that are hazardous to
health or the environment (Butt & Oduyemi, 2003).
Consequently, the data was converted into risk assessment scores for quantitative calculation
of the inherent risk. According to DEAT (2002b), it is advisable to integrate all three types of
risk assessment when conducting a risk assessment study in order to obtain comprehensive
results. Such types of risk assessment are namely:
• Baseline risk assessment is the first type of risk assessment to be conducted in a
facility that focuses on assessing risk in relation to a specific landfill.
• Issue based risk assessment is a risk assessment that is focused on a specific issue or
activity within the operation of a landfill.
• Continuous risk assessment is the most important day-to-day function of management
to continuously assess the risks associated with the daily operations of the landfills.

60
From this observation, it was also taken into account that risk assessment is a minimum
requirement for waste disposal sites, hence certain requirements for conducting risk
assessment on the landfills had to be followed. In the study, three risk assessment components
are used as illustrated through Figure 4.2 (DWAF, 1998c).
Figure 4.2: Risk assessment model (Adapted from Butt & Oduyemi, 2003: 15)
4.4.1 Toxicity assessment (TA)
Toxicity assessment is the first step of risk assessment, which integrates hazard identification
(HI) and dose-response assessment (DA). It concerns the agent or hazard and its adverse
effects and the correlation of the dose and the response thereof.
Risk Characterization
Exposure Assessment
Toxicity Assessment

61
It uses various kinds of studies, such as epidemiological, biological, physiological and
toxicological, to identify and assess hazards. It also establishes the relationship between the
dose and the extent of an adverse response quantitatively (Paustenbach, 2000).
4.4.2 Exposure assessment (EA)
The focus of this EA component is to establish the existing and anticipated exposures,
exposure pathways and levels of the identified hazards towards environmental and human
health (De Rosa et al., 1997). This stage often involves epidemiological, biological,
physiological and toxicological studies. Exposure assessment is a key component of risk
assessment and is also an area of many uncertainties, mainly due to the dynamics involved
such as, the exposure rate, duration of exposure, contact agent, location of the agent, its exact
availability and other factors (De Rosa et al., 1997).
In human beings, exposure to toxins occur through three major routes namely, inhalation
(respiratory system), dermal (integumentary system) and oral (digestive system). Adding to the
three major exposure routes, there are two methods of measuring exposure, which also play a
critical role during exposure assessment exercise (direct & indirect). These methods involve
physiologically based pharmacokinetic (PB-PK) modelling and environmental sampling
(Paustenbach, 2000; De Rosa et al., 1997). The two methods differ in that the direct
measurement method (DMM) focuses on measuring the concentration of substances by taking
a specimen or sample from the environment or human body, while an indirect measurement
method (IMM) measures the concentration of an agent outside the human body (ambient
concentration of substances). It further assumes that ambient substances are readily available
for absorption into the environment.

62
Although there are different advantages and disadvantages of both measurement methods, a
combination of both methods was adopted in this study (Schoeman & Schroder, 1994).
4.4.3 Risk characterization (RC)
As alluded to earlier, risk assessment is a process of gathering data and making assumptions
to estimate the nature, severity, and likelihood of harm to human health or the environment.
Therefore, risk characterization (RC) is the last step of the risk assessment process that
summarises all data from the previous steps (De Rosa et al., 1997). It is a stage of risk
assessment at which conclusions are drawn based on the strength and weight of evidence
about the hazard. This stage relies on the quality of the information about the potency of the
effect caused by the hazard, population affected, types of health and environmental effects, the
likelihood of exposure and public concerns over the issue in question (Paustenbach, 2000).
Furthermore, risk assessment involves identifying hazards and evaluating the nature and
severity of risks. According to De Rosa et al. (1997:38) the following aspects are critical when
conducting risk assessment:
• Estimate environmental and health problems associated with the status conditions and
operations of the local municipal waste disposal sites;
• Estimate and compare the risks associated with upgrading, developing new sites,
closure of the existing sites and using the waste sites with the present existing
conditions and operational practices;

63
• Evaluate and compare different techniques, methods and proposals for reducing or
eliminating the risk from the condition, operations of the waste facilities and the classes
of the waste disposed;
• Identify and select conditions and operations, which are potentially hazardous in the
waste facilities;
• Evaluate and set priorities for the management of various environmental and health
risks.
The combination of all components of risk assessment, all studies involved, health perceptions
and other relevant information are used to establish the extent of risk involved in the study
areas (Mehta, 2007). The extent of the risk depends on the severity of harm to the
environment, public health and the number of those who are affected by the hazards of the
landfill sites. All data gathered from toxicity assessment (TA) and exposure assessment (EA)
were combined, analyzed, quantified or qualified, and meanings extracted or contracted (Janis,
2001).
4.5 CONCLUSION
In this chapter, research methods, data collection tools and data analysis and risk assessment
models were elucidated. The chapter illustrates the relationship between the rationale of the
study, statement of research problem, as well as the aims and objectives. It also explained the
research methods used to address each research objective. Furthermore, the three risk
assessment components were also discussed and how they are linked to the research
objectives. The categories of participants, size of the population, sample size, sample frames
and units were also detailed. The next chapter will present research results and findings.

64
CHAPTER 5
RESEARCH FINDINGS AND DISCUSSION 5.1 INTRODUCTION
Out of the 400 questionnaires administered to respondents, at least 380 were returned.
However, out of this total five were not completed accurately. As a result, the final number of
questionnaires analysed was 375. In addition, for each of the three landfills, three site analysis
forms were completed during the survey, which resulted in the total of nine forms analysed. All
responses from the questionnaires and site analysis forms were clustered into two groupings,
namely, demographics and risk assessment components. The risk assessment components
are (1) toxicity assessment, (2) exposure assessment and (3) risk characterisation. These
components as well as the demographics of respondents were analysed by means of
descriptive statistics and through tables and figures – an analytical procedure undertaken in
other studies of risk assessment (De Rosa, et al, 1998; Huysamen, 1998; Paustenbach, 2000;
Kassim & Ali, 2005).
5.2 DEMOGRAPHICS
The findings regarding the different demographics in the study areas are depicted in figure 5.1.
On this figure it can be seen that there are about seventy five (75) different institutions
(including households) that are implicated in the production of the different types of waste
materials reaching unregulated landfill sites. These institutions can be divided into three
categories, namely, residences, commercial enterprises, and health care facilities. At the
Badplaas study area, 87 per cent of the respondents were residential households whilst 13 per
cent was comprised of commercial enterprises.

65
This means that Badplaas had no responses in the category of healthcare facilities. This can
be ascribed to the fact that this study area has a very low number (about two) of such facilities,
and given the sensitive nature of the topic under consideration it appears that some
respondents were not ready to provide the information required. Regarding the demographics
prevailing in the Carolina study area, responses from residential households constituted 62 per
cent whilst those from commercial enterprises were 34, 5 per cent. The responses from health
care facilities were at 3, 5 per cent, slightly higher than at Badplaas. However, the number of
health care facilities at Carolina is nearly 10, suggesting the significance of this study area as a
source of health and medical-related waste. At the Elukwatini study area, the magnitude of
responses from the residential households, commercial enterprises, and health care facilities
was 61 per cent, 9 per cent, and 30 per cent, respectively.
0
2
4
6
8
10
12
14
16
18
20
Residential Commercial Healthcare
Badplaas Carolina Elukwatini
Figure 5.1: Profile of the number of participants per study area

66
Table 5.1: Number of respondents per study area
Landfill sites
Residents Commercial institutions
Health care institutions
Total
Badplaas (39%) 20 (87%) (20%) 3 (13%) 0 23 (30.5%)
Carolina (35%) 18 (62%) (67%) 10 (34.5%) (12.5%) 1 (3.5%) 29 (39.0%)
Elukwatini (27%) 14 (61%) (13%) 2 (9%) 87.5%) 7 (30%) 23 (30.5%)
Out of the total respondents who participated in the study, 13 percent of them were head of
households, 21 per cent were tenants, and 28 per cent occupied management roles in the
different organisations in the vicinity of the study areas. Responses from the youth sector were
38 per cent. These numbers imply that over 72 per cent of responses were obtained from the
different households in the study areas. Regarding gender composition, 58 per cent of
respondents are women whilst 42 per cent are men.
All the respondents included in the survey have indicated that they do receive waste collection
services from the local municipality; although about 40 per cent of them mentioned that the
services provided are not regular, thus forcing many to dispose of their own waste. The latter
situation appears to be rampant amongst the different industries involved in the selected areas,
as well as in the informal settlements. Given that this category of waste is simply dumped in
open spaces and without any pre-treatment nor steps to contain the movement of particulates
and associated fluids, this poses an environmental threat of various dimensions in the selected
study areas.
67
5.3 RISK ASSESSMENT
5.3.1 Sources of waste material disposed of in unregulated landfills
Observations made during fieldwork and data collected by means of landfill analysis forms
have revealed the different sources of the type of waste commonly found at the unregulated
landfill sites. Based on the type of waste materials disposed of in the different sites, the
following patterns can be highlighted. At the Badplaas landfill site, the largest contributors were
residential households and commercial enterprises at 48 per cent and 34 per cent,
respectively. Although no responses were received from the health care facilities, there was
evidence in the form of discarded needles, bottles, tissues, gloves and plastics which shows
that such facilities also contribute to the waste stream in this study area.
At the Carolina landfill site, it was found that the different waste categories emanated from
residential households, commercial enterprises and health care facilities in the proportion of 25
per cent, 39 per cent, and 36 per cent, respectively. Thus, commercial enterprises and health
care facilities are the largest contributors of waste in the landfills around Carolina. By contrast
to the other landfill sites, the biggest sources of waste at Elukwatini are residential households
(48 per cent) and health care facilities (34 per cent). Commercial enterprises constitute only 18
per cent of the total waste stream. Figure 5.2 depicts the total proportions of sources of the
different waste materials disposed of in the landfill sites. According to this figure, residential
households contribute about 41 per cent of the waste materials generated from the local
municipality whereas the role of commercial enterprises and health care facilities is nearly the
same at 30 per cent and 29 per cent, respectively.

68
41%
30% 29%
Residential Commercial Healthcare
Figure 5.2: Total proportions of the different sources contributing to the waste stream reaching the unregulated landfill sites.
5.3.2 Classes and types of waste disposed of in the landfill sites
Given that the mass of waste observed at the disposal sites emanates from various sources, it
can be stated that these sites contain both household solid waste and potentially hazardous
waste fractions, originating from industries and health care facilities. By definition, the class of
waste usually categorised as solid waste, mainly refers to municipal solid waste comprised of
food remains; packaging materials in the form of cardboards, tins, and bottles; discarded
writing materials and newspapers; plastic bags, clothing, batteries, wooden waste, garden
waste, appliances; and a variety of household chemicals, discarded paint; as well as electronic
waste (Hill, 2004).

69
Figure 5.3 shows that households in Badplaas and Elukwatini rank superior (at 48 per cent) in
terms of the provenance of waste dumped in their landfill sites, although a larger fraction of this
waste could even be deemed as hazardous. In this instance, the most environmentally
hazardous items included, amongst other things, asbestos fibres, glasses, batteries, discarded
paint, and electronic waste. However, besides this type of municipal solid waste, another type
of waste encountered was the potentially ‘hazardous’ fractions emanating mostly from polluting
industries such as abattoirs, agricultural enterprises, fuel stations, and medical facilities in the
study areas. In order to summarise the waste categories observed in the study, figure 5.3
shows the relative quantities of each type of waste per each landfill site.
48
25
48
34
39
18
18
36 34
0%
10%
20%
30%
40%
50%
60%
70%
80%
90%
100%
Badplaas Landfill Carolina landfill Elukwatini landfill
Type
s of w
aste
The study area
Domestic Industrial Medical
Figure 5.3: Types of waste disposed of at the municipal landfills

70
Based on figure 5.3, Carolina and Elukwatini landfills appear to have high quantities of medical
waste. In particular, this waste was comprised of used syringes, leaking blood residues, sharp
instruments, gloves, pharmaceutical waste and plastics. However, of major environmental
concern is that this waste was discarded without any pre-treatment nor precautionary
measures been taken. According to DWAF (1998a), medical waste is classified as toxic and
infectious (class 6: hazardous substances). Although it may form a smaller fraction of the total
waste load discarded, it is likely to pose danger to humans and livestock around affected sites.
Furthermore, the landfills at Carolina and Badplaas received significant quantities of industrial
waste, estimated to be 39 per cent and 34 per cent, respectively. This waste was comprised of
the following classes, as deduced from the categories provided by the Hazardous Substances
Act (Act 15 of 1973):
• Class 1: Explosives
• Class 2: Gases
• Class 3: Flammable liquids
• Class 4: Flammable solids or substances
• Class 5: Oxidizing substances
• Class 6: Toxic and infectious substances
• Class 7: Radioactive substances
• Class 8: Corrosives
• Class 9: Miscellaneous substances

71
Even more hazardous, is the fact that these substances provide an environmental setting
conducive to the outbreak of sporadic fires and flow of leachate that results from the physical
and chemical disintegration of various waste substances. Moreover, when fires break out they
generate large quantities of smoke which escape into the surrounding atmosphere and
neighbouring informal settlements whilst the unrestricted flow of leachate has potential to
contaminate adjacent geological and soil formations as well as surface water bodies and
wetlands.
5.3.3 Exposure pathways in and around the landfill sites
Given the types of waste identified in the current research and the contribution made by the
different economic sectors towards the local waste streams, some exposure pathways were
identified in the affected sites. In general, exposure pathways may occur across different routes
from the source of pollution to receptors (Paustenbach (2000). According to Hill (2004), and
DEAT (2002a) exposure pathways occur in various forms, including inhalation, dermal contact,
oral route, and environmental routes. Furthermore, exposure pathways may also be divided
into primary and secondary exposures.
Primary exposure has to do with contamination through direct contact with pollutants. This may
occur through the consumption of contaminated water, inhalation of hazardous substances,
and skin infections due to air and water-borne irritants.
The natural environment may also be vulnerable to primary exposures due to the release of
toxins directly into the soil, atmosphere, and water bodies. In contrast, secondary exposure
relates to the indirect effects of environmental contamination. For instance, when livestock

72
ingests contaminated material in the landfill sites, the consumption of such livestock by humans
may provide a secondary route of infection.
Regarding the exposure of humans to health-threatening substances in the study areas, three
pathways were identified, namely, oral, dermal and respiratory routes:
• Oral route - could be through dietary and non-dietary ingestion. The dietary route refers
to ingestion of substances such as food reclaimed by informal pickers in the landfill
sites. The non-dietary fraction is comprised of unintentional ingestion of substances
due to explosions, contaminated hands and other indirect sources.
• Dermal route – occurs mainly through the skin and may lead to the development of
skin problems such as eczema or psoriasis and other complications. This exposure
pathway involves direct contact between contaminants and the skin. Furthermore, it
may be worsened by injuries sustained around the landfill sites as well as the use of
contaminated reclaimed materials. The impacts of these exposure pathways in the
selected landfills were manifested by festering wounds, scars and marks of insects
bite, observed on the skin of some of the reclaimers.
• Respiratory route – affects neighbouring rural communities and the receiving natural
environment through the movement and settling of airborne emissions such as landfill
gas, fumes, and particulates. Residents who reside within 200 m of these landfills and
informal pickers who visit these sites are at greater environmental risk.

73
By contrast, environmental contamination arises from point and non-point pathways. In the
current study, routes implicated in the dissemination of toxins include emissions into the
surrounding airscape and the fall-out of landfill gases as well as the underground flow of
leachate. Unrestrained movement of leachate has the potential to contaminate the different
layers of the soil, geological strata, ground water bodies, as well as adjacent wetlands.
Given the fact that a significant fraction of the inhabitants of rural communities in the study
areas rely on the use (44 per cent) of untreated water from local streams and boreholes (4
per cent) (see figure 5.4), the environmental impacts of leachate flow can be expected to
be greater. Equally disastrous, however, is the fact that the headwaters of most streams
located in close proximity to the Badplaas and Carolina landfill site can also be polluted by
direct surface wash triggered by rainwater and indirect run-off stemming from problem
sites.

74
48%44%
4% 4%
Tap River Borehole Reservoir
Figure 5.4: Domestic water supply for the communities
Furthermore, the analysis of bio-physical data pertaining to water samples obtained from local
streams indicates undesirable chemical and microbiological properties. These properties were
quantified through measures such as Escherichia coli counts and p H levels (see table 5.2).
The Escherichia coli counts were found to be far above the maximum tolerable limits, and pH
values signified an acidic medium. Moreover, the p H value recorded for Carolina site was 3.1,
characterising a strongly acidic environment. The danger associated with highly acidic water is
that it has the propensity to release heavy metals such as aluminium, copper or iron and is,
therefore deemed to be hazardous for human consumption and ecosystem processes (DWAF,
1998c).

75
Table 5.2: Portability of untreated water samples
Parameter Maximum limit Badplaas Carolina Elukwatini
Escherichia coli 0-10/100ml 200 11000 320000
pH 6.5 -8.2 4.3 3.1 6.8
5.3.4 Assessment and characterization of the environmental risks associated with
unregulated landfill sites
In view of the different sources, classes, and types of waste materials highlighted, as well as
exposure pathways in and around unregulated landfill sites, the associated environmental risks
were determined for the study.
By definition, environmental risk is the likelihood that the health of receiving communities and
the different components of the natural environment may be adversely affected. In other words,
the assessment and characterization of risk has to do with determining the severity and extent
to which hazardous waste materials can cause harm to human health and the environment (De
Rosa et al., 1998).
Subsequently, the data analysed in the current study was used to determine frequencies or the
number of exposures as well as the percentages characterising the severity of associated
environmental impacts. In this section, an attempt has been made to characterise existing
environmental risk at unregulated landfill sites. This analysis utilised the information regarding
the location of affected human populations, associated health and environmental effects as well
as public perceptions, in keeping with related studies conducted by Paustenbach (2000), Mehta
(2007), as well as Janis (2001).
76
In the characterization of the inherent environmental risks, specialist studies suggest the
following guidelines (De Rosa et al. 1998; Paustenbach, 2000). Firstly, the different sources,
classes and types of waste materials are identified. In the context of the current study, sources
of waste materials that were dumped in the landfills are threefold, namely, residential
households, commercial enterprises and healthcare facilities. In addition, the waste materials
disposed of in the landfills were categorized into both general waste types and hazardous
ones. Moreover, the materials recorded in landfill analysis forms included all the nine
hazardous waste classes. According to DWAF (1998a) guidelines, hazardous waste materials
are rated, in order of severity, from one to four. In this study, over 65 percent of the materials
identified were classed as extremely and highly hazardous to local public health and ecosystem
processes.
Secondly, the conditions and operations that are potentially hazardous in the landfill sites are
identified (see for instance Plate 5.1, 5.2, and 5.3). In the current study, such conditions and
operations relate to the careless disposal of potentially hazardous solid waste materials and the
lack of landfill liners or geomembranes as well as collection systems to contain the flow of
leachate. In addition, the degree of environmental risk is heightened by factors such as lack of
access control at landfill sites, the existence of nearly 60 informal waste pickers who collect
contaminated food remains and the fact that they wear no protective clothing, and the
occurrence of fires, smoke, as well as chemical explosions.

77
Thirdly, it is imperative to estimate the frequencies related to the different exposure pathways
involved (De Rosa et al. 1998; Paustenbach, 2000). Accordingly, the occurrences of exposure
pathways were calculated through an examination of the number of all instances that have
potential to cause environmental hazards per study area. These instances were determined by
analysing the data on the completed questionnaires. For instance, at Badplaas, the frequency
with which various exposure pathways occurred was found to be 53, implying just how often
the public and the environment is susceptible to existing waste-related hazards. At Carolina
and Elukwatini, the frequencies of exposure were found to be 58 and 37, respectively. It can
be seen that, in order of severity, the landfill sites at Carolina and Badplaas have the highest
exposure frequencies.

78
Plat
e 5.1:
Spo
radi
c fire
s and
oth
er w
aste
mat
erial
s at E
lukw
atin
i land
fill

79
Plat
e 5.2:
Som
e of t
he re
claim
ers a
t the
Bad
plaa
s lan
dfill

80
Plat
e 5.3:
Was
te m
ater
ials d
umpe
d at
the C
arol
ina l
andf
ill

81
Fourthly, the probabilities for the occurrence of risk are determined. In the current research, risk
probability was determined by analysing questionnaire responses which dealt with aspects
such as the proximity of residential households and water bodies to landfill sites, the
consumption of discarded food by reclaimers, the percentage of respondents relying on water
from contaminated streams, the potential for the bio-accumulation of hazardous substances in
living organisms as well as along food webs, and the frequency of personal injuries commonly
associated with the problem landfill sites. It was found that at Badplaas and Carolina the
proportion of respondents affected by existing hazards were 40 per cent and 63 per cent,
respectively. At Elukwatini this figure was 45 per cent. These percentages maybe regarded as
an indication of the magnitude of the severity of environmental impacts associated with the
unregulated landfill sites. According to the guidelines provided by DEAT (2005), environmental
risk can be estimated by multiplying the frequency of exposures by the severity of
environmental impacts. This relationship or formula is illustrated as follows:
Environmental risk = Frequency of exposures x Severity of environmental impacts
Source: Adapted from DEAT (2005:15)
The computations performed based on this formula, have revealed that the environmental risk
associated with the three unregulated landfill sites is 2 120, 3 654, and 1 665 for Badplaas,
Carolina, and Elukwatini, respectively. Table 5.4 illustrates further, how these calculations were
performed whilst table 5.5 shows categories for risk classification (DEAT, 2005: 17).

82
Based on table 5.5 the scores associated with the individual risks in the respective landfill sites
were found to exceed a risk value of 400, which is interpreted to imply very high environmental
risky situations. With these high levels of risk, the environmental management decision to be
taken involves immediate discontinuation of existing landfill operations in order to reduce the
magnitude of public vulnerability and drastic decline in environmental quality and sustainability.
45
3740
63
5358
0
10
20
30
40
50
60
70
Badplaas Carolina Elukwatini
Study area
Ris
k co
mpo
nent
Probability Exposure
Figure 5.5: Public perceptions on the probability of the various exposure pathways

83
Table 5.3: Quantitative risk assessment
Source: Adapted from DEAT (2005:15)
Table 5.4: Risk classification
Source: Adapted from DEAT (2005:15)
Landfill site Calculation Assessment
Badplaas 40 x 53 = 2120 Extreme risk
Carolina 63 x 58 = 3654 Extreme risk
Elukwatini 45 x 37 = 1665 High risk
Formula R = F x S; R= Risk; F=Frequency or Probability; S= Severity
Risk classification Risk scores
Environmental management decision
Very high risk Over 400 Discontinue the operations
High risk 200-400 Immediate corrective action
Substantial risk 70-200 Correction needed
Possible risk 20-70 Attention is needed
Low risk Under 20 Risk perhaps accepted as is

84
29%
49%
22%
Badplaas landfill Carolina landfill Elukwatini landfill
Figure 5.6: Risk distribution in the landfills of the municipality
Given the inherent risks determined per landfill site, it can be seen on figure 5.6
that the Carolina landfill site contributes 49 percent of the total health and
environmental risk determined at the selected study areas. This high level of risk
is possibly accentuated by the fact that this landfill site receives a larger
proportion of hazardous waste material from local industries and the fact that the
town itself is undergoing rapid commercial and residential growth. This trend is
less conspicuous at Elukwatini and Badplaas landfill sites, which have
contributed 28 per cent and 22 per cent, respectively, to the total environmental
risk (Figure 5.6).
However, the higher risk profile of landfill sites at Elukwatini deserves to be
highlighted and it is attributable to the relatively higher number of existing

85
healthcare facilities (see Table 5.1 & Figure 5.1). It can, therefore, be stated that
the magnitude of environmental risk in selected study areas is considerably high
and it is possibly accentuated by the failure of the current management system
of the local municipality to deal effectively with streams of waste from local
industries and health care facilities, as well as residential households – despite
the plethora of existing environmental legislation (see Table 2.2) intended to
control and contain waste mismanagement. Consequently, the research
hypothesis in the current study – that the uncontrolled and illegal dumping of
various forms of waste materials at the unregulated landfill sites in the Albert
Luthuli municipality has potential to pose greater environmental risk to
neighbouring land-users and the natural environment - is accepted.
Without such a base-line characterisation of environmental risk in the affected
areas, the provision and delivery of sustainable waste management services will
remain elusive in the foreseeable future for the municipality and affected
stakeholders.

86
CHAPTER 6
CONCLUSION AND RECOMMENDATIONS
6.1 CONCLUDING REMARKS
The current research has identified and quantified the environmental risks associated with the
unregulated landfill sites in the Albert Luthuli municipality, thus contributing to the research
pertaining to waste problems in rural areas where disposal facilities often engender
environmental nuisances due to poor environmental planning. In all cases examined for the
municipality, it has been established that environmental risk is extremely high. Without such
risk characterisation, it would be impossible to provide informed perspectives towards the
development of an integrated waste management strategy to deal with the problem landfill
sites. Chief among the multiple sources of negative environmental impacts in the disposal sites
include waste materials such as:
• Broken asbestos structures, electronic cables and toxic waste containers at the
Badplaas landfill.
• Healthcare waste in Carolina and Elukwatini and burning fires, with reclaimers
picking left overs.
• Different types of industrial waste, including plastics and other discarded
containers.

87
As outlined earlier, the movement of these materials into the biosphere, hydrosphere,
atmosphere, geosphere and the human environment, through a myriad of exposure pathways,
may lead to unfavourable human illnesses as well as impaired ecosystem processes. The
exposure pathways summarised in chapter 5 illustrate the baseline environmental status as
well as the unfavourable repercussions arising from substandard and shoddy operational
practices unfolding at the problem landfills sites. In view of these ramifications, as well as the
magnitude of the environmental risk computed, the current research hypothesis has been
accepted
6.2 RECOMMENDATIONS
From an environmental viewpoint, the goal to be achieved in the Albert Luthuli Municipality
waste management problematics should to minimise and ultimately eliminate the environmental
risks involved. As a result, some guidelines are recommended and they are at three levels or
categories.
6.2.1 Priority 1: Strategic issues
Since the Albert Luthuli Municipality does not have its own solid waste management plan, the
municipality is advised to adopt the existing integrated waste management plan developed by
the district (GSDM, 2006). The adoption of the district IWMP plan will assist in helping the
municipality to address key waste management problematic landfill sites in a holistic manner.
For instance, in the integrated waste management plan, issues of recycling and reclamation of
waste materials from the source, transfer stations and the reduction on the number of landfills
are outlined in order to reduce management challenges. However, human and financial
resources must be allocated in the integrated development planning because it appears the
municipality does not have adequate resources to deal with these challenges. Furthermore,

88
there is a need for the municipality to develop waste management by-laws which must be
enforced.
6.2.2 Priority 2: Operational issues
The findings of the study also showed that all landfills in the study areas are not legally
commissioned and operated. However, in South Africa, development actions involving the
handling, transportation, treatment and disposal of waste materials are classified as scheduled
activities which require formal environmental impact assessment (EIA) authorisations and other
precautionary measures. The purpose of the EIA is three fold. Firstly, to identify any potentially
negative environmental impacts of a development project or programme. The aim being to
avoid and reduce all undesirable environmental consequences (Lee & George, 2000).
Secondly, to ensure and guarantee that any identified environmental consequences are taken
into account during the planning and designing phase. Thirdly, to influence environmental
decision making processes throughout the entire project or programme life cycle.
Beyond EIA compliance, a long term environmental management plan (EMP) as well as a
monitoring plan are required. An EMP will describe all the appropriate actions that the
development proponents must take during the construction and development phase of
proposed actions during the implementation, construction, and decommissioning phases. In
drawing these plans, a summary of all potentially significant adverse impacts can be obtained
directly from the completed EIA report (George, 2000). In addition, the environmental
monitoring plan should provide information on aspects such as the following (UNEP, 1996):
o The nature of problems encountered
o Magnitude of impacts

89
o Their geographical extent
o Time scale
o Probability of occurrence
According to Arts and Nooteboom (1999:1) there are a range of possibilities for monitoring
nuisances such as landfill sites and these include measures such as the (1) specification of
procedures for handling of the waste, (2) provisions for spillages, (3) maintenance of protection
measures and facilities, (4) registration of generated waste and how it is disposed of, and lastly
(5) regular registration of material flows in order to curb point and non-point contamination.
The lack of these environmental planning imperatives in the Albert Luthuli Municipality has led,
unfortunately, to a situation of extremely high environmental risks to nearby vulnerable
populations and the environment. In order to help ameliorate the impacts associated with these
higher risks, it is recommended that all the problem landfill sites should be closed immediately.
However, given the rapidly accelerating streams of waste from the various areas of the
municipality, at least one of these landfill sites can be allowed as an interim measure whilst the
other two are regarded as transfer or recycling stations. The Elukwatini landfill site can be left
to continue since it is located relatively distant from human settlements and there is also a
buffer zone away from possible receptors. This will enable the municipality to only permit one
landfill site and manage it effectively. This will in turn help improve legal compliance and reduce
permitting constraints as well as operational costs.

90
6.2.3 Priority 3: General issues
It is equally imperative to recognize the fact that dealing with environmental problematics such
as those examined in the current research requires meaningful stakeholder engagement.
Stakeholder engagement or public participation is an indispensable phase of environmental
planning in South Africa and abroad. Moreover, there are numerous benefits associated with
stakeholder engagement, apart from merely communicating the inherent environmental risk
associated with the problem landfill sites in the Albert Luthuli Municipality. These benefits
include the possibility of affording interested and affected parties an opportunity to know more
about local environmental concerns, integrating stakeholder knowledge and views in project
planning and implementation, and solving problems and issues at an early stage in order to
avoid decelerating project development (George, 2000). Recognition of these benefits by the
Albert Luthuli Municipality will prevent conflict with interested and affected stakeholders and will
instead promote win-win scenarios.
Furthermore, if the affected communities can be involved meaningfully, legitimate ward waste
management councils and recycling forums can be established. This will assist the municipality
to reduce waste quantities, formalize recycling and reclamation of waste materials, and
improve the environmental conditions of the municipal area. Nevertheless, there is also a need
to engage the local business sectors, as there are considerable market and industrial
opportunities if some of the waste can be reclaimed through environmentally sound operations.

91
LIST OF REFERENCES Adani F, Tambone F and Gotti A, 2004: Biostabilization of municipal solid waste. Waste
Management. 24, 775-783.
Arts J and Nooteboom S. 1999. Environmental impact assessment: Monitoring and auditing.
Handbook of Environmental Impact Assessment, Petts, J (ed). Blackwell Science. Oxford.
Albert Luthuli Municipality, 2006: Integrated Development Plan 2005/6. Carolina: Council
Resolution.
Babbie E, 1998: The practice of social research. 8thedition. USA: Wadsworth.
Butt TE and Oduyemi KOK, 2003: A holistic approach to a concentration assessment of
hazards in the risk assessment of landfill Leachate. Environment International. 28. 12, 597-609.
Constitution of the Republic of South Africa Act, 1996 (Act 108 of 1996), Government Gazette:
Pretoria. South Africa.
Dalvie, MA and Ehrlich, R, 2006. Community mercury levels in the vicinity of peri-urban waste
disposal sites and fossil fuel burning operations. Environment International. 32. 493-499.
De Rosa CT, Hana RP, Malcolm W, Ademoyero AA, Selene CH and Jones DE, 1998: Public
health implications of environmental exposures. Environmental Health Perspectives. 106 (1):
369-378.
DEAT, 1999: White paper on Environmental Management Policy. Pretoria: Government
Printers.
DEAT, 2002a: Ecological Risk Assessment, Integrated Environmental management.
Information series 6. Department of Environmental Affairs and Tourism (DEAT). Pretoria.
92
DEAT, 2002b: Impact Significance, Integrated Environmental management. Information series
5. Department of Environmental Affairs and Tourism (DEAT). Pretoria.
DEAT, 2005: Environmental Risk Assessment Guidelines. Information Series. Department of
Environmental Affairs and Tourism (DEAT). Pretoria.
DWAF, 1998a: Waste Management Series. Minimum Requirements for Handling, Classification
and Disposal of Hazardous Waste. Second edition 1998. Department of Water Affairs and
Forestry (DWAF). Pretoria.
DWAF, 1998b. Waste Management Series. Minimum Requirements for Waste Disposal by
Landfill. Second edition 1998. Department of Water Affairs and Forestry (DWAF). Pretoria.
DWAF, 1998c. Waste Management Series. Minimum Requirements for the Monitoring of
Water Quality at Waste Management Facilities. Second edition 1998. Department of Water
Affairs and Forestry (DWAF). Pretoria.
EI-Fadel M, Findikakis AN and Leckie JO, 1995: Environmental Impacts of Solid Waste
Landfilling. Journal of Environmental Management. Department of Civil Engineering, Stanford
University. USA.
Environment Conservation Act 1989 (Act 73 of 1989; Government Gazette: Pretoria. South
Africa.
Environmental Agency, 2005: Health impact assessment of waste management:
Methodological aspects and information sources. Science Report P6-011/1/SR 1 Bristol.
Hill, M, 2004. Understanding environmental pollution. 2nd Edition. Cambridge University Press.
Cape Town.

93
Finlay A, 2007: E-Waste challenges in developing countries: South African case study.
Accessed at www.openresearch.co.za Website (Accessed 2007/05/07).
George, C . 2000. Environmental impact prediction and evaluation. Environmental assessment
in developing and transitional countries. Lee, N & George, C (Eds). New York. USA
Govan Mbeki Municipality, 2003: Assessment of existing waste management conditions and
recommendations concerning service delivery improvement in the Govan Mbeki Municipality.
Secunda: Kwezi V3 Engineers.
GSDM, 2006: Gert Sibande District Municipality Integrated Waste Management Plan. Albert
Luthuli Municipality.
Hazardous Substances Act 1973 (Act 15 of 1973); Government Gazette: Pretoria. South Africa.
Huysamen GK, 1998: Descriptive statistics for the social and behavioural sciences. Pretoria:
Van Schaik. Impact Books: Pretoria.
Institute of Geo-Science, 2007: Mpumalanga Maps, Highveld region: Baberton and Badplaas
areas. Pretoria.
Jain P, Kim H and Townsend A, 2005: Heavy metal content in soil reclaimed from a municipal
solid waste landfill. Waste Management. 25, 25-35.
Janis S, 2001: Landfill sites. Risk of adverse birth outcomes. Practice Nurse (Oct 12, 2001): p
61 (1). Thomson Gale Publishing.
Jung CH, Matsuto T and Tanaka M, 2005: Behavior of metals in ash melting and gasification-
melting of municipal sold waste (MSW). Waste Management. 25, 301-310.

94
Kassim SM and Ali M, 2005: Solid waste collection by the private sector. Tanzania:
Loughborough University.
Koshy L, Paris P, Ling S and Jones T, 2007: Bio reactivity of leachate from municipal solid
waste landfills – assessment of toxicity. Science of the Total Environment, 384 (1-3), 171-181.
Krige DS, 1998: The challenge of dismantling spatial patterns constructed by apartheid in the
Bloemfontein – Botshabelo-Thaba Nchu region. Acta Academica Supplentum 1998. 1, 174-
218.
Kum V, Sharp A and Harnpornchai N, 2005: Improving the solid waste management in Phnom
Penh City: a strategic approach. Waste Management. 25, 626-637.
Kutlaca A, 1994: Urban Waste. South Australian Geographical Journal. 93, 22-41.
Lee, N and George, C . 2000. Introduction to environmental assessment. Environmental
assessment in developing and transitional countries. Lee, N & George, C (Eds). New York.
USA
Lerche I and Paleogos EK, 2001: Environmental Risk Analysis. McGraw-Hill: New York.
Local Government: Municipal Systems Act 2000 (Act 32 of 2000); Government Gazette:
Pretoria. South Africa.
Mahlangu L, 2007: Waste Management. Accessed at http://www.enviornment.gov.za/enviro-
infor/env/wmanag.htm (Accessed 08 Jan 2008)
Matete N and Trios C, 2007: Towards zero waste in emerging countries – A South African
experience. Waste Management ( In press).

95
McLean M, Watson HK and Muswema A, 2003: Veterinary waste disposal: Practice and
policy in Durban, South Africa (2001-2003). Accessed at www.sciencedirect.com Website, 01
Jun 2006)
Mehta MD, 2007: Risk assessment and sustainable development: towards a concept of
sustainable risk. Franklin Pierce Law Center.
Middleton N, 2004: The Global Casino: An introduction to environmental issues. Third edition.
Oxford University Press Inc, New York.
Mpumalanga DACE, 2003: Mpumalanga State of the Environment Report. Mpumalanga
Department of Agriculture, Conservation and Environment. Nelspruit: Mpumalanga.
Mpumalanga DALA, 2006: Integrated Resource Information Report: Albert Luthuli.
Mpumalanga Provincial Government: DALA.
Mutuki A, Mwanthi LON and Ernest DT, 1997: The present and future status of municipal solid
waste management in Nairobi. Waste Management. 7, 345-353.
Nachmias F, Nachmias D and Arnold E, 1992: Research methods in the social sciences. 4th
edition. Great Britain .St Martin’s.
National Environmental Management Act 1998 (Act 107 of 1998); Government Gazette:
Pretoria. South Africa.
National Environmental Management – Air Quality Act (Act 39 of 2004), Government Gazette:
Pretoria. South Africa
Nissim L, Shohat T and Inbar Y, 2005: From dumping to sanitary landfills-solid waste
management in Israel. Waste management . 25, 323-327

96
Nriagu J, Jinabhai CC, Naido R and Coutsoudis A, 1997: Lead poisoning of children in Africa II.
KwaZulu Natal, South Africa. The Science of the Total Environment. 197, 1-11.
Paustenbach DJ, 2000: The practice of exposure assessment: a state-of-the-art review. 3
(112), 179-291.
Rosqvist H, Dahlin T, Fourie A, Rohrs L, Bengtsson A and Larsson M, 2003: Mapping of
leachate plumes at two landfill sites in South Africa using geoelectrical imaging. WITS,
Johannesburg. RSA.
Schoeman JJ and Schroder HE, 1994: Occupational Hygiene. Juta Publishing. Johannesburg.
Slack RJ, Gronow JR and Voulvoulis N, 2005: Household hazardous waste in municipal
landfills: contaminants in leachate. Science of the Total Environment. 337 (1-3), 119-137.
South African YearBook, 2000/01. South Africa. 7th Edition. ISSN 0302-0681.
Strachan L, Stretch D, Laister G and Saner M, 2007: Odour trails from landfill sites. School of
Civil Engineering, Durban Solid Waste and Hindoc (Pty) Ltd: University of Natal. South Africa.
Sugni M, Calcaterra E and Adani F, 2005: Biostabilization-biodrying of municipal solid waste by
inverting air-flow. Bioresource Technology. 96, 1331-1337.
Sykes P, Jones K and Wildsmith JD, 2007: Managing the potential public health risks from
bioaerosol liberation at commercial composting sites in the UK: An analysis of the evidence
base. Resources, Conservation and Recycling. Corrected Proof.
Thomson G, 1999: Landfill Liners Not Always Necessary, Claims South African Specialist.
Hazardous Waste News. Info Trac. 21, 44-65.

97
United Nations, 2008: UN Mlillenium Development Goals. (http://www.un.org) Website
accessed 19th May 2008.
UNEP, 1996. Environmental impact assessment, Training Resource Manual. United Nations
Environmental Program, Nairobi.
Van der Merwe H and Steyl L, 2005: Solid waste management in intensively farmed rural
areas: a Western Cape case study. Acta Academica. 37 (3), 184-211.
White CJ 2003: Research Methods and Techniques. Study guide for B. Tech Education
Management students.
Yong-Chung J, Cargro L, Oh-Sub Y and Hwidong K 2005: Medical waste management in
Korea. Journal of Environmental Management. 80, 107-115.

98
ANNEXURE A: SITE ANALYSIS FORM
This tool will be completed by the researcher or the research team and the information collected shall be used only for academic purposes. Anonymity is guaranteed to all participants , according to DWAF, (2001)
To be completed by the researcher or his research team
1. Name of the waste disposal site
2. Locality of the waste disposal site
3. Responsible person/ authority
4. Certificate of registration/ approval
5. Date of on which operations commenced
6. What is the distance from the waste facility to the nearest residential area
7. What is the distance from the waste facility to the nearest industries
8. What is the distance from the waste facility to the nearest water bodies
9. List or mention the names of the nearest facilities in (6,7 & 8) .......................................................................................................................................................................
10. Is the waste facility located within or close to the following features? ( state yes/ no)
10.1 A drainage area
10.2 An area with a shallow or visible water table
10.3 100m of source of surface water
10.4 1km from a wet land or within a wetland
11. What type of waste reclamation activities that take place at the waste facility (mark with an x)
• At source • No salvaging
• Recycling installation • Formal salvaging
• Contractor
• Informal salvaging
12. Is the waste disposal site lawfully permitted or registered?
13. Has risk assessment (RA) or EIA been once conducted on the waste disposal site?
14. If yes to question 13, give the year and the person/ authority that performed the exercise
15. Is waste covering done after disposal? Yes no
16. If yes, how often? Daily Weekly Monthly Annually During decommissioning
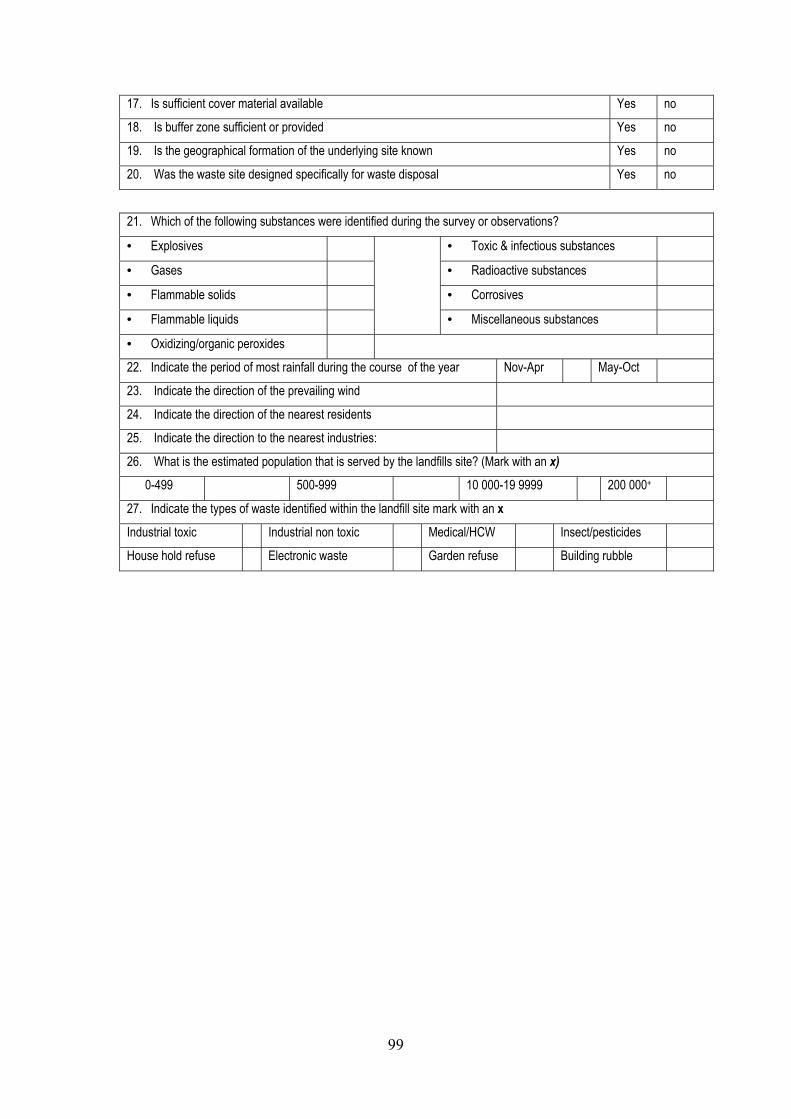
99
17. Is sufficient cover material available Yes no
18. Is buffer zone sufficient or provided Yes no
19. Is the geographical formation of the underlying site known Yes no
20. Was the waste site designed specifically for waste disposal Yes no
21. Which of the following substances were identified during the survey or observations?
• Explosives • Toxic & infectious substances
• Gases • Radioactive substances
• Flammable solids • Corrosives
• Flammable liquids
• Miscellaneous substances
• Oxidizing/organic peroxides
22. Indicate the period of most rainfall during the course of the year Nov-Apr May-Oct
23. Indicate the direction of the prevailing wind
24. Indicate the direction of the nearest residents
25. Indicate the direction to the nearest industries:
26. What is the estimated population that is served by the landfills site? (Mark with an x) 0-499 500-999 10 000-19 9999 200 000+
27. Indicate the types of waste identified within the landfill site mark with an x
Industrial toxic Industrial non toxic Medical/HCW Insect/pesticides
House hold refuse Electronic waste Garden refuse Building rubble

100
ANNEXURE B: RESEARCH QUESTIONNAIRE
This tool will be completed by various role players as specified in each part, and the information collected shall be used only for academic purposes. Anonymity is guaranteed to all participants, according to DWAF, (2001)
To be completed by the respondents from one of the three strata selected
1. Locality/ township
2. Type of an institution
3. Total population (family)
4. Capacity of the respondent
5. Gender of the respondent
6. Age range of respondent 18-25 26-33 34-41 42-49 50+
Health care Veterinary services
Industry House hold/residential
7. What type of services or operations is performed in your institution? Laboratory Other (specify) :
8. What type of waste items are produced in your institution or household?
9. Indicate you answer to the following statements by filling Yes or No on the appropriate spaces
10. Does the municipality collect waste from your residence?
11. Does the municipality collect waste from your industries?
12. Does the municipality collect waste from your health care institutions?
13. According to your knowledge, does the municipality collect waste from the nearest hospitals, clinics or mortuaries?
14. According to your knowledge, does the municipality collect waste from the nearest industries?
15. What type of water supply is used by you/your local community?
16. Reticulated/ tap water supplied by the municipality
17. Spring/river waster
18. Bore hole
19. Tankers/reservoirs
20. Combination of various waster sources
21. Do you know or have heard of any person injured at the dumping site?
If yes, what type of problem/injury:
List the composition or items that form part of waste generated in your institution
What is the situation of waste management in your local municipal area or township?
What improvements would you recommend for your local area/municipality/dumping sites?
Give any waste related information that you feel it can contribute to this study …………………………………………………………………………………………………………………………………………………………… …………………………………………………………………………………………………………………………………………………………… …………………………………………………………………………………………………………………………………………………………… ……………………………………………………………………………………………………………………………………………………………