Embed Size (px)
Citation preview

Environmental Scan Report
Loddon Mallee Region

Environmental Scan Report: Loddon Mallee Region
Page 2 of 123 Date: 14 September 2020 FINAL 2.0 Public Version
Table of contents
1. Introduction ....................................................................................................................................................... 5
2. Purpose ............................................................................................................................................................. 5
3. Structure of document ..................................................................................................................................... 5
4. Environmental scan process .......................................................................................................................... 6
5. Regional Context .............................................................................................................................................. 6
6. Natural Environment ........................................................................................................................................ 9
6.1 Climate .............................................................................................................................................................. 10
6.1.1 Average Temperatures ..................................................................................................................................... 10
6.1.2 Rainfall .............................................................................................................................................................. 11
6.1.3 Climate Change ................................................................................................................................................ 15
6.2 Land Use .......................................................................................................................................................... 17
6.3 Bushfire Risk .................................................................................................................................................... 19
6.3.1 Bushfire prone areas ........................................................................................................................................ 20
6.4 Waterways ........................................................................................................................................................ 21
6.4.1 Floods ............................................................................................................................................................... 25
6.5 Geology ............................................................................................................................................................ 28
7. Built Environment ........................................................................................................................................... 33
7.1 Information and telecommunications ................................................................................................................ 33
7.2 Energy .............................................................................................................................................................. 35
7.2.1 Energy distribution ............................................................................................................................................ 35
7.2.2 Electricity .......................................................................................................................................................... 36
7.2.3 Solar and Wind ................................................................................................................................................. 39
7.2.4 Gas ................................................................................................................................................................... 40
7.2.5 Liquid fuels ....................................................................................................................................................... 41
7.3 Food, grocery and manufacturing .................................................................................................................... 41
7.3.1 Food supply chain ............................................................................................................................................ 42
7.4 Transport .......................................................................................................................................................... 43
7.4.1 Transport infrastructure .................................................................................................................................... 44
7.4.2 Roads ............................................................................................................................................................... 44
7.4.3 Rail .................................................................................................................................................................... 53
7.4.4 Air ..................................................................................................................................................................... 55
7.5 Water and wastewater ...................................................................................................................................... 55
7.5.1 Water ................................................................................................................................................................ 55
7.5.2 Emergency water supply points ....................................................................................................................... 60
7.5.3 Wastewater ....................................................................................................................................................... 60
7.6 Waste and recycling ......................................................................................................................................... 62
7.6.1 Landfill .............................................................................................................................................................. 62
7.6.2 Recycling .......................................................................................................................................................... 64

Environmental Scan Report: Loddon Mallee Region
Page 3 of 123 Date: 14 September 2020 FINAL 2.0 Public Version
7.7 Government services ........................................................................................................................................ 64
7.7.1 Prisons and community correctional facilities................................................................................................... 64
7.7.2 Law courts ........................................................................................................................................................ 65
7.8 Emergency services ......................................................................................................................................... 66
7.8.1 Ambulance stations .......................................................................................................................................... 66
7.8.2 Police stations .................................................................................................................................................. 67
7.8.3 Fire stations, lookouts and refuges .................................................................................................................. 67
7.8.4 SES ................................................................................................................................................................... 74
7.8.5 Volunteer Coast Guard Flotillas ....................................................................................................................... 75
7.8.6 Emergency Coordination Facilities ................................................................................................................... 75
7.9 Other infrastructure assets and industries ........................................................................................................ 77
7.9.1 Infrastructure and industries ............................................................................................................................. 77
7.9.2 Dependencies ................................................................................................................................................... 78
7.9.3 Tourism infrastructure ....................................................................................................................................... 79
7.9.4 Cladding fire safety risk .................................................................................................................................... 79
8. Social Environment ........................................................................................................................................ 81
8.1 Population ......................................................................................................................................................... 81
8.1.1 Current population ............................................................................................................................................ 81
8.1.2 Population forecast ........................................................................................................................................... 83
8.2 Vulnerability indicators ...................................................................................................................................... 86
8.2.1 The young and the elderly ................................................................................................................................ 88
8.2.2 Those needing assistance ................................................................................................................................ 89
8.3 Diversity ............................................................................................................................................................ 90
8.3.1 Birthplaces and languages spoken .................................................................................................................. 90
8.3.2 Income and housing ......................................................................................................................................... 94
8.4 Education .......................................................................................................................................................... 95
8.4.1 Educational institutions ..................................................................................................................................... 95
8.4.2 Educational Level ............................................................................................................................................. 97
8.5 Health ............................................................................................................................................................... 98
8.5.1 Hospitals and health centres ............................................................................................................................ 98
8.5.2 Aged Care....................................................................................................................................................... 101
8.6 Cultural values and assets ............................................................................................................................. 102
8.6.1 Aboriginal cultural heritage assets ................................................................................................................. 102
8.7 Volunteerism ................................................................................................................................................... 105
9. Economic Environment ............................................................................................................................... 106
9.1 Economic situation ......................................................................................................................................... 106
9.1.1 Key economic indicators ................................................................................................................................. 107
9.1.2 Industry and employment ............................................................................................................................... 109

Environmental Scan Report: Loddon Mallee Region
Page 4 of 123 Date: 14 September 2020 FINAL 2.0 Public Version
9.2 Banking and finance ....................................................................................................................................... 110
9.3 Political and legal factors ................................................................................................................................ 111
10. Operational Learnings ................................................................................................................................. 112
11. Data sources ................................................................................................................................................. 115
12. List of Abbreviations .................................................................................................................................... 122
13. Document information ................................................................................................................................. 123

Environmental Scan Report: Loddon Mallee Region
Page 5 of 123 Date: 14 September 2020 FINAL 2.0 Public Version
1. Introduction
Planning by agencies has traditionally focused on each hazard type e.g. fire, flood or storm, using risk-
based decision-making processes to inform preparedness, response, relief and recovery (PPRR) activities.
Victorian emergency management arrangements also support agencies and relevant stakeholders to work
together across all hazard types. This includes creating opportunities to identify and manage priorities to
effectively manage risks, together with communities and organisations from within and outside the
emergency management sector.
In 2020, the Emergency Management Act 2013 was amended by the Emergency Management Legislation
Amendment Act 2018. In response to this, new State, Regional and Municipal plans are required to comply
with the new legislation. Some of the key inclusions are information on regional context, and mitigation,
response and recovery strategies, along with supporting roles and responsibilities for regional collaboration.
The new arrangements also require the establishment of regional emergency management planning
committees (REMPCs) and the preparation of regional emergency management plans (REMPs).
Emergency Management Victoria (EMV) is providing guidance to the REMPCs for each of the eight
emergency management regions in Victoria to assist with the development of updated regional plans.
2. Purpose
The aim of this is to produce a document containing consistent, accurate contextual data and information
for Loddon Mallee Region (LMR) to use as a resource when preparing the context section of the regional
emergency management plans.
The outputs from this analysis will link directly to the context section of the REMPs. The standard headings
from the State plan reference natural, built, economic and social environments for consideration. While the
relative importance of each of these will vary between regions, they will still provide a good overview of the
key regional context.
3. Structure of document
The structure of this document first summarises the process used to investigate the environment under
which each region operates. This environmental scanning process was undertaken using a PESTEL
analysis (Political, Economic, Social, Technological, Environmental and Legal). The content of the document
then explores the data and information found, grouped under the standard headings from the State
Emergency Management Plan, Natural, Built, Social and Economic environments. Each of these has sub-
headings relevant to the region. Finally, a data source section shows the data and information attribution
and summarises the metadata for each source used in the document. This gives context to the data and
information as well as an assessment of reliability, credibility and currency of the data.

Environmental Scan Report: Loddon Mallee Region
Page 6 of 123 Date: 14 September 2020 FINAL 2.0 Public Version
4. Environmental scan process
The categories of a PESTEL analysis are often used for business analysis to cover all aspects of context
for a project or business proposal to expand the thinking outside of the standard considerations. This will
broaden the scope of the emergency management sector to cover all emergencies and all communities.
Further detail for each key area is in the image below.
Figure 1. PESTEL analysis1
The broad environmental scanning process ensured that all impacts on the region were considered,
including those influences outside of the regional boundaries.
5. Regional Context
The LMR is the traditional home of the First Peoples of the Millewa-Mallee being Latji Latji, Ngintait and
Nyeri Nyeri Traditional Owners, the Wotjobaluk, Jaadwa, Jajawadjali, Wergaia, Jupagulk, Dja Dja Wurrung,
Taungurung and Yorta Yorta peoples2, and is one of eight regions for emergency management in Victoria,
declared under Section 63 of the Emergency Management Act 2013.
1 B2U (2020): https://www.business-to-you.com/scanning-the-environment-pestel-analysis/
2 ACHRIS (2020): https://achris.vic.gov.au/weave/wca.html

Environmental Scan Report: Loddon Mallee Region
Page 7 of 123 Date: 14 September 2020 FINAL 2.0 Public Version
Figure 2. Victorian Emergency Management Regions
The LMR shares boundaries with the Grampians, Hume and North West Metropolitan Regions. It covers
58,960 square kilometres (26% of Victoria) and includes 10 local government areas (LGAs).
Figure 3. LMR including LGA boundaries3
The LGAs located within the LMR, and their corresponding populations (2019), are:
3 DJPR (2020): https://www.rdv.vic.gov.au/victorias-regions/loddon-mallee

Environmental Scan Report: Loddon Mallee Region
Page 8 of 123 Date: 14 September 2020 FINAL 2.0 Public Version
Figure 4. Population of LMR by LGA4
The LMR is the largest of Victoria’s regions, stretching north-west from the outskirts of Melbourne to the
Murray River and South Australian border. The region can be split into two sub-regions – Mallee and Loddon
Campaspe.
It is one of the five regions which borders metropolitan Melbourne, with some areas in the south (parts of
the Loddon Campaspe sub-region) falling within Melbourne’s peri-urban fringe. As a result, these areas
experience elevated population and development pressures on landscapes, agricultural, waterway and
environmental assets. For the areas falling in the south-western part of the region (the Mallee sub-region)
there are fewer development pressures, with more rural landscapes and smaller towns.
Mallee sub-region
The Mallee sub-region includes the LGAs of Buloke Shire, Gannawarra Shire, Mildura Rural City and Swan
Hill Rural City. With direct borders to both New South Wales and South Australia, the area has direct
functional, economic and social links to these adjoining states.5 The main regional centre is Mildura, with
other regional centres and towns including Swan Hill and Kerang.
The sub-region is dominated by agriculture (irrigated and dryland farming) and agriculture-related
manufacturing, with three of the four LGAs bordering the Murray River.6
4 DJPR (2020): https://www.rdv.vic.gov.au/information-portal/table-and-chart
5 DJPR (2014): https://www.planning.vic.gov.au/__data/assets/pdf_file/0024/94650/Loddon-Mallee-North-Regional-Growth-Plan-May-2014.pdf
6 DJPR (2014): https://www.planning.vic.gov.au/__data/assets/pdf_file/0024/94650/Loddon-Mallee-North-Regional-Growth-Plan-May-2014.pdf
339,412
6,124
37,622
118,093
13,186
10,472
7,504
50,231
55,777
19,754
20,649
Total Loddon Mallee Region
Buloke Shire
Campaspe Shire
City of Greater Bendigo
Central Goldfields Shire
Gannawarra Shire
Loddon Shire
Macedon Ranges Shire
Mildura Rural City
Mount Alexander Shire
Swan Hill Rural City

Environmental Scan Report: Loddon Mallee Region
Page 9 of 123 Date: 14 September 2020 FINAL 2.0 Public Version
Loddon Campaspe sub-region
The Loddon Campaspe sub-region includes the LGAs of Greater Bendigo, Campaspe Shire, Central
Goldfields Shire, Loddon Shire, Macedon Ranges Shire and Mount Alexander Shire. It is located in the
geographic centre of Victoria, making it accessible to and from Melbourne and surrounding regional areas.7
The main regional hub is Bendigo, while other regional centres include Echuca, Castlemaine, Gisborne,
Maryborough and Kyneton.
Rural areas of the sub-region support a variety of farming operations, while the urban centre of Bendigo
provides education and healthcare facilities.
Figure 4. Mallee and Loddon Campaspe sub-regions including LGA boundaries8
6. Natural Environment
The LMR is home to a diversity of natural landscapes, ranging from Mallee wilderness, to the native
grasslands of riverine plains and forested slopes of the Great Dividing Range. These landscapes represent
significant tourism drawcards, as well as habitats for a wide variety of plant and animal species.
The Murray River system, including its tributaries, wetlands and lakes, is the environmental, cultural and
economic lifeblood of much of the north of the region, with important riverine and wetland ecosystems along
the major rivers and their floodplains.9 A number of these wetlands are included on international migratory
bird and wetland conservation agreements.
7 DJPR (2014): https://www.planning.vic.gov.au/__data/assets/pdf_file/0033/94668/Loddon-Mallee-South-Regional-Growth-Plan-May-2014.pdf
8 DJPR (2014): https://www.rdv.vic.gov.au/victorias-regions/loddon-mallee
9 DJPR (2014): https://www.planning.vic.gov.au/__data/assets/pdf_file/0024/94650/Loddon-Mallee-North-Regional-Growth-Plan-May-2014.pdf

Environmental Scan Report: Loddon Mallee Region
Page 10 of 123 Date: 14 September 2020 FINAL 2.0 Public Version
The Mallee sub-region possesses a number of high value environmental assets, including the Hattah-
Kulkyne, Murray Sunset and Gunbower National Parks, the Big Desert Wilderness Park, and the Gunbower
Forest and Kerang Ramsar wetland sites.10
The Loddon Campaspe sub-region is home to the Greater Bendigo National Park, the Ramsar-listed
Gunbower Forest National and State Parks and Boort Lakes.11
6.1 Climate
6.1.1 Average Temperatures
Temperatures vary between the north and south of the region, with the north experiencing hot summers
with average maximum temperatures of 30° and mild winters with average temperatures around 10°.12 The
southern part of the region experiences cool and wet winters and warm, dry summers, with average
maximum temperatures of less than 25° in the elevated southern regions.13 Frosts are common throughout
the region.
Average maximum (max) and minimum (min) temperatures from a 30-year climate period from (1961-1990)
are outlined below:
Table 1. Seasonal average temperatures for LMR by LGA14
LGA Summer (°C) Winter (°C)
Max Min Max Min
Buloke Shire 30.0 14.0 14.6 4.4
Campaspe Shire 29.3 14.1 13.9 3.9
Central Goldfields Shire 27.8 12.2 12.9 3.5
City of Greater Bendigo 28.2 13.4 13.1 3.9
Gannawarra Shire 30.5 14.7 14.8 4.5
Loddon Shire 29.4 13.9 13.9 4.2
Macedon Ranges Shire 24.1 11.2 10.3 3.2
Mildura Rural City 31.0 14.8 15.9 5.2
Mount Alexander Shire 27.0 12.0 12.0 3.1
Swan Hill Rural City 31.2 15.0 15.6 4.6
LMR Average 28.9 13.5 13.7 4.1
10 DJPR (2014):https://www.planning.vic.gov.au/__data/assets/pdf_file/0033/94668/Loddon-Mallee-South-Regional-Growth-Plan-May-2014.pdf
11 DJPR (2014):https://www.planning.vic.gov.au/__data/assets/pdf_file/0033/94668/Loddon-Mallee-South-Regional-Growth-Plan-May-2014.pdf
12 DELWP (2015): https://www.climatechange.vic.gov.au/__data/assets/pdf_file/0023/60746/Loddon-Mallee.pdf
13 DELWP (2015): https://www.climatechange.vic.gov.au/__data/assets/pdf_file/0023/60746/Loddon-Mallee.pdf
14 BOM (2020): http://www.bom.gov.au/climate/averages/maps.shtml

Environmental Scan Report: Loddon Mallee Region
Page 11 of 123 Date: 14 September 2020 FINAL 2.0 Public Version
6.1.2 Rainfall
The north of the region is dry, with average annual rainfall of 330mm, while rainfall is considerably higher in
the south, with Macedon Ranges experiencing between 750mm and 800mm annually.15 Since the 1960s,
average rainfall has declined, especially in autumn.
Table 2. Annual and seasonal average rainfalls for LMR by LGA16
LGA Mean Rainfall (mm) 17
Annual Summer Autumn Winter Spring
Buloke Shire 370.0 72.2 89.7 106.6 101.5
Campaspe Shire 461.0 94.2 114.2 136.4 116.2
Central Goldfields Shire 540.4 102.8 127.9 166.7 143.0
City of Greater Bendigo 540.7 104.0 129.7 167.9 139.1
Gannawarra Shire 371.9 77.9 91.5 107.3 95.1
Loddon Shire 437.7 83.6 108.9 129.2 115.9
Macedon Ranges Shire 793.0 146.5 187.6 245.8 213.0
Mildura Rural City 306.3 58.6 71.0 90.4 86.3
Mount Alexander Shire 634.4 119.0 149.4 200.9 165.1
Swan Hill Rural City 336.7 70.7 83.5 91.8 90.8
Average 479.2 93.0 115.3 144.3 126.6
15 DELWP (2015): https://www.climatechange.vic.gov.au/__data/assets/pdf_file/0023/60746/Loddon-Mallee.pdf
16 DELWP (2015): https://www.climatechange.vic.gov.au/__data/assets/pdf_file/0023/60746/Loddon-Mallee.pdf
17 http://www.bom.gov.au/climate/averages/maps.shtml

Environmental Scan Report: Loddon Mallee Region
Page 12 of 123 Date: 14 September 2020 FINAL 2.0 Public Version
Figure 5. Annual rainfall Victoria (1900-2019)18
Intensity–Frequency–Duration (IFD) design rainfall intensities (mm/h) or design rainfall depths (mm)
corresponding to selected standard probabilities, are based on the statistical analysis of historical
rainfall. Design rainfall are used in the design of infrastructure including gutters, roofs, culverts, stormwater
drains, flood mitigation levees, retarding basins and dams. They can also be used to assess the severity of
observed rainfall events.
The following tables summarise the design rainfalls that could be of interest for critical infrastructure
planning. They give an indication of heavy rainfall probability across the region and can be used as potential
triggers for response based on observed or forecast rainfall.19 The standard probabilities shown here for
reference are 10% annual exceedance probability (AEP) equivalent to 1 in 10 year average recurrence
interval (ARI) and 1% AEP, equivalent to 1 in 100 year ARI.
18
http://www.bom.gov.au/climate/change/index.shtml#tabs=Trackerandtracker=timeseriesandtQ=graph%3Drain%26area%3Dvic%26season%3D01
12%26ave_yr%3D0
19 Further values can be obtained from: http://www.bom.gov.au/water/designRainfalls/revised-ifd/

Environmental Scan Report: Loddon Mallee Region
Page 13 of 123 Date: 14 September 2020 FINAL 2.0 Public Version
Table 3. Design rainfalls for LMR by LGA – 5 Min20 21
LGA 5 min 10% AEP (mm) 5 min 1% AEP (mm)
Mean Min Max Range Mean Min Max Range
Buloke Shire 9.9 8.9 10.7 1.7 18.2 15.7 19.9 4.2
Campaspe Shire 9.6 8.9 10.9 2.0 16.6 15.1 18.9 3.9
Central Goldfields Shire 8.7 8.3 9.4 1.1 15.2 14.2 16.8 2.6
City of Greater Bendigo 9.8 9.2 10.4 1.2 17.4 16.5 18.2 1.7
Gannawarra Shire 9.6 9.2 10.4 1.2 17.6 16.5 19.4 2.9
Loddon Shire 9.7 8.9 10.2 1.4 17.7 16.0 19.0 3.1
Macedon Ranges Shire 9.1 8.3 9.7 1.4 15.1 13.5 16.9 3.3
Mildura Rural City 8.9 8.3 9.6 1.4 16.3 14.4 18.4 4.0
Mount Alexander Shire 9.4 8.8 10.0 1.2 16.4 15.2 17.5 2.3
Swan Hill Rural City 9.7 9.2 10.3 1.0 18.2 17.0 19.5 2.4
Table 4. Design rainfalls for LMR by LGA – 1hr22 23
LGA 1hr 10% AEP (mm) 1hr 1% AEP (mm)
Mean Min Max Range Mean Min Max Range
Buloke Shire 29.9 26.6 32.3 5.7 55.0 46.7 60.5 13.8
Campaspe Shire 29.4 27.1 33.3 6.2 50.7 46.5 58.2 11.7
Central Goldfields Shire 26.2 24.9 28.2 3.3 45.8 42.8 50.6 7.9
City of Greater Bendigo 29.8 27.9 31.9 4.1 53.1 50.0 55.6 5.6
Gannawarra Shire 29.4 28.1 31.4 3.3 53.4 49.9 58.6 8.7
Loddon Shire 29.5 26.9 31.1 4.2 53.7 48.2 57.9 9.7
Macedon Ranges Shire 27.6 25.2 29.2 4.1 45.9 41.3 51.1 9.8
Mildura Rural City 27.1 24.8 29.8 4.9 49.4 43.4 57.2 13.9
Mount Alexander Shire 28.3 26.4 30.0 3.6 49.9 46.1 52.8 6.7
Swan Hill Rural City 29.8 28.1 31.4 3.4 55.9 51.9 60.6 8.7
20 BOM (2016): http://www.bom.gov.au/water/designRainfalls/revised-ifd/
21 The standard probabilities shown here for reference are 10% annual exceedance probability (AEP) equivalent to 1 in 10 year average
recurrence interval (ARI) and 1% AEP, equivalent to 1 in 100 year ARI
22 BOM (2016): http://www.bom.gov.au/water/designRainfalls/revised-ifd/
23 The standard probabilities shown here for reference are 10% annual exceedance probability (AEP) equivalent to 1 in 10 year average
recurrence interval (ARI) and 1% AEP, equivalent to 1 in 100 year ARI

Environmental Scan Report: Loddon Mallee Region
Page 14 of 123 Date: 14 September 2020 FINAL 2.0 Public Version
Table 5. Design rainfalls for LMR by LGA – 1 Day24 25
LGA 1 day 10% AEP (mm) 1 day 1% AEP (mm)
Mean Min Max Range Mean Min Max Range
Buloke Shire 68.6 64.8 74.0 9.2 107.2 95.8 123.8 28.0
Campaspe Shire 69.7 65.5 79.5 14.0 107.2 100.6 126.2 25.6
Central Goldfields Shire 71.8 67.9 79.3 11.4 109.9 102.5 119.3 16.8
City of Greater Bendigo 74.1 68.7 86.6 17.9 111.0 102.7 130.1 27.5
Gannawarra Shire 66.8 63.4 69.4 6.0 105.1 98.7 113.4 14.7
Loddon Shire 69.2 63.9 80.1 16.2 104.5 99.4 117.3 17.9
Macedon Ranges Shire 89.5 79.1 107.6 28.6 141.8 124.2 170.2 46.1
Mildura Rural City 62.7 56.3 70.1 13.9 109.0 95.7 127.7 31.9
Mount Alexander Shire 77.9 68.1 90.0 21.9 119.7 103.3 136.1 32.7
Swan Hill Rural City 67.7 63.7 72.7 9.0 108.1 99.3 118.8 19.5
For the LMR, there is little variation in the shorter duration events which are generally driven by convective
activity. Statistical analysis shows that that patterns of heavy rainfall from these storm events are similar
across the region. This is shown by similar mean design rainfall values across all LGAs and low ranges
between maximums and minimums for the selected probabilities.
The largest difference is observed in the longer duration events, where regions with variable topography
experience higher rainfall.
It is expected that the impact of climate change will be to have less days with rain, but higher intensity rain
events when these do happen. This is because a warmer atmosphere can hold more moisture. Australia’s
heavy rainfall patterns have a high natural variability and some sites are witnessing a larger increase in
heavy rainfall for shorter durations that may increase the risk of flash flooding.26
For the LMR, despite an overall trend of declining rainfall, it is expected that more of the rain which does fall
will be in increasingly extreme downpours, increasing the incidence of flood events.27
Rain Days >5mm by LGA
This calculation is based on the standard 30-year reference climate period (1961–1990). This threshold was
chosen as 5mm is the threshold to exceed canopy and interception losses in the Keetch-Byram Drought
Index, which is used to estimate soil moisture as a surrogate for heavy fuel availability in fires.
24 BOM (2016): http://www.bom.gov.au/water/designRainfalls/revised-ifd/
25 The standard probabilities shown here for reference are 10% annual exceedance probability (AEP) equivalent to 1 in 10 year average
recurrence interval (ARI) and 1% AEP, equivalent to 1 in 100 year ARI
26 BOM (2020): http://www.bom.gov.au/state-of-the-climate/australias-changing-climate.shtml
27 DELWP (2015): https://www.climatechange.vic.gov.au/__data/assets/pdf_file/0023/60746/Loddon-Mallee.pdf

Environmental Scan Report: Loddon Mallee Region
Page 15 of 123 Date: 14 September 2020 FINAL 2.0 Public Version
Table 6. LMR Rain Days >5mm by LGA28
LGA Rain Days >5mm (days)
Mean Min Max Range
Buloke Shire 23 22 24 2
Campaspe Shire 28 24 34 10
Central Goldfields Shire 18 14 25 11
City of Greater Bendigo 32 27 44 17
Gannawarra Shire 38 30 57 27
Loddon Shire 20 18 22 4
Macedon Ranges Shire 23 20 31 11
Mildura Rural City 52 44 62 18
Mount Alexander Shire 27 23 35 12
Swan Hill Rural City 33 30 42 12
LMR Average 29.4 25.2 37.6 12.4
6.1.3 Climate Change
The LMR has been getting warmer and dryer, with the rate of warming increasing since 1960 and rainfall
declining. In the future, the region can expect:29
• Temperatures to continue to increase year-round;
• More frequent and intense downpours;
• Less rainfall in autumn, winter and spring;
• Fewer frosts;
• More hot days and warm spells; and
• Harsher fire weather and longer fire seasons.
By 2050, as a result of these changes, the climate of Bendigo is expected to be more like the climate of
Shepparton currently, while the climate of Echuca will be more like the current climate of Swan Hill, Swan
Hill will be more like Hay and Mildura more like Menindee.30
28 BOM (2016): http://www.bom.gov.au/jsp/ncc/climate_averages/raindays/index.jsp?period=anandproduct=5mm#maps
29 DELWP (2015): https://www.climatechange.vic.gov.au/__data/assets/pdf_file/0023/60746/Loddon-Mallee.pdf
30 DELWP (2015): https://www.climatechange.vic.gov.au/__data/assets/pdf_file/0023/60746/Loddon-Mallee.pdf

Environmental Scan Report: Loddon Mallee Region
Page 16 of 123 Date: 14 September 2020 FINAL 2.0 Public Version
Figure 6. Loddon Mallee climate in 205031
The potential impacts of these changes in climate affect all aspects of the natural, built, social and economic
environments of the region, including primary production, infrastructure, tourism, health and community and
the natural environment, as outlined below:32
Primary production
The impacts on primary production are likely to be acutely felt in the LMR, with agriculture being the largest
employer across dryland farming, irrigated horticulture, fruit processing, irrigated agriculture including dairy
processing, and viticulture. Horticulture and vegetables are highly sensitive to reduced water availability and
increased salinity, while changes in temperature will also affect planting and harvesting times. Intensive
animal industries will also need to provide increased protection for stock from extreme temperatures.
Infrastructure
Critical services such as power, water, sewerage and telecommunications will be susceptible to the more
extreme weather events caused by the changing climate. Transport infrastructure, which underpins the
region’s economy, will also be increasingly exposed to flooding and increased heat loading, with long hot
spells weakening road surfaces and exposure to heat events resulting in road rutting and cracking.
Health and community
31 DELWP (2015): https://www.climatechange.vic.gov.au/__data/assets/pdf_file/0023/60746/Loddon-Mallee.pdf
32 DELWP (2015): https://www.climatechange.vic.gov.au/__data/assets/pdf_file/0023/60746/Loddon-Mallee.pdf

Environmental Scan Report: Loddon Mallee Region
Page 17 of 123 Date: 14 September 2020 FINAL 2.0 Public Version
A population with higher rates of obesity, chronic disease, disability and high-risk health behaviours, means
an increase in the number of people who may need assistance to manage extreme heat, bushfires and
flooding, which will subsequently increase pressure on health and community services.
Tourism
Harsher fire weather and flooding risk will threaten growth in the tourism industry, while significant reductions
in river flows will adversely affect recreational use.
Environment
The region’s environment is under threat from warmer and drier conditions, with reduced stream flows, more
severe droughts, extreme weather events and harsher fire weather all contributing to reduced ecosystem
health. Increasing water demand for irrigation will add to pressure on wetlands and their surrounding
environment.
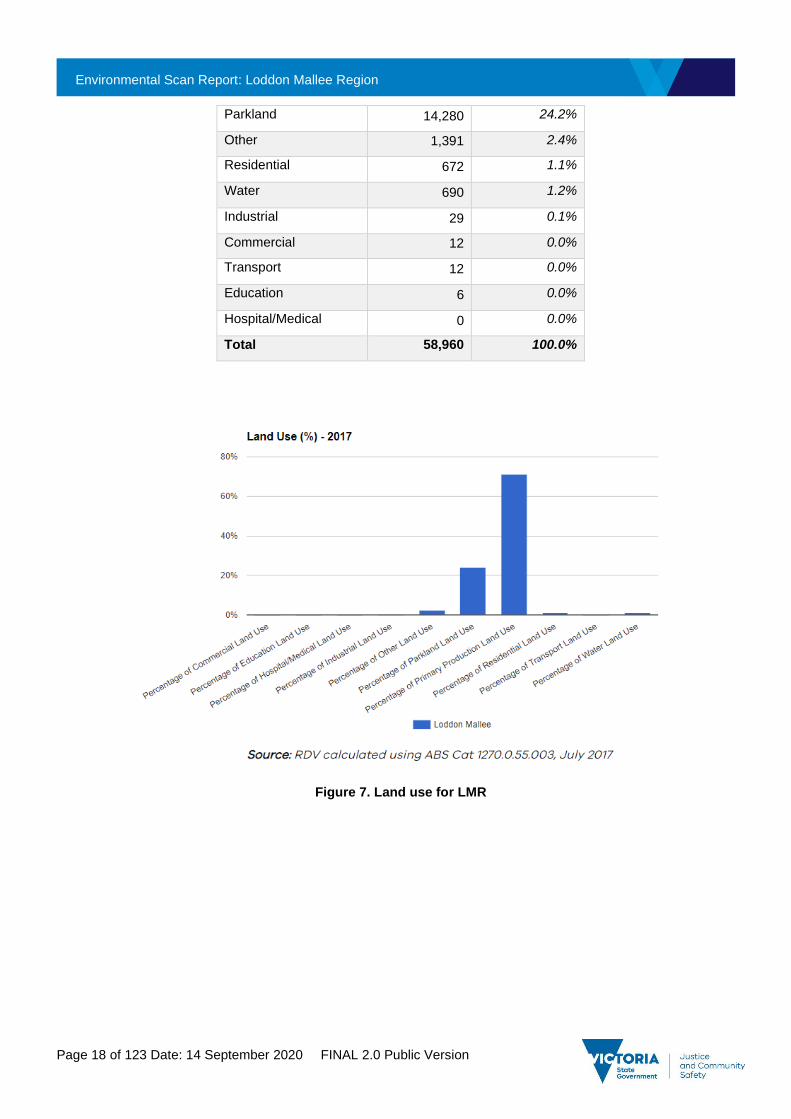
6.2 Land Use
Land use in the LMR is dominated by primary production, with over 70% of total land used for agriculture
and horticulture.
In the Mallee sub-region, the economy is driven by irrigated and dry land farming and is recognised as being
part of the Murray Darling food bowl.33 This sub-region also has large portions of public land with strong ties
to the Murray River, as well as extensive River Red Gum forests, native grasslands and wetland complexes.
In the Loddon Campaspe sub-region, a large portion of the population resides in the urban centre of
Bendigo, while the remainder of the region is made up of non-urban land, of which a significant portion is
used for agricultural production, including dairying, cropping, grazing, dry land and mixed farming.34 There
are also wineries, orchards and olive groves located throughout the sub-region.
Victoria’s forestry and wood products industry is one of Australia’s largest. In Victoria, it accounts for 9
million cubic metres or 27.5% of Australia’s log harvest volume. It accounts for approximately $7.3 billion or
31% of Australia’s forest product manufacturing sales and service income. LMR is home to over 7000
businesses in the agriculture, forestry and fishing industries, creating an approximate total of 10755 jobs for
the region.35
Table 7. Land usage by type across the LMR (2017)36
Land Use Type Area (Sq. Km) % Area
Primary Production 41,862 71.0%
33 DJPR (2014): https://www.planning.vic.gov.au/__data/assets/pdf_file/0024/94650/Loddon-Mallee-North-Regional-Growth-Plan-May-2014.pdf
34 DJPR (2014): https://www.planning.vic.gov.au/__data/assets/pdf_file/0033/94668/Loddon-Mallee-South-Regional-Growth-Plan-May-2014.pdf
35 DJPR (2020): https://www.rdv.vic.gov.au/information-portal/table-and-chart
36 DJPR (2020): https://www.rdv.vic.gov.au/information-portal/table-and-chart
Environmental Scan Report: Loddon Mallee Region
Page 18 of 123 Date: 14 September 2020 FINAL 2.0 Public Version
Parkland 14,280 24.2%
Other 1,391 2.4%
Residential 672 1.1%
Water 690 1.2%
Industrial 29 0.1%
Commercial 12 0.0%
Transport 12 0.0%
Education 6 0.0%
Hospital/Medical 0 0.0%
Total 58,960 100.0%
Figure 7. Land use for LMR
Environmental Scan Report: Loddon Mallee Region
Page 19 of 123 Date: 14 September 2020 FINAL 2.0 Public Version
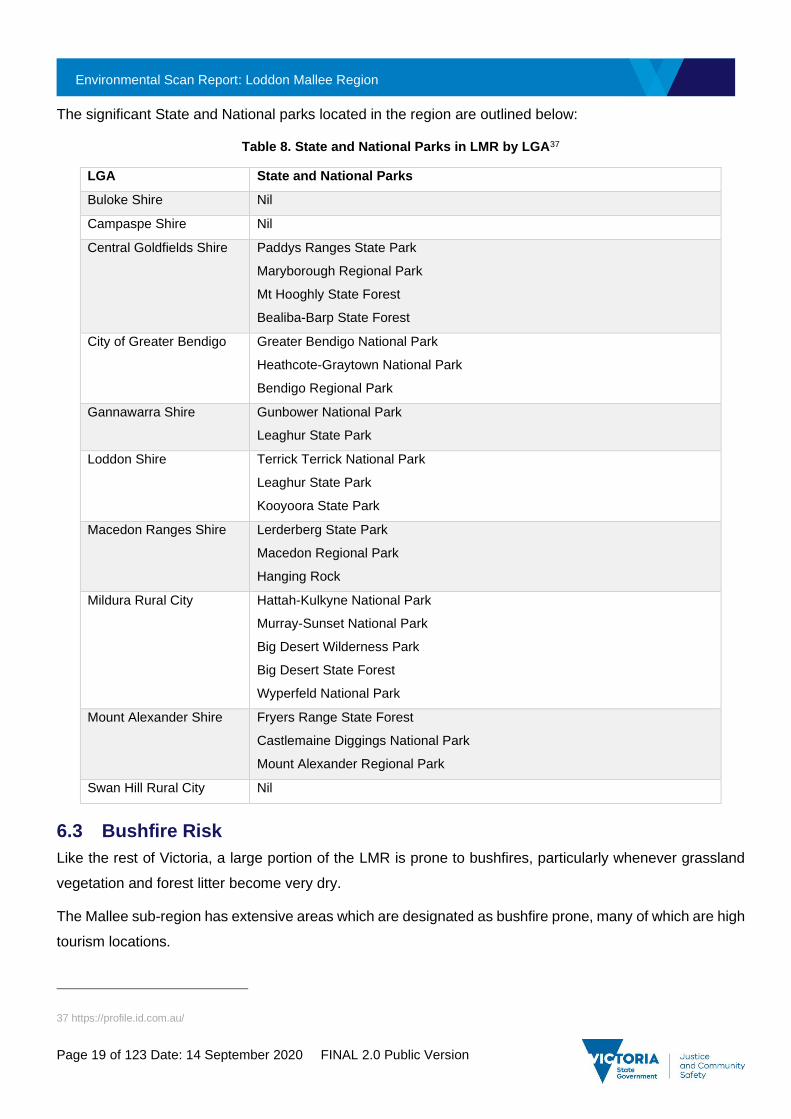
The significant State and National parks located in the region are outlined below:
Table 8. State and National Parks in LMR by LGA37
LGA State and National Parks
Buloke Shire Nil
Campaspe Shire Nil
Central Goldfields Shire Paddys Ranges State Park
Maryborough Regional Park
Mt Hooghly State Forest
Bealiba-Barp State Forest
City of Greater Bendigo Greater Bendigo National Park
Heathcote-Graytown National Park
Bendigo Regional Park
Gannawarra Shire Gunbower National Park
Leaghur State Park
Loddon Shire Terrick Terrick National Park
Leaghur State Park
Kooyoora State Park
Macedon Ranges Shire Lerderberg State Park
Macedon Regional Park
Hanging Rock
Mildura Rural City Hattah-Kulkyne National Park
Murray-Sunset National Park
Big Desert Wilderness Park
Big Desert State Forest
Wyperfeld National Park
Mount Alexander Shire Fryers Range State Forest
Castlemaine Diggings National Park
Mount Alexander Regional Park
Swan Hill Rural City Nil
6.3 Bushfire Risk
Like the rest of Victoria, a large portion of the LMR is prone to bushfires, particularly whenever grassland
vegetation and forest litter become very dry.
The Mallee sub-region has extensive areas which are designated as bushfire prone, many of which are high
tourism locations.
37 https://profile.id.com.au/

Environmental Scan Report: Loddon Mallee Region
Page 20 of 123 Date: 14 September 2020 FINAL 2.0 Public Version
In the Loddon Campaspe sub-region, there are many high bushfire hazard areas which intersect with
settlements and areas that are experiencing rural residential and tourism expansion.38 Some of the
settlements identified for focused growth are also located in areas with bushfire hazards, including Bendigo,
Castlemaine, Kyneton and Gisborne.39
The Fire Danger Period (FDP) in Victoria has become longer over time, indicating a trend towards extended
fire seasons. Seasonal fire restriction dates are set by municipality and depend on amounts of rain,
grassland curing and other local conditions. In 2019-2020, fire restriction dates for Victoria extended from
as early as 23 September 2019 to 23 March 2020.40
Smoke from fires, including from planned burns, can also be a hazard within the LMR. Those most at risk
from smoke exposure include young children, adults over 65 years of age, people with asthma or existing
heart or lung conditions, pregnant women, outdoor workers and smokers.41
In January 2020, smoke from bushfires across Victoria (and from New South Wales) rendered Melbourne’s
air quality the worst in the world42 with the smoke haze estimated to cost the cities of Melbourne, Sydney
and Canberra over $500 million.43
6.3.1 Bushfire prone areas
Bushfire prone areas are subject to or likely to be subject to bushfires, and to which specific bushfire
construction standards apply.44 Nearly all of the land in the LMR is a designated bushfire area.
38 DJPR (2014): https://www.planning.vic.gov.au/__data/assets/pdf_file/0033/94668/Loddon-Mallee-South-Regional-Growth-Plan-May-2014.pdf
39 DJPR (2014): https://www.planning.vic.gov.au/__data/assets/pdf_file/0033/94668/Loddon-Mallee-South-Regional-Growth-Plan-May-2014.pdf
40 FFMV (2020): https://www.ffm.vic.gov.au/permits-and-regulations/fire-restriction-dates
41 DHHS (2020): https://www2.health.vic.gov.au/public-health/environmental-health/climate-weather-and-public-health/bushfires-and-public-
health/smoke-from-fires-and-public-health
42 The Guardian (2020): https://www.theguardian.com/australia-news/2020/jan/14/melbourne-choked-by-hazardous-smoke-as-bushfires-
continue-to-burn-across-victoria
43 City of Melbourne (2020): https://www.melbourne.vic.gov.au/about-council/vision-goals/eco-city/Pages/adapting-to-climate-change.aspx
44 DELWP (2020): https://www.planning.vic.gov.au/policy-and-strategy/bushfire-protection/building-in-bushfire-prone-areas

Environmental Scan Report: Loddon Mallee Region
Page 21 of 123 Date: 14 September 2020 FINAL 2.0 Public Version
Table 9. Bushfire Risk in LMR by LGA45
LGA Bushfire Prone
Area (km2) 46 Total Area
(km2)47 % Area Bushfire
Prone Plan Number
Buloke Shire 7,807 8,000 97.6% LEGL./13-191
Campaspe Shire 4,415 4,519 97.7% LEGL./18-236
Central Goldfields Shire 1,529 1,533 99.7% LEGL./13-179
City of Greater Bendigo 2,930 3,000 97.6% LEGL./20-104
Gannawarra Shire 3,701 3,750 98.7% LEGL./18-240
Loddon Shire 6,694 6,696 100.0% LEGL./13-194
Macedon Ranges Shire 1,723 1,748 98.6% LEGL./20-109
Mildura Rural City 21,710 22,083 98.3% LEGL./13-195
Mount Alexander Shire 1,527 1,530 99.8% LEGL./13-186
Swan Hill Rural City 5,625 6,115 92.0% LEGL./13-398
LMR Total or Average 57,662 58,960 97.8%
6.4 Waterways
The Mallee sub-region is located entirely within the Murray Darling Basin, and contains parts of the
Goulburn, Campaspe, Loddon, Avoca, Wimmera-Avon, Mallee and Millicent Coast river basins. There are
numerous internationally and nationally important wetlands through the region, including the Ramsar listed
Hattah-Kulkyne Lakes, Kerang Lakes and Gunbower Forest. A significant part of the northern region is
natural floodplain, with shallow wetlands on public and private land.
The Loddon Campaspe sub-region covers parts of the Avoca, Loddon, Campaspe, Goulburn, Maribyrnong
and Werribee river catchments. Many rivers and wetlands, such as Little Lake Boort and the Loddon River
at Bridgewater, are key tourism assets. Many water storages exist with vast distances between each. Inland
lakes attract significant vessel traffic in peak periods, and lower volumes in off peak. The Murray River can
be fast flowing snag laden waterway, and generally has high summer populations. The riverine flood events
tend to be long and slow to recede.
45 DELWP (2020): https://discover.data.vic.gov.au/dataset/designated-bushfire-prone-area-bpa
46 DELWP (2020): https://discover.data.vic.gov.au/dataset/designated-bushfire-prone-area-bpa
47 DJPR (2020): https://www.rdv.vic.gov.au/information-portal/table-and-chart

Environmental Scan Report: Loddon Mallee Region
Page 22 of 123 Date: 14 September 2020 FINAL 2.0 Public Version
Red lines – catchment boundaries Dark Blue lines – main rivers
Light blue lines – main tributaries
Figure 8. Natural waterways in the LMR48 49
Natural waterways across the LMR have been heavily impacted by historical land use, including clearing
and agriculture, which have resulted in poor conditions relative to waterways in the east of Victoria, as
shown in the figure below.50
48 Data Vic (2020): https://discover.data.vic.gov.au/dataset/vicmap-lite
49 https://discover.data.vic.gov.au/dataset/awrc-major-river-basins-of-victoria
50 DELWP (2016): https://www.water.vic.gov.au/__data/assets/pdf_file/0030/58827/Water-Plan-strategy2.pdf

Environmental Scan Report: Loddon Mallee Region
Page 23 of 123 Date: 14 September 2020 FINAL 2.0 Public Version
Figure 9. River length condition in Victoria51
Many of these waterways are managed by appointed waterway managers who are responsible for
managing vessel activities on waters under their control. One of the key roles of waterway managers is to
provide and maintain navigational aids, appropriate signage of water levels and hazards, and rules applying
to their waters.52
51 DELWP (2016): https://www.water.vic.gov.au/__data/assets/pdf_file/0030/58827/Water-Plan-strategy2.pdf
52 DOT (2020): https://transportsafety.vic.gov.au/maritime-safety/ports-and-waterways

Environmental Scan Report: Loddon Mallee Region
Page 24 of 123 Date: 14 September 2020 FINAL 2.0 Public Version
Table 10. Managed waterways across the LMR53
LGA Waterway Name Appointed Waterway Manager
Buloke Shire Council Browns Lake (Lake Cope Cope) Buloke Shire Council
Green Lake (within Green Lake Regional Park) Buloke Shire Council
Wooroonook Lakes Buloke Shire Council
Tchum Lake South Tchum Lake Aquatic Club Inc.
Campaspe Shire Port of Echuca Campaspe Shire
Lake Cooper DELWP
Greens Lake (near Corop) Goulburn-Murray Water
Waranga Basin
Central Goldfields Shire Goldfields Reservoir Central Goldfields Shire
Lake Victoria (in Maryborough)
City of Greater Bendigo Lake Weeroona City of Greater Bendigo
Lake Eppalock Goulburn-Murray Water
Gannawarra Shire Gunbower Creek Gannawarra Shire
Kangaroo Lake
Lake Charm
Lake Meering (also known as Meran)
Middle and Reedy Lakes Goulburn-Murray Water
Loddon Shire Loddon River within the Shire of Loddon Loddon Shire
Loddon River at Bridgewater
Little Lake Boort
Laanecoorie Reservoir Goulburn-Murray Water
Mildura Rural City Lake Cullulleraine Mildura Rural City
Ouyen Lake Unmanaged
Waters within Hattah-Kulkyne National Park DELWP
Waters within Kings Billabong Wildlife Reserve
Walpeup Lake Walpeup Lake Committee of Management Inc.
Mount Alexander Shire Cairn Curran Reservoir (also in Central Goldfields Shire)
Goulburn-Murray Water
Swan Hill Rural City Lake Boga Swan Hill Rural City
Lake Powell DELWP
Lake Carpul
Heywood Lake
Water supplies and catchments are discussed further in Section 7 – Built Environment.
53 DOT (2020): https://transportsafety.vic.gov.au/maritime-safety/ports-and-waterways/waterway-managers

Environmental Scan Report: Loddon Mallee Region
Page 25 of 123 Date: 14 September 2020 FINAL 2.0 Public Version
6.4.1 Floods
Floods cause more damage – including loss of life and livelihoods and damage to property and infrastructure
– than any other type of natural disaster in Australia.54 Victoria is prone to riverine flooding, which occurs in
low-lying areas near rivers and streams, and flash flooding, which can happen anywhere in the event of
intense rainfall. Flash flooding can be unpredictable, overwhelming drainage systems and causing localised
threats.
In the Mallee sub-region, there are a significant number of urban settlements which are exposed to flood
risk, with floods also having caused significant damage to farms through inundation, isolation and flash
floods following heavy rainfall.55 Flooding in the sub-region provides important inflows to wetlands and lake
systems, however may also impact towns and infrastructure.
The Loddon Campaspe sub-region is particularly pre-disposed to floods, with many settlements within the
region that have been identified for growth, also having high flood risks, including Bendigo, Castlemaine,
Kyneton and Gisborne.56
Flood management guidelines, including prevention, response and recovery activities, are provided in the
State Emergency Response Plan Flood Sub-Plan, published in 2016. 57 This strategy relies on the combined
efforts of various agencies including local government, SES, Catchment Management Authorities and
community partnerships.58
The Bureau of Meteorology is responsible for providing a flood warning service for riverine flooding resulting
from heavy rainfall in Victoria in cooperation with other government, water and emergency management
agencies59. The coverage of this flood warning service is shown in Figure 10 with both the Flood Watch and
Flood Warning catchment shown. The products from the Service Level Specification that cover the
catchments in LMR are listed in Table 1160. The river observations sites when flood levels are defined are
shown as blue triangles and are listed in Table 11.
54 Flood Victoria (2020): https://www.floodvictoria.vic.gov.au/
55 DJPR (2014): https://www.planning.vic.gov.au/__data/assets/pdf_file/0024/94650/Loddon-Mallee-North-Regional-Growth-Plan-May-2014.pdf
56 DJPR (2014): https://www.planning.vic.gov.au/__data/assets/pdf_file/0033/94668/Loddon-Mallee-South-Regional-Growth-Plan-May-2014.pdf
57 EMV (2016): https://www.ses.vic.gov.au/documents/112015/2504320/State+Emergency+Response+Plan+-+Flood+Sub-Plan+-
+Edition+1.pdf/e4d997fa-080b-39fd-366b-42b5cb23443f
58 DELWP (2016): https://www.water.vic.gov.au/managing-floodplains/new-victorian-floodplain-management-strategy
59 http://www.bom.gov.au/water/floods/document/National_Arrangements_V4.pdf
60 http://www.bom.gov.au/vic/flood/brochures/VIC_SLS_current.pdf

Environmental Scan Report: Loddon Mallee Region
Page 26 of 123 Date: 14 September 2020 FINAL 2.0 Public Version
Table 11. Flood Warning products and Flood Warning Locations61
Product Warning Area Site Minor Moderate Major
IDN36629 Flood Warning for the Murray River D/S of Lake Hume
Murray River at Echuca 93.5 93.9 94.4
Murray River at Torrumbarry Weir
7.3 7.6 7.8
Murray River at Swan Hill 4.5 4.6 4.7
Murray River at Mildura Weir
36.0 37.5 38.5
Murray River at Wentworth 7.3 7.9 9.1
Murray River at Wakool Junction 8.8 10.5 11.5
IDV36710 Flood Warning for the Goulburn River
Flood Warning for the Yea River
Flood Warning for the Sunday Creek
Flood Warning for the Hughes Creek
Goulburn River at McCoys Bridge 9.0 10.0 10.2
IDV36750 Flood Warning for the Campaspe River
Campaspe River at Barnadown 3.8 4.4 5.0
Campaspe River at Rochester Town
113.0 114.0 114.5
Campaspe River D/S Lake Eppalock
158.4 160.4 162.4
IDV36810 Flood Warning for the Loddon River Loddon River at Appin South 2.8 3.1 3.3
Loddon River at MV Hwy Bridge (Kerang)
77.0 77.5 77.8
Loddon River D/S Cairn Curran 2.0 3.5 4.0
Loddon River D/S Laanecoorie 1.5 3.0 5.5
IDV36820 Flood Warning for the Avoca River Avoca River at Charlton Township 4.-0 5.9 7.5
Avoca River at Quambatook 2.0 2.2 2.4
IDV36830 Flood Warning for the Wimmera River
61 http://www.bom.gov.au/vic/flood/brochures/VIC_SLS_current.pdf

Environmental Scan Report: Loddon Mallee Region
Page 27 of 123 Date: 14 September 2020 FINAL 2.0 Public Version
Red Boundaries – Bureau of Meteorology Flood
Watch areas Red Shading – Bureau of Meteorology Flood Warning
Catchments Dark Blue areas – Lakes and dams Blue lines – rivers and streams
Green areas – 1:100 year ARI modelled inundation area
Triangles – River observations sites
Figure 10. Flood warning and 1:100-year ARI inundation62 63 64 65 66 67
The flood risk and area impacted by flooding varies around the region. Table 12 shows the percentage of
each LGA which is impacted by flooding at the 1:100-year average recurrence interval (ARI). This is shown
in Green in Figure 10. There is a one percent chance (1% annual exceedance probability (AEP)) of these
areas experiencing flooding of this level in any given year68 based on flood modelling results from flood
studies. The localities listed have some defined built up area in or near the flood impact area defined by the
1:100-year ARI. This list may not be exhaustive, and some areas may experience impacts from flash
flooding due to heavy rainfall that are not shown here.
62 http://www.bom.gov.au/metadata/catalogue/19115/ANZCW0503900441?template=full
63 http://www.bom.gov.au/metadata/catalogue/19115/ANZCW0503900561?template=full
64 http://www.bom.gov.au/metadata/catalogue/19115/ANZCW0503900563?template=full
65 http://www.bom.gov.au/metadata/catalogue/19115/ANZCW0503900564?template=full
66 https://discover.data.vic.gov.au/dataset/1-in-100-year-flood-extent
67 Data Vic (2020): https://discover.data.vic.gov.au/dataset/vicmap-lite
68 http://arr.ga.gov.au/arr-guideline

Environmental Scan Report: Loddon Mallee Region
Page 28 of 123 Date: 14 September 2020 FINAL 2.0 Public Version
Table 12. Areas potentially impacted by flooding inundation69
LGA % Included in 1:100 Ari Area
Main Localities with Affected Built Up Areas
Buloke 11.2% Charlton, Donald
Campaspe 31.7% Echuca, Kyabram, Moama (NSW), Rochester, Tongala, Wharparilla
Central Goldfields 20.1% Carisbrook, Dunolly, Maryborough
Gannawarra 40.4% Barham (NSW), Cohuna, Kerang, Koondrook, Quambatook
Greater Bendigo 5.9% Ascot (Bendigo), Bendigo, Eaglehawk, East, Bendigo, Elmore, Epsom, Flora Hill, Golden Square, Heathcote, Huntly, Kangaroo Flat, Kennington, Long Gully, Maiden Gully, North Bendigo, Quarry Hill, Spring Gully, Strathdale, Strathfieldsaye, White Hills
Loddon 29.1% Boort, Pyramid Hill
Macedon Ranges 2.0% Gisborne, Kyneton, Riddells Creek, Romsey, Woodend
Mildura 6.7% Mildura, Nichols Point
Mount Alexander 2.4% Campbells Creek, Castlemaine, Moonlight Flat
Swan Hill 10.2% Murray Downs (NSW), Nyah, Pental Island, Robinvale, Swan Hill
6.5 Geology
There are significant aspects of the Victorian environment that rely on natural workings underground.
Victoria’s geology contributes to a large cluster of volcanic plains, the frequency of weak to medium
magnitude earthquakes and the versatility of groundwater.
There is an extensive area of volcanism in Victoria. Large basaltic formations (formed after the rapid cooling
of lava) are present along the western coast of Victoria. The time of the last volcanic eruption in Victoria is
contested by volcanologists, however common consensus is that it occurred approximately 7000 years ago
at Mount Napier. In volcanology terms, this classifies the Western Victorian Volcanic Plains as an active
volcanic region, with many volcanologists considering the area dormant rather than extinct.70 The plains
span approximately 2.3 million hectares or 10% of the state’s land mass. The eastern side of Victoria
experienced volcanic activity significantly earlier than in the west. 71 Older Volcanic Plains are scattered
throughout eastern Victoria and experienced an estimated 400 eruptions that were sporadic, relatively low
volume and widespread.72
69 https://discover.data.vic.gov.au/dataset/1-in-100-year-flood-extent
70 http://vro.agriculture.vic.gov.au/dpi/vro/vrosite.nsf/pages/landform_geomorphological_framework_6.1
71 New 40Ar/39Ar ages for selected young (<1 Ma) basalt flows of the Newer Volcanic Province, Southeastern Australia (2011)
https://www.sciencedirect.com/science/article/abs/pii/S1871101411000112
72 New 40Ar/39Ar ages for selected young (<1 Ma) basalt flows of the Newer Volcanic Province, Southeastern Australia (2011)
https://www.sciencedirect.com/science/article/abs/pii/S1871101411000112

Environmental Scan Report: Loddon Mallee Region
Page 29 of 123 Date: 14 September 2020 FINAL 2.0 Public Version
Figure 11. Map of Victoria with Volcanic overlay73
There is no reported threat of volcanic eruption to the LMR. However, in the event of an eruption in the
Western Victorian Volcanic Plains, there is a chance of volcanic gases to be present in the air in Loddon
Mallee.
On average, there are approximately 100 earthquakes in Australia per year that register above 3
magnitude.74 As a nation, Australia experiences significantly less earthquakes than other parts of the world
near tectonic boundaries, where large earthquakes occur more often. 75 However, the country experiences
earthquakes due to a series of interlocking, interspersed fault lines that spread throughout the nation. In
Victoria, several vault lines have been identified including the Strzelecki Ranges, The Mornington Peninsula
and the Otway Ranges. However, the frequency of earthquakes in the state indicates that there are multiple
minor fault lines that have not been formally identified. 76 Included below is a table that lists earthquakes in
Victoria with a magnitude over 4.5 since records began with damage reported:
73 New 40Ar/39Ar ages for selected young (<1 Ma) basalt flows of the Newer Volcanic Province, Southeastern Australia (2011)
https://www.sciencedirect.com/science/article/abs/pii/S1871101411000112
74 Geology Australia (2020) https://www.ga.gov.au/scientific-topics/community-safety/earthquake
75 Geology Australia (2020) https://www.ga.gov.au/scientific-topics/community-safety/earthquake
76 Geology Australia (2020) https://www.ga.gov.au/scientific-topics/community-safety/earthquake

Environmental Scan Report: Loddon Mallee Region
Page 30 of 123 Date: 14 September 2020 FINAL 2.0 Public Version
Table 13. List of earthquakes above 4.5 magnitude in Victoria since records began77 78
Location Date Magnitude Damage Reported
Cape Liptrap 02 July 1885 5.7 Tied Victoria’s largest earthquake – minor damage reported around epicentre
Warrnambool 14 July 1903 5.3 Minor damage over wide geographical area near epicentre
Alpine National Park
10 April 1904 5.0 No damage reported – epicentre in national park
Ocean Grove (offshore)
10 April 1922 5.7 Reports of minor item damage in Cranbourne, East Malvern, Pakenham and Portalington – aftershock 4.7 magnitude
Mornington 03 September 1932 4.5 Minor damage
Bass Strait (offshore)
15 September 1946 6.2 Minor damage reported in Gippsland region and Tasmanian northern coast
Cape Otway 25 December 1950 5.3 No Damage Reported
Mt Hotham 5 May 1966 5.5 Windows broken in ski village
Boolarra 20 June 1969 5.3 5.0 magnitude aftershock, cracked walls and windows near epicentre
Western Port 7 July 1971 5.0 Damage reported in Cowes
Balliang 2 December 1979 4.7 Felt across south eastern suburbs, minor damage caused in Anakie area
Wonnangatta 21 November 1982 5.4 Felt across state, no damage reported
Mount Baw Baw 25 September 5.0 No damage reported
Boolarra 29 August 2000 5.0 Minor damage
Swan Hill 27 October 2001 4.8 Minor damage, power disruption
Wonthaggi 6 March 2011 4.5 No damage reported
Gippsland 19 June 2012 5.4 Minor damage
Loddon Mallee has some history with significant earthquakes. Since records began, Loddon Mallee has
reported 11 earthquakes above 3 magnitude with the most recent being the largest recorded. In Swan Hill
on 27 October 2000, a 4.8 magnitude earthquake caused minor damage and some power disruption to rural
communities.79 In 2017, the SES identified the following dams in Loddon Mallee had credible earthquake
risk:
77 Seismology Research Centre (2020) https://www.src.com.au/earthquakes/older-quakes/
78 Earthquake Tracker (2020) https://earthquaketrack.com/p/australia/victoria/recent?mag_filter=4
79

Environmental Scan Report: Loddon Mallee Region
Page 31 of 123 Date: 14 September 2020 FINAL 2.0 Public Version
Table 14 SES identified dams with credible earthquake risk80
Dam Name Location Capacity (Megalitres)
Laanecoorie Reservoir Located on the Loddon River, 40km south-west of Bendigo.
8,000Ml
Cairn Curran Reservoir Located on the Loddon River, about 10km west of Maldon.
147,130Ml
Lake Eppalock Located on the Campaspe River, near Bendigo in central Victoria.
276,751Ml
(304651Ml on Goulbourn Murray Water website)
Barkers Creek Reservoir 25km south of Bendigo, north of Harcourt. 1,690Ml
Caledonia Reservoir 6km south of Heathcote \on Dairy Flat Rd. 214Ml
Upper Coliban Reservoir Located 9km west of Kyneton on the Coliban River. 37,770Ml (from Coliban Water website)
Lauriston Reservoir Located 8km south west of Kyneton on the Coliban River.
19,790Ml (from Coliban Water website)
Malmsbury Reservoir Located 1km south Malmsbury on the Coliban River.
12,034Ml (from Coliban Water website)
McCay Reservoir Located off the Pyrenees Highway, halfway between Chewton and Elphinstone townships.
1,400Ml
Sandhurst Reservoir Located at Big Hill, 3km south of Kangaroo Flat. 2,600Ml
Spring Gully Reservoir Located in Spring Gully, 3km south of Bendigo. 1,680Ml
Expedition Pass Reservoir (Golden Point Reservoir)
Located on Golden Point Road, around 3km from Chewton.
264Ml
Torrumbarry Weir Located 30km north of Echuca. 36,810Ml
Crusoe Reservoir Located upstream of Kangaroo Flat off Crusoe Road.
890Ml
Tullaroop Reservoir Located 6km upstream of Carisbrook off Rodborough Road.
72,950Ml (from the Goulbourn Murray Water website)
Mildura Weir North east corner of the Mildura township, on Murray River
36,600Ml (from GMW website)
Waranga Basin East of Rushworth township. 432,360Ml (from the Goulbourn Murray Water website)
Campaspe Weir South West of Rochester township on the Northern Highway.
252,000Ml (from Goulbourn Murray Water website)
Groundwater is water found under the ground that flows through layers known as aquifers. Surface water
from rainfall seeps into cracks or pores in the ground (aquifers), however aquifers can also be recharged
from streams or indirectly from other aquifers.81 Groundwater resources eventually flow into rivers, lakes or
the ocean. Many surface environments known as ‘groundwater dependent ecosystems’ rely on groundwater
including wetlands and river baseflows. Groundwater is also important as a water resource in semi-arid
80 State Emergency Services – Earthquake Emergency Plan (2018)
81 Southern Rural Water – Groundwater Atlas (2012) http://www.srw.com.au/wp-content/uploads/2016/03/GGA_SmallSize-1.pdf

Environmental Scan Report: Loddon Mallee Region
Page 32 of 123 Date: 14 September 2020 FINAL 2.0 Public Version
parts of Victoria where rainfall is infrequent or inadequate to reliably meet water needs.82 In areas where
groundwater may be replenished on a regular basis (through rainfall), extraction can be managed on a
renewable basis. However, in many areas in Australia the extraction greatly exceeds the rate at which
groundwater is replenished - Australian Water Resources 2005 concluded that 30% of groundwater
extraction sites were approaching or beyond sustainable extraction limits.83
The area around the Murray-Darling Basin is a primary source for groundwater in the LMR.84 Major issues
arising in LMR around groundwater is the unsustainable demand and declining groundwater levels in current
aquifers. 85 Most of the recent discussion around the utilisation of groundwater in Loddon Mallee has focused
on the water and land salinity problems that occur through the unsustainable harvesting of the resource.86
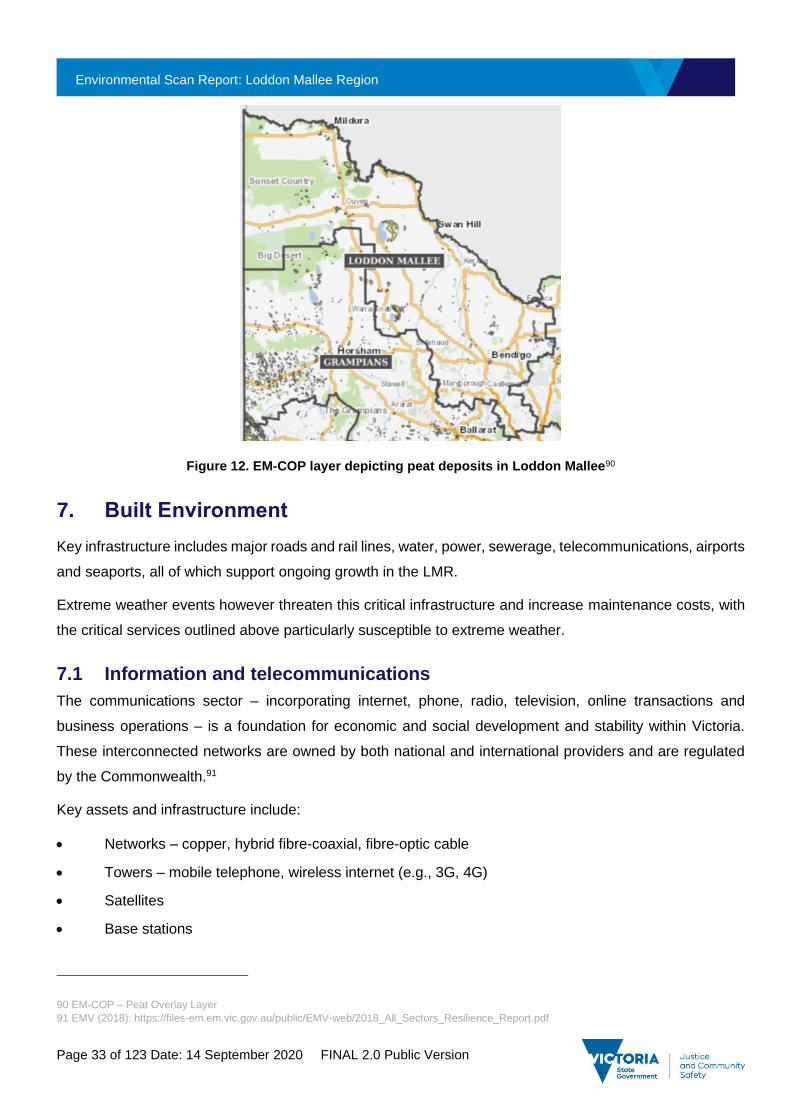
Peat consists of decayed vegetation or organic matter. Peat can pose a major fire hazard and a smouldering
peat fire cannot be extinguished by light rain.87 Peat fuelled fires can burn for extended periods of time and
have also been observed as smouldering underground resulting in reignition if an oxygen source is
present.88 The minimum rainfall intensity required to extinguish a peat fire is roughly 4mm/h.89 LMR’s main
deposit of peat is near Lake Wahpool and Lake Tiboram. Another cluster of deposits can be found in Hattah-
Kulkne National Park. Apart from these centralised locations, peat is spread around Loddon Mallee in
relatively small clusters. A full map of peat deposits can be found on EM-COP, below is a screenshot of the
BSW region with the peat hazard layer shown in yellow.
82 Geology Australia (2020) https://www.ga.gov.au/scientific-topics/water/groundwater/basics/what-is-groundwater
83 Geology Australia (2020) https://www.ga.gov.au/scientific-topics/water/groundwater/basics/what-is-groundwater
84 Murray Darling Basin – Groundwater Report - https://www.mdba.gov.au/sites/default/files/archived/mdbc-GW-
reports/2173_GW_a_resource_for_the_future.pdf
85 Murray Darling Basin – Groundwater Report - https://www.mdba.gov.au/sites/default/files/archived/mdbc-GW-
reports/2173_GW_a_resource_for_the_future.pdf
86 Murray Darling Basin – Groundwater Report - https://www.mdba.gov.au/sites/default/files/archived/mdbc-GW-
reports/2173_GW_a_resource_for_the_future.pdf
87 Lin and Huang (2020) https://www.sciencedirect.com/science/article/abs/pii/S0048969720319811
88 Lin and Huang (2020) https://www.sciencedirect.com/science/article/abs/pii/S0048969720319811
89 Lin and Huang (2020) https://www.sciencedirect.com/science/article/abs/pii/S0048969720319811
Environmental Scan Report: Loddon Mallee Region
Page 33 of 123 Date: 14 September 2020 FINAL 2.0 Public Version
Figure 12. EM-COP layer depicting peat deposits in Loddon Mallee90
7. Built Environment
Key infrastructure includes major roads and rail lines, water, power, sewerage, telecommunications, airports
and seaports, all of which support ongoing growth in the LMR.
Extreme weather events however threaten this critical infrastructure and increase maintenance costs, with
the critical services outlined above particularly susceptible to extreme weather.
7.1 Information and telecommunications
The communications sector – incorporating internet, phone, radio, television, online transactions and
business operations – is a foundation for economic and social development and stability within Victoria.
These interconnected networks are owned by both national and international providers and are regulated
by the Commonwealth.91
Key assets and infrastructure include:
• Networks – copper, hybrid fibre-coaxial, fibre-optic cable
• Towers – mobile telephone, wireless internet (e.g., 3G, 4G)
• Satellites
• Base stations
90 EM-COP – Peat Overlay Layer
91 EMV (2018): https://files-em.em.vic.gov.au/public/EMV-web/2018_All_Sectors_Resilience_Report.pdf

Environmental Scan Report: Loddon Mallee Region
Page 34 of 123 Date: 14 September 2020 FINAL 2.0 Public Version
• Exchanges or points of interconnect
• Data centres
• Backhaul infrastructure (which transfers high data volumes to and from the core network)
• Cables – between onshore nodes and other countries
Key risks to the sector include:
• Natural disasters – fire, flood, storm, extreme weather
• Pandemic
• Security breaches
• Technical issues (e.g., electricity disruption, asset failure)
In the LMR the quality of digital infrastructure, including fixed broadband and mobile access, is highly
variable. While for cities and large towns such as Bendigo and Mildura, access is generally comparable to
metropolitan Melbourne, smaller towns and localities such as Rushworth and Charlton generally have less
capacity and reliability.92
For the LMR, key assets and infrastructure are summarised below:
Table 15. Communications infrastructure in LMR by LGA93
LGA Radio
Broadcast Television Broadcast
Radio Communication
Telephone Exchanges
Buloke Shire 0 0 3 23
Campaspe Shire 2 0 4 29
Central Goldfields Shire 1 0 3 8
City of Greater Bendigo 3 0 2 17
Gannawarra Shire 1 1 1 21
Loddon Shire 0 0 4 28
Macedon Ranges Shire 1 5 3 14
Mildura Rural City 14 17 16 15
Mount Alexander Shire 7 11 3 10
Swan Hill Rural City 9 10 4 16
LMR Total 38 44 43 181
92 Infrastructure Victoria (2019): https://www.infrastructurevictoria.com.au/wp-content/uploads/2019/04/Aither-Loddon-Campaspe-Regional-
Profile-March-2019.pdf
93 Data Vic (2020): https://discover.data.vic.gov.au/dataset/foi-point-vicmap-features-of-interest

Environmental Scan Report: Loddon Mallee Region
Page 35 of 123 Date: 14 September 2020 FINAL 2.0 Public Version
7.2 Energy
Energy – including electricity, gas and liquid fuels – is one of eight critical infrastructure sectors identified
for Victoria. All three of these sub-sectors are privately owned and operated, and form part of extensive
national networks to import and export energy between Victoria and other States.94
Victoria’s primary energy sources are electricity generated from brown coal in the La Trobe Valley, and
natural gas sourced from the Gippsland Basin.95
7.2.1 Energy distribution
Energy distribution in the LMR is summarised by LGA in the below table and discussed further by form in
the following sections.
Table 16. Energy distribution across LMR by LGA (km)96
LGA Major Electricity
Transmission Lines Oil Pipelines Gas Pipelines
Buloke Shire 12.8 0.0 0.0
Campaspe Shire 168.7 0.0 30.6
Central Goldfields Shire 37.3 0.0 45.4
City of Greater Bendigo 146.9 0.0 29.4
Gannawarra Shire 177.8 0.0 0.0
Loddon Shire 147.8 0.0 0.0
Macedon Ranges Shire 65.3 0.0 50.2
Mildura Rural City 420.1 0.0 117.3
Mount Alexander Shire 96.7 0.0 72.4
Swan Hill Rural City 252.8 0.0 0.0
Total 1,526.2 0.0 345.3
For the energy sector overall, key risks include:
• Fire
• Severe weather
• Extreme temperatures
• Cyber-attack
• Earthquake
94 EMV (2018): https://files-em.em.vic.gov.au/public/EMV-web/2018_All_Sectors_Resilience_Report.pdf
95 DELWP (2020): https://www.energy.vic.gov.au/
96 EMV (2020): Potential Impact Reports (by LGA)

Environmental Scan Report: Loddon Mallee Region
Page 36 of 123 Date: 14 September 2020 FINAL 2.0 Public Version
• Earthworks damaging underground infrastructure
• Loss of communication
• Workforce issues (which could arise for any number of reasons but include industrial issues, heat
stress, pandemic, an ageing workforce and lack of experience or specialist staff).97
Key dependencies for the energy sector include:
• Production infrastructure
• Supporting infrastructure (e.g., energy supplies for operations)
• Water and wastewater
• Transport infrastructure
• Human resources and management systems
• Information technology and communications98
7.2.2 Electricity
The key assets and infrastructure for the electricity sector include generators, high and low voltage
transmission and distribution systems.99
Most of Victoria’s electricity is generated by brown coal generators in the La Trobe Valley.100
Terminal stations are key centres for receiving high voltage electricity from transmission lines and converting
it to lower voltages for distribution to zone substations.101 Zone Substations receive electricity from bulk
supply substations and transform the voltage to 11,000 volts for distribution to customers’ homes and
businesses along powerlines or cables.102
In the LMR, the distribution network is owned by Powercor 103. Electricity is transported to a terminal station,
where it then moves via a sub-transmission network at 66 kilovolts. Most of this network is configured in
loops to maximise reliability, however some areas are supplied by radial 66 kilovolt lines. Electricity is
converted at zone substations, to 22 or 11 kilovolts, and transported across high voltage distribution lines
to substations.
97 EMV (2018): https://files-em.em.vic.gov.au/public/EMV-web/2018_All_Sectors_Resilience_Report.pdf
98 EMV (2018): https://files-em.em.vic.gov.au/public/EMV-web/2018_All_Sectors_Resilience_Report.pdf
99 EMV (2018): https://files-em.em.vic.gov.au/public/EMV-web/2018_All_Sectors_Resilience_Report.pdf
100 DELWP (2020): https://www.energy.vic.gov.au/electricity/about-the-electricity-sector
101 AusNet Services (2018): https://www.ausnetservices.com.au/-/media/Files/AusNet/About-Us/Determining-Revenues/Distribution-
Network/Customer-Forum/Week-1/Networks-101-Customer-Forum.ashx?la=en
102 AusNet Services (2018): https://www.ausnetservices.com.au/-/media/Files/AusNet/About-Us/Determining-Revenues/Distribution-
Network/Customer-Forum/Week-1/Networks-101-Customer-Forum.ashx?la=en
103 https://www.energy.vic.gov.au/electricity/electricity-distributors

Environmental Scan Report: Loddon Mallee Region
Page 37 of 123 Date: 14 September 2020 FINAL 2.0 Public Version
The distribution network experiences losses as it transports electricity. One of the causes is Single Wire
Earth Return (SWER), usually in remote and sparsely settled rural areas. SWER lines operate at a nominal
voltage of 12.7 kilovolts, unlike the rest of the high voltage distribution network, which operates at 22
kilovolts. Some parts of the network are stronger than others. The Charlton substation zone is subject to
outages, because of its remote location. This area services a large portion of the Buloke Shire, as well as
small parts of Swan Hill, Gannawarra and Loddon Shires. The zone substation is supplied by one very long
radial sub-transmission line from Bendigo. Other vulnerable areas include towns and communities serviced
by single radial lines, either three-phase 22 kilovolt, single-phase 22 kilovolt, or SWER lines. Powercor has
also identified a number of zone substation constraints, including Eaglehawk, Bendigo and Merbein.
More generation is being connected to the periphery of the network, where it has to travel further and the
grid is weaker and more easily overloaded. The transmission network in the region is becoming increasingly
constrained, limiting the capacity of new generators to export energy into the grid. As a result, generators
are seeking to move further south in the region, to areas with more grid capacity.104
Within the LMR, there are 7 terminal stations and no zone substations, as outlined below:
Figure 13. Terminal stations and zone substations in LMR105
104 https://www.energy.vic.gov.au/__data/assets/pdf_file/0028/464725/Roadmap-LoddonMalleeFinal.pdf
105 EMV (2020): Potential Impact Reports (by LGA)
0
0
0
2
1
0
0
3
0
1
Buloke Shire
Campaspe Shire
Central Goldfields Shire
City of Greater Bendigo
Gannawarra Shire
Loddon Shire
Macedon Ranges Shire
Mildura Rural City
Mount Alexander Shire
Swan Hill Rural City
Terminal Stations Zone Substations

Environmental Scan Report: Loddon Mallee Region
Page 38 of 123 Date: 14 September 2020 FINAL 2.0 Public Version
A map of electrical infrastructure is provided in the figure below:
Green star – renewable power generation Blue star – non-renewable power generation Red triangle – Electrical substation Green triangle – Electrical switchyard
Yellow triangle – Electrical transmission Blue triangle – Electrical zone Black dot – Electrical terminal Thick red line – Power transmission
Thin red line – Power sub-transmission
Figure 14. Transmission lines within LMR106 107 108
106 https://data.gov.au/dataset/ds-aurin-aurin%3Adatasource-AU_Govt_GA-
UoM_AURIN_DB_national_major_power_stations_2016/details?q=Major%20Power%20Stations
107 https://data.gov.au/dataset/ds-aurin-aurin%3Adatasource-AU_Govt_GA-
UoM_AURIN_DB_national_electricity_transmission_substations_2017/details?q=electricity%20transmission%20substations
108 https://discover.data.vic.gov.au/dataset/foi-line-vicmap-features-of-interest

Environmental Scan Report: Loddon Mallee Region
Page 39 of 123 Date: 14 September 2020 FINAL 2.0 Public Version
7.2.3 Solar and Wind
In the LMR, the focus of renewable energy has been on solar energy, with the Kiamal Solar Farm north of
Ouyen to be Victoria’s largest.
There are 21 solar farms and two wind farms operating in the Loddon Mallee, including:
Figure 15. Wind and solar farms in LMR by LGA109,110
109 EMV (2020): Potential Impact Reports (by LGA)
110 https://www.energy.vic.gov.au/__data/assets/pdf_file/0028/464725/Roadmap-LoddonMalleeFinal.pdf
2
0
0
0
0
0
0
0
0
0
1
4
2
11
3
Buloke Shire
Campaspe Shire
Central Goldfields Shire
City of Greater Bendigo
Gannawarra Shire
Loddon Shire
Macedon Ranges Shire
Mildura Rural City
Mount Alexander Shire
Swan Hill Rural City
Wind Farms Solar Farms
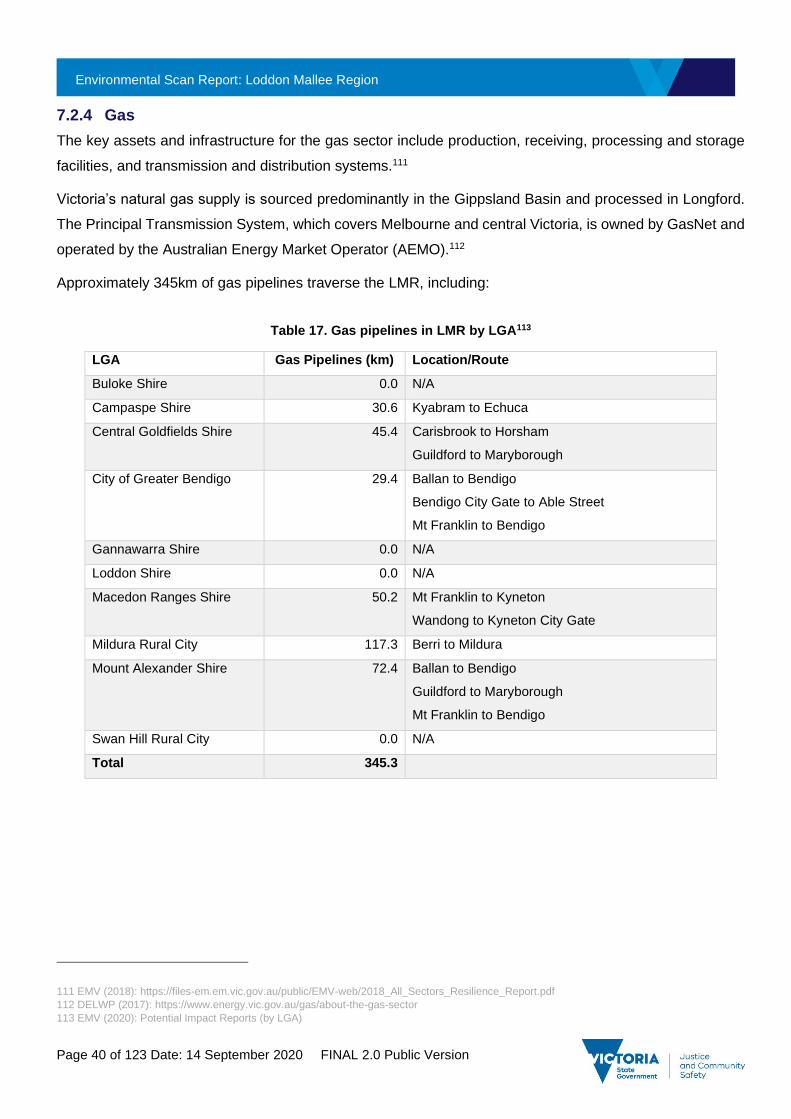
Environmental Scan Report: Loddon Mallee Region
Page 40 of 123 Date: 14 September 2020 FINAL 2.0 Public Version
7.2.4 Gas
The key assets and infrastructure for the gas sector include production, receiving, processing and storage
facilities, and transmission and distribution systems.111
Victoria’s natural gas supply is sourced predominantly in the Gippsland Basin and processed in Longford.
The Principal Transmission System, which covers Melbourne and central Victoria, is owned by GasNet and
operated by the Australian Energy Market Operator (AEMO).112
Approximately 345km of gas pipelines traverse the LMR, including:
Table 17. Gas pipelines in LMR by LGA113
LGA Gas Pipelines (km) Location/Route
Buloke Shire 0.0 N/A
Campaspe Shire 30.6 Kyabram to Echuca
Central Goldfields Shire 45.4 Carisbrook to Horsham
Guildford to Maryborough
City of Greater Bendigo 29.4 Ballan to Bendigo
Bendigo City Gate to Able Street
Mt Franklin to Bendigo
Gannawarra Shire 0.0 N/A
Loddon Shire 0.0 N/A
Macedon Ranges Shire 50.2 Mt Franklin to Kyneton
Wandong to Kyneton City Gate
Mildura Rural City 117.3 Berri to Mildura
Mount Alexander Shire 72.4 Ballan to Bendigo
Guildford to Maryborough
Mt Franklin to Bendigo
Swan Hill Rural City 0.0 N/A
Total 345.3
111 EMV (2018): https://files-em.em.vic.gov.au/public/EMV-web/2018_All_Sectors_Resilience_Report.pdf
112 DELWP (2017): https://www.energy.vic.gov.au/gas/about-the-gas-sector
113 EMV (2020): Potential Impact Reports (by LGA)

Environmental Scan Report: Loddon Mallee Region
Page 41 of 123 Date: 14 September 2020 FINAL 2.0 Public Version
Gas Pipeline
Figure 16. Natural gas pipelines within the LMR114
7.2.5 Liquid fuels
The key assets and infrastructure for the liquid fuels sector include production and import facilities, fuel
refineries, storage, distribution systems (including pipelines and transport) and retail outlets.115
There are no oil refineries located in the LMR, with only two refineries situated in Victoria – at Altona (Mobil)
and Geelong (Viva Energy).116
7.3 Food, grocery and manufacturing
Victoria is the epicentre of manufacturing in Australia, home to more than 13,000 manufacturing firms
employing over 280,000 people and generating $30 billion for the Victorian economy.117
A number of large businesses operate home bases or sites in the LMR including:118
• Lactalis Australia (formerly Parmalat) factory in North Bendigo
• George Weston Foods factory at Castlemaine
114 EM-COP – Gas Pipelines Overlay Layer
115 EMV (2018): https://files-em.em.vic.gov.au/public/EMV-web/2018_All_Sectors_Resilience_Report.pdf
116 https://aip.com.au/sites/default/files/download-files/2017-09/At%20a%20Glance%20Australian%20Oil%20Refineries.pdf
117 DJPR (2020): https://djpr.vic.gov.au/about-us/overview/strategies-and-initiatives/advancing-victorian-manufacturing
118 DJPR (2020): https://www.rdv.vic.gov.au/victorias-regions/loddon-mallee

Environmental Scan Report: Loddon Mallee Region
Page 42 of 123 Date: 14 September 2020 FINAL 2.0 Public Version
• Hazeldene’s Chicken Farm at Lockwood
• Loddon Valley Eggs at Bridgewater
• Laucke Flour Mills at Bridgewater
• Hy-Line Australia at Bagshot
• Southern Stock Feeds at Bridgewater
• True Foods at Maryborough
• Thales Australia at Bendigo
• Keech Australia at Bendigo
Key assets and infrastructure may include:
• Warehousing and distribution centres
• Complex logistics networks
• Multiple modes of transport
7.3.1 Food supply chain
The safety, security and continuity of Australia’s food supply is complicated. It is a nationally distributed
system, generally owned and operated by the private sector, with oversight from the Department of
Agriculture, Water and the Environment (DAWE) and other industry and government agencies. However,
“States and territories have the lead responsibility for planning for and responding to emergency events
within their jurisdictions.”119 Emergency situations that could give rise to supply chain disruptions, with
downstream effects on consumers, include:
• Pandemic
• Biosecurity concern (e.g., foot and mouth disease)
• Drought
• Industrial action
• Natural disaster
• Severe weather event
• Terrorist attack
119 DAWR (2020): https://www.agriculture.gov.au/ag-farm-food/food/food-chain-resilience

Environmental Scan Report: Loddon Mallee Region
Page 43 of 123 Date: 14 September 2020 FINAL 2.0 Public Version
• Food or water contamination
• Power, water or communications outage
Figure 17 provides an overview of the food supply chain and its dependencies.
Figure 17. Overview of food supply chain and dependencies120
7.4 Transport
The LMR is located along strategically important intrastate and interstate transport routes. Roads connect
the northern Loddon Mallee to major markets and population centres of southern Victoria, Adelaide, Sydney
and regional southern NSW, and in the south provide for the increased flow of traffic between Bendigo and
Melbourne.121
The vast majority of trips by people within and from the LMR are made by car, which presents particular
challenges for ageing and disadvantaged groups in more rural areas. Public transport options decrease the
further the distance travelled from Melbourne, with only the Bendigo-Swan Hill, Bendigo-Echuca and
Ballarat-Maryborough train lines offering passenger services, while a mix of private and community bus
services provide links between larger centres and smaller towns.122
120 DAFF (2012): https://www.agriculture.gov.au/sites/default/files/sitecollectiondocuments/ag-food/food/national-food-plan/submissions-
received/resilience-food-supply.pdf
121 DJPR (2014): https://www.rdv.vic.gov.au/__data/assets/pdf_file/0004/1663618/Loddon_Mallee_RSP-1-Web.pdf
122 DJPR (2014): https://www.rdv.vic.gov.au/__data/assets/pdf_file/0004/1663618/Loddon_Mallee_RSP-1-Web.pdf

Environmental Scan Report: Loddon Mallee Region
Page 44 of 123 Date: 14 September 2020 FINAL 2.0 Public Version
7.4.1 Transport infrastructure
Major transport infrastructure in the LMR is outlined below, and discussed further by mode in the following
sections:
Table 18. Transport infrastructure (km) by LGA (2015)123
LGA Major Roads
Major Rail
Distance to Melbourne
CBD124
% Population close to Public Transport125
Buloke Shire 756.9 262.5 278 7.1%
Campaspe Shire 550.0 195.3 208 23.2%
Central Goldfields Shire 183.9 115.8 169 45.4%
City of Greater Bendigo 474.9 195.4 279 9.3%
Gannawarra Shire 443.4 157.9 145 57.8%
Loddon Shire 640.8 241.7 248 8.0%
Macedon Ranges Shire 227.2 97.9 55 14.3%
Mildura Rural City 663.2 366.5 541 52.7%
Mount Alexander Shire 259.8 108.2 121 24.8%
Swan Hill Rural City 463.1 237.6 338 38.4%
LMR Total 4,663.2 1,978.8
7.4.2 Roads
More than 4,600 km of major roads traverse the LMR, including major highways, freeways, arterial roads,
bridges and tunnels.
The road network is shown in the figure below, with darker red representing arterial roads, and lighter red
municipal roads and tracks. This network includes:
• Calder Freeway/Highway – Melbourne-Gisborne-Kyneton-Bendigo-Inglewood-Mildura link
• Sturt Highway – Adelaide-Mildura-Hay-Wagga Wagga link
• Murray Valley Highway – Robinvale-Swan Hill-Echuca-Wodonga-Towong link
• Sunraysia Highway – Ouyen-Donald-Ballarat link
• Henty Highway – Portland-Horsham-Hopetoun-Lascelles link
• Mallee Highway – Tailem Bend-Ouyen-Balranald link
• Midland Highway – Geelong-Ballarat-Bendigo-Shepparton-Wangaratta-Mansfield link
123 EMV (2020): Potential Impact Reports (by LGA)
124 DJPR (2020): https://www.rdv.vic.gov.au/information-portal/table-and-chart
125 DJPR (2020): https://www.rdv.vic.gov.au/information-portal/table-and-chart

Environmental Scan Report: Loddon Mallee Region
Page 45 of 123 Date: 14 September 2020 FINAL 2.0 Public Version
• Loddon Valley Highway – Bendigo-Kerang link
• Northern Highway – Echuca-Heathcote-Wallan link
• McIvor Highway – Bendigo-Heathcote link
• Pyrenees Highway – Elphinstone-Maryborough-Avoca-Ararat link
• Wimmera Highway – Bendigo-St Arnaud-Horsham link
• Northern Highway – Melbourne-Heathcote-Elmore-Rochester-Echuca
Figure 18. Main roads within the LMR126
126 Data Vic (2020): https://discover.data.vic.gov.au/dataset/road-network-vicmap-transport

Environmental Scan Report: Loddon Mallee Region
Page 46 of 123 Date: 14 September 2020 FINAL 2.0 Public Version
Figure 19. Density of road network within the LMR127
The calculated road lengths (km) for each LGA in the LMR below are based on the Department of
Transport’s standard categories:
127 Data Vic (2020): https://discover.data.vic.gov.au/dataset/road-network-vicmap-transport

Environmental Scan Report: Loddon Mallee Region
Page 47 of 123 Date: 14 September 2020 FINAL 2.0 Public Version
Table 19. Road Lengths in LMR by LGA128
LGA F
reew
ay
Hig
hw
ay
Art
eri
al
Su
b-A
rteri
al
Co
llecto
r
Lo
cal
2W
D
4W
D
Walk
ing
Tra
ck
Bik
e P
ath
Buloke Shire - 323 428 625 232 2,725 2,893 342 2 -
Campaspe Shire - 186 352 583 25 2,808 2,592 421 52 2
Central Goldfields Shire - 40 126 294 10 561 1,424 148 2 2
City of Greater Bendigo - 107 340 177 19 1,629 2,030 339 2 -
Gannawarra Shire - 231 242 480 20 2,516 2,061 186 188 5
Loddon Shire - 205 430 661 199 2,789 3,770 267 21 4
Macedon Ranges Shire 127 6 95 242 149 891 1,701 214 27 5
Mildura Rural City - 357 131 125 77 2,784 6,732 3,141 121 -
Mount Alexander Shire 60 90 95 433 - 519 1,186 160 37 12
Swan Hill Rural City - 224 238 446 2 3,310 1,908 256 7 -
LMR Total 187 1,769 2,477 4,065 732 20,530 26,297 5,473 459 30
A listing of the major roads is also provided below:
Table 20. Major roads in LMR by LGA129
LGA Major Roads
Buloke Shire – 756.9km
Aitken Av
Armstrong St
Berriwillock -Springfield Rd
Best St
Birchip -Corack Rd
Birchip - Rainbow Rd
Birchip -Sea Lake Rd
Birchip -Wycheproof Rd
Boort -Charlton Rd
Boort -Wycheproof Rd
Borung Hwy
Calder Hwy
Camp St
Campbell St
Main St
Mccracken Av
Mildura Way
Mount St
Oconnor St
Park St
Robinvale-Sea Lake Rd
Sea Lake - Swan Hill Rd
St Arnaud - Wycheproof Rd
Sunraysia Hwy
Ultimo Rd
Warracknabeal -Birchip Rd
Watchem Rd
Woods St
128 Data Vic (2020): https://discover.data.vic.gov.au/dataset/road-network-vicmap-transport
129 EMV (2020): Potential Impact Reports (by LGA)

Environmental Scan Report: Loddon Mallee Region
Page 48 of 123 Date: 14 September 2020 FINAL 2.0 Public Version
LGA Major Roads
Charlton - St Arnaud Rd
Corack Rd
Culgoa -Lalbert Rd
Culgoa -Ultimo Rd
Cumming Av
Donald -Murtoa Rd
Donald -Stowell Rd
Donald -Swan Hill Rd
Donald Rd
Hammill St
High St
Hooper Ct
Hopetoun -Sea Lake Rd
Horace St
Main St
Mccracken Av
Mildura Way
Mount St
Oconnor St
Park St
Robinvale-Sea Lake Rd
Sea Lake - Swan Hill Rd
St Arnaud - Wycheproof Rd
Sunraysia Hwy
Ultimo Rd
Warracknabeal -Birchip Rd
Watchem Rd
Woods St
Campaspe Shire – 550.0km
Albion St
Allan St
Bendigo - Murchison Rd
Bendigo - Tennyson Rd
Bridge Rd
Brudenell St
Byrneside - Kyabram Rd
Cobb Hwy
Cornelia Creek Rd
Curr Rd
Dingee Rd
Echuca - Mitiarno Rd
Echuca Rd
Edis St
Elizabeth St
Girgarre - Rushworth Rd
Graham Rd
Hawdon Rd
Heathcote - Rochester Rd
Henderson Rd
Heygarth St
High St
John Allan Rd
Lancaster - Mooroopna Rd
Lancaster Rd
Leitchville - Pyramid Rd
Lowry St
Mccormick Rd
Mcewen Rd
Mckenzie Rd
Midland Hwy
Mitchell St
Moora Rd
Moore St
Murchison Rd
Murray Valley Hwy
Northern Hwy
Ogilvie Av
Prairie - Rochester Rd
Rushworth - Tatura Rd
Stanhope Rd
Station St
Warren St
Webb Rd
Central Goldfields Shire – 183.9km
Avoca Rd
Ballarat -Maryborough Rd
Bendigo -Maryborough Rd
Bridgewater - Dunolly Rd
Broadway
Inkerman St
Landrigan Rd
Lexton-Talbot Rd
Maryborough -Dunolly Rd
Maryborough -St Arnaud Rd

Environmental Scan Report: Loddon Mallee Region
Page 49 of 123 Date: 14 September 2020 FINAL 2.0 Public Version
LGA Major Roads
Bucknall St
Carisbrook -Eddington Rd
Derby Rd
Dunach -Eddington Rd
Dunolly -Eddington Rd
Dunolly -Moliagul Rd
Elgin Rd
Elgin St
Gladstone St
High St
Napier St
Park Rd
Phelan Rd
Pyrenees Hwy
Simson St
Sutton Rd
Tuaggra St
Tweeddale St
Victoria St
Wimmera Hwy
City of Greater Bendigo – 474.9km
Adam St
Arnold St
Barnard St
Bendigo - Eaglehawk Rd Bendigo - Maldon Rd Bendigo - Maryborough Rd Bendigo - Murchison Rd Bendigo - Pyramid Rd Bendigo - Tennyson Rd Bridge St
Calder Alternative Hwy
Calder Hwy
Chapel St
Condon St
Creeth St
Don St
Eaglehawk Rd
Elmore -Raywood Rd
Gladstone St
Hamelin St
Hattam St
Heathcote - Kyneton Rd
Heathcote - Nagambie
Rd Heathcote -Redesdale Rd
Heathcote -Rochester Rd Heinz St
High St
Holdsworth Rd
Holmes Rd
Inglis St
Kilmore Rd
Kyneton -Redesdale Rd
Lockwood Rd
Loddon Valley Hwy
Lucan St
Lyell Rd
Mackenzie St West
Margaret St
Marong Rd
Mccrae St
McIvor Hwy
McIvor Rd
Midland Hwy
Miller St
Mitchell St
Myers St
Myrtle St
Napier St
Northern Hwy
Oak St
Olinda St
Pall Mall
Powells Av
Pyke St
Reservoir Rd
Rohs Rd
Russell St
Sailors Gully Rd Sparrowhawk Rd
Specimen Hill Rd Strathfieldsaye Rd
Stray St
Strickland Rd
Sutton Grange -Redesdale Rd
Townsend St
Weeroona Av
Wellington St
Wills St

Environmental Scan Report: Loddon Mallee Region
Page 50 of 123 Date: 14 September 2020 FINAL 2.0 Public Version
LGA Major Roads
Wimmera Hwy
Gannawarra Shire – 443.4km
Airport Rd
Benjeroop - Lake Charm Rd
Boo rt - Kerang Rd
Boort - Quambatook Rd
Cohuna - Koondrook Rd
Cohuna - Leitchville Rd
Cohuna - McMillans Rd
Donald - Swan Hill Rd
Dumosa - Quambatook Rd
Gonn Av
Grigg Rd
Guthrie St
Kerang - Koondrook Rd
Kerang - Murra bit Rd
Kerang - Quambatook Rd
Kerang Rd
King George St
Koondrook- Murrabit Rd
Lalbert - Kerang Rd
Leitchville - Kerang Rd
Leitchville - Pyramid Rd
Leitchville Rd
Loddon Valley Hwy
Mildred St
Murrabit Rd
Murrabit West Rd
Murray Valley Hwy
Olive St
Pyramid - Cohuna Rd
Quambatook - Boort Rd
Quambatook - Swan Hill Rd
Thule St
Victoria St
Wellington St
Loddon Shire – 640.8km
Allen St
Arnold Rd
Barber St
Bell St
Bendigo - Maryborough Rd
Bendigo - Pyramid Rd
Boort - Charlton Rd
Boort - Kerang Rd
Boo rt - Mitiamo Rd
Boort - Pyramid Rd
Boort - Quambatook Rd
Boort - Wedderburn Rd
Boort - Wycheproof Rd
Bridgewater - Dunolly Rd
Bridgewater - Moldan Rd
Bridgewater - Serpentine Rd
Brooke St
Calder Hwy
Clyde St
Commercial Rd
Dunolly - Eddington Rd
Dunolly - Moliagul Rd
Durham Ox - Pyramid Rd
Heales St
High St
Inglewood Rd
Kelly St
King St
Leitchville - Pyramid Rd
Loddon Valley Hwy
Logan - Wedderburn Rd
Lyons St
Mack St
Main St
Mcmillans Rd
Mitiamo - Kerang Rd
Malaga - Durham Ox Rd
Peppercorn Way
Perryman St
Prairie - Rochester Rd
Pyramid - Cohuna Rd
Pyramid - Mincha Rd
Queen St
Racecourse Rd
River St
Serpentine Rd

Environmental Scan Report: Loddon Mallee Region
Page 51 of 123 Date: 14 September 2020 FINAL 2.0 Public Version
LGA Major Roads
Durham Ox Rd
Echuca - Mitiamo Rd
Eddington Rd
Gladfield Rd
Glossop St
Godfrey St
St Arnaud Rd
Vernon St
Victoria St
Welsh St
Wimmera Hwy
Macedon Ranges Shire – 227.2km
Aitken St
Avenue Of Honour -Calder Out Ramp Bacchus Marsh Rd
Beauchamp St
Bourke St
Burton -Calder In Ramp
Burton -Calder Out Ramp
Burton Av
Calder Fwy
Calder Hwy
Calder In -Avenue Of Honour Ramp Calder In - Burton Ramp
Calder In - Edgecombe Ramp
Calder In - Macedon - Woodend Ramp Calder In - Malmsbury East Ramp Calder In - Melbourne Ramp
Calder In - Ramsey Ramp
Calder In - Springvale Ramp
Calder In - Station Ramp
Calder Out -Couangalt Ramp
Calder Out - Edgecombe Ramp
Calder Out - Macedon -Woodend Ramp Calder Out - Malmsbury East Ramp Calder Out - Melbourne Ramp
Calder Out - Mount Macedon Ramp Calder Out - Ramsey Ramp
Calder Out - Springvale Ramp
Calder Out - Station Ramp
Calder Out -Trio Ramp
Chisholm Av
Couangalt -Calder Out Ramp
Daylesford - Malmsbury Rd
Daylesford Rd
Degraves Mill Dr
Edgecombe -Calder In Ramp
Edgecombe -Calder Out Ramp
Edgecombe Rd
Edgecombe St
Hamilton St
Heathcote - Kyneton Rd
High St
Kyneton -Trentham Rd
Lancefield -Tooborac Rd
Macedon - Woodend -Calder In Ramp Macedon - Woodend - Calder Out Ramp Main Rd
Main St
Malmsbury East -Calder Out Ramp Malmsbury East -Calder In Ramp Melbourne -Calder In Ramp
Melbourne -Calder Out Ramp Melbourne - Lancefield Rd
Melbourne Rd
Melton Rd
Mollison St
Mount Macedon -Calder In Ramp
Piper St
Riddell Rd
Robertson St
Ramsey -Calder In Ramp
Ramsey -Calder Out Ramp
Saleyards Rd
Springvale -Calder In Ramp
Springvale -Calder Out Ramp
Station -Calder In Ramp
Station -Calder Out Ramp
Station Rd
Trentham Rd
Trio -Calder In Ramp
Trio Rd
Mildura Rural City – 663.2km
Baring Rd Kulkyne Way

Environmental Scan Report: Loddon Mallee Region
Page 52 of 123 Date: 14 September 2020 FINAL 2.0 Public Version
LGA Major Roads
Benetook Av
Calder Hwy
Commercial St
Cotter St
Cowanna Av
Cregan St
Deakin Av
Eleventh St
Farrell St
Fifteenth St
Flora Av
Ginquam Av
Gregory St
Hattah - Robinvale Rd
Hopetoun -Walpeup Rd
Hughes St
Jacaranda St
Main Av North
Main Av South
Mallee Hwy
Mckenzie St
Mena Rd
Millewa Rd
Murphys Rd
Ranfurly Way
Reilly St
Rowe St
Seventeenth St
Seventh St
Seventh St East
Sturt Hwy
Sunraysia Hwy
Third St
Wentworth Rd
Mount Alexander Shire – 259.8km
Baringhup Rd
Barker St
Bassetts - Calder In Ramp
Bendigo - Maldon Rd
Bridgewater - Maldon Rd
Calder Fwy
Calder Hwy
Calder In - Bassetts Ramp
Calder In -Victoria Ramp
Calder Out - Midland Ramp
Calder Out - Unnamed Ramp
Castlemaine - Maldon Rd
Creswick - Newstead Rd
Daylesford - Newstead Rd
Diggers Way
Duke St
Elizabeth St
Fletcher St
Forest St
Harmony Way
Heathcote - Kyneton Rd
Hepburn - Newstead Rd
High St
Hornsby St
Johnstone St
Lyell Rd
Main Rd
Main St
Maldon - Newstead Rd
Maldon Rd
Midland - Calder Out Ramp
Midland Hwy
Morris St
Newstead Rd
Parker St
Pyrenees Hwy
Templeton St
Tivey St
Calder In Ramp
Victoria Rd
Wright St
Swan Hill Rural City – 463.1km
Balranald Rd
Bromley Rd
Campbell St
Murray Valley Hwy
Nyah Rd
Quambatook- Swan Hill Rd

Environmental Scan Report: Loddon Mallee Region
Page 53 of 123 Date: 14 September 2020 FINAL 2.0 Public Version
LGA Major Roads
Culgoa - Ultimo Rd
Curlewis St
Donald - Swan Hill Rd
Hattah - Robinvale Rd
Larundel St
Mallee Hwy
Mccallum St
Murray St
Quambatook Rd
Robinvale -Sea Lake Rd
Sea Lake - Swan Hill Rd
Stradbroke Av
Swan Hill - Moulamein Rd
Tooleybuc Rd
Wattle St
Wattle St South
7.4.3 Rail
More than 1,900km of major rail crosses the LMR, including stations, lines and hubs.
The rail network is shown in the figure below and includes: 130
• Direct passenger and freight rail routes from Maryborough (via Ballarat), Swan Hill, Echuca and
Bendigo to Melbourne.
• Direct freight rail routes from Mildura, Kulwin and Robinvale lines via Dunolly and Ballarat to
Melbourne, Geelong and Portland.
Figure 20. Rail networks in the LMR131
130 EMV (2020): Potential Impact Reports (by LGA)
131 Data Vic (2020): https://discover.data.vic.gov.au/dataset/road-network-vicmap-transport

Environmental Scan Report: Loddon Mallee Region
Page 54 of 123 Date: 14 September 2020 FINAL 2.0 Public Version
Train stations
There are 15 train stations in the LMR with locations and services as outlined below:
Table 21. Train stations in LMR by LGA132,133
LGA No. Train stations
Station name(s) Services Latitude and Longitude
Buloke Shire 0 Nil Nil Nil
Campaspe Shire 2 Rochester Railway Station
Echuca Railway Station
V/Line – Bendigo Line
V/Line – Bendigo Line (Terminus)
-36.36236; 144.698681
-36.130982; 144.753459
Central Goldfields Shire
2 Talbot Railway Station
Maryborough Railway Station
V/Line – Maryborough Line
V/Line – Maryborough Line
-37.172899; 143.70564
-37.050908; 143.742402
City of Greater Bendigo
4 Kangaroo Flat Railway Station
Bendigo Railway Station
Eaglehawk Railway Station
Epsom Railway Station
Elmore Railway Station
V/Line – Bendigo Line
V/Line – Bendigo Line
V/Line – Swan Hill Line
V/Line – Bendigo Line
V/Line – Bendigo Line
-36.794834; 144.24899
-36.76567; 144.283009
-36.718525; 144.24838
-36.706342; 144.32104
-36.49502; 144.607758
Gannawarra Shire 1 Kerang Railway Station V/Line – Swan Hill Line -35.733122; 143.924425
Loddon Shire 2 Dingee Railway Station
Pyramid Railway Station
V/Line – Swan Hill Line
V/Line – Swan Hill Line
-36.369233; 144.23112
-36.053113; 144.113133
Macedon Ranges Shire
2 Clarkefield Railway Station
Riddells Creek Railway Station
Gisborne Railway Station
Macedon Railway Station
Woodend Railway Station
Kyneton Railway Station
Malmsbury Railway Station
V/Line – Bendigo Line
V/Line – Bendigo Line
V/Line – Bendigo Line
V/Line – Bendigo Line
V/Line – Bendigo Line
V/Line – Bendigo Line
V/Line – Bendigo Line
-37.483498; 144.745373
-37.465124; 144.679831
-37.458825; 144.598722
-37.423573; 144.561397
-37.358799; 144.52589
-37.258279; 144.450602
-37.18974; 144.375323
Mildura Rural City 0 Nil Nil Nil
Mount Alexander Shire
1 Castlemaine Railway Station
V/Line – Bendigo Line -37.062837; 144.213799
Swan Hill Rural City 1 Swan Hill Railway Station
V/Line – Swan Hill Line -35.341114; 143.562343
Total 15
132 Data Vic (2020): https://discover.data.vic.gov.au/dataset/foi-point-vicmap-features-of-interest
133 DOT (2020): https://www.vline.com.au/getattachment/f8a1e2c3-5d60-4abe-b608-2bc18e9f8197/V-Line-Network-Map
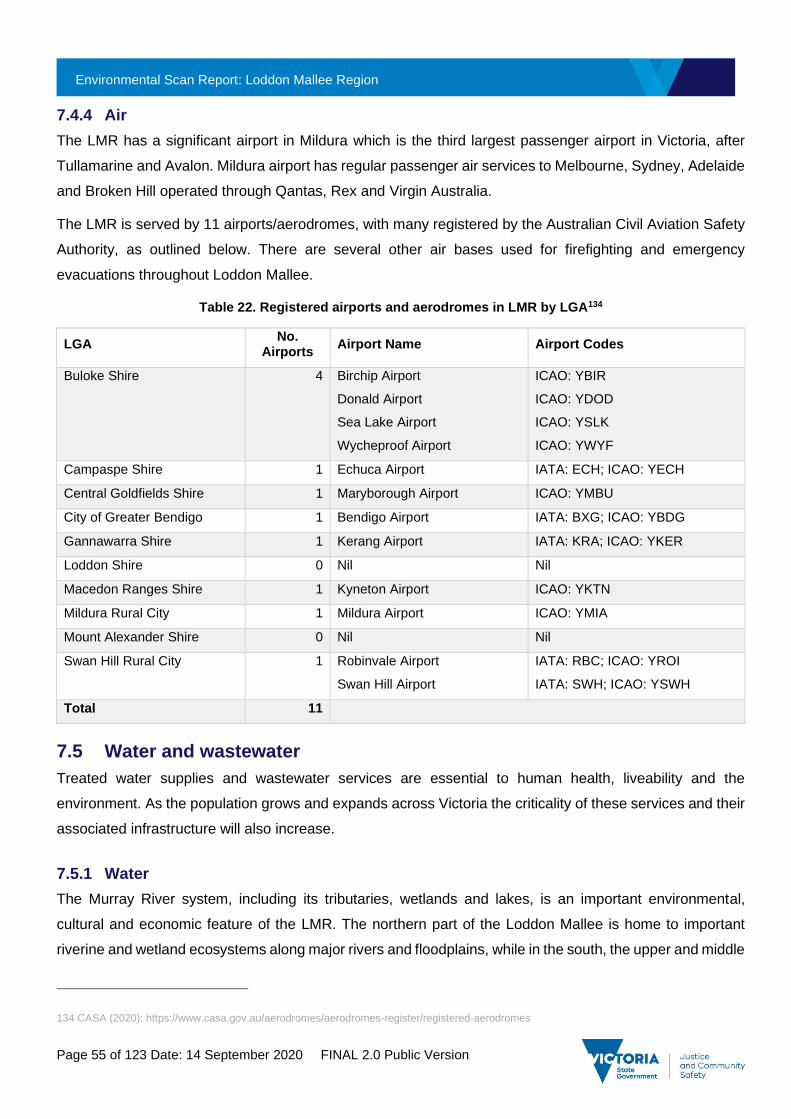
Environmental Scan Report: Loddon Mallee Region
Page 55 of 123 Date: 14 September 2020 FINAL 2.0 Public Version
7.4.4 Air
The LMR has a significant airport in Mildura which is the third largest passenger airport in Victoria, after
Tullamarine and Avalon. Mildura airport has regular passenger air services to Melbourne, Sydney, Adelaide
and Broken Hill operated through Qantas, Rex and Virgin Australia.
The LMR is served by 11 airports/aerodromes, with many registered by the Australian Civil Aviation Safety
Authority, as outlined below. There are several other air bases used for firefighting and emergency
evacuations throughout Loddon Mallee.
Table 22. Registered airports and aerodromes in LMR by LGA134
LGA No.
Airports Airport Name Airport Codes
Buloke Shire 4 Birchip Airport
Donald Airport
Sea Lake Airport
Wycheproof Airport
ICAO: YBIR
ICAO: YDOD
ICAO: YSLK
ICAO: YWYF
Campaspe Shire 1 Echuca Airport IATA: ECH; ICAO: YECH
Central Goldfields Shire 1 Maryborough Airport ICAO: YMBU
City of Greater Bendigo 1 Bendigo Airport IATA: BXG; ICAO: YBDG
Gannawarra Shire 1 Kerang Airport IATA: KRA; ICAO: YKER
Loddon Shire 0 Nil Nil
Macedon Ranges Shire 1 Kyneton Airport ICAO: YKTN
Mildura Rural City 1 Mildura Airport ICAO: YMIA
Mount Alexander Shire 0 Nil Nil
Swan Hill Rural City 1 Robinvale Airport
Swan Hill Airport
IATA: RBC; ICAO: YROI
IATA: SWH; ICAO: YSWH
Total 11
7.5 Water and wastewater
Treated water supplies and wastewater services are essential to human health, liveability and the
environment. As the population grows and expands across Victoria the criticality of these services and their
associated infrastructure will also increase.
7.5.1 Water
The Murray River system, including its tributaries, wetlands and lakes, is an important environmental,
cultural and economic feature of the LMR. The northern part of the Loddon Mallee is home to important
riverine and wetland ecosystems along major rivers and floodplains, while in the south, the upper and middle
134 CASA (2020): https://www.casa.gov.au/aerodromes/aerodromes-register/registered-aerodromes

Environmental Scan Report: Loddon Mallee Region
Page 56 of 123 Date: 14 September 2020 FINAL 2.0 Public Version
reaches of the Campaspe, Coliban and Loddon rivers are important catchment areas supporting urban
populations and agriculture.
The Wimmera Mallee Pipeline was a major project completed in 2010, which has delivered reliable and
high-quality water to towns, for domestic and stock uses, for lakes and weirs for consumption, and for
recreation and industrial uses. It comprises 9,159 kilometres of rural pipeline which provides a continuous
water supply to around 7,000 rural customers and 36 towns across the Wimmera and Mallee. Recreational
lakes and weirs in the region are also supplied via the Wimmera Mallee Pipeline, from both the Grampians
reservoir system through the Wimmera Mallee and via Grampian Wimmera Mallee Water’s Murray River
allocations.135
Water security is heavily impacted by both long-term trends – such as increasing population growth,
urbanisation and climate change – and sudden events, including floods and oil spills. Some examples of
the impacts such events could have include:
• Diminished agricultural production leading to a decline in gross domestic product.
• Health risks, such as blue-green algae outbreaks, which can be triggered by changes in nutrients and
salinity, storage volumes, water flow and warmer weather. Large numbers of blue-green algae can
produce toxins harmful to humans, animals, birds, livestock and the environment.136
• An increasing reliance on groundwater, which in Victoria is primarily used by dairy farms and other
livestock, for irrigating crops, power generation and town water supplies.137
In a range of emergencies, including blue-green algae incidents, dam safety issues and disruption to water
services – DELWP is charged with responsibility for responding to and mitigating the impact of such
events.138
Since 2006 the water sector has been identified as an essential service according to an Act of Parliament,139
which requires Victoria’s water organisations to have risk management plans in place which include
provisions for terrorist acts. Water resources are also particularly susceptible to all hazard events, including
bushfires, drought, floods, earthquakes, cyclones, contamination and epidemics. Individual disruptions to
infrastructure in one area can have an impact on the response and recovery efforts in other areas because
water is both dependent and interdependent on infrastructure networks across Victoria. For example, water
supplies rely on electric power to operate distribution pumps while electric power requires water for electricity
135 GWM Matter (2020): https://www.gwmwater.org.au/component/edocman/885-recreation-lake-and-weir-pools-map/download
136 DELWP (2020): https://www.water.vic.gov.au/waterways-and-catchments/rivers-estuaries-and-waterways/blue-green-algae
137 DELWP (2020): https://www.water.vic.gov.au/groundwater/victorias-groundwater-resources
138 DELWP (2019): https://www.water.vic.gov.au/managing-dams-and-water-emergencies/emergency-management
139 The Terrorism (Community Protection) Act 2003.community protection

Environmental Scan Report: Loddon Mallee Region
Page 57 of 123 Date: 14 September 2020 FINAL 2.0 Public Version
generation. So too, the water sector relies on supply chains, including the transport sector, to provide
chemicals for water treatment and disinfection and may share common service corridors.140
Several government departments and agencies share responsibility for managing and protecting Victoria’s
bays, rivers and ports, including:
• Parks Victoria
• Fisheries Victoria
• Department of Environment, Land, Water and Planning (DELWP)
• Department of Transport
• Environmental Protection Agency (EPA)
• Water Police141
Key water storages in the LMR are managed by Goulburn Murray Water, Coliban Water and Southern Rural
Water.
140 Global Terrorism Research Centre (2015):
https://www.researchgate.net/publication/275658307_Plan_Prepare_and_Safeguard_Water_Critical_Infrastructure_Protection_in_Australia
141 Parks Victoria (2020): https://www.parks.vic.gov.au/water-management

Environmental Scan Report: Loddon Mallee Region
Page 58 of 123 Date: 14 September 2020 FINAL 2.0 Public Version
Reservoirs
There are 21 reservoirs in the LMR, as outlined below:
Table 23. Reservoirs in LMR by LGA142
LGA No.
Reservoirs Reservoir name(s)
Capacity (ML)
Water Authority
Campaspe Shire
4
Greens Lake
Waranga Basin
Torrumbarry Weir
Kow Swamp
32,500
432,360
36,810
51,640
Goulburn-Murray Water
Central Goldfields Shire 2
Tullaroop Reservoir
Cairn Curran Reservoir (also in Mount Alexander Shire)
72,950
147,130
Goulburn-Murray Water
City of Greater Bendigo
3
Sandhurst Reservoir 2,405 Coliban Water
Lake Eppalock
Spring Gully Reservoir
304,651
1,680
Goulburn-Murray Water (Coliban Water has a % share)
Gannawarra Shire
3
Middle and Reedy Lakes
Kangaroo Lake
Lake Charm
5,900
39,710
21,970
Goulburn-Murray Water
Loddon Shire 1 Laanecoorie Reservoir 8,000 Goulburn-Murray Water
Macedon Ranges Shire
4
Rosslynne Reservoir Southern Rural Water
Upper Coliban Reservoir
Lauriston Reservoir
Malmsbury Reservoir
37,770
19,790
12,034
Coliban Water
Mildura Rural City 1 Mildura Weir 36,600 Goulburn-Murray Water
Mount Alexander Shire 2
Barkers Creek
McCay Reservoir
1,673
1,365
Coliban Water
Swan Hill Rural City
1 Lake Boga 37,794 Goulburn-Murray Water
Total 21
For areas with mains drinking water, most of these systems are treated to potable standard meeting the
Australian Drinking Water Guidelines. While the main systems are predominately based around surface
water supplies from reservoirs, there are also some communities that rely on groundwater for drinking water.
Table 24 outlines the areas serviced by water supply systems in the region. These include networks of
system storages (tanks and basins), pumping stations and pipes. A system of bulk water entitlements
governs the extraction of water from these storages and systems143.
142 DELWP (2020): https://www.water.vic.gov.au/water-reporting/water-in-your-region
143 https://waterregister.vic.gov.au/water-entitlements
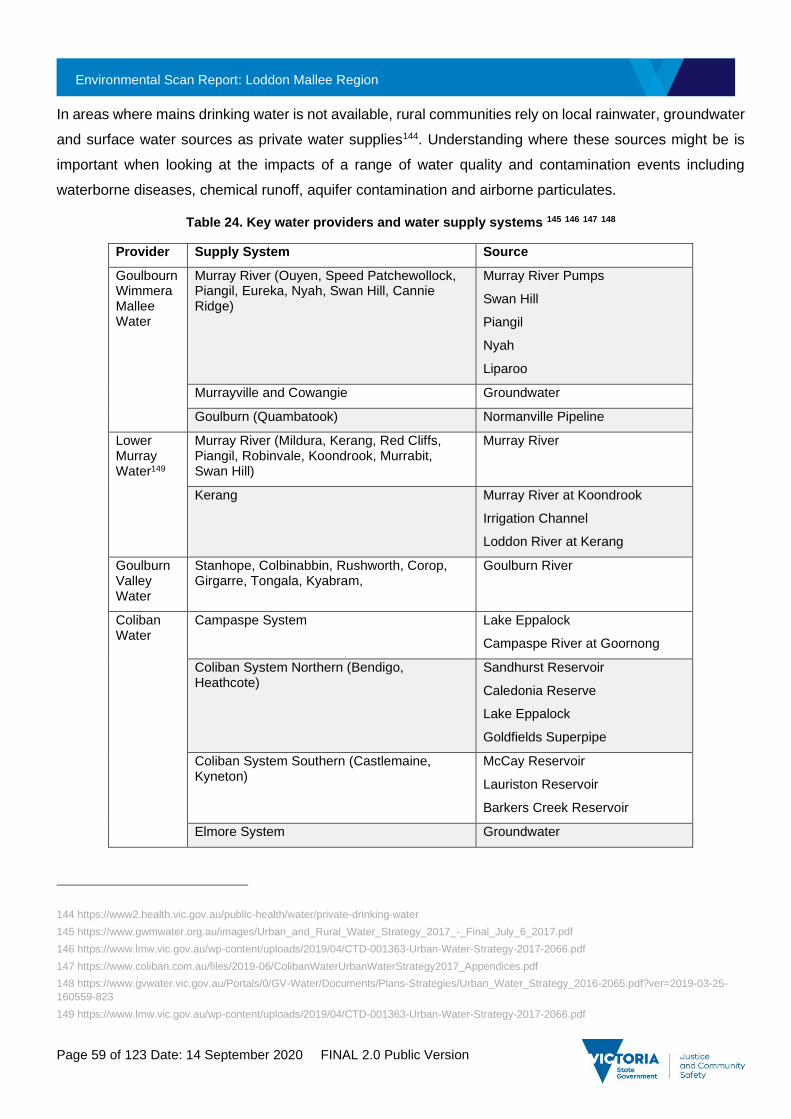
Environmental Scan Report: Loddon Mallee Region
Page 59 of 123 Date: 14 September 2020 FINAL 2.0 Public Version
In areas where mains drinking water is not available, rural communities rely on local rainwater, groundwater
and surface water sources as private water supplies144. Understanding where these sources might be is
important when looking at the impacts of a range of water quality and contamination events including
waterborne diseases, chemical runoff, aquifer contamination and airborne particulates.
Table 24. Key water providers and water supply systems 145 146 147 148
Provider Supply System Source
Goulbourn Wimmera Mallee Water
Murray River (Ouyen, Speed Patchewollock, Piangil, Eureka, Nyah, Swan Hill, Cannie Ridge)
Murray River Pumps
Swan Hill
Piangil
Nyah
Liparoo
Murrayville and Cowangie Groundwater
Goulburn (Quambatook) Normanville Pipeline
Lower Murray Water149
Murray River (Mildura, Kerang, Red Cliffs, Piangil, Robinvale, Koondrook, Murrabit, Swan Hill)
Murray River
Kerang Murray River at Koondrook
Irrigation Channel
Loddon River at Kerang
Goulburn Valley Water
Stanhope, Colbinabbin, Rushworth, Corop, Girgarre, Tongala, Kyabram,
Goulburn River
Coliban Water
Campaspe System Lake Eppalock
Campaspe River at Goornong
Coliban System Northern (Bendigo, Heathcote)
Sandhurst Reservoir
Caledonia Reserve
Lake Eppalock
Goldfields Superpipe
Coliban System Southern (Castlemaine, Kyneton)
McCay Reservoir
Lauriston Reservoir
Barkers Creek Reservoir
Elmore System Groundwater
144 https://www2.health.vic.gov.au/public-health/water/private-drinking-water
145 https://www.gwmwater.org.au/images/Urban_and_Rural_Water_Strategy_2017_-_Final_July_6_2017.pdf
146 https://www.lmw.vic.gov.au/wp-content/uploads/2019/04/CTD-001363-Urban-Water-Strategy-2017-2066.pdf
147 https://www.coliban.com.au/files/2019-06/ColibanWaterUrbanWaterStrategy2017_Appendices.pdf
148 https://www.gvwater.vic.gov.au/Portals/0/GV-Water/Documents/Plans-Strategies/Urban_Water_Strategy_2016-2065.pdf?ver=2019-03-25-
160559-823
149 https://www.lmw.vic.gov.au/wp-content/uploads/2019/04/CTD-001363-Urban-Water-Strategy-2017-2066.pdf

Environmental Scan Report: Loddon Mallee Region
Page 60 of 123 Date: 14 September 2020 FINAL 2.0 Public Version
Provider Supply System Source
Coliban Water
Goulburn System (Rochester, Lockington, Dingee, Pyramid Hill, Boort, Serpentine, Jarklin, Macorna, Mysia, Mitiamo)
Waranga Western Channel
Lake Eildon
Campaspe River
Loddon System (Bridgewater, Inglewood, Laanecoorie, Tarnagulla, Dunolly, Bealiba)
Loddon River
Murray System (Cohuna, Leitchville, Gunblower, Echuca)
Murray River
Taylors Creek
Cohuna Channel
Gunblower Creek
Trentham System Groundwater
Reservoir 1
Reservoir 2
Wimmera System (Korong, Wedderburn, Wychitella, Borung)
Wimmera-Mallee pipeline
7.5.2 Emergency water supply points
Victoria has more than 300 emergency water supply points, overseen by DELWP and managed by various
state agencies, for use during drought and bushfires. Some can be used to supply water to firefighting
vehicles.150
7.5.3 Wastewater
There are also numerous water and wastewater treatment plants across the region, with plants in most
towns and multiple plants spread across each LGA. Wastewater treatments plants are regulated by the
Victorian Environment Protection Authority (EPA).
Wastewater can be treated to different levels to allow reuse activities and support safe discharge to the
receiving environment. Class A is the highest grade of recycled water and can be used in residential areas
and to irrigate food crops. Class D is the lowest class and can only be used in areas with low risk of human
contact such as irrigation outside of agricultural food production151. Most treatment plants in Loddon Mallee
treat water to Class C standard or above for recycled use or discharge to environment152. Table 25
summarises the areas in the region serviced by wastewater treatment systems. Local Governments are
responsible for the regulation of septic tanks in areas without sewerage systems.
150 DELWP (2020): https://data.aurin.org.au/dataset/vic-govt-delwp-datavic-water-ewsp-na
151 https://ref.epa.vic.gov.au/our-work/licences-and-approvals/~/media/Publications/464%202.pdf
152 http://www.barwonwater.vic.giv.au/water-and-waste/sewage

Environmental Scan Report: Loddon Mallee Region
Page 61 of 123 Date: 14 September 2020 FINAL 2.0 Public Version
Table 25. Key sewerage service providers and service areas 153 154 155 156
Provider Service area Treatment Plant
Central Highlands Water Maryborough Maryborough
Grampians Wimmera Mallee Water
Local Town systems Various
Lower Murray Water Local towns systems (Koondrook, Murrabit, Swan Hill, Kerang, Lake Boga, Nyah West, Nyah, Robinvale, Irymple, Mildura, Red Cliffs, Merbein)
10 Treatment plants
Coliban Water Coliban System Northern Axedale
Bendigo
Heathcote
Coliban System Southern Castlemaine
Kyneton (Domestic)
Kyneton (Trade waste)
Elmore System Elmore
Goulburn System Boort
Lockington
Pyramid Hill
Rochester
Loddon System Bridgewater
Dunolly
Murray System Gunblower
Cohuna
Echuca
Trentham System Kyneton
Wimmera System Wedderburn
153 https://www.gwmwater.org.au/images/Urban_and_Rural_Water_Strategy_2017_-_Final_July_6_2017.pdf
154 https://www.lmw.vic.gov.au/wp-content/uploads/2019/04/CTD-001363-Urban-Water-Strategy-2017-2066.pdf
155 https://www.coliban.com.au/files/2019-06/ColibanWaterUrbanWaterStrategy2017_Appendices.pdf
156 https://www.gvwater.vic.gov.au/Portals/0/GV-Water/Documents/Plans-Strategies/Urban_Water_Strategy_2016-2065.pdf?ver=2019-03-25-
160559-823

Environmental Scan Report: Loddon Mallee Region
Page 62 of 123 Date: 14 September 2020 FINAL 2.0 Public Version
7.6 Waste and recycling
7.6.1 Landfill
Landfill – the below ground disposal of waste materials that cannot be recycled – continues to be a part of
Victoria’s waste management strategy. Many landfill sites are licensed to accept low-hazard (Category C)
industrial waste. However, prescribed industrial waste can only be accepted at one hazardous (Category B)
landfill in Victoria – this is located in Taylors Road in Dandenong South in the City of Greater Dandenong.157
Closed landfills also pose environmental risks, including from:
• Leachate – a liquid formed by decomposing waste and rainwater – which can contaminate
groundwater; and
• Landfill gas – from decomposing waste – which can migrate to the atmosphere.158
A study conducted by the Fire Services Commissioner in 2012 found that a series of significant fires in
Victorian landfill sites had been costly and resource intensive for fire services to suppress. The need to work
more closely with operators of landfill sites was identified as a recommendation to improve operating
practices and develop fire management plans.159
There are currently 40 sites in the LMR listed in the EPA’s Priority Sites Register which have been issued a
Clean Up Notice or a Pollution Abatement Notice, as the current condition of the sites is incompatible with
the current or approved use and poses a risk to human health or the environment.160 Examples of
contamination and pollution issues experienced in the region include former landfill sites, current and former
industrial sites, historical deposits of mine tailings and dumped industrial waste.161
157 EPA Victoria (2020): https://ref.epa.vic.gov.au/your-environment/waste/landfills
158 EPA Victoria (2020): https://ref.epa.vic.gov.au/your-environment/waste/landfills/closed-landfills.html
159 EMV (2012): https://www.emv.vic.gov.au/how-we-help/reviews-and-lessons-management/operational-reviews/fire-management-at-landfill-
sites
160 EPA Victoria (2020): https://www.epa.vic.gov.au/for-community/environmental-information/land-groundwater-pollution/priority-sites-register
161 EPA Victoria (2020): https://www.epa.vic.gov.au/for-community/environmental-information/land-groundwater-pollution/priority-sites-register

Environmental Scan Report: Loddon Mallee Region
Page 63 of 123 Date: 14 September 2020 FINAL 2.0 Public Version
There are 77 landfill sites across the region, as below:
Table 26. Landfill sites in LMR by LGA162
LGA No. Sites Operating Status and Waste Type
Buloke Shire 5 General waste – 2
Closed – 3
Campaspe Shire 10 Asbestos, tyres, solid inert waste, general waste – 1
Closed – 9
Central Goldfields Shire 7 Closed – 7
City of Greater Bendigo 6 All waste types – 1
Asbestos, contaminated soil (Cat. C), tyres, solid inert waste, general waste – 1
Closed – 4
Gannawarra Shire 12 Asbestos, contaminated soil (Cat. C), solid inert waste, general waste – 1
Closed – 11
Loddon Shire 10 Solid inert waste and general waste – 3
Closed – 7
Macedon Ranges Shire 1 Closed – 1
Mildura Rural City 12 Solid inert waste – 1
Closed – 1
Mount Alexander Shire 4 Asbestos, contaminated soil (Cat. C), solid inert waste, general waste – 1
Closed – 3
Swan Hill Rural City 10 Commercial and industrial waste, general waste, asbestos, contaminated soil (Cat. C) – 1
General waste, commercial and industrial waste – 1
Closed – 8
LMR Total 77
162 Data Vic (2020): https://discover.data.vic.gov.au/dataset/foi-point-vicmap-features-of-interest

Environmental Scan Report: Loddon Mallee Region
Page 64 of 123 Date: 14 September 2020 FINAL 2.0 Public Version
7.6.2 Recycling
There are 49 transfer stations and 118 stockpile sites registered by the EPA (waste in storage for recycling
or reuse), across the region as outlined below:
Table 27. Transfer Stations and EPA Stockpile Sites in LMR by LGA163 164
LGA No. Transfer
Stations No. EPA
Stockpile Sites
Buloke Shire 8 10
Campaspe Shire 7 20
Central Goldfields Shire 4 6
City of Greater Bendigo 4 15
Gannawarra Shire 5 5
Loddon Shire 8 8
Macedon Ranges Shire 3 9
Mildura Rural City 7 26
Mount Alexander Shire 2 3
Swan Hill Rural City 1 16
LMR Total 49 118
7.7 Government services
Regional emergency management plans should consider how to ensure the continuation of government
services to the community during an emergency – a time when they are likely to need vital support. The
coronavirus pandemic of 2020 has already demonstrated the precarious nature of government workforces
and the impact that absenteeism as a direct consequence of a disaster can have flow on effects (e.g., health
care workers in an emergency department who are required to self-isolate for a period of 14 days following
exposure to the virus can lead to the closure of wards or the cessation of elective surgeries which may lead
to diversions for Ambulance Victoria and other care settings being required to pick up the slack).
Government services not already covered in this scan include prisons, community correctional services and
law courts, which can have their own unique issues in the face of an emergency.
7.7.1 Prisons and community correctional facilities
There are two prisons/community correctional facilities in the LMR: Loddon Prison Precinct (Middleton) and
Tarrengower Prison (both in Mount Alexander Shire).165
163 Data Vic (2020): https://discover.data.vic.gov.au/dataset/foi-point-vicmap-features-of-interest
164 EMV (2020): Potential Impact Reports (by LGA)
165 EMV (2020): Potential Impact Reports (by LGA)

Environmental Scan Report: Loddon Mallee Region
Page 65 of 123 Date: 14 September 2020 FINAL 2.0 Public Version
7.7.2 Law courts
There is one County Court and 10 Magistrates courts in the region, as outlined below:
Table 28. Law Courts in LMR by LGA166
LGA No. Courts Name
Buloke Shire 0 N/A
Campaspe Shire 1 Echuca Magistrates Court
Central Goldfields Shire 1 Maryborough Magistrates Court
City of Greater Bendigo 2 Bendigo Magistrates Court
Bendigo County Court
Gannawarra Shire 1 Kerang Magistrates Court
Loddon Shire 0 N/A
Macedon Ranges Shire 1 Kyneton Magistrates Court
Mildura Rural City 2 Mildura Magistrates Court
Ouyen Magistrates Court
Mount Alexander Shire 1 Castlemaine Magistrates Court
Swan Hill Rural City 2 Robinvale Magistrates Court
Swan Hill Magistrates Court
Total 11
166 Data Vic (2020): https://discover.data.vic.gov.au/dataset/foi-point-vicmap-features-of-interest

Environmental Scan Report: Loddon Mallee Region
Page 66 of 123 Date: 14 September 2020 FINAL 2.0 Public Version
7.8 Emergency services
The LMR is served by 32 ambulance stations, 56 police stations, 200 fire stations, 21 SES units and 1
Coast Guard flotilla.
7.8.1 Ambulance stations
There are 32 ambulance stations across the region.
The Ambulance response time performance for Code 1 calls across LGAs for Q4 of the 2019-20 reporting
period is provided below:
Table 29. Ambulance response times for LMR (2019-20)167 168
LGA
No. Stations
Locations
Code 1 – % Responses
within 15 mins
Code 1 – Average response
time (mins)
Buloke Shire 3 Charlton, Donald, Sea Lake 24.3% 27:23
Campaspe Shire 3 Echuca, Kyabram, Rochester 66.5% 13:59
Central Goldfields Shire
1 Maryborough 59.3% 16:52
City of Greater Bendigo
7 Bendigo, Eaglehawk, Epsom, Heathcote, HEMS3, Kangaroo Flat, Strathdale
74.5% 13:17
Gannawarra Shire 2 Cohuna, Kerang 47.1% 21:08
Loddon Shire 3 Boort, Inglewood, Wedderburn 34.9% 21:46
Macedon Ranges Shire
4 Gisborne, Kyneton, Romsey, Woodend 58.7% 14:41
Mildura Rural City 4 Irymple, Mildura, Murrayville, Ouyen 82.0% 11:57
Mount Alexander Shire
1 Castlemaine 48.8% 18:37
Swan Hill Rural City
4 Manangatang, Nyah West, Robinvale, Swan Hill
71.2% 14:24
Total 32
167 Ambulance Victoria (2019): https://www.ambulance.vic.gov.au/ambulance-victoria-data-sets/
168 Data Vic (2020): https://discover.data.vic.gov.au/dataset/foi-point-vicmap-features-of-interest

Environmental Scan Report: Loddon Mallee Region
Page 67 of 123 Date: 14 September 2020 FINAL 2.0 Public Version
7.8.2 Police stations
There are 56 police stations across the region as follows:
Table 30. Police stations in LMR by LGA169
LGA No.
Stations Locations
Buloke Shire 6 Birchip, Charlton, Culgoa, Donald, Sea Lake, Wycheproof
Campaspe Shire 7 Echuca, Gunbower, Kyabram, Rochester, Rushworth, Stanhope, Tongala
Central Goldfields Shire 2 Dunolly, Maryborough
City of Greater Bendigo 6 Axedale, Bendigo, Elmore, Goornong, Heathcote, Raywood
Gannawarra Shire 4 Cohuna, Kerang, Koondrook, Quambatook
Loddon Shire 7 Boort, Bridgewater, Inglewood, Pyramid Hill, Serpentine, Tarnagulla, Wedderburn
Macedon Ranges Shire 8 Gisborne, Kyneton, Lancefield, Macedon, Malmsbury, Riddells Creek, Romsey, Woodend
Mildura Rural City 7 Merbein, Mildura, Murrayville, Ouyen, Red Cliffs, Underbool, Werrimull
Mount Alexander Shire 3 Castlemaine, Maldon, Newstead
Swan Hill Rural City 6 Lake Boga, Manangatang, Nyah, Piangil, Robinvale, Swan Hill
Total 56
7.8.3 Fire stations, lookouts and refuges
There are 200 fire stations across the region as outlined below:
Table 31. Fire Stations and Forest Industry Brigades in LMR by LGA170
LGA No. Stations
(and Brigades)
Station locations
Buloke Shire 29 Berriwillock Fire Station
Birchip Fire Station
Buckrabanyule Fire Station
Charlton Fire Station
Coonooer Bridge Fire Station
Cope Cope Fire Station
Corack East Fire Station
Corack Fire Station
Culgoa Fire Station
Curyo Fire Station
Donald Fire Station
169 Data Vic (2020): https://discover.data.vic.gov.au/dataset/foi-point-vicmap-features-of-interest
170 Data Vic (2020): https://discover.data.vic.gov.au/dataset/foi-point-vicmap-features-of-interest

Environmental Scan Report: Loddon Mallee Region
Page 68 of 123 Date: 14 September 2020 FINAL 2.0 Public Version
LGA No. Stations
(and Brigades)
Station locations
Dumosa Fire Station
Glenloth East Fire Station
Jeffcott Fire Station
Laen East Fire Station
Litchfield Fire Station
Nandaly Fire Station
Narraport Fire Station
Nullawil Fire Station
Reedy Dam Fire Station
Sea Lake Fire Station
Teddywaddy Fire Station
Warmur Fire Station
Watchem Fire Station
Watchupga Fire Station
Wooroonook Fire Station
Wycheproof Fire Station
Wycheproof South Fire Station
Yeungroon Fire Station
Campaspe Shire 22 Bamawm Extension Fire Station
Colbinabbin Fire Station
Corop Fire Station
Corop West Fire Station
Echuca Fire Station
Echuca Village Fire Station
Girgarre Fire Station
Gunbower Fire Station
Kotta Fire Station
Kyabram Fire Station
Lockington Fire Station
Pine Grove Fire Station
Rochester Fire Station
Rushworth Fire Station
Stanhope Fire Station
Tennyson Fire Station
Timmering Fire Station
Tongala Fire Station
Toolleen Fire Station
Torrumbarry Fire Station
Wyuna Fire Station

Environmental Scan Report: Loddon Mallee Region
Page 69 of 123 Date: 14 September 2020 FINAL 2.0 Public Version
LGA No. Stations
(and Brigades)
Station locations
Yambuna Fire Station
Central Goldfields Shire 9 Bealiba Fire Station
Bowenvale Fire Station
Carisbrook Fire Station
Dunolly Fire Station
Maryborough Fire Station
Moolort Joyces Creek Fire Station
Mt Cameron Fire Station
Talbot Fire Station
Wareek Bung Bong Fire Station
City of Greater Bendigo 29 Axe Creek Fire Station
Axedale Fire Station
Bendigo Fire Station
Costerfield Fire Station
Eaglehawk Fire Station
Elmore Fire Station
Golden Square Fire Station
Goornong Fire Station
Heathcote Fire Station
Hunter-Diggora Fire Station
Huntly Fire Station
Junortoun Fire Station
Kamarooka Fire Station
Kangaroo Flat Fire Station
Knowsley Fire Station
Lockwood Fire Station
Maiden Gully Fire Station
Mandurang Fire Station
Marong Fire Station
Mia Mia Fire Station
Mosquito Creek Fire Station
Mt Camel Fire Station
Oscar 1 Emerg Response Fire Station
Raywood Fire Station
Redesdale Fire Station
Sedgwick Fire Station
Strathfieldsaye Fire Station
Sutton Grange Myrtle Ck Satellite Fire Station (Myrtle Creek)
Woodvale Fire Station

Environmental Scan Report: Loddon Mallee Region
Page 70 of 123 Date: 14 September 2020 FINAL 2.0 Public Version
LGA No. Stations
(and Brigades)
Station locations
Gannawarra Shire 12 Beauchamp Fire Station
Cohuna Fire Station
Kerang Fire Station
Koondrook Fire Station
Lake Charm Fire Station
Lalbert Fire Station
Leitchville Fire Station
Macorna Fire Station
Meering West Fire Station
Murrabit Fire Station
Quambatook Fire Station
Sandhill Lake District Fire Station
Loddon Shire 29 Appin South Fire Station
Baringhup West Satellite Fire Station (Eddington)
Barraport-Gredgwin Fire Station
Barraport-Gredgwin Satellite Fire Station (Gredgwin)
Berrimal Fire Station
Boort Fire Station
Bridgewater Fire Station
Campbells Forest Fire Station
Dingee-Tandarra Fire Station
Fentons Creek Fire Station
Inglewood Fire Station
Jarklin Fire Station
Korong Vale Fire Station
Loddon Vale Fire Station
Mitiamo Fire Station
Murphys Creek Fire Station
Mysia Fire Station
Newbridge Fire Station
Powlett-Salisbury Fire Station
Pyramid Hill Fire Station
Rheola Fire Station
Serpentine Fire Station
Tarnagulla Fire Station
Wedderburn Fire Station
Woodstock West Fire Station
Woosang Fire Station
Wychitella Fire Station

Environmental Scan Report: Loddon Mallee Region
Page 71 of 123 Date: 14 September 2020 FINAL 2.0 Public Version
LGA No. Stations
(and Brigades)
Station locations
Yando Fire Station
Yarrawalla Fire Station
Macedon Ranges Shire 22 Benloch Fire Station
Bolinda Monegeetta Fire Station
Bullengarook Fire Station
Carlsruhe Fire Station
Clarkefield District Fire Station
Clarkefield District Satellite Fire Station (Boggy Gate)
Darraweit Guim Fire Station
Gisborne Fire Station
Hesket-Kerrie Fire Station
Hesket-Kerrie Satellite Fire Station (Hesket-Cherokee)
Kyneton Fire Station
Lancefield Fire Station
Macedon Fire Station
Malmsbury Fire Station
Mount Macedon Fire Station
Newham Fire Station
Pastoria Fire Station
Riddells Creek Fire Station
Romsey Fire Station
Springfield Fire Station
Tylden Fire Station
Woodend Fire Station
Mildura Rural City 14 Carwarp Fire Station
Cowangie Fire Station
Irymple Fire Station
Merbein Fire Station
Meringur District Fire Station
Meringur District Satellite Fire Station (Werrimull)
Mildura Fire Station
Mittyack Fire Station
Murrayville Fire Station
Nangiloc Fire Station
Ouyen Fire Station
Red Cliffs Fire Station
Underbool Fire Station
Walpeup Fire Station
Mount Alexander Shire 17 Baringhup West Fire Station

Environmental Scan Report: Loddon Mallee Region
Page 72 of 123 Date: 14 September 2020 FINAL 2.0 Public Version
LGA No. Stations
(and Brigades)
Station locations
Baringhup West Satellite Fire Station (Baringhup West)
Campbells Creek Fire Station
Castlemaine Fire Station
Chewton Fire Station
Elphinstone Fire Station
Fryerstown Fire Station
Guildford Fire Station
Harcourt Fire Station
Langley-Barfold Fire Station
Maldon Fire Station
Metcalfe Fire Station
Newstead District Fire Station
Sutton Grange Myrtle Ck Fire Station
Taradale Fire Station
Walmer Fire Station
Walmer Satellite Fire Station (Muckleford)
Swan Hill Rural City 17 Annuello Fire Station
Beverford District Fire Station
Boundary Bend Fire Station
Chinkapook Fire Station
Goschen Fire Station
Kooloonong Fire Station
Lake Boga Fire Station
Manangatang Fire Station
Natya Fire Station
Nyah Nyah West Fire Station
Piangil Fire Station
Robinvale Fire Station
Swan Hill Fire Station
Ultima Fire Station
Waitchie Fire Station
Wemen Fire Station
Woorinen South Fire Station
Total 200

Environmental Scan Report: Loddon Mallee Region
Page 73 of 123 Date: 14 September 2020 FINAL 2.0 Public Version
There are seven fire lookouts across the region, as below:
Table 32. Fire Lookouts in LMR by LGA171
LGA No. Lookouts Locations
Buloke Shire 0 Nil
Campaspe Shire 1 Growlers Hill
Central Goldfields Shire 0 Nil
City of Greater Bendigo 2 Mt Ida, One Tree Hill
Gannawarra Shire 0 Nil
Loddon Shire 1 Mt Brenanah
Macedon Ranges Shire 1 FT 4 Mt Macedon
Mildura Rural City 0 Nil
Mount Alexander Shire 2 Fryers Ridge, Mt Tarrengower
Swan Hill Rural City 0 Nil
Total 7
There are no Community Fire Refuges in the region.172 However, there are 53 Neighbourhood Safer
Places (NSP), as outlined below:
Table 33. Neighbourhood Safer Places in LMR by LGA173
LGA No. NSP Locations
Buloke Shire 2 Charlton, Donald
Campaspe Shire 1 Echuca
Central Goldfields Shire 5 Carisbrook, Dunolly, Maryborough (2), Talbot
City of Greater Bendigo 11 Axedale, Bendigo, Eaglehawk, Heathcote, Junortoun, Kangaroo Flat (2), Maiden Gully, North Bendigo, Redesdale, Strathfieldsaye
Gannawarra Shire 4 Cohuna, Kerang, Koondrook, Murrabit
Loddon Shire 6 Boort, Bridgewater on Loddon, Inglewood, Pyramid Hill, Serpentine, Wedderburn
Macedon Ranges Shire 4 Lancefield, Macedon, Riddells Creek, Woodend
Mildura Rural City 10 Cullulleraine, Irymple, Merbein, Mildura (3), Murrayville, Ouyen, Red Cliffs, Underbool
Mount Alexander Shire 8 Campbells Creek, Castlemaine, Guildford, Harcourt, Maldon (2), Newstead, Taradale
Swan Hill Rural City 2 Robinvale, Swan Hill
LMR Total 53
171 Data Vic (2020): https://discover.data.vic.gov.au/dataset/foi-point-vicmap-features-of-interest
172 CFA (2020): https://www.cfa.vic.gov.au/plan-prepare/community-fire-refuges
173 CFA (2020): http://www.saferplaces.cfa.vic.gov.au/cfa/search/default.htm

Environmental Scan Report: Loddon Mallee Region
Page 74 of 123 Date: 14 September 2020 FINAL 2.0 Public Version
7.8.4 SES
There are 21 SES units across the region, including:
Table 34. SES Units in LMR by LGA174
LGA No. Units Locations
Buloke Shire 2 Birchip, Wycheproof
Campaspe Shire 4 Echuca, Kyabram, Rochester, Rushworth
Central Goldfields Shire 2 Dunolly, Maryborough
City of Greater Bendigo 3 Bendigo, Heathcote, Marong
Gannawarra Shire 1 Kerang
Loddon Shire 1 Wedderburn
Macedon Ranges Shire 2 Gisborne, Woodend
Mildura Rural City 3 Mildura, Murrayville, Ouyen
Mount Alexander Shire 1 Castlemaine
Swan Hill Rural City 2 Swan Hill, Robinvale
Total 21
174 Data Vic (2020): https://discover.data.vic.gov.au/dataset/foi-point-vicmap-features-of-interest

Environmental Scan Report: Loddon Mallee Region
Page 75 of 123 Date: 14 September 2020 FINAL 2.0 Public Version
7.8.5 Volunteer Coast Guard Flotillas
There is one Coast Guard flotilla in the region – VF5 Lake Eppalock in the City of Greater Bendigo.175
A map of emergency services is provided in the figure below:
Red = Fire station (CFA and FRV) Green = Ambulance station
Blue = Police station
Orange = SES Light Blue = Life saving Purple = Coast Guard
Figure 21. Emergency services for the LMR176
7.8.6 Emergency Coordination Facilities
Emergency services agencies are supported by the State Control Centre (SCC) in East Melbourne (the
State’s primary control centre for the management of Class 1 and Class 2 emergencies), one Regional
Control Centre (RCC) in Bendigo (a facility that enables the implementation of Command, Control and
Coordination arrangements within a set regional boundary) and four Incident Control Centres (ICCs) –
where an Incident Controller and Incident Management Teams can manage response activities in an
emergency.177
175 Australian Volunteer Coastguard (2020): https://coastguard.com.au/locations/full-flotilla-list/
176 Data Vic (2020): https://discover.data.vic.gov.au/dataset/foi-point-vicmap-features-of-interest
177 EMV (2019): https://files-em.em.vic.gov.au/public/Doctrine/ManHand/VIC-EOpsHandbook.pdf

Environmental Scan Report: Loddon Mallee Region
Page 76 of 123 Date: 14 September 2020 FINAL 2.0 Public Version
In total there are 37 emergency coordination centres across the region, including 32 Local Command
Facilities, as outlined below:
Table 35. Emergency Coordination Facilities in LMR by LGA178
LGA Facility
Locations RCC ICC LCF
Buloke Shire - - 5 Birchip, Charlton, Donald, Sea Lake, Wycheproof
Campaspe Shire - - 4 Echuca, Lockington, Rochester, Rushworth
Central Goldfields Shire - - 2 Dunolly, Maryborough
City of Greater Bendigo 1 1 5 Bendigo
Loddon Mallee (CFA)
Bendigo, Elmore, Heathcote, Huntly, Redesdale
Gannawarra Shire - - 2 Cohuna, Kerang
Loddon Shire - - 4 Boort, Inglewood, Pyramid Hill, Kerang
Macedon Ranges Shire - 1 3 Gisborne
Gisborne, Kyneton, Romsey
Mildura Rural City - 1 3 Mildura
Mildura, Murrayville, Ouyen
Mount Alexander Shire - - 2 Castlemaine, Maldon
Swan Hill Rural City - 1 2 Swan Hill
Swan Hill, Robinvale
Total 1 4 32 37
178 Data Vic (2020): https://discover.data.vic.gov.au/dataset/foi-point-vicmap-features-of-interest
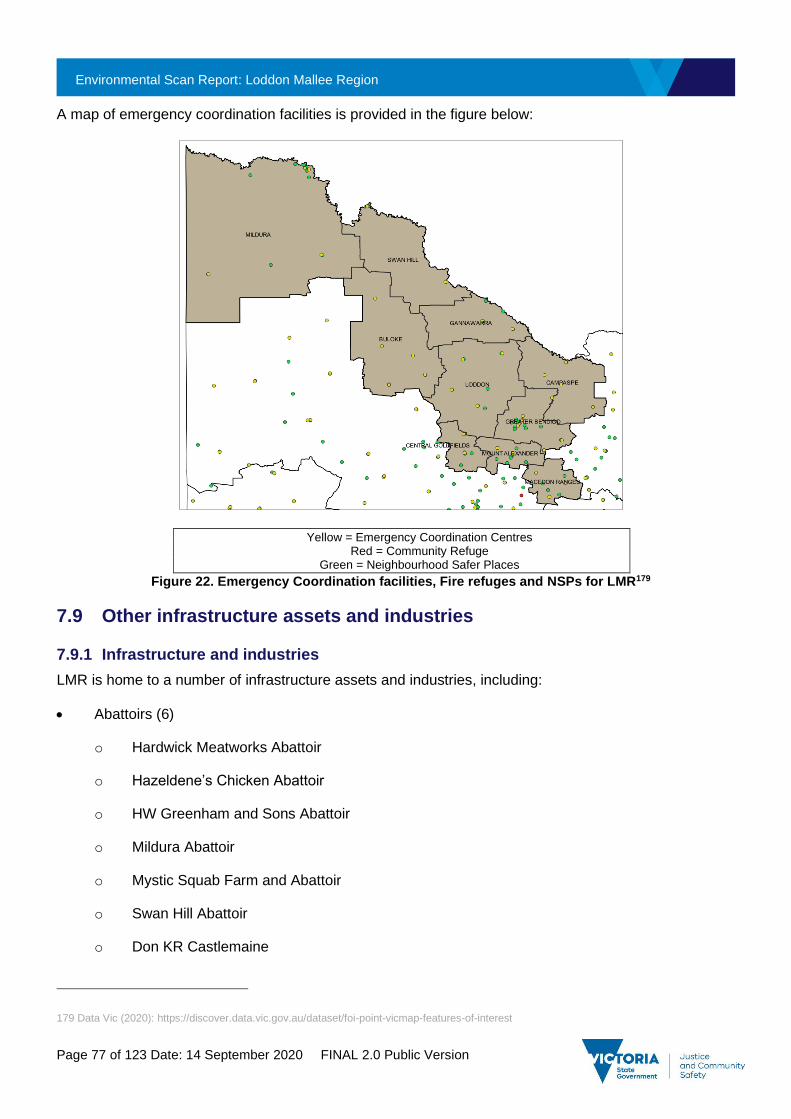
Environmental Scan Report: Loddon Mallee Region
Page 77 of 123 Date: 14 September 2020 FINAL 2.0 Public Version
A map of emergency coordination facilities is provided in the figure below:
Yellow = Emergency Coordination Centres Red = Community Refuge
Green = Neighbourhood Safer Places
Figure 22. Emergency Coordination facilities, Fire refuges and NSPs for LMR179
7.9 Other infrastructure assets and industries
7.9.1 Infrastructure and industries
LMR is home to a number of infrastructure assets and industries, including:
• Abattoirs (6)
o Hardwick Meatworks Abattoir
o Hazeldene’s Chicken Abattoir
o HW Greenham and Sons Abattoir
o Mildura Abattoir
o Mystic Squab Farm and Abattoir
o Swan Hill Abattoir
o Don KR Castlemaine
179 Data Vic (2020): https://discover.data.vic.gov.au/dataset/foi-point-vicmap-features-of-interest
Environmental Scan Report: Loddon Mallee Region
Page 78 of 123 Date: 14 September 2020 FINAL 2.0 Public Version
• Backpackers
o Bendigo Backpackers
• Rooming Houses (23)
• Supported Residential Facilities (7)
7.9.2 Dependencies
The following infrastructure assets are key dependencies for this region:
• Calder Freeway/Highway – Melbourne-Gisborne-Kyneton-Bendigo-Inglewood-Mildura link
• Sturt Highway – Adelaide-Mildura-Hay-Wagga Wagga link
• Murray Valley Highway – Robinvale-Swan Hill-Echuca-Wodonga-Towong link
• Sunraysia Highway – Ouyen-Donald-Ballarat link
• Midland Highway – Geelong-Ballarat-Bendigo-Shepparton-Wangaratta-Mansfield link
• Pyrenees Highway – Elphinstone-Maryborough-Avoca-Ararat link
• Direct passenger and freight rail routes from Maryborough (via Ballarat), Swan Hill, Echuca and
Bendigo to Melbourne.
• Direct freight rail routes from Mildura, Kulwin and Robinvale lines via Dunolly and Ballarat to
Melbourne, Geelong and Portland.
• Berri (SA) to Mildura gas pipeline
• Ballan to Bendigo gas pipeline

Environmental Scan Report: Loddon Mallee Region
Page 79 of 123 Date: 14 September 2020 FINAL 2.0 Public Version
7.9.3 Tourism infrastructure
Other significant infrastructure includes sites such as event facilities and stadiums, major tourist attractions
and shopping centres. These sites are outlined below:
Table 36. Tourism infrastructure in LMR by LGA
LGA Infrastructure category
Name
Buloke Shire Nil -
Campaspe Shire Nil -
Central Goldfields Shire Nil -
City of Greater Bendigo
Shopping Centres
Event and Entertainment Facilities
Bendigo Marketplace Shopping Centre
Lansell Square Shopping Centre
Bendigo Exhibition Centre
Bendigo Stadium
Bendigo Racecourse
Gannawarra Shire Nil -
Loddon Shire Nil -
Macedon Ranges Shire Nil -
Mildura Rural City Shopping Centres Mildura Central
Mount Alexander Shire Nil -
Swan Hill Rural City Nil -
7.9.4 Cladding fire safety risk
The Victorian Building Authority (VBA) is in the process of conducting a State-wide audit of non-compliant
building materials in Victoria, with a focus on reducing fire safety risks for buildings found to have
combustible cladding.180
On 25 November 2014, a fire in the 23-storey Lacrosse high-rise building in Docklands highlighted the fire
safety risks of non-compliant external wall coverings. The fire, which spread vertically, directly affected
approximately 500 residents who required immediate evacuation and accommodation.181
To date, more than 2,200 inspections have been undertaken and LMR has been identified to have 10
privately owned buildings with cladding.
180 https://www.vba.vic.gov.au/cladding/audit
181 https://www.melbourne.vic.gov.au/sitecollectiondocuments/mbs-report-lacrosse-fire.pdf

Environmental Scan Report: Loddon Mallee Region
Page 80 of 123 Date: 14 September 2020 FINAL 2.0 Public Version
Figure 23. Number of privately owned buildings with cladding by LGA182
182 https://www.vba.vic.gov.au/cladding/cladding-by-municipality
Buloke, 0
Campaspe, 1
Central Goldfields, 0
Gannawarra, 0
Greater Bendigo, 6
Loddon, 0
Macedon Ranges, 1
Mildura, 2
Mount Alexander, 0
Swan Hill, 0

Environmental Scan Report: Loddon Mallee Region
Page 81 of 123 Date: 14 September 2020 FINAL 2.0 Public Version
8. Social Environment
Social factors that influence the culture and institutions of LMR include demographic characteristics and
trends, and the values, norms and customs of the people who reside or work within or travel through the
region.
8.1 Population
8.1.1 Current population
Nearly 340,000 people live in the LMR, with a large portion of the population (35%) living in the City of
Greater Bendigo.
Population density for LMR ranged between 0.8 persons per km2 (in Buloke) and 39.4 persons per km2 (in
Greater Bendigo), with an average of 5.8 persons per km2.
Figure 24. LMR Population by LGA (2019) 183
183 ABS (2020): https://www.abs.gov.au/AUSSTATS/[email protected]/DetailsPage/3218.02018-19?OpenDocument

Environmental Scan Report: Loddon Mallee Region
Page 82 of 123 Date: 14 September 2020 FINAL 2.0 Public Version
Table 37. LMR Population Density by LGA (2019) 184
LGA Total
Population Area (sq km)
Population Density (persons/km2)
Buloke 6,124 8,000 0.8
Campaspe 37,622 4,519 8.3
Central Goldfields 13,186 1,533 8.6
Gannawarra 10,472 3,735 2.8
Greater Bendigo 118,093 3,000 39.4
Loddon 7,504 6,696 1.1
Macedon Ranges 50,231 1,748 28.7
Mildura 55,777 22,083 2.5
Mount Alexander 19,754 1,530 12.9
Swan Hill 20,649 6,115 3.4
LMR 339,412 58,959 5.8
184 DJPR (2020): https://www.rdv.vic.gov.au/information-portal/table-and-chart

Environmental Scan Report: Loddon Mallee Region
Page 83 of 123 Date: 14 September 2020 FINAL 2.0 Public Version
8.1.2 Population forecast
By 2036, the population of the region is forecast to increase by 59,383 people (17%) to 398,795 people,
with the majority taking up residence in Greater Bendigo (+35,666 people), Macedon Ranges (+14,412
people) and Mildura Rural City (+6,777 people). The LGAs of Buloke Shire, Gannawarra Shire, Loddon
Shire and Swan Hill Rural City are forecast to experience declines in population by 2036.
Refer to the below tables and visualisations for Local Government population breakdowns and forecasts.
Table 38. Estimated Population and Projections by LGA
LGA Estimated Population and Projections
2019185 2036186 No. Increase % Growth
Buloke 6,124 5,015 -1,109 -18.1%
Campaspe 37,622 39,084 1,462 3.9%
Central Goldfields 13,186 14,134 948 7.2%
Gannawarra 10,472 9,928 -544 -5.2%
Greater Bendigo 118,093 153,759 35,666 30.2%
Loddon 7,504 7,347 -157 -2.1%
Macedon Ranges 50,231 64,643 14,412 28.7%
Mildura 55,777 62,554 6,777 12.1%
Mount Alexander 19,754 21,814 2,060 10.4%
Swan Hill 20,649 20,517 -132 -0.6%
LMR 339,412 398,794 59,383 17.5%
VICTORIA 6,596,039 8,722,766 2,126,727 32.2%
185 ABS (2017): https://www.rdv.vic.gov.au/information-portal/table-and-chart
186 VIF2019 projections: https://www.planning.vic.gov.au/land-use-and-population-research/victoria-in-future/tab-pages/victoria-in-future-data-
tables

Environmental Scan Report: Loddon Mallee Region
Page 84 of 123 Date: 14 September 2020 FINAL 2.0 Public Version
Table 39. LMR Population by age group (2017) 187
187 ABS (2017): https://www.rdv.vic.gov.au/information-portal/table-and-chart
LGA
Age Group (Years)
0-14 15-19 0-19
Subtotal 20-24 25-34 35-44 45-54 55-64 65-74 75-84 85+
65+
Subtotal
Total
No.
Buloke 1,047 357 1,404 220 500 572 871 1,015 812 563 327 1,702 6,284
Campaspe 6,923 2,392 9,315 1,893 3,759 4,033 5,054 5,292 4,473 2,654 1,122 8,249 37,595
Central Goldfields 2,119 699 2,818 659 1,071 1,255 1,701 2,010 1,997 1,142 434 3,573 13,087
Gannawarra 1,756 640 2,396 487 902 1,014 1,411 1,571 1,495 937 354 2,786 10,567
Greater Bendigo 22,055 7,293 29,348 8,035 14,458 13,276 14,061 13,855 10,646 5,918 2,670 19,234 112,267
Loddon 1,228 419 1,647 246 550 741 1,082 1,340 1,105 599 248 1,952 7,558
Macedon Ranges 9,920 3,017 12,937 2,310 4,329 6,500 7,279 6,368 5,006 1,987 764 7,757 47,480
Mildura 10,672 3,594 14,266 3,366 6,889 6,277 7,062 7,026 5,331 3,075 1,366 9,772 54,658
Mount Alexander 2,970 947 3,917 785 1,684 2,220 2,844 3,231 2,569 1,284 563 4,416 19,097
Swan Hill 4,089 1,287 5,376 1,276 2,649 2,356 2,707 2,746 2,001 1,239 546 3,786 20,896
LMR 62,779 20,645 83,424 19,277 36,791 38,244 44,072 44,454 35,435 19,398 8,394 63,227 329,489
% 19.0% 6.3% 25.3% 5.8% 11.2% 11.6% 13.4% 13.5% 10.7% 5.9% 2.6% 19.2% 100.0%
VICTORIA 1,166,502 374,125 1,540,627 466,102 991,712 849,923 809,781 705,704 532,826 294,754 130,219 957,799 6,321,648
% 18.5% 5.9% 24.4% 7.4% 15.7% 13.4% 12.8% 11.2% 8.4% 4.7% 2.1% 15.2% 100.0%

Environmental Scan Report: Loddon Mallee Region
Page 85 of 123 Date: 14 September 2020 FINAL 2.0 Public Version
Table 40. LMR Projected population by age group (2036)
LGA
Age Group (Years)
0-14 15-19 0-19
Subtotal 20-24 25-34 35-44 45-54 55-64 65-74 75-84 85+
65+
Subtotal
Total
No.
Buloke 609 256 865 158 429 423 535 679 814 703 410 1,927 5,015
Campaspe 5,842 1,960 7,802 2,061 4,315 4,645 4,418 4,386 5,268 4,259 1,929 11,456 39,084
Central Goldfields 1,950 613 2,563 523 1,372 1,599 1,502 1,689 2,236 1,809 840 4,885 14,134
Gannawarra 1,459 504 1,963 407 949 1,156 1,065 1,201 1,503 1,240 445 3,187 9,928
Greater Bendigo 27,607 9,591 37,199 9,838 18,725 19,787 19,268 16,142 15,671 12,062 5,067 32,800 153,759
Loddon 1,037 282 1,319 258 759 836 837 1,011 1,130 886 312 2,328 7,347
Macedon Ranges 11,795 3,777 15,572 3,170 6,069 8,575 8,839 7,677 7,069 5,131 2,543 14,743 64,643
Mildura 10,372 3,405 13,777 3,450 7,727 8,184 7,318 6,595 7,280 5,796 2,428 15,504 62,554
Mount Alexander 2,901 898 3,798 725 1,758 2,533 2,945 3,106 3,352 2,578 1,019 6,948 21,814
Swan Hill 3,098 1,055 4,153 1,164 2,359 2,325 2,501 2,482 2,629 2,027 877 5,533 20,517
LMR 66,670 22,340 89,010 21,753 44,461 50,063 49,228 44,968 46,951 36,491 15,870 99,312 398,794
% 16.72% 5.60% 22.32% 5.45% 11.15% 12.55% 12.34% 11.28% 11.77% 9.15% 3.98% 24.90% 100.00%
VICTORIA 1,484,771 511,324 1,996,095 585,796 1,232,559 1,266,034 1,146,896 886,495 771,700 568,029 269,162 2,948,620 8,722,766
% 17.0% 5.9% 22.9% 6.7% 14.1% 14.5% 13.1% 10.2% 8.8% 6.5% 3.1% 33.8% 100.0%

Environmental Scan Report: Loddon Mallee Region
Page 86 of 123 Date: 14 September 2020 FINAL 2.0 Public Version
Figure 25. Population growth for LMR by LGA (2019-2036)
8.2 Vulnerability indicators
In emergency management there are many population vulnerability indicators that have a geographical
distribution and are relevant to natural hazard risk analysis. These include:
• The young, the elderly and those needing assistance, who may be dependent on others for care;
• Single parents, who may lack support for their dependent children;
• Income and public housing residency, which are indicators of socio-economic disadvantage and can
have an impact on a household’s ability to recover from a disaster;
• Education level and proficiency in English, which can limit understanding of warnings, risks and
preparation advice;
• Car ownership, which may have an impact on a household’s ability to evacuate;
• Unoccupied dwellings, which may reduce owners’ engagement levels with the local community and
reduce the likelihood that relevant preparations will be undertaken for their properties.
Some of these indicators for LMR are summarised below. Of note:
• More than a quarter (26.6%) of LMR households are lone person;
• Approximately one in five households in LMR indicated they had no internet connection at home in
2016.

Environmental Scan Report: Loddon Mallee Region
Page 87 of 123 Date: 14 September 2020 FINAL 2.0 Public Version
Table 41. Vulnerable Communities Indicators by LGA (2016)188
LGA
Vulnerability Indicators (%)
Po
pu
lati
on
ag
ed
65
+
Lo
ne p
ers
on
ho
useh
old
s
Peo
ple
wit
h a
dis
ab
ilit
y
Peo
ple
wit
h p
oo
r
En
glish
pro
ficie
nc
y
Esti
mate
d h
om
ele
ss
po
pu
lati
on
Po
pu
lati
on
wit
h n
o
mo
tor
veh
icle
s
Po
pu
lati
on
wit
h n
o
inte
rnet
co
nn
ecti
on
at
ho
me
Buloke 28.2% 30.2% 7.4% 0.4% 0.1% 4.4% 25.4%
Campaspe 22.9% 25.0% 6.4% 0.3% 0.3% 4.0% 21.0%
Central Goldfields 28.3% 31.5% 8.9% 0.3% 0.3% 5.7% 26.9%
Gannawarra 27.6% 29.4% 6.5% 0.3% 0.2% 4.0% 25.4%
Greater Bendigo 17.8% 24.9% 5.9% 1.0% 0.3% 4.7% 16.2%
Loddon 26.7% 29.5% 7.4% 0.3% 0.5% 3.3% 25.4%
Macedon Ranges 17.1% 17.9% 4.1% 0.5% 0.1% 2.2% 10.5%
Mildura 18.7% 24.7% 6.8% 2.1% 0.3% 5.6% 21.1%
Mount Alexander 24.1% 29.2% 5.0% 0.5% 0.3% 4.1% 17.4%
Swan Hill 18.9% 23.8% 5.5% 3.0% 0.5% 5.1% 22.5%
Average LMR 23.0% 26.6% 6.4% 0.9% 0.3% 4.3% 21.2%
Figure 26. Vulnerable Communities Indicators for LMR (2016)
188 https://blog.id.com.au/2020/population/demographic-trends/interactive-chart-is-your-community-demographically-vulnerable/#chart
0%
5%
10%
15%
20%
25%
30%
Populationaged 65+
Loneperson
households
People witha disability
People withpoor
Englishproficency
Estimatedhomelesspopulation
Populationwith nomotor
vehicles
Populationwith nointernet
connectionat home

Environmental Scan Report: Loddon Mallee Region
Page 88 of 123 Date: 14 September 2020 FINAL 2.0 Public Version
8.2.1 The young and the elderly
Within the LMR, 25% of the population was aged 19 years or younger in 2018, while 20% was aged 65
years or older
Figure 27. Population breakdown for LMR by Age (2018)189
However, these vulnerable groups were not evenly distributed across the region, with Macedon Ranges
Shire having the highest proportion of people aged 0-19 years (28%), while Mount Alexander Shire (17%)
had the lowest proportion of people aged 0-19 years. Conversely, Buloke Shire, Central Goldfields Shire,
Gannawarra Shire and Loddon Shire had the highest number of people aged 65+ years (28%), while
Macedon Ranges Shire had the lowest number of people aged 65+ years (17%).
189 DJPR (2020): https://www.rdv.vic.gov.au/information-portal/table-and-chart
19%
6% 6%
11% 11%
13% 13%
11%
6%
3%
0-14 15-19 20-24 25-34 35-44 45-54 55-64 65-74 75-84 85+

Environmental Scan Report: Loddon Mallee Region
Page 89 of 123 Date: 14 September 2020 FINAL 2.0 Public Version
Table 42. Proportion of Population by Age Group and LGA (2018) 190
LGA 19 years or younger (%) 65 years + (%)
Buloke Shire 22% 28%
Campaspe Shire 24% 23%
Central Goldfields Shire 21% 28%
City of Greater Bendigo 26% 18%
Gannawarra Shire 22% 28%
Loddon Shire 21% 28%
Macedon Ranges Shire 28% 17%
Mildura Rural City 26% 18%
Mount Alexander Shire 20% 25%
Swan Hill Rural City 26% 19%
8.2.2 Those needing assistance
When it comes to assistance with core activities, approximately 6.5% of the population of the LMR have a
need – in real terms representing 19,344 people. However, the number of people in need varies according
to LGA, from just 4.4% of the population of Macedon Ranges Shire (1,879 people) in 2016 to 9.6% of the
population of Central Goldfields Shire (1,158 people).
Table 43. Need for assistance with Core Activities for LMR by LGA (2016)191
LGA Total Percentage
Buloke Shire 457 8.1%
Campaspe Shire 2,357 6.9%
Central Goldfields Shire 1,158 9.6%
City of Greater Bendigo 6,548 6.4%
Gannawarra Shire 686 7.0%
Loddon Shire 558 8.4%
Macedon Ranges Shire 1,879 4.4%
Mildura Rural City 3,644 7.4%
Mount Alexander Shire 934 5.7%
Swan Hill Rural City 1,123 6.3%
Total LMR 19,344 6.5%
190 DJPR (2020): https://www.rdv.vic.gov.au/information-portal/table-and-chart
191 DJPR (2020): https://www.rdv.vic.gov.au/information-portal/table-and-chart

Environmental Scan Report: Loddon Mallee Region
Page 90 of 123 Date: 14 September 2020 FINAL 2.0 Public Version
8.3 Diversity
8.3.1 Birthplaces and languages spoken
Ethnic and cultural indicators reflect a population’s composition and can be useful indicators of socio-
economic status. These characteristics can help inform decision-makers about a population’s ability to
access services and information and assist service providers determine the need to communicate in
languages other than English.
The population of LMR is less culturally diverse than metro regions with 10.1% of the population born
overseas. However, the populations of Macedon Ranges, Mildura, Mount Alexander and Swan Hill are
slightly higher than the rest of LMR with each LGA above 11% but no more than 14% born overseas while
the population of the Shire of Buloke 6.31 % were born overseas. Refer Table 44.
In LMR the most common countries of birth (other than Australia) were:
• England – which featured in the top three of all 10 LGAs
• New Zealand – which featured in the top three of 9 of the 10 LGAs
• India – which featured in the top three of 3 of the 10 LGAs
5.8% of the population of LMR speaks a language other than English at home. In all LGAs, except for
Mildura and Swan Hill, the number of people who speak only English at home were above 95%. The Rural
City of Swan Hill observed about 86% of the population only speaks English at home.
The diversity of most common languages spoken at home other than English is observed to be significant
in LMR with 13 languages listed as common language to speak at home for the 10 LGAs.
In LMR the most common languages spoken (other than English) were:
• Italian – which featured in the top three for 6 of the 10 LGAs
• Mandarin – which featured in the top three for 5 of the 10 LGAs
• German – which featured in the top three for 4 of the 10 LGAs
As a proportion of LMR, Aboriginal and Torres Strait Islanders represent 2.7% of the total LMR population.
Ranging between 0.7% of the population in the Macedon Ranges to 4.2% and 4.7% of the population in the
Rural Cities of Mildura and Swan Hill respectively.

Environmental Scan Report: Loddon Mallee Region
Page 91 of 123 Date: 14 September 2020 FINAL 2.0 Public Version
There are many Aboriginal languages. However, they do not have geographic boundaries. The most
widespread in Victoria are the Kulin languages.192
Figure 28. Map of Aboriginal languages of Victoria193
192 https://www.vcaa.vic.edu.au/Documents/alcv/History.pdf
193 https://cv.vic.gov.au/stories/aboriginal-culture/our-story/vacl-language-map-of-victoria/

Environmental Scan Report: Loddon Mallee Region
Page 92 of 123 Date: 14 September 2020 FINAL 2.0 Public Version
Table 44. Population by Aboriginal and Torres Strait Islander (ATSI) status and birthplace and LGA (2016)195
194 .id (2020): profile.id.com.au
195 ABS Census 2016: https://www.rdv.vic.gov.au/information-portal/table-and-chart
LGA
Birthplace
Australia Elsewhere Total Top 3 Countries of Birth (other than Australia)194
ATSI All
No. % EMR No. % No. % No. % 1 2 3
Buloke 67 1.21% 5,201 93.69% 350 6.31% 5,551 100.00% England New Zealand India
Campaspe 874 2.59% 31,243 92.59% 2,500 7.41% 33,743 100.00% England New Zealand Philippines
Central Goldfields 190 1.61% 10,654 90.23% 1,153 9.77% 11,807 100.00% England New Zealand Netherlands
Gannawarra 203 2.10% 9,118 94.38% 543 5.62% 9,661 100.00% England New Zealand Philippines
Greater Bendigo 1,846 1.81% 93,326 91.36% 8,822 8.64% 102,148 100.00% England New Zealand India
Loddon 119 1.81% 5,976 90.66% 616 9.34% 6,592 100.00% England Philippines New Zealand
Macedon Ranges 297 0.70% 36,795 86.52% 5,735 13.48% 42,530 100.00% England New Zealand Germany
Mildura 2,065 4.25% 42,733 88.02% 5,815 11.98% 48,548 100.00% England Italy New Zealand
Mount Alexander 209 1.23% 14,851 87.27% 2,167 12.73% 17,018 100.00% England New Zealand Netherlands
Swan Hill 832 4.69% 15,363 86.53% 2,391 13.47% 17,754 100.00% India Italy England
LMR 6,702 2.27% 265,260 89.81% 30,092 10.19% 295,352 100.00%

Environmental Scan Report: Loddon Mallee Region
Page 93 of 123 Date: 14 September 2020 FINAL 2.0 Public Version
Table 45. Population by language spoken at home (2016)196
LGA
Language Spoken at Home
English Only Other
Language Total Top 3 Languages Spoken (other than English)197
No. % No. % No. % 1 2 3
Buloke 5,474 97.11% 163 2.89% 5,637 100.00% Malayalam Mandarin Tagalog
Campaspe 33,184 96.82% 1,091 3.18% 34,275 100.00% Italian Filipino Tagalog
Central Goldfields 11,752 97.31% 325 2.69% 12,077 100.00% Filipino Mandarin German
Gannawarra 9,583 97.88% 208 2.12% 9,791 100.00% Malayalam Greek Punjabi
Greater Bendigo 97,860 95.04% 5,103 4.96% 102,963 100.00% Karen Mandarin Italian
Loddon 6,486 96.69% 222 3.31% 6,708 100.00% Filipino German Hungarian
Macedon Ranges 41,023 95.21% 2,064 4.79% 43,087 100.00% Italian German Mandarin
Mildura 44,286 89.63% 5,126 10.37% 49,412 100.00% Italian Turkish Greek
Mount Alexander 15,942 96.16% 637 3.84% 16,579 100.00% Mandarin German Italian
Swan Hill 15,710 86.89% 2,371 13.11% 18,081 100.00% Italian Tongan Vietnamese
LMR 281,300 94.20% 17,310 5.80% 298,610 100.00%
196 ABS (2016): https://www.rdv.vic.gov.au/information-portal/table-and-chart
197 .id (2020): profile.id.com.au

Environmental Scan Report: Loddon Mallee Region
Page 94 of 123 Date: 14 September 2020 FINAL 2.0 Public Version
8.3.2 Income and housing
According to Socio-Economic Indexes for Areas (SEIFA), which measure the relative level of socio-
economic advantage or disadvantage based on a range of Census characteristics (where higher scores
indicate lower levels of disadvantage), LGAs within the LMR were ranked as follows:
Table 46. SEIFA socio-economic disadvantage ranking within LMR by LGA (2016) 198
LGA SEIFA Score Ranking (Most
Disadvantaged)
Buloke Shire 967 24th
Campaspe Shire 967 23rd
Central Goldfields Shire 889 1st
City of Greater Bendigo 981 31st
Gannawarra Shire 957 18th
Loddon Shire 942 9th
Macedon Ranges Shire 1,060 71st
Mildura Rural City 935 5th
Mount Alexander Shire 995 42nd
Swan Hill Rural City 947 11th
LMR Average 964 -
VICTORIA Average 997 -
Central Goldfields Shire – with a SEIFA score of 889 – was the most disadvantaged LGA in LMR (and the
most disadvantaged in Victoria), while Macedon Ranges Shire was the least disadvantaged in LMR (and
ranked 71st of 79 LGAs in Victoria). Overall, LMR is more disadvantaged than the average for Victorian
LGAs.
Other indicators of socio-economic status include income and housing. In the LMR in 2016: 199
• There were 129,685 occupied private dwellings, with an average of 2.5 persons per dwelling.
• 5.6% of households had no vehicle.
Refer also Table 47.
198 DJPR (2020): https://www.rdv.vic.gov.au/information-portal/table-and-chart
199 DJPR (2020): https://www.rdv.vic.gov.au/information-portal/table-and-chart

Environmental Scan Report: Loddon Mallee Region
Page 95 of 123 Date: 14 September 2020 FINAL 2.0 Public Version
Table 47. Socio-economic Indicators for LMR (2016)200
Indicator Total Percentage
Low income households with rental stress 3,845 30.2%
Low income households with mortgage stress 8,632 9.2%
Home ownership 86,811 73.9%
Separate houses - 89.0%
Occupied private dwellings 129,685 -
Households with internet connected 94,175 79.7%
These findings provide an indication of the number of properties that could be impacted in the event of an
emergency and the relative ease with which people might be able to leave their dwellings by motor vehicle
as well. It also indicates the availability of personal financial resources to support any actions required in
the event of an emergency.
8.4 Education
8.4.1 Educational institutions
There are 202 schools and 56,027 full-time enrolments in the region, with government schools making up
72% of all schools and 67% of full-time enrolments:
Figure 29. Number of schools and full-time enrolments in LMR201
The number of schools and full-time enrolments in the region are distributed across LGAs as follows, with
the City of Greater Bendigo having the highest number of schools (51) and the largest number of full-time
enrolments (19,843):
200 DJPR (2020): https://www.rdv.vic.gov.au/information-portal/table-and-chart
201 DET (2020): https://www.education.vic.gov.au/about/department/Pages/factsandfigures.aspx

Environmental Scan Report: Loddon Mallee Region
Page 96 of 123 Date: 14 September 2020 FINAL 2.0 Public Version
Table 48. Schools and full-time enrolments in LMR by LGA (2019)202
LGA No. Schools Full-time Enrolments
Buloke Shire 10 939
Campaspe Shire 24 6,588
Central Goldfields Shire 8 2,106
City of Greater Bendigo 51 19,843
Gannawarra Shire 12 1,274
Loddon Shire 9 892
Macedon Ranges Shire 26 8,741
Mildura Rural City 31 9,820
Mount Alexander Shire 16 2,137
Swan Hill Rural City 15 3,688
Total LMR 202 56,027
There is one university and two TAFEs with multiple campuses across the region, including:
Table 49. Universities and TAFEs in LMR203
University/TAFE Campuses
Latrobe University Bendigo, Mildura
Bendigo Regional Institute of TAFE Bendigo, Echuca, Castlemaine
Sunraysia Institute of TAFE Mildura, Swan Hill, Robinvale, Cardross (training farm)
There are also 242 childcare facilities across the region (including childcare centres, pre-schools and
kindergartens).204
202 DET (2020): https://www.education.vic.gov.au/about/department/Pages/factsandfigures.aspx
203 Data Vic (2020): https://discover.data.vic.gov.au/dataset/foi-point-vicmap-features-of-interest
204 Data Vic (2020): https://discover.data.vic.gov.au/dataset/foi-point-vicmap-features-of-interest

Environmental Scan Report: Loddon Mallee Region
Page 97 of 123 Date: 14 September 2020 FINAL 2.0 Public Version
The below figure shows the location of educational facilities in the LMR:
Light Green = Primary school Mid-green = Primary/secondary school
Dark Green = Secondary school Pink = Special school
Orange = Further education Yellow = Tertiary institution
Red = University
Figure 30. Map of Educational Facilities within the LMR205
8.4.2 Educational Level
Approximately 1 in 3 persons (32.7%) of people over 15 years of age in the LMR have a bachelor’s degree
or higher non-school qualification, however more than 1 in 2 persons (57.4%) did not complete Year 12.
Table 50. Education Level achieved in LMR206
Education Level Total Percentage
People over 15 with bachelor’s degree or higher non-school qualification (2016)
37,759 32.7%
Did not complete Year 12 (2016) 135,000 57.4%
15-19 years old not in school or employment 1,301 6.5%
205 Data Vic (2020): https://discover.data.vic.gov.au/dataset/foi-point-vicmap-features-of-interest
206 DJPR (2020): https://www.rdv.vic.gov.au/information-portal/table-and-chart

Environmental Scan Report: Loddon Mallee Region
Page 98 of 123 Date: 14 September 2020 FINAL 2.0 Public Version
8.5 Health
The State Health Emergency Response Plan outlines arrangements for managing health emergencies (i.e.,
incidents requiring a significant and coordinated response from the health system, the Department of Health
and Human Services and the emergency management sector, in partnership with the community) to ensure
an effective response and ease adverse consequences.207 Practitioners, health professionals, service
organisations and government agencies may also be required to respond to local emergencies to care for
the injured or unwell directly affected.
In an emergency, vulnerable populations such as those in hospitals, health care facilities and retirement
villages, may require significant and coordinated priority interventions, responses and support for their
safety.
In LMR in 2011 there were 115 General Medical Practitioners per 100,000 people.
8.5.1 Hospitals and health centres
There are 30 hospitals, two community health centres and nine maternal and child health services across
the region, as outlined below:
Table 51. Hospitals and healthcare facilities in LMR by LGA208
LGA Hospitals Community
Health Centres
Maternal and Child Health
Services
Buloke Shire 5 0 0
Campaspe Shire 4 1 0
Central Goldfields Shire 2 0 0
City of Greater Bendigo 5 0 1
Gannawarra Shire 2 0 0
Loddon Shire 2 1 0
Macedon Ranges Shire 1 0 7
Mildura Rural City 4 0 0
Mount Alexander Shire 2 0 1
Swan Hill Rural City 3 0 0
Total LMR 30 2 9
207 DHHS (2020): https://www2.health.vic.gov.au/emergencies/shera
208 Data Vic (2020): https://discover.data.vic.gov.au/dataset/foi-point-vicmap-features-of-interest
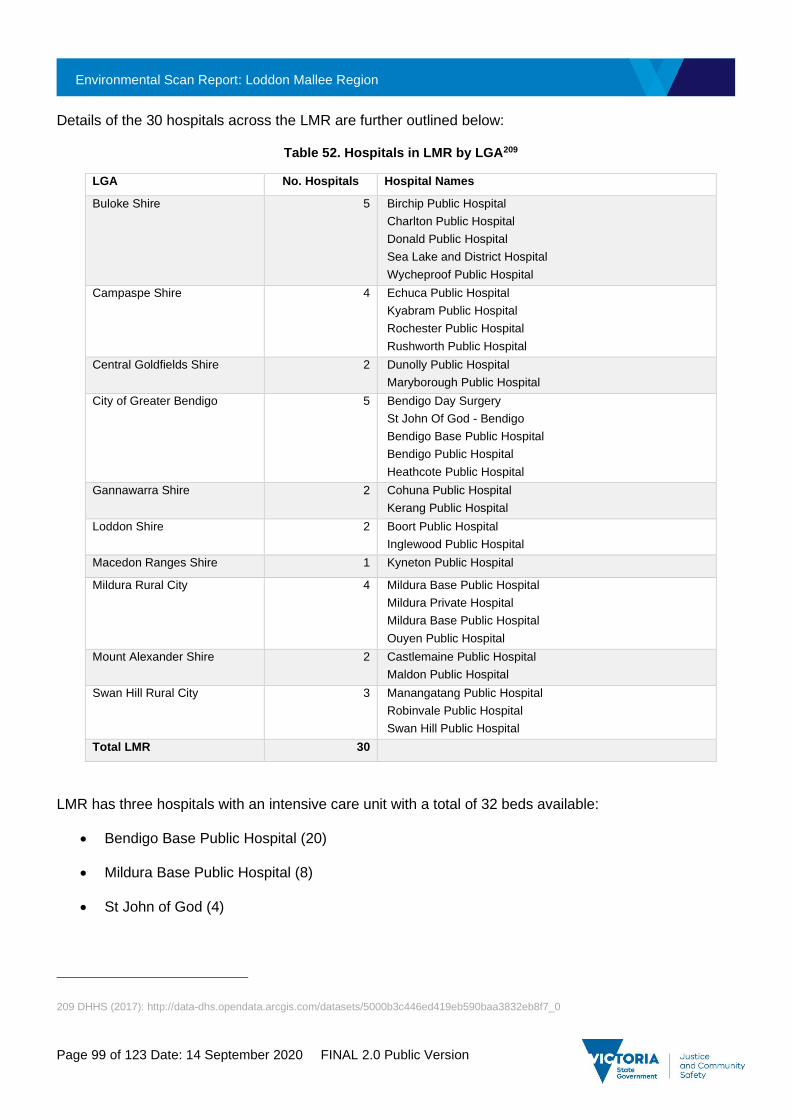
Environmental Scan Report: Loddon Mallee Region
Page 99 of 123 Date: 14 September 2020 FINAL 2.0 Public Version
Details of the 30 hospitals across the LMR are further outlined below:
Table 52. Hospitals in LMR by LGA209
LGA No. Hospitals Hospital Names
Buloke Shire 5 Birchip Public Hospital
Charlton Public Hospital
Donald Public Hospital
Sea Lake and District Hospital
Wycheproof Public Hospital
Campaspe Shire 4 Echuca Public Hospital
Kyabram Public Hospital
Rochester Public Hospital
Rushworth Public Hospital
Central Goldfields Shire 2 Dunolly Public Hospital
Maryborough Public Hospital
City of Greater Bendigo 5 Bendigo Day Surgery
St John Of God - Bendigo
Bendigo Base Public Hospital
Bendigo Public Hospital
Heathcote Public Hospital
Gannawarra Shire 2 Cohuna Public Hospital
Kerang Public Hospital
Loddon Shire 2 Boort Public Hospital
Inglewood Public Hospital
Macedon Ranges Shire 1 Kyneton Public Hospital
Mildura Rural City 4 Mildura Base Public Hospital
Mildura Private Hospital
Mildura Base Public Hospital
Ouyen Public Hospital
Mount Alexander Shire 2 Castlemaine Public Hospital
Maldon Public Hospital
Swan Hill Rural City 3 Manangatang Public Hospital
Robinvale Public Hospital
Swan Hill Public Hospital
Total LMR 30
LMR has three hospitals with an intensive care unit with a total of 32 beds available:
• Bendigo Base Public Hospital (20)
• Mildura Base Public Hospital (8)
• St John of God (4)
209 DHHS (2017): http://data-dhs.opendata.arcgis.com/datasets/5000b3c446ed419eb590baa3832eb8f7_0

Environmental Scan Report: Loddon Mallee Region
Page 100 of 123 Date: 14 September 2020 FINAL 2.0 Public Version
The below figure shows the location of the above healthcare services, with hospitals centred closer to larger
towns, while community health centres are located in more remote areas.
Pink = Community health centre Purple = Maternal/child health centre
Green = Day procedure centre
Orange = General hospital Yellow = General hospital (emergency)
Figure 31. Map of hospitals and health care facilities in the LMR210
210 Data Vic (2020): https://discover.data.vic.gov.au/dataset/foi-point-vicmap-features-of-interest

Environmental Scan Report: Loddon Mallee Region
Page 101 of 123 Date: 14 September 2020 FINAL 2.0 Public Version
8.5.2 Aged Care
There are 82 aged care facilities across the region, as outlined below:
Table 53. Aged care facilities in LMR211
LGA No. Facilities
Buloke Shire 8
Campaspe Shire 11
Central Goldfields Shire 5
City of Greater Bendigo 20
Gannawarra Shire 4
Loddon Shire 4
Macedon Ranges Shire 8
Mildura Rural City 10
Mount Alexander Shire 3
Swan Hill Rural City 9
Total LMR 82
The locations of these facilities is also provided below:
Figure 32. Map of aged care facilities in the LMR212
211 Data Vic (2020): https://discover.data.vic.gov.au/dataset/foi-point-vicmap-features-of-interest
212 Data Vic (2020): https://discover.data.vic.gov.au/dataset/foi-point-vicmap-features-of-interest

Environmental Scan Report: Loddon Mallee Region
Page 102 of 123 Date: 14 September 2020 FINAL 2.0 Public Version
The number of people in the LMR who accessed aged care support at some stage during the 2018-19
reporting period is outlined in the following table. This number forms part of the total number of people in
the community who may need some form of assistance during an evacuation or emergency.
Table 54. Aged Care Support in LMR (2018-2019)213
Age Bracket Home Care Residential Care Transition Care Total
0–49 2 10 - 12
50–54 5 15 - 20
55–59 21 29 1 51
60–64 18 61 - 79
65–69 89 132 3 224
70–74 170 210 8 388
75–79 220 346 11 577
80–84 285 575 23 883
85–89 234 869 17 1,120
90–94 144 825 16 985
95–99 30 338 1 369
100+ 6 44 - 50
Total 1,224 3,454 80 4,758
In LMR in 2016 there were 86.8 residential care places per 100,000 population aged 70 years and over.
8.6 Cultural values and assets
The LMR is the traditional home of the First Peoples of the Millewa-Mallee being Latji Latji, Ngintait and
Nyeri Nyeri Traditional Owners, the Wotjobaluk, Jaadwa, Jajawadjali, Wergaia, Jupagulk, Dja Dja Wurrung,
Taungurung and Yorta Yorta peoples. 214
8.6.1 Aboriginal cultural heritage assets
Rivers and waterways are particularly important heritage sites for the Dja Dja Warrung people and hold
economic, social, environmental and spiritual values. Sites include the Loddon, Coliban, Campaspe, Avoca
and Avon Rivers, and the Boort, Eppalock and Laanecoorie Lakes. The Dhelkunya Dja Land Management
Board manages six parks held as Aboriginal Title and managed through Joint Management Plans: the
Greater Bendigo and Kara Kara National Parks, the Paddys Ranges State Forest, Kooyoora State Park,
Hepburn Regional Park, and Wehla Nature Conservation Reserve. Dja Dja Warrung artefacts continue to
213 https://www.gen-agedcaredata.gov.au/Resources/Access-data/2020/March/GEN-data-People-using-aged-care
214 ACHRIS (2020): https://achris.vic.gov.au/weave/wca.html

Environmental Scan Report: Loddon Mallee Region
Page 103 of 123 Date: 14 September 2020 FINAL 2.0 Public Version
be found across the Loddon Campaspe region, particularly as development of infrastructure and housing
expands. Artefacts include scar trees, middens, burial remains and other ritual artefacts.
Important heritage sites on the land of the First Peoples of the Millewa-Mallee are found in the Hattah-
Kulkyne National Park and the Murray-Sunset National Park.
Other significant cultural assets in the LMR include art galleries and museums, as outlined below:
Table 55. Significant cultural assets in LMR215
LGA Art Galleries and Museums
Buloke Shire Auchmore Historic Homestead
Donald Agricultural Museum
Donald District Archives
Golden Grains Museum
The Old Police Camp Donald
Campaspe Shire Historical Society Museum
Lockington And District Living Heritage Complex
Opperman Sports Museum
Port of Echuca Discovery Centre
Rochester Historical and Pioneer Society Museum
Rushworth Museum
Warf Shed Museum
Central Goldfields Shire Central Goldfields Art Gallery
Dunolly Museum
Museum of Truth And Lies
Talbot Historical Museum
City of Greater Bendigo Bendigo Art Gallery
Bendigo Joss House Temple
Bendigo Pottery Museum
Golden Dragon Museum
La Trobe University Visual Arts Centre
Soldiers Memorial Museum Bendigo
Gannawarra Shire Cohuna And District Historical Society Museum
Quambatook Heritage Machinery Shed
Loddon Shire -
Macedon Ranges Shire Kyneton Museum
Lancefield Court House Museum
Mildura Rural City Langtree Hall Museum
Mildura Arts Centre Gallery
215 Data Vic (2020): https://discover.data.vic.gov.au/dataset/foi-point-vicmap-features-of-interest

Environmental Scan Report: Loddon Mallee Region
Page 104 of 123 Date: 14 September 2020 FINAL 2.0 Public Version
LGA Art Galleries and Museums
Mildura RAAF Museum
Rio Vista Historic House
Mount Alexander Shire Castlemaine Art Gallery and Historical Museum
Maldon Museum and Archives Association
Maldon Vintage Machinery Museum
Swan Hill Rural City Lake Boga Flying Boat Museum
Swann Hill Regional Gallery
The region also hosts a number of major events and festivals throughout the year, including:
Table 56. Major events in LMR by LGA
LGA Major events and festivals
Buloke Shire -
Campaspe Shire -
Central Goldfields Shire -
City of Greater Bendigo Bendigo Blues and Roots Festival, Bendigo Easter Festival, Bendigo Cup
Gannawarra Shire -
Loddon Shire -
Macedon Ranges Shire -
Mildura Rural City Mildura Jazz, Food and Wine Festival
Mount Alexander Shire Maldon Folk Festival, Castlemaine Festival of Gardens
Swan Hill Rural City -
The below figure shows two layers that represent areas of cultural and heritage sensitivity. The first in
Orange, shows the areas of cultural heritage sensitivity that are known or likely to contain places and objects
of significance to Aboriginal cultural heritage. These are defined in the Aboriginal Heritage Regulations 2018
and include areas around designated watercourses and waterways, areas surrounding known Aboriginal
cultural heritage places and areas with landforms and soil types that are similar to known cultural heritage
places. While the areas shown are more likely to contain a higher number of cultural heritage places and
objects, these places can be found all over Victoria where Aboriginal people have lived216. The areas in blue
highlight locations that have been included in the Victorian Heritage Register showing places, objects and
shipwrecks that are currently protected under the Heritage Act 2017.217
216 https://www.aboriginalvictoria.vic.gov.au/cultural-heritage-sensitivity
217 https://vhd.heritagecouncil.vic.gov.au/

Environmental Scan Report: Loddon Mallee Region
Page 105 of 123 Date: 14 September 2020 FINAL 2.0 Public Version
Figure 33. Areas of cultural and heritage significance218 219
8.7 Volunteerism
An indication of a region’s level of community volunteering is also an important vulnerability factor because
volunteers and their social networks can be of assistance during emergencies.
In 2016, 64,858 people in LMR (5.6%) indicated that they were volunteers.220
According to the Ministerial Council for Volunteers (2017), approximately 4% of volunteers work for an
emergency services organisation221 and EMV estimates over 100,000 people in Victoria volunteer across a
wide range of emergency management agencies.222
218 https://discover.data.vic.gov.au/dataset/areas-of-cultural-heritage-sensitivity
219 https://discover.data.vic.gov.au/dataset/victorian-heritage-register
220 DJPR (2020): https://www.rdv.vic.gov.au/information-portal/table-and-chart
221 Ministerial Council for Volunteers (2017): https://iepcp.org.au/wp-content/uploads/2018/11/MCV-Volunteers-in-Victoria-report.pdf
222 EMV (2015): https://www.emv.vic.gov.au/volunteerstatement

Environmental Scan Report: Loddon Mallee Region
Page 106 of 123 Date: 14 September 2020 FINAL 2.0 Public Version
• As at 1 July 2020, CFA Victoria noted its volunteer membership at 53,311 people, with an additional
1,486 junior members.223
Volunteering is evolving in Victoria, particularly with respect to growing expectations around community
responsibility for emergency preparedness, the impact on operations of new communications technology,
and the characteristics of volunteers. For example, volunteering styles are becoming more diverse, but also
more episodic, while physical locations and office hours are becoming less of a constraint to people
volunteering their time and staying connected. However, in their series of reports, Emergency Volunteering
2030,224 the authors found that:
• Community sector groups anticipate a serious shortage of volunteers in the future, mounting
expectations to deliver emergency services, a rise in costs and poorer outcomes for communities.
• Volunteerism managers foresee growing regulation and corporatisation impacting negatively on
volunteer sustainability.
• Local government managers have flagged the need to examine how resourcing and funding options
and restrictions may be hindering the emergency management sector’s ability to respond to the
changing landscape of volunteering.
9. Economic Environment
An understanding of the LMR’s economic resilience can play an important role in emergency management
planning by providing some context to how adversity might affect local economies and the degree to which
different communities are likely to cope with the ongoing effects of emergencies.
The Mallee sub-region has an economy based on agriculture and manufacturing, while the Loddon
Campaspe sub-region is also focused on both agriculture and food product manufacturing, both of which
are key exports for the region.
9.1 Economic situation
The regional economy of the Mallee sub-region is heavily concentrated around two significant industries –
agriculture and manufacturing. While agriculture is based on irrigated and dryland farming, manufacturing
in the region is focused on food processing, construction and service provision.225
223 CFA (2020): https://www.cfa.vic.gov.au/about/cfa-at-a-glance
224 DIIS (2019): https://emergencyvolunteeringau.dropmark.com/594398?q=%23Emergency-Volunteering-2030-study%20%23report
225 DJPR (2014): https://www.planning.vic.gov.au/__data/assets/pdf_file/0024/94650/Loddon-Mallee-North-Regional-Growth-Plan-May-2014.pdf

Environmental Scan Report: Loddon Mallee Region
Page 107 of 123 Date: 14 September 2020 FINAL 2.0 Public Version
While the Loddon Campaspe sub-region is also heavily driven by agriculture, it also supports other key
industries including financial, health and insurance services, manufacturing and mining, with the city of
Bendigo driving much of the recent economic growth in the region.226
New modelling from the Department of Treasury and Finance suggests the coronavirus pandemic has had
a potentially unprecedented impact on Victoria’s economy. It is likely the State will record negative economic
growth for the current and next financial years.
• Gross regional product (GRP) is expected to drop by 14% in the June and September quarters as a
consequence of lower incomes, loss of consumer and business confidence and disruptions to global
supply chains.
• Unemployment is expected to rise to 11% in the September quarter and the number of jobs has
already fallen by almost 7% across Victoria since March 2020. 227
While the true extent of the impact on the LMR is unclear, it is likely to reflect the economic trends for
Victoria.
9.1.1 Key economic indicators
Key economic indicators across the LMR for the period 2018-19 are summarised below:228
Gross Regional Product (GRP) reflects the region’s contribution to the broader State economy and the value
of the regional economy.
• Overall, the LMR contributed $16.0 billion to the Victorian economy, which was 3.5% of the total for
the State (Gross State Product is estimated at $454.6 billion).
GRP per worker provides an indication of workforce participation.
• Overall, the LMR had a lower than average rate of productivity at $110,557 compared with $166,496
per worker for Victoria.
226 DJPR (2014): https://www.planning.vic.gov.au/__data/assets/pdf_file/0033/94668/Loddon-Mallee-South-Regional-Growth-Plan-May-2014.pdf
227 DTF (2020): https://www.dtf.vic.gov.au/economic-and-financial-updates/coronavirus-economic-outlook
228 DJPR (2020): https://www.rdv.vic.gov.au/information-portal/table-and-chart

Environmental Scan Report: Loddon Mallee Region
Page 108 of 123 Date: 14 September 2020 FINAL 2.0 Public Version
Table 57. Economic indicators for LMR229 230
Indicators
Gross Regional Product ($ million) (2019) $16,026m
Gross Regional Product per worker ($) (2018) $110,557
10-year average annual GRP growth rate (2009-2019) 1.00%
Total Jobs (2019) 144,956
Annual jobs growth rate (2018-2019) 3.65%
5-year average annual jobs growth rate (2014-2019) 1.68%
10-year average annual jobs growth rate (2009-2019) 1.45%
The number of local jobs reflects the health of the labour market.
• Overall, the LMR provided over 144,956 jobs, which was 5.3% of the total number of jobs for the state
(2.73 million jobs).
Labour force participation measures an economy’s active workforce, while the unemployment rate
measures the loss of productive resources to the economy.
• Overall, the LMR’s labour force participation rate in 2016 was 60.8%, which is in line with the Victorian
average (60.5%)
• The unemployment rate (3.93%) in 2019 Q4, was below the State average (4.8%).
Figure 34. Quarterly unemployment rate % for LMR (2017-2019)
229 DJPR (2020): https://www.rdv.vic.gov.au/information-portal/table-and-chart
230 DJPR (2020): https://www.rdv.vic.gov.au/information-portal/table-and-chart
0.0%
1.0%
2.0%
3.0%
4.0%
5.0%
6.0%
7.0%
2017Q1
2017Q2
2017Q3
2017Q4
2018Q1
2018Q2
2018Q3
2018Q4
2019Q1
2019Q2
2019Q3
2019Q4

Environmental Scan Report: Loddon Mallee Region
Page 109 of 123 Date: 14 September 2020 FINAL 2.0 Public Version
Table 58. Labour Force Indicators for LMR (2016)231
Indicators Total Percentage
Labour force participation
Participation at 65 years plus
147,790
8,049
60.8%
12.4%
People receiving an unemployment benefit
Receiving an unemployment benefit for more than 180 days
13,808
11,647
7.2%
6.1%
Youth unemployment (ages 15-24) 2,971 11.5%
9.1.2 Industry and employment
The main industries by number of jobs in the LMR overall in 2016 were Health Care and Social Assistance
(16% of all jobs), Retail Trade (12% of all jobs) and Education and Training (9% of all jobs), as shown below:
Figure 35. Jobs by industry in LMR (2016)232
The main industries by number of businesses in the LMR overall in 2019 were Agriculture, Forestry and
Fishing (24% of all businesses), Construction (17% of all businesses) and Rental, Hiring and Real Estate
services (8% of all businesses), as shown below:
231 DJPR (2020): https://www.rdv.vic.gov.au/information-portal/table-and-chart
232 DJPR (2020): https://www.rdv.vic.gov.au/information-portal/table-and-chart
Accommodation and Food Services, 7%
Administrative and Support Services, 3%
Agriculture, Forestry and Fishing, 9% Arts and Recreation Services, 1%
Construction, 7%
Education and Training, 9%
Electricity, Gas, Water and Waste Services, 1%
Financial and Insurance Services, 3%
Health Care and Social Assistance, 16%
Information Media and Telecommunications, 1%
Manufacturing, 9%
Mining, 1%
Other services, 4%
Professional, Scientific and Technical Services, 4%
Public Administration and Safety, 6%
Rental, Hiring and Real Estate Services, 1%
Retail Trade, 12%
Transport, Postal and Warehousing, 4%
Wholesale Trade, 2%

Environmental Scan Report: Loddon Mallee Region
Page 110 of 123 Date: 14 September 2020 FINAL 2.0 Public Version
Figure 36. Businesses by industry in LMR (2019)233
Of the 31,002 businesses in the region, over 60% are non-employing businesses, while 37% are small
businesses with less than 20 employees.
Table 59. Businesses by size in LMR (2018)234
Size of Business Percentage
Large businesses (200+ employees) 0.06%
Medium businesses (20-199 employees) 2.33%
Small businesses (<20 employees) 37.11%
Non-employing businesses 60.49%
9.2 Banking and finance
Banking and finance is a critical infrastructure sector that facilitates financial transactions across service
providers and customers, arranges insurance, leverages assets and aims to manage and create wealth.
The sector reaches far beyond Victoria’s borders and is regulated by the Commonwealth.235
233 DJPR (2020): https://www.rdv.vic.gov.au/information-portal/table-and-chart
234 DJPR (2020): https://www.rdv.vic.gov.au/information-portal/table-and-chart
235 EMV (2018): https://files-em.em.vic.gov.au/public/EMV-web/2018_All_Sectors_Resilience_Report.pdf
Accommodation and Food Services, 4%
Administrative and Support Services, 3%
Agriculture, Forestry and Fishing, 24%
Arts and Recreation Services, 1%
Construction, 17%
Education and Training, 1%
Electricity, Gas, Water and Waste Services, 0%
Financial and Insurance Services, 7%
Health Care and Social Assistance, 4%
Information Media and Telecommunications, 1%
Manufacturing, 4%
Mining, 0%
Other services, 5%
Professional, Scientific and Technical Services, 8%
Public Administration and Safety, 0%
Rental, Hiring and Real Estate Services, 8%
Retail Trade, 6%
Transport, Postal and Warehousing, 5%
Wholesale Trade, 3%

Environmental Scan Report: Loddon Mallee Region
Page 111 of 123 Date: 14 September 2020 FINAL 2.0 Public Version
Bendigo Bank, Australia’s fifth largest bank, is headquartered in Bendigo with more than 7,000 employees
and 1.8 million customers across 500 branch locations Australia-wide.236
9.3 Political and legal factors
There are eight electoral Regions in Victoria. Five Members of Parliament (MPs) represent each Region in
the Victorian Parliament's Legislative Council (Upper House). The principal role of people who are elected
to represent a Region is to review legislation that has been passed by the Lower House. Loddon Mallee sits
within the Northern Victorian Region. A breakdown of state and federal electoral divisions can be found
below. The Victorian Electoral Commission and the Federal Electoral Commission use different borders
distinctions that Emergency Management Regions due to the need to separate groups by population.237
Therefore, the list below includes all divisions that cross into LMR:
State electorates:
• Mildura
• Murray Plains
• Bendigo East
• Bendigo West
• Ripon (part)
• Lowan (part)
Federal
• Mallee
• Nicholls (part)
• Bendigo
• Ballarat (part)
236 Bendigo Bank (2020): https://www.bendigobank.com.au/about-us/
237 Victorian Electoral Commission Map of districts: https://www.parliament.vic.gov.au/findelectorate/

Environmental Scan Report: Loddon Mallee Region
Page 112 of 123 Date: 14 September 2020 FINAL 2.0 Public Version
10. Operational Learnings
The Victorian emergency management sector supports a culture of continuous improvement by:
• Encouraging the sector to share lessons, both positive actions to sustain and areas for improvement
• Encouraging learning from both assurance activities and contemporary good practice
• Focusing on systems of work, rather than the performance of individuals
• Recognising that identifying and implementing sustainable solutions takes time, resources and
opportunity
In November 2015, Victoria’s first sector-wide lessons management framework, EM-LEARN, was approved.
This framework further supports the development of a culture of continuous improvement and outlines a
model for lessons management and how it will be implemented into the sector, particularly operational
activities initially.
Lessons management involves the identification and learning of lessons captured through assurance and
learning activities (including debriefing, monitoring and reviews) occurring before, during and after
emergencies. This process of moving from identifying lessons to learning lessons is guided by the lessons
management life cycle within the EM-LEARN Framework, and should inform emergency management
planning to ensure ongoing continuous improvement.
Operational learnings identified from across the State over the past 12 months include:
Declarations
• It was observed that there was little discussion/communications with the regions regarding the State
of Disaster declaration for the summer fires, which resulted in confusion around what arrangements
were required to be put in place at the regional level to support this. However, the declaration did
result in the appointment of a State Relief Coordinator to support relief activities at the regional level
and the State Response Controller at the State level which was viewed positively.
• Observations indicate that during the lead-up to a Code Red Declaration on 21 November 2019, there
were issues with responding agencies accessing timely intelligence, information and predictions to
enhance their operations due to how quickly the data was being updated. Specifically, accessing EM-
COP was highlighted as challenging at times.

Environmental Scan Report: Loddon Mallee Region
Page 113 of 123 Date: 14 September 2020 FINAL 2.0 Public Version
IT
• IMT's highlighted the difficulties encountered with IT systems, connecting to networks and the
hardware in operational facilities. Observations indicate that there are challenges in accessing and
using multiple systems including EM-Drive, Webmail, EM-COP, IMS, Fireweb and FIRS.
Evacuation
• Observations indicate that Controllers were hesitant to consider robust evacuation planning until the
exact location of the towns requiring evacuation was known. Evacuation planning highlighted the need
for targeted messaging to people within evacuation areas, and the importance of having local agencies
(i.e. CFA) involved in the evacuation planning process and ensuring that relief centres are located in
'safe' areas.
• Observations indicate that it is difficult to plan for or assume where people will want to go post
evacuation or assuming what their needs might be. It is also very important that local councils are
involved in the planning and implementation of any evacuation or reception centres.
Planning
• Early identification of potential storm/flood hazards allowed for planning and pre-positioning of storm
and flood teams in IMT's. The adoption of standard processes for assuring the implementation of
safety alerts related to thunderstorms worked well.
Information Management and Intelligence
• Observations indicate that relief information on VicEmergency was not always consistent with
information distributed via community newsletters and other channels and that community
communications need to be clear and targeted to the audience.
• Observations indicate that communications between the incident, regional and State tiers could be
improved, in terms of building relationships, information sharing and reporting - and that all tiers need
to be proactive and take responsibility for ensuring this is done in a clear and timely manner.
• Observations indicate that the lack of an intelligence unit within IMT's and Sector Commanders in the
field impedes data collection at the incident level. There is value in establishing an intelligence within
ICCs to centrally and consistently coordinate and manage damage assessment and other data which
is collected from sources in various formats.
• It was observed that the SCC experienced difficulties in obtaining sufficient intelligence from across
the incident and regional tiers. At times there was a divergence of views between the State and
incident tiers regarding what the priority intelligence requirements were, which was exacerbated by
the fact that the State tier implemented new requirements - which were added to the existing

Environmental Scan Report: Loddon Mallee Region
Page 114 of 123 Date: 14 September 2020 FINAL 2.0 Public Version
procedures and products during times of peak operational demand on intelligence teams across all
levels.
Personnel
• Fatigue management is a continuing issue. Personnel have concerns on shift length, rostering
principles, rostering practices, entitlements and their general understanding of how to self-manage
fatigue in relation to assigned shifts.
• Observations indicate staff are being activated into functional roles when they do not necessarily have
the right accreditation or experience to perform the role effectively. In addition to being a potential
safety issue of having unaccredited staff performing functional roles in an emergency, it also places
pressure on others within the functional cell to cover the knowledge/experience gap and can cause
frustration across the entire IMT.

Environmental Scan Report: Loddon Mallee Region
Page 115 of 123 Date: 14 September 2020 FINAL 2.0 Public Version
11. Data sources
Table 60. Metadata
Item Details
Report section 5. Regional Context 6. Natural Environment 7. Built Environment 8. Social Environment 9. Economic Environment
Data set Regional Development Victoria Information Portal
Data source Online
Location https://www.rdv.vic.gov.au/information-portal/table-and-chart
Data accessed July 2020
Data type Geospatial database
Custodian DJPR
Publisher DJPR
Coverage Victoria
Frequency Approx. every four years
Item Details
Report section 6. Natural Environment
Data set Mean monthly and mean annual temperature data - maximum, minimum and mean (based on standard 30-year period 1961-1990)
Data source Online
Location http://www.bom.gov.au/jsp/ncc/climate_averages/temperature/index.jsp
Data accessed August 2020
Data type Geospatial database
Custodian BOM
Publisher BOM
Coverage Australia
Frequency Unknown
Item Details
Report section 6. Natural Environment
Data set Mean monthly, seasonal and annual rainfall data (based on standard 30-year period 1981-2010)
Data source Online
Location http://www.bom.gov.au/jsp/ncc/climate_averages/rainfall/IDCraingrids.jsp
Data accessed August 2020
Data type Geospatial database
Custodian BOM
Publisher BOM
Coverage Australia
Frequency Unknown

Environmental Scan Report: Loddon Mallee Region
Page 116 of 123 Date: 14 September 2020 FINAL 2.0 Public Version
Item Details
Report section 6. Natural Environment
Data set Design Rainfall Data System
Data source Online
Location http://www.bom.gov.au/water/designRainfalls/revised-ifd/
Data accessed August 2020
Custodian BOM
Publisher BOM
Coverage Australia
Frequency Unknown
Item Details
Report section 6. Natural Environment
Data set Average annual and monthly days of rain
Data source Online
Location http://www.bom.gov.au/jsp/ncc/climate_averages/raindays/index.jsp?period=anandproduct=5mm#maps
Data accessed August 2020
Custodian BOM
Publisher BOM
Coverage Australia
Frequency Unknown
Item Details
Report section 6. Natural Environment
Data set Bushfire Prone Areas
Data source Online
Location https://discover.data.vic.gov.au/dataset/designated-bushfire-prone-area-bpa
Date produced Last updated 24/3/2020 – produced 07/09/2011
Data accessed 09/05/2020
Data type Geospatial database
Custodian DELWP
Publisher DELWP
Coverage Victoria
Frequency Unknown
Item Details
Report section 6. Natural Environment
Data set Major River Basins of Victoria
Data source Online
Location https://discover.data.vic.gov.au/dataset/awrc-major-river-basins-of-victoria
Date produced Last updated 05/09/2020 – produced 01/08/2014
Data accessed August 2020
Data type Geospatial database
Custodian DELWP
Publisher DELWP
Coverage Victoria
Frequency Unknown

Environmental Scan Report: Loddon Mallee Region
Page 117 of 123 Date: 14 September 2020 FINAL 2.0 Public Version
Item Details
Report section 6. Natural Environment
Data set Vicmap Lite: Statewide data series depicting major features, public land, vegetation, hydrology, transport and administrative data
Data source Online
Location https://discover.data.vic.gov.au/dataset/vicmap-lite
Date produced Last updated 05/09/2020 – produced 01/08/2014
Data accessed August 2020
Data type Geospatial database
Custodian DELWP
Publisher DELWP
Coverage Victoria
Frequency As required
Item Details
Report section 6. Natural Environment
Data set 1 in 100 year flood extent
Data source Online
Location https://discover.data.vic.gov.au/dataset/1-in-100-year-flood-extent
Date produced Last updated 11/4/2020 – produced 01/08/2014
Data accessed August 2020
Data type Geospatial database
Custodian DELWP
Publisher DELWP
Coverage Victoria
Frequency As required
Item Details
Report section 6. Natural Environment
Data set Flood Warning Catchment Areas
Data source Online
Location http://www.bom.gov.au/metadata/catalogue/19115/ANZCW0503900441?template=full
Data accessed August 2020
Data type Geospatial database
Custodian BOM
Publisher BOM
Coverage Australia
Frequency Unknown
Item Details
Report section 7. Built Environment
Data set Potential Impact Reports (by LGA)
Data source EM-COP
Location EM-COP
Date produced May 2020
Data accessed July 2020
Data type Geospatial database
Custodian EMV
Publisher EMV
Coverage Victoria
Frequency As required

Environmental Scan Report: Loddon Mallee Region
Page 118 of 123 Date: 14 September 2020 FINAL 2.0 Public Version
Item Details
Report section 7. Built Environment
Data set FOI – Point – Vicmap Features of Interest
Data source Online
Location https://discover.data.vic.gov.au/dataset/foi-point-vicmap-features-of-interest
Date produced Last updated 28/05/2020 – produced 1/05/2009
Data accessed July 2020
Data type Geospatial database
Custodian DELWP
Publisher DELWP
Coverage Victoria
Frequency As required
Item Details
Report section 7. Built Environment
Data set Electricity
Data source Online
Location https://data.gov.au/dataset/ds-aurin-aurin%3Adatasource-AU_Govt_GA-UoM_AURIN_DB_national_major_power_stations_2016/details?q=Major%20Power%20Stations
Date produced Last updated December 2016
Data accessed August 2020
Data type Geospatial database
Custodian Australian Government
Publisher Australian Government
Coverage Australia
Frequency As required
Item Details
Report section 7. Built Environment
Data set PTV Public Transport
Data source Online
Location https://discover.data.vic.gov.au/dataset/public-transport-a-collection-of-ptv-datasets
Date produced Last updated 30/1/2020 – produced 07/06/2012
Data accessed 09/05/2020
Data type Geospatial database
Custodian Public Transport Victoria
Publisher Public Transport Victoria
Coverage Victoria
Frequency Quarterly
Item Details
Report section 7. Built Environment
Data set Roads
Data source Online
Location https://discover.data.vic.gov.au/dataset/road-network-vicmap-transport
Date produced Last updated 05/09/2020 – produced 1/08/2014
Data accessed August 2020
Data type Geospatial database
Custodian DELWP
Publisher DELWP

Environmental Scan Report: Loddon Mallee Region
Page 119 of 123 Date: 14 September 2020 FINAL 2.0 Public Version
Coverage Victoria
Frequency As required
Item Details
Report section 7. Built Environment
Data set EPA Victoria Landfill Register
Data source Online
Location https://discover.data.vic.gov.au/dataset/epa-victoria-victorian-landfill-register-vlr-location-polygons
Date produced 11/01/2020
Data accessed 09/05/2020
Data type Geospatial database
Custodian EPA
Publisher EPA
Coverage Victoria
Frequency As required
Item Details
Report section 7. Built Environment
Data set Emergency Services
Data source Ambulance Victoria Data Sets
Location https://www.ambulance.vic.gov.au/ambulance-victoria-data-sets/
Data accessed August 2020
Data type Database
Custodian AV
Publisher AV
Coverage Victoria
Frequency Annually
Item Details
Report section 8. Social Environment
Data set Population
Data source Australian Bureau of Statistics
Location https://www.abs.gov.au/AUSSTATS/[email protected]/DetailsPage/3218.02018-19?OpenDocument
Data accessed August 2020
Data type Database
Custodian ABS
Publisher ABS
Coverage Australia
Frequency As needed – next issue expected for release on 30/03/2021
Item Details
Report section 8. Social Environment
Data set Hospital locations
Data source Online
Location http://data-dhs.opendata.arcgis.com/datasets/5000b3c446ed419eb590baa3832eb8f7_0
Date produced Last updated 20/11/2019 – produced 28/07/2016
Data accessed 09/05/2020
Data type Spatial
Custodian DHHS
Publisher DHHS

Environmental Scan Report: Loddon Mallee Region
Page 120 of 123 Date: 14 September 2020 FINAL 2.0 Public Version
Coverage Victoria
Frequency Unknown
Item Details
Report section 8. Social Environment
Data set School enrolments
Data source Online
Location https://www.education.vic.gov.au/about/department/Pages/factsandfigures.aspx
Date produced Last updated 01/07/2019 – produced 01/01/2010
Data accessed 16/06/2020
Data type Spreadsheet
Custodian DET
Publisher DET
Coverage Victoria
Frequency Six-monthly
Item Details
Report section 8. Social Environment
Data set Aged Care
Data source Online
Location https://www.gen-agedcaredata.gov.au/Resources/Access-data/2020/March/GEN-data-People-using-aged-care
Date produced Last updated 03/03/2020
Data accessed August 2020
Data type Spreadsheet
Custodian Australian Institute of Health and Welfare
Publisher GEN Aged Care Data
Coverage Australia
Frequency Unknown
Item Details
Report section 8. Social Environment
Data set Areas of Aboriginal cultural heritage sensitivity
Data source Online
Location https://discover.data.vic.gov.au/dataset/areas-of-cultural-heritage-sensitivity
Date produced Last updated 11/07/2020 – produced 23/05/2018
Data accessed 06/08/2020
Data type Shapefile
Custodian DPC
Publisher DPC
Coverage Victoria
Frequency Quarterly
Item Details
Report section 8. Social Environment
Data set Victorian Heritage Register
Data source Online
Location https://discover.data.vic.gov.au/dataset/victorian-heritage-register
Date produced Last updated 05/09/2020 – produced 11/05/2016
Data accessed 06/08/2020
Data type Geospatial database
Custodian DELWP

Environmental Scan Report: Loddon Mallee Region
Page 121 of 123 Date: 14 September 2020 FINAL 2.0 Public Version
Publisher DELWP
Coverage Victoria
Frequency Fortnightly
Item Details
Report section 8. Social Environment
Data set Areas of Cultural Heritage Sensitivity
Data source Online
Location https://discover.data.vic.gov.au/dataset/areas-of-cultural-heritage-sensitivity
Date produced Last updated 18/05/2020 – produced 20/06/2019
Data accessed 06/08/2020
Data type Geospatial database
Custodian DPC
Publisher DPC
Coverage Victoria
Frequency Quarterly
Item Details
Report section Natural Environment
Data set Climate average maps reference period 1961 - 1990
Data source Online
Location http://www.bom.gov.au/climate/averages/maps.shtml
Data accessed 1/07/2020
Data type ASCII grid
Custodian Bureau of Meteorology
Publisher Bureau of Meteorology
Coverage Victoria
Frequency Fortnightly

Environmental Scan Report: Loddon Mallee Region
Page 122 of 123 Date: 14 September 2020 FINAL 2.0 Public Version
12. List of Abbreviations
Table 61. List of Abbreviations
Acronym Description
ABC Australian Broadcasting Corporation
ABS Australian Bureau of Statistics
ACHRIS Aboriginal Cultural Heritage Register and Information System
AEMO Australian Energy Market Operator
AEP Annual Exceedance Probability
ARI Average Reference Interval
BOM Bureau of Meteorology
CFA Country Fire Authority
CMA Catchment Management Authority
CSIRO Commonwealth Scientific and Industrial Research Organisation
DAWE Department of Agriculture, Water and the Environment
DELWP Department of Environment, Land, Water and Planning (VIC)
DET Department of Education and Training (VIC)
DHHS Department of Health and Human Services (VIC)
DISER Department of Industry, Science, Energy and Resources
DJPR Department of Jobs, Precincts and Regions (VIC)
DOT Department of Transport
DTF Department of Treasury and Finance
EMLA Emergency Management Legislation Amendment
EMV Emergency Management Victoria
EPA Environment Protection Authority
FDP Fire Danger Period
FFMV Forest Fire Management Victoria
GRP Gross Regional Product
ICC Incident Control Centre
ICU Intensive Care Unit
IFD Intensity-Frequency-Duration
LGA Local Government Area
MEMP Municipal Emergency Management Plan
NWMR North West Metro Region
PTV Public Transport Victoria
RCC Regional Control Centre
REMP Regional Emergency Management Plan
REMPC Regional Emergency Management Planning Committee
SCC State Control Centre
SEIFA Socio-Economic Indexes for Areas
SEMP State Emergency Management Plan
SES State Emergency Service (VIC)
SLS Surf Life Saving (VIC)
SSIP State Significant Industrial Precinct

Environmental Scan Report: Loddon Mallee Region
Page 123 of 123 Date: 14 September 2020 FINAL 2.0 Public Version
13. Document information
13.1 Document details
Criteria Details
Document title: Environmental Scan Report: Loddon Mallee Region
Document owner: Information Management and Intelligence Team, EMV
13.2 Version control
Version Date Description Author
0.1 14/05/2020 Initial template created C. Jolly
0.2 05/07/2020 First draft M. Frew
0.2 27/07/2020 Second draft M. Frew/C. Murphy
1.0 06/08/2020 Draft for initial consultation C. Jolly
1.1 06/09/2020 Updated based on feedback from IREMPCs
M. Frew, M. Brereton, W. Stephenson, M. Slavtcheva, C. Jolly
1.2 10/09/2020 Proof reading J. Kaye, T. Penfold
2.0 14/09/2020 Final release C. Jolly
13.3 Document approval
This document requires the following approval:
Name Title Organisation
Debra Abbott Deputy Emergency Management Commissioner
EMV
Andrew Crisp Emergency Management Commissioner EMV


![Environmental Scan Report 7.1.2013[2]...!!2!!!!! Red!Rocks!Community! College! Environmental!Scan!!!!! Compiledby:!!LauraSolano!!!!! This!document!contains!the!results!of!an!environmental!scan!conducted](https://img.pdfslide.net/doc/110x75/5f4e8e452d0d8d0ff32b4b24/environmental-scan-report-7120132-2-redrockscommunity-college.jpg)