Embed Size (px)
Citation preview

ENVIRONMENTAL STUDIESIN THE VICINITY OF THE
SUSQUEHANNA STEAM ELECTRIC STATION
2010WATER QUALITY
FISHES
Prepared by
Ecology III, Inc.Susquehanna SES Environmental Laboratory
804 Salem BoulevardBerwick, Pennsylvania 18603
For
PPL Susquehanna, LLC769 Salem BoulevardBerwick, PA 18603
November 2011

CONTENTS
Page
INTRODUCTION ....................... . ........ ............................... ......... 1
WATER QUALITY by Lyle R. Harvey and Sharon A. Harrall .................................. 2P rocedures ..................................................................................................... . 2Results and Discussion ................................................................................... 2
River Flow, River Water Withdrawal, and Temperature ........................ 2River W ater Quality at the Susquehanna SES .................................... 4Control and Indicator Site Comparisons ............................................... 4
C o nclusion ............................................................................................................ 5
FISHES by Brian P. Mangan ............................................................................................ 6P rocedures ..................................................................................................... . 6
Electrofishing ............ I ............................ 6- S e ining ................................................................................................. . . 7
Statistical Analysis ................................................................................ 7Results and Discussion ..................................................................................... 8
Electrofishing ................................................................................... 8S eining ............ ................................................................................... . . 9BACI Results: Electrofishing .................................................................... 9BACI Results: Seining ......................................................................... 10
REFERENCES ...... ... .. . ............. ............ ............. 1
L
i
LIST OF TABLES
PageTable 1 Descriptions of water quality sampling sites in the vicinity of the.:
Susquehanna SES, 2010 ...................... " ...................... 16
Table 2 Water quality parameters and methods of analyses utilized by theSusquehanna SES Environmenta[iLabooratory, 2010 ........ ............. 17
Table 3 Daily mean flow (cfs) of the Susqluehann'a River at the
Susquehanna SES EnvironmentalLaborat ory, 2010.................. 18
Table 4 Daily mean temperature (C) of the Susquehanna River at the -
Susquehanna SES Environmental Laboratory, 2010 .............. ... 19
Table 5 Pennsylvania Department of Environmental Protection Specificwater quality criteria for the Susquehanna River in the vicinity of theSusquehanna SES, 2010 .................................................................... 20
Table 6 Water quality data collected quarterly from the Susquehanna Riverand the Susquehanna SES blowdown, 2010 ...................................... 21
Table 7 Total iron concentrations from the Susquehanna River at the SSESsampling site, 1975-2010 ................. ............. 23
Table 8 Comparison of total mineral solids (TMS) concentrations from theSusquehanna River and the Susquehanna SES blowdown, 2010 ....... 24
Table 9 Comparison of annual average total mineral solids (TMS)concentrations from the Susquehanna River and the SusquehannaSES blowdown, 1991-2010 ................................................................ 24
Table 10 Descriptions of electrofishing (EL) and seining (SN) sites at SSESand Bell Bend on the Susquehanna River, 2010 ................................ 25
ii ..

Page
Table 11
Table 12
Fish species that were observed while electrofishing or collected byseiningat SSES 1and BellBend'on the SusquehannarRiver, 2010 ....... 26
Number, mean, and percentltotal of fish observed whileelectrofishing at SSES on the Susquehanna River, 2010 .......... 27
Table 13 Number, mean, and percent total of fish observed whileelectrofishing at Bell Bend on the Susquehanna River, 2010 ............. 28
Table 14 Number, mean, and percent total of fish captured by seining atSSES and Bell Bend on .the Susquehanna River, 2010 ...................... 29
Table 15 P-values for fish species deemed significant by the BACI analysis,1976-2010 (a = 0.05)............................................................................. 30
iii
LiST OF FIGURES
Page
Fig. 1 Sampling sites for water quality, electrofishing (EL), and seining (SN)at SSES and Bell Bend on the Susquehanna:River,:2010 ..................... 31
Fig. 2 The 2010 daily mean flow of the:Susquehanna River at theSusquehanna SES Environmental Laboratory ............................................... 32
Fig. 3 The 2010 monthly mean flow of the Susquehanna River at theSusquehanna SES Environmental Laboratory compared to the49-year (1961-2009) m ean ...................................................................... 32
Fig. 4 Volume of Susquehanna River flow at the Susquehanna SESEnvironmental Laboratory, 1961-2010 ..................................................... 33
Fig. 5 Daily Susquehanna River water withdrawal by Susquehanna SES,2008-2010 ........................................... 34
Fig. 6 The 2010 daily mean temperature of the Susquehanna River at theSusquehanna SES Environmental Laboratory ...................... 35
Fig. 7 The 2010 monthly mean temperature of the Susquehanna River at theSusquehanna SES Environmental Laboratory compared to the 36-year(1974-2009) m ean .................................................................................... 35
Fig. 8 Total iron and sulfate of the Susquehanna River at the SSES samplingsite, 1975-2010 ...................................................................................... . . 36
Iv

INTRODUCTION
PPL Susquehanna, LLC (PPL) contracted Ecology Ill, Inc. to conduct nonradiological
-- monitoring of the Susquehanna River in the vicinity of the Susquehanna Steam Electric Station
(Susquehanna SES) in 2010. The Susquehanna SES is a nuclear power station with two boilirig
water reactors, each with a net electrical generating capacity of approximately 1,350 megawatts.
It Is located on about .1,700 acres on the west side of the Susquehanna River in Salem Township,
*Luzerne County, 5 miles northeast of Berwick, Pennsylvania. In addition, approximately 700
acres of mostly undeveloped and recreational lands owned by PPL are located on the east side of
- the Susquehanna River in Conyngham and Hollenback Townships. PPL owns 90% of the station
and Allegheny Electric Cooperative, Inc. owns 10%.
The objective of the nonradiological environmental monitoring program is to assess the
_2 impact of operating the Susquehanna SES on the Susquehanna River water quality and relative
abundance of fishes. This was accomplished in 2010 by comparing data at control and indicator
stations and by evaluating results of preoperational (1971-1982) and operational (1983-2009)
studies (ichthyological Associates 1972, Ichthyological Associates, Inc. 1973-1985, Ecology Ill,
Inc. 1986-2010). Monitoring was done at sites within a control station (SSES) upriver from the
-- Susquehanna SES river intake structure and indicator station (Bell Bend) downriver from the
discharge diffuser.
To more objectively assess the Impact of operating the Susquehanna SES on the
Susquehanna River, a statistical procedure called BACI (Before-After:Control-Impact) analysis
was applied to preoperational and operational fishes monitoring data.
This report presents results of water quality and fishes studies.

-2-
WATER QUALITY
PROCEDURES
Water quality of the Susquehanna River relative to operation of the Susquehanna
SES was monitored throughout 2010 at four locations (Table 1, Fig. 1). Susquehanna
River water samples were collected quarterly at SSES (control) and Bell Bend (indicator).
In addition, water samples were also collected quarterly from the cooling tower blowdown
of the Susquehanna SES. River flow and temperature were monitored continuously at the
Environmental Laboratory (Table 2).
Most of the water sample parameters were analyzed by the Chemical Laboratory
personnel at the PPL System Facilities Center, Hazleton, Pennsylvania. This laboratory
has state accreditation with the Pennsylvania Department of Environmental Protection
(PADEP; Commonwealth of Pennsylvania 2010), identified as Lab #40-00568
(www.dep.state.pa.us). Water temperature and dissolved oxygen were measured by
Ecology Ill personnel and river level was recorded with the SSES data (Table 2). PPL
Susquehanna, LLC personnel provided data for Susquehanna River water withdrawal.
RESULTS AND DISCUSSION
River Flow, River Water Withdrawal, and River Temperature
In 2010, daily mean Susquehanna River flow ranged from 996 to 128,000 cubic feet
per second (cfs; Table 3, Fig. 2). The monthly mean Susquehanna River flow was above
the 49-year average for January, March, October, November, and December, and below

-3-
average for the remaining months (Fig. 3). For Luzerne County, the PADEP issued a
* drought watch on 6 August; this was changed to a drought warning on 16 September and
conditions returned to normal on 11 November (www.depweb.state.pa.us keyword:
Drought, accessed 3 February 2011). The annual precipitation at Avoca, PA (about 30
miles upriver from the Susquehanna SES) was 32.30 inches (5.26 inches below normal;
www.erh.noaa.gov/bqm/climate/avp.shtml, accessed 13 January 2011). Cumulatively, an
estimated 445 billion cubic feet of water flowed through this section of the Susquehanna
River during 2010 (Fig. 4).
Susquehanna SES river water withdrawal of river flow ranged from <0.1% on 14 and
15 March to 8.28% on 28 September (Fig. 5). Daily river water withdrawal of the plant was
<2% of river flow for more than two-thirds of 2010. River water withdrawal exceeded 4% of
* . river flow on 49 days last year.
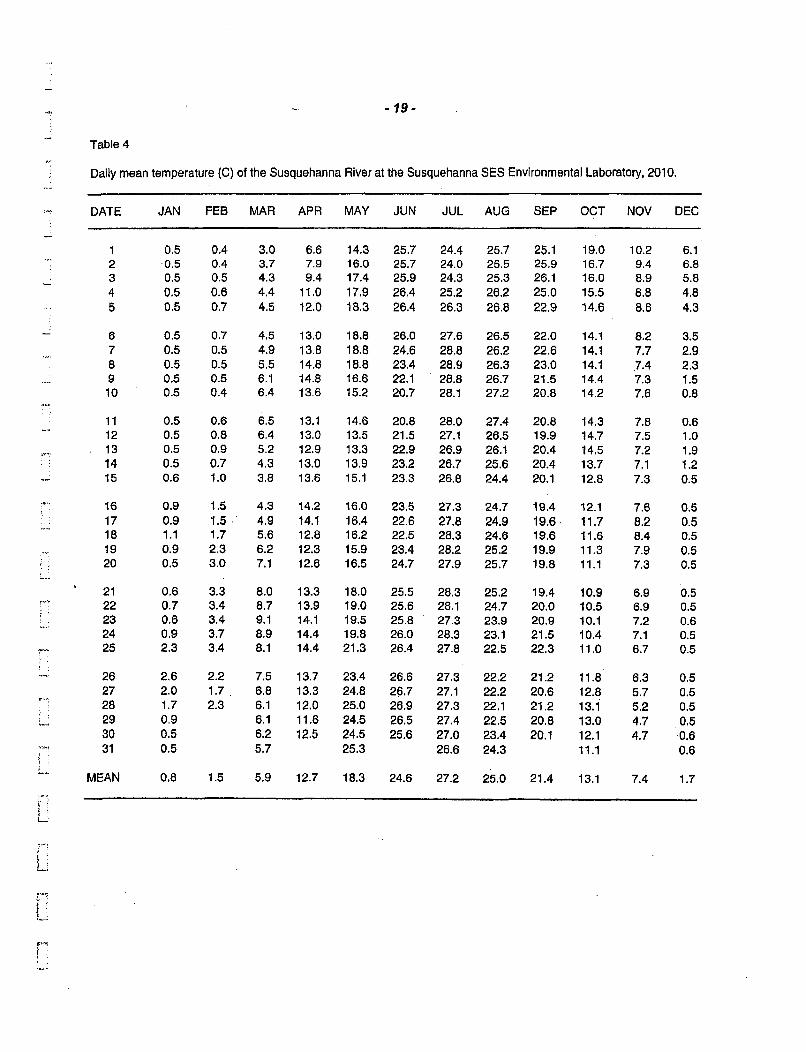
Daily mean river temperature ranged from 0.4 C on 1,2, and 10 February to:28.9 C
on 8 July (Table 4, Fig. 6). The hourly minimum river temperature of 0.3 C occurred at
0100 and 0200 h on 15 January. The hourly maximum river temperature of 30.6 C
occurred at 1600 h on 7 July and 1700 h on 8 July. March and April tied (5.9 C in 2000
and 12.7 C in 2008, respectively) the warmest monthly mean river temperatures on record
since 1974, for those months. July had the second warmest temperature in 37 years
(exceeded by 0.3 C in 2005) for that month. River temperature was above average every
month except January, October and December (Fig. 7). However, these temperature
comparisons did not take into account variations in river flow among. the months.
L,

-4-
River Water Quality at the Susquehanna SES
Control and indicator data were compared to PADEP specific water quality criteria
(Commonwealth of Pennsylvania 2009; Table 5). The parameters with published specific
water quality criteria for the critical use of the Susquehanna ,River in the vicinity of the
Susquehanna SES include alkalinity, ammonia nitrogen, dissolved oxygen, total iron, pH,
and temperature. In 2010, Susquehanna River water met the published criteria for all
collected samples at the control and indicator sampling sites (Table 6).
There have been significant decreases over time in certain indicators of abandoned
mine discharge such as total iron and sulfate concentrations (Table 7, Fig. 8), and Ecology
Ill, Inc. has long reported the biotic recovery in the river- associated with these
improvements.
Control and Indicator Site Comparisons
Control and indicator water quality data were similar on most of the sampling dates
during 2010 (Table 6). Since most of the water taken from the river for plant operation is
evaporated in the cooling process, the remaining cooling water returned to the river
subsequently contains concentrated mineral solids. Mineral solids concentrations in the
blowdown sample were 3.2 to 5.5 times greater than those of the river control (Table 6).
However, the dilutive effect of high river flow tends to equalize values at the control and
indicator sites. This is evident when TMS values of the blowdown are compared to the
control and indicator TMS results (Tables 8 and 9). It has been previously demonstrated
that TMS concentrations at SSES are the best predictor of TMS concentrations at Bell
Bend at most river flows. In addition, if operation of the Susquehanna SES is to influence
-...

-5-
the water quality at the indicator site, then the probability of that occurring should be
greatest at low river flows: (Ecology. I1,. Inc. 2008).
Conclusion
Susquehanna River flow exceeded the 49-year average during five months in 2010
and was below average for the remaining months. The maximum river water withdrawal of
river flow by Susquehanna SES was 8.28% on 28 September. On most days during 2010,
- however, river water withdrawal was <2% of river flow. Exceptionally warm river
temperatures were recorded for March, April and July.
Water quality data demonstrated that river samples met the published specific water
quality criteria for six common parameters. Overall, water quality of this section of the
Susquehanna River continues to improve.
Our data analyses demonstrate that effects of the operation of Susquehanna SES
on water quality of the Susquehanna River will likely occur at the lowest range of river
flows. This is reasonable because the dilutive power of the river against plant discharge
would then be minimized.
L

-6-
FISHES
PROCEDURES
Ellectrofishinci
Electrofishing samples were collected once each month in May, June, July, August
and October in 2010. Sampling was done at four sites, and each site was approximately
1,1 00-yards long and parallel to the river shoreline. These sites have been consistently
sampled by boat electrofishing since 1976. Two sites were located upriver from the
Susquehanna SES river intake structure along each bank of the river, and two sites were
downriver from the intake (referred to as SSES and Bell Bend locations, respectively; Table
10, Fig. 1).
The 18-foot electrofishing boat was outfitted with a 5-KW generator (direct current).
Electrical output was controlled by a variable-voltage pulsator, with a target of 5-6 amps
delivered to the water.
During sampling, the boat was driven downstream parallel to the shoreline, usually
within 30 feet of the riverbank. For both safety purposes and sampling efficiency,
electrofishing was done at river levels less than 493.1 feet above mean sea level (msl;
equivalent to 10.1 feet) as measured at the Environmental Laboratory. Sampling was done
in the evening and began about one hour after sunset. Two observers stood in the bow of
the boat and identified and counted fish during each sample. Data were recorded using a
cassette tape recorder.

-7-
Seining
Shoreline fishes were collected by seine during June and August. Sampling was
done when river levels were less than 490.2 feet above msl (equivalent to 7.2 feet at the
Environmental Lab). Similar to the electrofishing sampling sites, two shoreline seine sites
* were above the Susquehanna SES river intake structure and two were below (Table 10,
Fig. 1). High water prevented seining in October.
To seine, one end of the 25-foot bag seine (0.25-inch mesh) was kept stationary on
the riverbank while the other end was extended about 20 feet into the river or as far as
depth of the water allowed. The seine was then pulled upriver and onto shore. Two hauls
were made in the same location at each site and the catches from both hauls were
combined and considered one unit of effort. Captured fish were placed in 10% formalin in
the field and returned to the laboratory. After at least two weeks in the formalin, the fish
were rinsed with water, identified, and enumerated before final preservation in 40%
isopropyl alcohol.
Statistical Analysis
A statistical analysis known as the Before-After:Control-Impact (BACI), was applied
to the electrofishing (1976-2010) and seining data (1978-2010; Ecology Ill, Inc. 1990).
Twenty species or categories of fish were analyzed from the electrofishing data, as were
12 species from the seining data. These species or groups were chosen based on their
abundance during the years before Susquehanna SES operation.
Two different electrofishing data sets were analyzed. The first set included all
months sampled by electrofishing through the years, and is referred to as the All Data set.

-B-
The second set, named the Summer Data set, included only the months from June through
October to reflect the reduced monitoring effort in place sincel 986. The seining data set
analyzed by the BACI represents all of the months sampled by this method through the
years.
RESULTS AND DISCUSSION
Electrofishinc_
Electrofishing at the SSES and Bell Bend locations in 2010 resulted in the
observation of 1,594 fish of 19 species (Tables 11 through 13). The total numbers of fish
collected above and below the SSES intake and discharge for the year were generally
similar, with 815 fish at the upriver sites and 779 fish at the downriver sites. Differences in
monthly totals between upriver and downriver sites ranged from as few as 19 fish in May to
as many as 147 fish in August; in most months more fish were observed at the upriver sites
than at the downriver sites. Comparatively, the range of monthly sample sizes (maxima
minus minima) between the east and west banks was 92 fish at SSES and 158 at Bell
Bend. At both the upriver and downriver sites, more fish were observed in most months
along the eastern shore of the river. Maximum monthly sample sizes occurred during
October at SSES (275) and August at Bell Bend (308).
Walleye was the most abundant species observed at SSES and Bell Bend in 2010
(31% and 39% of the totals, respectively). Walleye and smallmouth bass together
represented 49% of the fish observed at SSES and 60% of those at Bell Bend. Walleye J
was also the most abundant species during July, August, and October at SSES and during
August and October at Bell Bend. Other species leading the list at SSES were smallmouth

-9-
bass during May and northern hog sucker in June. At Bell Bend, smallmouth bass were
most abundant in May, followed by yellow perch in June and rock bass in July. Overall, 5-
7% of fish observed were placed in the unidentified fish category at both sites during 2010.
Fifteen species were observed at SSES, as were 18 at Bell Bend. Species richness
in monthly samples ranged from 7 to 13 species at SSES and 10 to 14 species at Bell
Bend. Sucker and sunfish species dominated richness in all months during 2010.
Seining
Seining at the SSES and Bell Bend locations in 2010 resulted in the capture of 575
fish of 15 species (Tables 11 and 14). Spotfin shiner was the most abundant species
captured at SSES (26%), as was spottail shiner at Bell Bend (45%). Spotfin shiner,
bluntnose minnow and pumpkinseed comprised 63% of the fishes collected at SSES, while
spotfin shiner and spottail shiner comprised 88% of the fish collected at Bell Bend.
Similar to previous years, the number of fishes captured at SSES was a fraction
(44%) of those collected at Bell Bend. The disparity between the upriver and downriver
locations may reflect changing habitat differences between the sites.
Thirteen species were collected at both SSES and Bell Bend. At both stations,
species in the minnow and sunfish families predominated.
BACI Results: Electrofishing
Of the 20 species or categories of fish that were tested with the BACI analysis, eight
species from the All Data set and eight species from the Summer Data set showed
significant differences in the numbers of fishes above versus below the power plant

-10-
discharge (P50.05, Table 15). Species in the All Data set that indicated decreases in
abundance below the power plant discharge included quillback, northern hog sucker,
shorthead redhorse, muskellunge, rock bass, smallmouth bass, and unidentified fish. _
Brown bullhead was also significantly different; however, its numbers increased at Bell
Bend compared to the upriver sites. The Summer Data set demonstrated decline or
increase in all of the same species.
BACI Results: Seining
The results of the 12 seined species tested by BACI analysis indicated marginally
significant differences in the numbers of spoffin shiner (P=0.096), spottail shiner (P=0.087)
and rock bass (P=0.083) above versus below the plant discharge. The point estimates for
these species indicated that more spotfin and spottail shiners were collected at the
downriver sites versus upriver, while fewer rock bass were collected at the downriver
locations.
!.4

-11-
.... REFERENCES
American Chain and Cable Company (ACCO). 1971. Instruction manual for indicatingand recording liquid-level bubbler-type gauges in series "500" case. ACCO,Bristol Division, Waterbury, CT. Loose-leaf publ., n.p.
American Public Health Association. 1995. Standard methods for the examination ofwater and wastewater. 19th ed., APHA, Washington, DC.
Commonwealth of Pennsylvania. 2010. Enyironmental laboratory accreditation. 25 PaCode § 252. Fry Communications, Inc. Mechanicsburg, PA.
Commonwealth of Pennsylvania. 2009. Water quality standards. 25 Pa Code § 93.Fry Communications, Inc. Mechanicsburg, PA.
Ecology III, Inc. 1986. Ecological studies of the Susquehanna River in the vicinity of theSusquehanna Steam Electric Station, 1985 annual report. Prepared forPennsylvania Power and Light Company. Ecology III, Inc., Berwick, PA. 267 pp.
___...._.1987. Ecological studies of the Susquehanna River in the vicinity of theSusquehanna Steam Electric Station, 1986 annual report. Prepared forPennsylvania Power and Light Company.' Ecology III, Inc., Berwick, PA. 260 pp.
-__. 1988. Ecological studies of the Susquehanna River in the vicinity of theSusquehanna Steam Electric Station, 1987 annual report. Prepared forPennsylvania Power and Light Company. Ecology Ill, Inc., Berwick, PA. 228 pp.
1989. Ecological studies in the vicinity of the Susquehanna Steam ElectricStation, 1988 annual report. Prepared for Pennsylvania Power and Light Company.Ecology III, Inc., Berwick, PA. 177 pp.
L1990. Environmental studies in the vicinity of the Susquehanna Steam ElectricStation, 19.89 annual report. Prepared for Pennsylvania Power and Light Company.Ecology 111, Inc., Berwick, PA. 152 pp.
1991. Environmental studies in the vicinity of the Susquehanna Steam ElectricStation, 1990 annual report. Prepared for Pennsylvania Power and Light Company.
V•. Ecology III, Inc., Berwick, PA. 140 pp.
• 1992. Environmental studies in the vicinity of the Susquehanna Steam ElectricStation, 1991 annual report. Prepared for Pennsylvania Power and Light Company.Ecology Ill, Inc., Berwick, PA. 146 pp.

- 12-
1993. Environmental studies in the vicinity of the Susquehanna Steam ElectricStation, 1992 annual report. P•repared for Pennsylvania Power and Light Company.Ecology Ill, Inc., Berwick, PA. 102 pp.
1994. Environmental studies in the vicinity of the Susquehanna Steam ElectricStation, 1993 annual report. Prepared for Pennsylvania Power and Light Company.Ecology III, Inc., Berwick, PA. 136 pp.
1995. Environmental studies in the vicinity of the Susquehanna Steam ElectricStation, 1994 annual report. 'Prepared for Pennsylvania Power and Light Company.Ecology Ill, Inc., Berwick, PA. 139 pp.
1996. Environmental studies in the vicinity of the Susquehanna Steam ElectricStation, 1995 water quality and fishes. Prepared for Pennsylvania Power and LightCompany. Ecology III, Inc., Berwick, PA. 29 pp.
1997. Environmental studies in the vicinity of the Susquehanna Steam ElectricStation, 1996 water quality and fishes. Prepared for Pennsylvania Power and LightCompany. Ecology Ill, Inc., Berwick, PA. 31 pp.
_ 1998. Environmental studies in the vicinity of the Susquehanna Steam ElectricStation, 1997 water quality and fishes. Prepared for PP&L, Inc. Ecology ili, Inc.,Berwick, PA. 29 pp.
1999. Environmental studies in the vicinity pf the Susquehanna Steam ElectricStation, 1998 water quality and fishes. Prepared for PP&L, Inc. Ecology Ill, Inc., 7:
Berwick, PA. 29 pp.
2000. Environmental studies in the vicinity of the Susquehanna Steam ElectricStation, 1999 water quality and fishes. Prepared for PPL Corporation. Ecology Ill,Inc., Berwick, PA. 33 pp.
• 2001. Environmental studies in the vicinity of the Susquehanna Steam ElectricStation, 2000 water quality and fishes. Prepared for PPL Susquehanna, LLC.Ecology Ill, Inc., Berwick, PA. 30 pp. J
• 2002. Environmental studies in the'vicinity of the Susquehanna Steam ElectricStation, 2001 water quality and fishes. Prepared for PPL Susquehanna, LLC.Ecology III, Inc., Berwick, PA. 32 pp.
.2003. Environmental studies inthe vicinity of the Susquehanna Steam ElectricStation, 2002 water quality and fishes. Prepared for PPL Susquehanna, LLC.Ecology Ill, Inc., Berwick, PA. 43 pp.
-I

-13-
• 2004. Environmental studies in the vicinity of the Susquehanna Steam ElectricStation, 2003 water quality and fishes. Prepared for PPL Susquehanna, LLC.Ecology Ill, Inc., Berwick, PA. 32 pp.
• 2005. Environmental studies in the vicinity of the Susquehanna Steam ElectricStation, 2004 water quality and fishes. Prepared for PPL Susquehanna, LLC.Ecology III; Inc., Berwick, PA. 40 pp.
2007a. Environmental studies in the vicinity of the Susquehanna SteamElectric Station, 2005 water quality and fishes. Prepared for PPL Susquehanna,LLC. Ecology II, Inc., Berwick, PA 30 pp.
2007b. Environmental studies in the vicinity of the Susquehanna SteamElectric Station, 2006 water quality and fishes. Prepared for PPL Susquehanna,LLC. Ecology Ill, Inc., Berwick, PA. 33 pp.
_ 2008. Environmental studies in the vicinity of the Susquehanna Steam ElectricStation, 2007 water quality, benthic macroinvertebrates, and fishes. Prepared forPPL Susquehanna, LLC. Ecology Ill, Inc., Berwick, PA. 51 pp.
. 2009. Environmental studies in the vicinity of the Susquehanna Steam ElectricStation, 2008 water quality, benthic macroinvertebrates, and fishes. Prepared forPPL Susquehanna, LLC. Ecology III, Inc., Berwick, PA. 43 pp.
• 2010. Environmental studies in the vicinity of the Susquehanna Steam ElectricStation, 2009 water quality and. fishes. Prepared for: PPL Susquehanna, LLC.Ecology III, Inc., Berwicki PA. 36 pp.
Ichthyological Associates. 1972. An ecological study of the North Branch SusquehannaRiver in the vicinity of Berwick, Pennsylvania, progress report for the periodJanuary-December 1971. Prepared for Pennsylvania Power and Light Company.Ichthyological Associates, Ithaca, NY. 232 pp.
Ichthyological Associates, Inc. 1973. An ecological study of the North BranchSusquehanna River in the vicinity of Berwick, Pennsylvania, progress report for theperiod January-December 1972. Prepared for Pennsylvania Power and LightCompany. Ichthyological Associates, Inc., Berwick, PA. 658 pp. '
. 1974. An ecological study of the North Branch Susquehanna River in thevicinity of Berwick, Pennsylvania, progress report for the period January-December1973. Prepared for Pennsylvania Power and Light Company. IchthyologicalAssociates, Inc., Berwick, PA. 838 pp.

-14-
•__ 1976.: Ecological studies of the North Branch Susquehanna River in thevicinity of the Susquehanna Steam Electric Station, progress report for the periodJanuary-December 1974. Prepared for Pennsylvania Power and Light Company.Ichthyological Associates, Inc., Berwick, PA. 314 pp.
1976. Ecological studies of the North Branch Susquehanna River in thevicinity of the Susquehanna Steam Electric Station, annual report for 1975.Prepared for Pennsylvania Power and Light Company. Ichthyological Associates,Inc., Berwick, PA. 237 pp.
1977. Ecological studies of the Susquehanna River in the vicinity of theSusquehanna Steam Electric Station, annual report for 1976. Prepared for.Pennsylvania Power and Light Company. Ichthyological Associates, Inc., Berwick,PA, 250 pp.
1978. Ecological studies of the Susquehanna River in the vicinity of theSusquehanna Steam Electric Station, annual. report. ,for 1977. Prepared forPennsylvania Power and Light Company. Ichthyological Associates, Inc., Berwick,PA. 345 pp.
_ 1979. Ecological studies of the Susquehanna River in the vicinity of theSusquehanna Steam Electric Station, annual report for 1978. Prepared forPennsylvania Power and Light Company. Ichthyological Associates, -Inc., Berwick,PA. 293 pp.
1980. Ecological studies of the Susquehanna River in the vicinity of theSusquehanna Steam Electric Station, annual report for 1979. Prepared forPennsylvania Power and Light Company. Ichthyological Associates, Inc., Berwick,PA. 298 pp.
1981. Ecological studies of the Susquehanna:River in the vicinity of theSusquehanna Steam Electric Station, annual report for 1980. Prepared forPennsylvania Power and Light Company. Ichthyological Associates, Inc., Berwick,PA. 306 pp.
.1982. Ecological studies of the Susquehanna :River in the .vicinity of theSusquehanna Steam Electric Station, annual report for. .1981. Prepared forPennsylvania Power and Light Company. Ichthyological Associates, Inc., Berwick,PA. 365 pp.
1983. Ecological studies of the Susquehanna River in the vicinity of theSusquehanna Steam Electric Station, 1982 annual :report. Prepared forPennsylvania Power and Light Company. Ichthyological Associates, Inc., Berwick,PA. 353 pp.
-15-
. 1984. Ecological studies of the Susquehanna River in the vicinity of theSusquehanna Steam Electric Station, 1983 annual report. Prepared forPennsylvania Power and Light Company. Ichthyological Associates, Inc., Berwick,PA. 338 pp.
. 1985. Ecological studies of the Susquehanna River in the vicinity of theSusquehanna Steam Electric Station, 1984 annual report. Prepared forPennsylvania Power and Light Company. Ichthyological Associates, Inc., Berwick,PA. 343 pp.
Nelson, J. S., E. J. Crossman, H. Espinosa-P6rez, L. T. Findley, C. R. Gilbert, R. N. Lea,and J. D. Williams. 2004. Common and scientific names of fishes from the UnitedStates, Canada, and Mexico. 6th ed., Spec. Publ. 29. Am. Fish. Soc., Bethesda,MD.
Omega. 2001. Omega MobileCorder RD-MV-100 User's Manuals: User's Manual No.M3641, Communication Interface Manual No. M3643, DAQstandard SoftwareManual No. M3645. Omega Engineering, Inc., Stamford, CT.
Soya, W. J. 1991. Depth-level-flow relationship of the Susquehanna River at theSusquehanna SESEnvironmentalLaboratory. Ecology Ill, Inc., Berwick, PA.10 pp.

-16-
Table 1
Descriptions of Water quality sampling sites in the vicinity of the Susquehanna SES, 2010.
SITE LOCATION
Susquehanna SESEnvironmental Laboratory
SSES (control)
Blowdown
West bank of the Susquehanna River: 1,620 feet (ft) upriverfrom the Susquehanna SES intake structure, sensors for riverdepth and temperature are located on river bottom within 100 ftof the bank
Susquehanna River: 750 ft upriver from the center of theSusquehanna SES intake .structure, 130 ft from the west bank
Since November 1996: SusqueIianna SES Cooling TowerBlowdown Discharge Line 2S7 automatic composite sampler(ACS) about 750 feet downstream from the cooling tower basin,0.1 air miles NNE from the stand-by gas treatment vent at44200/N34117 (PA Grid System)
December 1990-October 1996: 6S7 ACS at the SusquehannaSES sewage treatment plant about 2,880 feet downstream fromthe cooling tower basin
Susquehanna River: 2,260 ft downriver from the SusquehannaSES discharge diffuser, 130 ft from the west bank
Bell Bend (indicator)

-17-
Table 2
Water quality parameters and methods of analyses utilized by the Susquehanna SES EnvironmentalLaboratory, 2010.
PARAMETER METHOD REFERENCEa
River depth(ft)
River level(ft above msl)
River flow(cfs)
Seven-day continuous recording from an Acco Bristol,. Model No.G500-15 bubbler-type water level gauge.
Level = Depth + 482.96
Insert river level into the appropriate regression equation.
At level <486.0 ft,log flow= - 0.0525 l(level) 2 + 51.478501(level)- 12612.85672
At level a486.0 ft,flow = 319.96989(level) 2 - 309316.24395(level) + 74753300
Constant monitor of river temperature:Seven-day continuous recording from an Omega RD-MV1 06-3-2-1 D temperature recorder.
River and blowdown temperature of samples collected:Calibrated, mercury-filled thermometer. Method 2550 B.
ACCO(1971)
Soya(1991)
Soya(1991)
Temperature(OF)
(°C)
Omega(2001)
APHA(1995)
Convert Fahrenheit to Celsius for tabulation: b Internet site
"C = (F - 32)-1.8 °cor' /0F-32
Dissolvedoxygen(mg/L)
Membrane electrode. Method 4500-0 G. APHA(1995)
F-
F~
a Listed in references cited.b http://mathforum.orq/librarv/drmath/\iew/58393.html. Accessed: 19 February 2009.

- 18
Table 3
Daily mean flow (cfs) of the Susquehanna River at the Susquehanna SES Environmental Laboratory, 2010.
DATE JAN . FEB MAR APR MAY JUN JUL AUG SEP OCT NOV DEC
12345
6789
10
1112131415
1617181920
2122232425
13100127001350012300
8470
74508120882084707450
68005880649061805880
680071208120
1350019700
1720014000115001030015300
2130016700153001530013500
119001030010700
95409180
88208120778077807450
68006800680064905880
58805880588058805880
618058805590
6180 667006490 568006800 454006800 373006490 30000
6490 257006490 223006490 202008470 18700
13100 18700
19200 1870030000 1670051000 1490078300 1350098600 12300
77300 1070064800 1030053400 1030042400 1150035900 11900
31900 1110030000 991031900 918045400 812056800 8120
51800 918047000 1190040200 1970036600 2290037300 1870051800
14900131001150010300
9910
9540882088209910
10300
1030011100111001620015800
1530014400127001150011500
115009540847074506800
649058805300502047404210
10100
39603960371034603710
346039608120
115009910
84708820778088208470
84707780649058805880
55905020474044804210
34603460
346034603460
37103960346032303230
30002770256021402140
21402140235027702770
21402140235021401940
21401940175017501750
15701210121012101210
15701570157019401570
17501750175017501570
3960 16200 140003460 66700 127003230 57700 115002770 44600 107002560 33200 11100
2350 31300 127002140 41600 158001940 41600 162001750 30600 140001750 24600 12700
1570 19700 119001570 17700 111001570 17200 107001570 15300 99101570 14000 9180
1570 12700 88201390 12300 107001210 17700 246001210 19200 294001390 15300 24000
1390 13100 197001390 11100 172001210 9540 153001210 9180 14000996 9180 14000
996 8820 15300996 9540 17200996 15300 19700996 22300 19200
1940 20700 1620016700
1760 22400 15000
1870071400
'85500
6030046200
3320026900229001970016200
1440014000177002350025700
2230018700158001440013500
12700111001030095408820
847071207450618061806490
21800
26 11400027 12800028 8140029 5600030 3800031 28100
1940 13901570 19401570 27701750 37102560 4740
3230 131003460 123003960 88204210 71203230 58802560 4740
'7
MEAN 22600 9050 35000 20000 5800 2680 3190
.!
-1
-19-
Table 4
Daily mean temperature (C) of the Susquehanna River at the Susquehanna SES Environmental Laboratory, 2010.
DATE JAN FEB MAR APR MAY JUN JUL AUG SEP OCT NOV DEC
1 0.5 0.4 3.0 6.6 14.3 25.7 24.4 25.7 25.1 19.0 10.2 6.12 .0.5 0.4 3.7 7.9 16.0 25.7 24.0 25.5 25.9 16.7 9.4 6.83 0.5 0.5 4.3 9.4 17.4 25.9 24.3 25.3 26.1 16.0 8.9 5.84 0.5 0.6 4.4 11.0 17.9 26.4 25.2 26.2 25.0 15.5 8.8 4.85 0.5 0.7 4.5 12.0 18.3 26.4 26.3 26.8 22.9 14.6 8.6 4.3
- 6 0.5 0.7 4.5 13.0 18.8 26.0 27.6 26.5 22.0 14.1 8.2 3.57 0.5 0.5 4.9 13.8 18.8 24.6 28.8 26.2 22.6 14.1 7.7 2.98 0.5 0.5 5.5 14.8 18.8 23.4 28.9 26.3 23.0 14.1 .7.4 2.39 0.5 0.5 6.1 14.8 16.6 22.1 28.8 26.7 21.5 14.4 7.3 1.5
10 0.5 0.4 6.4 13.6 15.2 20.7 28.1 27.2 20.8 14.2 7.6 0.8
11 0.5 0.6 6.5 13.1 14.6 20.8 28.0 27.4 20.8 14.3 7.8 0.612 0.5 0.8 6.4 13.0 13.5 21.5 27.1 26.5 19.9 14.7 7.5 1.013 0.5 0.9 5.2 12.9 13.3 22.9 26.9 26.1 20.4 14.5 7.2 1.914 0.5 0.7 4.3 13.0 13.9 23.2 26.7 25.6 20.4 13.7 7.1 1.215 0.6 1.0 3.8 13.6 15.1 23.3 26.8 24.4 20.1 12.8 7.3 0.5
16 0.9 1.5 4.3 14.2 16.0 23.5 27.3 24.7 19.4 12.1 7.6 0.5
17 0.9 1.5 - 4.9 14.1 16.4 22.6 27.8 24.9 19.6. 11.7 8.2 0.518 1.1 1.7 5.6 12.8 16.2 22.5 28.3 24.6 19.6 11.6 8.4 0.519 0.9 2.3 6.2 12.3 15.9 23.4 28.2 25.2 19.9 11.3 7.9 0.520 0.5 3.0 7.1 12.6 16.5 24.7 27.9 25.7 19.8 11.1 7.3 0.5
21 0.6 3.3 8.0 13.3 18.0 25.5 28.3 25.2 19.4 10.9 6.9 0.522 0.7 3.4 8.7 13.9 19.0 25.6 28.1 24.7 20.0 10.5 6.9 0.523 0.6 3.4 9.1 14.1 19.5 25.8 27.3 23.9 20.9 10.1 7.2 0.624 0.9 3.7 8.9 14.4 19.8 26.0 28.3 23.1 21.5 10.4 7.1 0.525 2.3 3.4 8.1 14.4 21.3 26.4 27.8 22.5 22.3 11.0 6.7 0.5
26 2.6 2.2 7.5 13.7 23.4 26.6 27.3 22.2 21.2 11.8 6.3 0.527 2.0 1.7 6.8 13.3 24.8 26.7 27.1 22.2 20.6 12.8 5.7 0.528 1.7 2.3 6.1 12.0 25.0 26.9 27.3 22.1 21.2 13.1 5.2 0.529 0.9 6.1 11.6 24.5 26.5 27.4 22.5 20.8 13.0 4.7 0.530 0.5 6.2 12.5 24.5 25.6 27.0 23.4 20.1 12.1 4.7 0.631 0.5 5.7 25.3 26.6 24.3 11.1 0.6
MEAN 0.8 1.5 5.9 12.7 18.3 24.6 27.2 25.0 21.4 13.1 7.4 1.7
L

I ý;.
-20-
Table 5
Pennsylvania Department of Environmental Protection specific water quality criteria for the SusquehannaRiver in the vicinity of the Susquehanna SES, 2010.
PARAMETER UNIT PERIOD CRITERIA AVERAGEMinimum Maximum
Alkalinity as CaCO3 mg/L 20Ammonia Nitrogen mg/L 4.56Dissolved Oxygen mg/L 4.0
Daily Average 5.0
Iron Total mg/L 30-Day 1.5pH 6.0 9.0
Temperature C January 1-31 4.4February 1-29 4.4March 1-31 7.8April 1-15 11.1April 16-30 14.4May 1-15 17.8May 16-31 22.2June 1-15 26.7June 16-30 28.9July 1-31 30.6August 1-15 30.6August 16-31 30.6September 1-15 28.9September16-30 25.6October 1-15 22.2October 16-31 18.9November 1-15 14.4November 16-30 10.0December 1-31 5.6
.1
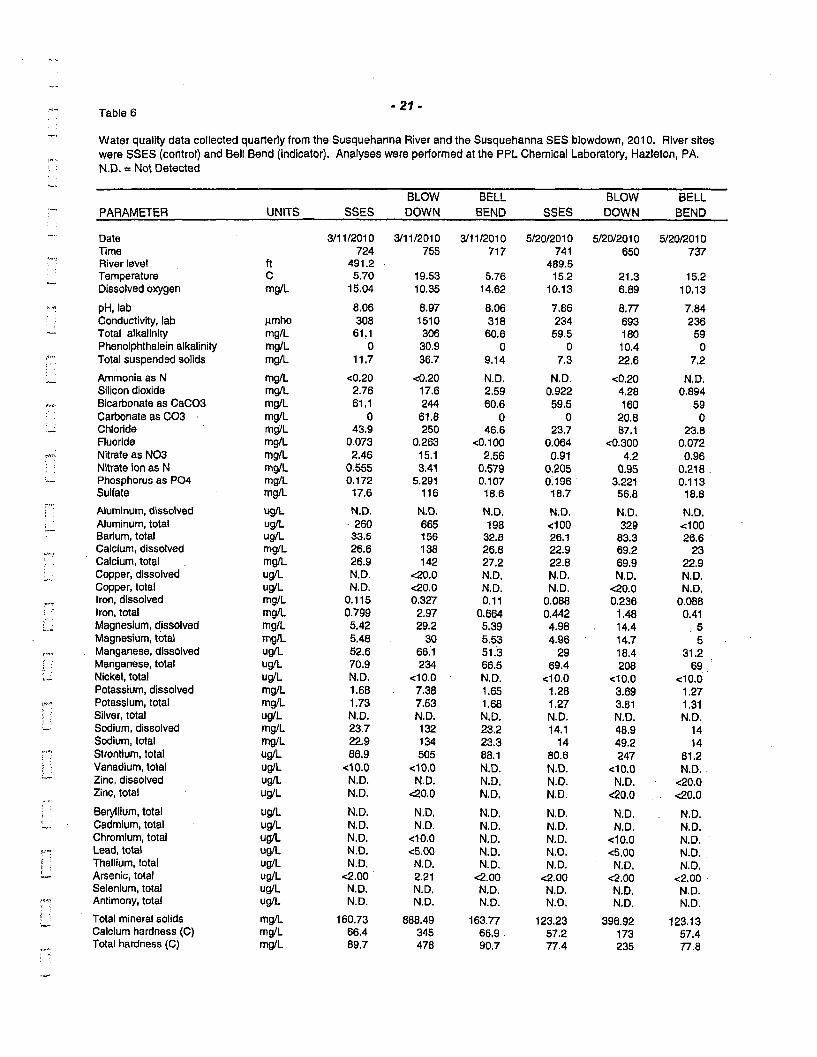
Table 6 -21-
Water quality data collected quarterly from the Susquehanna River and the Susquehanna SES blowdown, 2010. River sites
were SSES (control) and Bell Bend (indicator). Analyses were performed at the PPL Chemical Laboratory, Hazleton, PA.
N.D. = Not Detected
BLOW BELL BLOW BELL
* PARAMETER UNITS SSES DOWN BEND SSES DOWN BEND
- Date 3/11/2010 3/11/2010 3/11/2010 5/20/2010 5/20/2010 5/20/2010
Time 724 755 717 741 650 737
River level ft 491.2 489.5
Temperature C 5.70 19.53 5.76 15.2 21.3 15.2
Dissolved oxygen mg/L 15.04 10.35 14.62 10.13 6.89 10.13
pH, lab 8.06 8.97 8.06 7.86 8.77 7.84
Conductivity, lab gmho 308 1510 318 234 693 236
Total alkalinity mg/L 61.1 306 60.6 59.5 180 59
Phenolphthalein alkalinity mg/L 0 30.9 0 0 10.4 0
Total suspended solids mg/L 11.7 36.7 9.14 7.3 22.6 7.2
Ammonia as N mg/L <0.20 <0.20 N.D. N.D. <0.20 N.D.
Silicon dioxide mg/L 2.76 17.6 2.59 0.922 4.28 0.894
Bicarbonate as CaCO3 mg/L 61.1 244 60.6 59.5 160 59
* Carbonate as CO3 mg/L 0 61.8 0 0 20.8 0
Chloride mg/L 43.9 250 46.6 23.7 87.1 23.8
Fluoride mg/L 0.073 0.263 <0.100 0.064 <0.300 0.072
Nitrate as N03 mg/L 2.46 15.1 2.56 0.91 4.2 0.96
Nitrate Ion as N mg/L 0.555 3.41 0.579 0.205 0.95 0.218.
Phosphorus as P04 mg/L 0.172 5.291 0.107 0.196 3.221 0.113
Sulfate mg/L 17.6 116 18.6 18.7 56.8 18.8
Aluminum, dissolved ugIL N.D. N.D. N.D. N.D. N.D. N.D.Aluminum, total ug/L 260 665 198 <100 329 <100Barium, total ug/L 33.5 156 32.8 26.1 83.3 26.6
Calcium, dissolved mg/L 26.6 138 26.8 22.9 69.2 23
Calcium, totaI mgIL 26.9 142 27.2 22.8 69.9 22.9
Copper, dissolved ug/L N.D. <20.0 N.D. N.D. N.D. N.D.
Copper, total ug/L N.D. <20.0 N.D. N.D. <20.0 N.D.
Iron, dissolved mg/L 0.115 0.327 0.11 0.088 0.236 0.088
Iron, total mg/L 0.799 2.97 0.664 0.442 1.48 0.41
Magnesium, dissolved mg/L 5.42 29.2 5.39 4.98 14.4 5
Magnesium, total mg/L 5.48 30 5.53 4.96 14.7 5
Manganese, dissolved ug/L 52.6 66.1 51.3 29 18.4 31.2
Manganese, total ug/L 70.9 234 66.5 69.4 208 69
Nickel, total ug/L N.D. <10.0 N.D. <10.0 <10.0 <10.0
Potassium, dissolved mg/L 1.68 7.38 1.65 1.28 3.69 1.27
Potassium, total mg/L 1.73 7.63 1.68 1.27 3.81 1.31
Silver, total ug/L N.D. N.D. N.D. N.D. N.D. N.D.Sodium, dissolved mg/L 23.7 132 23.2 14.1 48,9 14
Sodium, total mg/L 22.9 134 23.3 14 49.2 14
Strontium, total ug/L 86.9 505 88.1 80.6 247 81.2
Vanadium, total ug/L <10.0 <10.0 N.D. N.D. <10.0 N.D.
Zinc, dissolved ug/L N.D. ND. N.D. N.D. N.D. <20.0
Zinc, total ug/L N.D. <20.0 N.D. N.D. <20.0 <20.0
Beryllium, total ug/L N.D. N.D, N.D. ND. N.D. N.D.
Cadmium, total ug/L N.D. N.D. N.D. N.D. N.D. N.D.
Chromium, total ug/L N.D. <10.0 ND. ND. <10.0 N.D.
Lead, total ug/L N.D. <5.00 N.D. N.D. <5.00 N.D.
Thallium, total ug/L N.D. N.D. N.D. N.D. N.D. N.D,
Arsenic, total ug/L <2.00 2.21 <2.00 <2.00 <2.00 <2.00
Selenium, total ug/L N.D. N.D. N.D. N.D. N.D. N.D.
Antimony, total ug/L N.D. N.D. N.D. N.D. N.D. N.D.
Total mineral solids mg/L 160.73 888.49 163.77 123.23 396.92 123.13
Calcium hardness (C) mg/L 66.4 345 66.9 57.2 173 57.4
Total hardness (C) mg/L 89.7 478 90.7 77.4 235 77.8

Table 6 (cont,) - 22-
BLOW BELL BLOW BELL
PARAMETER UNITS SSES DOWN BEND SSES DOWN BEND
Date 9/2/2010 9/2/2010 9/2/2010 11/10/2010 11/10/2010 11/10/2010Time 710 756 714 704 736 708River level ft 487.2 489.9Temperature C 24.7 25.8 24.8 6.01 15.55 6.01Dissolved oxygen mg/L 8.9 8.6 10.5 12.48 10.64 12.67
pH, lab 7.84 8.64 7686 7.75 8.71 7.77Conductivity, lab I.mho 276 852 278 214 640 212Total alkalinity mg/L 69 141 69.6 56.5 164 56Phenolphthaleln alkalinity mg/L 0 8.9 0 0 8.9 0Total suspended solids mg/L 5.2 16.6 5.2 <4.00 18 <4.00
Ammonia as N mg/L N.D. <0.20 ND. N.D. <0.20 N.D.Silicon dioxide mg/L 4.6 15.3 4.6 3.36 11.5 3.42Bicarbonate as CaCO3 mg/L 69 123 69.6 56.5 146 56Carbonate as C03 mg/L 0 17.8 0 0 17.8 0Chloride mg/L 27.7 101 28 20.2 68 20.1Fluoride mg/L <0.050 0.24 0.059 0.082 0.216 0.113Nitrate as N03 mg/L 1.36 5.99 1.35 1.41 5.22 1.59Nitrate Ion as N mg/L 0.306 1.35 0.305 0.318 1.18 0.36Phosphorus as P04 mg/L 0.163 2.988 0,175 0.04 3.491 0.009Sulfate mg/L 21.5 145 21.7 16.3 67.4 17.6
Aluminum, dissolved ug/L N.D. N.D. N.D. N.D. N.D. N.D.Aluminum, total ug/L <100 269 <100 <100 368 <100Barium, total ug/L 30.9 92.5 30.8 23.3 72.3 23.7Calcium, dissolved mg/L 27.2 87.3 27.6 21.4 68.6 21Calcium, total mg/L 27.7 88.3 27.7 21.3 70.1 21.5Copper, dissolved ug/L N.D. <20.0 N.D. N.D. N.D. N.D.Copper, total ug/L N.D. <20.0 N.D. N.D. N.D. N.D.Iron, dissolved mg/L 0.108 0.198 0.109 0,162 0.412 0.155Iron, total mg/L 0.479 1.45 0.449 0.41 1.65 0.396Magnesium, dissolved mg/L 5.61 17.3 5.65 4.26 13.4 4.2Magnesium, total mg/L 5.69 17.6 5.66 4.25 13.8 4.3Manganese, dissolved ug/L 26.2 15.3 23.2 38.6 15,9 36.5Manganese, total ug/L 99,8 273 93.8 47 149 45.6Nickel, total ug/L N.D. <10.0 N.D. N.D. <10.0 N.D.Potassium, dissolved mg/L 1.97 5.92 1.92 1.44 4.16 1.36Potassium, total mg/L 1.93 6.03 1.92 1.39 4.29 1.37Silver, total ug/L N.D. N.D. N.D. N.D. N.D. N.D.Sodium, dissolved mg/L 17.4 59.6 17.6 11.9 40.7 11.7Sodium, total mg/L 17.7 60 17.7 11.9 41.4 11.9Strontium, total ug/L 104 327 104 70.8 230 71.1Vanadium, total ug/L N.D. <10.0 <10.0 <10.0 <10.0 N.D.Zinc, dissolved ug/L N.D. N.D. N.D. N.D. N.D. N.D.Zinc, total ug/L N.D. ND. N.D. N.D. N.D. N.D.
Beryllium, total ug/L N.D. N.D. N.D. N.D. N.D. N.D.Cadmium, total ug/L N.D. N.D. N.D. N.D. N.D. N.D.Chromium, total ug/L N.D, <10.0 N.D. N.D. N.D. N.D.Lead, total ug/L N.D. <5.00 N.D. N.D. N.D. N.D.Thallium, total ug/L N.D. N.D. N.D. N.D. N.D. N.D.Arsenic, total ug/L <2.00 3.15 <2.00 N. D. <2.00 N.D.Selenium, total ug/L N.D. N.D. N.D. N.D. N.D. N.D.Antimony, total ug/L N.D. N.D. N.D. N.D. N.D. N.D.
Total mineral solids mg/L 149 522 150 114 377 115Calcium hardness (C) mg/L 67.9 218 68.9 53.4 171 52,4Total hardness (C) mg/L 92.6 293 92.5 70.7 232 71.4

- 23-
Table 7
Total iron concentrations from the Susquehanna River at the SSES sampling site, 1975-2010.Samples were collected monthly from 1975 through 1996 and quarterly from 1997 through 2010.PA DEP specific water quality criteria for total iron is 1,5 mg/L for a 30-day average.Analyses were performed by the PPL Chemical Laboratory, Hazleton, PA.
NO. SAMPLES NO. SAMPLES % SAMPLESYEAR Collected <1.50 mg/L <1.50 mg/L ANNUAL MEAN
1975
19761977197819791980
19811982198319841985
19861987198819891990
19911992199319941995
19961997199819992000
20012002200320042005
20062007200820092010
12 2
1211121212
1212111212
1212121212
1212121112
35555
97645
7879
10
101288
12
16.7
25.045.541.741.741.7
75.058.354.533.3.41.7
58.366.758.375.083.3
83.3100.066.772.7
100.0
75.0100.0100.0100.0100.0
100.0100.0
75.075.0
100.0
100.075.075.050.0
100.0
3.55
3.081.711.483.131.74
1.312.371.411.711.61
1.821.961.281.451.41
0.980.921.551.460.89
1.420.550.650.600.70
0.740.621.430.940.57
0.622.000.982.980.53
124444
44444
44444
94444
44334
43324

* 24-
Table 8
Comparison of total. mineral solids (TMS) concentrations from the Susquehanna River and theSusquehanna SES blowdown, 2010. River sites were SSES (control) and Bell Bend (indicator).
DATE SSES BLOWDOWN BELL BEND DIFFERENCEFlow TMS Flow TMS, TMS BELL BEND - SSES(cfs) (mg/L) (cfs) (mg/L) (mg/L) TMS
(mg/L)
11 Mar 19200 160.7 13.4 888.5 163.8 3.120 May 11500 123.2 13.7 396.9 123.1 -0.102 Sep 3460 149.0 31.8 522.0 150.0 1.010 Nov 12700 114.0 33.6 377.0 115.0 1.0
Table 9
Comparison of annual average total mineral solids (TMS) concentrations from the Susquehanna Riverand the Susquehanna SES blowdown, 1991-2010. River sites were SSES (control) and Bell Bend(indicator).
YEAR SSES BLOWDOWN BELL BEND DIFFERENCEFlow TMS Flow TMS TMS BELL BEND - SSES(cfs) (mg/L) (cfs) (mg/L) (mg/L) TMS
(mg/L)
1991 12600 197.3 14.6 711.8 203.7 6.41992 13400 155.3 7.5 600.3 156.4 1.11993 23700 202.8 13.1 636.2 204.4 1.61994 19200 174.9 13.9 660.9 175.3 0.41995 10200 196.7 12.9 643.9 198.8 2.1
1996 24000 151.8 19.5 438.4 152.6 0.81997 6490 239.0 16.9 787.7 248.6 9.61998 11200 242.2 19.2 649.3 247.9 5.71999 9120 204.1 11.2 585.1 212.0 7.92000 21200 160.4 12.6 449.5 163.5 3.1
2001 7190 180.2 20.8 572.5 183.9 3.72002 12200 136.2 17.7 523.4 142.5 6.32003 26900 131.3 18.7 459.0 132.5 1.22004 12200 134.1 18.3 446.6 136.3 2.22005 13500 157.1 16.2 584.0 165.4 8.3
2006 14400 137.6 17.9 522.8 138.0 0.42007 20800 145.7 20.4 455.1 147.9 2.22008 10700 164.1 23.2 505.0 165.1 1.02009 30900 99.9 22.4 393.8 100.2 0.32010 11700 136.7 23.1 546.1 138.0 1.3
MEAN 15600 167.4 17.0 558.6 170.7 3.3

.25-
Table 10
Descriptions of electrofishing (EL) and seining (SN) sites at SSES and Bell Bend on the Susquehanna River,2010.
SITE LOCATION
SSES (Control)
EL-1 East bank, 426 feet upriver from gas-line crossing to 1,082 feet upriver from a point opposite thecenter of the Susquehanna SES intake structure
EL-2 West bank from gas-line crossing to a point 820 feet upriver from the center of the SusquehannaSES intake structure
SN-1 East bank, 1,837 feet upriver from a point opposite the center of the Susquehanna SES intakestructure (33 feet upriver from the mouth of Little Wapwallopen Creek)
SN-2 West bank, 1,312 feet upriver from the center of the Susquehanna SES intake structure (328 feetdownriver from the boat ramp at the Susquehanna SES Environmental Laboratory)
BELL BEND (Indicator)
EL-3 East bank, 1,279 feet downriver from a point opposite the center of the Susquehanna SES Intakestructure to a point 1,640 feet upriver from the mouth of Wapwallopen Creek
EL-4 West bank, 1,246 feet dowrnriver from the center of the Susquehanna SES intake structure (558feet downriver from the discharge diffuser).to a point near the southeastern boundary of PPL'sWetlands Nature Area
SN-3 East bank, 8,528 feet (1.6 miles) downrlver from a point opposite the center of the SusquehannaSES intake structure, at the launching ramp of the Berwick Boat Club
SN-4 West bank, 4,264 feet (0.8 miles) downriver from the center of the Susquehanna SES intakestructure, near the southeastern boundary of PPL's Wetlands Nature Area

-26-
Table 11
Fish species that were observed while electrofishing or collected by seining at SSES and Bell Bend on theSusquehanna River, 2010. Names of fishes and order of listing conform to Nelson et al. (2004).
COMMON NAME SCIENTIFIC NAME
HerringsGizzard shad
Carps and MinnowsSpotfin shinerCommon carpRiver chubComely shinerSpottail shinerBluntnose minnowFallfish
SuckersQuillbackWhite suckerNorthern hog suckerShorthead redhorse
North American CatfishesChannel catfish
PikesNorthern pikeMuskellunge
TopminnowsBanded killifish
SunfishesRock bassRedbreast sunfishGreen sunfishPumpkinseedBluegillSmallmouth bass
PerchesTessellated darterYellow perchWalleye
ClupeldaeDorosoma cepedianum
CyprinidaeCyprinella 6pilopteraCyprinus carpioNocomis micropogonNotropis amoenusNotropis hudsoniusPimephales notatusSemotilus corporalis
CatostomidaeCarpiodes cyprinusCatostomus commersonfiHypentelium nigricansMoxostoma macrolepidotum
IctaluridaeIctalurus punctatus
EsocidaeEsox luciusEsox masquinongy
FundulidaeFundulus diaphanous
CentrarchidaeAmbloplites rupestrisLepomis auritusLepomis cyanellusLepomis gibbosusLepomis macrochirusMicropterus dolomieu
PercidaeEtheostoma olmstediPerca flavescensSander vitreus

3 C( .. I ... .. I I , . I - .. ..
Table 12
Number, mean, and percent total of fish observed while electrofishing at SSES on the Susquehanna River, 2010.
SPECIES
Gizzard shadCommon carpFallfish
QuillbackNorthern hog suckerShorthead redhorse
Sucker spp.Channel catfishMuskellungePike spp.Rock bassGreen sunfishPumpkinseedBluegillSmallmouth bassSunfish spp.Yellow perchWalleyeFish (unidentified)
27 May 24 Jun 29 Jul 26 Aug 25 Oct OVERALL
East West Mean % Total East West Mean % Total East West Mean % Total East West Mean % Total East West Mean % Total Mean % Total
0 0 0.0
1 1 1.0
1 4 2.5
5 3 4.0
4 2 3.0
1 0 0.5
0 0 0.0
5 2 3.5
1 1 1.0
0 0 0.0
6 7 6.5
0 0 0.0
0 1 0.5
0 0 0.0
26 5 15.5
1 1 1.0
0 1 0.5
2 0 1.0
4 2 3.0
0.0 0
2.3 05.7 09.2 46.9 471.1 00.0 18.0 02.3 10.0 0
14.9 90.0 21.1 00.0 0
35.6 52.3 11.1 12.3 16.9 2
0 0.0
0 0.0
11 5.5
5 4.53 25.00 0.00 0.50 0.00 0.50 0.0
11 10.01 1.50 0.00 0.04 4.51 1.01 1.02 1.52 2.0
0.0 0 0 0.0
0.0 1 2 1.59.6 0 2 1.07.8 8 4 6.0
43.5 9 8 8.50.0 2 2 2.0
0.9 0 0 0.00.0 1 1 1.00.9 0 0 0.00.0 1 0 0.5
17.4 9 11 10.02.6 0 0 0.00.0 0 1 0.50.0 7 2 4.57.8 12 10 11.01.7 4 6 5.01.7 2 1 1.52.6 25 33 29.03.5 8 5 6.5
0.0
1.71.16.89.6
2.30.01.10.00.6
11.30.00.65.1
12.45.61.7
32.87.3
0 0 0.0
4 1 2.5
4 0 2.0
2 7 4.5
7 2 4.5
3 1 2.0
0 0 0.0
1 1 1.0
2 0 1.0
1 0 0.5
20 0 10.0
0 0 0.0
3 0 1.5
1 0 0.5
22 15 18.5
1 1 1.0
3 0 1.5
44 2 23.0
9 4 6.5
127 34 80.5
0.0 1 0 0.53.1 3 1 2.02.5 0 0 0.05.6 19 12 15.55.6 13 8 10.52.5 0 0. 0.00.0 0 2 1.01.2 0 0 0.01.2 0 0 0.00.6 1 0 0.5
12.4 12 6 9.00.0 0 0 0.01.9 0 0 0.00.6 0 0 0.0
23.0 42 9 25.51.2 0 0 0.01.9 0 0 0.0
28.6 48 94 71.08.1 3 1 2.0
0.4
1.50.0
11.3
7.6
0.0
0.7
0.0
0.0
0.4
6.5
0.0
0.0
0.0
18.5
0.0
0.0
51.6
1.5
0.1 0.1
1.4 1.7
2.2 2.7
6.9 8.5
10.3 12.6
0.9 1.1
0.3 0.41.1 1.3
0.5 0.6
0.3 0.4
9.1 11.2
0.3 0.4
0.5 0.6
1.0 1.2
15.0 18.4
1.6 2.0 N
0.9 1.1
25.1 30.8
4.0 4.9
TOTAL 57 30 43.5 74 41 57.5 89 88 88.5 142 133 137.5 81.5
TOTAL 57 30 43.5 74 41 57.5 89 88 88.5 142 133 137.5 81.5

Table 13
Number, mean, and percent total of fish observed while electrofishing at Bell Bend on the Susquehanna River, 2010.
SPECIES 27 May 24 Jun 29 Jul 26 Aug 25 Oct OVERALL
East West Mean % Total East West Mean % Total East West Mean % Total East West Mean % Total East West Mean % Total Mean % Total
Common carpRiver chubFallfishQuillbackWhite suckerNorthern hog sucker
Shorthead redhorseSucker spp.Channel catfishNorthern pikeMuskellungePike spp.Rock bassRedbreast sunfishGreen sunfishPumpkinseedBluegillSmallmouth bassSunfish spp.Yellow perchWalleyeFish (unidentified)
2 0 1.01 0 0.5
2 1 1.53 2 2.50 0 0.00 4 2.01 0 0.50 0 0.04 2 3.00 0 0.00 1 0.50 0 0.03 1 2.00 0 0.00 0 0.00 0 0.01 0 0.59 18 13.51 0 0.50 0 0.04 1 2.56 1 3.5
37 31 34.0
2.9 01.5 04.4 17.4 13
0.0 0
5.9 3
1.5 00.0 08.8 3
0.0 11.5 00.0 05.9 20.0 00.0 20.0 01.5 0
39.7 51.5 10.0 147.4 2
10.3 5
0 0.00 0.00 0.50 6.50 0.0
3 3.00 0.00 0.01 2.00 0.50 0.00 0.02 2.00 0.01 1.50 0.00 0.03 4.00 0.50 7.02 2.03 4.0
0.0 4
0.0 0
1.5 0
19.4 2
0.0 0
9.0 0
0.0 1
0.0 0
6.0 1
1.5 0
0.0 0
0.0 0
6.0 12
0.0 1
4.5 2
0.0 2
0.0 1
11.9 9
1.5 5
20.9 2
6.0 5
11.9 9
1 2.5 6.1 7o 0.0 0.0 01 0.5 1.2 12 2.0 4.9 3
0 0.0 0.0 0
0 0.0 0.0 41 1.0 2.4 0
0 0.0 0.0 00 0.5 1.2 10 0.0 0.0 01 0.5 1.2 2
0 0.0 0.0 13 7.5 18.3 430 0.5 1.2 01 1.5 3.7 01 1.5 3.7 01 1.0 2.4 04 6.5 15.9 574 4.5 11.0 10 1.0 2.4 24 4.5 11.0 992 5.5 13.4 15
3 5.0 3.2 3 0 1.50 0.0 0.0 0 0 0.02 1.5 1.0 1 0 0.50 1.5 1.0 9 11 10.00 0.0 0.0 0 1 0.55 4.5 2.9 5 4 4.50 0.0 0.0 1 0 0.50 0.0 0.0 1 0 0.50 0.5 0.3 0 2 1.00 0.0 0.0 0 0 0.00 1.0 0.6 0 0 0.01 1.0 0.6 0 0 0.08 25.5 16.6 1 8 4.50 0.0 0.0 0 0 0.00 0.0 0.0 0 0 0.01 0.5 0.3 0 0 0.00 0.0 0.0 0 0 0.0
11 34.0 22.1 13 31 22.01 1.0 0.6 0 0 0.00 1.0 0.6 0 0 0.0
33 66.0 42.9 41 116 78.57 11.0 7.1 1 5 3.0
1.2 2.0 2.60.0 0.1 0.10.4 0.9 1.27.9 4.5 5.80.4 0.1 0.13.5 2.8 3.60.4 0.4 0.50.4 0.1 0.10.8 1.4 1.80.0 0.1 0.10.0 0.4 0.50.0 0.2 0.33.5 8.3 10.70.0 0.1 0.10.0 0.6 0.80.0 0.4 0.50.0 0.3 0.4
17.3 16.0 20.50.0 1.3 1.7
0.0 1.8 2.361.8 30.7 39.4
2.4 5.4 6.9
TOTAL 52 15 33.5 56 26 41.0 236 72 154.0 76 178 127.0 77.9
.. ... 1 .... U 7 .. ..... ... .... ... . .. .. ... .

29-
Table 14
Number, mean, and percent total of fish captured by seining at SSES and Bell Bend on the Susquehanna River, 2010.
SPECIES 28 Jun 24 Aug OVERALL
East West Mean % Total East West Mean % Total Mean % Total
SSES
Spotfin shinerComely shinerSpottail shiner
* Bluntnose minnowFallfishWhite suckerRock bass
* Redbreast sunfishGreen sunfishPumpokinseedSmallmouth bassTessellated darterWalleve
TOTAL
100
14241002140
9000001100041
5.0 22.20.0 0.00.0 0.07.0 31.11.0 4.42.0 8.91.0 4.40.5 2.20.0 0.01.0 4.40.5 2.24.0 17.80;5 2.2
31 5 18.01 0 0.52 5 3.59 4 6.50 0 0.01 0 0.58 0 4.00 0 0.0
11 11 11.010 26 18.01 1 1.04 1 2.50 0 0.0
78 53 65.5
27.50.85.39.90.00.86.10.0
16.827.5
1.53.80.0
11,50.31.86.80.51.32.50.35.59.50.83.30.3
44.0
26.10.64.0
15.31.12.85.70.6
12.521.61.77.40.6
29 16 22.5
BELL BEND
Snotfin shinerSpottail shinerBluntnose minnowFallfishWhite suckerNorthern hoo suckerBanded killifishRock bassRedbreast sunfishGreen sunfish
t PumokinseedSmallmouth bassTessellated darter
TOTAL
2060200000003
12000000000
1.5 15.81.0 10.53.0 31.60.0 0.01.0 10.50.0 0.00.0 0.00.5 5.30.0 0.00.0 0.00.0 0.00.5 5.32.0 21.1
158 13 85.5173 4 88.5
6 6 6.00 1 0.50 0 0.00 2 1.03 2 2.52 2 2.00 1 0.52 0 1.01 3 2.00 0 0.01 0 0.5
346 34 190.0
45.046.6
3.20.30.00.51.31.10.30.51.10.00.3
43.544.8
4.50.30.50.51.31.30.30.51.00.31.3
99.8
43.644.9
4.50.30.50.51.31.30.30.51.00.31.3
14 5 9.5

-30-
Table 15
P-values for fish species deemed significant by the BACI analysis, 1976-2010 (cc = 0.05).Species listed decreased In number at the downriver locations, except for brown bullheads whichincreased at the downriver sites. Columns depict the p-values associated with the two temporalcategories of data analyzed; All Data represents all months sampled, Summer Data denotessamples collected from June through October.
SPECIES ALL DATA SUMMERDATA
Quillback 0.007 0.002
Northern hog sucker <0.001 0.011
Shorthead redhorse <0.001 <0.001
Brown bullhead 0.005 0.047
Muskellunge <0.001 0.003
Rock bass <0.001 0.005
Smallmouth bass 0.032 0.001
Unidentified fish 0.024 0.001

-31-
SUSQUEHANNA STEAMELECTRIC STATION
SPRAY POND
..COOLING..:TOWERS %
GAS-LINE CROSSIN.G
EL-
SUSQUEHANNA SES //ENVIRONMENTAL
LABORATORY /I
(WLITTLEWAPWALLO PEN
-CREFK
NORTH
- SSES(CONTROL)
BELLBEND
(INDICATOR)
SAMPLING SITES
- ELECTROFISHINGo SEINING
( WATER QUALITYEEL WALLS
0 984
FEETSN-4
L•
WAPWALLOPENCREEK
Li Fig. 1
Sampling sites for water quality, electrofishing (EL), and seining (SN) atSSES and Bell Bend on the.Susquehanna River, 2010.

- 32-
140 -
120 -
100 -
SUSQUEHANNA RIVER FLOW
Daily Mean
xCo
80-
60- 1140 -
20-
0-I I I " I I
JAN FEB MAR APR MAY JUN JUL AUG SEP OCT NOV DEC
Fig. 2
The 2010 daily mean flow of the Susquehanna River at the Susquehanna SESEnvironmental Laboratory. The means were calculated from EnvironmentalLaboratory data.
0
xCo
40
35
30
25
20
15
10
5
0
Monthly Mean1912010
F l1961-2009
!j
JAN FEB MAR APR MAY JUN JUL AUG SEP OCT NOV DEC
Fig. 3
The 2010 monthly mean flow of the Susquehanna River at the Susquehanna SESEnvironmental Laboratory compared to the 49-year (1961-2009) mean, The meanswere calculated from U.S. Geological Survey and Environmental Laboratory data.
*"1

-33-
:SuSQUEF-HANNA RIVER VOLUME
x
L..
8
7
6
5
4-
3-
21961 65
Fig. 4
U 70 75 80 85 90 95 00 05 2010
Li
Volume of Susquehanna River flow at the Susquehanna SES Environmental Laboratory,1961-2010. The volumes were calculated from U.S. Geological Survey and EnvironmentalLaboratory data.
L

-34-
SUSQUEHANNA RIVER WATER WITHDRAWAL9- 2008
8•
T6-
5-"
4 -S4- .
odo
JAN FEB MAR APR MAY JUN JUL AUG SEP OCT NOV DEC
9-8 - 2009
5-
o 3 -•44i
JAN -.FEB .MAR;. AP;:ýAiR :MAY JUN. JULAUG SEPOCT .NOV DEC
9"2010'
8-
T6-
44-o 3-2- :.
0 -
JAN FEB MAR APR MAY JUN JUL: AUG SEP OCT NOV DEC
Fig. 5
Daily Susquehanna River water withdrawal by Susquehanna SES, 2008-2010.Data provided by PPL Susquehanna, LLC personnel. -1

-35-
SUSQUEHANNA RIVER TEMPERATURE
Daily Mean
(I)
U)0
30
25
20
15
10
5
0JAN FEB MAR APR MAY JUN JUL AUG SEP OCT NOV DEC
Fig. 6
The 2010 daily mean temperature of the Susquehanna River at the SusquehannaSES Environmental Laboratory.
L.
U)
30
25
20
15
10
5
0
Monthly Mean=2010
IM 1974-2009
L.. JAN FEB MAR APR MAY JUN JUL AUG SEP OCT NOV DEC
Fig. 7
The 2010 monthly mean temperature of the Susquehanna River at the SusquehannaSES Environmental Laboratory compared to the 36-year (1974-2009) mean.

-36-
TOTAL IRON15.0
13.5
12.0
10.5
........ y = 2.48e-°.°0035XR2 = 0.1085P = <0.001
E)E
9.0
7.5
6.0
4.5
3.0
1.5
0.0
150
120
90
)
1975 80 85 90 95 00 05 2010
)
)
SULFATE
-A-
E60
30
0.1
1975 80 85 90 95 00 05 2010
Fig. 8 9
Total iron and sulfate of the Susquehanna River at the SSES sampling site, 1975-2010. Sampleswere collected monthly 1975-1996 and quarterly 1997-2010. Analyses were performed by the PPLChemical Laboratory, Hazleton, PA.
:71'ý.- Al_:J