Embed Size (px)
Citation preview

Environmental Technology Verification Program Advanced Monitoring Systems Pilot
Generic Verification Protocol for Ambient Fine Particle Monitors

GENERIC VERIFICATION PROTOCOL
FOR
AMBIENT FINE PARTICLE MONITORS
August 2002
Prepared by
Battelle505 King Avenue
Columbus, OH 43201-2693
TABLE OF CONTENTS
Page
1 Introduction . . . . . . . . . . . . . . . . . . . . . . . . . . . . . . . . . . . . . . . . . . . . . . . . . . . . . . . . . . . . 1 1.1 Background . . . . . . . . . . . . . . . . . . . . . . . . . . . . . . . . . . . . . . . . . . . . . . . . . . . . . . . . 1
1.1.1 Environmental Technology Verification . . . . . . . . . . . . . . . . . . . . . . . . . . 1 1.1.2 Fine Particulate Monitoring . . . . . . . . . . . . . . . . . . . . . . . . . . . . . . . . . . . . 1
1.2 Test Objective . . . . . . . . . . . . . . . . . . . . . . . . . . . . . . . . . . . . . . . . . . . . . . . . . . . . . . 3 1.3 Test Applicability . . . . . . . . . . . . . . . . . . . . . . . . . . . . . . . . . . . . . . . . . . . . . . . . . . . 4
2 Technology Description . . . . . . . . . . . . . . . . . . . . . . . . . . . . . . . . . . . . . . . . . . . . . . . . . . . 4 2.1 Chemical Composition . . . . . . . . . . . . . . . . . . . . . . . . . . . . . . . . . . . . . . . . . . . . . . . 5 2.2 Mass or Surrogate Mass . . . . . . . . . . . . . . . . . . . . . . . . . . . . . . . . . . . . . . . . . . . . . . 6
3 Verification Approach . . . . . . . . . . . . . . . . . . . . . . . . . . . . . . . . . . . . . . . . . . . . . . . . . . . . 8 3.1 Scope of Testing . . . . . . . . . . . . . . . . . . . . . . . . . . . . . . . . . . . . . . . . . . . . . . . . . . . . 8 3.2 Site Selection . . . . . . . . . . . . . . . . . . . . . . . . . . . . . . . . . . . . . . . . . . . . . . . . . . . . . . 9 3.3 Experimental Design . . . . . . . . . . . . . . . . . . . . . . . . . . . . . . . . . . . . . . . . . . . . . . . . 10 3.4 Reference Methods and Supplemental Measurements . . . . . . . . . . . . . . . . . . . . . . 12
3.4.1 PM2.5 Mass . . . . . . . . . . . . . . . . . . . . . . . . . . . . . . . . . . . . . . . . . . . . . . . . 13 3.4.2 Speciation . . . . . . . . . . . . . . . . . . . . . . . . . . . . . . . . . . . . . . . . . . . . . . . . . 13 3.4.3 Supplemental Measurements . . . . . . . . . . . . . . . . . . . . . . . . . . . . . . . . . . 14
3.5 Data Comparisons . . . . . . . . . . . . . . . . . . . . . . . . . . . . . . . . . . . . . . . . . . . . . . . . . . 15 3.5.1 Quantitative Comparisons . . . . . . . . . . . . . . . . . . . . . . . . . . . . . . . . . . . . 15 3.5.2 Qualitative Comparisons . . . . . . . . . . . . . . . . . . . . . . . . . . . . . . . . . . . . . 16
3.6 Roles and Responsibilities . . . . . . . . . . . . . . . . . . . . . . . . . . . . . . . . . . . . . . . . . . . 17 3.6.1 Battelle . . . . . . . . . . . . . . . . . . . . . . . . . . . . . . . . . . . . . . . . . . . . . . . . . . . 19 3.6.2 Vendors . . . . . . . . . . . . . . . . . . . . . . . . . . . . . . . . . . . . . . . . . . . . . . . . . . 22 3.6.3 EPA . . . . . . . . . . . . . . . . . . . . . . . . . . . . . . . . . . . . . . . . . . . . . . . . . . . . . 22 3.6.4 Test Sites . . . . . . . . . . . . . . . . . . . . . . . . . . . . . . . . . . . . . . . . . . . . . . . . . 23 3.6.5 On-Site Operators . . . . . . . . . . . . . . . . . . . . . . . . . . . . . . . . . . . . . . . . . . 24 3.6.6 Contract Analytical Laboratories . . . . . . . . . . . . . . . . . . . . . . . . . . . . . . . 25
4 Test Procedures . . . . . . . . . . . . . . . . . . . . . . . . . . . . . . . . . . . . . . . . . . . . . . . . . . . . . . . . 25 4.1 Field Testing . . . . . . . . . . . . . . . . . . . . . . . . . . . . . . . . . . . . . . . . . . . . . . . . . . . . . . 25 4.2 PAH Sampling . . . . . . . . . . . . . . . . . . . . . . . . . . . . . . . . . . . . . . . . . . . . . . . . . . . . 26
4.2.1 Denuders . . . . . . . . . . . . . . . . . . . . . . . . . . . . . . . . . . . . . . . . . . . . . . . . . 27 4.2.2 Other Sampling Components . . . . . . . . . . . . . . . . . . . . . . . . . . . . . . . . . . 27
iii
TABLE OF CONTENTS (Continued)
Page
4.2.3 Shipment of Sampling Components . . . . . . . . . . . . . . . . . . . . . . . . . . . . 28 4.2.4 PAH Sampling . . . . . . . . . . . . . . . . . . . . . . . . . . . . . . . . . . . . . . . . . . . . . 28 4.2.5 PAH Analysis . . . . . . . . . . . . . . . . . . . . . . . . . . . . . . . . . . . . . . . . . . . . . . 28
5 Materials and Equipment . . . . . . . . . . . . . . . . . . . . . . . . . . . . . . . . . . . . . . . . . . . . . . . . . 29 5.1 FRM Sampler . . . . . . . . . . . . . . . . . . . . . . . . . . . . . . . . . . . . . . . . . . . . . . . . . . . . . 29 5.2 Speciation Sampler . . . . . . . . . . . . . . . . . . . . . . . . . . . . . . . . . . . . . . . . . . . . . . . . . 29 5.3 PAH Sampler . . . . . . . . . . . . . . . . . . . . . . . . . . . . . . . . . . . . . . . . . . . . . . . . . . . . . 30 5.4 Sampling Media . . . . . . . . . . . . . . . . . . . . . . . . . . . . . . . . . . . . . . . . . . . . . . . . . . . 30
6 Quality Assurance/Quality Control . . . . . . . . . . . . . . . . . . . . . . . . . . . . . . . . . . . . . . . . . 30 6.1 Sample Collection/Transfer . . . . . . . . . . . . . . . . . . . . . . . . . . . . . . . . . . . . . . . . . . 31 6.2 Data Collection/Transfer . . . . . . . . . . . . . . . . . . . . . . . . . . . . . . . . . . . . . . . . . . . . . 32 6.3 Field QA/QC Activities . . . . . . . . . . . . . . . . . . . . . . . . . . . . . . . . . . . . . . . . . . . . . 32
6.3.1 Flow Rate Check . . . . . . . . . . . . . . . . . . . . . . . . . . . . . . . . . . . . . . . . . . . 33 6.3.2 Leak Checks . . . . . . . . . . . . . . . . . . . . . . . . . . . . . . . . . . . . . . . . . . . . . . . 33 6.3.3 Temperature and Pressure Checks . . . . . . . . . . . . . . . . . . . . . . . . . . . . . . 33 6.3.4 Field Blanks . . . . . . . . . . . . . . . . . . . . . . . . . . . . . . . . . . . . . . . . . . . . . . . 34 6.3.5 Collocated Samplers . . . . . . . . . . . . . . . . . . . . . . . . . . . . . . . . . . . . . . . . 34
6.4 Laboratory QA/QC Activities . . . . . . . . . . . . . . . . . . . . . . . . . . . . . . . . . . . . . . . 35 6.4.1 Laboratory Blanks . . . . . . . . . . . . . . . . . . . . . . . . . . . . . . . . . . . . . . . . . . 35 6.4.2 Analytical Duplicates . . . . . . . . . . . . . . . . . . . . . . . . . . . . . . . . . . . . . . . . 36 6.4.3 Analytical Spikes . . . . . . . . . . . . . . . . . . . . . . . . . . . . . . . . . . . . . . . . . . . 36
6.5 Assessments and Audits . . . . . . . . . . . . . . . . . . . . . . . . . . . . . . . . . . . . . . . . . . . . . 36 6.5.1 Performance Evaluation Audits . . . . . . . . . . . . . . . . . . . . . . . . . . . . . . . . 36 6.5.2 Technical Systems Audits . . . . . . . . . . . . . . . . . . . . . . . . . . . . . . . . . . . . 37 6.5.3 Audits of Data Quality . . . . . . . . . . . . . . . . . . . . . . . . . . . . . . . . . . . . . . . 38
6.6 Reporting . . . . . . . . . . . . . . . . . . . . . . . . . . . . . . . . . . . . . . . . . . . . . . . . . . . . . . . . . 38 6.7 Corrective Action . . . . . . . . . . . . . . . . . . . . . . . . . . . . . . . . . . . . . . . . . . . . . . . . . . 39
7 Data Handling and Reporting . . . . . . . . . . . . . . . . . . . . . . . . . . . . . . . . . . . . . . . . . . . . . 39 7.1 Data Acquisition . . . . . . . . . . . . . . . . . . . . . . . . . . . . . . . . . . . . . . . . . . . . . . . . . . . 39 7.2 Data Review . . . . . . . . . . . . . . . . . . . . . . . . . . . . . . . . . . . . . . . . . . . . . . . . . . . . . . 40 7.3 Statistical Calculations . . . . . . . . . . . . . . . . . . . . . . . . . . . . . . . . . . . . . . . . . . . . . . 40
7.3.1 Comparability . . . . . . . . . . . . . . . . . . . . . . . . . . . . . . . . . . . . . . . . . . . . . 40 7.3.2 Predictability . . . . . . . . . . . . . . . . . . . . . . . . . . . . . . . . . . . . . . . . . . . . . . 41 7.3.3 Precision . . . . . . . . . . . . . . . . . . . . . . . . . . . . . . . . . . . . . . . . . . . . . . . . . . 42
iv
TABLE OF CONTENTS (Continued)
Page
7.3.4 Meteorological Effects/Precursor Gas Interferences . . . . . . . . . . . . . . . . 42 7.3.5 Short-Term Monitoring Capabilities . . . . . . . . . . . . . . . . . . . . . . . . . . . . 43 7.3.6 Qualitative Comparisons . . . . . . . . . . . . . . . . . . . . . . . . . . . . . . . . . . . . . 44
7.4 Reporting . . . . . . . . . . . . . . . . . . . . . . . . . . . . . . . . . . . . . . . . . . . . . . . . . . . . . . . . . 44
8 Health and Safety . . . . . . . . . . . . . . . . . . . . . . . . . . . . . . . . . . . . . . . . . . . . . . . . . . . . . . . 45
9 References . . . . . . . . . . . . . . . . . . . . . . . . . . . . . . . . . . . . . . . . . . . . . . . . . . . . . . . . . . . . 46
Appendix A . . . . . . . . . . . . . . . . . . . . . . . . . . . . . . . . . . . . . . . . . . . . . . . . . . . . . . . . . . . . . . . A-1
List of Figures
Figure 1. Organization Chart for Ambient Fine Particle Monitor Verification Test . . . . . . . 18
List of Tables
Table 1. Summary of Data Comparisons to be Made in Verification of Continuous Monitors . . . . . . . . . . . . . . . . . . . . . . . . . . . . . . . . . . . 16
v
ACRONYMS
AMS Advanced Monitoring Systems
APS Aerodynamic particle sizer
BAM Beta attenuation monitor
CARB California Air Resources Board
EC Elemental carbon
ELPI Electrical low pressure impactor
EPA United States Environmental Protection Agency
ETV Environmental Technology Verification
FEM Federal equivalent method
FRM Federal reference method
OC Organic carbon
PAH Polychlorinated aromatic hydrocarbon
PM Particulate matter
PM2.5 Particulate matter with an aerodynamic diameter less than 2.5 µm
PM10 Particulate matter with an aerodynamic diameter less than 10 µm
QA Quality assurance
QC Quality control
QMP Quality management plan
TEOM™ Tapered Element Oscillating Microbalance
TOR Thermal optical reflectance
WINS Well-Impactor Ninety Six
vi

1 INTRODUCTION
1.1 Background
1.1.1 Environmental Technology Verification
This protocol provides generic procedures for implementing a verification test of
monitors that continuously indicate the mass or chemical composition of fine particulate matter
in ambient air. The verification test is conducted under the auspices of the U.S. Environmental
Protection Agency (EPA) through its Environmental Technology Verification (ETV) program.
The purpose of the ETV program is to provide objective and quality-assured performance data on
environmental technologies, so that users, developers, regulators, and consultants can make
informed decisions about these technologies. ETV does not imply approval, certification, or
designation by EPA, but rather provides a quantitative assessment of the performance of a
technology under the specified test conditions.
Verification tests are coordinated by Battelle, of Columbus, Ohio, which is managing the
ETV Advanced Monitoring Systems (AMS) Center. The scope of the AMS Center covers
verification of monitoring technologies for contaminants and natural species in air, water, and
soil. In performing any verification, Battelle follows the procedures specified in the test protocol
and complies with the data quality requirements in the “Quality Management Plan (QMP) for the
ETV Advanced Monitoring Systems Center”.(1)
1.1.2 Fine Particulate Monitoring
The EPA promulgated changes to the National Ambient Air Quality Standard for
particulate matter (PM) in 1997.(2) Those changes call for revising the existing PM10 standard
and adding a new standard for PM2.5. The revised standard also calls for using “correlated
acceptable continuous” monitors to supplement PM2.5 sampling at community oriented
monitoring sites in large metropolitan areas. Additionally, a need to determine the chemical
components of particulate matter has been identified(3) and, consequently, a network of speciation
1

monitoring sites has been initiated.(4) As a result of these needs, there has been substantial effort
to develop methods for PM monitoring.
Methods used for measurement of PM mass and chemical composition include both
manual, filter-based methods, requiring sampling and subsequent laboratory analysis, and
continuous or automated methods, which provide results in real time or nearly real time.(5)
Manual sampling methods are well established, and several commercial devices for such
sampling have received Federal Reference Method (FRM) or Federal Equivalent Method (FEM)
designation(6) and are currently in widespread use for PM10 and PM2.5 monitoring. However,
these filter-based methods suffer from a number of limitations including relatively poor time
resolution (i.e., typically 24 hour), and the fact that they are relatively labor intensive and
typically require a number of activities to obtain a single result. As a result of these limitations,
data from time-integrated filter-based methods are not suitable for some valuable non
compliance purposes, such as assessing short-term variability in PM, tracking source
contributions, and monitoring human exposures. Furthermore, an additional limitation of these
methods is the potential for introducing error, by improper handling, or losing volatile PM
components.
In contrast, the primary advantage of continuous or automated monitors is their ability to
continuously and rapidly assess particulate matter levels or composition with relatively little
operator effort. Collecting real-time data of this type without the labor constraints imposed by
the manual methods makes continuous monitors invaluable tools for some particulate matter
monitoring applications. Indeed, many of these monitors have already been used for research
purposes when rapid time response is needed in PM monitoring. However, only a few
continuous monitors have received FEM designation status for PM10 monitoring, and none has
received that status for PM2.5 monitoring. This, along with a lack of independent verification
data for these monitors, has limited their credibility and acceptance. Consequently, they are not
yet widely used, despite considerable interest within the air monitoring and research
communities. The purpose of verification tests of ambient fine particle monitors is to provide
potential purchasers, users, and regulators of these monitors with quality-assured performance
data, with which informed decisions can be made about these monitors.
2
1.2 Test Objective
The purpose of the verification test is to evaluate the performance of ambient fine particle
monitors(a) under realistic operating conditions. The performance of these monitors shall be
evaluated primarily by comparisons with specific reference methods to determine their ability to
predict the results of those reference methods.
Specific objectives of verification tests for these monitors are to
• Assess the degree of agreement between these continuous technologies and timeintegrated reference methods when possible, or the degree to which the technologies being verified can predict the results of the reference methods
• Determine the intra-method precision of these continuous monitors by comparing simultaneous results from duplicate monitors
• Evaluate the effects of meteorological conditions on the performance of the continuous monitors
• Determine the influence of ambient precursor gases on the instrumental response of the monitors being verified
• Investigate the capabilities of these technologies to monitor short term changes in ambient particulate matter, through comparisons to reference method samples collected over various sampling durations
• Evaluate the reliability and general ease-of-use of these technologies over the course of the testing period.
To address these objectives, verification of these monitors shall involve field testing in two
separate phases. The degree to which the results from these monitors agree with those of the
reference methods, or can be used to predict the results of the reference methods, is established
based on statistical comparisons of the results from each phase. Similarly, statistical compari
sons of the results from duplicate monitors is used to assess the intra-method precision for these
continuous methods. The two separate phases are conducted in different geographic locations,
a For the purpose of clarity, technologies capable of monitoring ambient levels or composition of particulate matter either continuously or semi-continuously will be referred to as “continuous” monitors throughout this protocol.
3
and during different seasons to assess the effects of temperature, humidity, particulate matter
concentration, and chemical composition on the performance of the monitors being verified. In
addition, the verification test shall report on other operational characteristics including the
reliability, necessary maintenance, and ease of operation of these monitors. Verification results
shall summarize additional information that may be relevant to potential users, including power
and shelter requirements, data output, and the overall cost of these monitors.
The results from performance evaluations shall be made publically available with the goal
of providing credible information to potential purchasers, regulators, and permitters of these
technologies.
1.3 Test Applicability
This generic protocol is applicable to verification testing of ambient fine particulate
matter monitors that are capable of providing real-time, or nearly real-time, indications of the
ambient level of fine particulate matter(b) and do not require discrete manual steps for sample
collection, preparation, and laboratory analysis. Although not necessarily designed to monitor
the same physical quantity or property of ambient particulate matter, each of these devices can be
useful for PM monitoring by providing rapid assessment of various properties of ambient fine
particulate matter. In accordance with the intent of the ETV program, the monitors to be tested
shall be commercially available and not developmental products or prototypes.
2 TECHNOLOGY DESCRIPTION
Monitors to be tested are continuous particulate matter monitoring instruments whose
designs and principles of operation cover a wide range of analytical capabilities. Nonetheless,
they exhibit a rapid, quantitative response to ambient particulate matter and, therefore, may be
b For this generic protocol, fine particulate matter is defined as that fraction of particles with aerodynamic diameters below 2.5 µm (PM2.5). This is a general definition and will be adopted for all monitors to be tested unless otherwise noted. Individual vendors may wish to adopt a different definition for their monitor; however, in all cases, the definition of fine particulate matter will be clearly indicated in each verification report resulting from this test.
4

useful in ambient PM monitoring research applications. Based on the principle of operation of
these monitors, each can be grouped into categories for measuring either (1) chemical
composition, or (2) mass or “surrogate mass.” The technologies that fall within the former
category provide nearly continuous indication of some aspect of the chemical composition of
ambient particulate matter. The technologies within the latter category are used to monitor mass,
or what may be called “surrogate mass,” in that they measure a physical property that should
correlate with the mass of fine particulate matter present. That is to say, particle mass itself is
not necessarily measured by these techniques, but they may provide valuable indicators of
particle mass. A brief summary of some of the monitors in these general measurement categories
is provided below. This list is not meant to be exhaustive and is representative of the monitors
that can be verified under this protocol. More complete descriptions of these technologies can be
found in the EPA “Guidance for Using Continuous Monitors in PM2.5 Monitoring Networks.(7)
2.1 Chemical Composition
Chemical composition monitors perform automated and repetitive procedures to
determine some portion of the chemical composition of fine particles in nearly real time. The
classes of particulate compounds for which there are continuous analyzers include carbonaceous
material, both elemental and organic, and ionic species such as nitrate and sulfate.
Analysis of carbon-containing particulate matter can be used to quantify both the
elemental carbon (EC) and organic carbon (OC) ambient concentrations. The thermal
volatilization, or conversion to carbon dioxide (CO2), of these two classes of carbon particulate,
occurs at very different temperatures. Consequently, by heating particulate samples and
monitoring the CO2 generated at different temperatures, the EC and OC concentrations can be
determined. Some carbon analyzing technologies, such as the Series 5400 Automated Carbon
Particulate Monitor (ACPM, Rupprecht & Patashnick, Co., Inc.) include two sample collectors
that can be used alternately for collection and analysis steps, thereby allowing continuous
monitoring.
In addition to total EC and OC concentrations, specific chemical classes of organic
particulate can be measured in situ. One such class of compounds is particulate-bound
5
polycyclic aromatic hydrocarbons (PAHs). Measurement of PAHs is based on ultraviolet
photoionization of the particulate PAH and subsequent measurement of the ionization current
formed by the emitted electrons. Monitors of this type respond to the sum of all PAH
compounds in the particle phase and do not respond to vapor-phase PAH. EcoChem Analytics
provides a commercial version of the PAH monitor in the form of the PAS 2000 instrument.
This monitor also has been used to monitor overall EC levels.
The concentration of ambient “elemental carbon” or “black carbon” particulate can be
measured by light absorption using an aethalometer (Andersen Instruments). In these devices,
light is passed through a filter, or a sample spot on a continuous tape, and detected. Particulate
deposition on this filter results in the attenuation of the light in proportion to the loading of light
absorbing particulate on the filter. Using appropriate conversion factors, the degree of light
attenuation is converted to “black carbon” concentration.
Automated monitors have been developed to measure particulate nitrate or sulfate
concentrations. These monitors use flash volatilization of a filter sample, entrainment of the
evolved oxides in an inert carrier stream, and chemiluminescent or gas-phase fluorescent
detection to determine particulate nitrate or sulfate concentrations, respectively. Examples of
these monitors are the Series 8400N Ambient Particulate Nitrate Monitor (Rupprecht &
Patashnick, Co., Inc.) and the Series 8400S Ambient Particulate Sulfate Monitor (Rupprecht &
Patashnick, Co., Inc.).
2.2 Mass or Surrogate Mass
A variety of particle properties can be related to, and ultimately used to predict, particle
mass. A number of techniques have been developed to probe these physical properties.
The Tapered Element Oscillating Microbalance (TEOM®, Rupprecht & Patashnick, Co.,
Inc.), directly measures particulate matter mass in real time by drawing air through a hollow
tapered element on which an exchangeable filter is mounted. The tapered element is
mechanically oscillated and, as particulate matter deposits on the filter, the frequency at which
the tapered element oscillates changes. This change in the frequency of oscillation has a direct
relationship to the mass of the deposited particulate matter. By “continuously” monitoring (once
6
every two seconds) the oscillation frequency, the TEOM is able to obtain near real-time
measurements of the deposited mass. These measurements can then be used to calculate an
average mass over time periods ranging from 10 minutes to 24 hours. Mass flow controllers are
used to maintain a constant air mass flow rate which, when adjusted for ambient temperature and
pressure, remains within the appropriate specifications for volumetric flow rate. From the data
for both mass and flow, the TEOM calculates an ambient concentration for PM2.5.
Beta attenuation monitors (BAMs) provide an indication of particulate matter mass by
measuring the attenuation of beta radiation through a filter on which particulate matter is
deposited. As the fine particles deposit, fewer of the beta particles penetrate the filter and reach
the detector. By measuring the intensity of beta particle penetration before and after, or during, a
period of air sampling, a measure of the mass deposited on the filter can be obtained. The degree
to which the beta radiation is attenuated is approximately proportional to particle mass based
upon the Beer-Lambert law, but is also dependent upon the chemical composition of the
particulate matter. Commercial versions of beta attenuation monitors are available from
Andersen Instruments, Met One Instruments, and Opsis AB.
The Continuous Ambient Mass Monitor (Andersen Instruments) measures the drop in
pressure across a porous membrane filter to monitor particle mass. As air is drawn through the
filter, particulate matter is deposited on the filter and obstructs the air flow through the filter.
This flow obstruction results in an increasing pressure differential across the filter, which can be
measured and correlated to the mass of the deposited material.
Several techniques involve the use of light scattering to quantify the concentration and
size of ambient particulate matter. Among the more common of the instruments exploiting light
scattering for particulate matter monitoring are nephelometers. In these devices, a fixed volume
of aerosol sample is illuminated by an incident beam of light, and the total intensity over a range
of scattering directions is detected. The scattering intensity can be used to estimate particle
mass concentration.
Some continuous particle sizing instruments can also be used to provide an indication of
particulate mass. Light scattering monitors such as the Aerodynamic Particle Sizer (APS, TSI
Inc.) provide real-time size distributions that can be related to mass concentrations. In the APS,
sampled air is drawn into a flight tube where the transit time of particles through overlapping
7
light beams is measured. Size classification is based on the relationship between this transit time
and the aerodynamic size of the particles being interrogated.
The Electrical Low Pressure Impactor (Dekati, Ltd.) operates on the basis of charging,
inertial classification, and electrical detection of aerosol particles. Sampled air is drawn through
a corona discharge that imparts an electrical charge to the particles. The particles are then
separated based on their aerodynamic size in an inertial impactor. The individual stages of the
impactor are electrically isolated from one another and individually monitored by an electrometer
that monitors the charge collected on each stage. Real-time size distributions are determined
from the current produced on each stage.
3 VERIFICATION APPROACH
3.1 Scope of Testing
The objective of the verification test derived from this generic protocol is to provide
quantitative performance data on fine particle monitors under realistic operating conditions. To
meet this objective, testing shall occur in two phases, at established sites with ongoing particulate
matter monitoring programs conducted with appropriate quality assurance/quality control
(QA/QC) efforts. The field sites shall be located in two geographically distinct regions of the
United States to allow exposure to different particulate matter concentration levels and chemical
composition. At each site, the technologies shall undergo intensive testing for a period of at least
one month focusing on the season in which local PM2.5 levels are likely to be highest.
Performance verification shall be based, in part, on comparisons to the established
reference methods(c) already in place as part of the monitoring programs at the field sites or
provided by Battelle specifically for this test. Collocation of the technologies being verified with
systems for time-integrated monitoring of fine particulate mass and chemical speciation shall
provide the basis for assessing the degree of agreement and/or correlation between the
Throughout this document the term “reference method” will refer to methods that are used as a basis of comparison for the purposes of technology verification. These reference methods may be, but are not necessarily, FRMs or FEMs.
8
c
x
continuous and time-integrated methods. Other parameters to be assessed during the verification
test include the effects of meteorological conditions and the influence of interfering gases on
technology performance. Consequently, each test site shall be equipped with continuous
monitors to record meteorological conditions and the concentration of key precursor gases (O3,
NO , SO2, etc.). Additionally, other performance characteristics of the technologies being
verified, such as reliability, maintenance requirements, and ease of operation shall be assessed by
field operators and reported. Instrumental features that may be of interest to potential users (e.g.,
power and shelter requirements, data output, and overall cost) shall also be reported.
Although aerosols of known composition and size distribution can be created in a
laboratory, such aerosols are limited in their representativeness of actual ambient fine particulate
matter. It is beyond the scope of the verification test to generate aerosols in the laboratory that
are representative of the wide range of aerosol composition typically found in ambient air. This
verification test shall be limited to comparisons of data collected in the field under realistic
operating conditions. Consequently no laboratory evaluations shall be performed as part of this
test.
3.2 Site Selection
Two one-month tests at two distinct geographical regions during different seasons shall
be conducted. The testing sites shall be selected based on a number of criteria, including some
common characteristics between the sites, as well as some key differences. Common to these
sites shall be
• A wide variety of ongoing ambient monitoring activities, including appropriate reference methods
• Sufficient space and facilities for verification testing of participating technologies
• Trained site personnel or subcontractors
• Appropriate site security
• Established QA/QC protocols and procedures.
9
The key difference between the selected sites should be that they are in distinctly different
regions of the country, which results in exposure to different climates and meteorological
conditions, as well as different levels and chemical composition of particulate matter. These
factors, along with the willingness of the site management to collaborate with this verification
test, should be among the primary considerations for the selection of sites.
It is recognized that verifying these monitors at only two sites for one season each
represents only a small portion of the potential conditions under which these monitors are likely
to be used. Consequently, the verification reports that result from such tests will clearly indicate
the conditions of the verification test and will not make generalizations about the performance of
these monitors under different conditions. It is beyond the scope of the verification tests to
evaluate the performance of monitors under all conditions in which they are likely to be used.
Instead, two test sites will provide a demonstration of instrumental performance under a set
(albeit limited) of realistic operational conditions.
3.3 Experimental Design
The design of a fine particle monitor verification test shall be similar to that of the PM
instrument intercomparison study performed for CARB.(8) In that study, a variety of continuous
and manual methods were intercompared to assess operational relationships among the different
methods. Verification tests will be similar to that study in that similar comparisons will be made
between the continuous and manual methods. Verification tests will be different in that they will
expand on some of the comparisons and will be performed at two different sites and in different
seasons. However, in contrast to the CARB study, no intercomparison of the monitors being
verified will be made in this verification test.
Verification tests involve collocating duplicate commercial monitors at test sites that have
established reference methods already in place, including both FRM and speciation samplers.
Duplicate monitors are placed in close proximity to each other (<5 meters) and to reference
samplers (<10 meters) to eliminate spatial variability as a source of error in statistical
comparisons. Comparisons between the continuous monitors and the reference methods are
made to assess the comparability of the monitors being tested and the reference methods, or the
10

capabilities of the continuous monitors in predicting the results from the reference methods.
Comparisons of the results from duplicate monitors are used to assess intra-method precision for
each type of monitor. Continuous measurements of meteorological conditions and the
concentrations of precursor gases are used to support these assessments. In this way, the
accuracy and variability of the continuous monitors are assessed under various conditions after
adjusting for the influence of those conditions. Additional observations are made by on-site
operators and documented to describe the general operational characteristics of the monitors,
including general performance, reliability, maintenance, and ease of use.
The primary comparison for each monitor is with daily 24-hour, time-integrated samples
collected by the respective reference methods (see Section 3.4). As a result, the primary
comparison includes approximately 30 samples from each month-long phase. The actual number
of data points available for use in these comparisons may be somewhat smaller than 30. In
addition to the 24-hour samples used for the primary comparisons, a number of shorter term
samples (3, 5, 8-hour) are collected and used for supplemental comparisons. The data sets
available for the supplemental comparisons may be larger based on the frequency of data
collection (up to 5 samples per day). Continuous meteorological and precursor gas concentration
data also are used to support the primary comparisons. The variability in ambient air parameter
levels over the course of a month of data collection is expected to be much larger than the size of
the error in measurement, allowing for accurate estimation of the relationship between the
reference methods and the monitors tested.
In some cases, the monitors to be verified may be already in use at one or both of the
sites. If so, the vendor of a monitor already on-site will provide a single additional monitor for
verification. The test for that type of monitor will thus include a monitor that has been operating
in the field and one newly installed in the field. In these cases, the history of these monitors may
provide useful information about performance issues, and records of performance (including
monitoring results and maintenance activities) at the site may be used to support the observations
made during the intensive portion of the verification test. When available, monitoring results
from these continuous monitors and the reference methods may provide an indication of the
performance of these monitors during multiple seasons at a given site, and maintenance records
may provide an indication of the long-term reliability of these monitors.
11
When possible, the same monitors are to be verified in the two phases of this test.
However, when a monitor being tested is part of the site monitoring equipment, a different
monitor will necessarily be tested at the other site. The additional monitor provided by the
vendor will be used at both sites. In all cases, the verification report will clearly indicate which
monitors (by serial number) were tested at the respective sites. Furthermore, as a result of the
time difference between the two phases of the verification test, there is a potential that design
modifications may be made to one or more of the monitors being tested. If changes of this type
are made, the updated version may be used in the second phase. Again, the verification report
will clearly indicate what design changes were made. As the statistical analyses will be
performed separately for the individual monitors at each site, the potential use of different
monitors at different sites will not affect the validity of statistical comparisons made in the
verification process. Records indicating which monitors were verified in each phase may be used
to explain potential differences in verification results between monitors at a site.
3.4 Reference Methods and Supplemental Measurements
Verification of the performance of continuous ambient fine particle monitors shall be
based in part on comparisons to appropriate reference methods or procedures. Since no
appropriate absolute standards for fine particulate matter exist, the reference methods for the
verification tests were selected to provide comparisons of the results from the continuous
monitors to those of currently accepted methods for the determination of particulate matter mass
or chemical concentration. It is recognized that comparisons of real-time measurements to time
averaged measurements may not fully explore the capabilities of the real-time monitors.
However, in the absence of accepted standards for real-time fine particulate matter measure
ments, the use of time-averaged standard methods that are currently widely accepted is
necessary. The limitations associated with the use of these methods (including measurement
uncertainties) will be discussed in the verification reports. A summary of each reference method
to be used during the verification tests is given below.
12
3.4.1 PM2.5 Mass
Comparisons to PM2.5 mass shall be made relative to the FRM for PM2.5 mass
determination, i.e., the 24-hour time-averaged procedure detailed in 40 CFR Part 50.(2) This
method involves manual sampling using any of a number of designated commercially available
filter samplers, followed by gravimetric analysis of the collected sample. In this method, a size
selective inlet is used to sample only that fraction of aerosol of interest (i.e., <2.5 µm diameter).
The air sample is drawn into the sampler at a fixed rate, and the aerosol is collected on an
appropriate filter for gravimetric analysis. After equilibration of the sample and filter in a
temperature- and humidity-controlled environment, the sample is weighed on an appropriate
microbalance. The particulate sample weight is determined by subtracting the weight of the filter
alone, determined prior to sampling after similar equilibration. Protocols for sample collection,
handling, and analysis are described by EPA and will be followed for this verification test.
FRM samples shall be collected daily during each phase of the testing using a BGI
PQ200 (RFPS-0498-116) or comparable sampler, and PM2.5 shall be determined according to the
FRM procedures mentioned above. Results from other single filter or sequential FRM samplers
may be used after the comparability of these other samplers and the BGI sampler is established
(see Section 3.5.2 and Section 7.3). Time periods shorter than the FRM-prescribed 24-hour
sampling also shall be used in some cases to assess the short-term capabilities of the continuous
monitoring technologies. This short-term PM2.5 sampling will augment, rather than replace, the
24-hour FRM sampling.
3.4.2 Speciation
The reference methods to be used for chemical speciation of ambient PM2.5 are described
in the EPA guidance document “Guideline on Speciated Particulate Monitoring,”(9) with the
exception of the method for particle-bound PAH analysis. As with the gravimetric mass
determination, these reference methods involve time-integrated sample collection and subsequent
laboratory analysis, although the collection media and the methods of analysis vary for the
different species.
13
In general, the speciation samplers have individual trains for determining specific
components of the ambient aerosol. The aerosol is drawn into the sampler through a size
selective inlet and divided into separate streams for collection and subsequent chemical-specific
analysis. Alternatively, separate size-selective inlets may be used for each stream. After
sampling, the collected fractions are sent for preparation and laboratory analysis. At each field
site, one or more approved speciation samplers shall be employed as part of the studies
performed at those sites. Collected samples from those speciation samplers may be analyzed by
contract laboratories selected by Battelle, and the results of those analyses will be used for the
data comparisons. Particulate nitrate, particulate sulfate, and elemental/organic carbon are the
chemical species for which samples from the speciation samplers will be analyzed. At each site,
particulate nitrate and particulate sulfate fractions may be collected on nylon filters downstream
from a MgO denuder used to remove gaseous nitric acid. These fractions will subsequently be
analyzed by ion chromatography as suggested in the EPA’s “Guideline on Speciated Particulate
Monitoring.”(9) EC/OC fractions will be collected on quartz fiber filters and analyzed by both the
IMPROVE thermal optical reflectance and the NIOSH 5040 thermal optical transmission
techniques.
For particle-bound PAH measurements, sample collection and analysis procedures based
on ASTM Method D 6209-98(10) shall be used. Battelle shall supply filter/XAD resin sampling
trains and appropriate denuders to determine the particle-phase PAH species. After removal of
the vapor phase material in the denuder, the total particle-phase PAH is collected on a quartz
fiber filter followed by an XAD-2 resin bed. Particulate matter collected on the combined
filter/XAD trains is analyzed for PAH content by solvent extraction and subsequent gas
chromatography/mass spectrometry (GC/MS) procedures. Particulate matter samples for PAH
determination shall be collected daily over 24-hour periods at each test site and used to verify the
performance of the commercial particulate PAH monitor.
3.4.3 Supplemental Measurements
Various supplemental measurements shall be recorded and used to further establish the
performance of the continuous monitors being tested. Meteorological conditions shall be
14
monitored and recorded continuously throughout each phase of the verification test. These
measurements include at least temperature, relative humidity, wind speed, and direction.
Likewise, the ambient concentrations of various precursor gases including ozone and NOx also
shall be measured continuously during the verification test to assess the influence of these
parameters on the performance of the monitors being tested.
To supplement the 24-hour samples, additional samples may be collected over shorter
sampling periods (i.e., 3, 5, 8-hour) to help assess the capabilities of the monitors being tested in
indicating short-term PM levels. These short-term samples shall be collected and analyzed for
PM2.5 mass, nitrate, sulfate, and carbon fractions. Before use in evaluating the performance of
the continuous monitors, these short-term sampling measurements will be compared with the
corresponding 24-hour results of the reference methods. These comparisons will be used to
establish the relationship between the two sets of measurements.
3.5 Data Comparisons
3.5.1 Quantitative Comparisons
Table 1 provides a summary of typical primary and supplemental comparisons to be
made in evaluating technology performance. These comparisons are intended to evaluate the
continuous monitors being verified by comparison to the reference method that most closely
matches the quantity measured by the technology. The primary comparisons shall be made with
the reference methods described above. Additional comparisons shall be made with the
supplemental measurements to assess (1) the effects of meteorological conditions and precursor
gas concentrations on the response of the monitors being tested and (2) the capabilities of these
monitors to indicate short-term levels of ambient PM. The comparisons shall be based on
statistical calculations as described in Section 7.3.
Comparisons shall be made independently for the data from each site; and, with the
exception of the intra-method precision calculations, the results from the duplicate monitors will
be analyzed and reported separately. Intra-method precision shall be determined from a
statistical intercomparison of the results from the duplicate monitors.
15
Table 1. Summary of Data Comparisons to be Made in Verification of Continuous Monitors
Parameter Measured Primary Data Supplemental Data
Mass Daily 24-hour FRM samples
3-, 5-, or 8-hour PM2.5 mass samples; continuous meteorological data
Light scattering intensity
Daily 24-hour FRM samples
3-, 5-, or 8-hour PM2.5 mass samples; continuous meteorological data
Black Carbon Daily 24-hour EC/OC samples
3-, 5-, or 8-hour EC/OC samples; continuous meteorological data
EC/OC Daily 24-hour EC/OC samples
3-, 5-, or 8-hour EC/OC samples; continuous meteorological data
NO3 - Daily 24-hour NO3
-
samples
3-, 5-, or 8-hour NO3 - samples; continuous NOx,
O3 measurements; continuous meteorological data
PAH and EC Daily 24-hour PAH and EC samples
3-, 5-, or 8-hour EC samples; continuous meteorological data
SO4 2- Daily 24-hour SO4
2
samples
3-, 5-, or 8-hour SO4 2- samples; continuous SO2,
O3 measurements; continuous meteorological data
3.5.2 Qualitative Comparisons
There is evidence that some continuous monitors may be considered comparable with the
FRM. For example, a recent study commissioned by the California Air Resources Board to
intercompare a variety of PM measuring equipment has shown high a degree of comparability
(slope = 0.91, intercept = 0.80 µg/m3, R2 = 0.989) between the PM2.5 FRM and a beta attenuation
monitor with a well-impactor ninety-six PM2.5 inlet (BAM-WINS).(8) Therefore, in addition to
the comparisons outlined in Table 1, additional comparisons may be made with other available
methods if appropriate methods are in place at the test site and can be shown to be adequately
comparable to the PM2.5 FRM. Although less stringent than the criteria for FEM equivalence, the
criteria used in this test for a continuous monitor to be considered adequately comparable with
the FRM are based on those presented in the EPA guidance document for the use of continuous
16
monitors.(7) These criteria require that the results of the continuous monitor be compared with
the reference method and analyzed by linear regression. The results of that statistical analysis
must have a slope within three standard deviations of unity, an intercept within three standard
deviations of zero, and a squared correlation coefficient of greater than 0.9 for that monitor to be
accepted as a comparable method. The degree to which each monitor being verified meets these
comparability criteria shall be assessed.
If a monitor being verified meets these criteria, it may be used for comparison with other
monitors being verified. If an additional method in use at a test site shows comparability with
the FRM, it may be used as a secondary means of comparison for illustration of the temporal
response of the monitors being tested. The use of these data will be limited to qualitative
comparisons, and no quantitative conclusions about the performance of the monitors tested shall
be made. However, the temporal features that appear in real-time measurements of PM2.5 mass
(for example) may correlate with features in the PM mass or composition measurements of the
other continuous monitors being verified. Comparisons of this type that can be used to show
temporal features will illustrate the utility of the tested methods.
3.6 Roles and Responsibilities
Verification tests shall be performed by Battelle with the participation of EPA, the
vendors who will be having their monitors verified, and the test sites. The chart in Figure 1
shows the organization of responsibilities for Battelle, the vendor companies, EPA, and the test
sites. Specific responsibilities are detailed below.
17
Figure 1. Organization Chart for Ambient Fine Particle Monitor Verification Test
18

3.6.1 Battelle
The Verification Test Coordinator will have the overall responsibility for ensuring that the
technical, scheduling, and cost goals established for the verification test are met. The Verification
Test Coordinator shall
• Prepare a draft test/QA plan, verification reports, and verification statements
• Revise the draft test/QA plan, verification reports, and verification statements in response to the reviewers’ comments
• Coordinate distribution of the final test/QA plan, verification reports, and verification statements
• Coordinate testing parameters and test schedule with management and technical staff at each testing site
• Arrange for necessary Battelle materials to be available at the test sites when needed
• Ensure that all quality procedures specified in the test/QA plan and in the QMP are followed
• Respond to any issues raised in assessment reports and audits, including instituting corrective action as necessary
• Serve as the primary point of contact for vendor and site representatives
• Establish a budget for the verification test and monitor staff effort to ensure that the budget is not exceeded
• Ensure that confidentiality of vendor information is maintained.
The Verification Testing Leader for the AMS Center shall provide technical guidance and
oversee the various stages of verification testing and shall
• Support the Verification Test Coordinator in preparing the test/QA plan and organizing the testing
• Review the draft test/QA plan
19
• Review the draft verification reports and statements
• Ensure that confidentiality of vendor information is maintained.
Battelle’s AMS Center Manager shall
• Review the draft test/QA plan
• Review the draft verification reports and statements
• Ensure that necessary Battelle resources, including staff and facilities, are committed to the verification test
• Ensure that vendor confidentiality is maintained
• Support the Verification Test Coordinator in responding to any issues raised in assessment reports and audits
• Maintain communication with EPA’s AMS Center and ETV Quality Manager.
Battelle shall provide test personnel who assist as necessary during the verification test.
The test personnel shall
• Assist in setting up and removing the monitors and testing equipment as needed
• Train on-site operators in operating procedures for Battelle-supplied equipment
• Ensure that confidentiality of vendor information is maintained.
20
Battelle shall provide a Staff Statistician who supports statistical and data analysis
activities for this verification test. Specifically the Staff Statistician shall
• Assist in converting verification data from electronic spreadsheet format to appropriate file format for statistical evaluation
• Support the Verification Test Coordinator in performing statistical calculations specified in the test/QA plan on the verification data
• Provide results of statistical calculations and associated discussion for the verification reports
• Support the Verification Test Coordinator in responding to any issues raised in assessment reports and audits related to statistics and data reduction.
Battelle’s Quality Manager for this verification test shall
• Review the draft test/QA plan
• Conduct a technical systems audit (TSA) once during each phase of the verification test
• Review results of performance evaluation audits specified in this test/QA plan
• Audit at least 10% of the verification data
• Prepare and distribute an assessment report for each audit
• Verify implementation of any necessary corrective action
• Issue a stop work order if self-audits indicate that data quality is being compromised; notify Battelle AMS Center Manager if stop work order is issued
• Provide a summary of the QA/QC activities and results for the verification reports
• Review the draft verification reports and statements
• Have overall responsibility for ensuring that the test/QA plan and QMP are followed
21
• Ensure that Battelle management is informed if persistent quality problems are not corrected
• Interface with EPA’s ETV Quality Manager.
3.6.2 Vendors
Vendor representatives shall
• Review the draft test/QA plan and provide comments and recommendations
• Approve the revised test/QA plan
• Provide Battelle with detailed description of installation requirements prior to testing to ensure that adequate facilities are available
• Provide duplicate commercial-ready monitors for testing
• Install the monitors to be verified at each site and ensure proper operation before testing (vendors shall have access to the test sites at least one week in advance of testing during each phase)
• Provide a detailed checklist to on-site operators of items that should be checked to verify proper operation of monitors
• Provide an on-site operator or on-site technical support as needed
• Review and comment upon their respective draft verification reports and statements.
3.6.3 EPA
EPA’s responsibilities in the AMS Center are based on the requirements stated in the
“Environmental Technology Verification Program Quality and Management Plan for the Pilot
Period (1995-2000)” (QMP)(11) or the most current update of this document. The roles of the
specific EPA staff are as follows:
22

EPA’s ETV Quality Manager shall
• Review the draft test/QA plan
• Perform, at his/her option, one external TSA during the verification test
• Notify the AMS Center Manager to facilitate a stop work order if an external audit indicates that data quality is being compromised
• Prepare and distribute an assessment report summarizing results of an external audit, if performed
• Review draft verification reports and statements.
EPA’s AMS Center Manager shall
• Review the draft test/QA plan
• Approve the final test/QA plan
• Approve the final verification reports
• Review the draft verification statements.
3.6.4 Test Sites
The responsibilities of the test sites are to
• Assist in developing the test/QA plan for the verification test
• Allow facility access to vendor, Battelle, and EPA representatives during the scheduled verification testing including set-up and tear-down operations
• Provide adequate working space at the test site for the duration of verification testing
• Provide sufficient power for the simultaneous operation of all test equipment and technologies being verified
23

• Provide access to data from equipment collocated at the test site, including available reference methods, continuous gas monitors, and meteorological monitors
• Assist Battelle in arranging for augmented sampling schedules or additional sample analysis
• Cooperate with Battelle’s documentation of the test site’s QA/QC procedures
• Review portions of the verification report to assure accurate descriptions of the test site operations and to provide technical insight on verification results
• Provide safety instructions to test and QA personnel for operations at the test site.
3.6.5 On-Site Operators
Battelle shall hire on-site operators to assist, as necessary, in activities associated with
verification tests that are not already performed by the test sites. The responsibilities of these on
site operators are to
• Observe the operation of the monitors being test and complete checklists for each monitor, as well as make general observations about the performance and maintenance of the monitors being tested
• Perform sampling activities according to the test/QA plan, to document procedures, and as instructed by the Verification Test Coordinator
• Arrange for and ship samples to the respective contract analytical laboratories
• As necessary, inform respective vendors and Battelle of problems associated with the monitors being tested
• Ensure that confidentiality of vendor information is maintained.
24
3.6.6 Contract Analytical Laboratories
Verification tests rely on the results of various analytical measurements. Battelle shall
secure the services of contract analytical laboratories to conduct these measurements. The
responsibilities of these laboratories are to
• Conduct quality-assured analytical measurements of collected samples
• Provide Battelle with results of analytical measurements in mutually agreed upon format
• Provide Battelle and EPA, as necessary, with appropriate QA records and documents, including standard operating procedures, calibration records, training records, etc.
• As necessary, allow an external TSA of laboratory facility, personnel, and procedures by Battelle and/or EPA staff.
4 TEST PROCEDURES
4.1 Field Testing
Field testing shall be conducted in two phases. At each site, data from the monitors being
tested, the meteorological monitors, and the precursor gas monitors shall be collected
continuously over the course of the verification test. Samples are collected by the reference
methods (i.e., FRM, speciation, and PAH samplers) according to the schedules in place at the
sampling sites. In all cases, the monitoring and sampling equipment are operated according to the
recommendations provided in the respective operator’s manual or standard operating procedures
for the samplers, and within the procedures and protocols set forth in this protocol, the test/QA
plan, or the quality assurance plans in place at the respective sites and the analytical laboratories.
If the monitors being verified are already in operation at the field sites, the vendors shall
perform appropriate calibration and maintenance on the monitors before testing begins. For those
that are not, the vendor shall install and ensure the proper calibration and operation of the
monitors to be verified at each site. Routine operation during the verification test shall be
25

observed by on-site operators after appropriate training by vendor staff. Instrument status will be
documented by the on-site operators by completing checklists provided by the respective vendors.
In the case of instrument failure, the vendor shall be notified by the on-site operators and allowed
to perform on-site repair if necessary. Since testing at each site will be conducted over a limited
time period, it is expected that the vendor will arrange for adequate time for installation and
training at each site before testing begins. Testing will not be delayed if installation of the
monitors is not complete, and will not be extended to make up for downtime if a monitor being
verified fails during the test.
At each site, on-site operators shall be asked to make observations about the operational
performance, maintenance, ease of use and reliability of each technology, as well as provide
additional insight concerning general technology performance, and sampling conditions on the
respective checklists provided by the vendors. If existing records pertaining to the past
performance of one or more of the monitors are available, they may be used in the respective
verification report to support discussions of operational performance. Information concerning
maintenance and daily operation of these monitors, including data output requirements, will be
recorded by site operators and summarized in the verification reports.
4.2 PAH Sampling
Particulate PAH data shall be obtained to verify commercial PAH monitors by means of a
denuder/filter/sorbent train that separates vapor- and particle-phase PAHs. The method used for
PAH determination is based on ASTM Method D 6209-98.(10) The principle of this method is
that, as sample air is drawn through the train, vapor-phase PAHs diffuse rapidly to the walls of an
annular denuder tube and are captured. Particles pass through the denuder in the sample air
stream because of their much slower rate of diffusion and are collected on a quartz fiber filter
backed up by a sorbent trap. The sorbent trap serves to collect any PAH that volatilizes from the
filter after particle collection. The particle-phase PAH concentration is determined by extracting
and analyzing the filter/sorbent combination together. In addition, if needed, the denuder can be
extracted for determining the vapor-phase PAHs.
26
The procedures for the daily operation of the PAH sampler are summarized below,
including the origin, handling, shipping, and installation of the denuders; handling and installation
of the sample filters; field sampling; and laboratory analysis.
4.2.1 Denuders
The denuders to be used for the verification test are based on those developed by Gundel
and co-workers,(12) and consist of a glass annular denuder with a sandblasted inner surface coated
with finely ground XAD-4 resin. The resin particles collect vapor-phase PAH from the air
stream, but are resistant to removal from the glass surface during air sampling, solvent extraction,
and handling of the denuder. The primary purpose of the denuder is to provide an air stream free
of vapor-phase PAH, so that particle-phase PAH may be collected without artifact from the vapor
phase. However, the denuders can also be extracted with solvent for determining the collected
vapor-phase PAH.
The denuders used in the verification test may be commercial units such as those by URG
Inc. and coated by Restek Corporation. The denuders to be used shall be appropriate for use with
the sampler being used to collect the PAH samples. Preliminary chamber and field studies shall
be performed to characterize the performance of the denuders before the verification test.
4.2.2 Other Sampling Components
Cleaned quartz fiber filters and XAD-2 resin traps shall be prepared by Battelle.
Commercial quartz fiber filters shall be cleaned by heating in a muffle furnace in high-purity air
and shall be stored wrapped in similarly muffled aluminum foil. XAD-2 resin is cleaned by
Soxhlet extraction with multiple solvents and stored in sealed, pre-cleaned glass sampling
cartridges. At least one sampling assembly from each batch is analyzed as a laboratory blank. A
blank is considered acceptable if the mass of each individual PAH species does not exceed 10 ng,
and if the blank PAH concentration is less than 10% of the expected ambient concentration (based
on historical averages if available).
27
4.2.3 Shipment of Sampling Components
Sets of denuders, filters, and XAD-2 traps should be shipped to the test site at weekly to
twice-weekly intervals in protective shipping containers by overnight delivery service. These
materials are stored at room temperature and kept sealed until the time of use. After sample
collection, the sampling components are resealed in their original containers and kept refrigerated
(below 4�C) until enough samples are collected for a return shipment to Battelle. Refrigerated
samples are then returned to Battelle in the same containers used for shipment to the site. Field
blank sampling materials undergo the same handling and shipment procedures as actual samples.
Temperature records of the shipped samples accompany the samples.
4.2.4 PAH Sampling
Sampling for particle-phase PAH takes place at the test sites on each day of both test
phases. At least 10% of the PAH samples collected and analyzed are field blanks. Field blanks
are collected by inserting the filter/sorbent assembly into the sampler and removing the assembly
without sampling.
The air flow rate of the PAH sampler is checked as part of the field performance audit
schedule at each site as a quality control procedure. The procedures for sampler operation and for
flow rate checks are provided by the manufacturer in the operator’s manual.
4.2.5 PAH Analysis
Upon return to Battelle, quartz fiber filters and their corresponding XAD-2 resin traps are
extracted in methylene chloride using Soxhlet apparatus, and the extracts are concentrated to less
than 1 ml volume. Analysis is by GC/MS using the electron impact mode of ionization. All
samples and blanks are spiked prior to extraction with perdeuterated PAH as internal standards in
the analysis. The particle-phase PAH data obtained from the filter/XAD combinations are the
primary basis for comparison with the continuous PAH monitor.
28

Performance verification of the continuous PAH monitor shall be based on the response of
the monitor to only those particle-bound PAH species that are expected to be ionized by the light
source employed in the monitor (i.e., those for which the ionization potential is below the photon
energy).
5 MATERIALS AND EQUIPMENT
In general, verification tests rely on the materials and equipment in use as part of routine
monitoring efforts at each of the two field sites. The equipment in use as part of those studies is
operated and maintained by the personnel at the respective sites. In addition to the on-site
equipment operated by the test site, Battelle shall provide the following equipment as needed.
5.1 FRM Sampler
A single-filter BGI PQ200 FRM sampler shall be provided, as needed, at the test sites for
use during the verification test. Filter transport cases and extra filter cassettes shall be provided,
as will a BGI DataTrans module for retrieval of stored sampling information.
5.2 Speciation Sampler
An Andersen RAAS2.5-400 Chemical Speciation sampler, or similar sampler, shall be
provided, as needed, to the test sites for use during the verification test. Filter transport cases and
extra filter cassettes also shall be provided.
29
5.3 PAH Sampler
The sampler to be used for the PAH sampling shall be provided by Battelle for each phase
of the verification test. The sampler shall be equipped with the following components for
separating and collecting particle-phase PAH:
• Commercial annular denuder coated with XAD-4 resin
• Quartz fiber filter
• Glass backup trap containing XAD-2 resin.
These components shall be prepared and shipped to the respective sites by Battelle weekly to
twice weekly during the individual verification test phases. After sample collection, these
assemblies shall be properly stored and shipped back to Battelle by site staff for analysis.
The other components of the sampler include the inlet, vacuum system, and pump. These
components shall be shipped to the respective site before each phase of testing for installation on
the sampling platform. These components shall be provided as either a stand-alone unit or as a
train in a commercial speciation sampler (e.g., Andersen RAAS2.5-400).
5.4 Sampling Media
All materials necessary for sampling specifically associated with the verification test,
including filters, denuders, and sorbent traps, shall be supplied by Battelle. Arrangements for
delivery dates and locations shall be made with the respective test site management or on-site
operators by the Verification Test Coordinator.
6 QUALITY ASSURANCE/QUALITY CONTROL
The verification effort relies in part on the QA/QC programs in place at the host sites.
That is, the QA/QC procedures for the studies ongoing at each site will be adopted as part of the
30
verification test. These procedures should cover daily operation of the site equipment, calibration,
sample collection and handling, laboratory analysis, and data collection and handling, as well as
scheduled auditing. These procedures shall be followed by site staff throughout the duration of
testing. Adherence to the data quality procedures that relate to the test will be assessed by
Battelle QA personnel through review of procedures during the field verification periods.
Additional QA/QC procedures specific to this verification test are described below.
6.1 Sample Collection/Transfer
Samples collected using Battelle-supplied equipment shall be collected by the on-site
operators daily during each phase of the test according to the procedures described in this
protocol. After receipt by the on-site operators, filters and other necessary materials (i.e.,
denuders, polyurethane foam cartridges) used to collect samples, as well as field blanks, will be
kept in a clean, temperature- and humidity-controlled environment until transported to the test site
for sampling. If kept off-site, these sampling materials shall be transported to the site by the on
site operators to avoid contamination. Filters and other sampling materials receive unique codes
for identification according to the procedures of the on-site operators or contract analytical
laboratory, depending on which party prepares the materials for sampling. Each sample is
accompanied by a chain-of-custody form during each step of its transport. Information on these
forms is completed by the sample sender and recipient as needed. Sample run data forms
documenting the sampling parameters are completed by the on-site operators for each sample.
On-site operators shall forward these sample run data forms to the Verification Test Coordinator
for approval within one week of the sampling date. The contract analytical laboratory shall
forward the chain-of-custody forms to the Verification Test Coordinator for approval within one
week of completing the sample analysis. Approval of these records shall be indicated by the
signature of the Verification Test Coordinator on each form. Example forms are shown in
Appendix A.
31
6.2 Data Collection/Transfer
Data from the time-integrated and continuous monitors operated at each site, and the
results of laboratory analyses, are recorded according to the site test plans and operating
procedures. These data are transferred to Battelle after validation procedures are performed. The
data received by Battelle from each site will be maintained by Battelle’s Verification Test
Coordinator, and information regarding specific technologies being tested shall be kept
confidential while under the control of Battelle.
Data generated by Battelle or on behalf of Battelle for the verification test, that are not
already covered by procedures at the test site, are recorded either electronically, on data sheets, or
in laboratory notebooks. These data include those associated with particulate PAH measurements
and include observations on the operation of the monitors being tested, weather observations, and
other information. These data are compiled in electronic format and, excluding confidential
information about the specific technologies being verified, are made available to each site upon
request.
6.3 Field QA/QC Activities
A variety of QA/QC activities shall be performed by the on-site operators at the test sites
to ensure that the samplers provided by Battelle are operating properly. These activities include
flow rate checks and internal and external leak checks, as well as checks of the temperature and
pressure sensors in the samplers. QA/QC activities associated with the reference methods
supplied by the test sites are conducted according to the procedures in place at the respective sites,
and the results are provided to Battelle. For the reference methods supplied by Battelle, the
QA/QC activities to be performed are based on those described in the manuals for the respective
samplers and are summarized below.
32
6.3.1 Flow Rate Check
The flow rate of the reference samplers provided by Battelle is verified through single
point checks to ensure the proper operation of the samplers. These flow rate checks are conducted
based on the procedures described in the respective manuals and are conducted at least once
within one week of the beginning and once within one week of the end of each phase of the
verification test. The flow rates are checked using a calibrated flow meter to verify that the
sampler is operated at a flow rate within ±5% of the nominal operating flow rate of the sampler.
Also, if the sampler includes an internal flow meter, agreement between the audit flow meter and
the sampler flow meter must be within ±4%. If ±5% agreement between the sampler flow rate
and the nominal operating flow rate is not achieved, the sampler flow rate is manually adjusted to
meet this performance criterion. If agreement between the sampler and audit flow meters does not
meet the ±4% acceptance criterion, recalibration of the sampler flow meter is performed
according to the procedures in the operator’s manual.
6.3.2 Leak Checks
Internal and external leak checks of the reference samplers provided by Battelle shall be
performed to ensure the integrity of the sampling system. These leak checks are performed based
on the procedures described in the respective sampler manuals and are conducted at least weekly
during each phase of the verification test. Leak checks of the FRM sampler are conducted after
each cleaning of the WINS impactor in the FRM sampler. The WINS impactor shall be cleaned at
least once every five sampling days. Acceptance criteria and corrective actions for these activities
are described in the respective manuals for the reference samplers.
6.3.3 Temperature and Pressure Checks
Single point calibration checks of the temperature and pressure sensors in the reference
samplers provided by Battelle shall be conducted based on the procedures described in the
respective manuals. These checks are performed at least twice during each phase of the
33
verification test, once within one week of the beginning and once within one week of the end of
each phase. Acceptance criteria and corrective actions for these activities are described in the
respective manuals for the reference samplers.
6.3.4 Field Blanks
Field blanks shall be collected and analyzed for all the reference methods supplied by
Battelle to assess the contamination levels associated with activities other than sampling. The
field blanks are collected by placing the sampling media in the sampler and removing without
sampling. At least 10% of the collected samples shall be field blanks. The acceptance criteria
and corrective actions for the field blanks are established based on procedures in place at the
respective contract analytical laboratories (based on historical averages if available).
At least one field blank for the PAH sampler will be collected within the first three days of
sampling, and again within the last week of sampling of each test phase, with at least one
additional blank collected during each phase. Blank levels for the PAH sampler are acceptable if
the mass of each individual PAH species, excluding naphthalene, does not exceed 20 ng on the
filter/sorbent assembly, and if the blank PAH concentration is less than 10% of the average
ambient concentration. For naphthalene, the acceptance level for the blank sample is 200 ng. If
this acceptance criterion is not met, the source of the contamination is investigated, and the
sample is flagged as of questionable validity.
6.3.5 Collocated Samplers
The precision of the reference methods provided by Battelle shall be established by
collocating each reference sampler with an identical or a similar sampler. The collocated
samplers are placed within four meters of each other and collect at least five 24-hour samples to
establish precision. This collocated sampling shall be completed at the verification test site,
before the start of the verification test sampling.
34
For the FRM reference method, agreement between the duplicate samples must be within
10% to be considered acceptable. If this agreement criterion is not met, the source of the
discrepancy is investigated, additional samples are collected, and the analyses are repeated.
For the chemical speciation (nitrate, sulfate, carbon, and PAH) reference methods, the
duplicate samples are analyzed concurrently, and agreement between the observed concentration
of each analyte must be within ±35% to be acceptable. If this agreement criterion is not met, the
source of the discrepancy is investigated; and, if possible, additional samples are collected, and
the analyses are repeated.
6.4 Laboratory QA/QC Activities
QA/QC practices performed by the laboratories used to conduct all the chemical and
gravimetric analyses for this verification test, except for the PAH analysis, should be described in
their respective standard operation procedures or laboratory quality manuals. These activities
include instrument calibration and verification, as well as analysis of laboratory and lot blanks.
The acceptance criteria and corrective actions for these activities are described in the respective
procedures.
Battelle shall conduct the PAH analysis according to procedures based on ASTM Method
D-6209-98.(10) QA/QC activities for these analyses include analysis of laboratory blanks,
analytical duplicates, and analytical spikes as described below.
6.4.1 Laboratory Blanks
At least one sorbent/filter assembly from each batch of prepared assemblies shall be
analyzed as a laboratory blank. These blanks undergo the same preparation and handling
procedures as those traps that are shipped to the test sites for sampling, but will not be shipped or
exposed to sampling. The laboratory blanks shall be analyzed at the same time as the PAH
samples. Acceptance criteria and corrective actions for these laboratory blanks are the same as
those for the PAH field blanks.
35
6.4.2 Analytical Duplicates
For the PAH analyses, an analytical duplicate of one sample shall be run for each batch of
samples analyzed to assess the precision of the analytical method. Agreement between the results
from the duplicate analyses must be within 15% to be acceptable. If this agreement criterion is
not met, the source of the discrepancy shall be investigated and the analyses repeated, if possible.
6.4.3 Analytical Spikes
Analytical spikes shall be used to assess the accuracy of the PAH analytical method. Each
sample is spiked prior to extraction with 100 ng each of pyrene-d10 and chrysene-d12 to serve as
surrogate recovery standards. The percent recovery of each standard must be within the range of
70 to 130% to be acceptable. If this agreement criterion is not met, the source of the discrepancy
shall be investigated and appropriate corrective action taken.
6.5 Assessments and Audits
Independent of site and EPA QA activities, Battelle shall be responsible for ensuring that
the following audits are conducted as part of this verification test.
6.5.1 Performance Evaluation Audits
6.5.1.1 Reference Methods Supplied by the Test Sites
Performance evaluation audits of the reference methods supplied and operated by the test
sites, and of the laboratory analyses, shall be performed according to the procedures and schedules
provided in the procedures for the respective sites and contract analytical laboratories,
respectively. The audits of the reference samplers may include, among other activities, flow rate
checks of the reference method samplers using calibrated flow meters to ensure proper flow
during sample collection, and collocation of audit samplers with the reference samplers to assess
36
the precision of the reference methods. Performance evaluation audits for laboratory analysis
include calibration checks of balances and other analytical instrumentation, as well as analysis of
blank samples. Acceptance criteria and corrective actions for these QA activities are provided in
the test plans or in the standard operating procedures for the respective site or analytical
laboratory. When possible Battelle QA staff shall be present during the performance of these
audits.
6.5.1.2 Reference Methods Supplied by Battelle
Performance evaluation audits of the reference method equipment supplied by Battelle
shall be performed during the verification test. These audits include verification of the sampler
flow rate, as well as verification of the temperature and pressure sensors to ensure proper sampler
operation.
Performance evaluation audits of the flow rate, as well as the temperature and pressure
sensors for the reference samplers provided by Battelle will be conducted according to the
procedures described in Section 6.3 with the same acceptance criteria and corrective actions.
These audits are conducted using sensors with National Institute of Standards and Technology
traceable calibrations that are not those used for the usual checks described in Section 6.3, but
may be traceable to the same primary standards. The audits shall be observed by Battelle staff
when possible and, when possible, shall be performed by someone other than the usual on-site
operator. These performance evaluation audits shall be conducted at least once during each phase
of the verification test, within one month of the beginning of each phase.
6.5.2 Technical Systems Audits
Battelle’s Quality Manager shall perform a TSA at least once during each phase of the
verification test. The purpose of this audit is to ensure that the verification test is being performed
in accordance with AMS Center QMP(1) and this test protocol and that all QA/QC procedures are
being implemented. During this audit, the Quality Manager reviews the reference methods used,
compares actual test procedures to those specified or referenced in this protocol, and reviews data
37
acquisition and handling procedures. This effort includes reviewing the procedures used at the
test site for compliance with this protocol and with the SOPs for the respective site. When
possible, a TSA of the contract analytical laboratories shall be conducted to ensure that analyses
are being performed in accordance with the requirements of this protocol and the SOPs of the
laboratory. A TSA report shall be prepared, including a statement of findings and the actions
taken to address any adverse findings.
At EPA’s discretion, the EPA ETV Quality Manager also may conduct an independent
TSA of the verification testing procedures. In any case, the EPA ETV Quality Manager shall
review Battelle’s TSA report and provide comments on the findings and actions presented in that
report.
6.5.3 Audits of Data Quality
Battelle’s Quality Manager shall audit at least 10% of the verification data acquired during
the verification test. The Battelle Quality Manager traces the data from initial acquisition,
through reduction and statistical comparisons, to final reporting. All calculations performed on
the data undergoing the audit are checked.
6.6 Reporting
Each audit shall be documented in accordance with the AMS Center QMP.(1) Audit reports
include the following:
• Identification of any adverse findings or potential problems
• Corrective actions that address adverse findings or potential problems
• Confirmation by Battelle’s Quality Manager that the corrective actions have been implemented and are effective
• Citation of any noteworthy practices that may be of use to others.
38
6.7 Corrective Action
The Battelle or EPA ETV Quality Managers, during the course of any audit, shall identify
to the technical staff performing experimental activities any immediate corrective action that
should be taken. If serious quality problems exist, the Battelle Quality Manager is authorized to
stop work. Once the audit report has been prepared, the Verification Test Coordinator ensures
that a response is provided for each adverse finding or potential problem, and implements any
necessary follow-up corrective action. The Battelle Quality Manager shall ensure that follow-up
corrective action has been taken.
7 DATA HANDLING AND REPORTING
7.1 Data Acquisition
A variety of data shall be acquired and recorded electronically, or manually, by site or
laboratory personnel in each phase of the verification test. After the prescribed validation at the
respective test site, these data, including most reference method results, meteorological
conditions, precursor gas concentrations, and the data from the technologies being verified, are
transferred to Battelle either electronically or in hard copy for subsequent reduction and analysis.
Other data, namely PAH concentrations, are generated by Battelle. These data are compiled in
electronic format and shared with the host sites. In all cases, strict confidentiality of the
verification data is maintained for each participating vendor. This is accomplished in part by
storing electronic data under separate and clearly identifiable computer file names. All hard copy
information similarly is maintained in separate files. At no time during verification testing shall
Battelle engage in any comparison or discussion of test data or intercomparison of different
monitors undergoing verification. However, much of the data used in this verification test is
obtained from sources outside of the control of Battelle. Consequently, the same data that are
used for technology verification through ETV may be used in intercomparative studies by other
organizations.
39
7.2 Data Review
Records received by or generated by Battelle staff in the verification test shall receive a
one-over-one review within two weeks after receipt or generation, respectively, before these
records are used to calculate, evaluate, or report verification results. These records may include
electronic records, laboratory record books, operating data from the test site, or equipment
calibration records. The review is performed by a Battelle technical staff member involved in the
verification test, but not the staff member that originally received or generated the record. The
review is documented by the person performing the review by adding his/her initials and date to a
hard copy of the record being reviewed. This hard copy is returned to the Battelle staff member
who received or generated or who will be storing the record.
In addition, data calculations performed by Battelle will be spot-checked by Battelle
technical staff to ensure that calculations are performed correctly. Calculations to be checked
include determination of predictability or comparability, intra-method precision, and other
statistical calculations to assess meteorological and precursor gas effects, and short-term
monitoring capabilities as identified in Section 7.3 of this protocol.
7.3 Statistical Calculations
Performance verification is based, in part, on statistical comparisons of continuous
monitoring data to results from the reference methods. A summary of the calculations to be made
is given below.
7.3.1 Comparability
The comparability between the continuous monitors and reference methods shall be
assessed only for monitors that yield measurements with the same units of measure as the
reference method with which it is being compared. The relationship between the two is assessed
from a linear regression of the data using the reference method results as the independent variable
and the continuous monitor results as the dependent variable as follows:
40
Ci = � + �×Ri + �i (1)
where Ri is the ith reference measurement (for a 24-hour period), Ci is the average of the
continuous measurements over the same 24-hour time period as the ith reference measurement, �
and � are the intercept and slope parameters, respectively, and �i is error unexplained by the
model. The average of continuous measurements is used because it is the quantity that is most
comparable to the reference sampler measurements.
Comparability is expressed in terms of bias between the continuous monitor and the
reference method and the degree of correlation (i.e., r2) between the two. Bias is assessed based
on the slope and intercept of the linear regression analysis of the data from the reference method
and the continuous monitor. In the absence of bias, the regression equation would be Ci = Ri + �i
(slope = 1, intercept = 0), indicating that the 24-hour average of continuous measurements is
simply the reference measurement plus random error. A value of r2 close to 1 implies that the
amount of random error is small, that is, the variability in the continuous measurements is almost
entirely explained by the variability in the reference measurements.
Quantities to be reported include sample size, r2, estimates and standard errors of the
intercept and slope parameters, and the numbers of standard errors between the slope estimate and
unity and between the intercept estimate and zero.
Comparability is determined independently for each of the two duplicate monitors being
tested and assessed separately for each phase of the verification test.
7.3.2 Predictability
Predictability shall be assessed for continuous monitors that report results in units that are
different than those of the reference method with which it is being compared. In these cases the
reported predictability is representative of the usefulness of that monitor as a surrogate of the
reference method, i.e., its ability to predict the measurement made by the reference method. The
relationship between the two shall be assessed from a linear regression of the data using the
reference method results as the independent variable and the continuous monitor results as the
dependent variable. The predictability of the continuous monitor is expressed by the correlation
41
coefficient of a linear regression analysis, and the slope and intercept of the regression analysis
can be used to express the relationship between the two. The statistical model used is identical to
model (1) for comparability. Quantities to be reported include sample size, r2, and estimates and
standard errors of the intercept and slope parameters. Additionally, by reversing the roles of the
independent and dependent variables, a 95% prediction interval is calculated for conversion from
monitor measurement units to lower and upper bounds on reference method measurement units.
Predictability is determined independently for each of the duplicate monitors being tested
and assessed separately for each phase of the verification test.
7.3.3 Precision
The intra-method precision of the continuous monitors shall be determined based on
procedures described in Section 5.5.2 of EPA 40 CFR 58, Appendix A, which contains guidance
for precision assessments of collocated non-FRM samplers. Simultaneous measurements from
duplicate monitors are paired and the behavior of their differences used to assess precision. The
following statistics shall be reported for each parameter measured: sample size, mean difference,
standard deviation of the difference, coefficient of variation (CV), and a 90% confidence interval
for CV. As suggested by the EPA guidance, only measurements above level of detection shall be
used in precision calculations. The CV is defined as the standard deviation of the differences
divided by the mean of the measurements and expresses the variability in the differences as a
percentage of the mean. Precision is assessed separately for each phase of the verification test.
7.3.4 Meteorological Effects/Precursor Gas Interferences
The influence of meteorological conditions on the correlation between the continuous
monitors and the reference methods shall be evaluated by using meteorological data such as
temperature and humidity as parameters in multi-variable analyses of the reference/monitor
comparison data. The model to be used is as follows:
Ci = � + �×Ri + ��j×Xji + �i (2)
42
where the Xji’s are meteorological and/or precursor gas measurements for the ith 24-hour time
period, the �j’s are the associated slope parameters, and other notation is as before. Comparability
and predictability results are reported again after these variables are adjusted for in the model.
Additionally, estimates and standard errors of the �j’s shall be provided. Meteorological effects
and precursor gas interferences are assessed independently for each of the two monitors being
tested and assessed separately for each phase of the verification test.
7.3.5 Short-Term Monitoring Capabilities
The capabilities of these monitors also shall be assessed by comparison to reference
samples collected over short sampling periods (i.e., three to eight hours). This assessment is
based on linear regression analysis of the averaged short-term sampling results from the
continuous monitors against the reference results. The analysis shall be conducted and the results
reported in a fashion identical to that for the comparability and predictability assessments
described in Sections 7.3.1 and 7.3.2 that are based on 24-hour samples.
Short-term comparisons are made only after establishing the relationship between the
short-term reference sampling results and the corresponding 24-hour reference results. The
relationship between the two sets of reference measurements is established by linear regression
using the weighted 24-hour average of the results from the short-term sampling as the dependent
variable and the 24-hour results as the independent variable in the regression analysis.
Comparability is assessed using equation (1), replacing the average of continuous measures with
the weighted average of short-term sampler measurements. The short-term sampling results also
shall be used to assess the effects of meteorological conditions and precursor gas concentrations
on the response of the monitors. These short-term results are used in place of the 24-hour
measurements in the analysis described in Section 7.3.4. Independent assessments are made for
the duplicate monitors, and the data from each phase of testing are analyzed separately.
43
7.3.6 Qualitative Comparisons
As described in Section 3.5.2, additional qualitative comparisons may be made between
the monitors being verified and other monitors, provided that other monitors are in use on site that
are adequately comparable to the PM2.5 FRM. A continuous monitor shall be considered
adequately comparable if, under analysis using equation (1), the squared correlation coefficient
(r2) is at least 0.90 and the slope and intercept estimates are within three standard deviations of
unity and zero, respectively.
Given an adequately comparable continuous monitor, qualitative comparisons between
this monitor and the tested monitor shall consist of overlaid time-series plots of measurements.
Such plots allow visual inspection of similarities and dissimilarities in measurements and
temporal patterns over the entire period of data collection. Similar overlaid time-series plots shall
be made with the results from the continuous meteorological and precursor gas monitors when
appropriate. Qualitative comparisons are made separately for each of the two monitors being
tested and for each phase of the verification test.
7.4 Reporting
The statistical comparisons that result from each of the tests described above shall be
conducted separately for each technology being verified, and information on the additional cost
factors (i.e., costs associated with calibration gases, etc.) are reported. Separate verification
reports are then prepared, each addressing an individual technology provided by one commercial
vendor. For each test conducted in this verification, the verification report presents the test data,
as well as the results of the statistical evaluation of those data.
The verification report shall briefly describe the ETV program, the AMS Center, and the
procedures used in verification testing. The parties involved in the verification test shall be
identified and the roles of each described. These sections will be common to each verification
report resulting from this verification test. The results of the verification test shall then be stated
quantitatively, without comparison to any other technology tested or comment on the
44
acceptability of the technology’s performance. Included in the verification report shall be
descriptions of the following parameters:
• Operating conditions during testing
• Instrument settings used during testing
• The inlet used during the test.
The preparation of draft verification reports, the review of reports by vendors and others, the
revision of the reports, the final approval, and the distribution of the reports will be conducted as
stated in the “Generic Verification Protocol for the Advanced Monitoring Systems Pilot.”(13)
Preparation, approval, and use of verification statements summarizing the results of this test also
are subject to the requirements of that same protocol.
After approval, the final verification reports and verification statements shall be made
available to the respective vendors as hard copy and will be posted on the ETV Web site
(www.epa.gov/etv/centers/center1.html). The reports also may be presented or made available at
various technical conferences and trade shows.
8 HEALTH AND SAFETY
Before each phase of testing begins, site management shall be responsible for reviewing
the necessary health and safety requirements and guidance for the respective test sites with
Battelle, EPA, and vendor staff. While on site, Battelle staff shall operate under these established
requirements and guidelines. It is expected that, while on-site, EPA and vendor staff shall also
operate according to these requirements.
45
9 REFERENCES
1. “Quality Management Plan (QMP) for the ETV Advanced Monitoring Systems Center,” Version 3.0, U.S. EPA Environmental Technology Verification Program, Battelle, Columbus, OH, December 2001.
2. “National Primary and Secondary Ambient Air Quality Standards,” 40 CFR Part 50, Federal Register, 62 (138):38651-38760, July 18, 1997.
3. “Research Priorities for Airborne Particulate Matter,” National Academy Press, National Research Council, Washington, DC, 1998.
4. “Ambient Air Quality Surveillance,” 40 CFR Part 58, Federal Register, 62 (138):3883038854, July 18 (1997).
5. “Measurement Methods to Determine Compliance with Ambient Air Quality Standards for Suspended Particles,” J. C. Chow, J. Air & Waste Manage. Assoc., 48, 320-382, (1995).
6. A complete list of designated methods can be downloaded from: http://www.epa.gov/ttnamti1/files/ambient/criteria/699pm.pdf
7. “Guidance for Using Continuous Monitors in PM2.5 Monitoring Networks,” U.S. EPA, Office of Air Quality Planning and Standards, Research Triangle Park, NC, 1998.
8. “Instrument Intercomparison Study - Bakersfield, CA 1998-1999,” California Air Resources Board, Sacramento, CA, 1999.
9. “Guideline on Speciated Particulate Monitoring,” U.S. EPA, Office of Air Quality Planning and Standards, Research Triangle Park, NC, 1999.
10. “Standard Test Method for Determination of Gaseous and Particulate Polycyclic Aromatic Hydrocarbons in Ambient Air (Collection on Sorbent-Backed Filters with Gas Chromatography/Mass Spectrometric Analysis),” American Society for Testing and Materials, Method D 6209-98, in Annual Book of Standards, Vol. 11.03, West Conshohoken, PA, 1998.
11. “Environmental Technology Verification Program Quality and Management Plan for the Pilot Period (1995-2000),” U.S. EPA, EPA-600/R-98/064, Cincinnati, OH, May 1998.
12. Atmos. Environ., 29, 1719-1733 (1995), L. A. Gundel, V. C. Lee, K. R. R. Mahanama, R. K. Stevens, and J. M. Daisey.
46

13. “Generic Verification Protocol for the Advanced Monitoring Systems Pilot,” U.S. EPA, Environmental Technology Verification Program, Battelle, Columbus, Ohio, October 1998.
47
APPENDIX A
Example QA/QC Report Forms
A-1
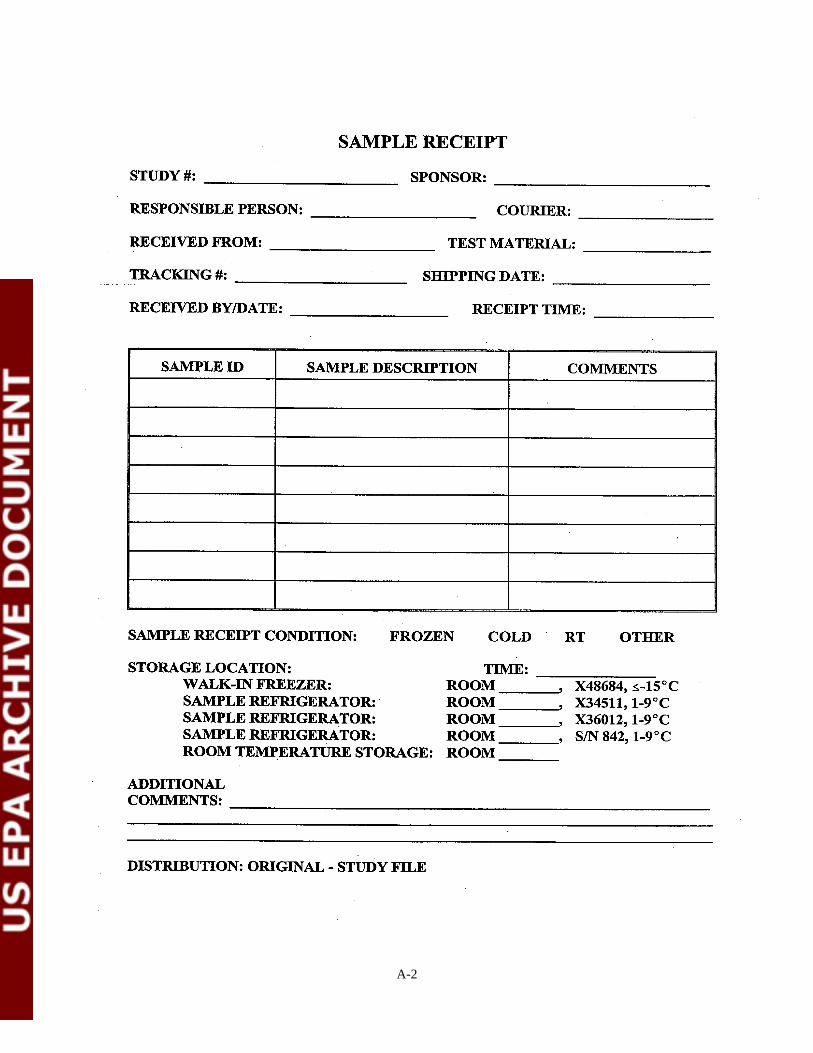
A-2
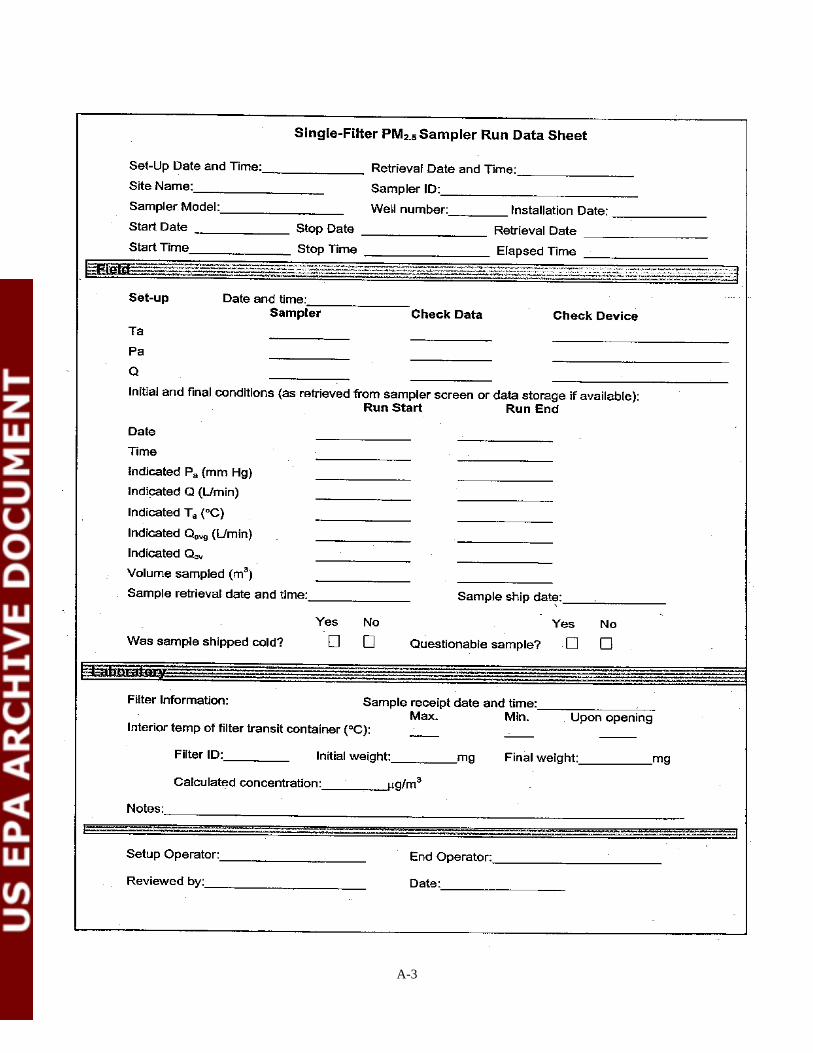
A-3

A-4


![Monitoring Report Sheet (Input Sheet) [For Verification]](https://img.pdfslide.net/doc/110x75/623de839923f7d2c131ce1dd/monitoring-report-sheet-input-sheet-for-verification.jpg)