Embed Size (px)
Citation preview

1
Environmental Impact Assessment and Recommendations for Potential Hydraulic Fracturing in
Thailand
Authors:
Davis Plunkett Maureen Pittman
Alex Clegg Anne Corrigan Spencer Nelson Charlotte Brown
University of North Carolina at Chapel Hill
Institute for the Environment King Mongkut’s University of Technology Thonburi
Joint Graduate School for Energy and the Environment (JGSEE)

2
Chapel Hill, North Carolina Bangkok, Thailand
Contents 1. Abstract .................................................................................................................................................... 4
2. Introduction ............................................................................................................................................. 4
3. Methods ................................................................................................................................................... 5
3.1 Life Cycle Assessment ........................................................................................................................ 5
3.2 Goal and Limitations .......................................................................................................................... 6
3.3 Scope .................................................................................................................................................. 6
3.3.1 System Boundaries ...................................................................................................................... 6
3.3.2 Functional Unit ............................................................................................................................ 7
3.3.3 Preliminary Assumptions ............................................................................................................. 7
4. Theory and Calculations ........................................................................................................................... 8
4.1 Suitability Map ................................................................................................................................... 8
4.2 Well Productivity ................................................................................................................................ 9
4.3 Infrastructure ..................................................................................................................................... 9
4.4 Parts List and Transportation ........................................................................................................... 10
4.2 On Site Processes ............................................................................................................................. 10
4.2.1 Construction and Installation .................................................................................................... 10
4.2.2 Well Completion ........................................................................................................................ 11
4.2.3 Other Natural Gas Emissions ..................................................................................................... 11
4.2.4 Fracturing .................................................................................................................................. 11
4.2.5 On-‐site Refining ......................................................................................................................... 12
4.2.6 Well Decommissioning .............................................................................................................. 12
4.3 Water ............................................................................................................................................... 12
4.3.1 Water volume ............................................................................................................................ 12
4.3.2 Consumptive Water Use ........................................................................................................... 12
4.3.3 Flowback and Produced Water ................................................................................................. 13
4.3.4 Water Reuse and Recycling ....................................................................................................... 13
4.3.5 Wastewater Scenarios ............................................................................................................... 14
6. Results .................................................................................................................................................... 15

3
6.1 Impact Assessment and Interpretation ............................................................................................ 15
6.1 Total Water Use ............................................................................................................................... 18
6.2 Site Reclamation .............................................................................................................................. 19
7. Discussion ............................................................................................................................................... 19
7.1 Economic Analysis ............................................................................................................................ 19
7.1.1 Economic Review of Wastewater Scenarios ............................................................................. 19
7.1.2 Economic Cost per Well ............................................................................................................ 21
7.2 Water Data Limitations .................................................................................................................... 22
7.3 Water Scarcity .................................................................................................................................. 23
7.4 Pollution Events ................................................................................................................................ 24
7.5 Sensitivity Analysis ............................................................................... Error! Bookmark not defined.
7.6 Other Energy Sources ....................................................................................................................... 24
7.6.1 Onshore conventional natural gas ............................................................................................ 24
7.6.2 Offshore natural gas .................................................................................................................. 25
7.6.3 General Other Fuels ...................................................................... Error! Bookmark not defined.
7.7 Scaling Up ......................................................................................................................................... 25
8. Conclusions and Recommendations ...................................................................................................... 25
8.1 Conclusions ...................................................................................................................................... 26
8.2 Recommendations ........................................................................................................................... 27
Sources ....................................................................................................................................................... 27

4
1. Abstract Natural gas extracted through the process of hydraulic fracturing is currently gaining attention as an alternative to conventional oil and gas sources. In light of the recent appraisal of Thailand’s shale gas reserves in the Northeastern Khorat region, this study aims to estimate potential environmental impacts of a hydraulic fracturing project in the Nam Duk shale formation. Environmental impacts were evaluated using Life Cycle Assessment (LCA) methodology, encompassing the operations of a well-‐site from construction through on-‐site refining and wastewater treatment options. A brief economic evaluation of hydraulic fracturing in Thailand compliments the LCA. Results show that Global Warming Potential (GWP) overshadowed all other midpoint impact categories in contribution to the endpoints of Human Health and Ecosystem Depletion. Resource depletion results suggest it is not a significant impact for this process. The largest emissions came from leaking, venting and flaring processes; methane release during on site extraction alone contributes 34% to GWP. Evaluation of toxicity and wastewater treatment scenarios indicates process waters can significantly impact human health. Economic analysis adds to the discussion by quantifying treatment and reclamation options. The paper concludes with recommendations for regulation and encouragement of further research.
2. Introduction Thailand is among the most rapidly industrializing countries in the world today. As noted in Figures 1 and 2, natural gas represents a significant portion of Thai energy consumption, and while domestic fossil fuel production has been increasing, it has not been enough to meet the growing energy demand. The Thailand Energy Ministry predicts peak gas production will be reached in 2017, and new domestic energy sources will likely be investigated to enhance energy security (US EIA Thailand Analysis).
It is proposed that Thailand will look to an exploration of unconventional oil and gas recovery to fill this gap. This research group chose to focus on hydraulic fracturing of shale rock for natural gas recovery.
A 2013 evaluation of total world shale gas resource by the Advanced Resource Institute and the U.S. Energy Information Administration revealed that Thailand has a significant shale gas resource. There is an estimated 5 trillion cubic feet of natural gas in the Khorat Basin region of the country (Advanced
Figure 1: 2010 Thailand Energy Consumption. Figure 2: Thailand Natural Gas Production and Consumption. Source: US EIA, 2013

5
Resource Institute, 2013). A recoverable resource of this size would represent 5% of Thailand’s natural gas consumption over the next 30 years based on current consumption projections (US EIA Thailand Analysis). The most promising geologic formation is the Nam Duk, a Permian age formation with favorable over-‐pressuring and thermal maturity, indicating gas phase hydrocarbons suitable for extraction by hydraulic fracturing. The closest geologic analog is the Wolfcamp Shale in West Texas. Due to a lack of exploratory data on Nam Duk, data from Wolfcamp Shale will be substituted where appropriate.
Hydraulic fracturing differs from conventional oil and gas recovery in that it involves horizontal drilling and fracturing of shale rock to release natural gas. Conventional extraction makes use of dense pockets of oil and natural gas that have migrated to a single location over time. However, oil and gas deposits also form inside the pores of shale rock, where they remain trapped. By drilling down vertically and then horizontally through these rocks, the natural gas can be reached. Once inside the shale formation, a high pressure mixture of water and chemicals is pumped down and fractures the rock. These fractures are then held open with a proppant, usually sand, which allows the natural gas to escape.
Hydraulic fracturing has become a profitable and popular extraction method in the United States, the United Kingdom, and Australia, but it also comes with legitimate environmental concerns. In recent years there has been a growing environmental backlash against the hydraulic fracturing industry. Concerns stem mostly from the unknown nature of the chemicals used in fracturing, the potential for contamination of ground water, and evidence of methane leakage. Several studies examine specific contamination cases and the US EPA has been working to compile hundreds of cases into a study on the impact of hydraulic fracturing on drinking water (McDermott-‐Levy, 2013; US EPA, 2012). Cases of extreme contamination juxtaposed with the economic vitality of the industry have polarized public opinion on the practice. This makes it very important to understand the environmental impacts and concerns related to the hydraulic fracturing industry before it happens and make efforts to prevent such problems.
3. Methods
3.1 Life Cycle Assessment Life Cycle Assessment (LCA) is a technique for cataloging all the environmental impacts of a process, good or service over its entire lifetime. It involves a methodical aggregation of resource use and emissions from each life cycle stage, starting with harvesting the raw material and ending with its eventual disposal. By accounting for the whole life cycle of a product, aspects like durability, productivity, and environmental persistence can be taken into account. This method was chosen for its ability to encompass environmental, human health and energy security concerns in light of the resource being extracted.
Impacts are catalogued according to the ReCiPe used by Van de Meent and Van Zelm in previous LCAs (Van de Meent, 2005; Van Zelm, 2009). It includes 18 midpoint indicators and 3 endpoint indicators. Results herein will be displayed in both formats as midpoints are more accurate and less subjective, but

6
endpoints are more easily understood as impacts. Figure 3 shows an example of midpoint to endpoint conversion. The study utilizes ReCiPe’s moderate time scale for these impacts based on mid-‐range values.
3.2 Goal and Limitations The goal of the LCA is to determine the probable environmental impacts of natural gas hydraulic fracturing in the Korat Basin of Thailand. The LCA will focus on water use and contamination, resource depletion, land-‐use change, and ecosystem impacts. These impacts will be distributed over the productivity of a single well and then scaled to replicate full exploitation of the resource.
This study will also evaluate the economics of certain practices, namely water treatment and site reclamation. Finally, an overall economic, energy, and environmental impact comparison will be made to other energy sources.
This is the 1st study of its type in Thailand and can be used as a reference for policy makers when determining how to regulate the industry. It should be seen as a preliminary evaluation and will hopefully spur further research. The study is not an environmental assessment of the region, nor is it an exhaustive economic evaluation. Its implications are limited geographically to gas in the Khorat Region. The results can be seen as valid for 10 to 15 years, by which time the industry practices will likely have changed significantly.
3.3 Scope
3.3.1 System Boundaries This LCA will include all setup required to begin extraction and will follow the natural gas up to (but not including) off-‐site transportation. The exploration step will be excluded, as it is in many other analyses of fracturing due to the negligibility of its impacts. Our system will include: road and pipeline construction, site preparation, well pad construction and drill rig set up, water, mud, chemical and sand transport, drilling, sealing, perforation, fracturing, extraction, initial processing, and water treatment. Figure 4 details the system boundaries in a process flow map. Since natural gas can be refined into a host of products, our analysis will stop before it leaves the wellhead site. At that point, it can be seen as identical to any other natural gas produced in Thailand. The removal of useful chemicals during refining (H2S) will fall outside the scope of this study; they will not be counted as a credit, nor will they be an environmental emission. The production of capital goods like the drill rig will fall outside the scope, but
Figure 3: Example ReCiPe Midpoints to Endpoints (GWP, AP, OFP)

7
the production of cement for well casing will not. The production of hydraulic fracturing chemicals will fall outside of the scope; since the composition is unknown, the emissions cannot be reasonably determined. As well, it is anticipated that the low volumes used would make chemical production emissions negligible, as argued by (Clark, 2011).
Figure 4 show the system boundaries of the LCA. Processes shown in yellow are infrastructure requirements; processes in orange are extraction-‐related; processes in purple are possible wastewater destinations. Blue objects show selected product flows.
3.3.2 Functional Unit The functional unit (FU) chosen is 50,000 m3 of natural gas extracted via hydraulic fracturing, ready for transportation. This is roughly equal to 65 person-‐years of natural gas consumption in all forms in Thailand.
3.3.3 Preliminary Assumptions As no hydraulic fracturing is currently underway in Thailand, the data presented is secondary, and has been modified to approximate hydraulic fracturing in Thailand.
An assumption held throughout the paper is that the Wolfcamp Shale is the best analog for the Nam Duk. The two formations show geological similarities in age, depth, pressuring, and thermal maturity. The comparisons between productivity and water and chemical use are less clear and require additional assumptions. The issue is discussed further below.
Figure 4: Process Flow Map and System Boundaries

8
The emissions data for much of the infrastructure construction and on-‐site mechanical processes are adapted from an LCA on natural gas performed by the National Energy Technology Laboratory (NETL, 2014). The report assumes a certain composition of natural gas where methane makes up 78.8% (NETL, 2014). In this report the same composition is maintained, detailed in Table 1, because it is similar to the average methane content of 75% in Thailand’s natural gas (Pongthanaisawan, 2007). Based on this assumption, a natural gas density of 0.81 kg/m3 is used for the study (Unitrove).
Table 1: Shale Gas Composition
4. Theory and Calculations
4.1 Suitability Map A GIS analysis of the four provinces surrounding the Nam Duk formation was performed to find suitable locations for shale gas wells. The suitability map was created using methodology proposed by Walker 2013. Researchers there took industry and environmental perspectives into account to assign classification values to hydrography, land cover, elevation, and existing roadways. A map was created for each perspective, then overlaid and clipped to the watershed area. The same classification values were used here to create this map, seen below as Figure 5.
Natural Gas Composition by Mass
Component Production Methane (CH4) 78.8% Ethane (C2H6) 13.3% Propane (C3H8) 3.9% iso-‐Butane (C4H10) 0.05% n-‐Butane 0.05% Nitrogen (N) 1.77% Carbon Dioxide (CO2) 1.51% Water (H2O) 0.12% Hydrogen Sulfide (H2S) 0.5%

9
Areas of green represent high suitability for both perspectives. The example well was chosen in an area of high suitability that was also in the middle of the shale formation, close to an access road, and not in the National Park. As the most important determinant of the industry perspective is natural gas concentration, concentration was assumed to be uniform across the formation.
4.2 Well Productivity Well productivity was calculated from the EIA/ARI’s gas concentration assessment of 6.1x10⁹ m3/km2 in the Nam Duk formation (EIA, 2013). This value was compared with the 1.1x10¹⁰ m3/km2 gas concentration and 8.5x10⁷ m3 estimated ultimate recovery (EUR) of a Barnett Shale well to approximate an EUR of 4.7x10⁷ m3 of natural gas over the lifetime of a Nam Duk well (USDOE Unconventional, 2014; Kruuskraa 2010). This productivity value is used as a parameter for the emissions calculated as a result of on-‐site processes (well construction, completion, extraction, refining, etc) and for scaling up emissions for the entire Nam Duk formation.
4.3 Infrastructure Infrastructure creation includes road construction, well pad setup, and pipeline construction. It was assumed that access roads, which connect the well pad to main roads, will be dirt and connected to
Figure 5: Suitability Map. Nam Duk map provided by Thailand Department of Mineral Resources

10
main roads efficiently (NYSDEC, 2009). The length of road to the proposed well site is 755 meters, derived from the average access road length in a development in the Western United States (Anderson, 2011). This number is comparable due to similarities in land use patterns and road density in Thailand. The total land disturbance from roads during the construction phase is 9,211 m2/well. The area can be reduced once the production phase begins, which is covered in the reclamation section.
Once the road has been cleared, the well pad can be constructed. The size of the pad is assumed to be 9,202 m2, which can house 6 horizontal wells and service almost 3 km2 of the natural gas basin (NYSDEC, 2009). Environmental effects from construction of the well pad are estimated from NETL data (NETL, 2013).
The final piece of infrastructure is pipeline installation. PTT, Thailand’s largest oil and gas producer, has a network of nearly 1,500 km of natural gas pipeline (PTT, 2012). We estimate 125 km of new necessary pipeline, with a clearing of 15 m, to connect the chosen Nam Duk well site with the network (NETL, 2014).
4.4 Materials and Transportation Materials fall into broad categories for this study; all are grouped according to their source location. The source of materials was investigated to see the feasibility of domestic sources. This is clearly the case for construction equipment. It is also true for drill rigs and drilling equipment, most of which is located in the south of Thailand. Fracturing chemicals, drilling mud, and proppant could all be sourced domestically. These would be produced at any of various Industrial Estates through the country. For transportation distances, the most likely candidate was chosen based on production capability. Fracturing equipment is the only item sourced from overseas; Australia was chosen as the most likely origin. Fuel use was calculated based on port-‐to-‐port distance, average speed, and hours of operation (Corbett, 2003). Over land distances were estimated from the well location using Google Maps. Different trucks were figured for solid and liquid transportation. The number of trips was estimated from the mass of the material, with the help of an MIT study (US DOE, 2014). The GREET Model from Argonne National Labs was used to calculate the emissions of CO2, CH4, N2O, VOCs, CO, NOx, PM10 and 2.5, and SOx from these data.
4.2 On Site Processes
4.2.1 Construction and Installation Well construction and installation includes the vertical and horizontal drilling of the well then complete casing, steel pipe with cement lining, of all tunnels. The total drilling time, based on a standard advanced drilling rig, may be nearly 20 days (NETL, 2013). For this study, the total well length chosen was the median value of 4600m, taken from NETL data on unconventional well length. This is approximately ten times the length of a conventional gas well. 2700m of our well is assumed to be vertical, leaving approximately 1800 m of horizontal wells (NETL, 2013). The well length estimate could be more accurate with more detailed geologic information and a map of natural gas concentration in the Basin.

11
4.2.2 Well Completion After the well is constructed and casing installed, there is a release of natural gas as a result of well completion. This is a one-‐time emission that occurs as the well transitions from its construction phase to the operational extraction phase. Completion emissions in addition to the construction and installation emissions represent one unit process.
4.2.3 Other Natural Gas Emissions Data sheets provided in NETL natural gas report provide formulas and adjustable parameters so that they may be tailored to a specific extraction process. To best model this study’s emission results, the parameters were adjusted to fit the specifications of the Khorat Basin conditions whenever possible. During the operation of the well, the most significant impacts result from natural gas leakages. Leaked methane may be monitored then intentionally vented or flared. While conventional gas wells may flare up to 51% of the extracted NG, shale wells only flare 15% on average (NETL, 2010). Fugitive emissions are a certain smaller type of methane leakage that escape unregulated from the well, equipment, and valves. In the case of pneumatic devices, it is assumed that these machines, usually pumps, run off the natural gas that has been extracted on site. Using specialized Kemray pumps, the natural gas is not actually combusted; rather, the natural underground pressure of the gas is maintained upon extraction and used to power the equipment (EPA, 2014). That same natural gas is usually released directly to the atmosphere as the pump operates. Meanwhile, the rest of the machinery (including that of drilling) is assumed to use energy powered by diesel generators. The emissions from either the diesel generators or the natural gas-‐run pneumatics are included in the calculations.
This study’s unit process “leaking, venting, and flaring” includes all intentional and unintentional natural gas emissions at the well site. Note that the values presented are in units of natural gas delivered, so the data was adjusted to account for the difference between the quantity immediately extracted and the quantity delivered. NETL estimates that 92% of natural gas is delivered from the well to the power plant (NETL, 2014).
Liquids unloading, where flowback water and condensates must be removed from a wellhead to allow for the flow of natural gas, is not required for unconventional wells and, therefore, does not contribute to the impact categories (NETL, 2014). Well workovers, another well-‐maintenance procedure, are necessary on average every 100 years. When scaled to the study’s well-‐life of 30 years, the size of the episodic emission for this step is negligible and thus excluded.
4.2.4 Fracturing The fluids used to fracture the shale must reach very high pressures to crack the rock. Diesel-‐run pumps are used to achieve this. The methodology for this process was taken from an LCA of greenhouse gas emission in the Marcellus shale. Using horsepower, pumping time, and an emission factor, the emissions for the fracturing phase were established. While some of the parameters used were geographically specific, the contribution of this phase was seen to be small enough to allow for this assumption (Jiang et al., 2009).

12
4.2.5 On-‐site Refining Finally, the natural gas must be refined on site to improve the quality to meet pipeline standards. Included in the on-‐site refining for this study is the sweetening of the natural gas (removal of H2S) and dehydrating. These steps are summed in the unit process of on-‐site refining.
4.2.6 Well Decommissioning After a productive life of 30 years, the well is decommissioned. This process includes various levels of well plugging. Levels of well plugging, beyond simply leaving with no clean up, range from filling the well with cement to installing mechanical plugs to prevent further leaks (NPC, 2011). If wells are not properly plugged, there is potential for fluids to migrate between different formations and into water sources. If natural gas leaks from the well, there is fire risk. It can also be problematic if the field is drilled again, due to the possibility of gas and oil leakage from the wellhead (NPC, 2011).
In some instances, wells are “mothballed” instead of being fully abandoned, meaning that they can be redrilled later if there is an advance in technology or the economic environment of natural gas is such that it is prudent to reactivate the well (Muehlenbachs, 2013). While this does allow for future exploration and profit, wells can cause environmental damage in the meantime. If a company decides to not perform further exploration in the area after mothballing for several years, decommissioning and environmental is often costlier than it would have been if done immediately, the extent of this is unknown however (Meuhlenbachs, 2013). There have also been cases of firms going bankrupt and being unable to cleanup mothballed wells, creating “orphaned wells”, which become liabilities of the state (Muehlenbachs, 2013).
4.3 Water
4.3.1 Water volume Large volumes of water are used during well drilling, fracturing, and well closure. This study focuses on direct water use in the well-‐pad construction, drilling, fracturing, and well closure processes. Indirect water consumption from transportation and energy generation was included. Indirect water consumption from the production of chemicals and additives, drilling mud or fuel was not considered. Water use for drilling, well closure, trucking and energy production were estimated using data from Jiang 2014, while total hydraulic fracturing water use was estimated based on 2008 water use intensity values in the geologically similar Wolfcamp shale (Nicot, 2012) and on our assumption of six horizontal wells per vertical well. While water consumption is a serious concern during hydraulic fracturing, so too is the return of water along with the natural gas product during the extraction of natural gas.
4.3.2 Consumptive Water Use Consumptive water use is the total water lost underground, through evaporation, or in a product. For this study, total water consumption does not include indirect water consumption. Produced and flowback waters, whether treated or discharged, are not considered as consumed. While impaired, these waters are still released to the environment.

13
4.3.3 Flowback and Produced Water When a well undergoes the process of hydraulic fracturing, a fluid made up of freshwater, sand, and various chemicals is injected into the well. Sand is used as a proppant to hold open the fissures from which natural gas flows. The chemicals used include biocides, breakers, clay stabilizers, corrosion inhibitors, crosslinkers, scale inhibitors, and surfactants in order to maximize natural gas return (NY DEC, 2009). There are many possible combinations of chemicals that accomplish each of these tasks, and fluid composition will vary from well-‐site to well-‐site depending on geology and cost.
The initial two weeks post-‐fracturing are known as the flowback period, in which around 30% of the injected fluid is returned with concentrations of naturally-‐occurring salts, such as sodium, calcium, and chlorides (Jiang, 2014). Other chemicals, including the carcinogen benzene, appear in concentrations of up to 2 mg/L (Hayes, 2009). However, 70% remains underground. Since it is isolated below surface water and groundwater, chemicals in that fluid are not counted in the LCA.
From the fourteenth day to the end of the well’s lifetime, the water that flows to the well’s surface is known as produced water. This was water previously trapped within the shale formation, and is now released to the surface. It is especially high in Total Dissolved Solids (TDS) and Total Suspended Solids (TSS) (SPE White Paper, 2011). High concentrations of TDS and TSS complicate wastewater management practices, and can contain high concentrations of toxic minerals such as barium (Jiang, 2014). Produced water also contains isotopes of naturally-‐occurring radioactive material (NORM). The concentrations and toxicity of NORM in Khorat produced waters was not estimated, due to the limited ecotoxicity of NORM (Hosseini, 2012). The volume of produced water that returns is dependent on the geology of the region. Based on produced water generation rates of wells in similar geology the volume of produced water over the lifespan of the well is equal to 130% of total volume injected.
4.3.4 Water Reuse and Recycling Water use varies greatly between companies and regionally, based on the availability of freshwater, finances of the company, and the availability of wastewater treatment facilities. Most water used is freshwater (<1000 mg/L TDS), but treated wastewater and some brackish water (<10,000mg/L TDS) can be used when freshwater is scarce. Produced and flowback water can be reused or treated through a variety of treatment technologies, can be discharged, or can be injected underground (Vlasopoulos, 2006). Early flowback water has low levels of TDS and TSS and is therefore the easiest water to treat or reuse. Additionally, because it still contains low levels of fracturing fluids it can be economically feasible to directly reuse early flowback for further fracturing (Boschee, 2014). As production continues, the TDS of produced water rises and it becomes increasingly more difficult to treat.
Treatment of flowback and produced waters has two forms: conventional and advanced treatments. Conventional water treatment includes flocculation, coagulation, sedimentation, and filtration to remove oil, grease, and most suspended solids (Boschee, 2014). Conventional water treatment is much cheaper and more widely available than advanced; however, it does not remove all TDS and can result in a high level of eutrophication. Advanced processing of petroleum waters includes reverse osmosis, crystallization, and thermal distillation (Gregory, 2011). These technologies are much more efficient at reducing TDS levels, but they can have high energy use and are costly (Vlasopoulos, 2006). When

14
produced waters have very high salinity or the geology is particularly suitable, injection wells can be used to put the water deep underground. Water is injected deep below aquifers between two confining regions of rock that prevent the flow of the produced water towards the surface. If water is cheap, deep well injection can be a viable solution to wastewater management. In this study injected wastewaters are considered to have no emissions; however, that water is lost from the water cycle.
4.3.5 Wastewater Scenarios It is difficult to predict how companies operating in Thailand will use or reuse their water; therefore we have included 5 scenarios of water use as a benchmark for relative impact of various water management systems.
Five scenarios were considered as possibilities for wastewater management in the event of a hydraulic fracturing project in the Khorat Basin:
I. Total dumping without treatment: This scenario assumes that no treatment will be given to the flowback or produced water before it is dumped into a freshwater body.
II. Total treatment & reuse: This scenario uses NETL data to quantify the fossil depletion and emissions associated with the operation of a conventional Waste Water Treatment Plant (WWTP). Reference flow is one kg of water delivered to be treated; assumptions include 90% reduction in all constituents of interest and a 20% return of water fit to be reused.
III. Treatment of flowback, dumping of produced: In this scenario, the flowback water (water appearing in the first 14 days) is treated at a Waste Water Treatment Plant (WWTP), while the produced water (after 14 days) is released to the environment.
IV. Total Deep-‐well injection: Wastewater is injected into a disposal well, where it is considered to be consumed with no direct emissions to the environment. This scenario is considered best practice in some cases of hydraulic fracturing (depending on water scarcity and TDS of returned water). Economic viability is dependent on geological suitability.
V. Treatment of flowback, injection of produced: As with scenario III, only the flowback water is treated for reuse. The produced water is disposed of via deep-‐well injection.
Another possible disposal route is evaporation pits. These pits are kept and maintained on site, where flowback and produced waters are pumped and sometimes left to evaporate. No quantitative data is currently available, but best practice advises against this since volatile compounds (including carcinogens such as benzene, toluene, and xylenes) will be released into the air and negatively impact air quality (Stockman, 2013). In addition, unlined pits or pits with damaged lining allow toxic chemicals to leach into groundwater, polluting local water resources.

15
6. Results
6.1 Impact Assessment and Interpretation First, data is presented for all lifecycle stages except wastewater treatment. Emissions fall into the following midpoints, shown in Table 3: Global Warming Potential (GWP), Photochemical Oxidant Formation (POF), Particulate Matter Formation (PMF), Acidification Potential (AP), Marine Eutrophication (ME), Fossil Depletion (FD), Human Toxicity (HT), Terrestrial Ecotoxicity (TET), Freshwater Ecotoxicity (FET), Marine Ecotoxicity (MET), and Land Occupation (LO).
Table 3: Midpoint emissions for extraction-‐related processes Midpoint GWP POF PMF AP ME FD HT TET FET MET LO
Unit (kg) CO2-‐eq
NMVOC PM10-‐eq
SO2-‐eq N-‐eq oil-‐eq 1,4-‐DB eq
1,4-‐DB
1,4-‐DB
1,4-‐DB
m2
Pipeline Installation
3.0E+2 3.6E+0 8.2E-‐1 1.8E+0 1.2E-‐1 2.8E+0 1.7E+1 0 0 2.3E-‐2 1.4E+2
Pad Construction 3.9E+0 8.4E-‐2 4.4E-‐3 4.6E-‐2 3.2E-‐3 0 0 0 0 0 3.5E-‐8
Road Construction
0 0 0 0 0 0 0 0 0 0 3.1E+0
Transportation of Materials
2.3E+2 1.8E+0 4.0E-‐1 9.1E-‐1 6.3E-‐2 3.2E-‐1 0 0 0 0 0
Construction, Installation
2.0E+3 2.6E+0 4.5E-‐1 1.0E+0 1.1E-‐1 9.2E+1 0 0 0 0 0
Leaking, Venting, Flaring
6.0E+3 4.5E+1 0 0 0 2.2E+2 0 0 0 0 0
Fracturing 4.6E+2 3.5E+0 8.5E-‐1 2.1E+0 1.4E-‐1 0 0 0 0 0 0
Sweetening, Dehydrating
4.9E+3 5.3E-‐1 6.5E-‐4 1.2E-‐3 1.3E-‐4 6.3E+1 1.7E-‐4 6.5E-‐11
6.2E-‐11
2.4E-‐8 0
NG extracted 0 0 0 0 0 3.5E+4 0 0 0 0 0
total 1.4E+4 5.7E+01 2.5E+0 5.9E+0 4.3E-‐1 3.6E+4 1.7E+1 6.5E-‐11
6.2E-‐11
2.3E-‐2 1.4E+2
Each of the wastewater treatment scenarios differ in emissions amounts and types. Table 4 shows ReCiPe midpoint totals associated with each possible fate of produced and flowback water.
Table 4: Midpoints for Wastewater Management Options GWP POF PMF AP ME FD HT FE FET MET
kg
CO2 eq
kg NMVOC
kg PM10
eq
kg SO2 eq
kg N eq
kg oil eq
kg 1,4-‐DB eq
kg P eq
kg 1,4-‐DB eq
kg 1,4-‐DB eq
1 -‐ Total Dumping 0 0 0 0 0 0 1.09E+
04 0.00E+00
4.51E+02
126.228
2 -‐ Total Treatment 4.90E+02
2.41E-‐01
8.65E-‐03
1.44E-‐01
3.02E+00
7.03E-‐02
9.92E+02
1.84E-‐02
41.06716
11.48182
3 -‐ Treated Flowback, Produced Dumped
9.81E+01
4.83E-‐02
1.73E-‐03
0.02873
6.03E-‐01
1.41E-‐02
1.04E+04
3.68E-‐03
4.37E+02
1.21E+02
4 -‐ Total Injection 195.1836
7.79E+00
8.61E-‐04
3.96E-‐02
0.002191
3.25E+00
0 0 0 0

16
Figure 6: Resource depletion percent contribution by lifecycle phase
5 -‐ Treated Flowback, Produced Injected
254.2069
6.28E+00
2.42E-‐03
6.04E-‐02
0.604953
2.617235
46.09764
0.003676
1.469263
0.475234
With such different emissions for each scenario, it is very difficult to directly compare them. For this reason, an LCA endpoint approach was used. Resource depletion, given in dollar amounts, is understood as the monetary amount necessary to extract additional resource given that the concentration is now decreased. Human Health is presented in Disability Adjusted Life Years (DALY), which includes both years spent disabled and years of life lost as a result of toxic or cancerous effects of pollutants. Ecosystem Depletion is presented in species-‐years. One million species years is equivalent to one extinction.
In order to make results clearer, and to highlight the process steps that consume the highest proportion of resources, natural gas extraction has been excluded from Resource Depletion. Figure 6 shows the percentage contribution of life cycle phases. By this calculation, the resource depletion per functional unit is THB 892 (all baht [THB] figures are normalized to 2013 values).
The largest contributor is leaking, venting and flaring, caused mostly by
methane emissions during this lifecycle stage. Since resource depletion is only effected by fossil depletion, this measure does not change for any of the wastewater treatment scenarios.
17
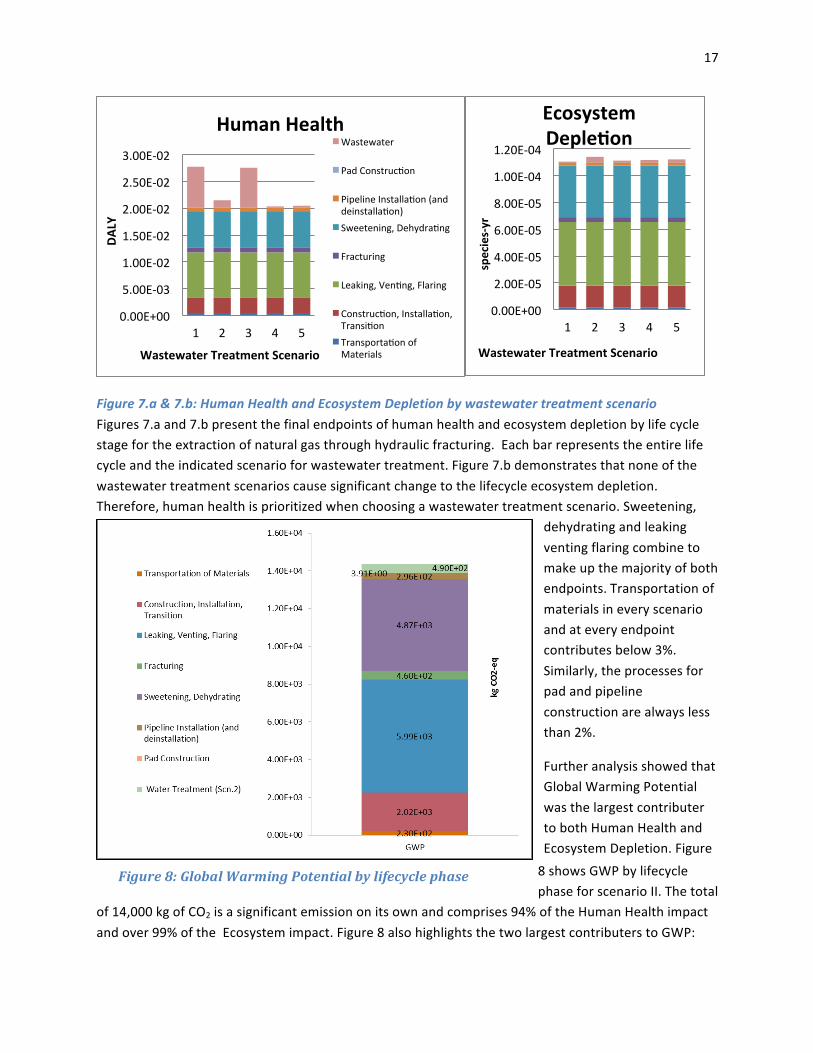
Figure 8: Global Warming Potential by lifecycle phase
Figure 7.a & 7.b: Human Health and Ecosystem Depletion by wastewater treatment scenario Figures 7.a and 7.b present the final endpoints of human health and ecosystem depletion by life cycle stage for the extraction of natural gas through hydraulic fracturing. Each bar represents the entire life cycle and the indicated scenario for wastewater treatment. Figure 7.b demonstrates that none of the wastewater treatment scenarios cause significant change to the lifecycle ecosystem depletion. Therefore, human health is prioritized when choosing a wastewater treatment scenario. Sweetening,
dehydrating and leaking venting flaring combine to make up the majority of both endpoints. Transportation of materials in every scenario and at every endpoint contributes below 3%. Similarly, the processes for pad and pipeline construction are always less than 2%.
Further analysis showed that Global Warming Potential was the largest contributer to both Human Health and Ecosystem Depletion. Figure 8 shows GWP by lifecycle phase for scenario II. The total
of 14,000 kg of CO2 is a significant emission on its own and comprises 94% of the Human Health impact and over 99% of the Ecosystem impact. Figure 8 also highlights the two largest contributers to GWP:
0.00E+00
5.00E-‐03
1.00E-‐02
1.50E-‐02
2.00E-‐02
2.50E-‐02
3.00E-‐02
1 2 3 4 5
DALY
Wastewater Treatment Scenario
Human Health Wastewater
Pad Construcoon
Pipeline Installaoon (and deinstallaoon) Sweetening, Dehydraong
Fracturing
Leaking, Venong, Flaring
Construcoon, Installaoon, Transioon Transportaoon of Materials
0.00E+00
2.00E-‐05
4.00E-‐05
6.00E-‐05
8.00E-‐05
1.00E-‐04
1.20E-‐04
1 2 3 4 5
species-‐yr
Wastewater Treatment Scenario
Ecosystem DepleXon

18
leaking, venting, flaring at 42%, and sweetening, dehydrating at 34% of total GWP. Emissions of methane specifically make up 55-‐57% of GWP for the lifecycle in all scenarios.
Wastewater Scenarios Scenarios I and III, total freshwater dumping and partial freshwater dumping respectively, contribute significantly to human health while scenarios IV and V, total injection and partial treatment/injection, make no contribution to human health. Scenario II, when there is total treatment, makes minor contributions to human health. Thus, environmentally, scenarios IV and V have the smallest potential for environmental detriment; scenarios I and III should be avoided.
6.1 Total Water Use Total freshwater withdrawal over the lifetime of one well is estimated to be 22,000 m3, and per functional unit to be 24.1 m3. Lifecycle phase contribution is show in Table 9. The relative impact of water withdrawal for hydraulic fracturing is largely dependent on regional water stress, which is considered in the discussion.
Table 9: Total Freshwater Withdrawal; modified from Jiang 2014 Freshwater Withdrawal m3
Per FU Per Well
Well Pad Construction 8.9 8,400
Direct Drilling Water Use 0.1 74
Drilling Energy Consumption 0.9 870
Drilling Water Trucking 0.00 0.2
Hydraulic Fracturing 12.0 11300
Fracturing Energy 0.3 250
Fracturing Water Trucking 0.04 36
Well Closure 1.8 1700
Total 24.1 22000 Consumptive water use, shown in Table 10, is water that is lost to the ground, the air or in a product. Scenarios I through III all have the same water use, as all of the water is still accessible within the hydrosphere. The largest difference in water consumption between the scenarios comes from deep well injection. Water that is injected underground leaves the water cycle and deep well injection makes a significant difference in total water consumption.
Table 10: Consumptive water use per functional unit by wastewater treatment scenario Consumptive Water Use per Functional UnIt Consumed water (m3)
Scenario I Scenario II Scenario III Scenario IV Scenario V 8.45 8.45 8.45 23.47 20.47

19
6.2 Site Reclamation Land occupation can be greatly decreased through site reclamation. While reclamation is legally required in the United States, it is unclear if a similar mandate with be made in Thailand. Thus, changes land occupation totals from reclamation are presented separately in Table 11. After the wells are fully installed, reclamation could potentially begin. Roads and well pads may be reduced to 50% of the footprint they had during construction (Anderson, 2011). Later, once the well has been decommissioned, the remainder of the well pad can be restored, leaving only a marker to signify the past well site (Anderson, 2011). The roads can also be restored, or left available to landowners if the landowners elect to do so (Anderson, 2011).
Table 11: Land Use by Drilling Process Land Use By Stage in Drilling Process
m2/Functional Unit Roads Well Pad Pipeline* Total Construction Phase 4.24 3.53E-‐08 826 431 Production Phase 2.12 1.77E-‐08 0 2.12 After Decommissioning 0 0 0 0 * Land reclaimed after five years
7. Discussion
7.1 Economic Analysis
7.1.1 Economic Review of Wastewater Scenarios When companies weigh which treatment system to use, costs are ultimately the largest factor. A projected cost model was replicated from a 2012 analysis on the Marcellus Shale (Karapataki, 2012). This model was adapted to fit Thailand prices and distances; however, the cost of the technologies themselves are extracted directly from the report. Trucking costs were also held constant. The cost of water used was THB 92/ bbl, derived from the Thailand Board of Investment’s cost of doing business in Thailand. High and low estimates for the distance to the disposal well were used, 32 km and 160 km respectively. We estimated a distance of 5 miles to the water source. Evaporation pits were not considered due to small likelihood they would be implemented. The results of the analysis are presented in Table 12.
Table 12 also includes our methodology of quantifying the economic externality of the DALY, using a Willingness to Accept (WTA) figure. This indicates how much a person would require to be compensated per DALY in order to bear the externality, found using survey data and measuring the result as a proportion of the per capita GDP. The lower bound is 40% of the 2013 per capita GDP, and the upper bound is twice the per capita GDP (Thanborncharoensap, 2013). This number was then added to the costs of installing and operating water treatment scenarios to find the total cost of each scenario, in Table 12.

20
Table 12: Economic Evaluation of Wastewater Treatment per Functional Unit
Scenario WTA Direct Cost Total Cost
1 ฿ 628 ฿ 3,140 ฿ 514 ฿ 514 ฿ 1,141 ฿ 3,653
2 ฿ 114 ฿ 569 ฿ 6,616 ฿ 12,729 ฿ 6,730 ฿ 13,298
3 ฿ 613 ฿ 3,064 ฿ 2,034 ฿ 5,090 ฿ 2,646 ฿ 8,154
4 ฿ 22 ฿ 112 ฿ 4,487 ฿ 18,854 ฿ 4,510 ฿ 18,966
5 ฿ 32 ฿ 160 ฿ 2,034 ฿ 5,090 ฿ 2,066 ฿ 5,250
Cost estimates were found for lowest and highest cost scenarios, with variables including operational and capital expenditures, trucking distances, and water costs. Total deep-‐well injection (scenario IV) has a large range due to the variability of disposal well siting. Improperly placed disposal wells may leak into natural gas fields or water sources (Karapataki, 2012). Water scarcity, as covered later, can also influence produced water treatment. Scarcity may raise the water price, incentivizing the reuse of water when possible. While this was not covered in the table above, it is important to mention the possibility of water price volatility. Blending and reuse of returned water without any treatment (scenario IV) also bears risks and only remains feasible while flowback has low TDS concentrations.
The cheapest option is to directly discharge produced water to local watersheds (scenario I), however this carries high risk. A regulatory regime should monitor wastewater disposal and injection wells to ensure the health and safety of local ecosystems. While Thailand may seem like a water-‐rich country, and it is compared to many, its resources are being placed under increasing strain, which is only projected to accelerate (GWP, 2013).
While at first glance the totals cost appears to indicate that scenario I is the most cost-‐effective analysis, there exists a lot of uncertain, as the large gap between the high and low estimates indicates. Since WTA

21
is dependent on GDP, changes in population size and GDP growth can alter the results. Projected total costs, with 4.5% increase in real GDP per year and population projections from the World Bank, is shown in Figure 8 (a tabular version is in the appendix, Table E4). While the cost projections generally move together, scenarios most influenced by WTA rise more quickly.
Figure 8: Projected Costs for Wastewater Treatments, High and Low Estimates
7.1.2 Site Reclamation Reclamation is highly advisable for drilling sites in order to maintain the integrity of areas where drilling has occurred, by preventing invasive weeds and other plant species, preventing excess erosion, and restoring a more pleasing aesthetic to the area (Anderson, 2011). The benefits do not impact gas production however, and therefore do not always occur without regulatory intervention. For this reason it is imperative that Thailand adopt a “Best Management Practice” (BMP) reclamation standard, similar to those in the USA and Canada. A BMP provides baselines for firms to follow and allows regulators to monitor the firms with both sides on the same plain. While not necessarily expensive—costs for a well are estimated to be THB 357,142, an estimation from Alberta, Canada (AER, 2014) that stands as a ballpark estimate for Thailand—regulations must be installed in order to ensure firms use BMP.
Besides waiting to see if a well can regain its profitability, operators also leave wells open so they can avoid decommissioning costs. For our well, costs range from THB 173,814-‐234,285 for a minimal treatment to THB 976,214-‐1,209,557 for the most secure treatment option (AER, 2014). In order to find a compromise between firms seeking low costs and government looking to protect public health and land, the second cost tier estimated by the Alberta Energy Regulator is the most effective, costing THB 282,800-‐364,557 (AER, 2014). Costs may be higher if a well requires extra attention, however they should not be performed below this standard.
With these high cost figures, requiring firms to faithfully execute a thorough well abandonment requires effective, enforceable regulation. The practice of mothballing under the guise of future drilling should

22
also be frowned upon, due to the possible environmental consequences and the small likelihood that wells exhausted in the present will be profitable in the future (Muelenbachs, 2013).
7.1.3 Economic Cost per Well A brief cost comparison is included here to provide a reference for this potential process. In general, unconventional gas extraction is more costly than conventional extraction, but it is also more productive. Conventional recovery factors are 80-‐90%, while unconventional is about 25% less. As well, the greater drilling distance and introduction of the fracturing stage increase costs. However, unconventional wells have a longer productive life and service a larger area. To be profitable, these additional costs must be outweighed by increased resource extraction. Typically, unconventional wells are slightly less profitable than conventional ones (Hefley et al. 2011).
Another large cost comes from leasing of land and permitting. Table 13 shows a cost breakdown of Marcellus shale gas well development. Leasing and permitting is the second most costly step in the process, but it is unclear how expensive it would be in Thailand (Kaiser 2012). Without regulations in place, these costs cannot be accurately determined.
Well cost was estimated by comparing Wolfcamp Shale and Chinese data. Costs in China are currently around $10 million dollars, while Wolfcamp costs are between $8.5 and $9 (Kammerzell 2014; Permian 2014). The huge variability in Chinese cost is due mostly to the scattered nature of the shale formations, as well as the deeper depths of the Chinese shale formations requiring greater water use
(What 2014). Thailand’s shale formations more closely resemble this than the flat plane shale plays of the U.S.
7.2 Water Data Limitations Since fracturing fluid composition varies widely between regions and drilling companies and is often undisclosed proprietary information, it is difficult to predict what chemicals would be used and in what concentrations. Additionally, the geology of shale plays determines the concentration of dissolved solids and chemicals returned to the surface after a fracturing event, as well as the volume of produced water. With no precedent in Thailand to base estimation, US Marcellus Shale water data were used as a loose representation of potential impacts of a fracturing project in the Khorat Basin.
The chemical loadings in flowback and produced water are taken from a Hayes 2009 study of Marcellus produced water from hydraulic fracturing, adapted to expected water use for the idealized Khorat well (see Appendix A). The concentrations found in the Marcellus region, however, are potentially incomparable to those that would be seen in Thailand. For example, the average concentration of
Stage Cost Acquisition and Leasing $2,191,100 Permitting $10,080 Site Preparation $400,000 Vertical drilling $663,280 Horizontal Drilling $1,214,800 Fracturing $2,500,000 Completion $200,000 Production to Gathering $472,500
Total: $7,651,760
Table 13: Cost breakdown by phase for Marcellus Shale. Source: Kaiser 2012

23
barium, the most significantly toxic parameter in the Hayes data, is nearly two orders of magnitude less in the Barnett Shale region in southwestern United States (Coleman, 2011). It is clear that the concentrations of parameters of interest will vary dramatically between regions, and even between well-‐sites.
In addition, emissions from wastewater treatment are based on US conventional practices (NETL Marcellus Shale Water Treatment) which differ from Thailand municipal wastewater management. It is assumed by NETL calculations that 90% of all chemical constituents will be removed by the process (NETL Barnett Shale Water Use); however, some may be preferentially removed, increasing uncertainty in regards to environmental effects and reuse viability.
The emissions associated with deep-‐well injection were derived from an average energy requirement per well in five shale regions in the United States (Clark et al., 2011). It was assumed that the injection pump runs on a diesel generator, and emissions were calculated using EPA engine certification data (USEPA Annual Certification Test Results and Data, 2011).
Depending on differences in geological composition and proximity to aquifers, significant variation will exist in toxicity potentials, produced water volume, and viability of treatment/reuse between regions and subregions of shale. For these reasons, the potential impacts found herein are merely estimates based on the most rigorous data available, applied very generally to what might be observed in the Khorat Basin.
7.3 Water Scarcity As hydraulic fracturing is a water intensive process, the impact it could have on regional water supply needs to be taken into account. Water footprinting is a technique to calculate water use in a region in the context of water availability. The Khorat basin and the underlying shale spans three provinces with highly variable water availability in each.
Table 14. Water Footprint, with and without stress weighting Water Footprint
Watershed WSI Volumetric Footprint (m3)
Stress-‐Weighted Footprint (m3)
Mun (9) 0.927 22000 20394 Chi(8) 0.471 22000 10362 Pasak (12) 0.05 22000 1100
Water scarcity in each region potentially impacts the sourcing of water, and will also likely impact the treatment and disposal of wastewater. Gheewala et al. calculated the water stress index (WSI) of 25 watersheds in Thailand, and the WSI of each
Figure 9: Thailand Water Scarcity. Modified from Gheewala 2014

24
watershed in the Khorat region can be used to find the stress-‐weighted water footprint, shown in Figure 9. The Nam Duk formation lies between the Chi and Pasak and therefore has moderate water stress. However, a large portion of the Khorat basin is in an area of extreme water stress. The relative water footprint of a well in the Mun watershed is twice as high as one in the Chi watershed, and 20 times as high as one in the Pasak watershed. Companies operating wells in the Khorat region should consider the relative impact their wells will have on local water sources and responsibly source and treat their water accordingly.
7.4 Pollution Events All of the above results are for an ideal case of optimum functionality. The focus of environmental activism and social concern over hydraulic fracturing is the potential for oversights and process errors. Leakage of fracturing chemicals and methane through cracks in cement and into groundwater is of greatest concern. The U.S. EPA is currently completing a study on the potential impacts of such leakage, but until its arrival, the frequency and potential consequences of events are difficult to predict. Data on environmental events from Marcellus shale exploration gives some reference. Considine et al. tracked environmental events in the region for many years. Their data shows the first year of fracturing has the highest percentage of events; over 50% of wells experience some polluting environmental event (Considine, 2012). Luckily, only 3% of those events can be categorized as “major.” This data points toward the need for regulation before industrial exploitation.
7.5 Other Energy Sources
7.5.1 Onshore conventional natural gas The environmental impacts of onshore conventional natural gas extraction were compared to those from shale gas. This section highlights the change in global warming potential because it is the midpoint responsible for almost all contribution to human health and ecosystem endpoints. It is assumed that there is little or no difference between pipeline and road construction for conventional onshore and shale well sites. The associated emissions, therefore, are excluded. Additionally, because transportation of materials accounts for less than 3% of GWP, it is assumed that even though the number of truckloads may change, the resultant change in emissions is negligible.
To calculate the emissions from on-‐site processes, the parameters of the NETL data sheets were adjusted for average conventional onshore details. Of the processes: well construction and installation, completion, leaking, venting, and flaring, and on-‐site refining, the only notable deviation was for the well completion. The well completion emission for a shale well is almost 250 times greater than that of a conventional gas well due to the difference in reservoir pressure (EPA, 2011a). As well, the fracturing process—which is shale-‐specific, not performed during conventional gas extraction—contributes approximately 3% to shale GWP. In total, global warming potential from conventional onshore gas is 20% (2380 kg CO2-‐eq) less.
Flowback water is not created in conventional extraction since there is no fracturing stage, but there are still large volumes of produced water with potentially toxic chemicals. However, compounds that are present in produced water would be the same for a hydraulically fractured or conventional well. As

25
shown above, most toxicity effects come from produced water, simply because there are much greater quantities of it. Therefore, toxicity differences are likely to be small and would depend almost entirely upon the fracturing fluid chemistry.
7.5.2 Offshore natural gas The GWP impact of potential hydraulic fracturing in the Khorat Basin is also comparable to offshore natural gas extraction. Offshore emissions were estimated from the Bongkot site in the Gulf of Thailand. To make a fair comparison, this study applied its ReCiPe methodology to the documented emissions from extraction under the control of PTT Exploration and Production Co. (Phumpradab, et al. 2009). The offshore conventional gas GWP impacts were only 2% greater than those of shale gas. (1.31E+04 vs. 1.29E+04 kg CO2e)
7.6 Scaling Up To predict the impacts of a large-‐scale hydraulic fracturing project in Thailand, impacts are scaled accordingly from the functional unit of 50,000 cubic meters to the full resource. There are 617 billion cubic meters of natural gas in place in the Nam Duk shale formation, 153 billion cubic meters of which are recoverable (EIA/ARI 2013). Because the concentration distribution for the shale gas is unavailable, the study must assume the same well productivity value, 47 million cubic meters of natural gas per well, for all potential wells. This gives 940 functional units per well; therefore, there are 3.06 million functional units of recoverable shale gas in the Nam Duk formation. Assuming all recoverable natural gas is extracted, the development would require 3260 wells in the Nam Duk formation. The time scale for
total extraction is difficult to predict; one well produces for 30 years, but the whole field may be active for 100. Table 16 highlights the midpoints and endpoints of greatest concern.
The approximation provided is a sizeable overestimate as it is unlikely that all of the available resource is accessible; and without a detailed map of the gas resource concentration there is no accurate estimate of how much each pocket of shale will produce. A true scaling factor would reduce the current estimate based on the percent of land deemed suitable for hydraulic fracturing. A second reduction could occur if the Thai government restricts drilling in the National Park located over a portion of the shale formation.
Significant Impacts from Scenario II per FU for entire resource Midpoint GWP (kg CO2-‐eq) 1.44E+04 4.41E+10 PMF (kg PM10-‐eq) 2.53E+00 7.75E+06 HET (kg 1,4-‐DB-‐eq) 1.01E+03 3.10E+09 Endpoint Human Health (DALY) 2.51E-‐02 7.69E+04 Ecosystem Depletion (species-‐yr) 1.14E-‐04 3.49E+02
Table 16: Significant Impacts of Large Scale Hydraulic Fracturing

26
Stipulations aside, it can be seen that global warming potential is the most significant environmental concern at 44.1 billion kg CO2 equivalent released at maximum resource recovery. To put this in the context of Thailand’s other greenhouse gas activities, this number is on the same order as (~15% less than) that of the greenhouse gas emissions from the agricultural sector in a single year (51.9 billion kg CO2eq released in the year 2000). In actuality the potential GWP of hydraulic fracturing would increase Thai CO2 emissions from pre 2000 estimates (Muncharoen 2000) by ~20%, a significant portion of Thailand’s total greenhouse gas emissions (Muncharoen 2000).
Thailand’s dependence on foreign (via Myanmar) natural gas leaves it vulnerable to external disruptions and inconsistencies. In 2013, Thailand imported 39.8% of its natural gas, and that number is projected to climb to 90.9% by 2035. If the Khorat basin is exploited, this projection can be lowered to 87.2%. While this may not seem like a drastic reduction, that 3.2% is 74.5 billion THB avoided import purchases per year, for a total of 3.7 trillion THB kept in-‐country over the lifetime of the field.
In addition to the direct economic effects that hydraulic fracturing may have on Thailand’s economy, there are several other indirect economic effects such as hiring law firms, accounting firms, and trucking firms that are necessary to completing the hydraulic fracturing process. There are also induced economic effects that are caused as a result of indirect spending, for example, the goods and services purchased by truck drivers. In a previous Marcellus shale hydraulic fracturing project that took place in 2009, the indirect economic effects in the surrounding area were estimated to be as great as the direct economic effects (Hefley 2011). In terms of Thailand this could mean the creation of thousands of new jobs, as well as a rise in GDP.
8. Conclusions and Recommendations
8.1 Conclusions The impact analysis and interpretation show that global warming potential is the largest impact of hydraulic fracturing. The majority of global warming potential results from emissions during leaking, venting, and flaring as well as sweetening and dehydrating. Impacts from these unit processes can be addressed by specific recommendations to equipment and procedure.
The five wastewater treatment scenarios only show significant variation in the human health endpoint. The degree of impact ranges from almost 30% to under 2% of DALY impact depending on which of the five treatment scenarios is selected. As expected, the smallest impact results under the total wastewater treatment scenario, closely followed by deep well injection. However, economic evaluation shows that total treatment is the most costly scenario. Deep well injection might be a compromise between environmental and economic perspectives, but water scarcity near the Nam Duk formation is a large enough concern to preclude that selection.
Lifecycles stages of site reclamation and well decommissioning are not quantitatively accounted for in LCA because they may or may not happen. The procedures are most difficult to incentivize because, when it is time for the processes to take place, the natural gas resource has already been removed.

27
There is no further profitability. Had the reclamation and decommissioning been quantified in the LCIA, both of these processes would notably reduce the persistence of the environmental impact of fracturing.
Scaling up provides a way to frame our LCA as a more realistic scenario of full resource exploitation. In this case, the process emissions from hydraulic fracturing reach considerable numbers. Still, the huge resource extracted and the extended time period of extraction mean the impact does not vary significantly from conventional fossil fuel sources.
8.2 Recommendations 1. Wastewater Treatment
a) If possible, deep well injection best combines environmental and economic perspectives. Water scarcity and geologic feasibility must be evaluated first.
b) Total treatment is the next best option. While the cost of treating flowback and produced water could be over ten times greater than the cheapest options, decision-‐makers should prioritize human health over economic expense. The economic costs included in the report do not include externalized costs that likely appear in other sectors such as public health.
Note: Blending and reuse, as described in the economic wastewater evaluation, could provide the next best option after deep well injection. However, it cannot be a formal recommendation of this report without environmental quantification.
2. Regulatory Oversight a) A regulatory agency should set standards on hydraulic fracturing in Thailand. The Department of
Mineral Fuels currently governs procurement of oil and natural gas in the country; an additional board should be employed to monitor the development specifically for unconventional natural gas.
b) Given the environmental benefits of site reclamation and well decommissioning, these procedures should be mandated by the board.
Because hydraulic fracturing does not yet take place in Thailand there is a lack of information on the topic. The research group was forced to manipulate data from several geographic locations, geologic types, and technical backgrounds. Though the assumptions were validated, this leaves a wide range of uncertainty. Regardless, the inherent sources of error in the study should not be viewed as faults but rather as markers which can spur more intensive study of the topic. It is our hope that this paper serves as a foundation upon which future researchers will build.
Sources Advanced Resources International and the U.S. Energy Information Administration. “EIA/ARI World
Shale Gas and Shale Oil Resource Assessment” June 2013. Arlington, VA. http://www.adv-‐res.com/pdf/A_EIA_ARI_2013%20World%20Shale%20Gas%20and%20Shale%20Oil%20Resource%20Assessment.pdf. Jan 2014.
Alberta Energy Regulator. “Directive 011: Licensee Liability Rating (LLR) Program: Updated Industry Parameters and Liability Costs.” April 10, 2014. http://www.aer.ca/documents/directives/Directive011_May2014.pdf

28
Anderson, Robert M. “Environmental Assessment of Samson Resources Company’s Field Development Program in and Adjacent to the Hornbuckle Field.” August 2011. http://www.blm.gov/pgdata/etc/medialib/blm/wy/information/NEPA/cfodocs/hornbuckle-‐samson.Par.52155.File.dat/final-‐ea.pdf
Argonne National Laboratory. GREET Life Cycle Model: User Guide. Publication. US Department of Energy, Oct. 2013. Web. 15 May 2014. <https://greet.es.anl.gov/publications>.
Asian Institute of Technology School of Technology, Resources, and Development Thailand. “Energy Security in Thailand.”’ Global Network on Energy for Sustainable Development. January 2010. http://www.gnesd.org/~/media/Sites/GNESD/Publication%20pdfs/Energy%20Security%20Theme/ait%20thailand_energy_security.ashx
Boschee, Pam. "Produced and Flowback Water Recycling and Reuse." Oil and Gas Facilities 2014. Web. Challenges in Reusing Produced Water. Society of Petroleum Engineers, 2011. Web. Clark, C., et al. Life-‐Cycle Analysis of Shale Gas and Natural Gas. Argonne National Laboratory, US
Department of Energy, 2011. Web. Coin News. “US Inflation Calculator.” May 15, 2014.
http://www.usinflationcalculator.com/inflation/consumer-‐price-‐index-‐and-‐annual-‐percent-‐changes-‐from-‐1913-‐to-‐2008/
Coleman, Nancy. “Produced Formation Water Sample Results from Shale Plays.” Natural Gas: Fueling America’s Future. Chesapeake Energy. 2011. <http://water.epa.gov/type/groundwater/uic/class2/hydraulicfracturing/upload/producedformationwatersampleresultsfromshaleplays.pdf>
Considine, Timothy; Watson, Robert; Considine, Nicholas; Martin, John. "Environmental Impacts During Marcellus Shale Gas Drilling: Causes, Impacts, and Remedies." Shale Resources and Society Institute: 18-‐20. Cornell University Cooperative Extension. Web. 9 July 2014.
Corbett, James; Koehler, Horst. “Updated Emissions from ocean shipping” Journal of Geophysical Research: Atmospheres. 29 Oct. 2003. Vol. 108, Issue D20. Web. 27 July 2014.
Davis, Stacy C.; Susan W. Diegel, Robert G. Boundy, and Sheila Moore, 2013 “VEHICLE TECHNOLOGIES MARKET REPORT”, National Technical Information Service, US, 2013
Gheewala, Shabbir; Silalertruksa, Thapat; Nilsalab, Piryapat; Mungkung, Rattanawa; Perret, Sylvain W.; Chaiyawannakarn, Nuttapon. "Water Footprint and Impact of Water Consumption for Food, Feed, Fuel Crops Production in Thailand." Water 6.6 (2014): 1698-‐718. Web.
Global Water Partnership: Southeast Asia. “National Stakeholder Consultations on Water: Supporting the Post-‐2015 Development Agenda.” 2013. http://www.gwp.org/Global/About%20GWP/Publications/Reports/Country%20Consultation%20Reports/Thailand%20Final%20National%20Consultation%20Report.pdf
Gregory, KB, RD Vidic, and DA Dzombak. "Water Management Challenges Associated with the Production of Shale Gas by Hydraulic Fracturing." ELEMENTS 7.3 (2011): 181-‐6. Web.
Hefley, William E.; Seydor, Shaun M.; Bencho, Michelle K.; Chapel, Ian, et al. "The Economic Impact of the Value Chain of a Marcellus Shale Well." Pitt Business Working Papers (2011): n. pag. University of Pittsburgh -‐ Joseph M. Katz Graduate School of Business, Aug. 2011. Web. May 2014.
Hosseini, Ali; Brown, Justin E; Gwynn, Justin P; Dowdall, Mark. "Review of Research on Impacts to Biota of Discharges of Naturally Occurring Radionuclides in Produced Water to the Marine Environment." The Science of the total environment 438 (2012): 325-‐33. Web.
Hayes, Thomas. “Sampling and Analysis of Water Streams Associated with the Development of Marcellus Shale Gas.” Marcellus Shale Coalition. December 31, 2009.
International Association of Oil and Gas Producers (OGP).“Regulators’ Use of Standards: Report No. 426.” March 2010. http://www.ogp.org.uk/pubs/426.pdf

29
International Energy Agency. “Southeast Asia Energy Outlook.” 2013. http://www.iea.org/publications/freepublications/publication/southeastasiaenergyoutlook_weo2013specialreport.pdf
Jiang, Mohan, Chris T. Hendrickson, and Jeanne M. VanBriesen. "Life Cycle Water Consumption and Wastewater Generation Impacts of a Marcellus Shale Gas Well." Environmental science & technology 48.3 (2014): 1911-‐20. Web.
Jiang, Mohan, et al. "Life Cycle Greenhouse Gas Emissions of Marcellus Shale Gas." Environmental Research Letters 6.3 (2011): 034014. Web.
Kaiser, Mark J. "Profitability Assessment of Haynesville Shale Gas Wells." Energy38.1 (2012): 315-‐30. Science Direct. Elsevier, Feb. 2012. Web. June 2014.
Kammerzell, Jaime. "Peering Inside China's Shale Gas Zones." Oilpro. N.p., 12 July 2014. Web. July 2014. http://oilpro.com/post/5728/peering-‐inside-‐china-‐s-‐shale-‐gas-‐zones.
Karapataki, Christina. “Techno-‐Economic Analysis of Water Management Options for Unconventional Natural Gas Developments in the Marcellus Shale.” Massachusetts Institute of Technology. June 2012.
Kruuskraa, Vello. "Case Study #1. Barnett Shale: The Start of the Gas Shale Revolution". Gas Shale Development Workshop Sponsored by U.S. Department of Energy, U.S. Trade and Development Agency. Beijing, China. 2010. Web.
McDermott-‐Levy, Ruth, and Nina Kaktins. "Fracking, the Environment, and Health." AJN, American Journal of Nursing 113: 45-‐51. OvidSP. Web. 9 July 2014.
Milano, Aaron. Milt, Austin. Bell, David. Ander, Katelyn. Grant, Stephanie. The Feasibility and Benefits of Biofules in Thailand. Capstone Report, Institute for the Environment, UNC-‐Chapel Hill, 2008
Muehlenbachs, Lucija. “A Dynamic Model of Cleanup: Estimating Sunk Costs in Oil and Gas Production.” Resources for the Future. December 3, 2013. http://www.rff.org/RFF/Documents/RFF-‐DP-‐12-‐12-‐REV.pdf
Muncharoen, Chiawat. “Thailand's GHG Activities and Future Plan.” Thailand Greenhouse Gas Management Organization. Web. Retrieved July 2014. http://eeas.europa.eu/delegations/thailand/documents/thailande_eu_coop/environment_energy/tgo_ghg_activities_en.pdf
Nair, Nomita; Lui, Jeanettte. “Myanmar’s Energy Woes Could Be Solved by LNG Projects Under Current Plans Studied.” LNG Journal: July/ August 2013. http://www.blplaw.com/download/LNGJournal_JulAug13_p5-‐6_revised.pdf
National Petroleum Council. “Plugging and Abandonment of Oil and Gas Wells.” NPC North American Resource Development Study. September 15, 2011. http://www.npc.org/Prudent_Development-‐Topic_Papers/2-‐25_Well_Plugging_and_Abandonment_Paper.pdf
NETL (2011). NETL Life Cycle Inventory Data – Marcellus Shale Water Treatment, U.S. Department of Energy, National Energy Technology Laboratory. Last Updated: October 2011 (version 01). www.netl.doe.gov/energy-‐analyses (http://www.netl.doe.gov/energy-‐analyses)
NETL (2013). NETL Life Cycle Inventory Data – Natural Gas Well Construction and Installation. U.S. Department of Energy, National Energy Technology Laboratory. Last Updated: February 2013 (version 01). http://www.netl.doe.gov/energy-‐analyses
NETL (2011). NETL Life Cycle Inventory Data – Unit Process: Barnett Shale Natural Gas, Water Use and Water Quality. U.S. Department of Energy, National Energy Technology Laboratory. Last Updated: April 2013 (version 02). www.netl.doe.gov/energy-‐analyses (http://www.netl.doe.gov/energy-‐analyses)

30
NETL (2011). NETL Life Cycle Inventory Data – Unit Process: Dehydration of Natural Gas. U.S. Department of Energy, National Energy Technology Laboratory. Last Updated: April 2011 (version 01). www.netl.doe.gov/energy-‐analyses (http://www.netl.doe.gov/energy-‐analyses)
NETL (2011). NETL Life Cycle Inventory Data – Natural Gas Extraction, Other Venting Fugitives. U.S. Department of Energy, National Energy Technology Laboratory. Last Updated: May 2011 (version 01). www.netl.doe.gov/energy-‐analyses (http://www.netl.doe.gov/energy-‐analyses)
NETL (2011). NETL Life Cycle Inventory Data – Natural Gas Extraction, Pneumatic Venting. U.S. Department of Energy, National Energy Technology Laboratory. Last Updated: March 2011 (version 01). www.netl.doe.gov/energy-‐analyses (http://www.netl.doe.gov/energy-‐analyses)
NETL (2010). NETL Life Cycle Inventory Data – Unit Process: Natural Gas Sweetening. U.S. Department of Energy, National Energy Technology Laboratory. Last Updated: April 2011 (version 02). www.netl.doe.gov/energy-‐analyses (http://www.netl.doe.gov/energy-‐analyses)
NETL (2010). NETL Life Cycle Inventory Data – Unit Process: Natural Gas Well Venting and Flaring. U.S. Department of Energy, National Energy Technology Laboratory. Last Updated: April 2011 (version 01). www.netl.doe.gov/energy-‐analyses (http://www.netl.doe.gov/energy-‐analyses)
NETL (2010). NETL Life Cycle Inventory Data – Unit Process: Onshore Pipeline Installation and Deinstallation. U.S. Department of Energy, National Energy Technology Laboratory. Last Updated: February 2010 (version 01). www.netl.doe.gov/energy-‐analyses
NETL. “Life Cycle Analysis of Natural Gas Extraction and Power Generation.” 29 May, 2014. http://www.netl.doe.gov/File%20Library/Research/Energy%20Analysis/Life%20Cycle%20Analysis/NETL-‐NG-‐Power-‐LCA-‐29May2014.pdf
New York State Department of Environmental Conservation: Division of Mineral Resources. “Supplemental Generic Environmental Impact Statement On The Oil, Gas and Solution Mining Regulatory Program.” September 2009. ftp://ftp.dec.state.ny.us/dmn/download/OGdSGEISFull.pdf
Nicot, Jean-‐Philippe; Reedy, Robert; Costely, Ruth; Huang, Yun. Oil & Gas Water use in Texas: Update to the 2011 Mining Water use Report. Austin, Texas: Bureau of Economic Geology, 2012. Web.
Osborn, Stephen G.; Vengoshb, Avner; Warner, Nathaniel R.; Jackson, Robert B. “Methane contamination of drinking water accompanying gas-‐well drilling and hydraulic fracturing.” Proceedings of the National Academy of Sciences. Vol. 108 no. 20. USA108:8172–8176. May 21, 2011.
"Permian Operators Increasingly Target Shale as New Technology Rejuvenates Legacy Oil Field." Ogj.com. Oil & Gas Journal, 10 June 2014. Web. July 2014.
Phumpradab, Kamalaporn; Gheewala, Shabbir H.; Sagisaka, Masayuki. Life cycle assessment of natural gas power plants in Thailand. 16 May 2009.
Pongthanaisawan, Jakapong, Chumnong Sorapipatana, and Bundit Limmeechokchai. "Road Transport Energy Demand Analysis and Energy Saving Potentials in Thailand." Asian Journal on Energy & Environment 8.1 and 2 (2007): 49-‐72. Web.
PTT. “Transmission and Distribution Pipeline.” 2012. http://www.pttplc.com/EN/About/Business/PTT-‐Owned-‐Business/Gas-‐Unit/Pages/transmission-‐pipeline.aspx. June 2014.
Stockman, Gregory. “Fracking – Evaporation Pools.” Worchester Polytechnic Institute. Web. Updated 2013. <http://www.wpi.edu/Images/CMS/UGP/FrackingEvaporationPools.pdf>
Thailand Board of Investments. ”Utility Costs.” July 2013. http://www.boi.go.th/index.php?page=utility_costs

31
Thanvorncharoensap, Montarat. “Estimating the Willingness to Pay for a Quality-‐Adjusted Life Year in Thailand: Does the Context of Health Gain Matter?” ClinicoEconomics and Outcomes Research: CEOR. 2013; Volume 5. http://www.ncbi.nlm.nih.gov/pmc/articles/PMC3548562/
Unitrove. Natural Gas Density Calculator. Unitrove, n.d. Web. 02 May 2014. <http://unitrove.com/engineering/tools/gas/natural-‐gas-‐density>.
U.S. Department Of Energy. (US DOE a) “Life Cycle Analysis of Natural Gas Extraction and Power Generation.” DOE/NETL-‐2014/1646. Pittsburgh, PA. May 2014. Web. www.netl.doe.gov. June 2014
U.S. Department Of Energy. (US DOE b) “Environmental Impacts of Unconventional Natural Gas Development and Production.” DOE/NETL-‐2014/1651. Pittsburgh, PA. May 2014. Web. www.netl.doe.gov. June 2014
U.S. Energy Information Administration. (US EIA) "Thailand Country Analysis." U.S. Energy Information Administration (EIA). N.p., 23 Feb. 2013. Web. 22 Mar. 2014. <http://www.eia.gov/countries/country-‐data.cfm?fips=th>.
U.S. Environmental Protection Agency (US EPA). “Annual Certification Test Results and Data – Large Engine, 2011 MY.” May 2012. <http://www.epa.gov/otaq/certdata.htm>
U. S. Environmental Protection Agency (EPA a). “Oil and Natural Gas Sector Pneumatic Devices” April 2014. http://www.epa.gov/airquality/oilandgas/pdfs/20140415pneumatic.pdf. July 2014
U. S. Environmental Protection Agency (EPA b). “Study of the Potential Impacts of Hydraulic Fracturing on Drinking Water Sources: Progress Report.” Dec. 2012. www.epa.gov/hfstudy. July 2014
Varabuntoonvit, Viganda, et al. “Life Cycle Inventory Data Development for Greenhouse Gas Emissions Of Thailand’s Electricity Grid Generation Systems.” International Journal Of Emerging Electric Power Systems 9.1 (2008): 1-‐17. Academic Search Complete. Web. 2 July 2014.
Van de Meent D, Huijbregts MAJ, 2005. Evaluating ecotoxicological effect factors based on the Potentially Affected Fraction of species. Environmental Toxicolology and Chemistry 24 (6): 1573-‐1578. http://dx.doi.org/10.1897/04-‐496R.1[1]
Van Zelm R, Huijbregts MAJ, Posthuma L, Wintersen A, Van de Meent D. 2009. Pesticide ecotoxicological effect factors and their uncertainties for freshwater ecosystems. Int J Life Cycle Assess 14.43. http://dx.doi.org/10.1007/s11367-‐008-‐0037-‐5
Vlasopoulos, N.; Memon F.A; Butler, D.; Murphy, R. "Life Cycle Assessment of Wastewater Treatment Technologies Treating Petroleum Process Waters." The Science of the total environment 367.1 (2006): 58-‐70. Web.
Walker, Bethany. "Site Suitability Analysis for Hydraulic Fracturing in the French Creek Watershed Using a GIS." Diss. Allegheny College, 2013. Site Suitability Analysis for Hydraulic Fracturing in the French Creek Watershed Using a GIS. Allegheny College Environmental Science Department, 26 Apr. 2013. Web. May 2014. https://dspace.allegheny.edu/handle/10456/34274.
"What Does China's Second Shale Gas Auction Tell Us?" Norton Rose Fulbright. N.p., Dec. 2012. Web. June 2014.