Embed Size (px)
Citation preview
TE
AC
HE
R
Biology
Copyright © 2011 Laying the Foundation®, Inc., Dallas, Texas. All rights reserved. Visit us online at www.ltftraining.org. 1
Enzyme Activity
Measuring the Effect of Enzyme Concentration
Objective
Students will measure the length of time it takes for various concentrations of catalase-soaked
filter paper disks to float to the top of a cup filled with hydrogen peroxide. Students will perform
dilutions to produce the various enzyme concentrations.
Additionally, students will measure the effect of the competitive inhibitor hydroxylamine
hydrochloride on the catalase reaction.
Level
Biology I
Common Core Standards
TBD
Connections to AP*
AP Biology: I. Molecules and cells A. Chemistry of life 4. Enzymes
*Advanced Placement and AP are registered trademarks of the College Entrance Examination Board. The College
Board was not involved in the production of this product.
Materials
For a class of 28 working in pairs
2 L hydrogen peroxide solution, 1.5%
150 mL hydroxylamine hydrochloride
solution, 10%
beef liver
distilled water
168 filter paper disks
42 small beakers or medicine cups
14 small disposable cups
14 small dispensing cups
14 graduated cylinders, 50 mL
14 syringes, 10 cc
14 marking pens
14 stopwatches
14 forceps
28 aprons
28 pairs of gloves
28 goggles
blender
paper towels
TE
AC
HE
R
Teacher Overview – Enzyme Activity
Copyright © 2011 Laying the Foundation®, Inc., Dallas, Texas. All rights reserved. Visit us online at www.ltftraining.org. 2
Teacher Notes
Prepare the filter disks by using a standard hole punch to punch holes in the filter paper. Be
careful to separate the disks if you punch through multiple layers of filter paper.
Paper towels should be placed at each lab table. Students should be encouraged to wipe any
excess catalase from the disks and forceps in an effort to apply a consistent amount of catalase to
the disk.
Hydrogen Peroxide Solution
Hydrogen peroxide 3% can be purchased locally at any drug store or supermarket. Add equal
volumes of Hydrogen peroxide 3% and distilled water to produce a 1.5% solution. Store this
solution in a brown bottle.
Hydroxylamine Hydrochloride Solution
Hydroxylamine hydrochloride can be purchased from a chemical supply company. Prepare a
10% solution by adding 15 g hydroxylamine hydrochloride to 135 mL distilled water.
Catalase Stock Solution
Place a 1 cm3 slice of beef liver in 500 mL distilled water and liquefy in a blender. Before using
this stock with students, test the catalase solution for activity by placing a few drops into 10 mL
hydrogen peroxide. Bubbles should form immediately. If you do not see bubbles, add more liver
solution.
Once the catalase solution is prepared, it should be refrigerated. Keep it on ice throughout the
day if you need to leave it out in the lab room. The exact concentration and reactivity of the
catalase is not significant for this activity. However, you may need to dilute the stock solution so
that the disks will not immediately float to the surface.
TE
AC
HE
R
Teacher Overview – Enzyme Activity
Copyright © 2011 Laying the Foundation®, Inc., Dallas, Texas. All rights reserved. Visit us online at www.ltftraining.org. 3
Answer Key
Data and Observations
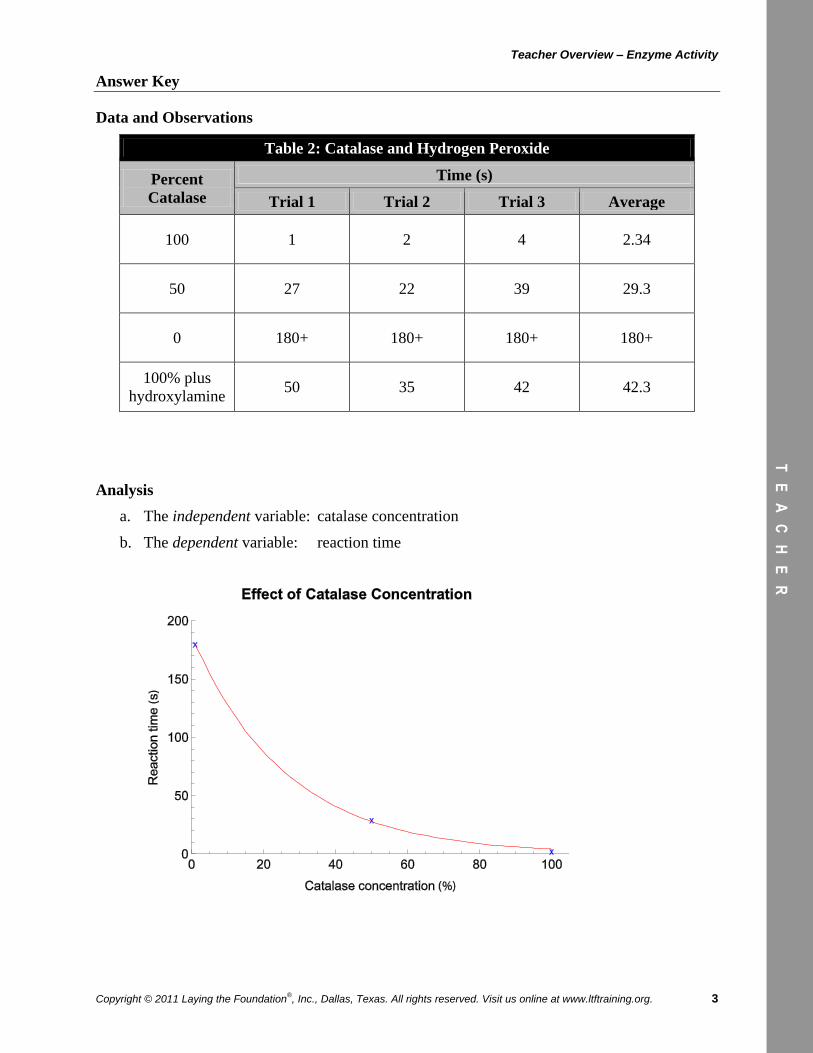
Table 2: Catalase and Hydrogen Peroxide
Percent
Catalase
Time (s)
Trial 1 Trial 2 Trial 3 Average
100 1 2 4 2.34
50 27 22 39 29.3
0 180+ 180+ 180+ 180+
100% plus
hydroxylamine 50 35 42 42.3
Analysis
a. The independent variable: catalase concentration
b. The dependent variable: reaction time
TE
AC
HE
R
Teacher Overview – Enzyme Activity
Copyright © 2011 Laying the Foundation®, Inc., Dallas, Texas. All rights reserved. Visit us online at www.ltftraining.org. 4
Answer Key (continued)
Conclusion Questions
1. The oxygen produced in the reaction accumulates under the disk, causing the disks to float.
2. The 100% solution had the shortest reaction time.
3. The 50% solution had the longest reaction time.
4. Catalase is a protein.
5. It temporarily binds with the hydrogen peroxide, causing it to be broken apart. The hydrogen
peroxide decomposes into water and oxygen gas, hence the bubbles in the liquid.
6. As the concentration of enzyme decreases, the reaction time increases.
7. The disk would not float to the top.
8. Hydroxylamine hydrochloride acts as an inhibitor, slowing the decomposition of hydrogen
peroxide.
9. The reaction time for that trial will be shorter than expected because there are additional
catalase molecules introduced into the solution from the forceps.
Student Activity – Enzyme Activity
Copyright © 2011 Laying the Foundation®, Inc., Dallas, Texas. All rights reserved. Visit us online at www.ltftraining.org. 1
Enzyme Activity
Measuring the Effect of Enzyme Concentration
Enzymes are proteins that serve as biological catalysts in a wide variety of life-sustaining
chemical reactions that take place in cells. As catalysts, enzymes lower the amount of energy
required to make a reaction occur. We call this energy the activation energy. By lowering the
activation energy, enzymes serve to speed up the rate at which the reactions occur.
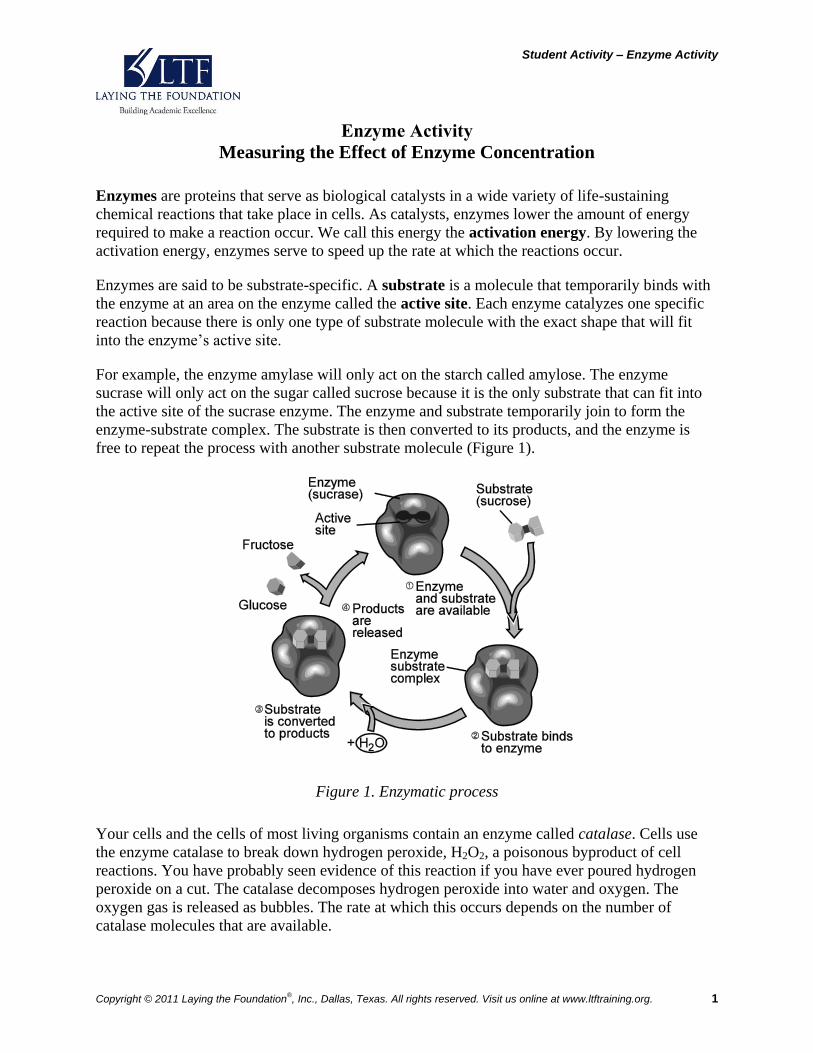
Enzymes are said to be substrate-specific. A substrate is a molecule that temporarily binds with
the enzyme at an area on the enzyme called the active site. Each enzyme catalyzes one specific
reaction because there is only one type of substrate molecule with the exact shape that will fit
into the enzyme’s active site.
For example, the enzyme amylase will only act on the starch called amylose. The enzyme
sucrase will only act on the sugar called sucrose because it is the only substrate that can fit into
the active site of the sucrase enzyme. The enzyme and substrate temporarily join to form the
enzyme-substrate complex. The substrate is then converted to its products, and the enzyme is
free to repeat the process with another substrate molecule (Figure 1).
Figure 1. Enzymatic process
Your cells and the cells of most living organisms contain an enzyme called catalase. Cells use
the enzyme catalase to break down hydrogen peroxide, H2O2, a poisonous byproduct of cell
reactions. You have probably seen evidence of this reaction if you have ever poured hydrogen
peroxide on a cut. The catalase decomposes hydrogen peroxide into water and oxygen. The
oxygen gas is released as bubbles. The rate at which this occurs depends on the number of
catalase molecules that are available.
Student Activity – Enzyme Activity
Copyright © 2011 Laying the Foundation®, Inc., Dallas, Texas. All rights reserved. Visit us online at www.ltftraining.org. 2
The activity of enzymes is controlled in many ways. One of the simplest ways is through the
action of inhibitors. Inhibitors compete with the substrate molecule for the active site of the
enzyme. If the inhibitor gets to the active site before the substrate, it will block the substrate from
binding and prevent the reaction from taking place. Hydroxylamine hydrochloride,
(NH2OH)HCl, is a known competitive inhibitor of the catalase/hydrogen peroxide reaction.
Purpose
In this activity, you will measure the time it takes for a disk of filter paper soaked with varying
concentrations of the enzyme catalase to float to the top of a cup filled with hydrogen peroxide.
The disk will float as oxygen produced in the catalase/hydrogen peroxide reaction accumulates
under the paper disk.
Additionally, you will measure the effect of hydroxylamine hydrochloride on the catalase
reaction.
Materials
hydrogen peroxide solution, 1.5%
hydroxylamine hydrochloride solution, 10%
catalase stock solution
distilled water
12 filter paper disks
3 small beakers or medicine cups
small disposable cup
graduated cylinders, 50 mL
syringe, 10 cc
marking pens
stopwatch
forceps
aprons
gloves
goggles
blender
paper towels
Safety Alert!
Wear goggles at all times.
Do not eat or drink in the laboratory.
Avoid unnecessary contact with chemicals.
Student Activity – Enzyme Activity
Copyright © 2011 Laying the Foundation®, Inc., Dallas, Texas. All rights reserved. Visit us online at www.ltftraining.org. 3
Procedure
Part I: The Effect of Catalase Concentration on the Decomposition of Hydrogen Peroxide
1. In the space provided on your student answer page, write an “if-then” statement that answers
the following question: What effect does increasing the concentration of catalase have on the
rate of decomposition of hydrogen peroxide?
2. Using small beakers or cups, prepare the catalase solutions as listed in Table 1. Use a
marking pencil to label the enzyme solutions as 100%, 50%, and 0%.
Table 1: Catalase Solutions
Final Quantity
Needed
Concentration of
Final Solution
Quantity of
Catalase (mL)
Quantity of
Water (mL)
10 mL 100% 10 0
10 mL 50% 5 5
10 mL 0% 0 10
3. Pour 40 mL of 1.5% hydrogen peroxide into a clean cup or beaker.
4. Using forceps, pick up one filter paper disk and submerge it in the 100% enzyme solution for
5 seconds. Do not let go of the disk.
5. Remove the disk from the solution and use a paper towel to blot it dry for 5 seconds. Be sure
to also dry the tips of the forceps.
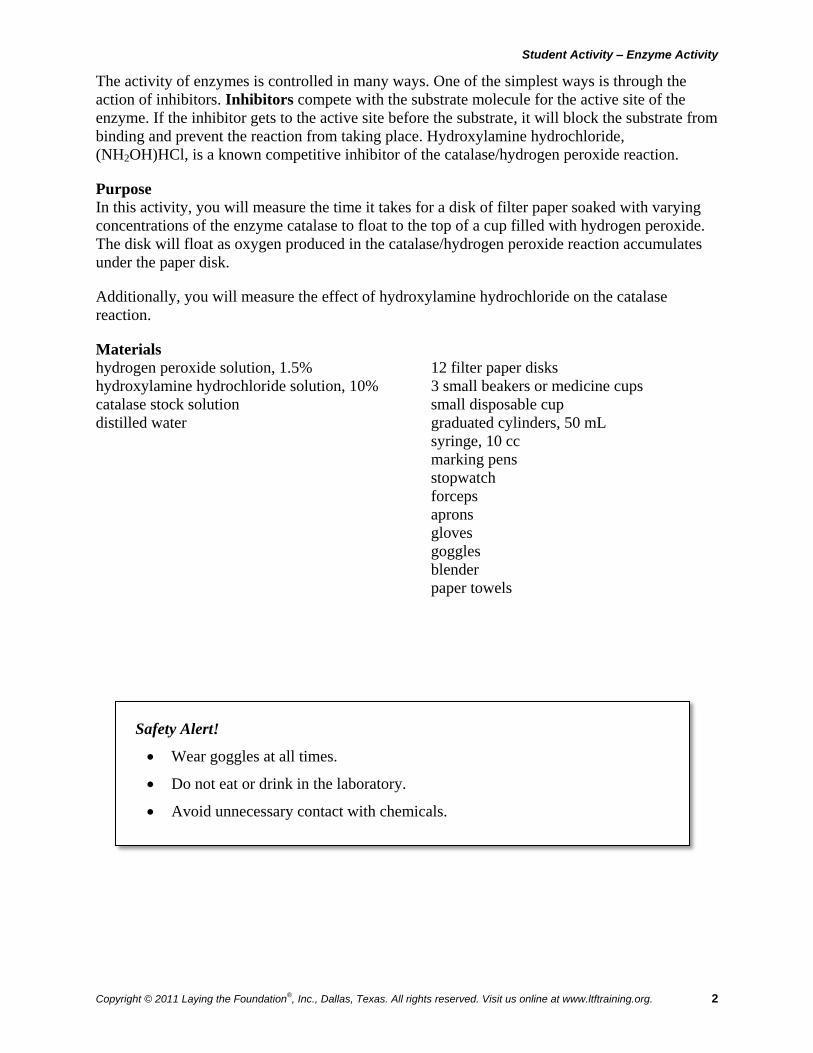
6. Use forceps to place the disk on the bottom of the cup with the hydrogen peroxide (Figure 2).
Begin timing as soon as the disk touches the surface of the hydrogen peroxide.
Figure 2. Disk at bottom of cup
Student Activity – Enzyme Activity
Copyright © 2011 Laying the Foundation®, Inc., Dallas, Texas. All rights reserved. Visit us online at www.ltftraining.org. 4
Procedure (continued)
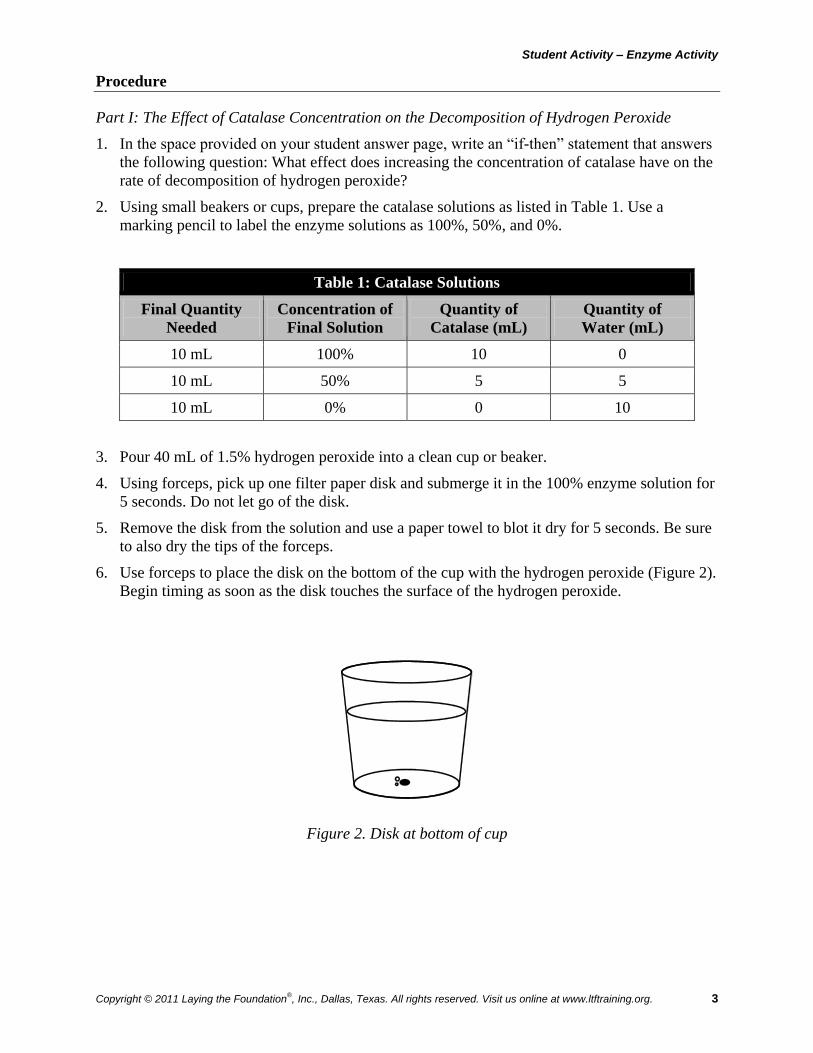
7. Record the time required for the disk to float to the surface of the hydrogen peroxide
(Figure 3) in Table 2.
Figure 3. Disk floating to surface
8. Conduct two additional trials with the 100% enzyme solution. Use a different filter paper
disk for each trial. Use a fresh 40 mL of hydrogen peroxide for each trial.
9. Repeat Steps 3 to 8 for the 50% and 0% catalase solutions. Remember to use clean filter
paper each time you test. Record the times for the trials of the remaining solutions in the
appropriate columns of Table 2. Note: If any disk takes longer than 180 seconds (3 minutes)
to float to the surface, simply record this time as “180+” in the data table.
10. Prepare a line graph of the average reaction time it takes for the disk to float to the top versus
the percent concentration of enzyme.
Part II: The Effect of Hydroxylamine Hydrochloride on Catalase
1. Pour 10 mL of the hydroxylamine hydrochloride into a clean cup or beaker. Pour 40 mL of
1.5% hydrogen peroxide into another clean cup or beaker.
2. Using forceps, pick up one filter paper disk and submerge it in the 100% enzyme solution for
5 seconds. Do not let go of the disk.
3. Remove the disk from the solution and use a paper towel to blot it dry for 5 seconds. Be sure
to also dry the tips of the forceps.
4. Dip the disk with catalase into the hydroxylamine hydrochloride solution for 5 seconds.
Remove the disk from the solution and blot it and the forceps dry using a paper towel.
5. Use forceps to place the disk on the bottom of the cup with the hydrogen peroxide. Begin
timing as soon as the disk touches the surface of the hydrogen peroxide.
6. Record the time required for the disk to float to the surface of the hydrogen peroxide in
Table 2.
7. Repeat Steps 2 to 6 for a total of three trials with hydroxylamine hydrochloride. Remember
to use clean filter paper and a fresh 40 mL of hydrogen peroxide for each trial. Record the
times for the three trials of the remaining solutions in the appropriate columns of Table 2.
Student Activity – Enzyme Activity
Copyright © 2011 Laying the Foundation®, Inc., Dallas, Texas. All rights reserved. Visit us online at www.ltftraining.org. 5
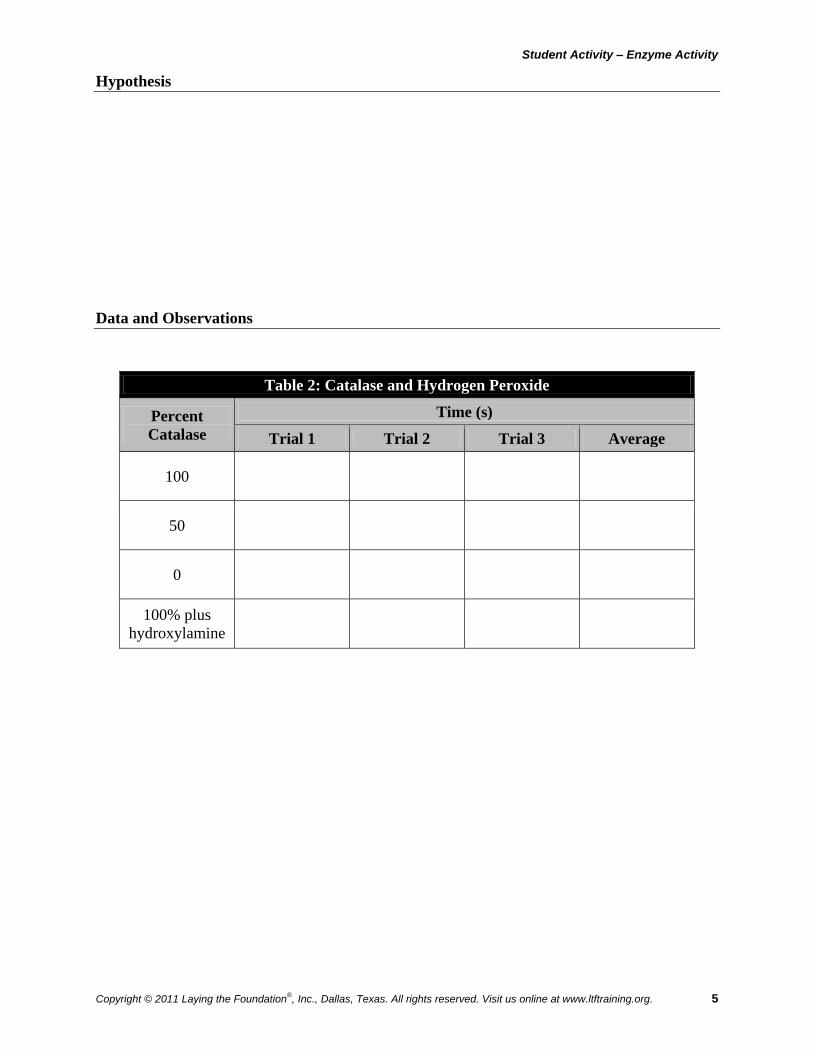
Hypothesis
Data and Observations
Table 2: Catalase and Hydrogen Peroxide
Percent
Catalase
Time (s)
Trial 1 Trial 2 Trial 3 Average
100
50
0
100% plus
hydroxylamine
Student Activity – Enzyme Activity
Copyright © 2011 Laying the Foundation®, Inc., Dallas, Texas. All rights reserved. Visit us online at www.ltftraining.org. 6
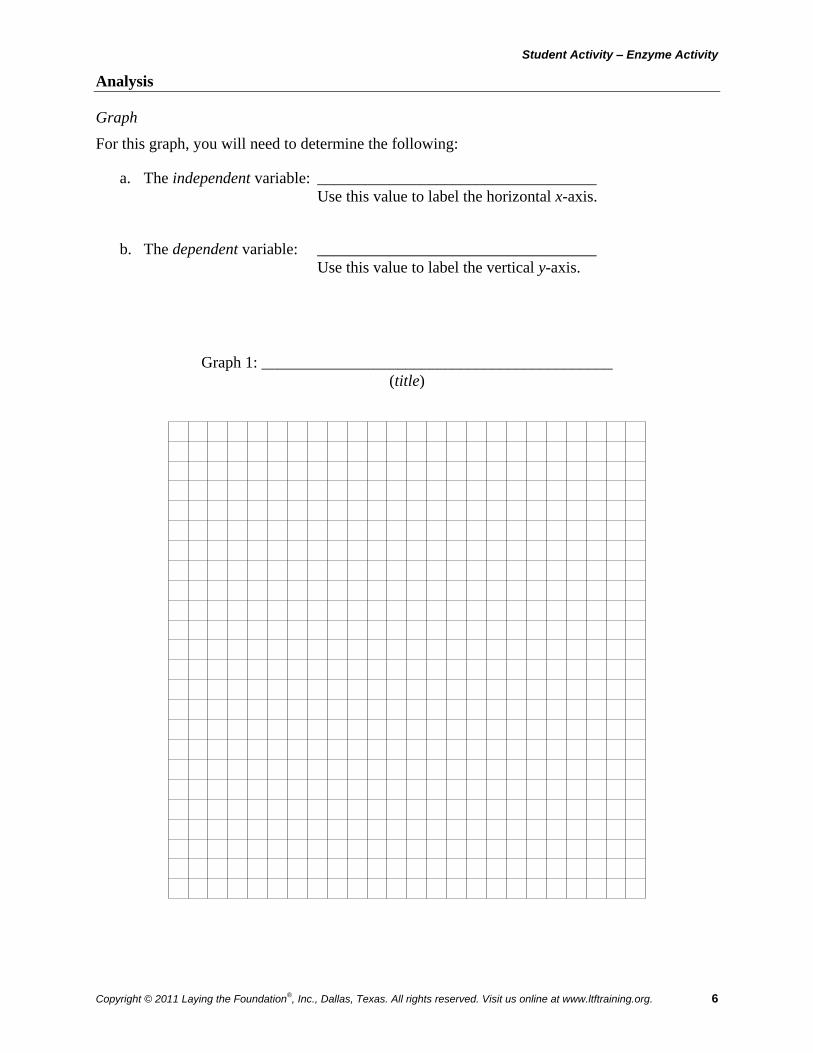
Analysis
Graph
For this graph, you will need to determine the following:
a. The independent variable: ___________________________________
Use this value to label the horizontal x-axis.
b. The dependent variable: ___________________________________
Use this value to label the vertical y-axis.
Graph 1: ____________________________________________
(title)
Student Activity – Enzyme Activity
Copyright © 2011 Laying the Foundation®, Inc., Dallas, Texas. All rights reserved. Visit us online at www.ltftraining.org. 7
Conclusion Questions
1. What causes the disks to float to the surface?
2. Which concentration of catalase had the shortest reaction time?
3. Which concentration of catalase had the longest reaction time?
4. What type of biological molecule is catalase?
5. What does catalase do to hydrogen peroxide?
6. Based on the graph and overall slope of the line, what can you conclude about the effect of
enzyme concentration on reaction time?
Student Activity – Enzyme Activity
Copyright © 2011 Laying the Foundation®, Inc., Dallas, Texas. All rights reserved. Visit us online at www.ltftraining.org. 8
Conclusion Questions (continued)
7. How would the results be different if you repeated Part I of this experiment using water
instead of hydrogen peroxide?
8. Describe the effect hydroxylamine hydrochloride has on the reaction time.
9. A student forgets to dry the tip of the forceps after dipping the disk in catalase solution. What
effect will this error have on the reaction time for that trial? Explain.


![Enzyme Concentration- [Lactase] and Lactose](https://img.pdfslide.net/doc/110x75/5515cbbc497959f81d8b4f2d/enzyme-concentration-lactase-and-lactose.jpg)