Embed Size (px)
Citation preview

EOS at SPPSAdrian L Cavalieri, David M Fritz, SooHeyong Lee,
Philip H Bucksbaum, David A Reis
(FOCUS Center, University of Michigan)
Holger Schlarb (DESY)
Patrick Krejcik, Jerome Hastings (SLAC/SSRL)

Timing for Ultrafast X-ray Science
• SPPS is an R&D facility for the Linac Coherent Light Source (LCLS)
and is a test bed for future beam diagnostics
SLAC LinacSLAC Linac
1 GeV1 GeV 20-50 GeV20-50 GeV
SPPSSPPSRTLRTL
9 ps9 ps 0.4 ps0.4 ps<100 fs<100 fs
50 ps50 ps
3km
• Electron bunches at SPPS are as short as 80fs FWHM, comparable
to the bunches that will drive future XFELs
– EOS delivers shot-to-shot bunch length to machine operators
• 2m undulator after bunch compression delivers 80fs FWHM hard
x-ray pulses
– EOS delivers shot-to-shot arrival time to users

EOS and “Pump-Probe”
system response
0S2S3S4S 6S7S 5S8S9S1S time
impulse
• Electro-Optic Sampling (EOS) delivers arrival time to users
– Pump-Probe experiments now possible at XFELs
– Machine jitter exploited to sample time-dependent phenomena
• Typical time resolved experiment utilizes intrinsic synchronization
between pump excitation and probe

Geography
EOS timing applicable
IF optical path lengths
remain constant
osc amp
EOS
X
undulator
t
t

Electro-Optic Sampling
x
• Crystal is affected by applied DC electric field
– Principle axes of crystal system are modified
– Index of refraction along these axes changes
• Probe laser field is decomposed in primed coordinate system
• Phase shift between components can be detected
•
y
DCE
x
y
x
ylaserE
DCE

Electric Field of 30GeV Electron Bunch
• Approximate field assuming:
–
– Steady-state
•
•
• Accurate calculation requires
numerical analysis
• Crystal is in a 6” 6-way vacuum
cross so approximation is good
12
80
z m RMS
fs FWHM
rE
zr
5 400 /peakE mm MV m
3.4nC
02r
z
qE
r

k
k
k
k
k
28.5GeV 28.5GeV 28.5GeV 28.5GeV 28.5GeV
EO Crystal
Spatially Resolved Electro-Optic Sampling (EOS)
k
k
k
k
k
k
k
k
k
k
Laser probe later relative to electron bunchLaser probe earlier relative to electron bunch• Spatially resolved EOS can deliver measurements with high enough
resolution to capture electron bunches at SPPS
– technique pioneered using table-top systems by Heinz et. al. in 2000
– spectrally resolved EOS cannot be used due to fundamental bandwidth
limitation
• Resolution limit of technique dominated by EO crystal thickness
input chirped

EO Crystal
Spatially Resolved EOS
v
v
k
k
k
v
(long bunch)

polarizing beamsplitter
laserk
s polarizedk
p polarizedk
time
; space
Arrival time and duration of bunch is encoded on profile of laser beam
Spatially Resolved EOS
time
time
integrated intensity
integrated intensity

SPPS Facility
AcceleratorTunnel Laser Room
&X-ray Hutch
LINAC

Effect of Long Pulse Probe Laser
• Probe pulse longer than e-bunch
– EO signal will be broadened
– If probe pulse shape is very well
known, we should be able to
deconvolve e-bunch shape
– Signal to background problems
introduced
• Probe pulse uncompressed
(~10’s of picoseconds or longer)
– Measurement will yield no
spatially dependent signal
v
k

Ultrafast Laser Transport
2
2
2

Pulse Shaper
• 640-pixel SLM can introduce arbitrary dispersion
• Genetic Algorithm used to find configuration that minimizes total
transport dispersion
• frequency doubled throughput provides feedback
• nearly transform limited pulse delivered when combined with grating
pair to compensate for GVD
SLM640-pixel
f f f f

Ultrafast Laser Transport: 3rd Order Correction
• Data taken with a 110m spool of test fiber at UofM with 128-pixel SLM
• Spectral width of transmitted pulse is ~10nm
Without Pulse Shaper With Pulse Shaper
FWHM 160fsFWHM 600fs

Transport Results
• Autocorrelation used for
measurement of laser pulse
arriving at EO chamber
• Find pulse is not transform limited
• Improvement can be made in
chromatic aberration in pulse
shaper
• Fixed phase mask can be used to
increase capacity of pulse shaper
135fs (FWHM)
PMT
BBO
2
Schematic

polarizing beamsplitter
laserk
s polarizedk
p polarizedk
time
; space
Spatially Resolved EOS Data
time
time
integrated intensity
integrated intensity

Single-Shot Data acquired with ZnTe
~ 300 fs
200 m
Single-Shotw/ high frequency filtering
iCC
D counts
time (ps)
color representation
Timing Jitter Data(20 Successive Shots)
time (ps)
shot

Effect of accelerator parameters on EO signal:Observation of resolution limit
• Changing Linac Phase detunes electron bunch compressor

Estimate Frequency Response Cut-Off
EO crystal sign of effect accumulated effect
fs
offwalkoffcut
176 pulse THzGaussian for
crystal) m200(for THz5.2-
1-

EO crystal imaging
2 f 2 f
fibe
r cou
ple
• EO signal/feature small ~50um extent
• Vacuum ports and other optics reduce angular resolution
• Object does not lie in a plane perpendicular to optical axis
• High resolution is required over a large depth of field (for adequate single-shot window)
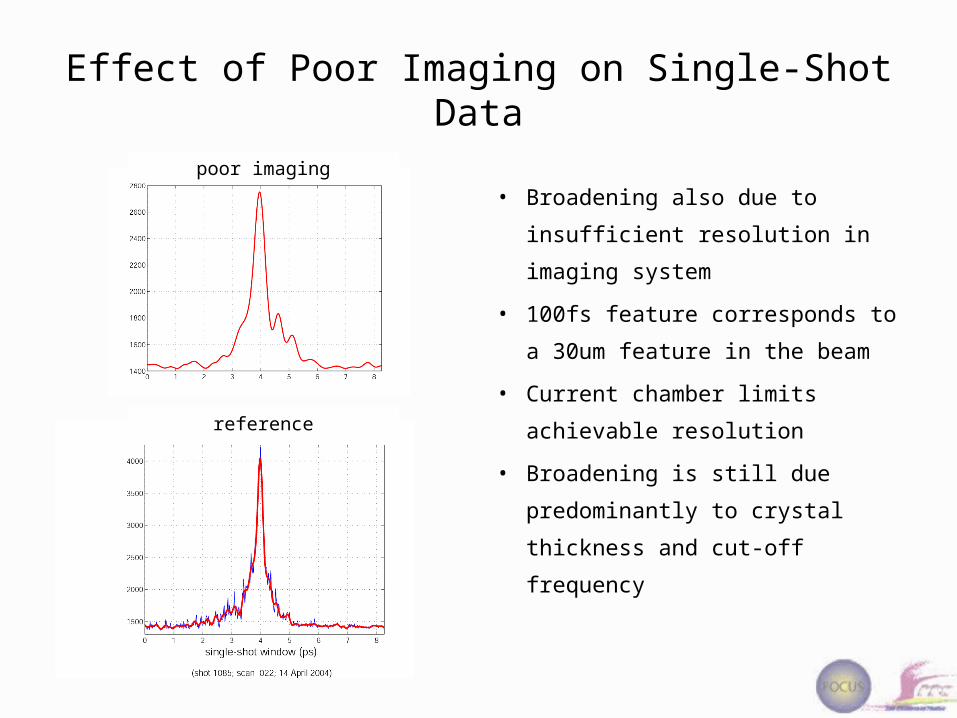
Effect of Poor Imaging on Single-Shot Data
• Broadening also due to
insufficient resolution in
imaging system
• 100fs feature corresponds to a
30um feature in the beam
• Current chamber limits
achievable resolution
• Broadening is still due
predominantly to crystal
thickness and cut-off frequency
poor imaging
reference

Imaging Solution
45 3015
• Depth of field fixed by single-shot window
• Rate of time-sweep fixed by incident angle
• Resolution requirement of imaging system fixed by incident angle

New EO Chamber
• Accepts 15, 30, and 45 degree
angle of incidence
• Thick and thin crystal on
actuator, user chooses which
crystal is used for the EOS
• No internal optics
• Shorter path length to exit port
(use shorter focal length
imaging optics)

E-beam/X-rays
Pump Laser(Experiment)
EOS
The Flowchart
RF
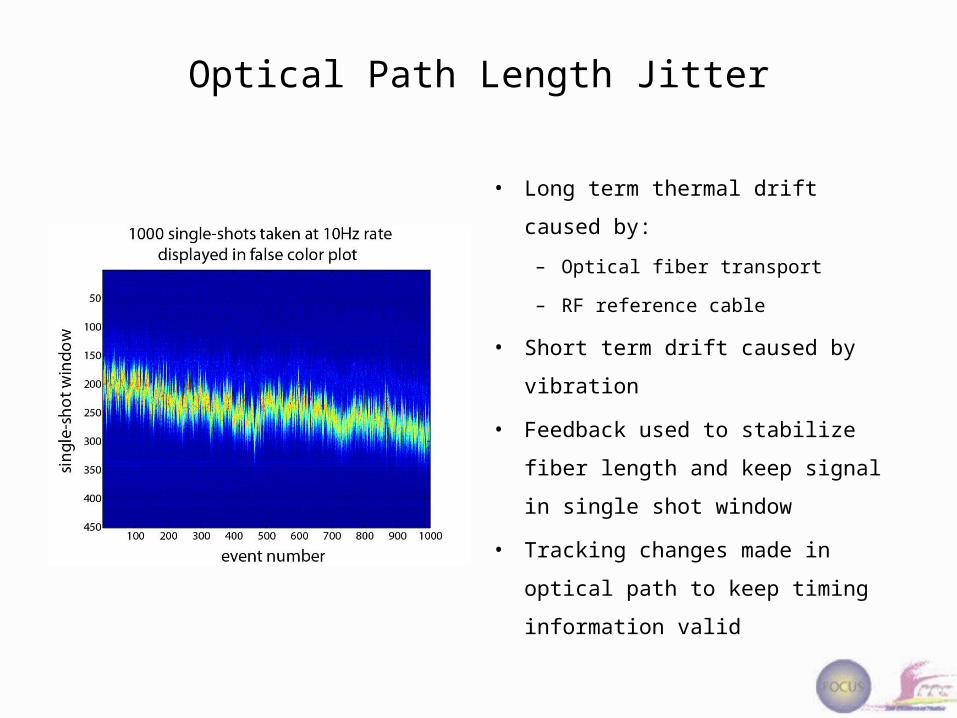
Optical Path Length Jitter
• Long term thermal drift caused by:
– Optical fiber transport
– RF reference cable
• Short term drift caused by vibration
• Feedback used to stabilize fiber
length and keep signal in single
shot window
• Tracking changes made in optical
path to keep timing information
valid

EO/Streak Camera Correlation(no fiber stabilization)
A. MacPhee, LBL
• 5000 shots recorded at 10Hz rate
• EO arrival time accuracy: <30fs
• Streak Camera arrival time accuracy: ~150fs
• Correlation between measurements is .707

EO/Melting Correlation(no fiber stabilization)
• 30 shots recorded at 1Hz rate
• EO arrival time accuracy: <30fs
• Melting arrival time accuracy: ~50fs
• Agreement between two measurements is 60fs RMS

1010

Is the measurement plausible?
Red line: bunch charge distribution
– sum of two gaussians, one with
100% amplitude, 80fs width; the
other 20% amplitude, 1ps width
• Instrument function estimated to
be gaussian - 200fs width
– combine laser pusle duration with
imaging imperfections
– returns narrow feature in data
• Blue line is the convolution of the
two – corresponds to expected
EO signal
K. Gaffney
time (fs)
Expected EO signal

Is this measurement plausible?
• Good agreement between test
function and the experimental data
• Instrument function – reasonable
estimate that returns the sharp
central feature
• Choice for charge distribution
convolved with instrument function
matches data, but does not match
simulation
Single-shot data
w/ convolution function
Red line: real single-shot data
Blue line: convolution function

Synchronization Using RF Reference
170 fs rms170 fs rms