Embed Size (px)
Citation preview

EPA’s Energy Use Assessment Tool User’s Guide Version 2.0

Office of Water (4606M) December 2012
www.epa.gov/safewater

Energy Use Assessment Tool User’s Guide iii
Contents 1 Introduction .................................................................................................................................................................... 1
1.1 Overview of EPA’s Energy Use Assessment Tool.................................................................................................. 1 1.2 Benefits of Using EUAT ......................................................................................................................................... 1 1.3 Data Requirement for EUAT .................................................................................................................................. 2 1.4 About This Guide .................................................................................................................................................... 2 1.5 Points of Contact ..................................................................................................................................................... 3
2 Setup Instructions ........................................................................................................................................................... 4 2.1 Saving a Copy of the Tool ....................................................................................................................................... 4
2.1.1 Saving the .xls EUAT ...................................................................................................................................... 4 2.1.1.1 ‘Save As’ in Excel 2003 ............................................................................................................................ 4 2.1.1.2 ‘Save As’ in Excel 2007 (Compatibility Mode) ........................................................................................ 5
2.1.2 Saving the .xlsm EUAT ................................................................................................................................... 7 2.1.2.1 ‘Save As’ in Excel 2007 ............................................................................................................................ 7 2.1.2.2 ‘Save As’ in Excel 2010 ............................................................................................................................ 9
2.2 Enabling Macros ................................................................................................................................................... 11 2.3 Changing Security Levels ..................................................................................................................................... 12
2.3.1 Changing Security Levels in Excel 2003 ....................................................................................................... 12 2.3.2 Changing Security Levels in Excel 2007 & 2010 .......................................................................................... 14
3 Getting Started on the Instructions Tab ........................................................................................................................ 17 3.1 Instructions Tab ..................................................................................................................................................... 17
4 General Information Tab .............................................................................................................................................. 19 4.1 Navigation Buttons ................................................................................................................................................ 19
4.1.1 Select/Switch Template .................................................................................................................................. 19 4.1.2 Building Data ................................................................................................................................................. 19 4.1.3 Plant Energy Usage ........................................................................................................................................ 20 4.1.4 Reset Data ...................................................................................................................................................... 20 4.1.5 Save ................................................................................................................................................................ 20
4.2 Entering Background Information ......................................................................................................................... 20 4.3 Entering Utility Bill Information ........................................................................................................................... 21
4.3.1 Use and Cost Data .......................................................................................................................................... 21 4.3.2 Entering Alternative and Other Utility Types ................................................................................................ 22 4.3.3 Utility Rates ................................................................................................................................................... 23 4.3.4 Treatment Volume ......................................................................................................................................... 23 4.3.5 Entering Cogeneration Data ........................................................................................................................... 24
5 Building Data Tab ........................................................................................................................................................ 25 5.1 Navigation Buttons ................................................................................................................................................ 25

Energy Use Assessment Tool User’s Guide iv
5.1.1 Save and Continue.......................................................................................................................................... 25 5.1.2 Reset Data ...................................................................................................................................................... 25 5.1.3 Return to General Info ................................................................................................................................... 25 5.1.4 Set # of Buildings ........................................................................................................................................... 26 5.1.5 Set # of Rooms ............................................................................................................................................... 27
5.2 Total Plant Building Information .......................................................................................................................... 27 5.3 Building Information ............................................................................................................................................. 27 5.4 Lighting Fixtures ................................................................................................................................................... 28 5.5 HVAC/Non-Process Units .................................................................................................................................... 30
6 WTP/WWTP Energy Usage Tab .................................................................................................................................. 32 6.1 HVAC and Lighting Totals ................................................................................................................................... 32 6.2 Plant Equipment Electrical Energy Inventory ....................................................................................................... 32
6.2.1 Table Entry Instructions ................................................................................................................................. 33 6.2.2 Entry Results .................................................................................................................................................. 35 6.2.3 Top Electrical Energy Use Systems ............................................................................................................... 35 6.2.4 Next Steps ...................................................................................................................................................... 37
7 Summary Report Tab ................................................................................................................................................... 39 7.1 Action Buttons....................................................................................................................................................... 39
7.1.1 Print Summary Report .................................................................................................................................... 39 7.1.2 Refresh Summary Report ............................................................................................................................... 39
7.2 Overview of Baseline Energy Use ........................................................................................................................ 39 7.3 Graphical Summaries for the Latest 12 Months .................................................................................................... 41
7.3.1 The Utility Cost Summary Graph .................................................................................................................. 41 7.3.2 The Electric Use vs. Water Treated Graph ..................................................................................................... 43 7.3.3 The Electric Use vs. Cost Graph .................................................................................................................... 44 7.3.4 The Electric Utilization vs. Water Treated Graph .......................................................................................... 45
7.4 Distribution of Electrical Energy Use and Cost by Major Process ........................................................................ 46 7.5 Equipment Inventory ............................................................................................................................................. 46 7.6 Energy Trends for Over the Last 5 years ............................................................................................................... 48
7.6.1 Electric Use vs. Water Treated Graph ............................................................................................................ 48 7.6.2 Electric Use vs. Cost Graph ........................................................................................................................... 49 7.6.3 Natural Gas Use vs. Cost Graph ..................................................................................................................... 50 7.6.4 Utility Cost Summary Graph .......................................................................................................................... 51
Appendix A. Calculations............................................................................................................................................. 53 General Information Tab ................................................................................................................................................. 53 Building Data Tab ........................................................................................................................................................... 53 WTP/WWTP Energy Usage Tab ..................................................................................................................................... 55 Summary Report Tab ....................................................................................................................................................... 55
Appendix B. Unit Definitions and Conversions ........................................................................................................... 56 Appendix C. Acronyms and Abbreviations .................................................................................................................. 57 Appendix D. Troubleshooting Guide ........................................................................................................................... 58 Appendix E. Cheat Sheet ............................................................................................................................................. 61

Energy Use Assessment Tool User’s Guide v
Figures Figure 2.2.1. Security warning medium. ................................................................................................................................................................................................... 11 Figure 2.2.2. Security warning high. ......................................................................................................................................................................................................... 12 Figure 2.3.1a. Select security option in Excel 2003. ................................................................................................................................................................................ 13 Figure 2.3.2a. Select security option in Excel 2007. ................................................................................................................................................................................ 15 Figure 3.1.1. Keys used throughout the tool. ............................................................................................................................................................................................ 17 Figure 3.1.2. The ‘Begin Assessment’ button on the Instructions tab. ...................................................................................................................................................... 18 Figure 3.1.3. Tabs at the bottom of the tool. .............................................................................................................................................................................................. 18 Figure 3.1.4. Select the template type. ....................................................................................................................................................................................................... 18 Figure 4.1. General Information tab buttons. ............................................................................................................................................................................................. 19 Figure 4.2. Background information. ......................................................................................................................................................................................................... 21 Figure 4.3.1. Utility bill data. .................................................................................................................................................................................................................... 22 Figure 4.3.4a. Electrical energy utilization summary. .............................................................................................................................................................................. 23 Figure 4.3.4b. Treatment Volume Unit dropdown list. .............................................................................................................................................................................. 24 Figure 5.1. Building Data tab buttons. ....................................................................................................................................................................................................... 25 Figure 6.1. HVAC and lighting totals. ....................................................................................................................................................................................................... 32 Figure 6.2.1a. Plant equipment inventory. ................................................................................................................................................................................................ 34 Figure 6.2.1b. Plant system type dropdown list. Figure 6.2.1c. Plant equipment type dropdown list. ................................................................................................................................................................................. 35 Figure 6.2.3. Top 5 electrical energy use systems. .................................................................................................................................................................................... 36 Figure 7.1. Summary Report heading ........................................................................................................................................................................................................ 39 Figure 7.2. Overview of baseline energy use ............................................................................................................................................................................................. 40

Energy Use Assessment Tool User’s Guide 1
1 Introduction
1.1 Overview of EPA’s Energy Use Assessment Tool The U.S. Environmental Protection Agency (EPA) developed an energy use assessment tool to allow small and medium sized water and wastewater systems to self-assess their baseline energy consumption and costs, and to identify areas for improved energy efficiency and operational savings. The tool provides the first step in establishing a baseline of energy consumption and use by collecting energy utility data and conducting a utility bill analysis.
EPA’s Energy Use Assessment Tool (EUAT) is free software that makes energy auditing more feasible for small to medium drinking water and wastewater systems. It is an Excel worksheet so no Internet connection is needed and the software requirements are minimal. The tool was designed and developed with input and suggestions from experts in energy auditing.
The tool comprises five tabs:
• Instructions
• General Information
• Building Data
• WTP (Water Treatment Plant) / WWTP (Wastewater Treatment Plant) Energy Usage Data
• Summary Report.
1.2 Benefits of Using EUAT EUAT can be a key step in reducing the energy usage at a small or medium sized system. The tool creates a baseline which shows the user an organized overall look at their facility’s energy usage. The tool creates a summary report that shows the energy trends as compared to the amount of water treated. This can reveal potential energy waste or inefficiencies. The tool allows entry of up to five years of data. It is recommended to look at more than just 12 months of data to develop more reliable trends. The tool organizes the last five years of utility bills, giving a clear look at how use and costs are trending. Use trends can show performance of existing or new equipment. The tool also details lighting and HVAC in each building. Comparison of lighting density may highlight areas of energy inefficiency. Compiling the data of motor sizes, efficiencies and operating schedules into one place gives systems the ability to quickly assess their energy management of each area of the plant and determine whether it is most appropriate to replace equipment with newer technology or change specific operational features of particular equipment.
Summary Report results can provide the following benefits:
Energy Use Assessment Tool User’s Guide 2
• Focused snapshot of the past and current energy utilization at the plant
• Trends can be used to compare and contrast energy use and costs from month to month, season to season, and year to year
• Tracking site energy information can show use and cost impacts from operational and equipment improvements identify quickly when use and/or costs have increased, and to show where there may be system limitations at the plant
• Site energy information can be shared with plant operations personnel for identification of operational and technology changes needed to reduce consumption each month
1.3 Data Requirement for EUAT It is recommended that you compile the following required information before using EUAT. This will allow you to use the tool with ease and to its full capability.
• All Plant Utility Data (use and cost information) by month (minimum of 12 months) for up to 5 years of analysis, including all Electric, Natural Gas, Fuel Oil No. 2 (Diesel Fuel), Water and/or Other Utilities
• List of Lighting Fixtures (by type and quantity) and HVAC equipment nameplate data (horsepower, efficiency rating, full load amp rating) and average motor operating amperage (for each building and room) and room size
• Drinking Water Treatment Plant Information including monthly treatment/discharge volumes, motor nameplate data (horsepower, efficiency rating, full load amp rating) and average motor operating amperage
• Wastewater Treatment Plant Information including monthly treatment/discharge volumes, motor nameplate data (horsepower, efficiency rating, full load amp rating) and average motor operating amperage
1.4 About This Guide This Energy Use Assessment Tool User’s Guide contains all the essential information for the user to make full use of the tool. It includes a description of the functions and capabilities of the tool and step-by-step instructions for using the application to evaluate your system’s energy consumption. It provides information on how to enter data, what to expect as the output and how to use that information to improve energy consumption in your facility.
This guide has a chapter for each of the five tabs. An extra chapter describes the setup instructions. Each chapter gives instructions and helpful tips specific to a tab within EUAT. The appendices provide additional information including a glossary of terms used in the tool, unit conversions, a troubleshooting guide and a cheat sheet page. Topics are cross-referenced within the document to provide a comprehensive understanding of how the various tabs are integrated.

Energy Use Assessment Tool User’s Guide 3
1.5 Points of Contact For additional help with the Energy Use Assessment Tool, send an email to [email protected] or visit Determining Energy Usage at http://water.epa.gov/infrastructure/sustain/energy_use.cfm

Energy Use Assessment Tool User’s Guide 4
2 Setup Instructions The following instructions guide you on how to set the needed security levels to enable macros to run in the tool. The instructions assume that you already have a copy of the EUAT saved to your computer.
2.1 Saving a Copy of the Tool EUAT has been developed in two formats: an .xls format for Excel 2003 and an .xlsm format for Excel 2007/2010. The .xls format has been fully tested only on Excel 2003 and the .xlsm format has been fully tested only on Excel 2010. You can however open and use both formats of the tool in Excel 2007 (compatibility mode for the .xls version). If you need to save a copy of the .xls tool you must save it as an Excel 2003 workbook with extension .xls. The .xls tool will not work if you save it as an Excel 2007 workbook (.xlsx or .xlsm file). You would need to use the .xlsm tool if you have Excel 2007 or 2010 on your machine. The .xlsm tool cannot be opened in Excel 2003 or earlier versions.
Note! The .xls version of the tool must be saved in .xls format (Excel 97-2003 workbook). The .xlsm tool cannot be used in Excel 2003 or earlier versions.
2.1.1 Saving the .xls EUAT
2.1.1.1 ‘Save As’ in Excel 2003 If you are using the tool in Excel 2003, from the File menu, select Save As and enter the new file name as shown in figures 2.1.1.1 and 2.1.1.3.

Energy Use Assessment Tool User’s Guide 5
Figure 2.1.1.1 Performing a ‘Save As’ in Excel 2003.
2.1.1.2 ‘Save As’ in Excel 2007 (Compatibility Mode) If you are using the tool in Excel 2007 (compatibility mode), click the Office button at the top left of the spreadsheet, click Save As, and click the Excel 97-2003 Workbook option as shown in Figures 2.1.2 and 2.1.3.

Energy Use Assessment Tool User’s Guide 6
Figure 2.1.1.2. The ‘Save As’ menu in Excel 2007.

Energy Use Assessment Tool User’s Guide 7
Figure 2.1.1.3. Save as enter filename.
2.1.2 Saving the .xlsm EUAT
2.1.2.1 ‘Save As’ in Excel 2007 To save a copy of the .xlsm tool in Excel 2007, click the Office button at the top left of the spreadsheet, click Save As, and click the Excel Macro-Enabled Workbook option as shown in Figures 2.1.2.1 and 2.1.2.3.

Energy Use Assessment Tool User’s Guide 8
Figure 2.1.2.1. The ‘Save As’ menu in Excel 2007.

Energy Use Assessment Tool User’s Guide 9
2.1.2.2 ‘Save As’ in Excel 2010 To save a copy of the .xlsm format in Excel 2010, click the File menu at the top left of the spreadsheet and click Save As. Make sure that Save as Type is the Excel Macro-Enabled Workbook (*.xlsm) option. See figures 2.1.2.2 and 2.1.2.3.
Figure 2.1.2.2. The ‘Save As’ menu in Excel 2010.

Energy Use Assessment Tool User’s Guide 10
Figure 2.1.2.3. Save as enter filename.
Note! The .xls EUAT was developed and tested to work in Microsoft Excel 2003. Some functionality might not work as designed if used in Excel 2007. However, if you choose to run it in Excel 2007, you should retain the .xls file extension which enables it to run in compatibility mode. The macros within this spreadsheet cannot be run in Excel 2010. The new .xlsm EUAT was developed for use on systems with Excel 2007 or Excel 2010. You should close all other Excel workbooks while working in the EUAT.

Energy Use Assessment Tool User’s Guide 11
2.2 Enabling Macros If the security level in Excel is set to Medium, when you open EUAT, a warning message appears (see Figure 2.2.1). To enable the macros needed for EUAT to function properly, click the Enable Macros button. If you do not enable the macros, the tool will not work as designed.
Figure 2.2.1. Security warning medium.
If the security level is set to High or Very High the security warning shown in Figure 2.2.2 appears. Click OK, and then follow the instructions in section 2.3 to change the security level to Medium.

Energy Use Assessment Tool User’s Guide 12
Figure 2.2.2. Security warning high.
2.3 Changing Security Levels
2.3.1 Changing Security Levels in Excel 2003 From the main toolbar click the Tools menu, go to Macro, and click Security (see Figure 2.3.1a). Select Medium from the security level popup as shown in figure 2.3.1b. To avoid having to enable the macros each time you open the tool you can set the security level as Low. Select that option only if you know that the files you will be working with are safe.

Energy Use Assessment Tool User’s Guide 13
Figure 2.3.1a. Select security option in Excel 2003.

Energy Use Assessment Tool User’s Guide 14
Figure 2.3.1b. Security levels.
2.3.2 Changing Security Levels in Excel 2007 & 2010 In Excel 2007 & 2010, you can change macro security settings in the Trust Center, unless a system administrator in your organization has changed the default settings to prevent you from changing the settings.
From the main toolbar, select the Developer tab and click the Macro Security button (see Figure 2.3.2a). Select Enable Macros from the security level popup as shown in figure 2.3.2b.
Hint: If the Developer tab is not displayed, click the Microsoft Office Button then click the Excel Options button on the bottom of the popup. In the Excel Option popup, select the Popular category (if not already selected). Under Top options for working with Excel, click Show Developer tab in the Ribbon (Figure 2.3.2c)

Energy Use Assessment Tool User’s Guide 15
Figure 2.3.2a. Select security option in Excel 2007 & 2010.
Figure 2.3.2b. Select security option in Excel 2007 &2010.

Energy Use Assessment Tool User’s Guide 16
Figure 2.3.2c. Enable Developer tab in Excel 2007.

Energy Use Assessment Tool User’s Guide 17
3 Getting Started on the Instructions Tab To use the tool to its full capacity you will need to collect the following information. For ease of use, you should gather it before using EUAT and entering your data.
• All Plant Utility Data (use and cost information) by month (minimum of 12 months) for up to 5 years of analysis, including all Electric, Natural Gas, Fuel Oil No. 2 (Diesel Fuel), Water, and/or Other Utilities
• List of Lighting Fixtures (by type and quantity) and HVAC equipment nameplate data (horsepower, efficiency rating, full load amp rating) and average motor operating amperage (for each building and room) and room size
• Drinking Water Treatment Plant Information, including monthly treatment/discharge volumes, motor nameplate data (horsepower, efficiency rating, full load amp rating) and average motor operating amperage
• Wastewater Treatment Plant Information, including monthly treatment/discharge volumes and average motor operating amperage
To get started, save a new workbook under a different name (detailed Save As instructions are in section 2.11).
It is OK to start with the data you have available and enter any remaining data at a later time. However, the more data you enter the more complete and accurate the audit will be.
3.1 Instructions Tab The Instructions tab is the default starting point of the tool. On it are brief directions on how to use the tool, how to enter data, and how to navigate through the tool. If this is your first time using the tool read the instructions first. Also note the color-coded keys used all through the tool (Figure 3.1.1).
Figure 3.1.1. Keys used throughout the tool.

Energy Use Assessment Tool User’s Guide 18
When you are ready to start entering data, click the Begin Assessment button at the top (Figure 3.1.2) and you will be automatically taken to the General Information tab or click the General Information tab at the bottom (Figure 3.1.3).
Figure 3.1.2. The ‘Begin Assessment’ button on the Instructions tab.
Figure 3.1.3. Tabs at the bottom of the tool.
If you are starting with a blank template, the tool prompts you to select the type of template needed (Figure 3.1.4). If you are entering data for a drinking water facility, select the Drinking Water Systems template or for a wastewater facility select the Wastewater Systems template.
Figure 3.1.4. Select the template type.
You can now begin entering data in the General Information tab, (see the Chapter 4, General Information Tab).

Energy Use Assessment Tool User’s Guide 19
4 General Information Tab
4.1 Navigation Buttons The buttons at the top of the General Information tab are shown in Figure 4.1. The function of each is explained below.
Figure 4.1. General Information tab buttons.
4.1.1 Select/Switch Template To switch between data entry for Drinking Water Systems or Wastewater Systems use the Select/Switch Template button at the top of the tab (Figure 4.1 - #1). You should select the template type before you begin data entry.
You can use the tool to enter data for either a drinking water system or a wastewater system. However, if your system is both a drinking water and a wastewater system that share the same facility information you can enter data for both plants within the same spreadsheet. You would not need to have a separate copy of the tool for each plant. Enter the facility information common to both plants, then enter the energy usage data for the first plant. After data entry of the first plant is complete, use the Select/Switch Template button to switch template and enter the energy usage data for the second plant. The summary report will reflect the data only for the currently active template/plant. You can switch between templates as often as needed to view the reports of each plant or to edit the data. If the facility information is different you will need to save a separate copy of the tool for each plant.
4.1.2 Building Data Once you have completed entering general information, the next step is to enter your building information for all the buildings in the facility. You will be able to enter data for the lighting fixtures and HVAC/Non-Process Energy users for each building and for up to 10 buildings in the facility. To start the building information, click the Building Data button (Figure 4.1 - #2) or click the Building 1 Data tab at the bottom (Figure 3.1.3).
1
3 2 4 5

Energy Use Assessment Tool User’s Guide 20
4.1.3 Plant Energy Usage The Plant Energy Usage button (Figure 4.1 - #3) takes you to the WTP/WWTP Energy Usage tab to enter in the plant system information. Depending on the type of template selected, clicking the button takes you to either the WTP Energy Usage tab or the WWTP Energy Usage tab. Once you have entered your general information, you can enter the plant information then go to the building data tab to enter the building data. You do not need to complete the building data to start this tab.
Note! It is recommended that you enter all utility information on the General Information tab before you start entering the building or plant information.
4.1.4 Reset Data The Reset Data button can be used to clear all the information entered on the General Information tab. The Reset Data button is on each tab. It resets the data specific to that tab or worksheet only (not the entire workbook).
4.1.5 Save The Save button is used to save all the data entered in the tool. The Save button saves the entire spreadsheet along with all the changes made to any of the tabs. The button is not specific to the General Information tab. You can also save your data by pressing CTRL + S on the keyboard.
4.2 Entering Background Information Use the Background Information form (Figure 4.2) on the General Information tab to enter the general site information including facility name, address, contact person, email, telephone, date of the audit, auditor information, etc. The information is displayed in the final summary report.

Energy Use Assessment Tool User’s Guide 21
Figure 4.2. Background information.
4.3 Entering Utility Bill Information Enter the plant’s monthly utility use and cost information in the section shown in figure 4.3.1.
4.3.1 Use and Cost Data The plants typical monthly energy use and cost data would fall into the different categories shown in #1 in the figure 4.3.1. These include the electricity, natural gas, water and sewer, oil/fuel, and so on, usage and costs. If the site does not collect that information already, the plant’s utility bill will provide that information. It is okay if the meter readings do not start and end on the first and last day of the month. If possible, you should enter the billing entry consistently. The total annual information is the most important.
If your facility uses Alternative Energy, use the related fields shown in figure 4.3.1 - #5 to enter data and specify the units for it in the top section (Figure 4.3.1- #2)
If you have additional utility categories you can use the Other fields shown in figure 4.3.1 - #5 to enter that information. Use the section shown in #2 in figure 4.3.1 to enter the type of the utility category and units to be used for the Other fields.
If the site has multiple accounts for the same utility (such as two electric accounts), combine the values and enter the total for use and costs for each month under this circumstance.

Energy Use Assessment Tool User’s Guide 22
Figure 4.3.1. Utility bill data.
The tool allows for analysis of up to 5 years of data. Enter the most recent year’s monthly data first followed by the next most recent year’s monthly data. The Estimated Annual Electric Energy Use and Cost are calculated for the latest 12 months of data entered. (For example, if data for January through July for 2011 are the latest entered, the annual totals would be taken from August 2010 to July 2011.)
Note! The summary report and charts are refreshed automatically only when data has been changed. Only the edits made on the yellow input fields are considered as a change. Selecting a year from the dropdown list does not trigger the refresh action. To force a refresh (from this tab), double-click any of the yellow cells and navigate to another cell, or use the Refresh Summary Report button on the Summary Report tab.
4.3.2 Entering Alternative and Other Utility Types If your facility uses Alternative Energy, use the related fields shown in the figure 4.3.1 - #5 to enter data. Specify the units for it in #2 shown in figure 4.3.1.
2
1
4
3
5

Energy Use Assessment Tool User’s Guide 23
If you have additional categories use the ‘Other’ fields to enter that information (figure 4.3.1 - #5). Use the section shown in figure 4.3.1 #2 to enter the type of the category and the units to be used for ‘Other’.
4.3.3 Utility Rates The billing rates for each type of energy consumption are automatically calculated for each year using the data entered for that year and are displayed in the section shown in #3 of figure 4.3.1. The Average Electrical Energy Rate will be calculated as an average of the electric rate over the latest 12 months of data entered. (For example, if data for January through July for 2011 are the latest entered, the totals would be taken from August 2010 to July 2011.) That average is displayed towards the top of the tab (figure 4.3.4) and will be used in calculations throughout the tool. The averages shown in figure 4.3.4 are calculated based on the yearly data and will be auto populated/refreshed as data is entered.
4.3.4 Treatment Volume Enter the volume of water treated in the area shown as #4 in figure 4.3.1. The unit for treatment volume can be set to either MGAL or TGAL using the input dropdown field found in the section shown in #2 in figure 4.3.1 (or figure 4.3.4b). The spreadsheet calculates the sites total utility cost per treatment volumes, electrical energy use, and average utility rate per individual utility, and displays a summary for each year of data entered (figure 4.3.4a). Graphs of the information are generated and are on the Summary Report tab.
Figure 4.3.4a. Electrical energy utilization summary.

Energy Use Assessment Tool User’s Guide 24
Figure 4.3.5b. Treatment Volume Unit dropdown list.
Note! The fields in light blue are display only and contain values automatically calculated by the tool. The yellow fields are data entry fields that you enter.
4.3.5 Entering Cogeneration Data EUAT is not designed to automatically handle cogeneration (co-gen) usage and costs. However, you can manipulate the information in the General Information tab to accurately reflect the effect that co-gen energy has on the facility’s use and costs.
The utility bill entries in the General Information tab can be manipulated to account for the electricity savings from the co-gen process and the additional cost from natural gas used to keep the co-gen process online. For the following manipulations, it is assumed that co-gen electrical production and natural gas consumption are metered.
• Add the electrical energy production from the co-gen process to the electricity purchased from your utility in the Electricity Consumption cells.
• The co-gen electrical energy costs can be added by including the co-gen direct purchased natural gas costs in the Electrical Cost cells.
• Co-gen natural gas that is a separately metered and that is billed separately from plant-wide natural gas can have the total bill added to the Electricity Cost cells.
• To account for co-gen natural gas that is sub-metered after the main natural gas meter, which is used for billing, subtract the usage and proportional cost from the Natural Gas Cost and Natural Gas Consumption cells.
• Add the portion of natural gas cost that went to the co-gen process to the Electricity Cost cells.
• Add the portion of natural gas use that went to the co-gen process to the Electricity Consumption cells.
After manipulating the energy usage and costs use the tool normally and it now accurately represents the site’s true costs for energy.
Energy Use Assessment Tool User’s Guide 25
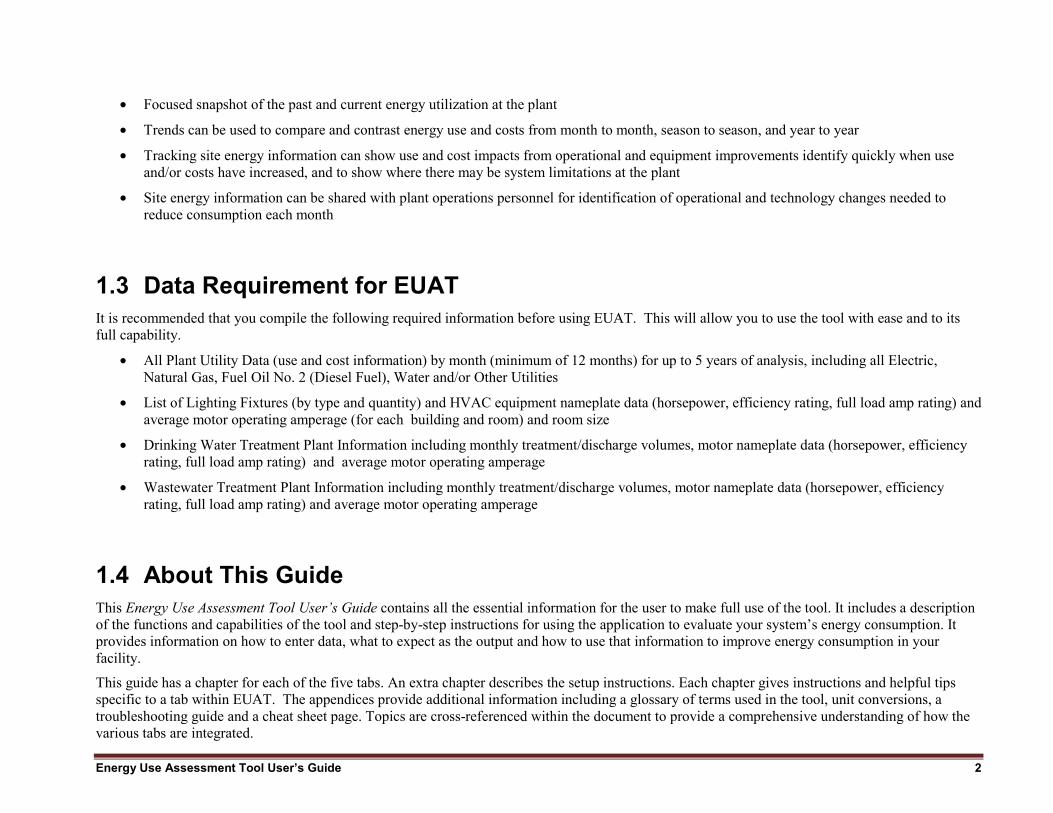
5 Building Data Tab The tool allows you to enter data for up to 10 buildings. The building data tabs are numbered from 1 to 10 and all 10 tabs follow the same format. The below instructions are common to all 10 tabs except if specified.
5.1 Navigation Buttons
Figure 5.1. Building Data tab buttons.
5.1.1 Save and Continue Use the Save and Continue button at the top of the page to save the data that has been entered for Building 1 and enter data for the next building or return to the General Information tab if building data entry is complete. Once the number of buildings has been selected you can also move to the other Building Data tabs by clicking them at the bottom of the tool.
5.1.2 Reset Data Use the Reset Data button to clear all the information entered on the current Building Data tab. A Reset Data button is on each tab. It resets the data that has been entered on that tab (not all tabs).
5.1.3 Return to General Info To return to the General Information tab, click the Return to General Info button. You do not have to complete data entry on the building tab. You can return later when you have time to fill in the detail.

Energy Use Assessment Tool User’s Guide 26
5.1.4 Set # of Buildings Use the Set # of Buildings button to set the desired number of rooms on-site. The Set # of Buildings button (figure 5.2) appears only on the Building 1 Data tab. If your facility has more than one building you will need to create the tabs before you can enter your building data. To do this, select the desired number of buildings from the dropdown list and click Set # of Buildings to allow entry for that many buildings. Enter data for the first building on the Building 1 Data tab, then click Save and Continue to go to the second building data tab. Enter data for the second building and continue process until you have entered the data for all buildings. If you do not have time to complete all buildings, you can skip it and come back later. If your site has outdoor lighting then you may want to use a separate building to capture this information within the EUAT.
Figure 5.1.4. Set the number of buildings.
At any time you can increase the number of buildings available for data entry. Select the total number of buildings needed from the dropdown list and click the Set # of Buildings button. Increasing the number of buildings will not reset/delete any of the data entered on the other building data tabs. (E.g. suppose you initially selected 5 buildings and entered data for these tabs and later realize you had 6 buildings. You would have to select 6 from the dropdown list and click the button. This would however create only 1 new tab and would retain the first 5 that were already created. You would therefore not lose any of the data that was already entered).
To remove extra or unused building tabs, select the required number of buildings and click the Set # of Buildings button. Doing so deletes the buildings tabs in decreasing order starting with the highest numbered tab, irrespective of which tabs contain data (i.e., if you originally set the number of buildings to 3 and then change the number of buildings to 1, tabs 3 and 2 will be deleted, along with any data entered on them but building 1 and all the data entered for it will remain.). It is assumed that the user will enter the buildings in increasing numerical order i.e., enter data for building 1 then building 2 and so on.
Note! Reducing the number of buildings will delete any data entered on the tabs being removed. It is assumed that the user will enter data in the building tabs in increasing order hence the highest numbered tab(s) would be the unused one(s).
Increasing the number of buildings will only add on to the existing tabs hence data will not be erased.
Energy Use Assessment Tool User’s Guide 27
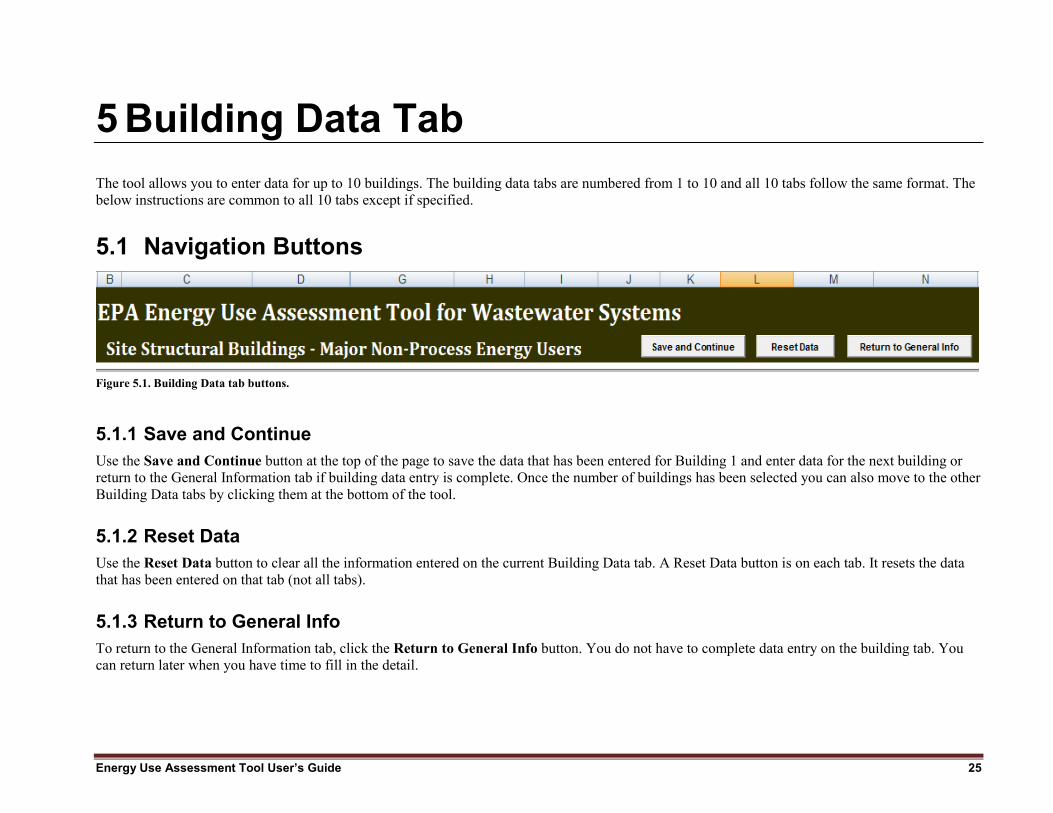
5.1.5 Set # of Rooms For each building, you must select the number of rooms for which you want to enter data. Select the number of rooms in the No. of Rooms dropdown list and click the Set # of Rooms button (figure 5.1.5).
Figure 5.1.5. Setting the number of rooms
Note! You must set the number of rooms in a building before entering any lighting data. Changing the number of rooms afterward entering data will reset/delete ALL the lighting data entered.
5.2 Total Plant Building Information Figure 5.2 shows the top section of all building tabs. This area displays a summary of the information entered on all the building tabs. If you entered data for buildings 1, 2, and 3, the section appears the same on all the building tabs and displays the sum of the building areas/electric loads/electric use on all three tabs.
However, the Does the site have buildings and Set # of Buildings fields are clickable only on the building 1 tab. On all other tabs, those fields are display only. Use the Set # of Buildings to allow data entry for the selected number of buildings (for more details, see section 5.1.4).
Figure 5.2. Total plant building information.
5.3 Building Information Enter general information about each building in the section shown in figure 5.3. This includes the name of the building, number of rooms, operating hours and so on. Set the number of rooms in the building before entering any lighting data (for more details, see section 5.1.5). The area of the building is calculated as a sum of the area of the rooms entered. The Operating Hours per Year are calculated using the values selected for operating hours per day and operating hours per week. The Average Building Lighting Power Density is calculated on the basis of the area of the building and the values entered for wattage in the rooms.

Energy Use Assessment Tool User’s Guide 28
The section shown in figure 5.3, #1 displays the totals of the information entered on the rooms and for the HVAC/Non-process units. Those totals across all the buildings are displayed on the Plant Energy Usage tab. You can then use them for entry on the WTP/WWTP Energy Usage tab.
If your system’s lighting and HVAC loads have already been identified or you would just like to estimate them without detailing that information here you can proceed to the WTP/WWTP Energy Use tab.
Figure 5.3. Building information.
5.4 Lighting Fixtures To determine the site’s lighting loads and energy use, describe each room’s lighting fixture types and counts by using the selectable input fields as shown in figure 5.4a and 5.4b. You can enter data for up to 10 rooms per building. If your system has more than 10 rooms you can combine the remaining rooms and enter the summed up values into the last room section.
Select from the dropdown list a light fixture for each type of fixture in each room. The tool provides the fixture’s electrical energy load in watts. Enter the quantity and the tool updates the total room wattage. If a type of fixture is not available in the dropdown use the Other Type input field to enter the fixture and its total (lamp and ballast) wattage.
Enter the area for each room and the tool provides the Lighting Power Density (LPD) in watts per square foot for each room.
1

Energy Use Assessment Tool User’s Guide 29
Figure 5.4a. Lighting data.
Figure 5.4b. Lighting fixture dropdown list.
Energy Use Assessment Tool User’s Guide 30
The tool totals the rooms’ lighting loads, each building’s lighting energy use, and the site’s total lighting energy use per year for use in other areas of this tool. You can then compare LPD’s from room to room and building to building to help determine where excess energy might be in use.
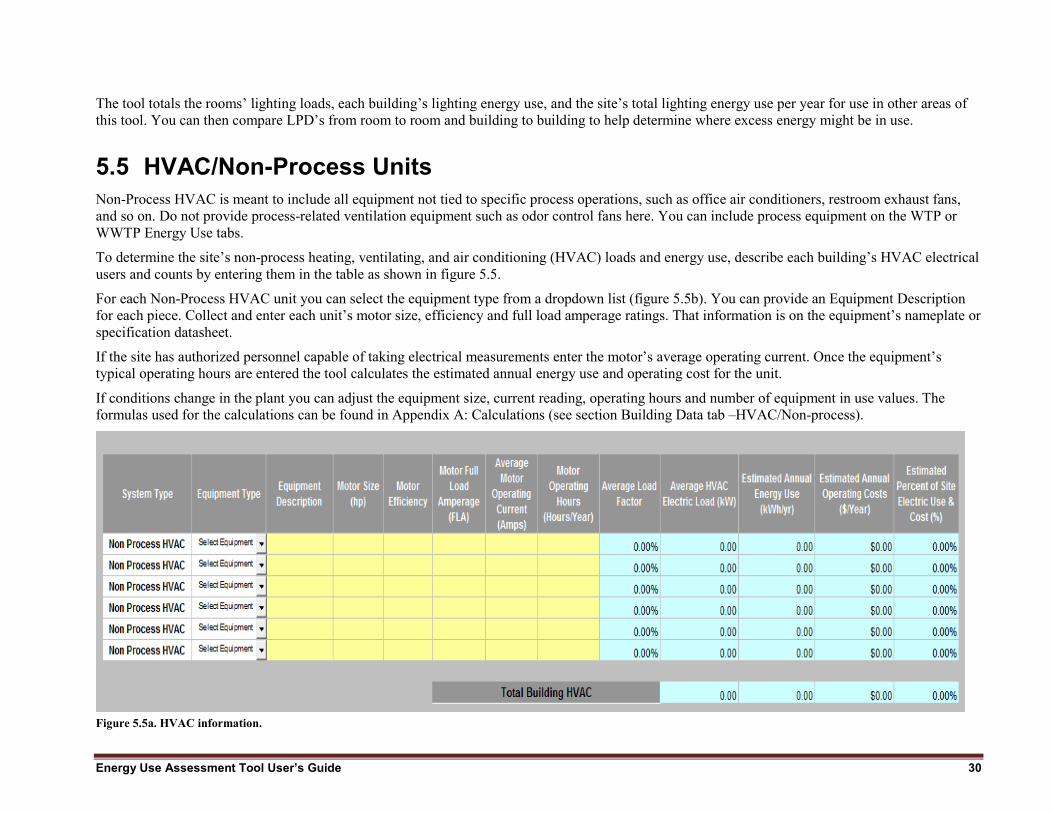
5.5 HVAC/Non-Process Units Non-Process HVAC is meant to include all equipment not tied to specific process operations, such as office air conditioners, restroom exhaust fans, and so on. Do not provide process-related ventilation equipment such as odor control fans here. You can include process equipment on the WTP or WWTP Energy Use tabs.
To determine the site’s non-process heating, ventilating, and air conditioning (HVAC) loads and energy use, describe each building’s HVAC electrical users and counts by entering them in the table as shown in figure 5.5.
For each Non-Process HVAC unit you can select the equipment type from a dropdown list (figure 5.5b). You can provide an Equipment Description for each piece. Collect and enter each unit’s motor size, efficiency and full load amperage ratings. That information is on the equipment’s nameplate or specification datasheet.
If the site has authorized personnel capable of taking electrical measurements enter the motor’s average operating current. Once the equipment’s typical operating hours are entered the tool calculates the estimated annual energy use and operating cost for the unit.
If conditions change in the plant you can adjust the equipment size, current reading, operating hours and number of equipment in use values. The formulas used for the calculations can be found in Appendix A: Calculations (see section Building Data tab –HVAC/Non-process).
Figure 5.5a. HVAC information.

Energy Use Assessment Tool User’s Guide 31
Figure 5.5b. HVAC Equipment Type dropdown list.
Energy Use Assessment Tool User’s Guide 32
6 WTP/WWTP Energy Usage Tab
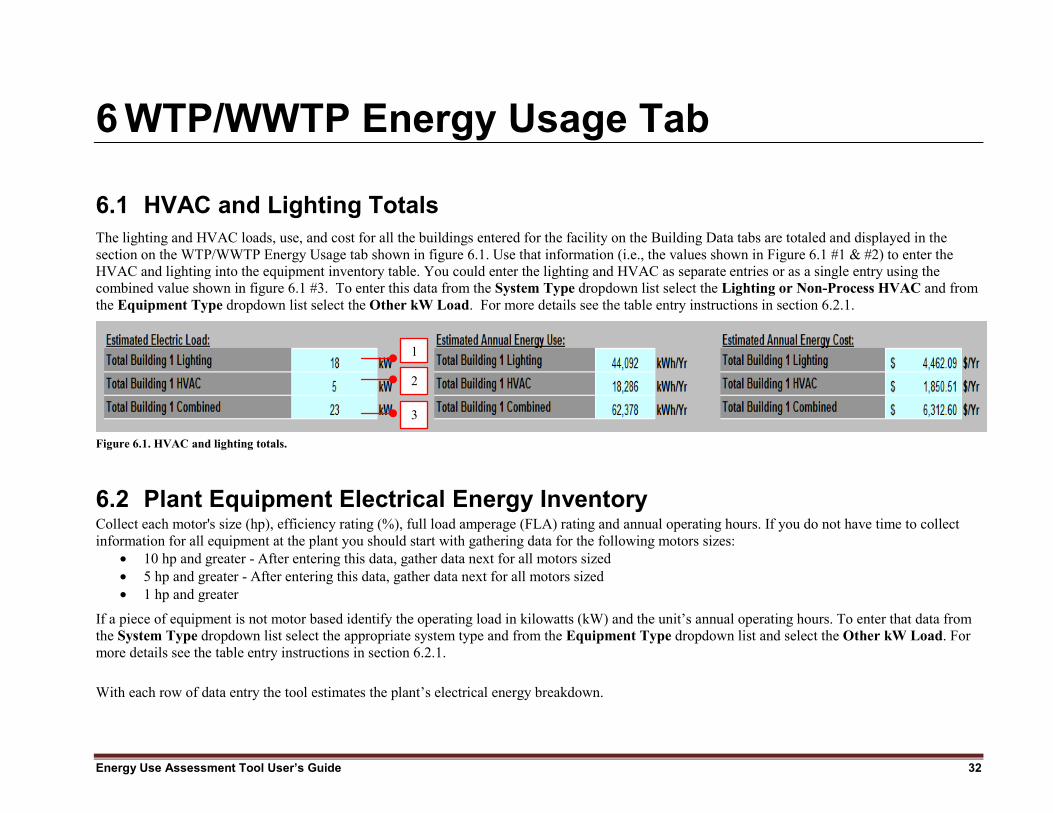
6.1 HVAC and Lighting Totals The lighting and HVAC loads, use, and cost for all the buildings entered for the facility on the Building Data tabs are totaled and displayed in the section on the WTP/WWTP Energy Usage tab shown in figure 6.1. Use that information (i.e., the values shown in Figure 6.1 #1 & #2) to enter the HVAC and lighting into the equipment inventory table. You could enter the lighting and HVAC as separate entries or as a single entry using the combined value shown in figure 6.1 #3. To enter this data from the System Type dropdown list select the Lighting or Non-Process HVAC and from the Equipment Type dropdown list select the Other kW Load. For more details see the table entry instructions in section 6.2.1.
Figure 6.1. HVAC and lighting totals.
6.2 Plant Equipment Electrical Energy Inventory Collect each motor's size (hp), efficiency rating (%), full load amperage (FLA) rating and annual operating hours. If you do not have time to collect information for all equipment at the plant you should start with gathering data for the following motors sizes:
• 10 hp and greater - After entering this data, gather data next for all motors sized • 5 hp and greater - After entering this data, gather data next for all motors sized • 1 hp and greater
If a piece of equipment is not motor based identify the operating load in kilowatts (kW) and the unit’s annual operating hours. To enter that data from the System Type dropdown list select the appropriate system type and from the Equipment Type dropdown list and select the Other kW Load. For more details see the table entry instructions in section 6.2.1.
With each row of data entry the tool estimates the plant’s electrical energy breakdown.
1
2
3

Energy Use Assessment Tool User’s Guide 33
6.2.1 Table Entry Instructions You will need to identify the equipment used in your plant and enter data for each one into the equipment inventory table as shown in figure 6.2.1a. To enter data follow the steps below:
1. Identify and select the System Type and Equipment Type from the dropdown menus (figures 6.2.1b and 6.2.1c) for each piece of equipment recognized at the plant. To enter system types not listed in the list from the System Type dropdown list select ‘Other’.
2. Enter a unique Equipment Description to keep track of each piece of equipment. That can be the system’s identification name or number.
3. Collect and enter the motor size, efficiency and full load amperage ratings. That information is on the equipment’s nameplate or specification datasheet.
4. If the site has authorized personnel capable of taking electrical measurements collect and enter the motor’s average operating current. If you are unable to measure the motor’s typical operating current the tool provides 75% as the default value for the unit’s Average Load Factor.
5. Enter the annual operating hours. If that information is not tracked for the unit estimate the value. You can readjust the value later.
6. If the piece of equipment is not motor based or if a total system load has already been identified such as for the Building Lighting and HVAC systems in the System Type dropdown list select the appropriate system type and from the Equipment Type dropdown list select Other kW Load. The tool then ignores the cells for Motor Size, Motor Full Load Amperage, Average Motor Operating Current and Load Factor by placing an N/A in those cells. (Figure 6.2.1 - #1) You can then enter the annual operating hours into the respective cell and electrical energy load in kW into the column titled Average Electric Load (kW). To put in the lighting and HVAC values entered on the building data tabs use the totals shown in the blue boxes at the top of this tab (Figure 6.1). For the Average Electric Load (kW) use the values shown in figure 6.1 (#1 and #2 or combined as #3). You can enter 100% for the Average Load Factor and use the high of 8760 for the Operating Hours (Hrs/Yr) since these may vary for each building.
7. If you need to add more equipment than the table allows click the Add Row button (Figure 6.2.1 - #2) (it adds a new row for data entry). You may add as many rows as you wish.

Energy Use Assessment Tool User’s Guide 34
Figure 6.2.1a. Plant equipment inventory.
1
2
3 4

Energy Use Assessment Tool User’s Guide 35
Figure 6.3.1b. Plant system type dropdown list. Figure 6.4.1c. Plant equipment type dropdown list.
6.2.2 Entry Results EUAT calculates each equipment’s electrical energy values for Average Electric Load (kW), Estimated Annual Energy Use (kWh/yr) and Estimated Annual Operating Costs ($/yr).
The tool also provides the Estimated Percent of Site Electric Use & Cost (%) identified as compared to the plant’s Actual Annual Electric Use and Cost (actual energy billed).
Any difference between what electrical energy has been identified and what has been billed is also indicated. If that value is positive the site’s electrical energy use and/or loads have been overestimated and readjustment of the equipment loads or operating hours might be necessary. If that value is negative, the site’s electrical energy use and/or loads have not been fully identified, and additional equipment loads or operating hours might be necessary (Figure 6.2 - #3).
The cell labeled Percent of Site Electrical Energy Identified (Figure 6.2 - #4) provides the site with an estimate of what portion of the site’s electrical energy use has been captured. Use that percent value to help gauge the data quantity yet to be collected and entered.
6.2.3 Top Electrical Energy Use Systems EUAT generates a list of the Top 5 Electrical Energy Use Systems at the plant (Figure 6.2.3). The breakdown is listed by major system type. Those smaller components not in the Top 5 will be combined and shown as the Balance of Plant Identified. The electrical energy that has not yet been identified will be shown as Balance of Plant Unidentified. As you enter data the percent of site electrical energy identified moves closer to 100% and the Balance of Plant Unidentified decreases.

Energy Use Assessment Tool User’s Guide 36
Figure 6.2.5. Top 5 electrical energy use systems.
System energy use comparisons between systems of varying voltages and phases are not a problem. The kW consumption is determined by converting motor horsepower to kW and adding it to direct kW consumptions from other equipment. Amperage is used only to determine the percent load factor of the motor power.
(% load factor) = (Average Amp Load)/(Full Amp Load)
The load factor multiplied by the motor total power results in the average power and, thus, energy consumption. Voltage is not used in any calculations.
The tool also generates a pie chart with the site’s top electrical energy use systems identified.
If conditions change at the plant you can adjust the values entered for the systems. Any change in the data would automatically refresh all calculations, charts and summaries.
A summary of the electrical energy use breakdown is provided on the Summary Report tab under Equipment Inventory.
The kW and kWhs are calculated on the basis of hp to kW conversion including the Amp/FLA as a multiplying load factor. Therefore, the voltage does not affect the current calculation. If you have real-time Amp, Volt, kW, and operating hour readings of your equipment, use the Equipment Type dropdown and select Other kW Load, then enter the kW and operating hours and the table will be even more precise.

Energy Use Assessment Tool User’s Guide 37
6.2.4 Next Steps Once you have entered your information to a reasonable accuracy to create your energy usage baseline you can determine where the majority of energy is being used. Your next steps might include the following activities:
1. Prioritize further investigation of opportunities to reduce your energy use -
o At first, focus on discovering opportunities for energy savings on the assets with the largest energy consumption; that is where your biggest savings can be made.
o As time permits, work down to progressively smaller assets until you have the “Balance of Plant Unidentified” down to as low of a value as possible. Look at those assets that run for long hours. Sometimes simple operation or technological changes can greatly reduce run time and cut large portions of energy consumption.
o Do not ignore lighting and HVAC because those areas have had great technological improvements in recent history and even one-for-one replacement can provide great energy savings, sometimes at very low cost. Also compare room LPDs as a first step to potentially identify where areas of the plant may be over lit.
o Lighting and HVAC can often be oversized for the plant however it is important to consult an engineer who is an expert in regulations and safety before making fixture, lamp, ballast or quantity changes.
2. Determine operational improvements to reduce energy use -
o Time is money when it comes to energy consumption. Changing operational procedures and schedules could reduce overall costs.
o Leaving process equipment on during non-processing time or leaving lights and heat on when a building is vacant can cost the system money.
o Reducing consumption during low or non-processing periods and building vacancy can provide easy opportunities for saving energy at no cost. Peak demand charges can be up to half of the plant’s total electric bill. That means the more electric load the system consumes at one time the larger the fee. Such peak demand is often carried over for months or years after it occurs. Therefore, staggering equipment startup (when energy spikes occur) can reduce the system’s peak demand and greatly reduce electrical fees. Also, staggering cyclical equipment is an opportunity to reduce peak demand. Consult your utility rate schedule and/or utility representative to determine your plant’s demand interval (e.g. 15 minutes, 30 minutes) to be sure you’re making adjustments within the necessary time periods required by your rate schedule.
3. Compare and contrast impacts (reductions or increases) of contemplated equipment upgrades or technology changes -
o Save another copy of EUAT to alter for hypothetical site changes. Change the baseline equipment listed in the tool with different lighting types, more efficient equipment or different operating schedules to see the possible yearly savings instantly. They are estimates and there will always be differences in the actual utility savings.

Energy Use Assessment Tool User’s Guide 38
4. Update the tables to confirm energy impacts (reductions or increases) as operational or equipment modifications or replacements are completed -
o Keep EUAT up-to-date as changes are made to the system and see the impact to utility consumption and provide a baseline for further work.
5. Seek detailed engineering insight -
o Process opportunities might exist beyond improving motor efficiencies and one-for-one upgrades. Seeking a detailed engineering analysis of the system’s largest energy consuming processes could reveal new technologies or alterations to the original design that can reduce energy consumption.
6. Utilize the Summary Report to -
o Provide a focused snapshot of the past and current energy utilization at the plant each month.
o Review trends to compare and contrast energy use and costs from month to month, season to season and year to year.
7. Track site energy information to confirm use and cost impacts from operational and equipment improvements (and make sure these savings are captured each month too), identify quickly when use and/or costs have increased and to show where there may be system limitations at the plant requiring further analysis (e.g. where equipment is oversized and doesn’t allow the plant to right size energy use as treatment volumes increase and decrease).

Energy Use Assessment Tool User’s Guide 39
7 Summary Report Tab The Summary Report tab contains a summary of all the information entered on the General Information, Building and WTP/WWTP Energy Usage tabs. The data have been summarized into tables and charts for easy interpretation and comparison of data.
7.1 Action Buttons The buttons available on the Summary Report tab are shown in figure 7.1.
Figure 7.1. Summary Report heading
7.1.1 Print Summary Report Use the Print Summary Report button (figure 7.1- #1) to print the summary report. To change the print area, use the default print options in Excel.
7.1.2 Refresh Summary Report Use the Refresh Summary Report button (figure 7.1- #2) to refresh the tables and charts on the tab. The tables and charts on the summary report should automatically reflect any changes made on the other tabs. However only data entered on the yellow data entry fields would trigger a refresh. If the summary report does not reflect the data entered, click the button to force a refresh. If that still does not refresh the report check the macros settings. If the macros are not running properly you might need to save and then close and reopen the tool. For more details, see Appendix D (Troubleshooting guide).
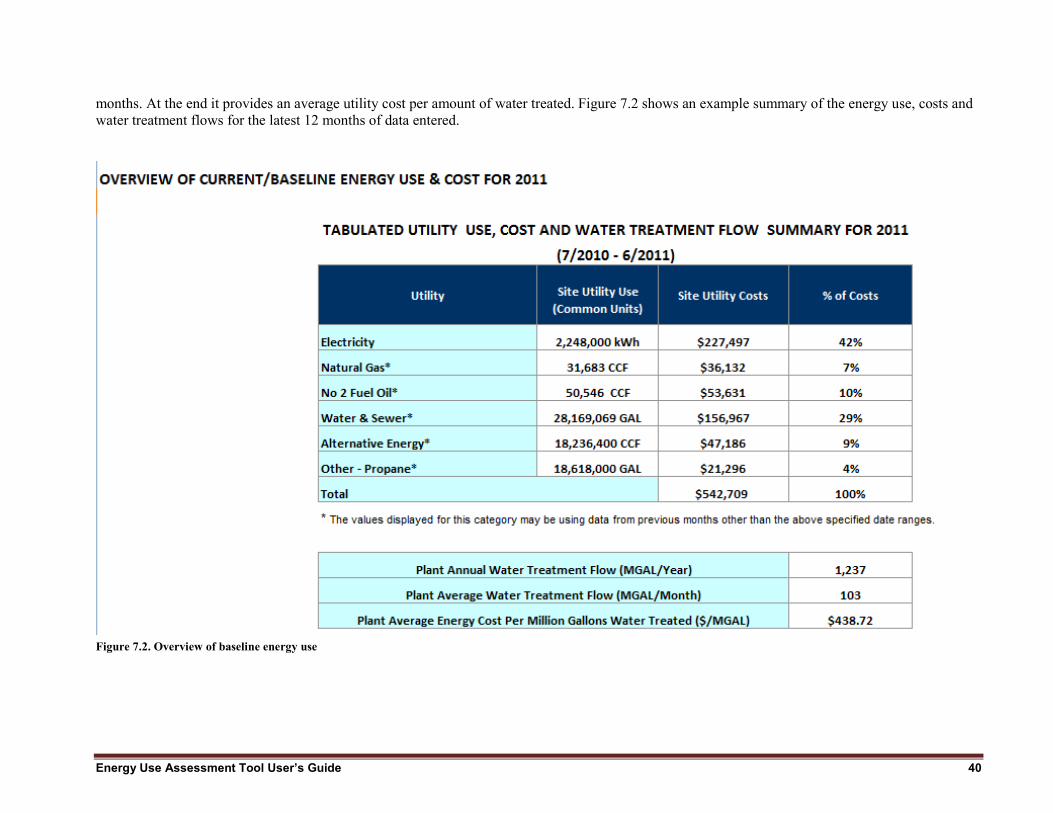
7.2 Overview of Baseline Energy Use The Baseline Energy Use (figure 7.2) summarizes each utility’s consumption and cost for the last 12 months entered on the General Information tab and the amount of water treated during that period. It calculates the percentage of the total plant utility cost that each utility is generating during the 12
1 2
Energy Use Assessment Tool User’s Guide 40
months. At the end it provides an average utility cost per amount of water treated. Figure 7.2 shows an example summary of the energy use, costs and water treatment flows for the latest 12 months of data entered.
Figure 7.2. Overview of baseline energy use

Energy Use Assessment Tool User’s Guide 41
7.3 Graphical Summaries for the Latest 12 Months EUAT takes the latest 12 months of utility data entered to produce graphs which help to analyze the energy trends for the past 1 year. The description of each graph can be found below.
7.3.1 The Utility Cost Summary Graph The Utility Cost Summary graph (figure 7.3.1) shows monthly trends in the Cost for your system in bar graph form and compares that to the amount of Water Treated in line graph form.
Figure 7.3.1a. Utility Cost Summary (Major Utilities) Graph

Energy Use Assessment Tool User’s Guide 42
Figure 7.3.1b. Utility Cost Summary (All Utilities) Graph

Energy Use Assessment Tool User’s Guide 43
7.3.2 The Electric Use vs. Water Treated Graph The Electric Use vs. Water Treated graph (figure 7.3.2) compares Electric Use (electric energy consumption) in bar graph form with Water Treated volumes in line graph form. As treatment amounts increase so should electric consumption and vice versa. If that relationship is weak there might be opportunities for energy savings in equipment schedules and in process procedures.
Figure 7.3.2. Electric Use vs. Water Treated Graph

Energy Use Assessment Tool User’s Guide 44
7.3.3 The Electric Use vs. Cost Graph The Electric Use vs. Cost graph (figure 7.3.3) shows the Electric Use in bar graph form as compared to Cost in line graph form. That allows the plant to see how energy costs are trending. Reducing peak demand charges can reduce the overall cost without decreasing the consumption.
Figure 7.3.3. Electric Use vs. Cost Graph

Energy Use Assessment Tool User’s Guide 45
7.3.4 The Electric Utilization vs. Water Treated Graph The Electric Utilization vs. Water Treated graph shows the Electric Energy Utilization (energy consumption per amount of water treated) in bar graph form compared to the amount of Water Treated in line graph form. If electric utilization increases sharply as the amount of water treated decreases there might be opportunities to reduce energy consumption in the non-process, building systems or the treatment process is not designed to efficiently handle varying flows.
Figure 7.3.4. Electric Utilization vs. Water Treated Graph
Energy Use Assessment Tool User’s Guide 46
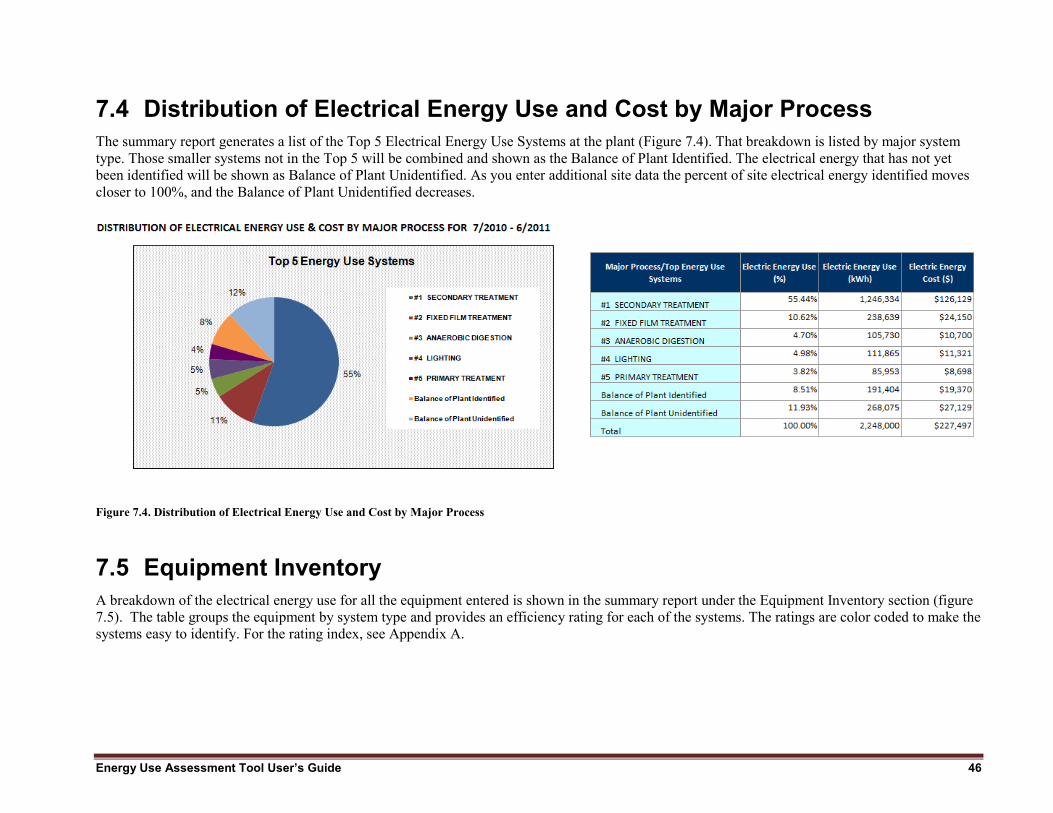
7.4 Distribution of Electrical Energy Use and Cost by Major Process The summary report generates a list of the Top 5 Electrical Energy Use Systems at the plant (Figure 7.4). That breakdown is listed by major system type. Those smaller systems not in the Top 5 will be combined and shown as the Balance of Plant Identified. The electrical energy that has not yet been identified will be shown as Balance of Plant Unidentified. As you enter additional site data the percent of site electrical energy identified moves closer to 100%, and the Balance of Plant Unidentified decreases.
Figure 7.4. Distribution of Electrical Energy Use and Cost by Major Process
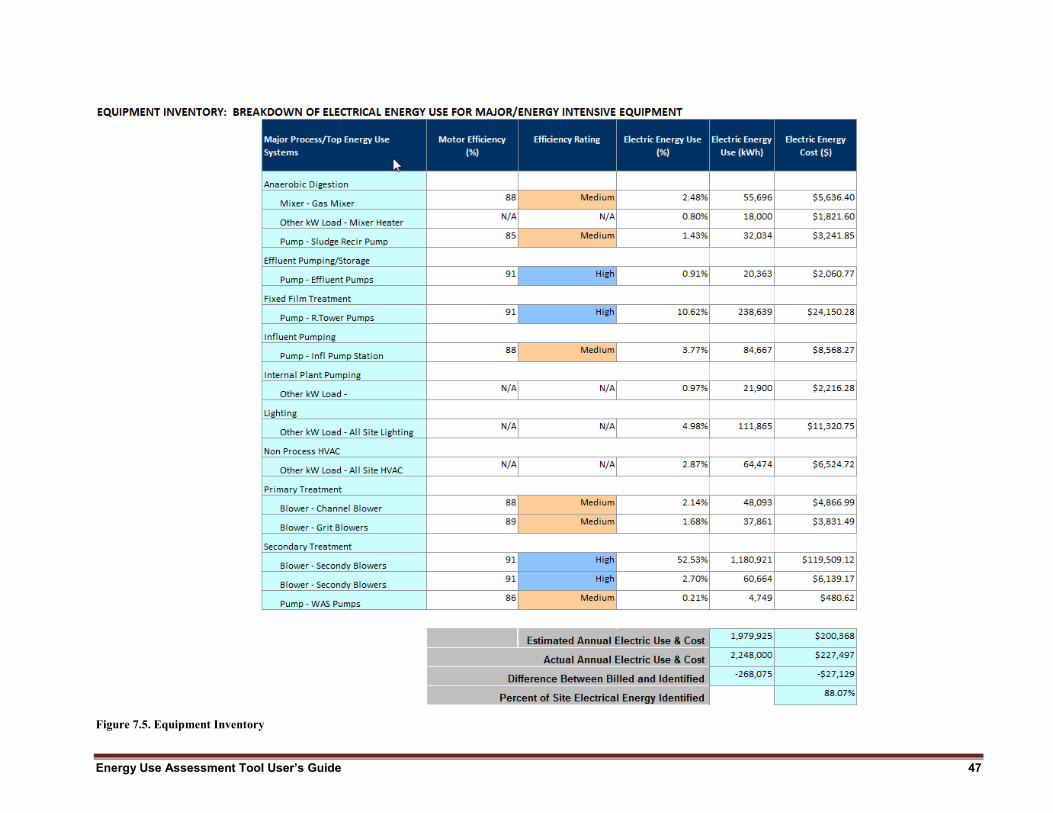
7.5 Equipment Inventory A breakdown of the electrical energy use for all the equipment entered is shown in the summary report under the Equipment Inventory section (figure 7.5). The table groups the equipment by system type and provides an efficiency rating for each of the systems. The ratings are color coded to make the systems easy to identify. For the rating index, see Appendix A.
Energy Use Assessment Tool User’s Guide 47
Figure 7.5. Equipment Inventory

Energy Use Assessment Tool User’s Guide 48
7.6 Energy Trends for Over the Last 5 years The energy trend graphs on the summary report show a comparison of year over year energy use versus water treated, energy use versus cost, and cost versus water treated over the past 5 years.
7.6.1 Electric Use vs. Water Treated Graph The 5 Year Electric Use vs. Water Treated graph (figure 7.6.1) shows the annual Electric Use in bar graph form compared to the amount of Water Treated in line graph form. That allows the plant to compare how electric use and water treated is trending from year to year. Contrasts in these comparisons may show opportunity for reductions in equipment in operation or equipment right sizing.
Figure 7.6.1. Equipment Inventory

Energy Use Assessment Tool User’s Guide 49
7.6.2 Electric Use vs. Cost Graph The 5 Year Electric Use vs. Cost graph (figure 7.6.2) shows the annual Electric Use in bar graph form as compared to Cost in line graph form. That allows the plant to see how energy use as compared to energy costs is trending. As utility rates increase costs may increase even as electric consumption decreases. Significant changes in site energy use and demands may allow a plant to change rate schedules which may provide for a better overall electric rate. Signing up for available riders may also be another way to combat increases in utility rates.
Figure 7.6.2. Electric Use vs. Cost Graph

Energy Use Assessment Tool User’s Guide 50
7.6.3 Natural Gas Use vs. Cost Graph The 5 Year Natural Gas Use vs. Cost graph (figure 7.6.3) shows the annual Natural Gas Use in bar graph form as compared to Cost in line graph form. That allows the plant to see how energy use as compared to energy costs is trending. In northern climates where building heating may be a significant portion of a sites natural gas use changes in weather may contribute significantly to changes in annual use. As these heating systems are upgraded with more efficient units and controls the site will have more control over this use and costs. Also, separated metering for process and building natural gas use will allow a site to focus on each systems natural gas needs separately.
Figure 7.6.3 Natural Gas Use vs. Cost Graph

Energy Use Assessment Tool User’s Guide 51
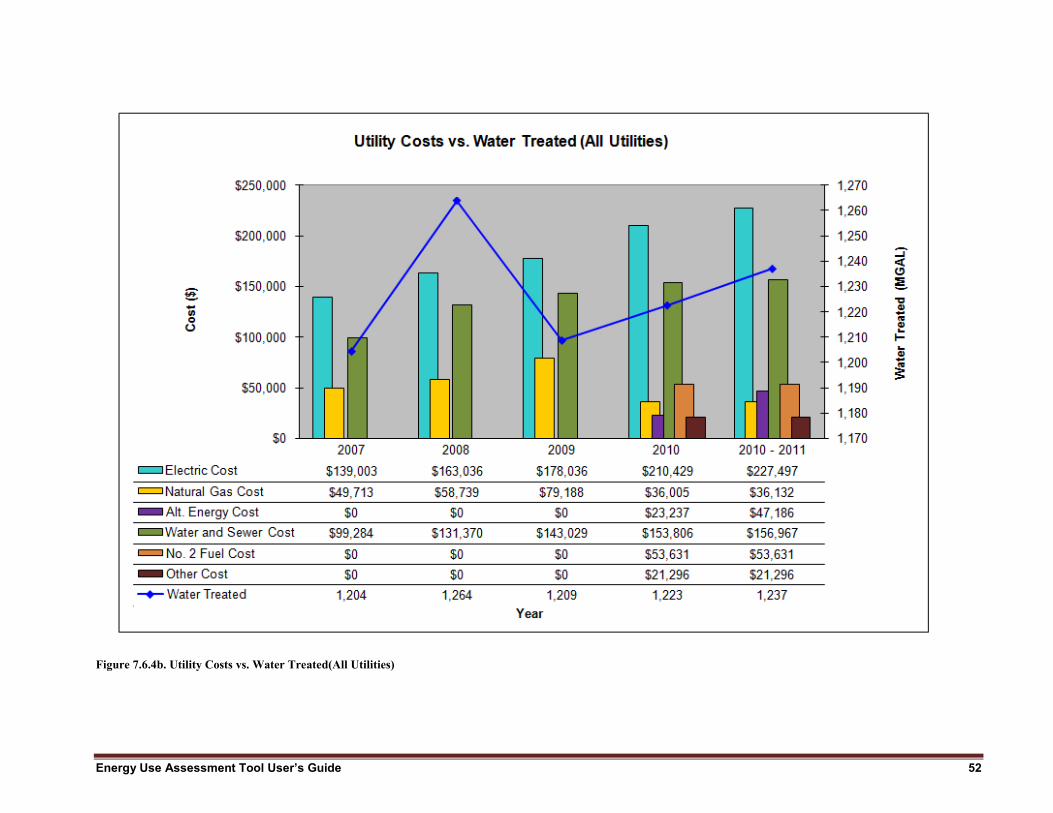
7.6.4 Utility Cost Summary Graph The Utility Cost Summary graph (figure 7.6.4) shows annual trends in the Cost for your system in bar graph form and compares that to the amount of Water Treated in line graph form. As a plant implements upgrades to combat utility use significant impacts can also affect the plant’s bottom line costs. Utilities are one of the few manageable potions of a site budget.
Figure 7.6.4a. Utility Costs vs. Water Treated(Major Utilities)
Energy Use Assessment Tool User’s Guide 52
Figure 7.6.4b. Utility Costs vs. Water Treated(All Utilities)

Energy Use Assessment Tool User’s Guide 53
Appendix A. Calculations
General Information Tab • Total Utility Cost per Tgal (or Mgal) Treated ($/Tgal (or Mgals)) per year = Total Annual Utility Cost in $ / Total Annual Treatment Volume
in Tgal (or Mgal)
• Electrical Energy Utilization (kWh/Tgal (or Mgal)) = Total Annual Electrical Energy Consumption in kWh / Total Annual Treatment Volume in Tgal (or Mgal)
• Estimated Annual Electrical Energy Use (kWh) = Sum of the electrical energy consumption for the latest 12 months of electrical energy data entered in kWh
• Average Electrical Energy Rate ($/kWh) = Sum of the electrical costs for the latest 12 months of electrical cost data entered in $ / Sum of the electrical energy consumption for the latest 12 months of electrical energy data entered in kWh
• Electric Rate ($/kWh) = Total Annual Electricity Cost in $ / Total Annual Electrical Energy Consumption in kWh
• Natural Gas ($/ccf) = Total Annual Natural Gas Cost in $ / Total Annual Natural Gas Consumption in ccf
• No 2 Fuel Oil ($/ccf) = Total Annual No. 2 Fuel Oil Cost in $ / Total Annual No. 2 Fuel Oil Consumption in ccf
• Water/Sewer ($/gal) = Total Annual Water/Sewer Cost in $ / Total Annual Water/Sewer Consumption in Gal
• Alt. Energy ($/__) = Total Annual Alternative Energy Cost in $ / Total Annual Alternative Energy Consumption in __ (the user must specify the units).
• Other Utility ($/__) = Total Annual Other Utility Cost in $ / Total Annual Other Utility Consumption in __ (the user must specify the units).
Building Data Tab • Total Plant Building Area (Ft2) = Sum of building areas for all buildings entered in square foot
• Total Plant Building Electric Load (kW) = Sum of building electric loads for all buildings entered in kW. The building electric load for a building is the total of the lighting and HVAC loads for that building. The total per building is in the section, Estimated Electric Load: Total Building [1] Combined in kW.
• Total Plant Building Electric Use (kWh/Yr) = Sum of building electric use for all buildings entered in kWh. The building electric use for a building is the total of the lighting and HVAC use for that building. The total per building is in the section, Estimated Annual Energy Use: Total Building [1] Combined in kWh/Yr.
Energy Use Assessment Tool User’s Guide 54
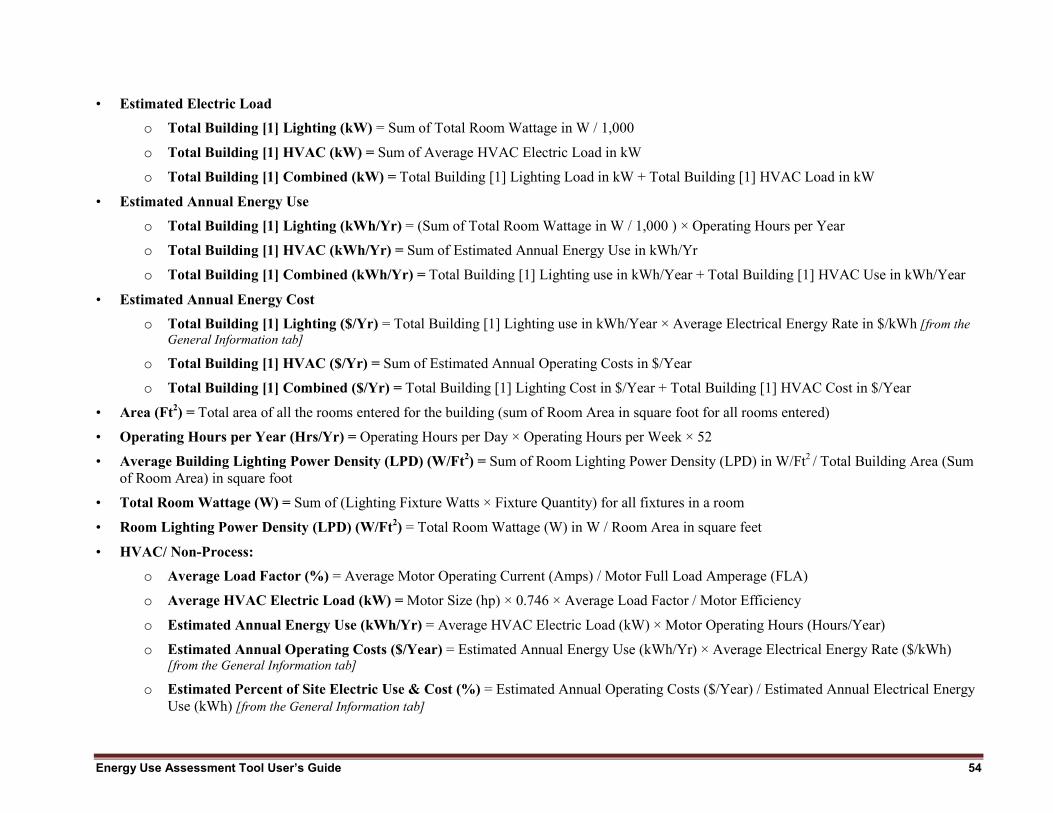
• Estimated Electric Load o Total Building [1] Lighting (kW) = Sum of Total Room Wattage in W / 1,000
o Total Building [1] HVAC (kW) = Sum of Average HVAC Electric Load in kW
o Total Building [1] Combined (kW) = Total Building [1] Lighting Load in kW + Total Building [1] HVAC Load in kW
• Estimated Annual Energy Use o Total Building [1] Lighting (kWh/Yr) = (Sum of Total Room Wattage in W / 1,000 ) × Operating Hours per Year
o Total Building [1] HVAC (kWh/Yr) = Sum of Estimated Annual Energy Use in kWh/Yr
o Total Building [1] Combined (kWh/Yr) = Total Building [1] Lighting use in kWh/Year + Total Building [1] HVAC Use in kWh/Year
• Estimated Annual Energy Cost o Total Building [1] Lighting ($/Yr) = Total Building [1] Lighting use in kWh/Year × Average Electrical Energy Rate in $/kWh [from the
General Information tab]
o Total Building [1] HVAC ($/Yr) = Sum of Estimated Annual Operating Costs in $/Year
o Total Building [1] Combined ($/Yr) = Total Building [1] Lighting Cost in $/Year + Total Building [1] HVAC Cost in $/Year
• Area (Ft2) = Total area of all the rooms entered for the building (sum of Room Area in square foot for all rooms entered)
• Operating Hours per Year (Hrs/Yr) = Operating Hours per Day × Operating Hours per Week × 52
• Average Building Lighting Power Density (LPD) (W/Ft2) = Sum of Room Lighting Power Density (LPD) in W/Ft2 / Total Building Area (Sum of Room Area) in square foot
• Total Room Wattage (W) = Sum of (Lighting Fixture Watts × Fixture Quantity) for all fixtures in a room
• Room Lighting Power Density (LPD) (W/Ft2) = Total Room Wattage (W) in W / Room Area in square feet
• HVAC/ Non-Process: o Average Load Factor (%) = Average Motor Operating Current (Amps) / Motor Full Load Amperage (FLA)
o Average HVAC Electric Load (kW) = Motor Size (hp) × 0.746 × Average Load Factor / Motor Efficiency
o Estimated Annual Energy Use (kWh/Yr) = Average HVAC Electric Load (kW) × Motor Operating Hours (Hours/Year)
o Estimated Annual Operating Costs ($/Year) = Estimated Annual Energy Use (kWh/Yr) × Average Electrical Energy Rate ($/kWh) [from the General Information tab]
o Estimated Percent of Site Electric Use & Cost (%) = Estimated Annual Operating Costs ($/Year) / Estimated Annual Electrical Energy Use (kWh) [from the General Information tab]

Energy Use Assessment Tool User’s Guide 55
WTP/WWTP Energy Usage Tab • Average Load Factor (%) = Average Motor Operating Current (Amps) / Motor FLA [Not Applicable for ‘Other KW Loads’ Equipment Type]
• Average Electric Load (kW) = Motor Size (hp) × 0.746 × Average Load Factor / (Motor Efficiency / 100) [Not Applicable for Other KW Loads Equipment Type]
• Estimated Annual Energy Use (kWh/Yr) = Average Electric Load (kW) × Operating Hours (Hrs/Yr)
• Estimated Annual Operating Costs ($/Yr) = Estimated Annual Energy Use (kWh/Yr) × Average Electrical Energy Rate ($/kWh) [from the General Information tab]
• Estimated Percent of Site Electric Use & Cost (%) = Estimated Annual Energy Use (kWh/Yr) / Estimated Annual Electrical Energy Use (kWh) [from the General Information tab]
• Estimated Annual WTP Electric Use & Cost Fields (%) = For each column the sum of values in the rows above for all equipment entered in the table
• Actual Annual WTP Electric Use (kWh) = Estimated Annual Electrical Energy Use (kWh) [from the General Information tab]
• Actual Annual WTP Electric Cost ($) = Estimated Annual Electrical Energy Use (kWh) [from the General Information tab] × Average Electrical Energy Rate ($/kWh) [from the General Information tab]
• Difference Between Billed and Identified Electric Use (kWh) = Estimated Annual WTP Electric Use – Actual Annual WTP Electric Use
• Difference Between Billed and Identified Electric Cost ($) = Estimated Annual WTP Electric Cost – Actual Annual WTP Electric Cost
• Percent of Site Electrical Energy Identified (%) = Estimated Annual WTP Electric Use / Actual Annual WTP Electric Use
• Top Energy Use Systems = Top 5 Energy Consumption Systems. All the equipment entered is grouped by System Type and then sorted by the highest energy consumption category. The top 5 categories are displayed, and the remaining are grouped into Balance of Plant Identified.
Summary Report Tab • Efficiency Rating: The table below shows the rating criteria used to rate the equipment displayed on the Equipment Inventory of electrical
energy use for major/energy intensive equipment table.
Rating Motor Efficiency %
High >90
Medium 85-90%
Low <85%

Energy Use Assessment Tool User’s Guide 56
Appendix B. Unit Definitions and Conversions Unit Definition
W Watt kW Kilowatt kWh Kilowatt hour Tgal Thousand gallons Mgal Million gallons cf Cubic foot or Cubic feet ccf Hundred cubic feet kcf Thousand cubic feet Mcf Million cubic feet therm Therm Btu British thermal unit kBtu Thousand Btu MBtu Million Btu Ft2 Square foot or Square feet
Unit Equivalent Units
1 kW 1,000 watts 1 Tgal 1,000 gallons 1 Mgal 1,000,000 gallons or 1,000 Tgal 1 cf 7.48052 gallons 1 ccf 100 cubic feet 1 kcf 1,000 cubic feet or 10 ccf 1 Mcf 1,000,000 cubic feet or 10,000 ccf or 1,000 kcf 1 therm 100,000 Btu or 100 kBtu or 0.1MBtu 1 kBtu 1,000 Btu 1 MBtu 1,000,000 Btu or 1,000 kBtu or 10 therms

Energy Use Assessment Tool User’s Guide 57
Appendix C. Acronyms and Abbreviations
Acronym or Abbreviation Definition Amp Amperage Btu British thermal unit cf Cubic foot or Cubic feet ccf Hundred cubic feet EUAT Energy Use Assessment Tool EPA Environmental Protection Agency FLA Full load amperage Ft2 Square foot or Square feet Hp Horsepower HVAC Heating, ventilation, and air conditioning kBtu Thousand Btu kcf Thousand cubic feet kW Kilowatt kWh Kilowatt hour kWh/Mgal Kilowatt hour per million gallons LPD Lighting power density MBtu Million Btu Mcf Million cubic feet Mgal Million gallons Tgal Thousand gallons therm Therm WTP Water Treatment Plant WWTP Wastewater Treatment Plant

Energy Use Assessment Tool User’s Guide 58
Appendix D. Troubleshooting Guide 1. Summary Report Does Not Get Refreshed: If the Summary report is not being refreshed with the data entered on any of the tabs check Excel’s macro settings (Section 2.1). Macros need to be enabled for the charts to get generated and for the buttons to work properly.
2. Summary Report Does Not Get Refreshed with General Information data: If the Summary report is not being refreshed with the data entered on the General Information tab
a. Check the Excel macro setting.
b. Trigger the refresh action by clicking the Refresh Summary Report button on the Summary Report tab. Note that the summary report and charts are automatically refreshed when data has been changed on the General Information tab. However, only the edits made on the yellow input fields are considered as a change. Selecting a year from the dropdown list does not trigger the refresh action. If your summary report does not look accurate click the Refresh Summary Report.
3. Run-time Error: If the pop up message appears as shown in figure D.1 click the End button to end the error. Then exit the tool and reopen it to ensure that the macros run properly.
Figure D.1. Run-time error.
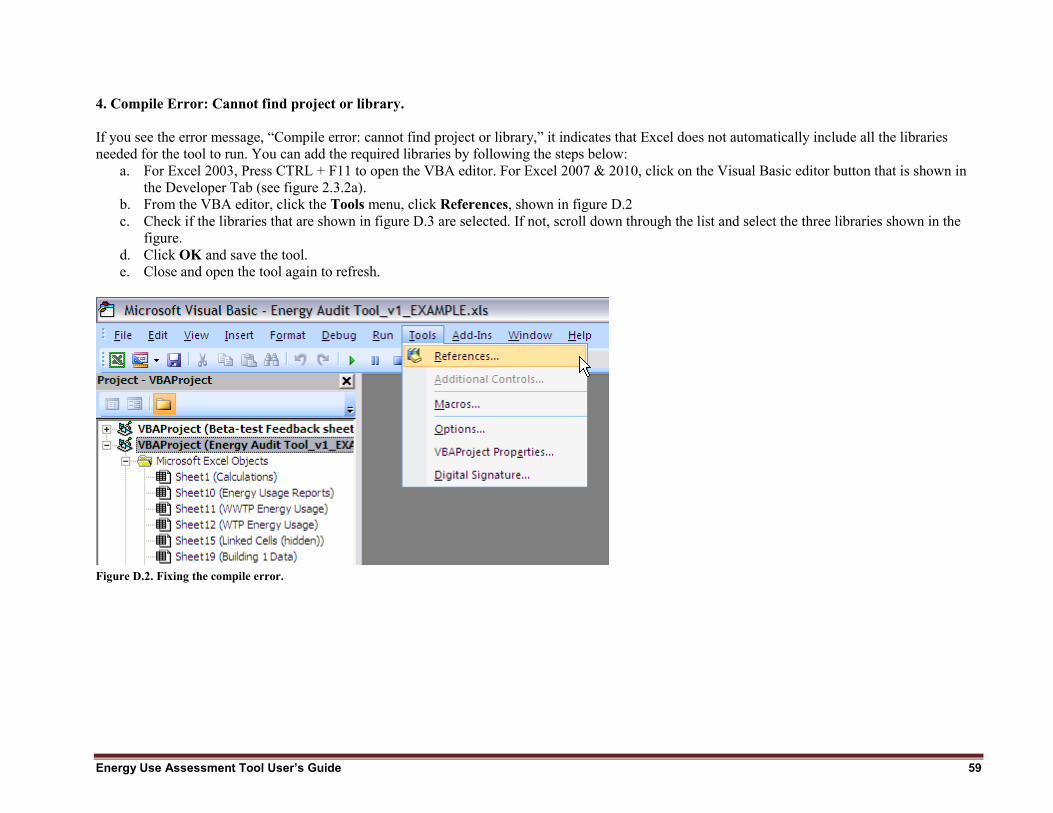
Energy Use Assessment Tool User’s Guide 59
4. Compile Error: Cannot find project or library. If you see the error message, “Compile error: cannot find project or library,” it indicates that Excel does not automatically include all the libraries needed for the tool to run. You can add the required libraries by following the steps below:
a. For Excel 2003, Press CTRL + F11 to open the VBA editor. For Excel 2007 & 2010, click on the Visual Basic editor button that is shown in the Developer Tab (see figure 2.3.2a).
b. From the VBA editor, click the Tools menu, click References, shown in figure D.2 c. Check if the libraries that are shown in figure D.3 are selected. If not, scroll down through the list and select the three libraries shown in the
figure. d. Click OK and save the tool. e. Close and open the tool again to refresh.
Figure D.2. Fixing the compile error.

Energy Use Assessment Tool User’s Guide 60
Figure D.3. The three references that are needed.
The above list of issues is not complete. If you encounter an issue not listed, please email us the details at [email protected] . The issue may later be added into the user’s guide if relevant to all users.

Energy Use Assessment Tool User’s Guide 61
Appendix E. Cheat Sheet 1. How do I change the tool template?
Use the Select/Switch Template button on the General Information tab to switch or select between a Wastewater template and a Drinking Water template for the tool.
2. How to enter data for both a drinking water plant and a wastewater system?
2.1. For plants under same facility You can enter data for both drinking water and wastewater facilities on the same spreadsheet only if both plants share the same general information. Enter the general information first. Select the type of facility using the Select/Switch Template button (see section 4.1.1). Enter data for the selected facility and view/print report. Use the Select/Switch Template button to switch to the other facility type. Enter data for the second facility and view/print report. Note that you can view the report for only one of the facilities at a time, although information for both facilities has been stored. You can switch between templates as frequently as needed to view/edit data.
2.2. Two completely separate facilities You will not be able to use a single spreadsheet to gather information for systems under different facilities. You will need to create a copy of the tool (see section 2.3) and use one copy for each plant/facility. If you need to do that, you should finish the analysis of one facility before you start the second one. Having two copies of the tool open at the same time can cause errors.
3. How do I add lighting loads into the pie charts and reports? A summary of the lighting information gathered on the building data tabs is displayed at the top of the WTP/WWTP Energy Usage tabs. For the information to be included in the total energy use and displayed in the pie charts and summary report, enter the values as lighting or non-process equipment into the Equipment Electrical Energy Inventory table. To enter the data, select the System Type of Lighting or Other Non Process Load and the Equipment Type of Other kW Load.
4. How do I add HVAC loads into the pie charts and reports? A summary of the non-process HVAC information entered on the building data tabs is displayed at the top of the WTP/WWTP Energy Usage tabs. For the information to be included in the total energy use and displayed in the pie charts and summary report, enter the values as non-process equipment into the Equipment Electrical Energy Inventory table. To enter data, select the System Type of Non Process HVAC or Other Non Process Load and the Equipment Type of Other kW Load.
5. How do I enter equipment with a system type that is not in the given System Type list? To enter system types that are not in the list select Other in that list and use the Equipment Description field to describe the system.
Energy Use Assessment Tool User’s Guide 62
6. How do I enter cogeneration (co-gen) data? Co-gen data must be integrated into the existing fields in the General Information tab. In the Electricity Consumption cells, add the electrical production to the electricity amount billed. The amount and cost of natural gas used to keep the co-gen online should be subtracted from the overall natural gas cells and the cost of that gas should be added to the Electricity Cost cells. There must be separate co-gen metering for this to work.
7. Is there a problem if my equipment voltages and phases are not all the same? The kW and kWh are calculated on the basis of hp to kW conversion using only the Avg. Amp/FLA as a multiplying load factor. Therefore, the voltage does not affect the tool’s calculations. If you have real-time Amp, Volt, kW, and operating hour readings of your equipment use the Equipment Type dropdown and select Other kW Load, then enter the kW and operating hours, and the table will be even more precise.
8. How do I enter values if energy is billed on multiple accounts? If the site has multiple accounts for the same utility (such as two electric accounts), combine the values and enter the total for use and costs for each month under this circumstance.
9. Will it matter if my meter readings do not start and end on the first day of the month? It is okay if the meter readings do not start and end on the first and last day of the month respectively. Try to be as consistent in your entry as possible. The total annual information is the most important.
10. How do I enter energy cost and consumption for energy types that are not given in the table? Use the Other field to enter this information. In the section on top just above the energy cost consumption data entry tables (Rows 50 and 51 on the General Information tab), enter the type of the energy to be used as Other and specify the units for the Other type. That information is reflected in the tables for each year.
11. Where do I specify the units for Treatment Volume? On the General Information tab, the section just above the cost and consumption data entry tables (Row 48 on the General Information tab), select the units for Treatment Volume as either Tgal or Mgal here.
12. Where do I specify the units for Alternative Energy? On the General Information tab, the section just above the cost and consumption data entry tables (Row 49 on the General Information tab), enter the units for Alternative Energy here.
13. What is the right method to follow when entering my system’s energy data? To save time in identifying the assets of high energy use, start with gathering data for all motors of 10 hp and larger. If you have time gather data next for all motors of 5 hp and greater. If you have more time gather data next for all motors sized 1hp and greater.
If a piece of equipment is not motor based identify the operating load in kW along with the unit’s annual operating hours.

Energy Use Assessment Tool User’s Guide 63
At the bottom of the data entry table (WTP/WWTP Plant Energy Usage tab), the cell labeled Percent of Site Electrical Energy Identified provides an estimate of what portion of the system’s electrical energy use has been captured. Use that percent value to help gauge the data quantity yet to be collected and entered.
14. How do I enter data for more than one building? The default number of buildings on the tool is set to 1. If the site has more than one building go to the Building 1 Data tab and specify the desired number of buildings in the dropdown list (10 maximum), then click the Set # of Buildings button. For more details, see section 5.1.4.
15. How do I enter more lighting data for more than 4 rooms? The default number of rooms per building is set to 4. If a building has more than four rooms, before you begin data entry for any of your rooms go to the selected Building (X) Data tab and specify the desired number of rooms in the dropdown list (10 maximum), then click the Set # of Rooms button. For more details, see section 5.1.5.
16. Where can I find the size, efficiency and full load amperage ratings of a motor? That information is on the equipment’s nameplate or specification datasheet. See example nameplate below.
17. What are my next steps once I have generated my summary report?
See section 6.2.4 for more details of the below recommended next steps:
1. Prioritize further investigation of opportunities to reduce your energy use
2. Determine operational improvements to reduce energy use
3. Compare and contrast impacts (reductions or increases) of contemplated equipment upgrades or technology changes
4. Update the tables to confirm energy impacts (reductions or increases) as operational or equipment modifications or replacements are completed
Motor Company Name Typically Here
Motor Name and Type Typically HereMotor Rated Amperage
Motor Horsepower
Motor Efficiency

Energy Use Assessment Tool User’s Guide 64
5. Seek detailed engineering insight
6. Utilize the Summary Report to:
a. Provide a focused snapshot of the past and current energy utilization at the plant each month
b. Review trends to compare and contrast energy use and costs from month to month, season to season, and year to year
c. Track site energy information to confirm use and cost impacts from operational and equipment improvements, identify quickly when use and/or costs have increased, and to show where there may be system limitations at the plant requiring further analysis.