Embed Size (px)
Citation preview

J Physiol 589.18 (2011) pp 4615–4631 4615
The
Jour
nalo
fPh
ysio
logy
(–)-Epicatechin enhances fatigue resistance and oxidativecapacity in mouse muscle
Leonardo Nogueira1, Israel Ramirez-Sanchez1,4, Guy A. Perkins2, Anne Murphy3, Pam R. Taub1,Guillermo Ceballos4, Francisco J. Villarreal1, Michael C. Hogan1 and Moh H. Malek5
1Department of Medicine, School of Medicine, University of California, San Diego, CA, USA2National Centre for Microscopy & Imageing Research, and 3Department of Pharmacology, La Jolla, CA 92093, USA4Escuela Superior de Medicina del Instituto Politecnico Nacional, Seccion de Posgrado, Mexico City, Mexico5Integrative Physiology of Exercise Laboratory, Wayne State University, Eugene Applebaum College of Pharmacy & Health Sciences,Detroit, MI 48201, USA
Non-technical summary During exercise, skeletal muscle performance depends in great parton the use of aerobic metabolism to supply the energetic demand of contractions. Endurancetraining increases the muscle aerobic capacity, which is not only associated with enhanced exerciseperformance, but also with a decreased risk of cardiovascular and metabolic diseases. Recently,it has been shown that regular use of small doses of dark chocolate may result in similar healthbenefits to exercise training. We show here that mice fed for 15 days with (–)-epicatechin (presentin dark chocolate) had improved exercise performance accompanied by: (1) an increased numberof capillaries in the hindlimb muscle; and (2) an increased amount of muscle mitochondria as wellas signalling for mitochondrial biogenesis. These results suggest that (–)-epicatechin increasesthe capacity for muscle aerobic metabolism, thereby delaying the onset of fatigue. These findingsmay have potential application for clinical populations experiencing muscle fatigue.
Abstract The flavanol (–)-epicatechin, a component of cacao (cocoa), has been shown to havemultiple health benefits in humans. Using 1-year-old male mice, we examined the effectsof 15 days of (–)-epicatechin treatment and regular exercise on: (1) exercise performance,(2) muscle fatigue, (3) capillarity, and (4) mitochondrial biogenesis in mouse hindlimb andheart muscles. Twenty-five male mice (C57BL/6N) were randomized into four groups: (1)water, (2) water–exercise (W-Ex), (3) (–)-epicatechin ((–)-Epi), and (4) (–)-epicatechin–exercise((–)-Epi-Ex). Animals received 1 mg kg−1 of (–)-epicatechin or water (vehicle) via oral gavage(twice daily). Exercise groups underwent 15 days of treadmill exercise. Significant increases intreadmill performance (∼50%) and enhanced in situ muscle fatigue resistance (∼30%) wereobserved with (–)-epicatechin. Components of oxidative phosphorylation complexes, mitofilin,porin, nNOS, p-nNOS, and Tfam as well as mitochondrial volume and cristae abundance weresignificantly higher with (–)-epicatechin treatment for hindlimb and cardiac muscles than exercisealone. In addition, there were significant increases in skeletal muscle capillarity. The combinationof (–)-epicatechin and exercise resulted in further increases in oxidative phosphorylation-complexproteins, mitofilin, porin and capillarity than (–)-epicatechin alone. These findings indicate that(–)-epicatechin alone or in combination with exercise induces an integrated response that includesstructural and metabolic changes in skeletal and cardiac muscles resulting in greater endurancecapacity. These results, therefore, warrant the further evaluation of the underlying mechanism ofaction of (–)-epicatechin and its potential clinical application as an exercise mimetic.
C⃝ 2011 The Authors. Journal compilation C⃝ 2011 The Physiological Society DOI: 10.1113/jphysiol.2011.209924

4616 L. Nogueira and others J Physiol 589.18
(Resubmitted 5 April 2011; accepted after revision 24 July 2011; first published online 25 July 2011)Corresponding author M. H. Malek: Wayne State University, Eugene Applebaum College of Pharmacy and HealthSciences, 259 Mack Avenue, Room 2248, Detroit, MI 48201, USA. Email: [email protected]
Abbreviations CFPE, capillary-to-fibre perimeter exchange index; (–)-Epi, (–)-epicatechin group;(–)-Epi-Ex, (–)-epicatechin–exercise group; F50, frequency of stimulation to evoke 50% of P0; FCSA, fibrecross-sectional area; GTE, green tea extract; nH, Hill coefficient; P t, twitch tension; P0, maximal tetanic tension;PCO, permanent coronary occlusion; W-Ex, water and exercise group.
Introduction
Muscle aerobic capacity is a strong determinant of skeletalmuscle function and exercise performance. Aerobiccapacity is greatly enhanced by exercise training, generallydue to increases in mitochondrial volume and capillarityin skeletal muscle (Holloszy & Coyle, 1984; Poole &Mathieu-Costello, 1996). In addition to the knownbenefits of increased mitochondrial volume on exerciseperformance, it is now becoming clear that exercisemaintains mitochondrial viability throughout the humanlifespan (Leick et al. 2010) and that reduced mitochondrialvolume and mitochondrial degeneration are a strongdeterminant of the ageing process (Wallace, 1999). Ithas been recognized that skeletal muscle function andperformance begin to deteriorate in middle aged humans,which can eventually lead to sarcopaenia (Nair, 2005),loss of normal activity levels, and thereby facilitate weightgain and the development of age-related pathologicalconditions such as diabetes and cardiovascular disease.As markers of reduced mitochondrial volume, oxidativephosphorylation proteins and mitochondrial content havebeen shown to decrease in skeletal muscle with ageing(Lanza & Nair, 2009).
It has been of great interest to identify natural productsand nutritional supplements which may mimic andenhance the effects of exercise in order to improvemuscle performance and possibly attenuate the effectsof ageing-induced muscle wasting. Recent reports havelinked the consumption of small amounts of darkchocolate (a product of cacao) with notable reductionsin risk for the development of cardiovascular diseases(Buijsse et al. 2010). Using animal models, our grouphas focused on the study of cardiovascular effectsof (–)-epicatechin (the main flavanoid present indark chocolate) and have demonstrated that at lowdoses, there is increased nitric oxide production inendothelial cells (Ramirez-Sanchez et al. 2010) andreduced myocardial injury (Yamazaki et al. 2008, 2010).Furthermore, Ottaviani et al. (2011) recently reportedthat only (–)-epicatechin, and not the stereoisomers(+)-epicatechin, (–)-catechin or (+)-catechin, is capableof mediating in vivo vasodilatation. There is evidence thatthe production of physiological amounts of nitric oxide(via nitric oxide synthase) may play a role in skeletal muscle
mitochondrial biogenesis (Wadley et al. 2007; Wadley &McConell, 2007) and capillarity (Lloyd et al. 2003), andenhance performance (Bailey et al. 2010). Interestingly,the potential effects of (–)-epicatechin have not beenexamined in relation to muscle aerobic capacity, fatiguedevelopment, mitochondrial volume and capillarity inskeletal and cardiac muscle. Recent studies have shownthat some exercise mimetic compounds (e.g. GW1516)need a modest metabolic stimulus to enhance their effects(Narkar et al. 2008). We reasoned, therefore, that the useof (–)-epicatechin may also require such a stimulus. Thecombination of (–)-epicatechin plus exercise would allowus to compare and contrast the effects of this flavanol versusthose of exercise alone or in combination with exercise.
Therefore, using middle aged mice (12 months old), thepurposes of this present study were to examine the effectsof low dose (–)-epicatechin administration (15 days) inthe presence and absence of exercise on (1) exerciseperformance, (2) muscle fatigue, (3) muscle capillarity,and (4) mitochondrial biogenesis in mouse heart andhindlimb muscles. We hypothesized that (–)-epicatechintreated mice would demonstrate higher exercise capacityand exhibit a longer time to fatigue, which would occursecondarily to increases in skeletal muscle capillarity andoxidative capacity.
Methods
Animals and ethical approval
We studied 1-year-old, male C57BL/6N mice (n = 25;Harlan Laboratories, Inc., Indianapolis, IN, USA), whichwere randomized into four groups. Animals were placedfour per cage and fed a standard diet without limitations.The room temperature was kept at 21◦C with 12 hlight–dark cycles. All animal care and experimentalprocedures were approved by the University of California,San Diego Animal Care and Use Committee and conformto NIH and American Physiological Society standards.
Experimental design and approach
A between-subjects design was used to determine theeffects of (–)-epicatechin on the hindlimb muscles of1-year-old mice. This age was selected because it has been
C⃝ 2011 The Authors. Journal compilation C⃝ 2011 The Physiological Society

J Physiol 589.18 (–)-Epicatechin and muscle adaptation 4617
shown that by 1 year there are decreases in exercise capacitywhen compared to young (4–6 months) mice (Leick et al.2010). All animals performed an incremental treadmill testand were then subsequently randomized into four groups:(1) water, (2) water–exercise (W-Ex), (3) (–)-epicatechin((–)-Epi), and (4) (–)-epicatechin–exercise ((–)-Epi-Ex).Groups 2 and 4 performed exercise on a rodent treadmillMonday through Friday during the study period. On theday after the final training session, all mice performedan incremental treadmill test. Forty-eight hours followingthe treadmill test, the mice were killed. The quadricepsfemoris, extensor digitorum longus (EDL), and plantarismuscles for all groups were harvested and used formorphometric, biochemical, isolated-muscle preparation,and molecular analyses.
(–)-Epicatechin administration
Mice in the (–)-epicatechin groups 3 and 4 were given1.0 mg (kg body mass)−1 twice a day (morning andevening) for 15 consecutive days, whereas animals in thecontrol groups 1 and 2 received the vehicle (water). Both(–)-epicatechin (Sigma-Aldrich, St Louis, MO, USA) andvehicle were administered via oral gavage.
Incremental treadmill tests
On at least two occasions prior to the test all mice werefamiliarized with the treadmill (model CL-4, Omnitech,Columbus, OH, USA) at a slow speed (∼5 m min−1)at 10 deg incline for approximately 5–10 min. Theincremental test consisted of warm-up at 4 m min−1 for2 min followed by an increase of 2 m min−1 every minutethereafter. A shock grid (0.2 mA) and air jets at the backof the treadmill were used to discourage the mice fromstopping while the treadmill belt was moving. Exhaustionwas determined when the mouse was no longer able tomaintain its normal running position on the treadmilland/or was unwilling to run as indicated by the frequentcontact (i.e. touching the shock grid with each stride) orsitting on the shock grid consistent with previous studiesfrom our laboratory (Malek & Olfert, 2009; Malek et al.2010).
The running time was measured and running distanceand power calculated. Distance is a function of time andspeed of the treadmill, whereas power is the product ofbody weight (kg), gravity (9.81 m s−−2), and vertical speed(m s−−1 × angle) (Handschin et al. 2007).
Exercise intervention
For 15 days, mice in groups 2 and 4 underwent treadmilltraining which began at approximately 14 m min−1 (50%of maximal treadmill speed) at 10 deg incline for 30 min
five times per week. It should be noted, however, that theintent was not to provide a training stimulus, but rather todetermine if (–)-epicatechin needed a metabolic stimulusto have an effect, as reported for GW1516 by Narkar et al.(2008).
Intact muscle contractility
Individual EDL muscles were rapidly dissected from eachmouse. The EDL muscles (6 muscles for each group) weremounted horizontally in a muscle strip myograph system(800MS; Danish Myo Technology, Aahus, Denmark) andperfused with Tyrode solution (in mM: 121 NaCl, 5KCl, 0.4 NaH2PO4, 1.8 CaCl2, 0.5 MgCl2, 24 NaHCO3,5.5 glucose, 0.1 EGTA) bubbled continuously with 95%O2 and 5% CO2 (final pH 7.4) at 32–34◦C during thetime course of the experiment. Muscle contractions wereevoked using electrical stimulation with an S48 stimulator(Grass Technologies, Quincy, MA, USA) at 1 ms pulseduration, 250 ms train duration, 40 V. After mounting themuscles, the optimal muscle length (L0) was determined at100 Hz. After determination of L0 each muscle rested for10 min. A force–frequency curve (1–200 Hz, 1 contractioneach 100 s) was then conducted in order to determine theexcitation–contraction coupling properties of the muscle.After resting again for 10 min, muscle performance wasevaluated by a fatigue run in which repeated contra-ctions were induced with increased stimulation frequencyevery 1 min (0.125, 0.25, 0.33 and 0.5 contractions persecond; 150 Hz, 40 V, 1 ms pulse duration, 250 ms trainduration) until the fatigue point, which was definedas a decrease in tension to 50% of the initial tensiondeveloped in the contractile run. After the experimentalprocedure, the muscles were blotted dry and weighed, andtension development was normalized with respect to themuscles cross-sectional area (N cm−2) according to Reidet al. (1987). Relative tension developed (P) was obtainedand the force–frequency curves were computed from themaximum tetanic tension (P0) evoked at 150 or 200 Hz (%P/P0) and fitted by a sigmoid non-linear regression usingthe equation P = Pmin + (P0XnH /F50
nH + XnH ), where Pmin
is the minimum tension developed, F50 is the midpoint ofthe curve (in Hz) and nH is the Hill coefficient, which iscorrelated to the steepness of the curve.
Tissue preparation
All mice were anaesthetized with sodium pentobarbital(60 mg kg−1, I.P.) and both left and right gastrocnemius,plantaris and quadriceps femoris muscles were removed,along with the heart. For the plantaris muscle an entiretransverse slice from the widest point of the middle bellyportion of the muscles was excised and frozen in precooledisopentane (–140◦C) and stored at –80◦C until further
C⃝ 2011 The Authors. Journal compilation C⃝ 2011 The Physiological Society

4618 L. Nogueira and others J Physiol 589.18
processing. Transverse 10 µm serial sections were cuton a cryotome (Reichert Jung Cryocut 1800; CambridgeInstruments, Buffalo, NY, USA) at –20◦C and mounted onslides for histochemical analysis of capillary number. Greatcare was taken to ensure that the widest part of the musclewas sectioned and that sectioning was perpendicular to theorientation of the fibres. The gastrocnemius muscle wasprepared for enzyme/metabolite measurements, whereasthe heart, contralateral plantaris, soleus, and quadricepsfemoris muscles were processed and stored for subsequentuse.
Capillary staining and indices
Sections from the plantaris muscle from all four groupswere stained using the method of Rosenblatt et al.(1987). Briefly, the sections were first fixed for 5 minin a Guth and Samaha fixative (Guth & Samaha, 1970)and then incubated for 1 h at 36◦C in a lead–adenosinetriphosphatase staining medium to stain capillaries. Itshould be noted that there are no differences in the numberof capillaries visualized with frozen biopsy samples usingthe Rosenblatt technique and the number visualizedin tissue sections prepared from perfusion-fixed muscle(Hepple & Mathieu-Costello, 2001).
Muscle sections were viewed under a light microscope(40× magnification, Jenalumar, Zeiss, Jena, Germany),and digital images were taken of the sections (Sony ModelDXC-960MD, Sony Corp., Tokyo, Japan). Capillarieswere quantified manually from the digital image onindividual fibres by a single individual. The followingindices were measured: (1) the number of capillariesaround a fibre (N CAF), (2) the capillary-to-fibre ratio onan individual-fibre basis (C/F i), and (3) capillary density(CD), which was calculated by using the fibre area asthe reference space (Hepple & Mathieu-Costello, 2001).Capillary-to-fibre perimeter exchange index (CFPE) wascalculated as an estimate of the capillary-to-fibre surfacearea (Hepple, 1997). Quantification of the capillarysupply was performed randomly selecting a fibre in anartifact-free region (no holes due to freeze fracture andfibres intact) (Wong et al. 2009). Fibre cross-sectional area(FCSA) and perimeter (FP) were measured with the imageanalysis system and commercial software (SigmaScan Prov. 5.0; Systat Software, Inc., Point Richmond, CA, USA).
Muscle metabolic enzyme activity
The gastrocnemius muscle was separated into 10 mg piecesand homogenized in 100 volumes (w:v) of buffer (175 mM
KCl, 2 mM EDTA; pH 7.4) for citrate synthase. In thebuffer, frozen muscle sections were pulverized using apestle for 60 s on ice. Homogenates were frozen in liquidnitrogen and underwent three freeze–thaw cycles using
liquid nitrogen. Before use, the homogenates were thaweda final time and centrifuged at 8000 g for 1 min to removeparticulate matter.
Using the supernatant, citrate synthase activity wasmeasured via the technique of Srere (1969). The activity ofcitrate synthase was measured by the rate of production ofthe mercaptide ion based on conversion of acetyl-CoA andoxaloacetate into citrate synthase and CoA-SH. CoA-SHin the presence of 5,5′-disthiobis-2-nitrobenzoic acid(DTNB) produces mercaptide ion. Samples were analysedin a Beckman DU 730 spectrophotomer (Beckman,Fullerton, CA, USA) at 412 nm. All samples were testedin triplicate and measured at 37◦C.
Western blotting
Approximately 50 mg of the heart and quadriceps femorismuscles were homogenized with a polytron in 500 µl lysisbuffer (1% Triton X-100, 20 mM Tris, 140 mM NaCl, 2 mM
EDTA, and 0.1% SDS) with protease and phosphataseinhibitor cocktails (P2714 and P2850, Sigma-Aldrich)supplemented with 0.15 mM PMSF, 5 mM Na3VO4 and3 mM NaF. Homogenates were passed through an insulinsyringe five times, sonicated for 30 min at 4◦C andcentrifuged (12,000 g) for 10 min. The total proteincontent was measured in the supernatant using theBradford method. A total of 40 µg of protein wasloaded onto a 4–15% precast TGX polyacrylamide gel(Bio-Rad), electrotransferred (12 V, 50 min), incubatedfor 1 h in blocking solution (5% non-fat dry milk inTBS plus 0.1% Tween 20 (TBS-T)), followed by a 3 hincubation at room temperature with primary mousemonoclonal antibodies: MitoProfile (complex I, 20 kDa;complex II, 30 kDa; complex III, 46 kDa; complex V,55 kDa; Timmers et al. (2011); oxidative phosphorylation,Total OXPHOS from MitoSciences cat no. MS601),Porin (35 kDa; Huffman et al. (2008); MitoSciences catno. MSA03), and Mitofilin (75 kDa; Iyer et al. (2009);MitoSciences cat no. MSM02). In addition, we usedthe following rabbit polyclonal antibodies against nNOS(∼155 kDa (Hayashi et al. 2009); Cell Signaling Cat#4234),anti-phospho-nNOS (∼155 kDa (Chen et al. 2000);Ser1417, Upstate Cat#07-544), anti-Tfam (30 kDa (Frankoet al. 2008); Sigma-Aldrich Cat#SAB1401383-100UG)to examine potential mechanisms of mitochondrialbiogenesis. All primary antibodies were diluted 1:1000and GAPDH (37 kDa; Pansters et al. (2011); rabbit poly-clonal, Cell Signaling cat no. 2118 14C10) primary anti-body was diluted 1:2000 in TBS-T plus 5% non-fat drymilk. Membranes were washed (3× for 5 min) in TBS-Tand incubated 1 h at room temperature in the presence ofHRP-conjugated secondary antibodies (anti-mouse IgG,or anti-rabbit IgG HRP-linked antibodies, Cell Signalingcat nos 7076 and 7074, respectively) diluted 1:10,000 in
C⃝ 2011 The Authors. Journal compilation C⃝ 2011 The Physiological Society

J Physiol 589.18 (–)-Epicatechin and muscle adaptation 4619
blocking solution. Membranes were again washed 3 timesin TBS-T, and the immunoblots were developed usingan ECL Plus detection kit (Amersham-GE). The bandintensities were digitally quantified using ImageJ software(http://www.nih.gov).
Electron microscopy
Pieces of the heart and plantaris muscles were fixed in 2%paraformaldehyde plus 2.5% glutaraldehyde (Ted Pella,Redding, CA, USA) in 0.1 M sodium cacodylate (pH 7.4)on ice for 24 h. The samples were washed three timeswith buffer consisting of 0.1 M sodium cacodylate plus3 mM calcium chloride (pH 7.4) on ice and then post-fixedwith 1% osmium tetroxide, 0.8% potassium ferrocyanide,3 mM calcium chloride in 0.1 M sodium cacodylate(pH 7.4) for 3 h, washed 3 times with ice-cold distilledwater, en bloc stained with 2% uranyl acetate at 4◦C for1 h, dehydrated through graded ethanol solutions, andembedded in Durcupan ACM resin (Fluka, St Louis, MO,USA). Ultrathin (80 nm) sections were post-stained withuranyl acetate and lead salts prior to imageing using a JEOL1200FX transmission EM operated at 80 kV. The negativeswere digitized at 1800 dpi using a Nikon CoolScansystem, giving an image size of 4033 × 6010 pixels anda pixel resolution of 2.35 nm. A stereological analysisto ascertain the ratio of mitochondrial volume to cyto-plasmic volume was performed with Adobe Photoshop.Point counting was used to determine the mitochondrialvolume densities by overlaying a grid on each digitizedimage. Mitochondria and cytoplasm lying under inter-cepts were counted. The relative volume of mitochondriawas expressed as the ratio of intercepts coinciding withthis organelle to the intercepts coinciding with cytoplasm.Mitochondrial membrane surface areas were measuredusing ImageJ software (http://www.nih.gov).
Statistical analyses
All data are presented as means ± SEM. Separate one-wayANOVAs were performed to compare the relevant groupmeans for each dependent variable. Separate 2 (time:pre-training and post-training) × 4 (group: water, W-Ex,(–)-Epi and (–)-Epi-Ex) mixed-factorial ANOVAs wereperformed for body mass as well as exercise indices. Whenappropriate, Tukey’s HSD was used post hoc to determinewhich means were significantly different from each other(Keppel & Wickens, 2004). An α level at P ≤ 0.05 wasselected for all statistical comparisons. The analyses wereconducted using the Statistical Package for the SocialSciences software (SPSS, v.18.0, SPSS Inc., Chicago, IL,USA).
Results
Animals
As shown in Table 1, there were no statistically significantdifferences detected in body, heart and muscle massesbetween the four groups. In addition, there wereno statistical differences detected when the data werenormalized to body mass.
Incremental treadmill test
Table 2 shows the exercise indices for each group prior toand following the 15 day intervention. The two-way mixedfactorial ANOVA resulted in a significant interaction. Thestatistical model was subsequently decomposed and theseanalyses indicated a statistically significant increase in allexercise indices for the (–)-epicatechin groups at Day 15when compared to the water groups. There were nostatistically significant differences detected, however, forthe exercise indices within the two groups (i.e. water vs.W-Ex or (–)-Epi only vs. (–)-Epi-Ex).
Hindlimb capillarity
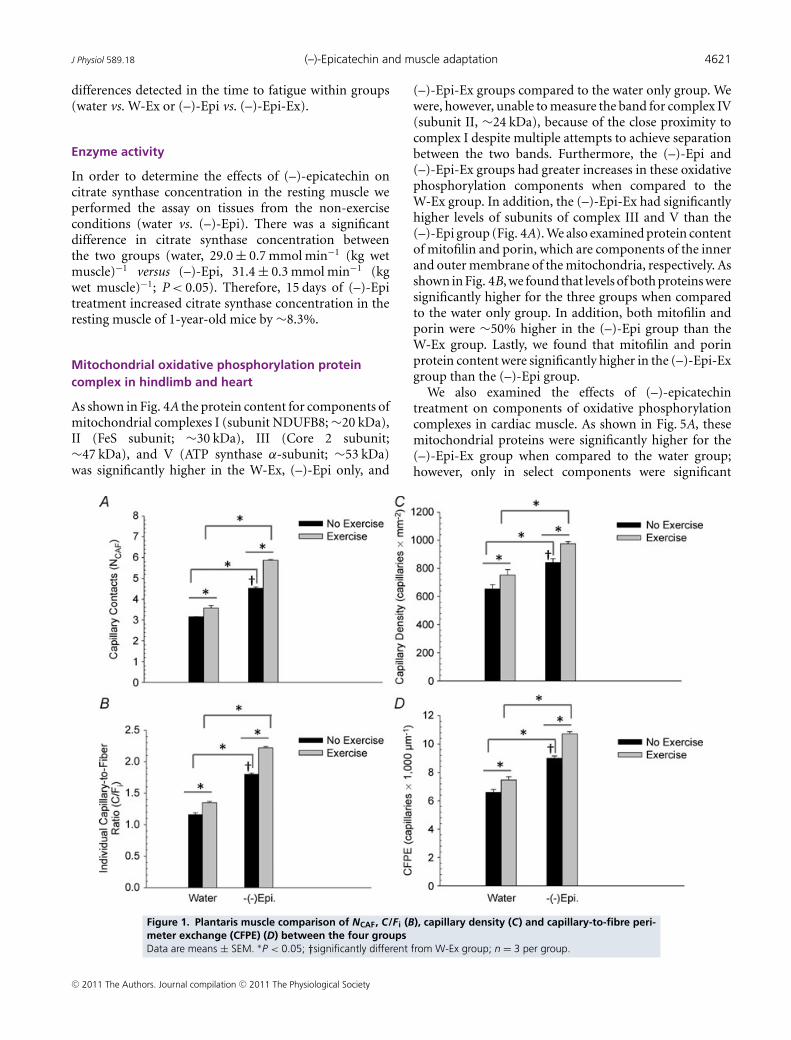
In the plantaris muscle (Fig. 1) there were significantdifferences in capillary indices between the (–)-epicatechinand water groups. In all cases, the indices of musclecapillarity (N CAF, C/F i, capillary density and CFPE) weregreater in the (–)-epicatechin treated groups than in thewater treated groups. As shown in Fig. 1, there weresignificant increases in capillarity for the W-Ex groupwhen compared to the water only group. In addition, the(–)-Epi-Ex group had the highest amount of capillarity(P < 0.05) in the plantaris muscle than the other threegroups. Also, there were significant mean differencesbetween the (–)-epicatechin and water groups for FCSAand FP (Table 3). Lastly, the (–)-Epi-Ex group had greaterFCSA than the (–)-Epi group (Table 3).
Intact muscle contractility
Effects of exercise training on the contractile propertiesof EDL muscle. As shown in Fig. 2, the force–frequencycurves from the four groups demonstrated a significant(P < 0.01) right-shift at the submaximal frequencies ofstimulation in the two exercised trained groups (W-Exand (–)-Epi-Ex), but no statistically significant differenceswere detected in the non-exercise groups. Table 4summarizes all the contractile properties calculated inthe four experimental groups. The midpoint of thecurve (F50), was significantly increased in both exercisedgroups (W-Ex and (–)-Epi-Ex) when compared to thenon-exercise groups (P < 0.05). There was no statisticallysignificant difference detected on either the steepness of
C⃝ 2011 The Authors. Journal compilation C⃝ 2011 The Physiological Society

4620 L. Nogueira and others J Physiol 589.18
Table 1. Body, heart and hindlimb muscle mass
Groups
Water only W-Ex (–)-Epi only (–)-Epi-Ex
n = 6 n = 7 n = 5 n = 7
Day 0 Day 15 Day 0 Day 15 Day 0 Day 15 Day 0 Day 15
Body mass (g) 31.8 ± 0.8 32.3 ± 0.9 32.8 ± 0.7 32.4 ± 0.9 32.9 ± 0.9 32.3 ± 1.0 32.6 ± 0.8 33.1 ± 0.9Heart mass (mg) — 136.7 ± 6.6 — 151.3 ± 7.7 — 138.6 ± 3.8 — 142.2 ± 4.5Heart/body mass
(mg g−1)— 4.30 ± 0.06 — 4.66 ± 0.21 — 4.29 ± 0.06 — 4.33 ± 0.21
Quadriceps femorismass (mg)
— 169.4 ± 8.9 — 165.3 ± 8.5 — 168.3 ± 8.7 — 171.1 ± 5.2
Quadricepsfemoris/bodymass (mg g−1)
— 5.30 ± 0.39 — 5.09 ± 0.23 — 5.23 ± 0.31 — 5.20 ± 0.21
Gastrocnemiusmass
— 109.9 ± 5.6 — 123.0 ± 3.4 — 111.7 ± 2.8 — 119.8 ± 3.2
Gastrocnemius/bodymass (mg g−1)
— 3.42 ± 0.16 — 3.79 ± 0.05 — 3.46 ± 0.09 — 3.63 ± 0.09
Plantaris (mg) — 16.4 ± 0.6 — 15.5 ± 1.3 — 17.9 ± 0.3 — 16.1 ± 1.1Plantaris/body
mass (mg g−1)— 0.51 ± 0.03 — 0.48 ± 0.04 — 0.55 ± 0.02 — 0.49 ± 0.03
The data are means ± SEM. There was no significant difference (P > 0.05) between groups for any of the indices.
Table 2. Results of incremental treadmill test for all groupsGroups
Water only W-Ex (–)-Epi only (–)-Epi-Ex
n = 6 n = 7 n = 5 n = 7
Day 0 Day 15 Day 0 Day 15 Day 0 Day 15 Day 0 Day 15Duration (s) 772 ± 17 730 ± 29 806 ± 15 745 ± 27 771 ± 18 931 ± 32∗ ,∗∗ 804 ± 15 958 ± 27∗ ,∗∗
Speed(m min−1) 27.3 ± 0.6 25.7 ± 1.0 28.0 ± 0.6 26.0 ± 0.9 26.8 ± 0.7 32.4 ± 1.1∗ ,∗∗ 28.3 ± 0.6 33.4 ± 0.9∗ ,∗∗
Distance (m) 245 ± 9 222 ± 16 255 ± 8 226 ± 15 237 ± 10 323 ± 17∗ ,∗∗ 259 ± 8 343 ± 15∗ ,∗∗
Work (J) 379 ± 16 343 ± 28 410 ± 15 351 ± 26 377 ± 18 533 ± 31∗ ,∗∗ 414 ± 15 580 ± 26∗ ,∗∗
Power (W) 0.0142 ± 0.0004 0.0135 ± 0.0005 0.0150 ± 0.0004 0.0138 ± .0005 0.0144 ± 0.0004 0.0171 ± 0.0006∗ ,∗∗ 0.0150 ± 0.0004 0.0180 ± 0.0005∗ ,∗∗
The data are means ± SEM. ∗Significantly (P < 0.05) different from Water-only group; ∗∗significantly different (P < 0.05) from W-Ex group.
the curves (nH) or the absolute maximal tetanic tension(P0) between the four groups. Single twitch tension (Pt)and fraction of the maximal tension developed with asingle twitch tension (Pt/P0) were significantly smallerin the (–)-Epi-Ex group compared to the (–)-Epi group(P < 0.05).
Effects of (–)-epicatechin on the contractile propertiesof EDL muscle. When the animals were treated with(–)-epicatechin for 15 consecutive days, either in thepresence or in the absence of exercise training, therewas no statistically significant shift detected in theforce–frequency relationship (Fig. 2) and no statisticallysignificant differences were detected in P0, Pt, F50 andnH compared to the control group (Table 4). Thus,
(–)-epicatechin did not alter contractile properties of theEDL muscle.
Effect of (–)-epicatechin treatment on the time to fatiguein in vitro EDL muscle. Figure 3A shows a representativerecording of tetanic contractions during a fatigue runfrom the four groups of mice. The absolute initialtetanic force was not statistically different among thefour groups; however, the muscles from animals treatedwith (–)-epicatechin were significantly more resistant tofatigue (130 ± 4 vs. 164 ± 10 s and 128 ± 5 vs. 179 ± 9 sfor water vs. (–)-Epi and W-Ex vs (–)-Epi-Ex, respectively;P < 0.05, Fig. 3B) which corresponded to a difference ofapproximately 30–45 s. There were, however, no statistical
C⃝ 2011 The Authors. Journal compilation C⃝ 2011 The Physiological Society
J Physiol 589.18 (–)-Epicatechin and muscle adaptation 4621
differences detected in the time to fatigue within groups(water vs. W-Ex or (–)-Epi vs. (–)-Epi-Ex).
Enzyme activity
In order to determine the effects of (–)-epicatechin oncitrate synthase concentration in the resting muscle weperformed the assay on tissues from the non-exerciseconditions (water vs. (–)-Epi). There was a significantdifference in citrate synthase concentration betweenthe two groups (water, 29.0 ± 0.7 mmol min−1 (kg wetmuscle)−1 versus (–)-Epi, 31.4 ± 0.3 mmol min−1 (kgwet muscle)−1; P < 0.05). Therefore, 15 days of (–)-Epitreatment increased citrate synthase concentration in theresting muscle of 1-year-old mice by ∼8.3%.
Mitochondrial oxidative phosphorylation proteincomplex in hindlimb and heart
As shown in Fig. 4A the protein content for components ofmitochondrial complexes I (subunit NDUFB8; ∼20 kDa),II (FeS subunit; ∼30 kDa), III (Core 2 subunit;∼47 kDa), and V (ATP synthase α-subunit; ∼53 kDa)was significantly higher in the W-Ex, (–)-Epi only, and
(–)-Epi-Ex groups compared to the water only group. Wewere, however, unable to measure the band for complex IV(subunit II, ∼24 kDa), because of the close proximity tocomplex I despite multiple attempts to achieve separationbetween the two bands. Furthermore, the (–)-Epi and(–)-Epi-Ex groups had greater increases in these oxidativephosphorylation components when compared to theW-Ex group. In addition, the (–)-Epi-Ex had significantlyhigher levels of subunits of complex III and V than the(–)-Epi group (Fig. 4A). We also examined protein contentof mitofilin and porin, which are components of the innerand outer membrane of the mitochondria, respectively. Asshown in Fig. 4B, we found that levels of both proteins weresignificantly higher for the three groups when comparedto the water only group. In addition, both mitofilin andporin were ∼50% higher in the (–)-Epi group than theW-Ex group. Lastly, we found that mitofilin and porinprotein content were significantly higher in the (–)-Epi-Exgroup than the (–)-Epi group.
We also examined the effects of (–)-epicatechintreatment on components of oxidative phosphorylationcomplexes in cardiac muscle. As shown in Fig. 5A, thesemitochondrial proteins were significantly higher for the(–)-Epi-Ex group when compared to the water group;however, only in select components were significant
Figure 1. Plantaris muscle comparison of NCAF, C/F i (B), capillary density (C) and capillary-to-fibre peri-meter exchange (CFPE) (D) between the four groupsData are means ± SEM. ∗P < 0.05; †significantly different from W-Ex group; n = 3 per group.
C⃝ 2011 The Authors. Journal compilation C⃝ 2011 The Physiological Society

4622 L. Nogueira and others J Physiol 589.18
Table 3. Muscle morphometry assessments for the plantaris muscle
Groups
Water only W-Ex (–)-Epi only (–)-Epi-Ex
Plantaris Muscle Day 0 Day 15 Day 0 Day 15 Day 0 Day 15 Day 0 Day 15
Area (µm2) — 1794 ± 50 — 1939 ± 46 — 2205 ± 35∗,∗∗ — 2428 ± 10∗,∗∗,†
Perimeter (µm) — 175.8 ± 2.5 — 184.6 ± 2.5 — 201.1 ± 2.5∗,∗∗ — 210.8 ± 4.2∗,∗∗
The data are means ± SEM. ∗Significantly (P < 0.05) different from Water-only group; ∗∗significantly different from W-Exgroup; †significantly different from (–)-Epi only group.
differences detected between the water group versus theW-Ex and (–)-Epi groups. In addition, only the complexII subunit was significantly higher for the (–)-Epi-Ex whencompared to the (–)-Epi group (see Fig. 5A). We alsofound that both mitofilin and porin protein content weresignificantly higher for the three groups (W-Ex, (–)-Epi,and (–)-Epi-Ex) when compared to the water only group;Fig. 5B). For mitofilin, we found that the (–)-Epi-Ex grouphad significantly higher protein content than the W-Exand (–)-Epi groups. For porin, there were no statisticaldifferences detected between the three groups (W-Ex,(–)-Epi, and (–)-Epi-Ex; Fig. 5B).
To gain better insight into the underlying mechanismsof (–)-epicatechin’s effect, we analysed changes in proteincontent of nNOS and the phosphorylation status of nNOS(p-nNOS) as well as for Tfam content in the quadriceps
Figure 2. Relative isometric tension (P/P0) obtained atdifferent frequencies of stimulation from EDL muscles fromnon-exercised mice (open and filled triangles) or exercisedmice (open and filled circles) that were fed with(–)-epicatechin (open symbols) or in the control mice (filledsymbols)∗P < 0.01, water vs. W-Ex; ∗∗P < 0.01, (–)-Epi vs. (–)-Epi-Ex. Data aremeans ± SEM, n = 6 muscles.
femoris muscles for each group. As shown in Fig. 6, bothnNOS and p-nNOS, and the p-nNOS/nNOS ratio (Fig. A)as well as Tfam (Fig. B) were significantly increased in allthree groups when compared to the water only group.However, there were no statistically significant differencesdetected in p-nNOS/nNOS ratio between the three groups(W-Ex, (–)-Epi and (–)-Epi-Ex). We were unable to detecteNOS in the skeletal muscle samples (data not shown). Itshould be noted, that the levels of Tfam were significantlyhigher in the (–)-Epi-Ex group compared to the W-Ex and(–)-Epi groups.
Electron microscopy
Electron microscopy was used to investigateultrastructural modifications to the plantaris muscleafter (–)-epicatechin treatment. High-resolution imagescomprising large regions of muscle tissue were examinedfrom three (–)-epicatechin only treated mice (group (3)and compared with images from three water only controlmice (group (1). We observed that in (–)-epicatechintreated mouse plantaris muscle there were more abundantmitochondria and cristae than in the controls (Fig. 7A andB). The measured mean volume density of mitochondria,expressed as the percentage of the cytoplasm occupiedby this organelle, was 10.0% after epicatechin treatmentcompared to 5.7% (P < 0.05) in the control. The cristaeabundance in (–)-epicatechin treated mice was alsosignificantly higher than in the control mitochondria(Fig. 7B). The mean cristae surface area, normalized to themitochondrial outer membrane (and thus unitless), was1.26 after (–)-epicatechin treatment compared to 0.77 incontrols (P < 0.05). When the entire mitochondrial innermembrane surface area was measured and normalized tothe outer membrane the mean inner membrane surfacearea after (–)-epicatechin treatment was 2.22 compared to1.72 in controls (P < 0.05). In addition, we examined themean cristae surface area for the cardiac muscle and founda statistically significant increase (∼25%) in (–)-Epi onlygroup when compared to the water group. Treatment alsosignificantly increased mitochondrial volume density by11% in cardiac muscle (P < 0.05, Fig. 8).
C⃝ 2011 The Authors. Journal compilation C⃝ 2011 The Physiological Society

J Physiol 589.18 (–)-Epicatechin and muscle adaptation 4623
Table 4. Contractile properties of the EDL for the group treated groups
Water only W-Ex (–)-Epi Only (–)-Epi-Ex
Pt (N cm−2) 3.6 ± 0.4 2.3 ± 0.8 3.3 ± 0.6 1.5 ± 0.6∗
P0 (N cm−2) 21 ± 2 21 ± 3 20 ± 4 17 ± 4Pt/P0 0.17 ± 0.03 0.10 ± 0.03 0.18 ± 0.05 0.07 ± 0.02∗∗
F50 (Hz) 72 ± 4 85 ± 5† 68 ± 5 87 ± 4∗
nH 4.9 ± 0.2 5.2 ± 0.2 5.3 ± 0.2 4.3 ± 0.3∗
The data are means ± SEM. Pt, twitch tension; P0, maximal tetanic tension;F50, frequency of stimulation to evoke 50% of P0; nH, Hill coefficient.∗P < 0.05, (–)-Epi vs. (–)-Epi-Ex; ∗∗P < 0.05, water vs. (–)-Epi-Ex; †P < 0.05,water vs. W-Ex.
Discussion
The principle and unique findings of the currentinvestigation are that 15 consecutive days of(–)-epicatechin treatment resulted in (1) improvedtreadmill performance; (2) delayed onset ofmuscle fatigue; (3) increased muscle capillarity; (4)increased levels of proteins comprising the oxidative
phosphorylation machinery as well as mitofilin andporin in skeletal and cardiac muscles; and (5) increasedmitochondrial volume density and cristae abundancein hindlimb and heart muscles. In addition, we foundincreases in Tfam expression in (–)-epicatechin-treatedmice. These effects were greater than those fromexercise alone. Furthermore, the combination of exercise
Figure 3. A, representative tension recordings, from the EDL muscle, during the fatigue run from thenon-exercised group (left panel) and from the exercised group (right panel) normalized to the initialtension. B, results of fatigue run for all four groups.Data are means ± SEM, n = 6 muscles. ∗P < 0.05.
C⃝ 2011 The Authors. Journal compilation C⃝ 2011 The Physiological Society

4624 L. Nogueira and others J Physiol 589.18
Figure 4. A, mitochondrial protein complexes for the quadriceps femoris muscle∗Significant differences between groups; ∗∗significant differences between W-Ex, (–)-Epi, and (–)-Epi-Ex versusW group; †significantly different from corresponding complex for (–)-Epi group. B, mitofilin and porin proteins.∗∗Significant differences between W-Ex, (–)-Epi, and (–)-Epi-Ex versus water group for mitofilin and porin. Dataare means ± SEM, n = 3 per group.
Figure 5. A, mitochondrial protein complexes for the cardiac muscle∗Significantly different from corresponding complex for W group; #significantly different with correspondingcomplex for water group; ‡significantly different from corresponding complex for W-Ex group; ∗∗significantdifferences between W-Ex, (–)-Epi, and (–)-Epi-Ex versus W group; †significantly different from correspondingcomplex of (–)-Epi group. B, mitofilin and porin protein.
∗∗Significant differences between W-Ex, (–)-Epi, and
(–)-Epi-Ex versus water group for mitofilin and porin. Data are means ± SEM, n = 3 per group.
C⃝ 2011 The Authors. Journal compilation C⃝ 2011 The Physiological Society

J Physiol 589.18 (–)-Epicatechin and muscle adaptation 4625
and (–)-epicatechin treatment resulted in greaterimprovements in selected endpoints. To our knowledge,this is the first study that has examined the effects of alow dose (–)-epicatechin treatment in mice. The natureof the observed changes indicate that the effects occur inmultiple organs and tissues that as a whole can lead to asustained increase in exercise performance.
Muscle capillarity and exercise performancein response to (–)-epicatechin treatment
In the current study, we did not detect statistical differencesin body or muscle masses between the four groups, butmice in the (–)-Epi or (–)-Epi-Ex groups had highertreadmill running capacities than those in the controlgroups after 15 consecutive days of treatment (Table 2).The ability to deliver oxygen to the working muscle is acoordinated effort involving multiple factors. Capillariesare an integral part of this process since they provide aninterface between the circulatory system and the muscle.For example, Waters et al. (2004) reported that 14 daysof voluntary wheel running was sufficient to induceangiogenesis and increase the capillary-to-fibre ratio by∼56% in the plantaris muscle of mice, whereas Olfert et al.(2009) reported that deletion of the vascular endothelialgrowth factor (VEGF) gene in cardiac and skeletal muscleresulted in profound reductions of exercise capacity whencompared to littermate controls. In the present study, anumber of established capillary indices (Hepple et al.1997; Malek & Olfert, 2009; Malek et al. 2010) wereused to characterize the effects of (–)-Epi and (–)-Epi-Exon capillarization of the plantaris muscle. This musclewas selected because glycolytic fibres typically have lowercapillary abundance relative to oxidative fibres (Malek& Olfert, 2009; Malek et al. 2010). When compared tothe W-Ex group, the (–)-Epi group increased C/F i by∼33%, whereas the combination of (–)-Epi-Ex increasedC/F i by ∼64%. This pattern of increased capillarity wasconsistent for all other indices (Fig. 1). In addition, we alsoestimated CFPE, which provides a measure of the inter-face between the capillaries and muscle fibres (Hepple& Mathieu-Costello, 2001). The observed increase inthe CFPE index for the (–)-Epi and (–)-Epi-Ex groupssuggests an increased oxygen flux potential, which mayexplain the increase in endurance capacity (Table 2) whencompared to the control groups. Although we did notobserve any statistical differences in treadmill exerciseindices (Table 2) between the (–)-Epi and (–)-Epi-Ex,this may, in part, be explained by the variabilityinherent with treadmill testing. Nevertheless, thesedata are consistent with well-established correlationalstudies between muscle capillarity, oxygen conductanceand/or exercise performance (Richardson et al.2000; Howlett et al. 2003) indicating that muscle
capillarity plays a key role in limiting exercisecapacity.
The ability to sustain exercise is an integrativeresponse between central (cardiorespiratory) and peri-pheral (muscle) factors. Approaches for the evaluationof cardiac function during exercise in mice arelimited and measurements of cardiac function duringtreadmill exercise are currently not feasible given thesize of the mouse as well as practical issues suchas equipment limitations (Malek & Olfert, 2009).Therefore, in the current study, it was not possibleto separate the contribution of central and peri-pheral factors to endurance capacity with (–)-epicatechintreatment.
Figure 6. Representative Western blot results for nNOS,p-nNOS and p-nNOS/nNOS ratio (A) and Tfam (B) fromquadriceps femoris muscle∗P < 0.05; †significantly different from water only group for p-nNOSand nNOS.
C⃝ 2011 The Authors. Journal compilation C⃝ 2011 The Physiological Society

4626 L. Nogueira and others J Physiol 589.18
Intact whole muscle response to (–)-epicatechintreatment
In the current investigation, the effects of 15 consecutivedays of (–)-epicatechin treatment with or without exercisewere evaluated using isolated whole EDL muscle, whichis composed mainly of fast-twitch, type IIA and IIBfibres in mice (Crow & Kushmerick, 1982). This approachallows a better evaluation of muscle fatigue propertiesin the absence of central factors (i.e. cardiorespiratoryand microcirculatory). One advantage of using the EDLmuscle compared to other thicker fast-twitch muscles,like gastrocnemius, is the relative small diameter of theEDL, allowing sufficient oxygenation of the core of themuscle during repetitive tetanic contractions (Barclay,2005). In order to evaluate the contractile apparatus in thenon-fatigued EDL muscle, tension was evoked electricallyat different frequencies of stimulation. This resulted in theproduction of twitches (single pulse of depolarization) aswell as unfused and fused tetanic contractions (Nogueira& Hogan, 2010).
As shown in Fig. 2 and by the increased F50, theforce–frequency curves for the exercise groups weresignificantly shifted to the right when compared to
the non-exercised group. Interestingly, the F50 in thenon-exercised group (∼70 Hz) was smaller than thereported values in the literature for EDL muscle, whichis around 80–90 Hz (Tang et al. 2004), whereas theexercised group had similar values (∼85 Hz) to those inthe literature. It is important to note that the animalschosen for this work were 1 year old; therefore, it is possiblethat ageing per se affected the contractile parametersin these mice as reported previously using intact singlemouse fibres (Gonzalez et al. 2000). Nevertheless, wedid not detect significant statistical difference in themaximal tetanic tension developed in all four groups. Onepossible interpretation is that moderate exercise did notaffect the maximal Ca2+ release and cross-bridge cycleduring maximal activation (Tang et al. 2004; Ottenheijmet al. 2009). Several studies (Shindoh et al. 1990; Reidet al. 1993) have shown that inhibition of muscle sub-maximal tension in the non-fatigued state is related tothe increased muscle antioxidant activity either by endo-genous or exogenous antioxidant enzymes. It is possiblethat the exercise regimen used in the current study mayhave increased the antioxidant pool in the EDL muscle asindicated by the right-shift of the force–frequency curve.
Figure 7. Mitochondrial volume density for the plantaris muscle (A), and cristae membrane surface areanormalized to the outer membrane surface area (B)Data are means and SEM. The representative electron microscopy images of control (left side) and (–)-epicatechin(right side) treated muscle above each graph. For panel A, the scale bar represents 2 µm, whereas for panel B, thescale bar represents 200 nm. ∗P < 0.05.
C⃝ 2011 The Authors. Journal compilation C⃝ 2011 The Physiological Society

J Physiol 589.18 (–)-Epicatechin and muscle adaptation 4627
Chronic treatment with a flavanoid such as (–)-epicatechinwith known antioxidant properties (Yamazaki et al. 2008)did not, however, affect maximal tension developmentnor promote any shift in the force–frequency relationshipsuggesting that (–)-epicatechin-induced effects are notmediated through changes on intracellular redox status.
After the force–frequency curves were determined,individual muscles from the four groups were repeatedlycontracted at maximal tetanic tension up to a fatigue timepoint. Although the EDL muscles for the water groupswere more fatigable than those for the (–)-epicatechingroups, there were no statistical differences within the twogroups between the non-exercise and exercise conditions(Fig. 3B). These results are consistent with the in vivotreadmill test results (Table 2). Nevertheless, mice treatedwith (–)-epicatechin, on average, were 31% more fatigueresistant than mice treated with water (Fig. 3). Ourfindings seem to be unique since it has been reportedthat resveratrol, a flavonoid compound found in redgrapes, did not improve muscle fatigability during in situisometric muscle action in young (3–5 months) or old(26–28 months) rats (Ryan et al. 2010). The results of thecurrent study indicates that (–)-epicatechin treatment mayreduce muscle fatigue in fast-twitch muscle, independentof exercise training.
Changes in mitochondrial structure
Skeletal muscle. The increase in mitochondrial densityis a typical adaptation to endurance training whichis well documented in the literature (Holloszy, 1967;Wright et al. 2007). In the current investigation, weexamined multiple components of the mitochondriaincluding enzyme activities, ultrastructural parameters(i.e. cristae abundance), protein expression of oxidativephosphorylation machinery, and the inner (mitofilin)and outer (porin) membranes in the quadriceps femorismuscle. This muscle was selected because it predominantlycontains the Type IIb myosin heavy chain isoform (Salernoet al. 2004; Kohn & Myburgh, 2007). As shown inFig. 4A, there were significant increases in componentsfor each of the probed complexes for the W-Ex, (–)-Epi,and (–)-Epi-Ex groups when compared to the watergroup. An interesting finding is that the W-Ex grouphad significantly higher amounts of protein for eachcomplex component when compared to the water groupeven though we did not observe an increase in functional(i.e. treadmill) capacity (Table 2). Another unique findingwas that the (–)-epicatechin group resulted in greaterprotein expression than the W-Ex group and this changewas associated with a 25% improvement in treadmillperformance.
Figure 8. Mitochondrial volume density for the heart muscle (A), and cristae membrane surface areanormalized to the outer membrane surface area (B)Data are means and SEM. The representative electron microscopy images of control (left side) and (–)-epicatechin(right side) treated muscle above each graph. For panel A, the scale bar represents 4 µm, whereas for panel B, thescale bar represents 400 nm. ∗P < 0.05.
C⃝ 2011 The Authors. Journal compilation C⃝ 2011 The Physiological Society

4628 L. Nogueira and others J Physiol 589.18
Mitofilin is an inner membrane protein (Gieffers et al.1997) that is enriched in the narrow space between themitochondrial inner boundary and the outer membranewhere it can assemble into a large multimeric proteincomplex. John et al. (2005) reported that down-regulationof mitofilin resulted in a disorganized mitochondrialinner membrane with a subsequent increase in reactiveoxygen species production and membrane potential. Innermembranes failed to form tubular or vesicular cristae andappeared as closely packed stacks of membrane sheetsthat fused intermittently. In contrast, gross mitochondrialfission and fusion appeared normal. Thus, mitofilinappears to potentially play an important role in thegeneration and/or assembly of inner mitochondrialmembrane. Porin, also known as a voltage-dependentanion channel (VDAC), is found predominantly in theouter membrane of the mitochondria and appears tofacilitate ion exchange between the mitochondria andcytosol (Benz, 2004; Singha et al. 2009). Recently, Park et al.(2010) characterized the role of porin in Drosophila muscleand reported that porin mutants exhibited elongatedmitochondria. This phenotype could be reversed byincreased mitochondrial fission. Furthermore, increasedfission by Drp1 expression suppressed flight defects inporin mutants. Collectively these results suggest that porinmay play a critical role in mitochondrial remodelling.
Mitofilin and porin protein levels increased significantlyin both W-Ex, (–)-Epi, and (–)-Epi-Ex when compared tothe water group (Fig. 4B). Another unique finding was thatthe combination of (–)-epicatechin and exercise furtherincreased mitofilin and porin levels when compared to(–)-epicatechin treatment alone (Fig. 4B). Thus, theseresults suggest that (–)-epicatechin treatment mimicsthe effects of exercise on these two proteins, which areimportant regulators of mitochondrial inner structure andremodelling.
We also examined mitochondrial volume density andcristae abundance in the plantaris muscle comparing onlywater and (–)-Epi groups (Fig. 7). This approach was takento determine whether (–)-epicatechin treatment alonewould result in mitochondrial biogenesis in a primarilyglycolytic muscle independent of daily exercise. As shownin Fig. 7 (both panels), (–)-epicatechin treatment resultedin∼75% greater mitochondrial volume density and∼65%greater cristae membrane surface area when comparedto the water group. It has been suggested that thecristae membranes are functionally distinct from the innerboundary membranes with the mitochondrial complexesenriched in the cristae (Frey et al. 2002; Gilkersonet al. 2003) Recently, Perkins & Ellisman (2010) reportedthat cristae abundance and shape are directly tied toenergy production in nerve tissue. A predominance oflamellar cristae in the mitochondria of the plantarismuscle was found, which allows for a greater number ofcomplexes. These data indicate that 15 consecutive days
of (–)-epicatechin treatment resulted in ultrastructuralchanges in the mitochondria that potentially increase thecapacity to produce energy. This assumption is supportedby the observation that hummingbird muscles are knownto possess mitochondria with very high cristae abundanceand these features correlate with very high levels ofoxidative capacity (Suarez et al. 1991).
One of the upstream signals that may be involved inmitochondrial biogenesis is nitric oxide (NO) (Nisoliet al. 2003; Wadley & McConell, 2007). Physiologicalincreases in NO can result from the upregulation and/oractivation of either endothelial or neuronal NOS isoforms(eNOS or nNOS, respectively). The precise role that NOplays in modulating mitochondrial biogenesis responsewith exercise is, however, unclear (Wadley & McConell,2007). In the present investigation, we examined theeffects of (–)-epicatechin on skeletal muscle eNOS andnNOS content and compared them with those inducedin conjunction with exercise. No detectable levels ofskeletal muscle eNOS were observed with any of thetreatment groups, which agrees with the low activityof eNOS in skeletal muscle fibres (Kobzik et al. 1994).(–)-Epicatechin treatment increased the total amount ofnNOS and phosphorylation of nNOS (p-nNOS/nNOSratio) in skeletal muscle and the effects were comparableto the exercise groups. However, the apparent lack ofadditional increases in total nNOS and p-nNOS/nNOSratio with (–)-Epi-Ex group prevents us from providingfurther evidence as to a possible stimulatory role for nNOSgenerated NO in skeletal muscle mitochondrial biogenesisas documented under these conditions.
The transcriptional factor Tfam has been recognizedas an important downstream mediator of mitochondriabiogenesis in response to exercise (Safdar et al. 2010).Increases in Tfam levels are typically associated withincreases in mitochondrial density in muscle. In a studyby Little et al. (2010), low-volume high interval trainingin humans was associated with increases in Tfam proteinlevels of ∼20% in skeletal muscle. In the present study,the results indicated that (–)-epicatechin stimulated Tfamprotein levels and that the effects were comparable tothose of exercise (Fig. 6). In addition, skeletal muscle Tfamprotein levels increased further when (–)-epicatechintreatment was combined with exercise. Taken together,these results indicate that (–)-epicatechin may potentiallyexert exercise mimetic effects when taken alone, but alsoprovides a synergist effect when combined with exercise.
Cardiac muscle. The heart relies exclusively on oxidativephosphorylation to generate energy and this is reflected bythe abundant presence of mitochondria, which comprise∼30% of the myocyte volume. Recent studies, however,have shown decreases in mitochondrial function of cardiacmuscle with age (Hagen et al. 2002; Moreau et al.
C⃝ 2011 The Authors. Journal compilation C⃝ 2011 The Physiological Society

J Physiol 589.18 (–)-Epicatechin and muscle adaptation 4629
2004). The effects of (–)-epicatechin on the myocardiumare of great interest and therefore have been examinedpreviously by our group (Yamazaki et al. 2008, 2010;Ramirez-Sanchez et al. 2010). For example, Yamazaki et al.(2010) reported that (–)-epicatechin, at the same dosage asin the current study, given for 10 consecutive days resultedin short term (∼52% reduction in infarction size after 48 hof permanent coronary occlusion (PCO)) as well as longterm (33% after 3 weeks of PCO) myocardial protection.More recently, Panneerselvam et al. (2010) reported thattreatment of mice with (–)-epicatechin (1 mg (kg bodyweight)−1) for 10 consecutive days resulted in myocardialprotection from ischemia–reperfusion injury.
In the present study, we found increases in selectmitochondrial complex proteins as well as mitofilinand porin (Fig. 5). Electron microscopy results showsignificant increases in cardiomyocyte mitochondriavolume density. Most notably, there was increasedcristae membrane surface area with (–)-epicatechintreatment. To our knowledge, this is the first study toreport mitochondrial biogenesis in cardiac muscle usingquantitative measures (Fig. 8). Findings from the presentstudy may, in part, explain the cardioprotective propertiesof (–)-epicatechin as treatment likely results in increasedoxidative capacity and energy reserves.
In summary, we report the novel finding that15 consecutive days of (–)-epicatechin treatment in1-year-old mice notably increased treadmill performanceand time to fatigue. To our knowledge this is thefirst study with (–)-epicatechin to integrate functionaland clinically relevant physiological animal data withstructural and morphological data from electron micro-scopy. This improvement in exercise capacity is likely tobe the result of the pleiotropic effects of (–)-epicatechinat multiple levels including capillarity as well asmitochondrial content, structure and function. Theeffects reported on mitochondrial cristae abundanceappear quite unique and deserve further investigation. Inaddition, the combination of (–)-epicatechin treatmentand physical activity was shown to increase componentsof oxidative phosphorylation and capillarity above andbeyond (–)-epicatechin treatment alone. These results,therefore, warrant the evaluation of the underlyingmechanisms of action of (–)-epicatechin and its potentialclinical application as an exercise mimetic.
References
Bailey SJ, Winyard PG, Vanhatalo A, Blackwell JR, DiMenna FJ,Wilkerson DP & Jones AM (2010). Acute L-argininesupplementation reduces the O2 cost of moderate-intensityexercise and enhances high-intensity exercise tolerance.J Appl Physiol 109, 1394–1403.
Barclay CJ (2005). Modelling diffusive O2 supply to isolatedpreparations of mammalian skeletal and cardiac muscle.J Muscle Res Cell Motil 26, 225–235.
Benz R (2004). Bacterial and Eukaryotic Porins: Structure,Function, Mechanism. Wiley-VCH, Weinheim, Germany.
Buijsse B, Weikert C, Drogan D, Bergmann M & Boeing H(2010). Chocolate consumption in relation to blood pressureand risk of cardiovascular disease in German adults. EurHeart J 31, 1616–1623.
Chen ZP, McConell GK, Michell BJ, Snow RJ, Canny BJ &Kemp BE (2000). AMPK signaling in contracting humanskeletal muscle: acetyl-CoA carboxylase and NO synthasephosphorylation. Am J Physiol Endocrinol Metab 279,E1202–1206.
Crow MT & Kushmerick MJ (1982). Chemical energetics ofslow- and fast-twitch muscles of the mouse. J Gen Physiol 79,147–166.
Franko A, Mayer S, Thiel G, Mercy L, Arnould T, Hornig-DoHT, Wiesner RJ & Goffart S (2008). CREB-1α is recruited toand mediates upregulation of the cytochrome c promoterduring enhanced mitochondrial biogenesis accompanyingskeletal muscle differentiation. Mol Cell Biol 28,2446–2459.
Frey TG, Renken CW & Perkins GA (2002). Insight intomitochondrial structure and function from electrontomography. Biochim Biophys Acta 1555, 196–203.
Gieffers C, Korioth F, Heimann P, Ungermann C & Frey J(1997). Mitofilin is a transmembrane protein of the innermitochondrial membrane expressed as two isoforms. ExpCell Res 232, 395–399.
Gilkerson RW, Selker JM & Capaldi RA (2003). The cristalmembrane of mitochondria is the principal site of oxidativephosphorylation. FEBS Lett 546, 355–358.
Gonzalez E, Messi ML & Delbono O (2000). The specific forceof single intact extensor digitorum longus and soleus mousemuscle fibers declines with aging. J Membr Biol 178,175–183.
Guth L & Samaha FJ (1970). Procedure for the histochemicaldemonstration of actomyosin ATPase. Exp Neurol 28,365–367.
Hagen TM, Moreau R, Suh JH & Visioli F (2002).Mitochondrial decay in the aging rat heart: evidence forimprovement by dietary supplementation withacetyl-L-carnitine and/or lipoic acid. Ann N Y Acad Sci 959,491–507.
Handschin C, Chin S, Li P, Liu F, Maratos-Flier E, LebrasseurNK, Yan Z & Spiegelman BM (2007). Skeletal musclefiber-type switching, exercise intolerance, and myopathy inPGC-1α muscle-specific knock-out animals. J Biol Chem282, 30014–30021.
Hayashi YK, Matsuda C, Ogawa M, Goto K, Tominaga K,Mitsuhashi S, Park YE, Nonaka I, Hino-Fukuyo N, HaginoyaK, Sugano H & Nishino I (2009). Human PTRF mutationscause secondary deficiency of caveolins resulting in musculardystrophy with generalized lipodystrophy. J Clin Invest 119,2623–2633.
Hepple RT (1997). A new measurement of tissue capillarity: thecapillary-to-fibre perimeter exchange index. Can J ApplPhysiol 22, 11–22.
Hepple RT, Mackinnon SL, Thomas SG, Goodman JM & PlyleyMJ (1997). Quantitating the capillary supply and theresponse to resistance training in older men. Pflugers Arch433, 238–244.
C⃝ 2011 The Authors. Journal compilation C⃝ 2011 The Physiological Society

4630 L. Nogueira and others J Physiol 589.18
Hepple RT & Mathieu-Costello O (2001). Estimating the size ofthe capillary-to-fiber interface in skeletal muscle: acomparison of methods. J Appl Physiol 91, 2150–2156.
Holloszy JO (1967). Biochemical adaptations in muscle. Effectsof exercise on mitochondrial oxygen uptake and respiratoryenzyme activity in skeletal muscle. J Biol Chem 242,2278–2282.
Holloszy JO & Coyle EF (1984). Adaptations of skeletal muscleto endurance exercise and their metabolic consequences.J Appl Physiol 56, 831–838.
Howlett RA, Gonzalez NC, Wagner HE, Fu Z, Britton SL, KochLG & Wagner PD (2003). Genetic models in appliedphysiology: Skeletal muscle capillarity and enzyme activity inrats selectively bred for running endurance. J Appl Physiol94, 1682–1688.
Huffman DM, Moellering DR, Grizzle WE, Stockard CR,Johnson MS & Nagy TR (2008). Effect of exercise and calorierestriction on biomarkers of aging in mice. Am J PhysiolRegul Integr Comp Physiol 294, R1618–1627.
Iyer S, Thomas RR, Portell FR, Dunham LD, Quigley CK &Bennett JP Jr (2009). Recombinant mitochondrialtranscription factor A with N-terminal mitochondrialtransduction domain increases respiration andmitochondrial gene expression. Mitochondrion 9, 196–203.
John GB, Shang Y, Li L, Renken C, Mannella CA, Selker JM,Rangell L, Bennett MJ & Zha J (2005). The mitochondrialinner membrane protein mitofilin controls cristaemorphology. Mol Biol Cell 16, 1543–1554.
Keppel G & Wickens TD (2004). Design and Analysis: AResearcher’s Handbook. Pearson Prentice Hall, Upper SaddleRiver, NJ.
Kobzik L, Reid MB, Bredt DS & Stamler JS (1994). Nitric oxidein skeletal muscle. Nature 372, 546–548.
Kohn TA & Myburgh KH (2007). Regional specialization of ratquadriceps myosin heavy chain isoforms occurring in distalto proximal parts of middle and deep regions is not mirroredby citrate synthase activity. J Anat 210, 8–18.
Lanza IR & Nair KS (2009). Muscle mitochondrial changeswith aging and exercise. Am J Clin Nutr 89, 467S–471S.
Leick L, Lyngby SS, Wojtasewski JF & Pilegaard H (2010).PGC-1α is required for training-induced prevention ofage-associated decline in mitochondrial enzymes in mouseskeletal muscle. Exp Gerontol 45, 336–342.
Little JP, Safdar A, Wilkin GP, Tarnopolsky MA & Gibala MJ(2010). A practical model of low-volume high-intensityinterval training induces mitochondrial biogenesis in humanskeletal muscle: potential mechanisms. J Physiol 588,1011–1022.
Lloyd PG, Prior BM, Yang HT & Terjung RL (2003).Angiogenic growth factor expression in rat skeletal muscle inresponse to exercise training. Am J Physiol Heart Circ Physiol284, H1668–1678.
Malek MH & Olfert IM (2009). Global deletion ofthrombospondin-1 increases cardiac and skeletal musclecapillarity and exercise capacity in mice. Exp Physiol 94,749–760.
Malek MH, Olfert IM & Esposito F (2010). Detraining losses ofskeletal muscle capillarization are associated with vascularendothelial growth factor protein expression in rats. ExpPhysiol 95, 359–368.
Moreau R, Heath SH, Doneanu CE, Harris RA & Hagen TM(2004). Age-related compensatory activation of pyruvatedehydrogenase complex in rat heart. Biochem Biophys ResCommun 325, 48–58.
Nair KS (2005). Aging muscle. Am J Clin Nutr 81, 953–963.Narkar VA, Downes M, Yu RT, Embler E, Wang YX, Banayo E,
Mihaylova MM, Nelson MC, Zou Y, Juguilon H, Kang H,Shaw RJ & Evans RM (2008). AMPK and PPARδ agonists areexercise mimetics. Cell 134, 405–415.
Nisoli E, Clementi E, Paolucci C, Cozzi V, Tonello C, Sciorati C,Bracale R, Valerio A, Francolini M, Moncada S & CarrubaMO (2003). Mitochondrial biogenesis in mammals: the roleof endogenous nitric oxide. Science 299, 896–899.
Nogueira L & Hogan MC (2010). Phenol increases intracellular[Ca2+] during twitch contractions in intact Xenopus skeletalmyofibers. J Appl Physiol 109, 1384–1393.
Olfert IM, Howlett RA, Tang K, Dalton ND, Gu Y, Peterson KL,Wagner PD & Breen EC (2009). Muscle-specific VEGFdeficiency greatly reduces exercise endurance in mice.J Physiol 587, 1755–1767.
Ottaviani JI, Momma TY, Heiss C, Kwik-Uribe C, Schroeter H& Keen CL (2011). The stereochemical configuration offlavanols influences the level and metabolism of flavanols inhumans and their biological activity in vivo. Free Radic BiolMed 50, 237–244.
Ottenheijm CA, Hidalgo C, Rost K, Gotthardt M & Granzier H(2009). Altered contractility of skeletal muscle in micedeficient in titin’s M-band region. J Mol Biol 393,10–26.
Panneerselvam M, Tsutsumi YM, Bonds JA, Horikawa YT,Saldana M, Dalton ND, Head BP, Patel PM, Roth DM &Patel HH (2010). Dark chocolate receptors:epicatechin-induced cardiac protection is dependent ondelta-opioid receptor stimulation. Am J Physiol Heart CircPhysiol 299, H1604–1609.
Pansters NA, van der Velden JL, Kelders MC, Laeremans H,Schols AM & Langen RC (2011). Segregation of myoblastfusion and muscle-specific gene expression by distinctligand-dependent inactivation of GSK-3β. Cell Mol Life Sci68, 523–535.
Park J, Kim Y, Choi S, Koh H, Lee SH, Kim JM & Chung J(2010). Drosophila porin/VDAC affects mitochondrialmorphology. PloS One 5, e13151.
Perkins GA & Ellisman MH (2010). Mitochondrialconfigurations in peripheral nerve suggest differential ATPproduction. J Struct Biol 173, 117–127.
Poole DC & Mathieu-Costello O (1996). Relationship betweenfiber capillarization and mitochondrial volume density incontrol and trained rat soleus and plantaris muscles.Microcirculation 3, 175–186.
Ramirez-Sanchez I, Maya L, Ceballos G & Villarreal F (2010).(–)-Epicatechin activation of endothelial cell endothelialnitric oxide synthase, nitric oxide, and related signalingpathways. Hypertension 55, 1398–1405.
Reid MB, Feldman HA & Miller MJ (1987). Isometriccontractile properties of diaphragm strips from alcoholicrats. J Appl Physiol 63, 1156–1164.
Reid MB, Khawli FA & Moody MR (1993). Reactive oxygen inskeletal muscle. III. Contractility of unfatigued muscle.J Appl Physiol 75, 1081–1087.
C⃝ 2011 The Authors. Journal compilation C⃝ 2011 The Physiological Society

J Physiol 589.18 (–)-Epicatechin and muscle adaptation 4631
Richardson RS, Wagner H, Mudaliar SR, Saucedo E, Henry R &Wagner PD (2000). Exercise adaptation attenuates VEGFgene expression in human skeletal muscle. Am J PhysiolHeart Circ Physiol 279, H772–H778.
Rosenblatt JD, Kuzon WM, Plyley MJ, Pynn BR & McKee NH(1987). A histochemical method for the simultaneousdemonstration of capillaries and fiber type in skeletalmuscle. Stain Technol 62, 85–92.
Ryan MJ, Jackson JR, Hao Y, Williamson CL, Dabkowski ER,Hollander JM & Alway SE (2010). Suppression of oxidativestress by resveratrol after isometric contractions ingastrocnemius muscles of aged mice. J Gerontol 65, 815–831.
Safdar A, Hamadeh MJ, Kaczor JJ, Raha S, Debeer J &Tarnopolsky MA (2010). Aberrant mitochondrialhomeostasis in the skeletal muscle of sedentary older adults.PloS One 5, e10778.
Salerno MS, Thomas M, Forbes D, Watson T, Kambadur R &Sharma M (2004). Molecular analysis of fiber type-specificexpression of murine myostatin promoter. Am J Physiol CellPhysiol 287, C1031–1040.
Shindoh C, DiMarco A, Thomas A, Manubay P & Supinski G(1990). Effect of N-acetylcysteine on diaphragm fatigue.J Appl Physiol 68, 2107–2113.
Singha UK, Sharma S & Chaudhuri M (2009). Downregulationof mitochondrial porin inhibits cell growth and altersrespiratory phenotype in Trypanosoma brucei. EukaryoticCell 8, 1418–1428.
Srere PA (1969). Citrate synthase. Methods Enzymol 13, 3–5.Suarez RK, Lighton JR, Brown GS & Mathieu-Costello O
(1991). Mitochondrial respiration in hummingbird flightmuscles. Proc Natl Acad Sci U S A 88, 4870–4873.
Tang W, Ingalls CP, Durham WJ, Snider J, Reid MB, Wu G,Matzuk MM & Hamilton SL (2004). Alteredexcitation-contraction coupling with skeletal muscle specificFKBP12 deficiency. FASEB J 18, 1597–1599.
Timmers S, de Vogel-van den Bosch J, Hesselink MK, vanBeurden D, Schaart G, Ferraz MJ, Losen M,Martinez-Martinez P, De Baets MH, Aerts JM & SchrauwenP (2011). Paradoxical increase in TAG and DAG contentparallel the insulin sensitizing effect of unilateral DGAT1overexpression in rat skeletal muscle. PLoS One 6,e14503.
Wadley GD, Choate J & McConell GK (2007). NOS isoform-specific regulation of basal but not exercise-inducedmitochondrial biogenesis in mouse skeletal muscle. J Physiol585, 253–262.
Wadley GD & McConell GK (2007). Effect of nitric oxidesynthase inhibition on mitochondrial biogenesis in ratskeletal muscle. J Appl Physiol 102, 314–320.
Wallace DC (1999). Mitochondrial diseases in man and mouse.Science 283, 1482–1488.
Waters RE, Rotevatn S, Li P, Annex BH & Yan Z (2004).Voluntary running induces fiber type-specific angiogenesisin mouse skeletal muscle. Am J Physiol Cell Physiol 287,C1342–1348.
Wong LE, Garland T Jr, Rowan S & Hepple RT (2009).Anatomic capillarization is elevated in medial gastrocnemiusmuscle of mighty mini mice. J Appl Physiol 106, 1660–1667.
Wright DC, Han DH, Garcia-Roves PM, Geiger PC, Jones TE &Holloszy JO (2007). Exercise-induced mitochondrialbiogenesis begins before the increase in muscle PGC-1αexpression. J Biol Chem 282, 194–199.
Yamazaki KG, Romero-Perez D, Barraza-Hidalgo M, Cruz M,Rivas M, Cortez-Gomez B, Ceballos G & Villarreal F (2008).Short- and long-term effects of (–)-epicatechin onmyocardial ischemia-reperfusion injury. Am J Physiol HeartCirc Physiol 295, H761–767.
Yamazaki KG, Taub PR, Barraza-Hidalgo M, Rivas MM,Zambon AC, Ceballos G & Villarreal FJ (2010). Effects of(–)-epicatechin on myocardial infarct size and leftventricular remodeling after permanent coronary occlusion.J Am Coll Cardiol 55, 2869–2876.
Author contributions
Work was done at UCSD and WSU. Conception and designof the study were by M.H.M. All authors contributed tocollection, analysis and interpretation of data, and to draftingthe manuscript. All authors approved the final version of themanuscript for publication.
Disclosure
F. Villarreal and P. R. Taub are co-founders of CarderoTherapeutics, Inc.
Acknowledgements
We are grateful to Maraliz Barraza-Hidalgo, Daniel Hogan, andVincent Mendiola for their assistance with this project. Thisstudy was funded by Cardero Therapeutics, Inc. (M.H.M.). Partof the work was performed at the National Centre for Microscopyand Imageing Research funded by NIH grant RR004050.
C⃝ 2011 The Authors. Journal compilation C⃝ 2011 The Physiological Society


![An Intracellular Laccase Is Responsible for Epicatechin-Mediated ... · An Intracellular Laccase Is Responsible for Epicatechin-Mediated Anthocyanin Degradation in Litchi Fruit Pericarp1[OPEN]](https://img.pdfslide.net/doc/110x75/5e40fd7c7264f80c8d618288/an-intracellular-laccase-is-responsible-for-epicatechin-mediated-an-intracellular.jpg)