Embed Size (px)
Citation preview

© 2019 ePlus inc.© 2019 ePlus inc.
ePlus inc.
Investor PresentationFebruary 2019
© 2019 ePlus inc.
Statements in this presentation that are not historical facts may be deemed to be "forward-looking statements." Actual and anticipated future results may vary materially
due to certain risks and uncertainties, including, without limitation, possible adverse effects resulting from financial market disruption and fluctuations in foreign currency
rates, interest rates, and volatility in the U.S. economy such as our current and potential customers' delaying or reducing technology purchases or put downward pressure on
prices, increasing credit risk associated with our customers and vendors, reduction of vendor incentive programs, and restrictions on our access to capital necessary to fund
our operations; significant adverse changes in, reductions in, or losses of relationships with our largest volume customers or one or more of our large volume customers or
vendors; our ability to implement comprehensive plans for the integration of sales forces, cost containment, asset rationalization, systems integration and other key
strategies; our ability to secure our customers’ electronic and other confidential information and remain secure during a cyber-security attack; changes to our senior
management team and/or failure to successfully implement succession plans; disruptions or a security breach in our or our vendors’ IT systems and data and audio
communications networks; the possibility of additional goodwill impairment charges; the demand for and acceptance of, our products and services; our ability to adapt our
services to meet changes in market developments; our ability to adapt to changes in the IT industry and/or rapid changes in product offerings, including the proliferation of
the cloud, infrastructure as a service and software as a service; our ability to hire and retain sufficient qualified personnel; our ability to realize our investment in leased
equipment; our ability to protect our intellectual property; our ability to successfully perform due diligence and integrate acquired businesses; the creditworthiness of our
customers; our ability to raise capital and obtain non-recourse financing for our transactions; our ability to reserve adequately for credit losses; the impact of competition in
our markets; our failure to comply with public sector contracts or applicable laws or regulations; and other risks or uncertainties detailed in the Company’s Annual Report on
Form 10-K for the fiscal year ended March 31, 2018 and other periodic filings with the Securities and Exchange Commission and available at the SEC’s website at
http://www.sec.gov.
We wish to caution you that these factors could affect our financial performance and could cause actual results for future periods to differ materially from any opinions or
statements expressed with respect to future periods in any current statements. All information set forth in this presentation is current as of the date of this presentation and
ePlus undertakes no duty or obligation to update this information.
Safe Harbor Statement
I 2
© 2019 ePlus inc.
Mark MarronChief Executive Officer
I 3
© 2019 ePlus inc.© 2019 ePlus inc.
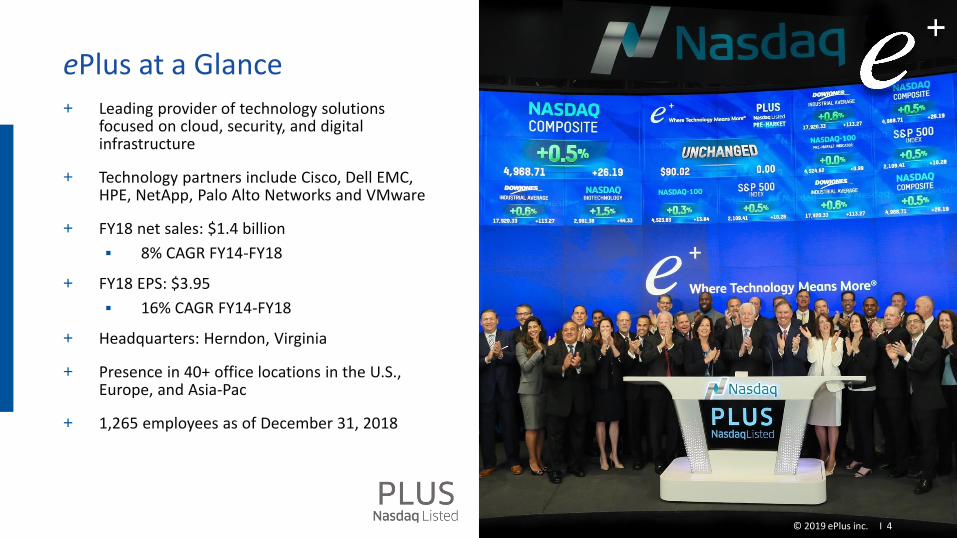
ePlus at a Glance + Leading provider of technology solutions
focused on cloud, security, and digital infrastructure
+ Technology partners include Cisco, Dell EMC, HPE, NetApp, Palo Alto Networks and VMware
+ FY18 net sales: $1.4 billion
▪ 8% CAGR FY14-FY18
+ FY18 EPS: $3.95
▪ 16% CAGR FY14-FY18
+ Headquarters: Herndon, Virginia
+ Presence in 40+ office locations in the U.S., Europe, and Asia-Pac
+ 1,265 employees as of December 31, 2018
I 4
© 2019 ePlus inc.
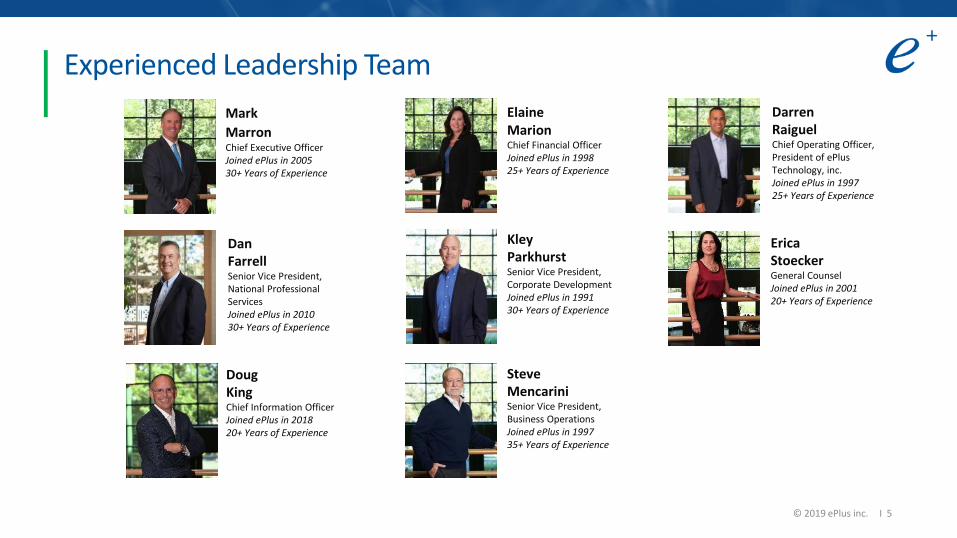
Experienced Leadership Team
ElaineMarionChief Financial OfficerJoined ePlus in 199825+ Years of Experience
DanFarrellSenior Vice President, National Professional ServicesJoined ePlus in 201030+ Years of Experience
KleyParkhurstSenior Vice President, Corporate DevelopmentJoined ePlus in 199130+ Years of Experience
Steve Mencarini Senior Vice President, Business OperationsJoined ePlus in 199735+ Years of Experience
Erica StoeckerGeneral CounselJoined ePlus in 200120+ Years of Experience
DarrenRaiguelChief Operating Officer, President of ePlus Technology, inc.Joined ePlus in 199725+ Years of Experience
Mark
MarronChief Executive Officer Joined ePlus in 2005 30+ Years of Experience
I 5
DougKingChief Information OfficerJoined ePlus in 201820+ Years of Experience

© 2019 ePlus inc.
Our range of complex solutions and services places us in high end of the IT market
SERVICE ORIENTED
GR
OSS
MA
RG
IN1
DISTRIBUTION FOCUSED1 Based on approximate LTM GAAP gross margin
Well Positioned within the IT Ecosystem
Distributors VARs IT Solutions Services/Integrators
5 – 13% GM 13 – 16% GM 17 – 23% GM 29 – 32% GM
Vendors
25 – 65% GM
INCREASING CUSTOMER VALUE AND VENDOR MARGINS
I 6
© 2019 ePlus inc.© 2019 ePlus inc.
Expanding Footprint
40+ locations serving the U.S., Europe, and Asia-Pac
24/7 365 managed services operations and integrationcenters strategically placed throughout the U.S.
400+ technical and support resources certified by the top IT manufacturers in the world
INTERNATIONAL OFFICES
ENGLAND
INDIA
REGIONAL OFFICE SALES OFFICES MANAGED SERVICES CENTERS INTEGRATION CENTERS
I 7
© 2019 ePlus inc.
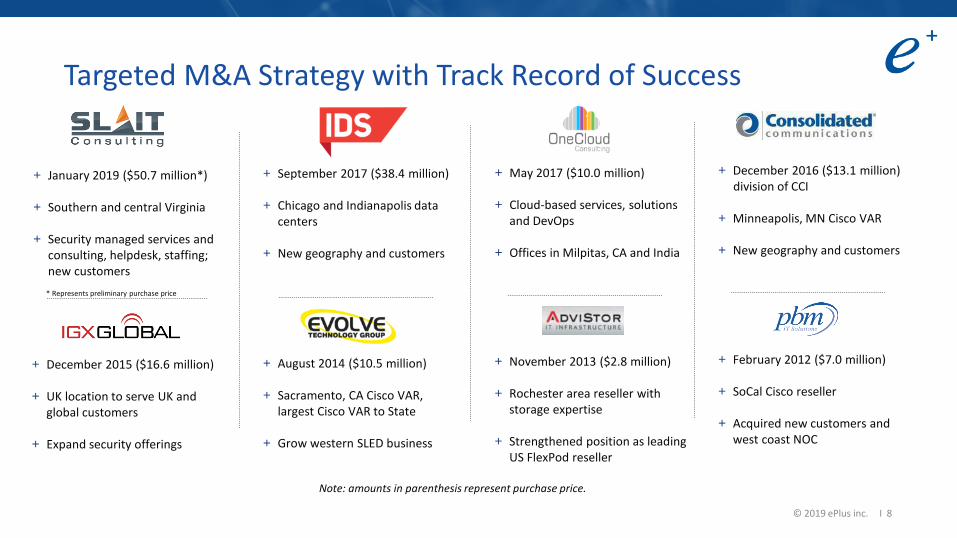
Targeted M&A Strategy with Track Record of Success
Note: amounts in parenthesis represent purchase price.
+ February 2012 ($7.0 million)
+ SoCal Cisco reseller
+ Acquired new customers and west coast NOC
+ November 2013 ($2.8 million)
+ Rochester area reseller with storage expertise
+ Strengthened position as leading US FlexPod reseller
+ August 2014 ($10.5 million)
+ Sacramento, CA Cisco VAR, largest Cisco VAR to State
+ Grow western SLED business
+ December 2015 ($16.6 million)
+ UK location to serve UK and global customers
+ Expand security offerings
I 8
+ December 2016 ($13.1 million)division of CCI
+ Minneapolis, MN Cisco VAR
+ New geography and customers
+ May 2017 ($10.0 million)
+ Cloud-based services, solutions and DevOps
+ Offices in Milpitas, CA and India
+ January 2019 ($50.7 million*)
+ Southern and central Virginia
+ Security managed services and consulting, helpdesk, staffing; new customers
* Represents preliminary purchase price
+ September 2017 ($38.4 million)
+ Chicago and Indianapolis data centers
+ New geography and customers
© 2019 ePlus inc.© 2018 ePlus inc.
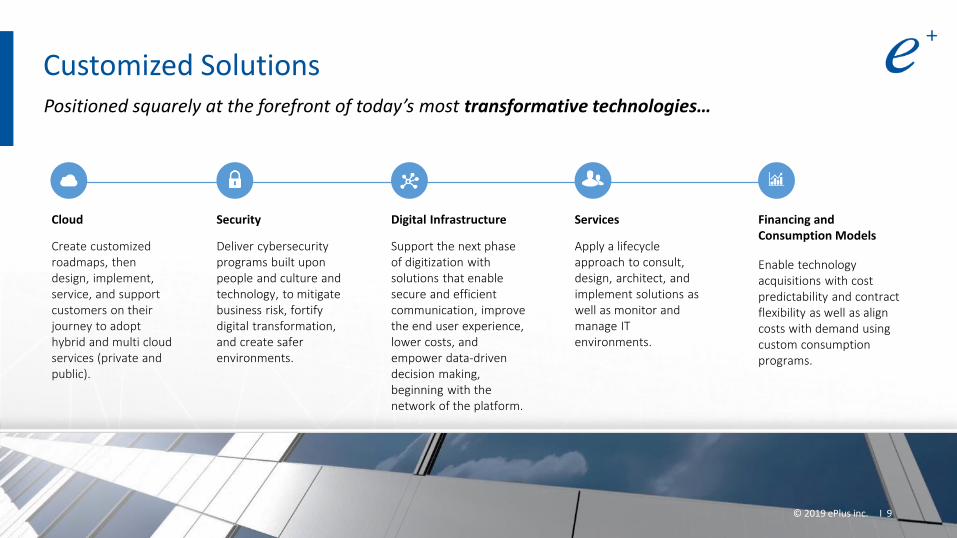
Cloud
Create customized roadmaps, then design, implement, service, and support customers on their journey to adopt hybrid and multi cloud services (private and public).
Security
Deliver cybersecurity programs built upon people and culture and technology, to mitigate business risk, fortify digital transformation, and create safer environments.
Digital Infrastructure
Support the next phase of digitization with solutions that enable secure and efficient communication, improve the end user experience, lower costs, and empower data-driven decision making, beginning with the network of the platform.
Customized SolutionsPositioned squarely at the forefront of today’s most transformative technologies…
Services
Apply a lifecycle approach to consult, design, architect, and implement solutions as well as monitor and manage IT environments.
Financing and Consumption Models
Enable technology acquisitions with cost predictability and contract flexibility as well as align costs with demand using custom consumption programs.
© 2019 ePlus inc. I 9
© 2019 ePlus inc.© 2018 ePlus inc.
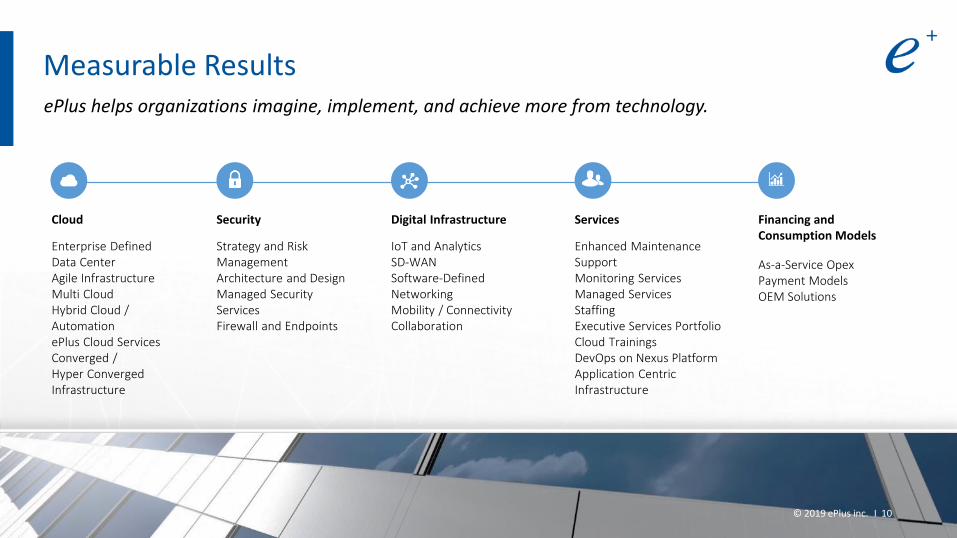
Cloud
Enterprise Defined Data CenterAgile InfrastructureMulti CloudHybrid Cloud / AutomationePlus Cloud ServicesConverged / Hyper Converged Infrastructure
Security
Strategy and Risk ManagementArchitecture and DesignManaged Security ServicesFirewall and Endpoints
Digital Infrastructure
IoT and AnalyticsSD-WANSoftware-Defined NetworkingMobility / ConnectivityCollaboration
Measurable ResultsePlus helps organizations imagine, implement, and achieve more from technology.
Services
Enhanced Maintenance SupportMonitoring ServicesManaged ServicesStaffingExecutive Services PortfolioCloud TrainingsDevOps on Nexus PlatformApplication Centric Infrastructure
Financing and Consumption Models
As-a-Service Opex Payment ModelsOEM Solutions
© 2019 ePlus inc. I 10
© 2019 ePlus inc.
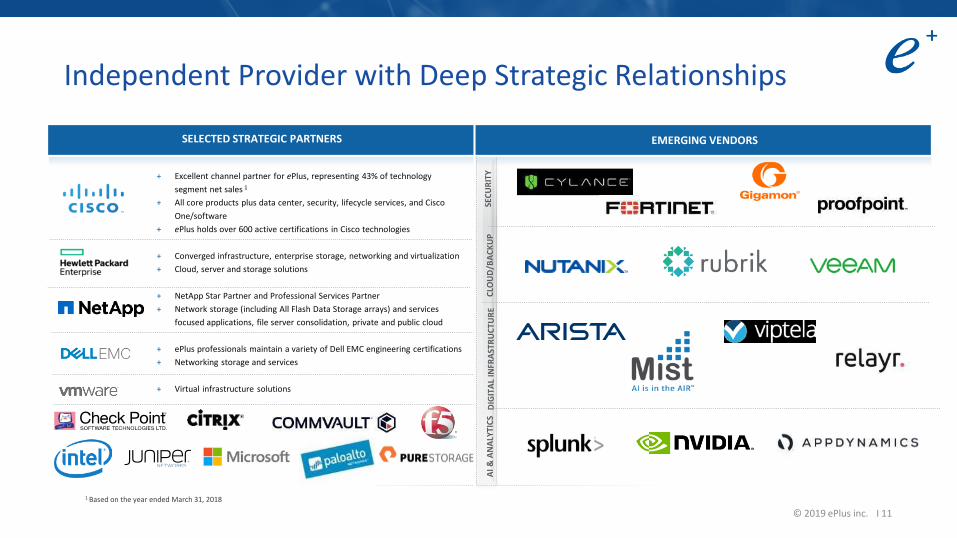
Independent Provider with Deep Strategic Relationships
1 Based on the year ended March 31, 2018
+ COMPLEMENTED BY ADDITIONAL RELATIONSHIPS
I 11
SEC
UR
ITY
CLO
UD
/BA
CK
UP
DIG
ITA
L IN
FRA
STR
UC
TUR
E
SELECTED STRATEGIC PARTNERS EMERGING VENDORS
+ Excellent channel partner for ePlus, representing 43% of technology
segment net sales 1
+ All core products plus data center, security, lifecycle services, and Cisco
One/software
+ ePlus holds over 600 active certifications in Cisco technologies
+ Converged infrastructure, enterprise storage, networking and virtualization
+ Cloud, server and storage solutions
+ NetApp Star Partner and Professional Services Partner
+ Network storage (including All Flash Data Storage arrays) and services
focused applications, file server consolidation, private and public cloud
+ ePlus professionals maintain a variety of Dell EMC engineering certifications
+ Networking storage and services
+ Virtual infrastructure solutions
AI
& A
NA
LYTI
CS
© 2019 ePlus inc.
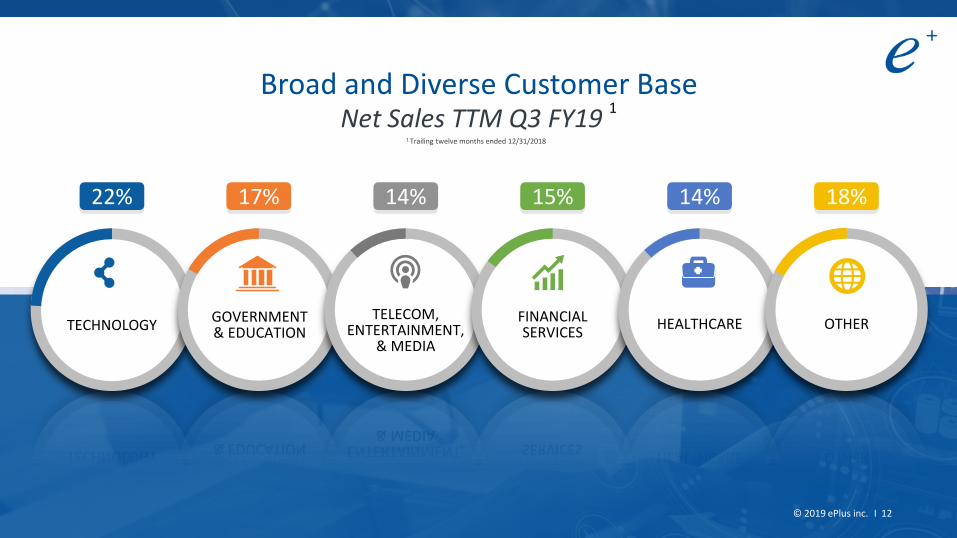
22% 14%17% 15% 14% 18%
TECHNOLOGYGOVERNMENT & EDUCATION
TELECOM, ENTERTAINMENT,
& MEDIA
FINANCIAL SERVICES
HEALTHCARE OTHER
Broad and Diverse Customer Base1
© 2019 ePlus inc. I 12
1 Trailing twelve months ended 12/31/2018
© 2019 ePlus inc.
Sampling of Our Customers
TECHNOLOGYGOVERNMENT & EDUCATION
TELECOM, ENTERTAINMENT,
& MEDIA
FINANCIAL SERVICES
HEALTHCARE OTHER © 2019 ePlus inc. I 13
© 2019 ePlus inc.
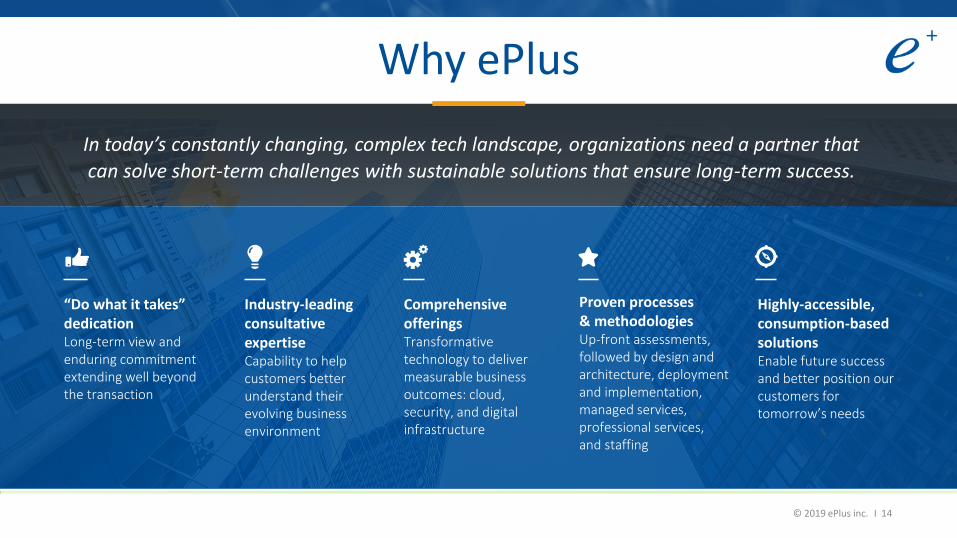
Why ePlus
In today’s constantly changing, complex tech landscape, organizations need a partner that
can solve short-term challenges with sustainable solutions that ensure long-term success.
“Do what it takes” dedication Long-term view and enduring commitment extending well beyond the transaction
Industry-leading consultative expertiseCapability to help customers better understand their evolving business environment
Comprehensive offerings Transformative technology to deliver measurable business outcomes: cloud, security, and digital infrastructure
Proven processes & methodologiesUp-front assessments, followed by design and architecture, deployment and implementation, managed services, professional services, and staffing
Highly-accessible, consumption-based solutionsEnable future success and better position our customers for tomorrow’s needs
I 14

© 2019 ePlus inc.
Elaine MarionChief Financial Officer
I 15
© 2019 ePlus inc.
Strong Financial Results
I 16
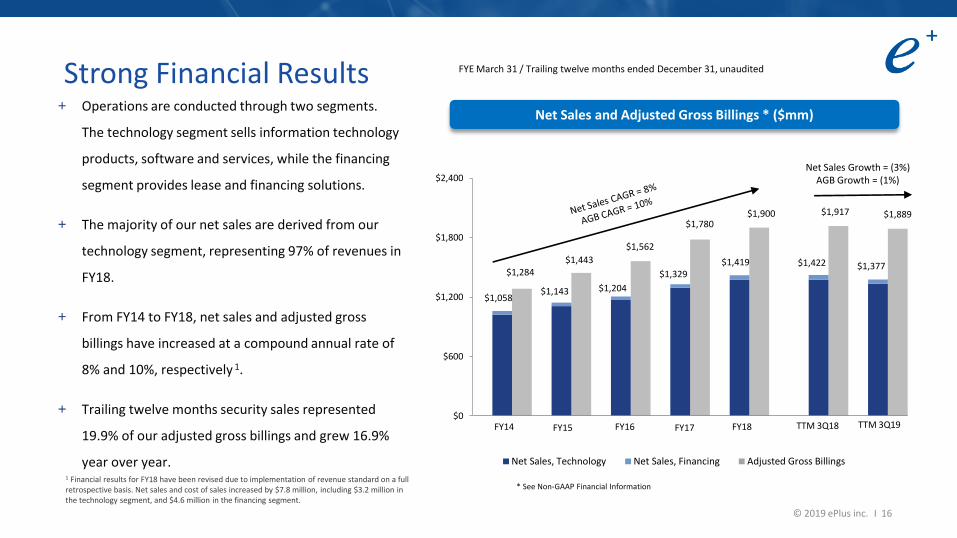
+ Operations are conducted through two segments.
The technology segment sells information technology
products, software and services, while the financing
segment provides lease and financing solutions.
+ The majority of our net sales are derived from our
technology segment, representing 97% of revenues in
FY18.
+ From FY14 to FY18, net sales and adjusted gross
billings have increased at a compound annual rate of
8% and 10%, respectively 1.
+ Trailing twelve months security sales represented
19.9% of our adjusted gross billings and grew 16.9%
year over year.
FYE March 31 / Trailing twelve months ended December 31, unaudited
* See Non-GAAP Financial Information1 Financial results for FY18 have been revised due to implementation of revenue standard on a full retrospective basis. Net sales and cost of sales increased by $7.8 million, including $3.2 million in the technology segment, and $4.6 million in the financing segment.
$1,058
$1,284
$1,143
$1,443
$1,204
$1,562
$1,329
$1,780
$1,419
$1,900
$1,422
$1,917
$1,377
$1,889
$0
$600
$1,200
$1,800
$2,400
Net Sales, Technology Net Sales, Financing Adjusted Gross Billings
Net Sales and Adjusted Gross Billings * ($mm)
FY14 FY15 FY16 FY17 FY18 TTM 3Q18 TTM 3Q19
Net Sales Growth = (3%)AGB Growth = (1%)

© 2019 ePlus inc.
Strong Financial Results
I 17
+ Consolidated gross profit increased at a
compounded annual rate of 11% from FY14 to
FY18, driven by our technology segment, which
represented 89% of our total gross profit in
FY18.
+ Technology gross margin has increased from
18.9% in FY14 to 20.9% in FY18, as services
capabilities continued to expand.
FYE March 31 / Trailing twelve months ended December 31, unaudited
$217
$245 $262
$300
$323 $318
$331
18.9%19.9% 20.3%
20.8% 20.9%20.5%
22.2%
15.0%
20.0%
25.0%
30.0%
35.0%
$0
$100
$200
$300
$400
FY14 FY15 FY16 FY17 FY18 TTM 3Q18 TTM 3Q19
Gross Profit, Technology Gross Profit, Financing Gross Margin, Technology
Gross Profit and Gross Margin ($mm)
© 2019 ePlus inc.
Strong Financial Results
I 18
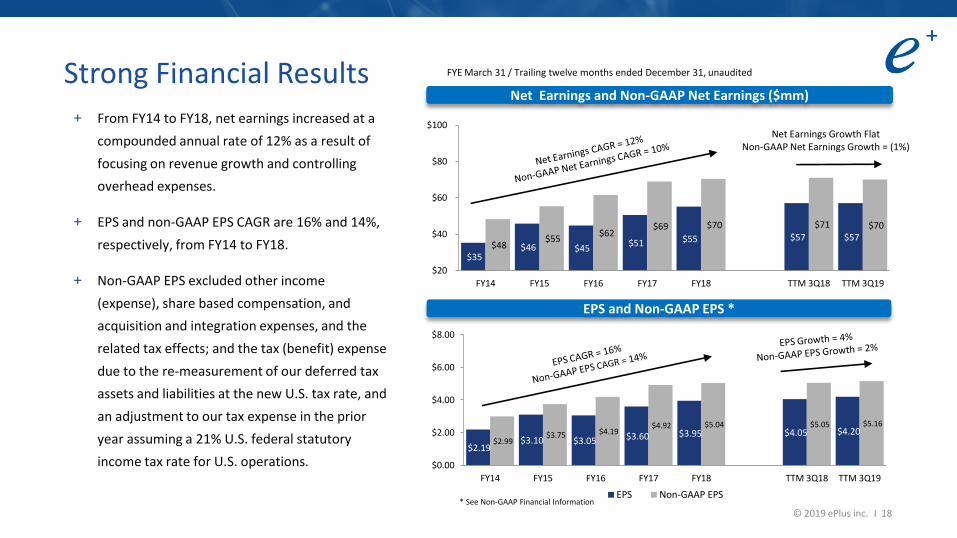
+ From FY14 to FY18, net earnings increased at a
compounded annual rate of 12% as a result of
focusing on revenue growth and controlling
overhead expenses.
+ EPS and non-GAAP EPS CAGR are 16% and 14%,
respectively, from FY14 to FY18.
+ Non-GAAP EPS excluded other income
(expense), share based compensation, and
acquisition and integration expenses, and the
related tax effects; and the tax (benefit) expense
due to the re-measurement of our deferred tax
assets and liabilities at the new U.S. tax rate, and
an adjustment to our tax expense in the prior
year assuming a 21% U.S. federal statutory
income tax rate for U.S. operations.
FYE March 31 / Trailing twelve months ended December 31, unaudited
* See Non-GAAP Financial Information
$35 $46 $45
$51 $55 $57 $57 $48
$55 $62
$69 $70 $71 $70
$20
$40
$60
$80
$100
FY14 FY15 FY16 FY17 FY18 TTM 3Q18 TTM 3Q19
Net Earnings and Non-GAAP Net Earnings ($mm)
Net Earnings Growth FlatNon-GAAP Net Earnings Growth = (1%)
$2.19 $3.10 $3.05 $3.60 $3.95 $4.05 $4.20
$2.99 $3.75 $4.19
$4.92 $5.04 $5.05 $5.16
$0.00
$2.00
$4.00
$6.00
$8.00
FY14 FY15 FY16 FY17 FY18 TTM 3Q18 TTM 3Q19
EPS Non-GAAP EPS
EPS and Non-GAAP EPS *

© 2019 ePlus inc.
Strong Financial Results
I 19
+ Adjusted EBITDA represents net earnings before
interest expense, depreciation and amortization,
share based compensation, acquisition and
integration expenses, provision for income taxes,
and other income. Interest on notes payable and
depreciation expense presented within cost of
sales represent operating expenses of financing
segment, as such they are not added back to net
earnings.
+ From FY14 to FY18, adjusted EBITDA increased at a
compounded annual rate of 11%.
+ Adjusted EBITDA margin increased from 6.4% to
7.3% over the last five years.
+ We incurred higher operating expenses in FY18 due
in part to the recent acquisitions.
FYE March 31 / Trailing twelve months ended December 31, unaudited
* See Non-GAAP Financial Information
$67
$80
$88
$99 $103 $102 $104
6.4%7.0% 7.3% 7.5% 7.3% 7.1%
7.6%
0.0%
4.0%
8.0%
12.0%
16.0%
$0
$30
$60
$90
$120
FY14 FY15 FY16 FY17 FY18 TTM 3Q18 TTM 3Q19
Adj. EBITDA Adj. EBITDA Margin
Adjusted EBITDA * ($mm)
© 2019 ePlus inc.
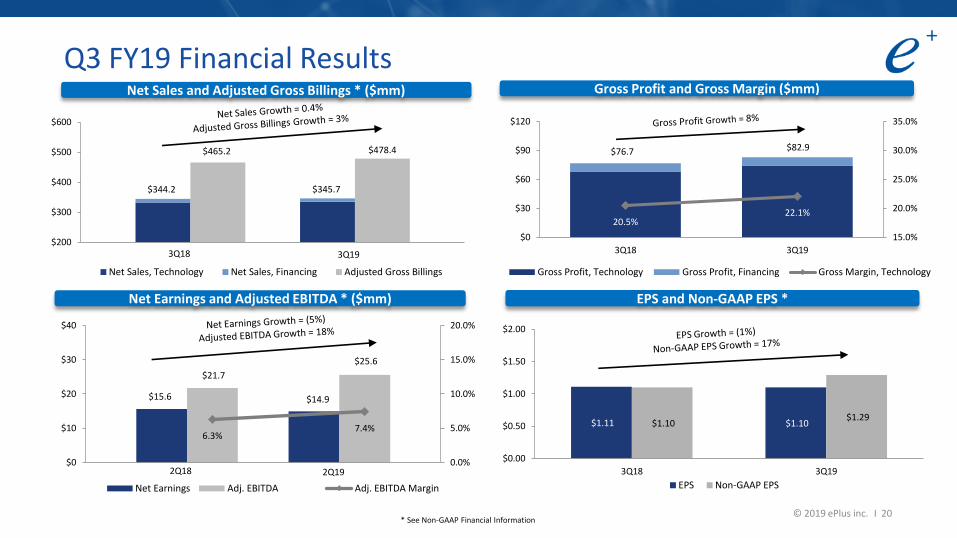
Q3 FY19 Financial Results
* See Non-GAAP Financial InformationI 20
$200
$300
$400
$500
$600
Net Sales, Technology Net Sales, Financing Adjusted Gross Billings
Net Sales and Adjusted Gross Billings * ($mm)
$344.2 $345.7
$465.2 $478.4
3Q18 3Q19
20.5%22.1%
15.0%
20.0%
25.0%
30.0%
35.0%
$0
$30
$60
$90
$120
3Q18 3Q19
Gross Profit, Technology Gross Profit, Financing Gross Margin, Technology
Gross Profit and Gross Margin ($mm)
$76.7 $82.9
$15.6 $14.9
$21.7
$25.6
6.3%7.4%
0.0%
5.0%
10.0%
15.0%
20.0%
$0
$10
$20
$30
$40
Net Earnings Adj. EBITDA Adj. EBITDA Margin
Net Earnings and Adjusted EBITDA * ($mm)
2Q18 2Q19
$1.11 $1.10 $1.10 $1.29
$0.00
$0.50
$1.00
$1.50
$2.00
3Q18 3Q19
EPS Non-GAAP EPS
EPS and Non-GAAP EPS *
© 2019 ePlus inc.
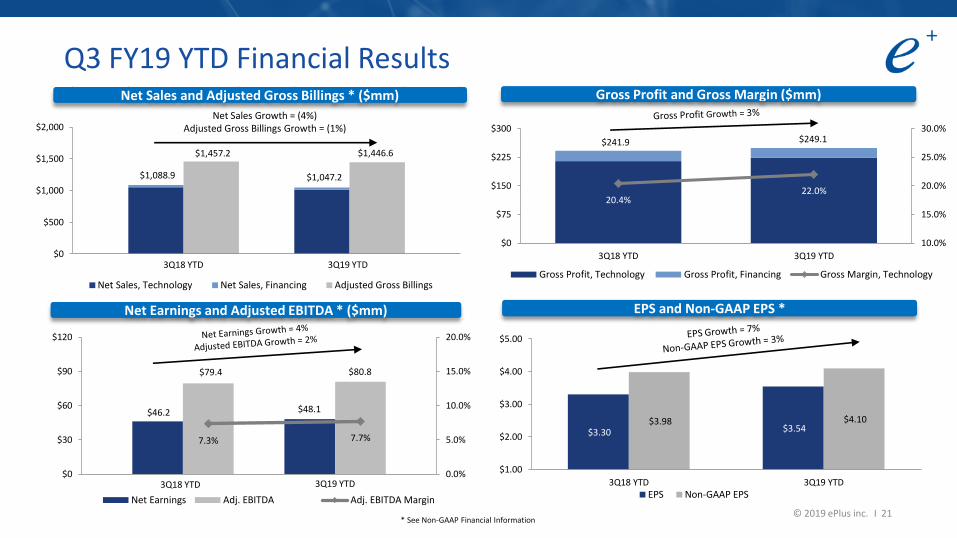
Q3 FY19 YTD Financial Results
* See Non-GAAP Financial InformationI 21
$0
$500
$1,000
$1,500
$2,000
Net Sales, Technology Net Sales, Financing Adjusted Gross Billings
Net Sales Growth = (4%)Adjusted Gross Billings Growth = (1%)
Net Sales and Adjusted Gross Billings * ($mm)
$1,088.9 $1,047.2
$1,457.2 $1,446.6
3Q18 YTD 3Q19 YTD
20.4%22.0%
10.0%
15.0%
20.0%
25.0%
30.0%
$0
$75
$150
$225
$300
3Q18 YTD 3Q19 YTD
Gross Profit, Technology Gross Profit, Financing Gross Margin, Technology
Gross Profit and Gross Margin ($mm)
$241.9 $249.1
$46.2 $48.1
$79.4 $80.8
7.3% 7.7%
0.0%
5.0%
10.0%
15.0%
20.0%
$0
$30
$60
$90
$120
Net Earnings Adj. EBITDA Adj. EBITDA Margin
Net Earnings and Adjusted EBITDA * ($mm)
3Q18 YTD 3Q19 YTD
$3.30 $3.54 $3.98 $4.10
$1.00
$2.00
$3.00
$4.00
$5.00
3Q18 YTD 3Q19 YTDEPS Non-GAAP EPS
EPS and Non-GAAP EPS *
© 2019 ePlus inc.
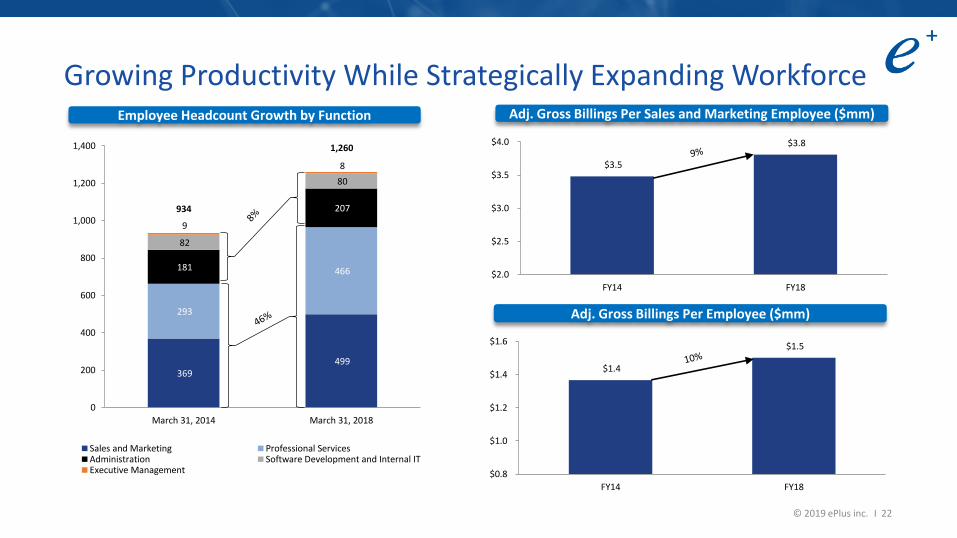
Growing Productivity While Strategically Expanding Workforce
I 22
$1.4
$1.5
$0.8
$1.0
$1.2
$1.4
$1.6
FY14 FY18
Adj. Gross Billings Per Employee ($mm)
$3.5
$3.8
$2.0
$2.5
$3.0
$3.5
$4.0
FY14 FY18
Adj. Gross Billings Per Sales and Marketing Employee ($mm)
369 499
293
466 181
207
82
80
9
8
0
200
400
600
800
1,000
1,200
1,400
March 31, 2014 March 31, 2018
Sales and Marketing Professional ServicesAdministration Software Development and Internal ITExecutive Management
Employee Headcount Growth by Function
934
1,260
© 2019 ePlus inc.
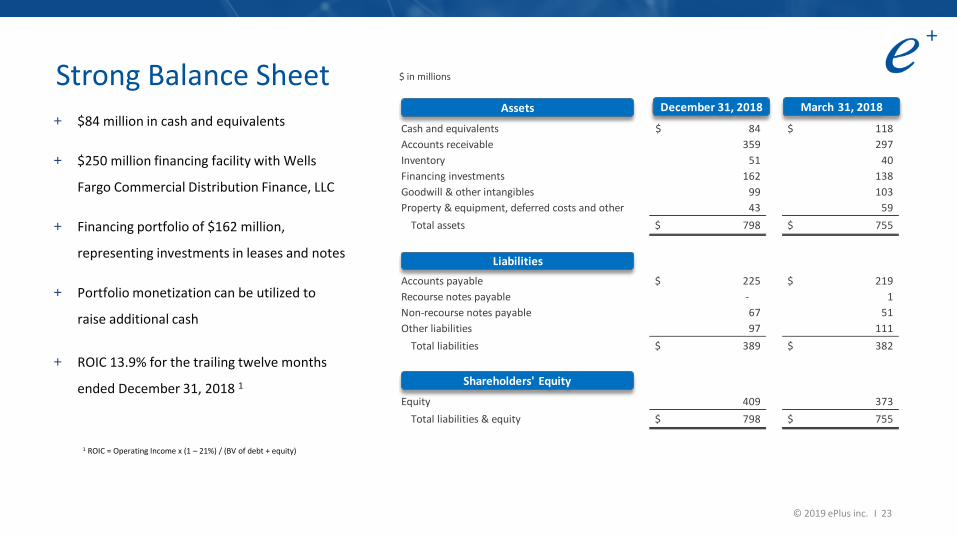
Strong Balance Sheet
I 23
+ $84 million in cash and equivalents
+ $250 million financing facility with Wells
Fargo Commercial Distribution Finance, LLC
+ Financing portfolio of $162 million,
representing investments in leases and notes
+ Portfolio monetization can be utilized to
raise additional cash
+ ROIC 13.9% for the trailing twelve months
ended December 31, 2018 1
$ in millions
1 ROIC = Operating Income x (1 – 21%) / (BV of debt + equity)
Cash and equivalents 84$ 118$
Accounts receivable 359 297
Inventory 51 40
Financing investments 162 138
Goodwill & other intangibles 99 103
Property & equipment, deferred costs and other 43 59
Total assets 798$ 755$
Accounts payable 225$ 219$
Recourse notes payable - 1
Non-recourse notes payable 67 51
Other liabilities 97 111
Total liabilities 389$ 382$
Equity 409 373
Total liabilities & equity 798$ 755$
Assets
Liabilities
Shareholders' Equity
December 31, 2018 March 31, 2018

© 2019 ePlus inc.© 2019 ePlus inc.
Appendix
I 24
© 2019 ePlus inc.
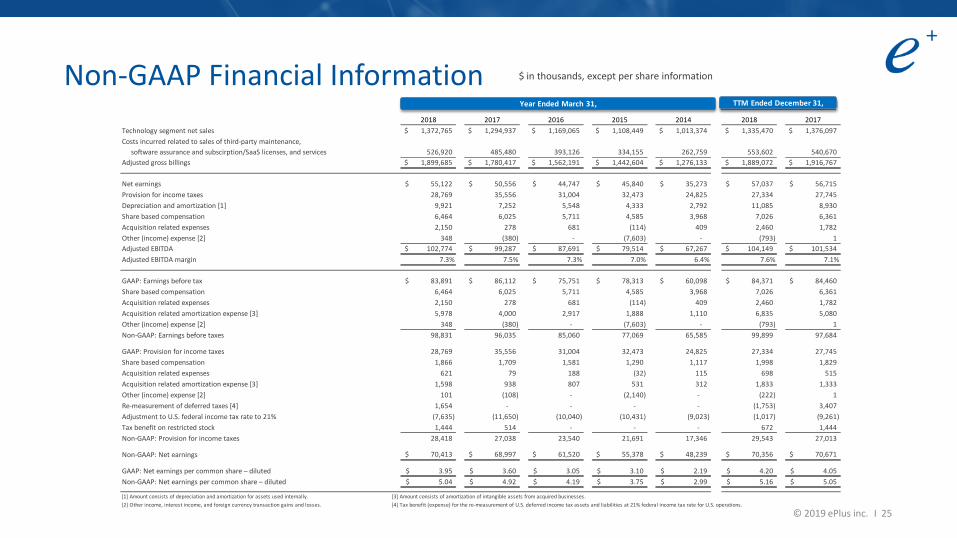
Non-GAAP Financial Information
I 25
$ in thousands, except per share information
2018 2017 2016 2015 2014 2018 2017
Technology segment net sales 1,372,765$ 1,294,937$ 1,169,065$ 1,108,449$ 1,013,374$ 1,335,470$ 1,376,097$
Costs incurred related to sales of third-party maintenance,
software assurance and subscirption/SaaS licenses, and services 526,920 485,480 393,126 334,155 262,759 553,602 540,670
Adjusted gross billings 1,899,685$ 1,780,417$ 1,562,191$ 1,442,604$ 1,276,133$ 1,889,072$ 1,916,767$
Net earnings 55,122$ 50,556$ 44,747$ 45,840$ 35,273$ 57,037$ 56,715$
Provision for income taxes 28,769 35,556 31,004 32,473 24,825 27,334 27,745
Depreciation and amortization [1] 9,921 7,252 5,548 4,333 2,792 11,085 8,930
Share based compensation 6,464 6,025 5,711 4,585 3,968 7,026 6,361
Acquisition related expenses 2,150 278 681 (114) 409 2,460 1,782
Other (income) expense [2] 348 (380) - (7,603) - (793) 1
Adjusted EBITDA 102,774$ 99,287$ 87,691$ 79,514$ 67,267$ 104,149$ 101,534$
Adjusted EBITDA margin 7.3% 7.5% 7.3% 7.0% 6.4% 7.6% 7.1%
GAAP: Earnings before tax 83,891$ 86,112$ 75,751$ 78,313$ 60,098$ 84,371$ 84,460$
Share based compensation 6,464 6,025 5,711 4,585 3,968 7,026 6,361
Acquisition related expenses 2,150 278 681 (114) 409 2,460 1,782
Acquisition related amortization expense [3] 5,978 4,000 2,917 1,888 1,110 6,835 5,080
Other (income) expense [2] 348 (380) - (7,603) - (793) 1
Non-GAAP: Earnings before taxes 98,831 96,035 85,060 77,069 65,585 99,899 97,684
GAAP: Provision for income taxes 28,769 35,556 31,004 32,473 24,825 27,334 27,745
Share based compensation 1,866 1,709 1,581 1,290 1,117 1,998 1,829
Acquisition related expenses 621 79 188 (32) 115 698 515
Acquisition related amortization expense [3] 1,598 938 807 531 312 1,833 1,333
Other (income) expense [2] 101 (108) - (2,140) - (222) 1
Re-measurement of deferred taxes [4] 1,654 - - - - (1,753) 3,407
Adjustment to U.S. federal income tax rate to 21% (7,635) (11,650) (10,040) (10,431) (9,023) (1,017) (9,261)
Tax benefit on restricted stock 1,444 514 - - - 672 1,444
Non-GAAP: Provision for income taxes 28,418 27,038 23,540 21,691 17,346 29,543 27,013
Non-GAAP: Net earnings 70,413$ 68,997$ 61,520$ 55,378$ 48,239$ 70,356$ 70,671$
GAAP: Net earnings per common share – diluted 3.95$ 3.60$ 3.05$ 3.10$ 2.19$ 4.20$ 4.05$
Non-GAAP: Net earnings per common share – diluted 5.04$ 4.92$ 4.19$ 3.75$ 2.99$ 5.16$ 5.05$
[1] Amount consists of depreciation and amortization for assets used internally. [3] Amount consists of amortization of intangible assets from acquired businesses.
[2] Other income, interest income, and foreign currency transaction gains and losses. [4] Tax benefit (expense) for the re-measurement of U.S. deferred income tax assets and liabilities at 21% federal income tax rate for U.S. operations.
Year Ended March 31, TTM Ended December 31,
© 2019 ePlus inc.
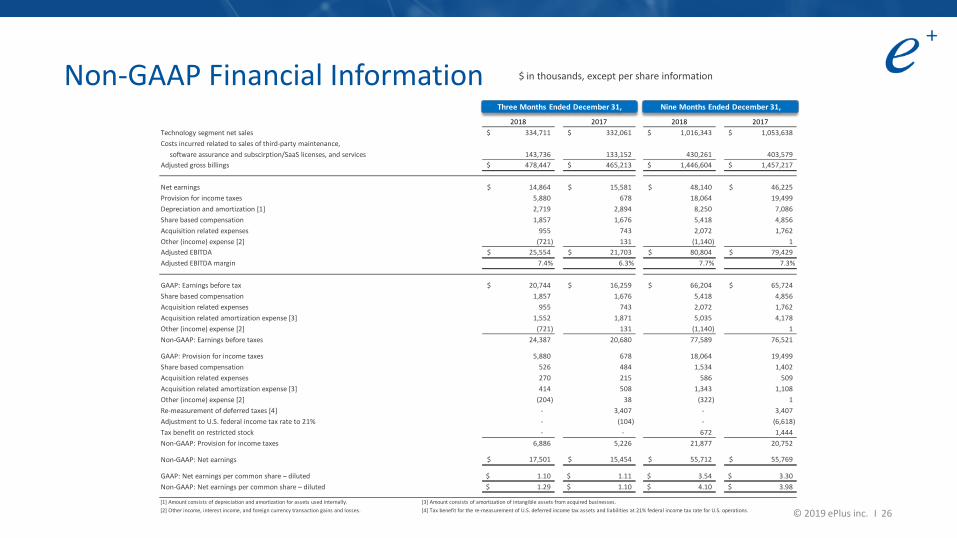
Non-GAAP Financial Information
I 26
$ in thousands, except per share information
2018 2017 2018 2017
Technology segment net sales 334,711$ 332,061$ 1,016,343$ 1,053,638$
Costs incurred related to sales of third-party maintenance,
software assurance and subscirption/SaaS licenses, and services 143,736 133,152 430,261 403,579
Adjusted gross billings 478,447$ 465,213$ 1,446,604$ 1,457,217$
Net earnings 14,864$ 15,581$ 48,140$ 46,225$
Provision for income taxes 5,880 678 18,064 19,499
Depreciation and amortization [1] 2,719 2,894 8,250 7,086
Share based compensation 1,857 1,676 5,418 4,856
Acquisition related expenses 955 743 2,072 1,762
Other (income) expense [2] (721) 131 (1,140) 1
Adjusted EBITDA 25,554$ 21,703$ 80,804$ 79,429$
Adjusted EBITDA margin 7.4% 6.3% 7.7% 7.3%
GAAP: Earnings before tax 20,744$ 16,259$ 66,204$ 65,724$
Share based compensation 1,857 1,676 5,418 4,856
Acquisition related expenses 955 743 2,072 1,762
Acquisition related amortization expense [3] 1,552 1,871 5,035 4,178
Other (income) expense [2] (721) 131 (1,140) 1
Non-GAAP: Earnings before taxes 24,387 20,680 77,589 76,521
GAAP: Provision for income taxes 5,880 678 18,064 19,499
Share based compensation 526 484 1,534 1,402
Acquisition related expenses 270 215 586 509
Acquisition related amortization expense [3] 414 508 1,343 1,108
Other (income) expense [2] (204) 38 (322) 1
Re-measurement of deferred taxes [4] - 3,407 - 3,407
Adjustment to U.S. federal income tax rate to 21% - (104) - (6,618)
Tax benefit on restricted stock - - 672 1,444
Non-GAAP: Provision for income taxes 6,886 5,226 21,877 20,752
Non-GAAP: Net earnings 17,501$ 15,454$ 55,712$ 55,769$
GAAP: Net earnings per common share – diluted 1.10$ 1.11$ 3.54$ 3.30$
Non-GAAP: Net earnings per common share – diluted 1.29$ 1.10$ 4.10$ 3.98$
[1] Amount consists of depreciation and amortization for assets used internally. [3] Amount consists of amortization of intangible assets from acquired businesses.
[2] Other income, interest income, and foreign currency transaction gains and losses. [4] Tax benefit for the re-measurement of U.S. deferred income tax assets and liabilities at 21% federal income tax rate for U.S. operations.
Nine Months Ended December 31,Three Months Ended December 31,
© 2019 ePlus inc.
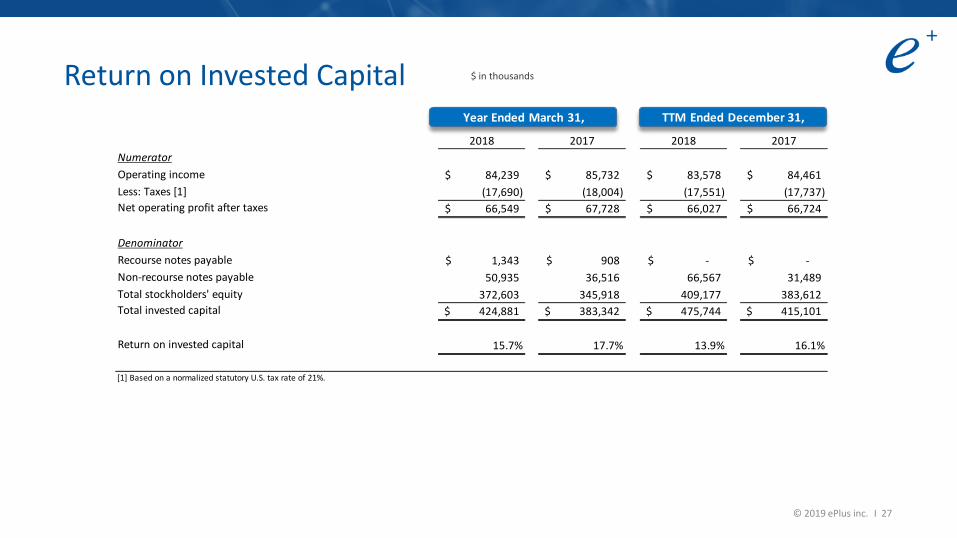
Return on Invested Capital
I 27
$ in thousands
2018 2017 2018 2017
Numerator
Operating income 84,239$ 85,732$ 83,578$ 84,461$
Less: Taxes [1] (17,690) (18,004) (17,551) (17,737)
Net operating profit after taxes 66,549$ 67,728$ 66,027$ 66,724$
Denominator
Recourse notes payable 1,343$ 908$ -$ -$
Non-recourse notes payable 50,935 36,516 66,567 31,489
Total stockholders' equity 372,603 345,918 409,177 383,612
Total invested capital 424,881$ 383,342$ 475,744$ 415,101$
Return on invested capital 15.7% 17.7% 13.9% 16.1%
[1] Based on a normalized statutory U.S. tax rate of 21%.
Year Ended March 31, TTM Ended December 31,

© 2019 ePlus inc.© 2019 ePlus inc.
Investor RelationsKley Parkhurst, SVP(703) 984-8150 [email protected]
ePlus inc.
13595 Dulles Technology Drive Herndon, VA 20171-3413
(703) 984-8400 / eplus.com
©2018 ePlus inc. All rights reserved. ePlus, the ePlus logo, and all referenced product names are trademarks or registered trademarks of ePlus inc. All other company names, product images and products mentioned herein are trademarks or registered trademarks of their respective companies.
I 28