Embed Size (px)
Citation preview
ePlus. Where Technology Means More.™
™
Investor Presentation
March 2015
ePlus. Where Technology Means More.™© 2015 ePlus inc. Confidential and Proprietary.
Safe Harbor StatementStatements in this presentation, which are not historical facts, may be deemed to be "forward‐looking statements.” Actual andanticipated future results may vary due to certain risks and uncertainties, including, without limitation; possible adverse effectsresulting from the recent uncertainty in the economic environment and general slowdown of the U.S. economy such as our currentand potential customers delaying or reducing technology purchases, increasing credit risk associated with our customers and vendors,reduction of vendor incentive programs, the possibility of additional goodwill impairment charges, and restrictions on our access tocapital necessary to fund our operations; our ability to implement comprehensive plans to achieve customer account coverage, costcontainment, asset rationalization, systems integration and other key strategies; our ability to secure our electronic and otherconfidential information; changes to our senior management team; the existence of demand for, and acceptance of, our products andservices; significant changes in accounting standards including changes to the financial reporting of leases which could impact thedemand for our leasing services, or misclassification of products and services we sell resulting in the misapplication of revenuerecognition policies; our ability to adapt to changes in the IT industry and/or rapid change in product standards; our ability to hire andretain sufficient personnel; our ability to protect our intellectual property; our ability to raise capital and obtain non‐recoursefinancing for our transactions; our ability to realize our investment in leased equipment; our ability to reserve adequately for creditlosses; our ability to successfully integrate acquired businesses; significant adverse changes in, reductions in, or losses of relationshipswith major customers or vendors; the possibility of defects in our products or catalog content data; and other risks or uncertaintiesdetailed in the Company’s Annual Report on Form 10‐K for the fiscal year ended March 31, 2014 and other periodic filings with theSecurities and Exchange Commission and available at the SEC’s website at http://www.sec.gov.
We wish to caution you that these factors could affect our financial performance and could cause actual results for future periods todiffer materially from any opinions or statements expressed with respect to future periods in any current statements. All informationset forth in this presentation is current as of the date of this presentation and ePlus undertakes no duty or obligation to update thisinformation.
All statements in this report attributable to Gartner represent ePlus’ interpretation of data, research opinion or viewpoints publishedas part of a syndicated subscription service by Gartner, Inc., and have not been reviewed by Gartner. Each Gartner publication speaksas of its original publication date (and not as of the date of this presentation. The opinions expressed in Gartner publications are notrepresentations of fact, and are subject to change without notice.
2
ePlus. Where Technology Means More.™
™
Kley ParkhurstSenior Vice President
ePlus. Where Technology Means More.™
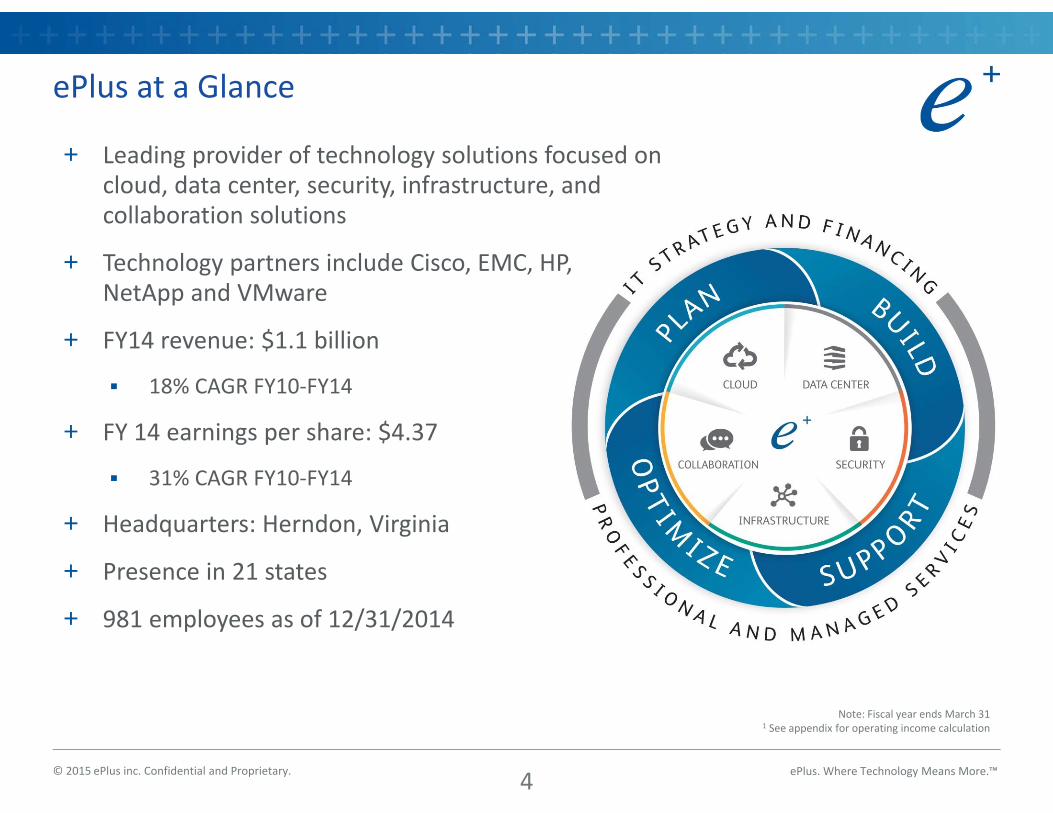
ePlus at a Glance
© 2015 ePlus inc. Confidential and Proprietary.
+ Leading provider of technology solutions focused on cloud, data center, security, infrastructure, and collaboration solutions
+ Technology partners include Cisco, EMC, HP, NetApp and VMware
+ FY14 revenue: $1.1 billion
18% CAGR FY10‐FY14
+ FY 14 earnings per share: $4.37
31% CAGR FY10‐FY14
+ Headquarters: Herndon, Virginia
+ Presence in 21 states
+ 981 employees as of 12/31/2014
Note: Fiscal year ends March 31 1 See appendix for operating income calculation
4
ePlus. Where Technology Means More.™© 2015 ePlus inc. Confidential and Proprietary.
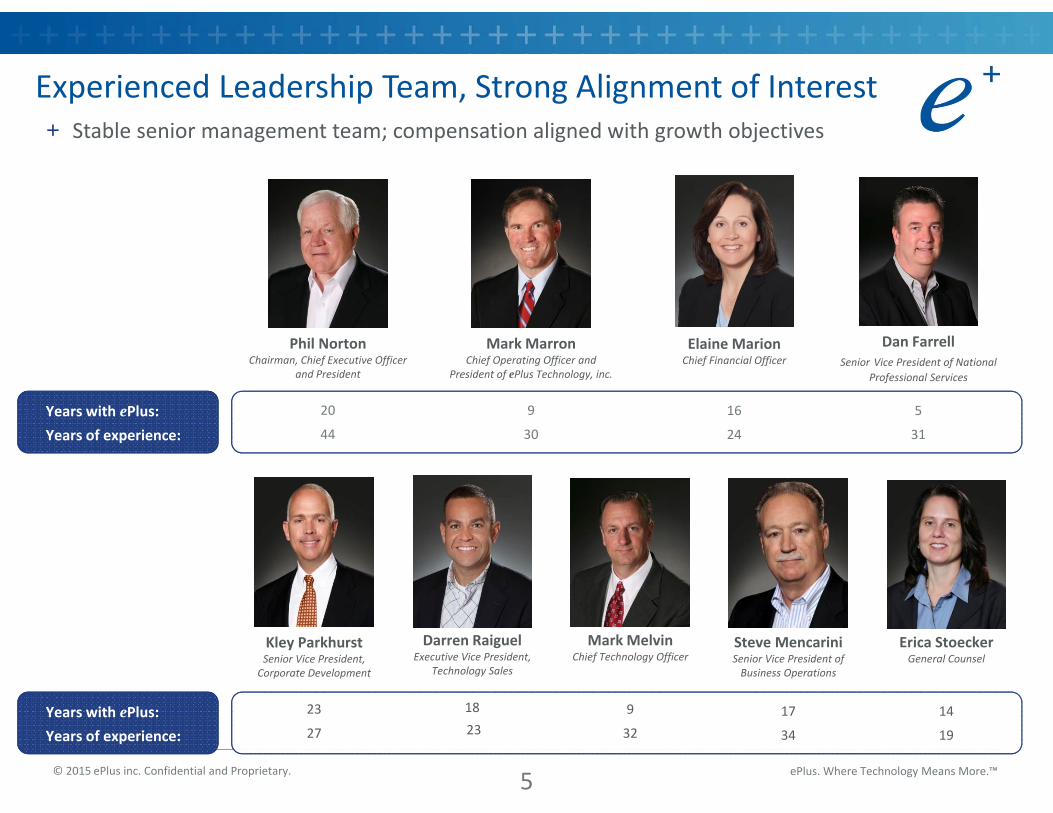
Years with ePlus:Years of experience: 30
9
Mark Marron Chief Operating Officer and
President of ePlus Technology, inc.
44
20
Phil NortonChairman, Chief Executive Officer
and President
Years with ePlus:Years of experience:
Steve Mencarini Senior Vice President of Business Operations
17
34
Mark MelvinChief Technology Officer
9
32
Erica StoeckerGeneral Counsel
14
1927
23
Kley ParkhurstSenior Vice President, Corporate Development
31
5
Dan FarrellSenior Vice President of National
Professional Services
+ Stable senior management team; compensation aligned with growth objectives
Experienced Leadership Team, Strong Alignment of Interest
24
16
Elaine MarionChief Financial Officer
Darren RaiguelExecutive Vice President,
Technology Sales
2318
5
ePlus. Where Technology Means More.™
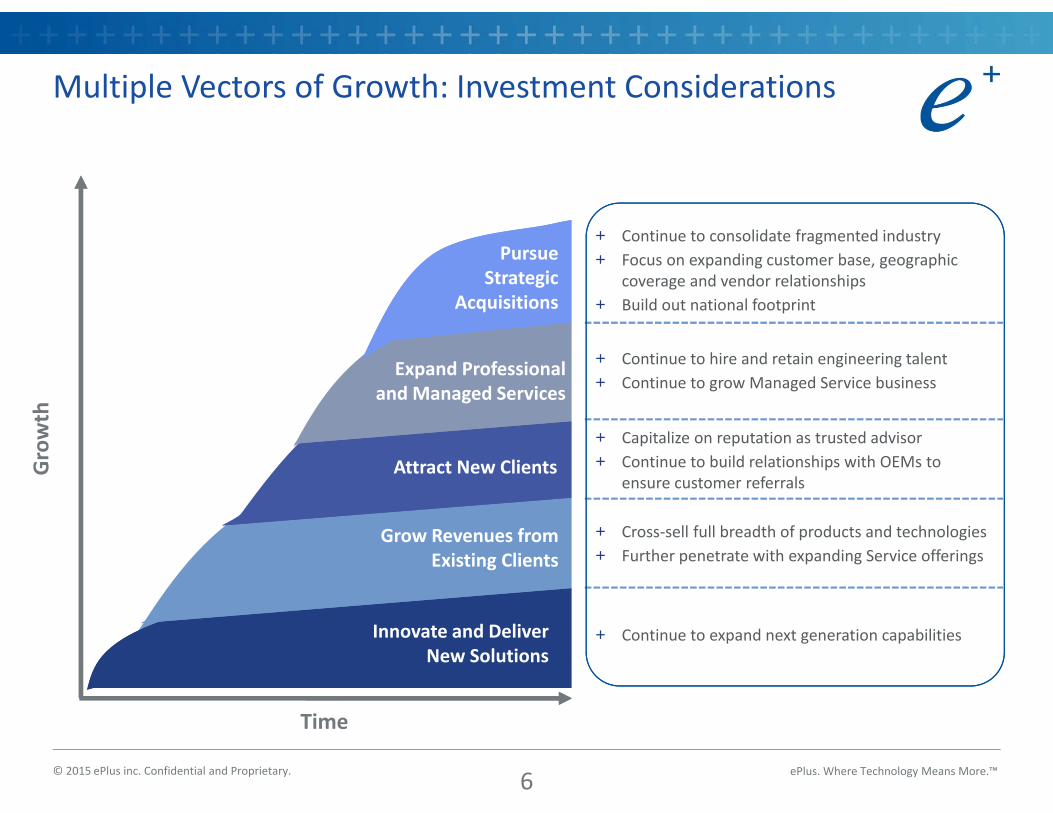
Multiple Vectors of Growth: Investment Considerations
© 2015 ePlus inc. Confidential and Proprietary.
Innovate and Deliver New Solutions
Grow Revenues from Existing Clients
Growth
Time
Attract New Clients
Expand Professional and Managed Services
+ Continue to expand next generation capabilities
+ Cross‐sell full breadth of products and technologies + Further penetrate with expanding Service offerings
+ Capitalize on reputation as trusted advisor + Continue to build relationships with OEMs to
ensure customer referrals
+ Continue to consolidate fragmented industry + Focus on expanding customer base, geographic
coverage and vendor relationships+ Build out national footprint
+ Continue to hire and retain engineering talent+ Continue to grow Managed Service business
Pursue Strategic
Acquisitions
6
ePlus. Where Technology Means More.™© 2015 ePlus inc. Confidential and Proprietary.
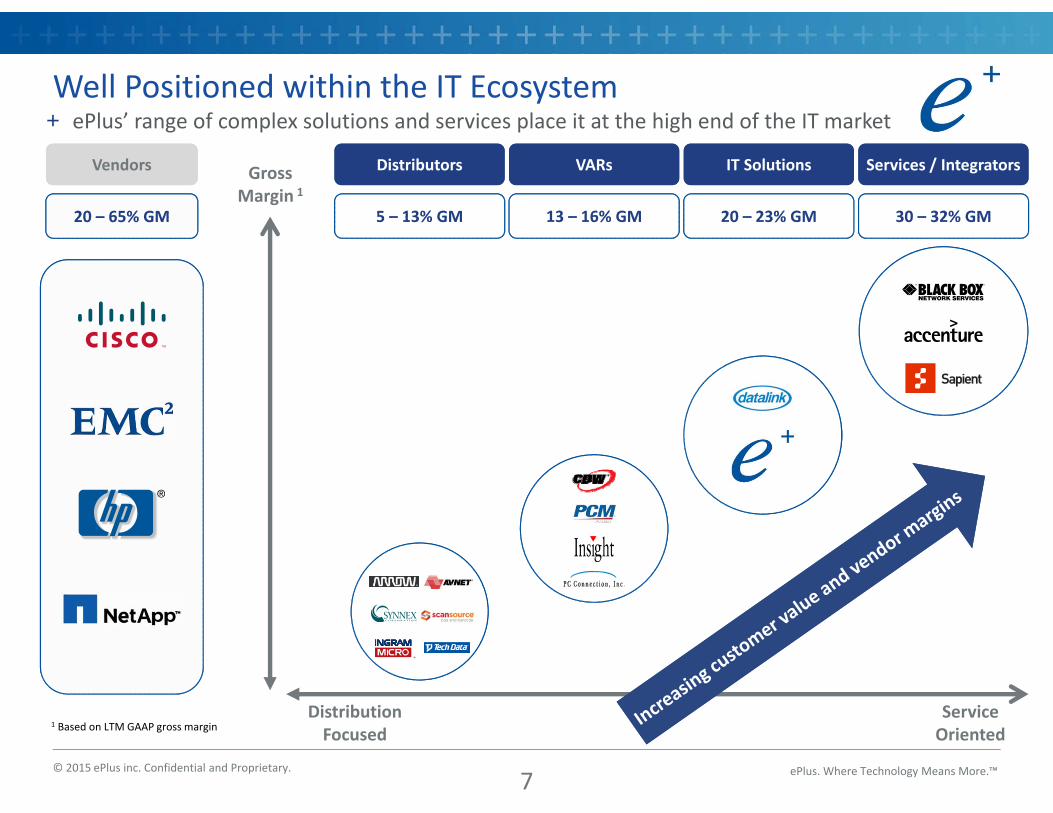
Vendors Vendors
+ ePlus’ range of complex solutions and services place it at the high end of the IT market
•
ServiceOriented
Gross Margin 1
20 – 65% GM20 – 65% GM 5 – 13% GM5 – 13% GM 20 – 23% GM20 – 23% GM 30 – 32% GM30 – 32% GM
Services / IntegratorsServices / IntegratorsIT SolutionsIT SolutionsDistributorsDistributors
DistributionFocused
13 – 16% GM13 – 16% GM
VARsVARs
1 Based on LTM GAAP gross margin
Well Positioned within the IT Ecosystem
7
ePlus. Where Technology Means More.™
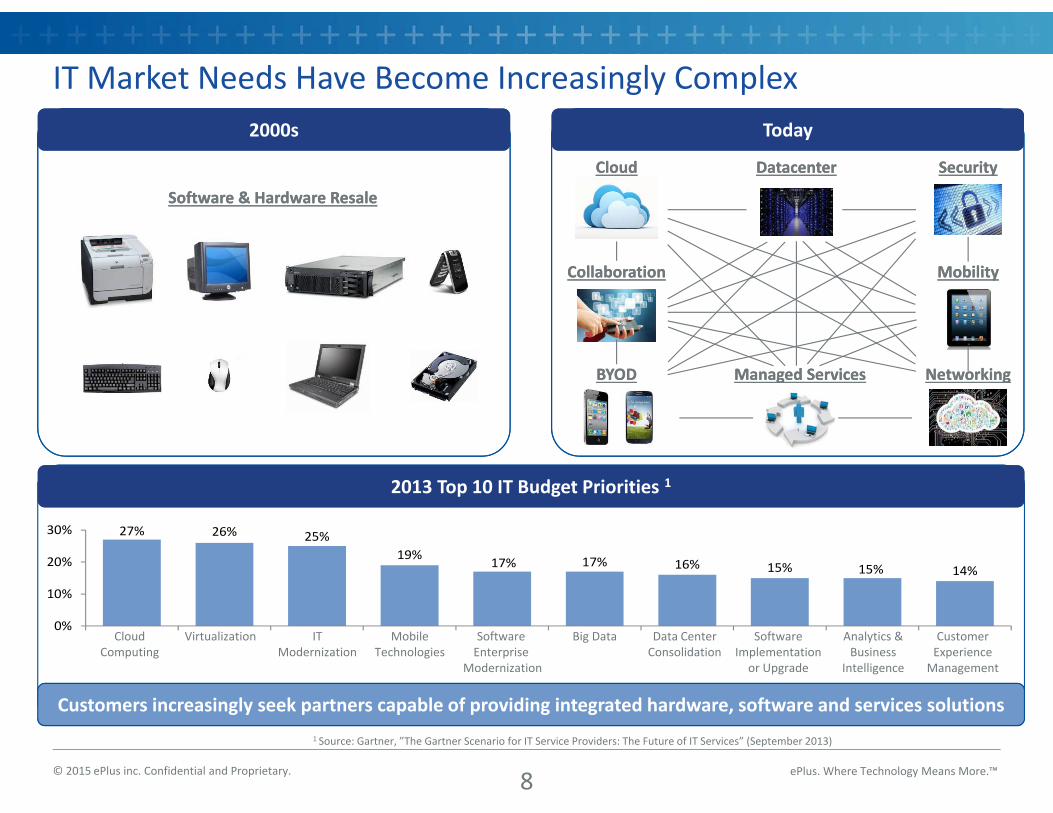
IT Market Needs Have Become Increasingly Complex
© 2015 ePlus inc. Confidential and Proprietary.
TodayToday2000s2000s
Software & Hardware ResaleSoftware & Hardware Resale
CloudCloud DatacenterDatacenter Security Security
MobilityMobilityCollaborationCollaboration
Managed ServicesManaged Services
Cloud Computing
Virtualization IT Modernization
Mobile Technologies
SoftwareEnterprise
Modernization
Big Data Data Center Consolidation
Software Implementation or Upgrade
Analytics & Business
Intelligence
Customer Experience Management
1 Source: Gartner, ”The Gartner Scenario for IT Service Providers: The Future of IT Services” (September 2013)
27% 26% 25%19% 17% 17% 16% 15% 15% 14%
0%
10%
20%
30%
NetworkingNetworkingBYODBYOD
2013 Top 10 IT Budget Priorities 12013 Top 10 IT Budget Priorities 1
Customers increasingly seek partners capable of providing integrated hardware, software and services solutions
8
ePlus. Where Technology Means More.™
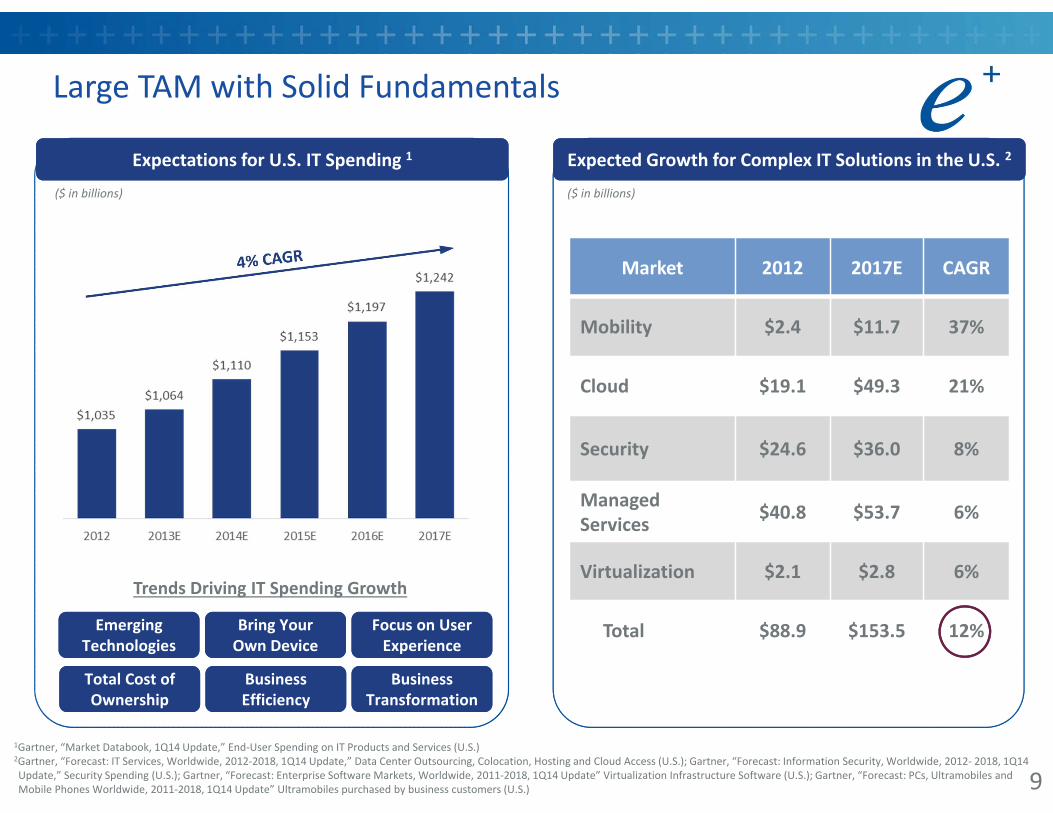
Large TAM with Solid Fundamentals
© 2015 ePlus inc. Confidential and Proprietary.
Expectations for U.S. IT Spending 1Expectations for U.S. IT Spending 1 Expected Growth for Complex IT Solutions in the U.S. 2Expected Growth for Complex IT Solutions in the U.S. 2
($ in billions)
Total Cost of OwnershipTotal Cost of Ownership
Business EfficiencyBusiness Efficiency
Business Transformation
Business Transformation
Emerging TechnologiesEmerging
TechnologiesBring Your Own DeviceBring Your Own Device
Focus on UserExperience
Focus on UserExperience
Trends Driving IT Spending Growth
Market 2012 2017E CAGR
Mobility $2.4 $11.7 37%
Cloud $19.1 $49.3 21%
Security $24.6 $36.0 8%
ManagedServices $40.8 $53.7 6%
Virtualization $2.1 $2.8 6%
Total $88.9 $153.5 12%
($ in billions)
1Gartner, “Market Databook, 1Q14 Update,” End‐User Spending on IT Products and Services (U.S.)2Gartner, “Forecast: IT Services, Worldwide, 2012‐2018, 1Q14 Update,” Data Center Outsourcing, Colocation, Hosting and Cloud Access (U.S.); Gartner, “Forecast: Information Security, Worldwide, 2012‐ 2018, 1Q14 Update,” Security Spending (U.S.); Gartner, “Forecast: Enterprise Software Markets, Worldwide, 2011‐2018, 1Q14 Update” Virtualization Infrastructure Software (U.S.); Gartner, “Forecast: PCs, Ultramobiles and Mobile Phones Worldwide, 2011‐2018, 1Q14 Update” Ultramobiles purchased by business customers (U.S.) 9
ePlus. Where Technology Means More.™
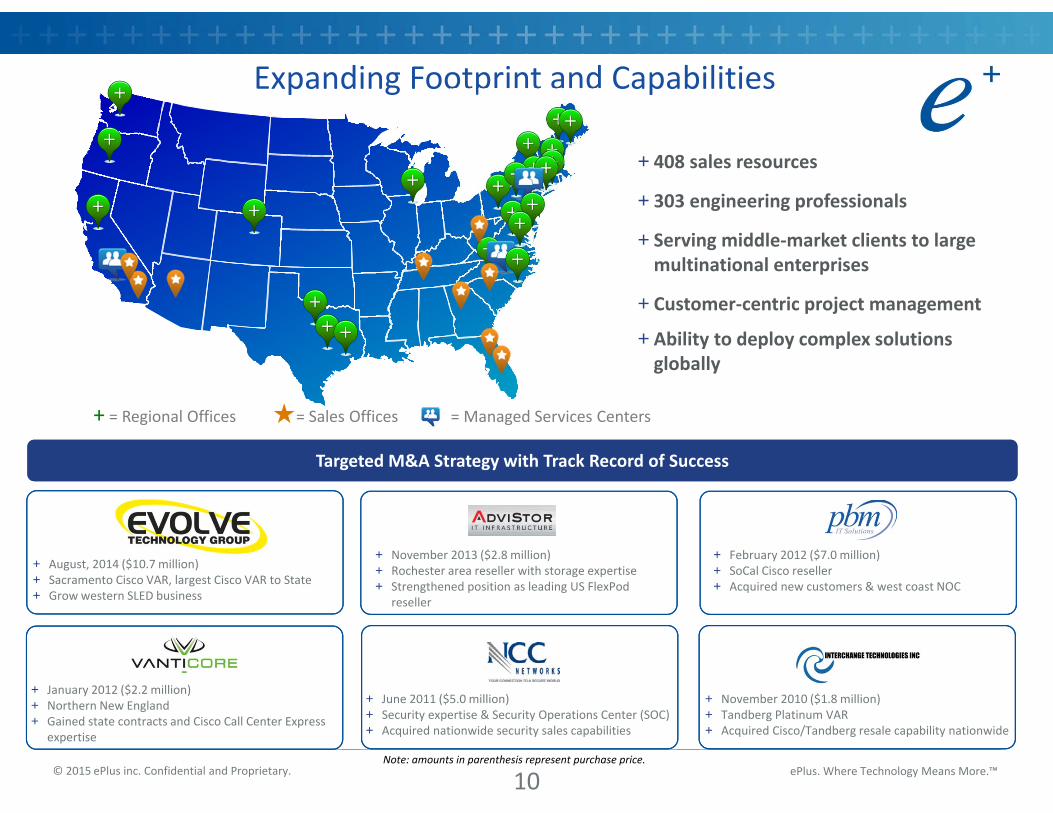
Expanding Footprint and Capabilities
© 2015 ePlus inc. Confidential and Proprietary.
Targeted M&A Strategy with Track Record of SuccessTargeted M&A Strategy with Track Record of Success
+ 408 sales resources
+ 303 engineering professionals
+ Serving middle‐market clients to large multinational enterprises
+ Customer‐centric project management
+ Ability to deploy complex solutions globally
Note: amounts in parenthesis represent purchase price.
+ January 2012 ($2.2 million) + Northern New England+ Gained state contracts and Cisco Call Center Express
expertise
+ February 2012 ($7.0 million)+ SoCal Cisco reseller+ Acquired new customers & west coast NOC
+ November 2013 ($2.8 million) + Rochester area reseller with storage expertise + Strengthened position as leading US FlexPod
reseller
+ November 2010 ($1.8 million) + Tandberg Platinum VAR+ Acquired Cisco/Tandberg resale capability nationwide
+ June 2011 ($5.0 million)+ Security expertise & Security Operations Center (SOC)+ Acquired nationwide security sales capabilities
+ August, 2014 ($10.7 million) + Sacramento Cisco VAR, largest Cisco VAR to State+ Grow western SLED business
+ = Regional Offices ★= Sales Offices = Managed Services Centers
10
ePlus. Where Technology Means More.™
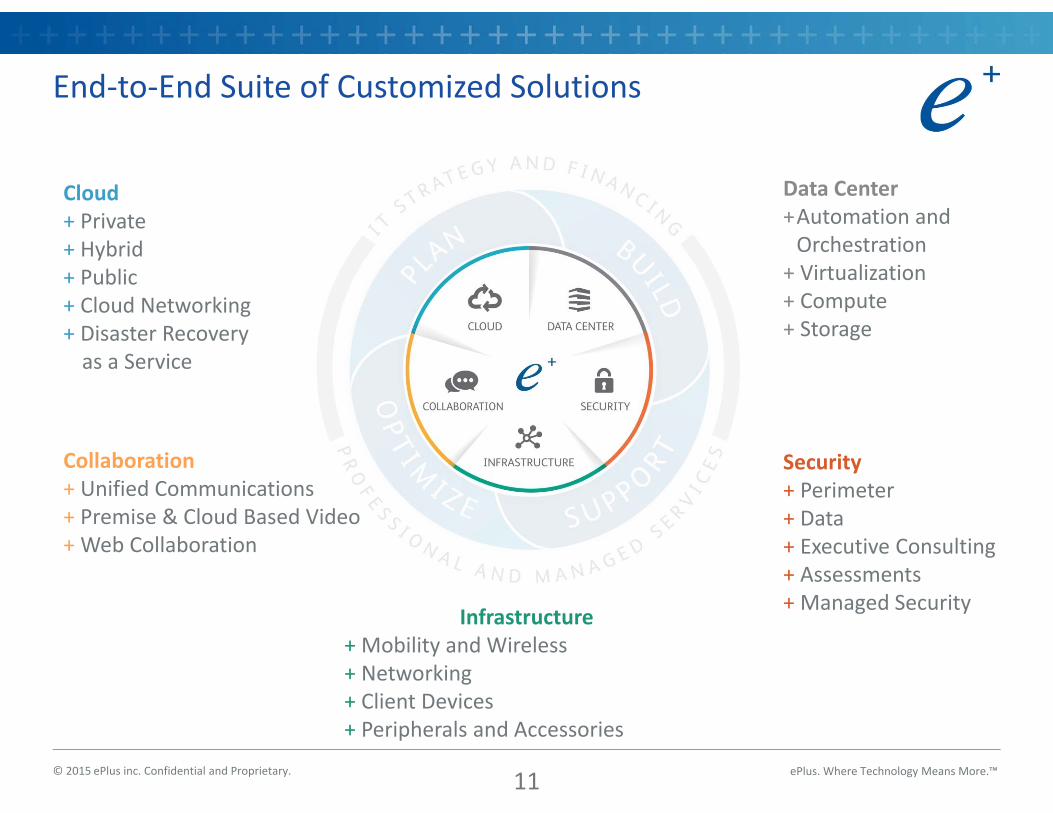
End‐to‐End Suite of Customized Solutions
© 2015 ePlus inc. Confidential and Proprietary.
Cloud+ Private+ Hybrid+ Public+ Cloud Networking+ Disaster Recovery as a Service
Data Center+Automation and Orchestration
+ Virtualization+ Compute+ Storage
Collaboration+ Unified Communications+ Premise & Cloud Based Video+ Web Collaboration
Infrastructure+ Mobility and Wireless+ Networking+ Client Devices+ Peripherals and Accessories
Security+ Perimeter+ Data+ Executive Consulting+ Assessments+ Managed Security
11
ePlus. Where Technology Means More.™
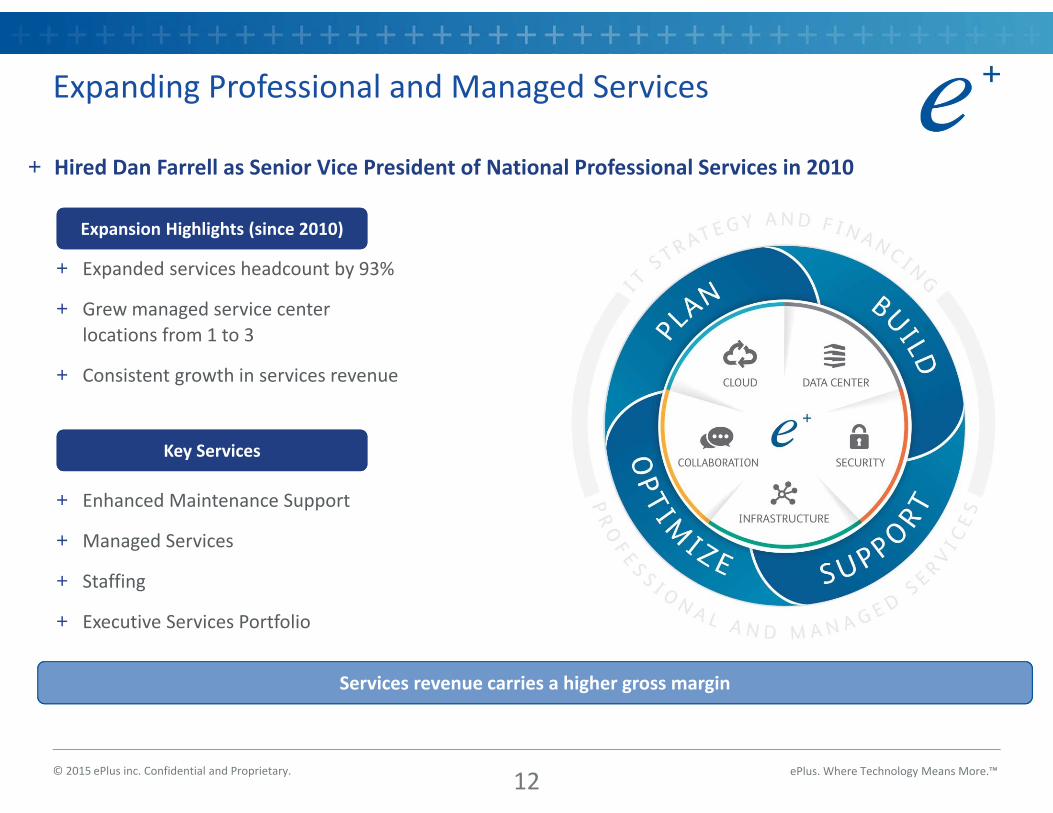
Expanding Professional and Managed Services
© 2015 ePlus inc. Confidential and Proprietary.
Expansion Highlights (since 2010)Expansion Highlights (since 2010)
+ Hired Dan Farrell as Senior Vice President of National Professional Services in 2010
+ Expanded services headcount by 93%
+ Grew managed service center locations from 1 to 3
+ Consistent growth in services revenue
+ Enhanced Maintenance Support
+ Managed Services
+ Staffing
+ Executive Services Portfolio
Key ServicesKey Services
Services revenue carries a higher gross margin
12
ePlus. Where Technology Means More.™
Independent Provider with Deep Strategic Relationships
© 2015 ePlus inc. Confidential and Proprietary.
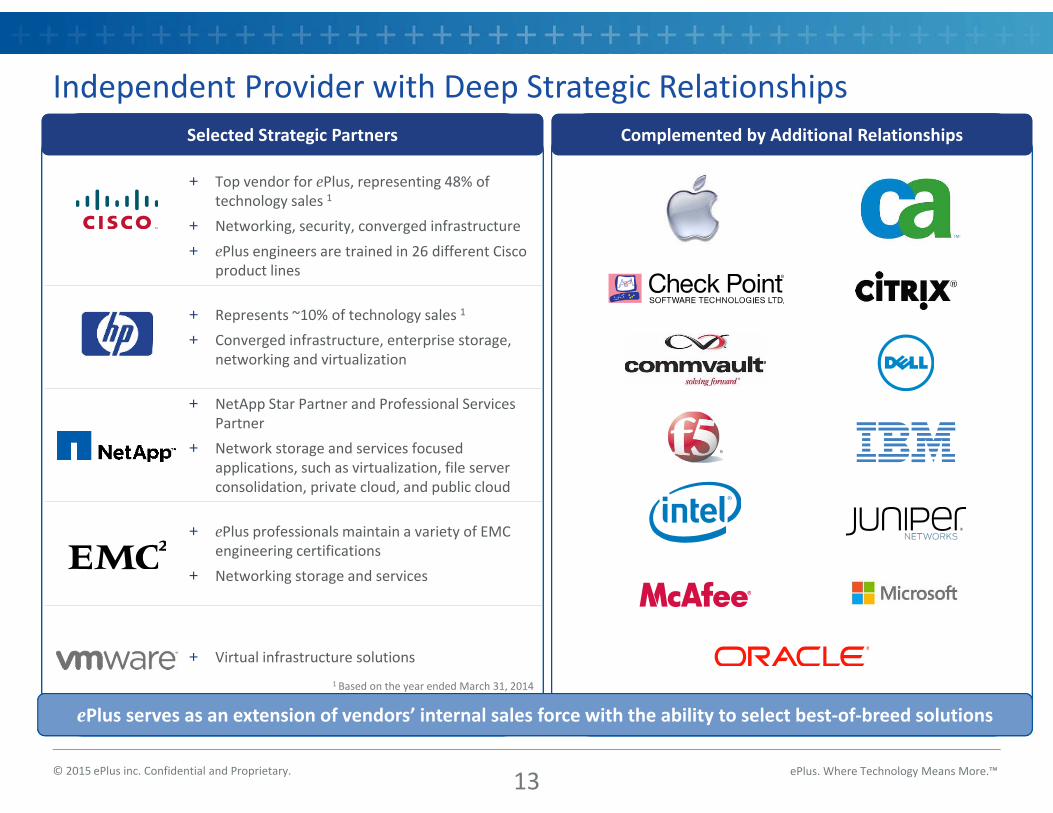
Selected Strategic PartnersSelected Strategic Partners
ePlus serves as an extension of vendors’ internal sales force with the ability to select best‐of‐breed solutions
+ Top vendor for ePlus, representing 48% of technology sales 1
+ Networking, security, converged infrastructure
+ ePlus engineers are trained in 26 different Cisco product lines
+ Represents ~10% of technology sales 1
+ Converged infrastructure, enterprise storage, networking and virtualization
+ NetApp Star Partner and Professional Services Partner
+ Network storage and services focused applications, such as virtualization, file server consolidation, private cloud, and public cloud
+ ePlus professionals maintain a variety of EMC engineering certifications
+ Networking storage and services
+ Virtual infrastructure solutions1 Based on the year ended March 31, 2014
Complemented by Additional RelationshipsComplemented by Additional Relationships
13
ePlus. Where Technology Means More.™
Deep Expertise and Experience with Emerging Vendors
© 2015 ePlus inc. Confidential and Proprietary.
Network
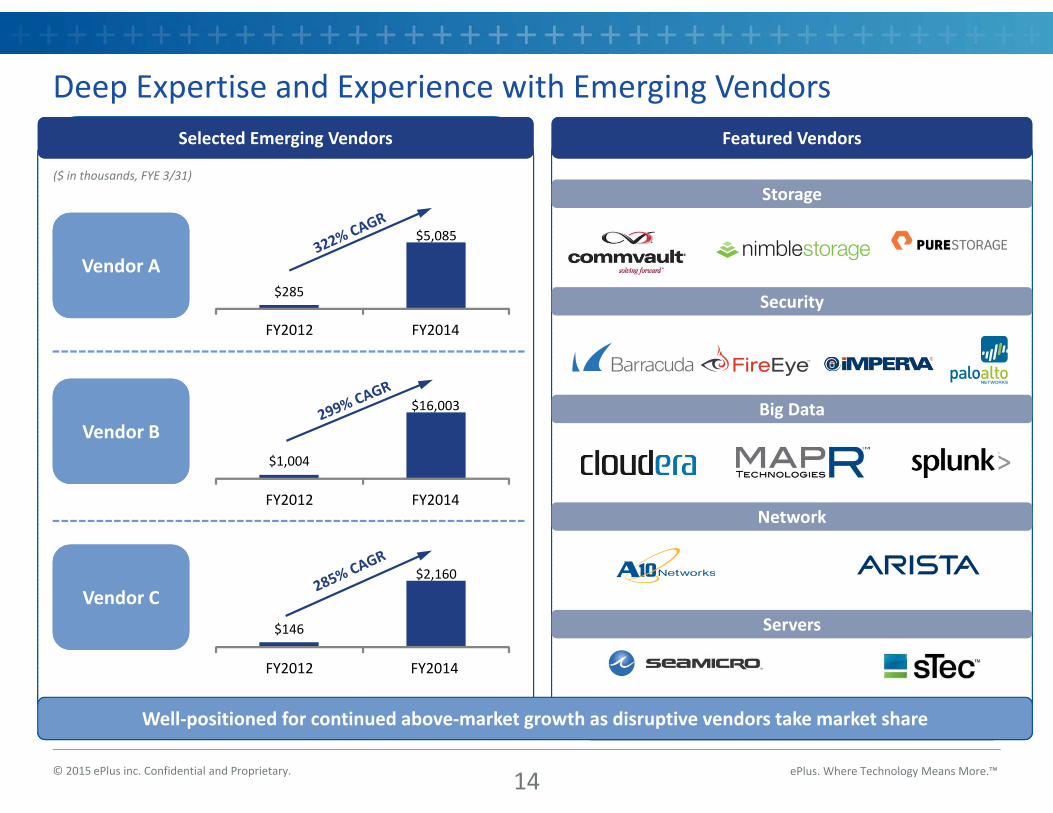
Vendor AVendor A
Vendor BVendor B
Vendor CVendor C
($ in thousands, FYE 3/31)Storage
Security
Big Data
Servers
Selected Emerging Vendors Selected Emerging Vendors
Well‐positioned for continued above‐market growth as disruptive vendors take market share
Featured VendorsFeatured Vendors
$285
$5,085
FY2012 FY2014
$1,004
$16,003
FY2012 FY2014
$146
$2,160
FY2012 FY2014
14
ePlus. Where Technology Means More.™
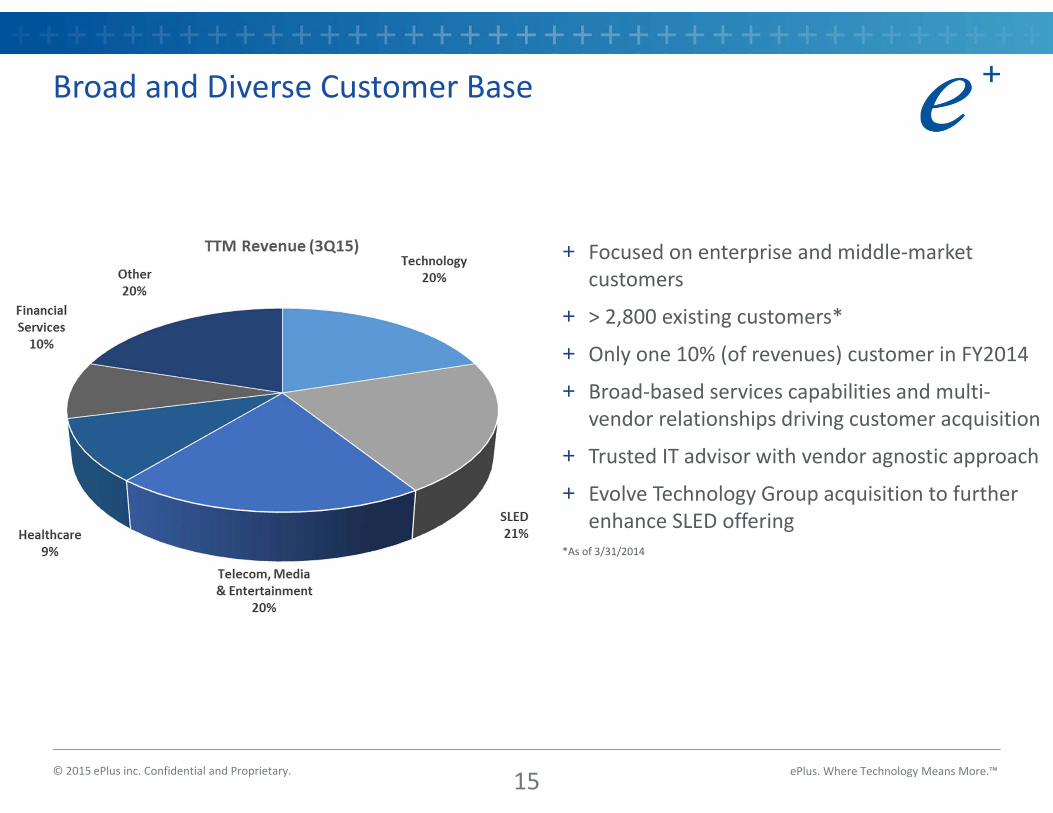
Broad and Diverse Customer Base
© 2015 ePlus inc. Confidential and Proprietary.
+ Focused on enterprise and middle‐market customers
+ > 2,800 existing customers*
+ Only one 10% (of revenues) customer in FY2014
+ Broad‐based services capabilities and multi‐vendor relationships driving customer acquisition
+ Trusted IT advisor with vendor agnostic approach
+ Evolve Technology Group acquisition to further enhance SLED offering
*As of 3/31/2014
15
ePlus. Where Technology Means More.™
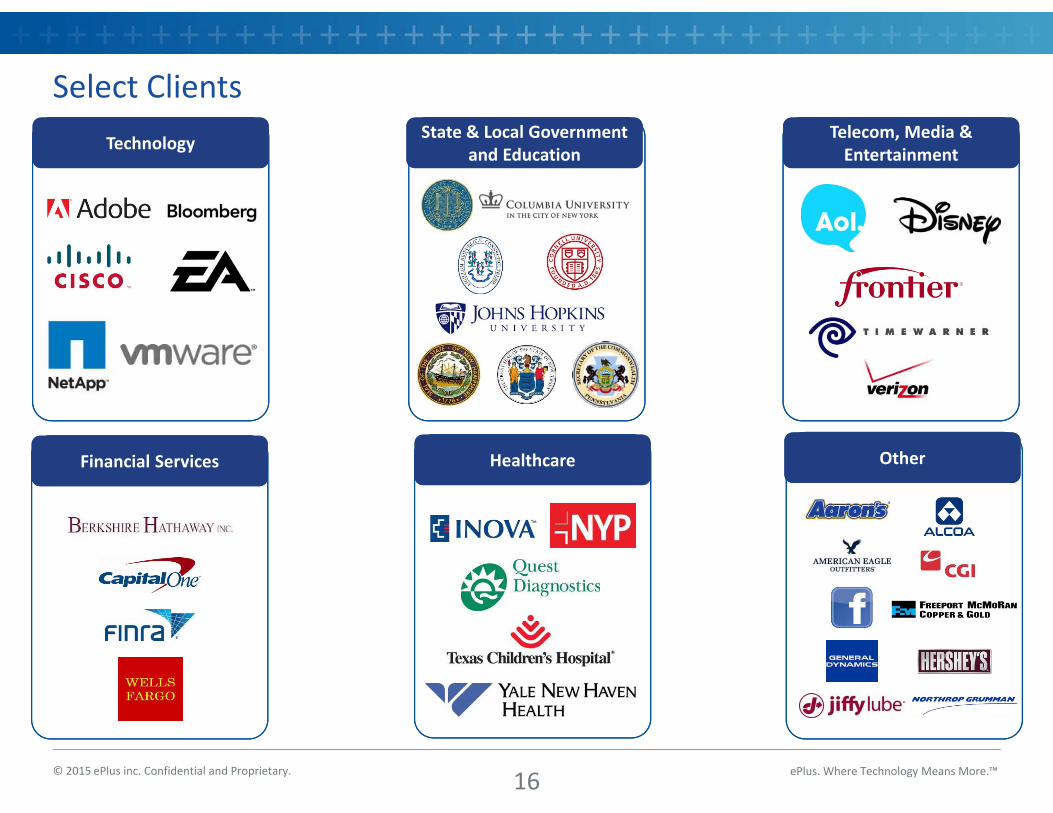
Select Clients
© 2015 ePlus inc. Confidential and Proprietary.
Financial ServicesFinancial Services
Telecom, Media & Entertainment
Telecom, Media & EntertainmentTechnologyTechnology
HealthcareHealthcare
State & Local Government and Education
State & Local Government and Education
OtherOther
16
ePlus. Where Technology Means More.™
™
Elaine MarionChief Financial Officer
ePlus. Where Technology Means More.™
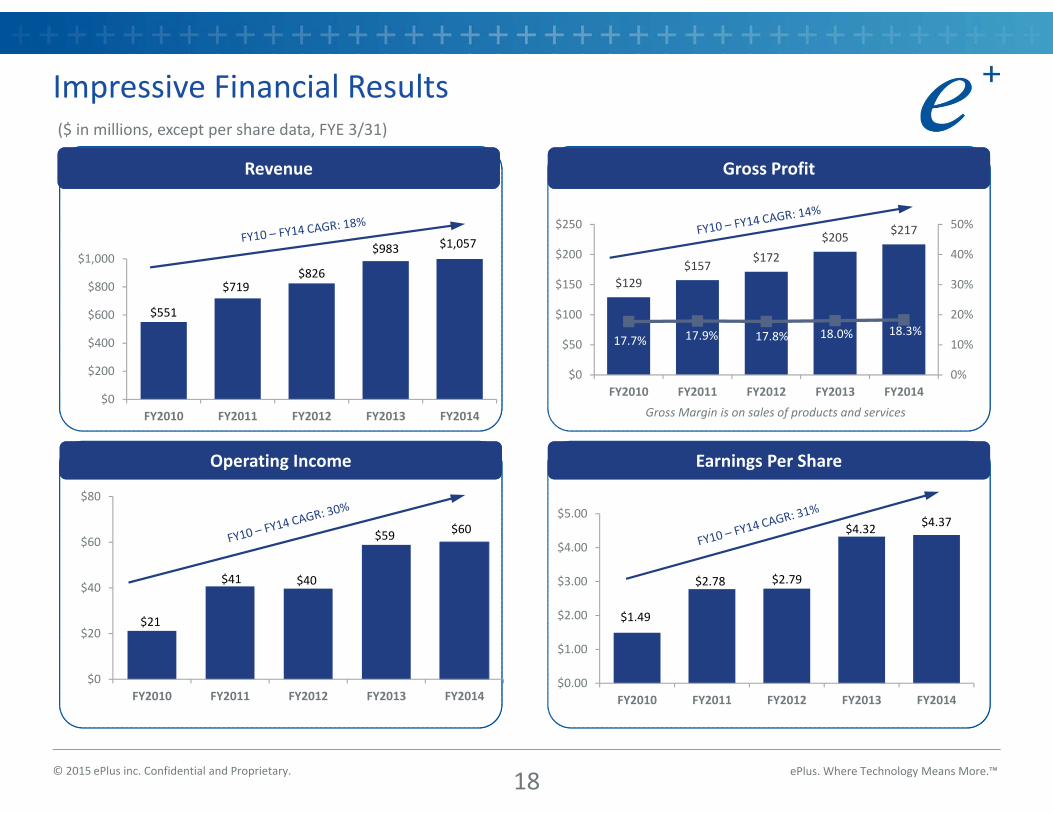
$129$157
$172$205 $217
17.7% 17.9% 17.8% 18.0% 18.3%
0%
10%
20%
30%
40%
50%
$0
$50
$100
$150
$200
$250
FY2010 FY2011 FY2012 FY2013 FY2014
Impressive Financial Results
© 2015 ePlus inc. Confidential and Proprietary.
Operating Income Operating Income Earnings Per ShareEarnings Per Share
Gross ProfitGross ProfitRevenue Revenue
($ in millions, except per share data, FYE 3/31)
Gross Margin is on sales of products and services
$551
$719$826
$983 $1,057
$0
$200
$400
$600
$800
$1,000
FY2010 FY2011 FY2012 FY2013 FY2014
$21
$41 $40
$59 $60
$0
$20
$40
$60
$80
FY2010 FY2011 FY2012 FY2013 FY2014
$1.49
$2.78 $2.79
$4.32 $4.37
$0.00
$1.00
$2.00
$3.00
$4.00
$5.00
FY2010 FY2011 FY2012 FY2013 FY2014
18
ePlus. Where Technology Means More.™
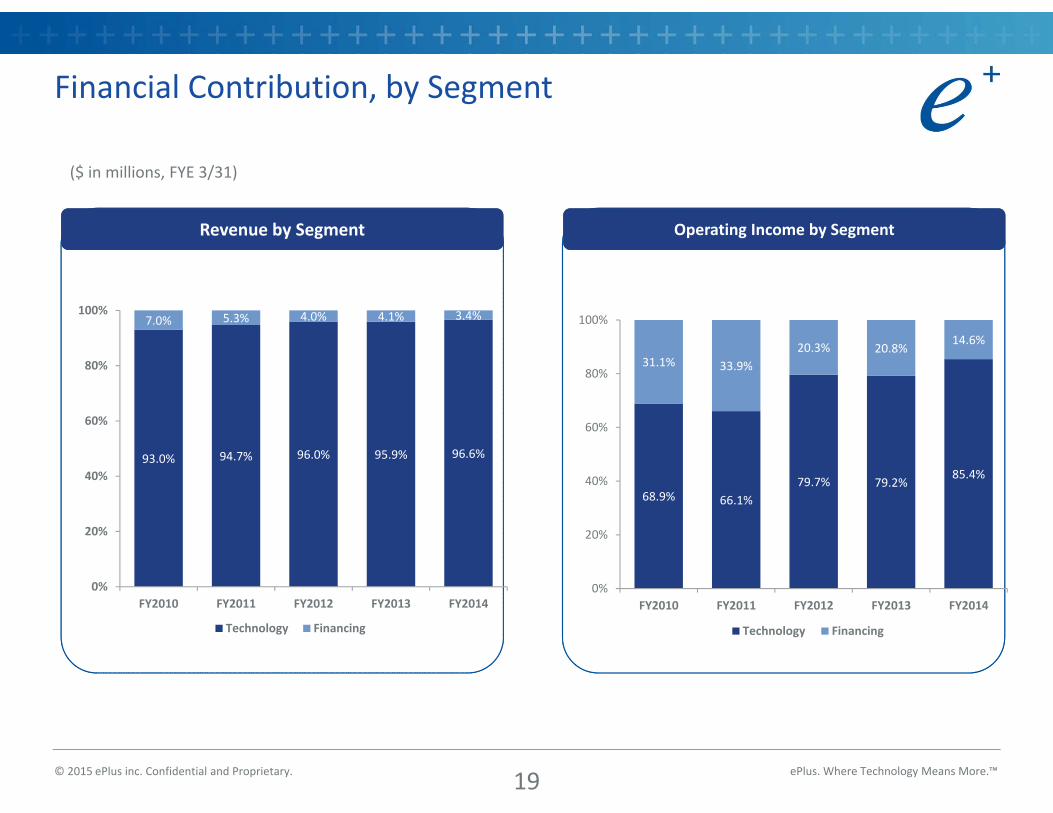
Financial Contribution, by Segment
© 2015 ePlus inc. Confidential and Proprietary.
Revenue by SegmentRevenue by Segment Operating Income by Segment Operating Income by Segment
($ in millions, FYE 3/31)
93.0% 94.7% 96.0% 95.9% 96.6%
7.0% 5.3% 4.0% 4.1% 3.4%
0%
20%
40%
60%
80%
100%
FY2010 FY2011 FY2012 FY2013 FY2014
Technology Financing
68.9% 66.1%79.7% 79.2%
85.4%
31.1% 33.9%20.3% 20.8%
14.6%
0%
20%
40%
60%
80%
100%
FY2010 FY2011 FY2012 FY2013 FY2014
Technology Financing
19
ePlus. Where Technology Means More.™
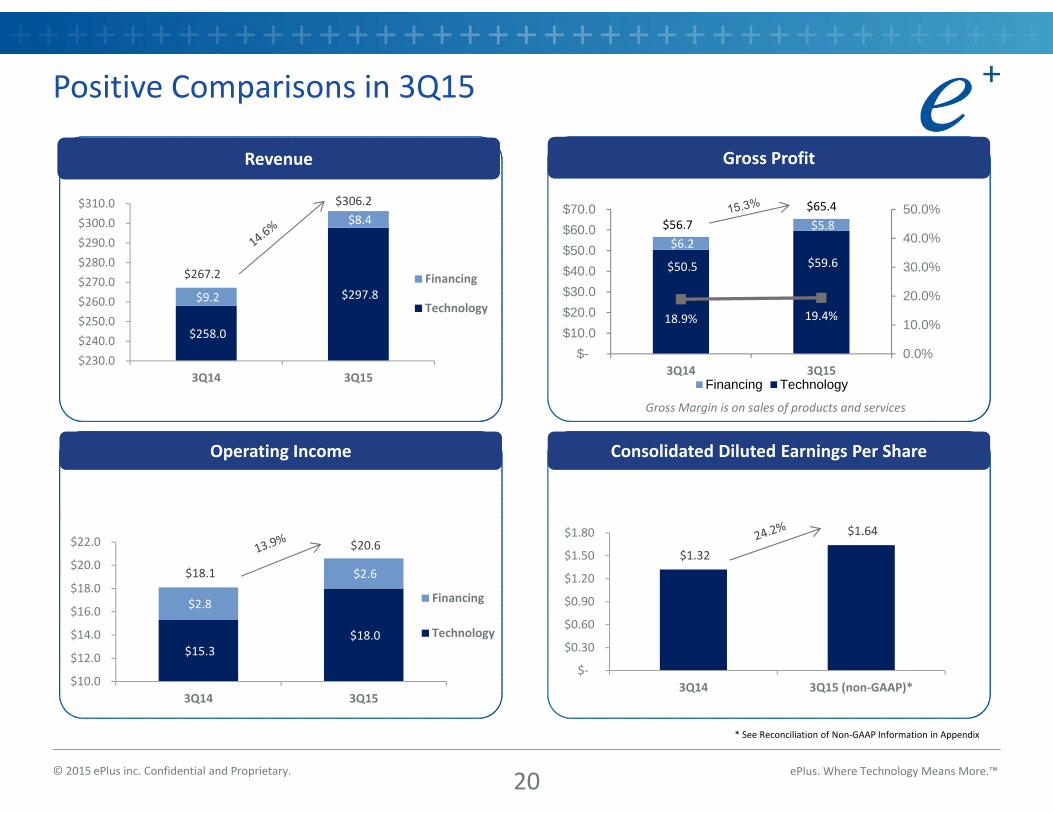
Positive Comparisons in 3Q15
© 2015 ePlus inc. Confidential and Proprietary.
Operating IncomeOperating Income Consolidated Diluted Earnings Per ShareConsolidated Diluted Earnings Per Share
Gross ProfitGross ProfitRevenue Revenue
* See Reconciliation of Non‐GAAP Information in Appendix
Gross Margin is on sales of products and services
$258.0
$297.8 $9.2
$8.4
$230.0 $240.0 $250.0 $260.0 $270.0 $280.0 $290.0 $300.0 $310.0
3Q14 3Q15
Financing
Technology
$267.2
$306.2
$50.5 $59.6 $6.2
$5.8
18.9% 19.4%
0.0%
10.0%
20.0%
30.0%
40.0%
50.0%
$- $10.0 $20.0 $30.0 $40.0 $50.0 $60.0 $70.0
3Q14 3Q15Financing Technology
$56.7$65.4
$15.3 $18.0
$2.8
$2.6
$10.0
$12.0
$14.0
$16.0
$18.0
$20.0
$22.0
3Q14 3Q15
Financing
Technology
$20.6
$18.1$1.32
$1.64
$‐
$0.30
$0.60
$0.90
$1.20
$1.50
$1.80
3Q14 3Q15 (non‐GAAP)*
20
ePlus. Where Technology Means More.™
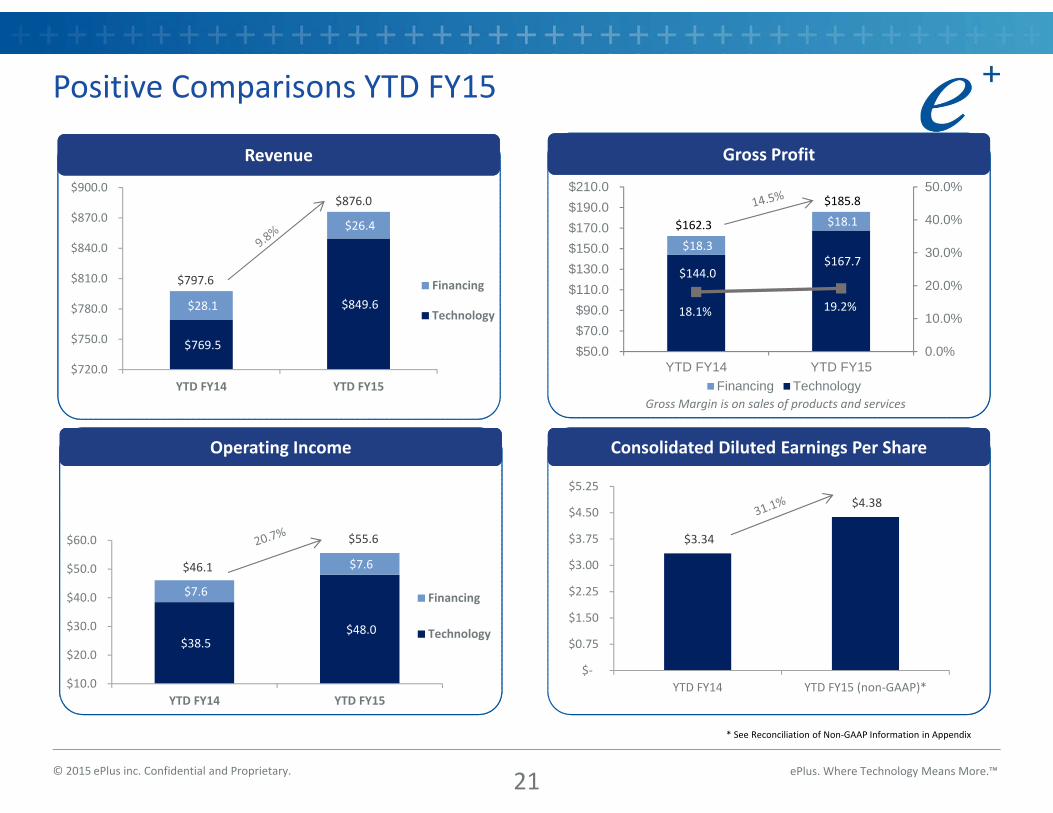
$38.5 $48.0
$7.6
$7.6
$10.0
$20.0
$30.0
$40.0
$50.0
$60.0
YTD FY14 YTD FY15
Financing
Technology
$55.6
$46.1
$3.34
$4.38
$‐
$0.75
$1.50
$2.25
$3.00
$3.75
$4.50
$5.25
YTD FY14 YTD FY15 (non‐GAAP)*
$144.0 $167.7
$18.3
$18.1
18.1% 19.2%
0.0%
10.0%
20.0%
30.0%
40.0%
50.0%
$50.0 $70.0 $90.0
$110.0 $130.0 $150.0 $170.0 $190.0 $210.0
YTD FY14 YTD FY15Financing Technology
$162.3
$185.8
$769.5
$849.6 $28.1
$26.4
$720.0
$750.0
$780.0
$810.0
$840.0
$870.0
$900.0
YTD FY14 YTD FY15
Financing
Technology
Positive Comparisons YTD FY15
© 2015 ePlus inc. Confidential and Proprietary.
* See Reconciliation of Non‐GAAP Information in Appendix
Operating IncomeOperating Income Consolidated Diluted Earnings Per ShareConsolidated Diluted Earnings Per Share
Gross ProfitGross ProfitRevenue Revenue
Gross Margin is on sales of products and services
$797.6
$876.0
21
ePlus. Where Technology Means More.™
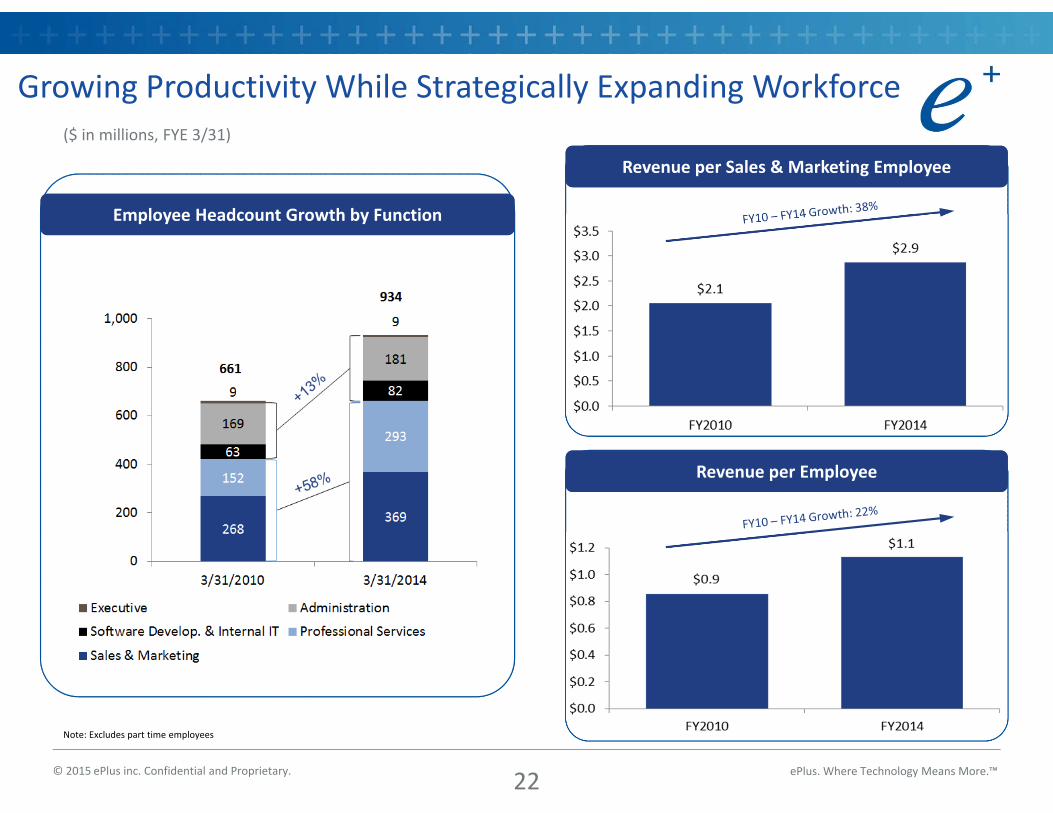
Growing Productivity While Strategically Expanding Workforce
© 2015 ePlus inc. Confidential and Proprietary.
Employee Headcount Growth by FunctionEmployee Headcount Growth by Function
Revenue per EmployeeRevenue per Employee
Note: Excludes part time employees
($ in millions, FYE 3/31)
Revenue per Sales & Marketing EmployeeRevenue per Sales & Marketing Employee
22
ePlus. Where Technology Means More.™
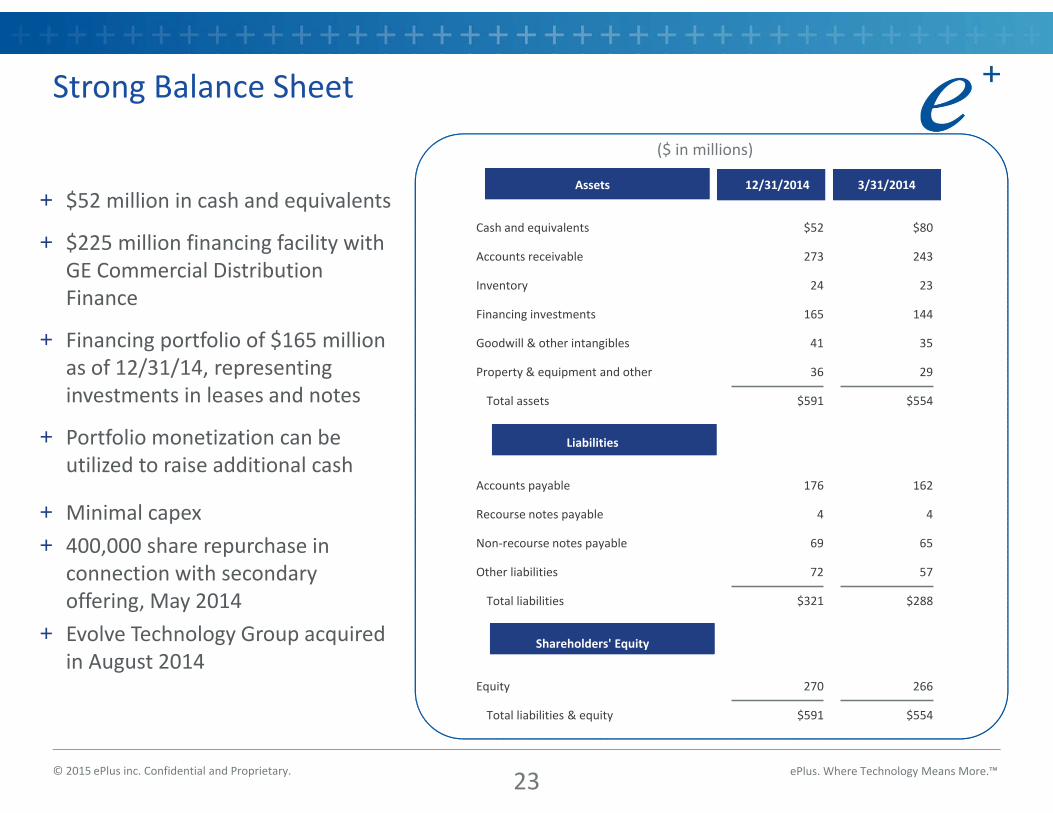
Strong Balance Sheet
© 2015 ePlus inc. Confidential and Proprietary.
+ $52 million in cash and equivalents
+ $225 million financing facility with GE Commercial Distribution Finance
+ Financing portfolio of $165 million as of 12/31/14, representing investments in leases and notes
+ Portfolio monetization can be utilized to raise additional cash
+ Minimal capex+ 400,000 share repurchase in
connection with secondary offering, May 2014
+ Evolve Technology Group acquired in August 2014
($ in millions)
Assets 12/31/2014 3/31/2014
Cash and equivalents $52 $80
Accounts receivable 273 243
Inventory 24 23
Financing investments 165 144
Goodwill & other intangibles 41 35
Property & equipment and other 36 29
Total assets $591 $554
Liabilities
Accounts payable 176 162
Recourse notes payable 4 4
Non‐recourse notes payable 69 65
Other liabilities 72 57
Total liabilities $321 $288
Shareholders' Equity
Equity 270 266
Total liabilities & equity $591 $554
23
ePlus. Where Technology Means More.™
™
Appendix
ePlus. Where Technology Means More.™© 2015 ePlus inc. Confidential and Proprietary.
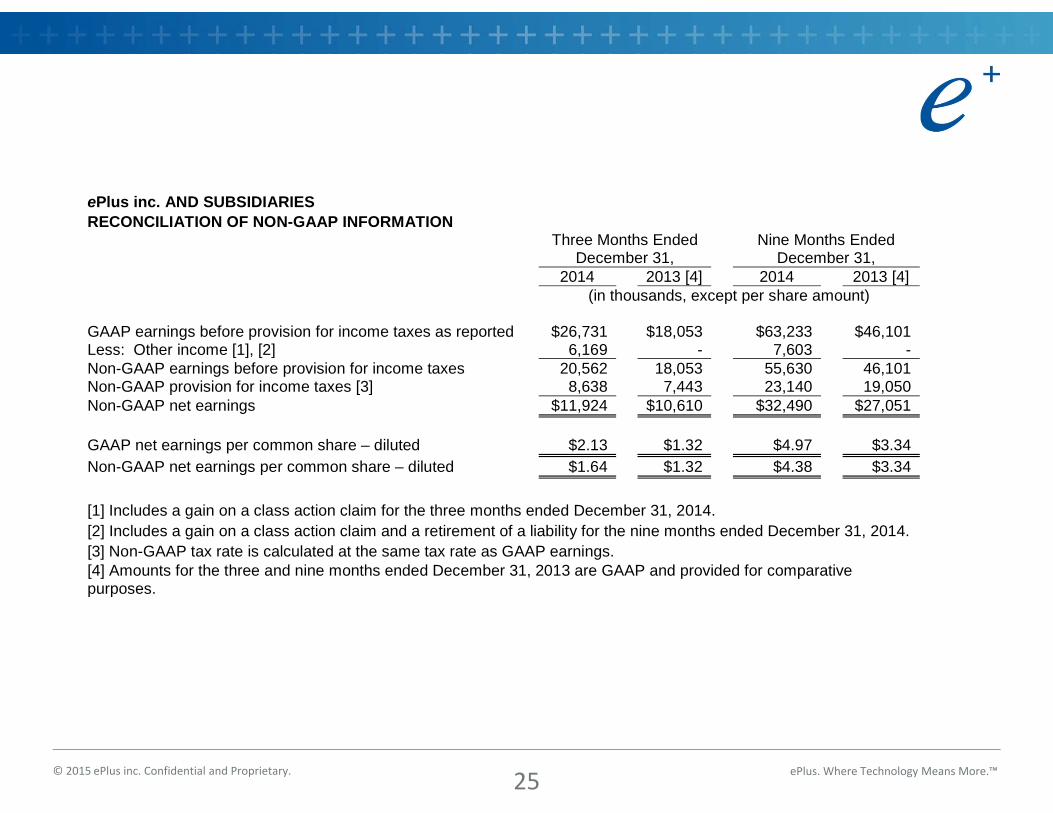
ePlus inc. AND SUBSIDIARIES RECONCILIATION OF NON-GAAP INFORMATION
Three Months Ended December 31,
Nine Months Ended December 31,
2014 2013 [4] 2014 2013 [4] (in thousands, except per share amount) GAAP earnings before provision for income taxes as reported $26,731 $18,053 $63,233 $46,101 Less: Other income [1], [2] 6,169 - 7,603 - Non-GAAP earnings before provision for income taxes 20,562 18,053 55,630 46,101 Non-GAAP provision for income taxes [3] 8,638 7,443 23,140 19,050 Non-GAAP net earnings $11,924 $10,610 $32,490 $27,051 GAAP net earnings per common share – diluted $2.13 $1.32 $4.97 $3.34 Non-GAAP net earnings per common share – diluted $1.64 $1.32 $4.38 $3.34 [1] Includes a gain on a class action claim for the three months ended December 31, 2014. [2] Includes a gain on a class action claim and a retirement of a liability for the nine months ended December 31, 2014. [3] Non-GAAP tax rate is calculated at the same tax rate as GAAP earnings. [4] Amounts for the three and nine months ended December 31, 2013 are GAAP and provided for comparative purposes.
25
ePlus. Where Technology Means More.™
Investor Relations Contact Information
© 2015 ePlus inc. Confidential and Proprietary.
Kley Parkhurst, SVP
ePlus inc.(703) 984‐8150
ePlus inc.13595 Dulles Technology Drive
Herndon, VA 20171‐3413(703) 984‐8400www.eplus.com
26