Embed Size (px)
Citation preview

www.rpi.edu/datawarehouse
DATA WAREHOUSE SERVICES
EPM: Getting Started What’s New: Enterprise Performance Management
Abstract: This document provides a detailed reference and highlights the new aspects of Oracle EPM and Interactive Reporting – the front-end of RPI’s data warehouse. Please contact data warehouse support ([email protected]) with questions related to Oracle EPM or Interactive Reporting.
Contents Enterprise Performance Management ..................................................................................................... 3
Login .......................................................................................................................................................... 3
EPM Terminology Reference .................................................................................................................... 5
EPM Workspace – Default Home Page ..................................................................................................... 5
My Personal Page ...................................................................................................................................... 6
Explore ...................................................................................................................................................... 7
Search .................................................................................................................................................... 8
Help ....................................................................................................................................................... 8
Working with BQYs ................................................................................................................................... 8
BQY Sections ......................................................................................................................................... 9
Query Section ........................................................................................................................................ 9
Results Section .................................................................................................................................... 10
Pivot Section ....................................................................................................................................... 11
Chart Section ....................................................................................................................................... 12

Enterprise Performance Management Oracle Enterprise Performance Management (EPM) serves as the front-end for RPI’s data warehouse. EPM is a coordinated environment that hosts Interactive Reporting (i.e., Brio), a query and reporting tool that allows users to process and analyze their own queries and reports and/or work with queries and reports built by others. EPM replaces the Brio Portal, also known as Hyperion Performance Suite.
Login Users may reach the EPM login page with the following URL:
https://dw.rpi.edu/workspace/
Upon request, the data warehouse team assigns each user a login to the EPM system.
Users gain access to the system by means of the EPM login page.

Users may also gain access to the system by way of the data warehouse Website, found with the following URL:
http://www.rpi.edu/datawarehouse/dw-brio.html
The link underneath “accessing interactive reporting” directs users to the Enterprise Performance Management (EPM) login page as well.

EPM Terminology Reference Old New
Brio Portal (or, Hyperion Performance Suite) EPM Workspace Browse Explore Personal Page My Personal Page Brio Query (or, Brio) Interactive Reporting (IR) Brio Plug-In Interactive Reporting Web Client (IRWC) BQY BQY
EPM Workspace – Default Home Page The default home page appears after you login to the EPM system. It displays a list of your recently opened items, Workspace pages, and quick links. You may also navigate from this page to other Workspace pages; the My Personal Page section, which contains dashboards; or to the Explore list, which contains data mart folders and published BQYs.
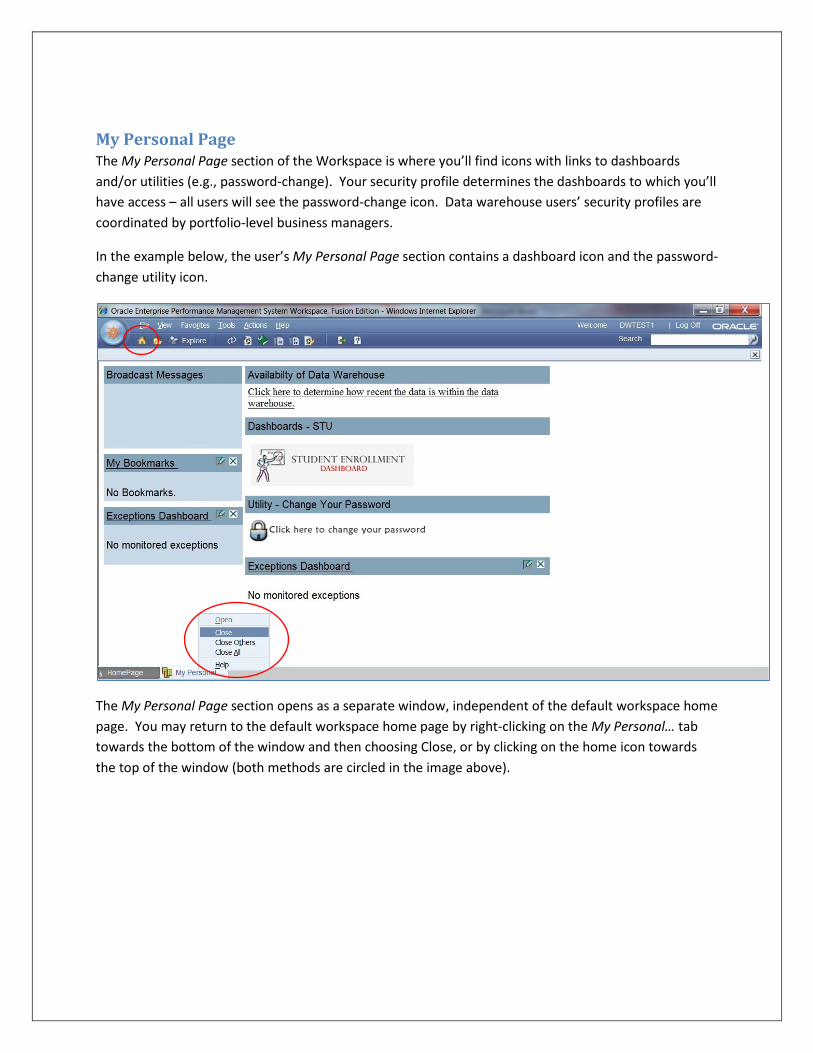
My Personal Page The My Personal Page section of the Workspace is where you’ll find icons with links to dashboards and/or utilities (e.g., password-change). Your security profile determines the dashboards to which you’ll have access – all users will see the password-change icon. Data warehouse users’ security profiles are coordinated by portfolio-level business managers.
In the example below, the user’s My Personal Page section contains a dashboard icon and the password-change utility icon.
The My Personal Page section opens as a separate window, independent of the default workspace home page. You may return to the default workspace home page by right-clicking on the My Personal… tab towards the bottom of the window and then choosing Close, or by clicking on the home icon towards the top of the window (both methods are circled in the image above).
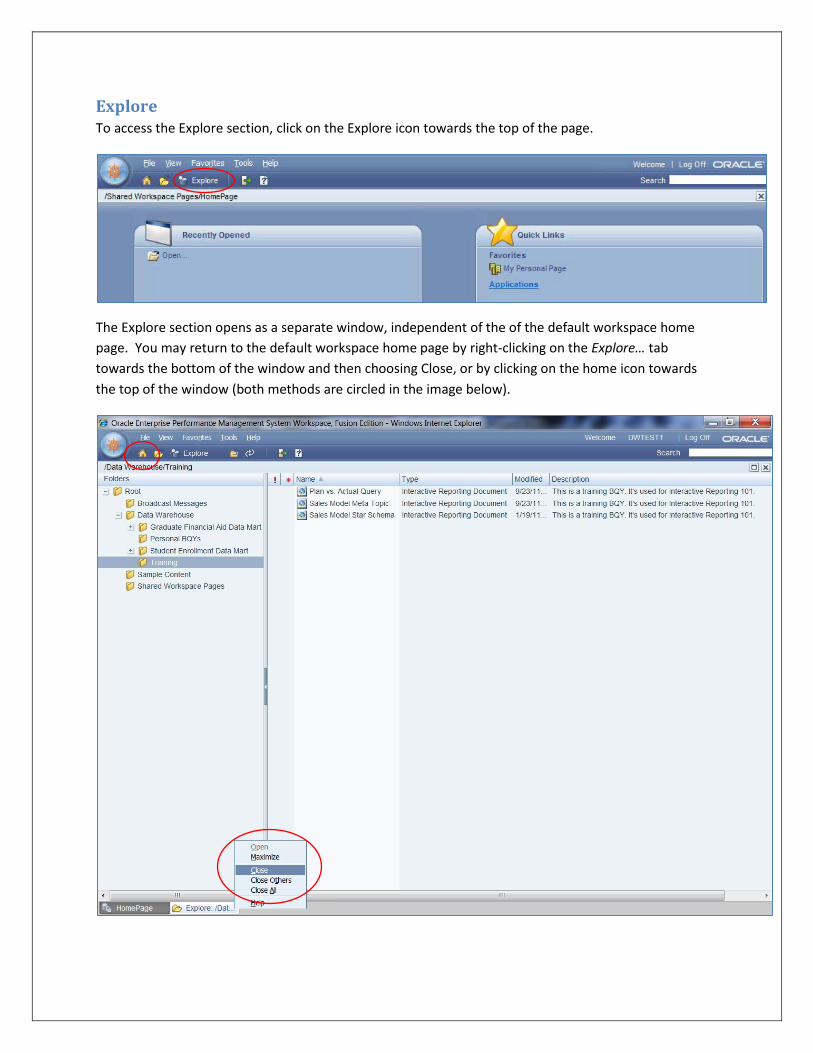
Explore To access the Explore section, click on the Explore icon towards the top of the page.
The Explore section opens as a separate window, independent of the of the default workspace home page. You may return to the default workspace home page by right-clicking on the Explore… tab towards the bottom of the window and then choosing Close, or by clicking on the home icon towards the top of the window (both methods are circled in the image below).
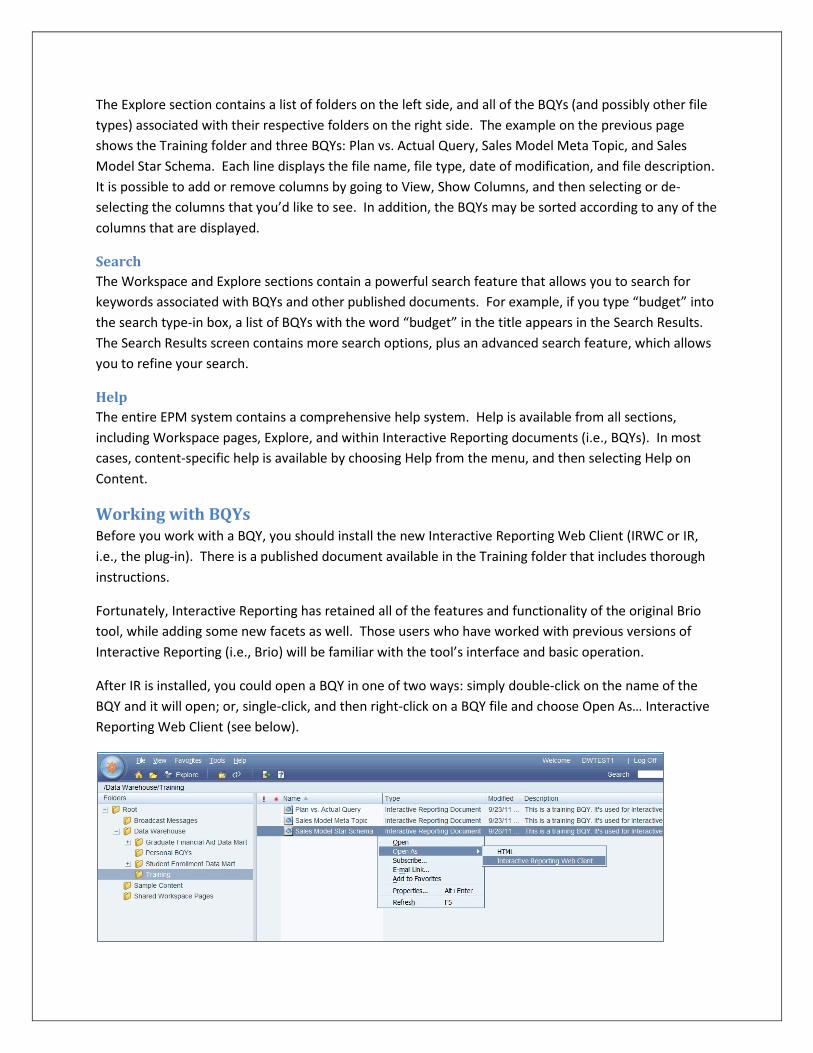
The Explore section contains a list of folders on the left side, and all of the BQYs (and possibly other file types) associated with their respective folders on the right side. The example on the previous page shows the Training folder and three BQYs: Plan vs. Actual Query, Sales Model Meta Topic, and Sales Model Star Schema. Each line displays the file name, file type, date of modification, and file description. It is possible to add or remove columns by going to View, Show Columns, and then selecting or de-selecting the columns that you’d like to see. In addition, the BQYs may be sorted according to any of the columns that are displayed.
Search The Workspace and Explore sections contain a powerful search feature that allows you to search for keywords associated with BQYs and other published documents. For example, if you type “budget” into the search type-in box, a list of BQYs with the word “budget” in the title appears in the Search Results. The Search Results screen contains more search options, plus an advanced search feature, which allows you to refine your search.
Help The entire EPM system contains a comprehensive help system. Help is available from all sections, including Workspace pages, Explore, and within Interactive Reporting documents (i.e., BQYs). In most cases, content-specific help is available by choosing Help from the menu, and then selecting Help on Content.
Working with BQYs Before you work with a BQY, you should install the new Interactive Reporting Web Client (IRWC or IR, i.e., the plug-in). There is a published document available in the Training folder that includes thorough instructions.
Fortunately, Interactive Reporting has retained all of the features and functionality of the original Brio tool, while adding some new facets as well. Those users who have worked with previous versions of Interactive Reporting (i.e., Brio) will be familiar with the tool’s interface and basic operation.
After IR is installed, you could open a BQY in one of two ways: simply double-click on the name of the BQY and it will open; or, single-click, and then right-click on a BQY file and choose Open As… Interactive Reporting Web Client (see below).

BQY Sections By default, most BQYs display the query section upon opening; however, if the BQY has a push-button menu system (i.e., an Executive Information System, or EIS), then either a welcome or a main menu screen appears first. These screens provide instructions on how to process the query(s) in the BQY.
Query Section The Query section is where Interactive Reporting interfaces with the underlying database through star schemas and/or meta topics. Each BQY contains one or more query sections; each query section has its own results section.
Query Section Terminology Old New
Limit Filter Table Catalog Elements Request Request Sort Sort Star Schema Star Schema BQY BQY

Results Section After you process a query, Interactive Reporting displays the request items from the query in a tabular format called the Results section. Each request item appears as a column in the Results section. Data within the Results section may be sorted or filtered; columns may be re-arranged in any order.
Results Section Terminology Old New
Limit Filter Sort Sort Outliner Data Layout Table Catalog Elements
Table Section A Table section is similar to a Results section; however, you are allowed to choose the fields that you’d like to see in the table. The table inherits the filters from the results section used to create it; however, you may apply additional filters to the table. You can also create charts and pivots that are driven from the data within the table section. A BQY may include one or more Table sections.

Pivot Section A pivot table is a versatile data analysis tool that allows you to summarize data or explore details in a variety of ways. You may add one or more Pivot sections to your BQY. Pivots inherit the limits that are set in the query and results sections to which they belong. Pivots are also drillable, which allows you to see more detailed results.
Pivot Section Terminology Old New
Sort Sort Outliner Data Layout Side Labels Row Labels Top Labels Column Labels Facts Facts Table Catalog Elements

Chart Section The Chart section allows you to display your data in a variety of meaningful summaries, which enables you to spot trends and patterns in the data. You may add one or more Chart sections to your BQY. Charts inherit the limits that are set in the query and results sections to which they belong. Charts are also drillable, which allows you to see more detailed results.
Chart Section Terminology Old New
Sort Sort Outliner Data Layout X-Categories X Axis (becomes Slice for a pie chart) Y-Facts Fact Z-Categories Depth (becomes Stack for stacked bar charts) Table Catalog Elements


![Skaffold - storage.googleapis.com · [getting-started getting-started] Hello world! [getting-started getting-started] Hello world! [getting-started getting-started] Hello world! 5](https://img.pdfslide.net/doc/110x75/5ec939f2a76a033f091c5ac7/skaffold-getting-started-getting-started-hello-world-getting-started-getting-started.jpg)