Embed Size (px)
Citation preview

The Impact of Social Class Bias on Psychological and Psychotherapeutic Practitioners’ Clinical Reasoning
Thomas Vlietstra
Submitted for the Degree of
Doctor of Psychology (Clinical Psychology)
School of PsychologyFaculty of Health and Medical Sciences
University of Surrey
September 2017
© Thomas Vlietstra 2017

Statement of Originality
This thesis and the work to which it refers are the results of my own efforts. Any ideas,
data, images, or text resulting from the work of others (whether published or
unpublished) are fully identified as such within the work and attributed to their
originator in the text. This thesis has not been submitted in whole or in part for any
other academic degree or professional qualification.
Name: Thomas Vlietstra
2
Overview of Portfolio
Research:
Social class biases are ubiquitous within Britain. Healthcare practitioners (including
psychological and psychotherapeutic clinicians) are taught to treat clients
nonjudgmentally with equal respect. However, clients may be discriminated against in
relation to their social class. This thesis aimed to understand the impact that social
class biases may have on healthcare professionals’ (and those in training) clinical
reasoning abilities. Part one of this portfolio presents a narrative literature review of
existing research on the impact social class biases have within medical and healthcare
professions. The findings of the review suggest that healthcare practitioners may
exhibit social class biases. This is in regards to diagnostic reasoning, treatments
provided, affective responses, explanations provided, examinations patients receive
and allocation of cognitive resources. The extent to which this impacts their practice
is dependent upon the clinical context, environment, and how social class is
conceptualised. Part two presents an empirical paper, which utilised an experimental
video vignette design specifically with British Psychological and Psychotherapeutic
professionals within the NHS. Within the context of the study participants
significantly perceived a ‘lower social class’ client as more likely to be diagnosed
with a ‘substance misuse disorder’ and be more motivated to make changes during
therapy compared to an ‘upper class client’. Overall, there was no general pattern of
discrimination against clients in relation to their social class. This may be due to client
class cues priming the psychologist to reflect on their beliefs about social class and
shift their position.
Clinical Training:
Part three of this portfolio highlights the clinical work completed across the three
years of the doctorate, including the nature of the placement, predominant therapeutic
models, clinical presentations worked alongside and psychometric and
neuropsychological measures completed. Part four outlines all academic and clinical
assignments completed as part of the program.
3

Table of Contents
Training Experience Acknowledgements...............................................................................5
Empirical Paper Acknowledgements .....................................................................................6
Part 1: Literature Review........................................................................................................7
Abstract...................................................................................................................................8Introduction...........................................................................................................................10Method..................................................................................................................................16Results...................................................................................................................................20Discussion.............................................................................................................................55Conclusion............................................................................................................................64References.............................................................................................................................65
Part 2: Empirical Paper.........................................................................................................84
Abstract.................................................................................................................................85Introduction...........................................................................................................................87Main Hypotheses..................................................................................................................95Method..................................................................................................................................96Results.................................................................................................................................106Discussion...........................................................................................................................122Conclusion..........................................................................................................................130References...........................................................................................................................132Appendix A: Script for Vignettes.......................................................................................157Appendix B: Full Procedure and Measures Used...............................................................161Appendix C: Advertisement - Letters.................................................................................174Appendix D: Advertisement - Poster..................................................................................175Appendix E: Ethical Acceptance........................................................................................176Appendix F: Main Effect Normality Plot...........................................................................184Appendix G: Residual Plots for Moderation......................................................................190
Part 3: Summary of Clinical Experience...........................................................................193
Part 4: Assignments Completed During Training............................................................196
4

Training Experience Acknowledgements
I would like to thank my eight clinical supervisors across my time of training: Dr
Gurpreet Kaur, Dr Caroline Dibnah, Dr Laura Smith, Dr Sally Stapleton, Dr Tina Lee,
Dr Julian Morris, Dr Jenni Shaw, Dr Phil Henshaw. They have fostered my growth as
a psychologists, with each placement acting as a scaffold for the next. I feel I have
been very fortunate to have such high quality and reflective supervision across
placements.
I would like to thank the members of staff, teams and clients I have worked alongside
for the learning and experiences they have provided me with. They reinstated the
importance of appreciating diversity, difference, power dynamics and how we tell
stories.
I would like to thank my clinical tutor Dr Eli Joubert for his support, guidance and
wisdom across clinical training, and providing me with a space to explore ‘what kind
of psychologist I would like to be.’
I would like to thank Mary John, Charlotte King and the Surrey course team for their
tireless work and ‘above and beyond’ approach which is much appreciated.
I would like to thank my mentor Dr Drew Alcott for providing me with a space to
discuss issues in clinical psychology and leadership separate from a training structure.
I would like to thank Francesca Thorpe for the psychotherapy and counselling she has
provided me with over the past three years, which aided in uniting my ‘personal’ and
‘professional’ sides and challenge the myth of an ‘untroubled therapist.’
Finally, clinical training does not exist within a vacuum. It is not ‘lip service’ when
courses outline the importance of having a good support network throughout. I would
like to thank my family, friends, fellow trainees and my partner Yan Yee Sung for
their invaluable support across the three years of training. Completing training would
not have been possible without them.
5
Empirical Paper Acknowledgements
I would like to thank my principal supervisor Linda Morison (University of Surrey)
for her support throughout the process, her statistical understanding and ability to help
me to focus on the main messages of the project.
I would also like to thank my co-supervisor Dr Adam McNamara (University of
Nottingham) for his support and mentoring, both during the project and over the past
five years when we first started looking at Social Class Bias together.
I would also like to thank Andrew Barnes (University of Surrey) for running the
project website and introducing me to Qualtrics software and to Tony Northeast
(University of West London) who developed the Brief Implicit Association Test
(BIAT) for use within Qualtrics. Additionally, Tony Northeast and Dr McNamara
transformed the raw BIAT data into a BIAT effect size.
I would like to thank Jamie Seal (Chicken/Egg Theatre Company) for acting in the
project’s video vignettes, alongside aiding in the planning and direction of the videos.
The skill required to produce two similar performances, whist only varying accent,
was appreciated. I would also like to thank Nigel Woodger (University of Surrey) for
setting up, rehearsing, filming and editing the video vignettes.
I would like to thank Dr Alison Yeung Yam Wah (University of Surrey) for her
support in relation to my academic writing. She reinstated the lessons my friend Nick
Bound has been trying to teach me about grammar over the years.
Finally, I would like to thank all the participants who gave up their time to complete
the study, and to the NHS trusts, teams, psychology leads, and professionals who
advertised the project.
6

Part One
The Impact of Social Class Bias on Healthcare Professionals’ Clinical Reasoning.
7

Abstract
Objectives
Medical and healthcare professionals are taught to treat all patients with equal respect,
however patients may be subtly discriminated against based on their social class. The
aim of the present review was to synthesise and critically evaluate the existing
evidence on medical and health practitioner social class biases in terms of the impact
on clinical reasoning.
Data sources
PsychInfo, PsychArticles, Psychology and Behavioural Sciences Collection, PubMed
and ProQuest.
Eligibility Criteria
Studies were required to have a quantitative methodology, involving the direct
comparison of ‘lower-class’ patients to another ‘class group’. The studies needed to
sample medical/healthcare professionals, focusing on individual practitioner’s class
bias and a component of medical/clinical reasoning.
Data synthesis
Eighteen papers, published between 1980-2015, met the eligibility criteria and were
included in this review. A narrative synthesis was completed due to heterogeneity of
data between studies.
Results
It was found that small–large effects of social class bias, predominantly in the
direction of upper class preference, were found for diagnostic reasoning, treatments
provided, affective responses to patients, explanations provided to patients,
examinations patients received and allocation of cognitive resources.
8
Conclusions
This review weighs up the usefulness of this research in the context of their
methodologies and how class is operationalised in these studies. Healthcare
practitioners may exhibit social class biases, the extent to which this impacts their
practice is dependent upon the clinical context, environment and how social class is
conceptualised.
9
Introduction
The impact of social class prejudice has been relatively neglected in medical,
healthcare, psychological and psychotherapeutic settings (Blacksher, 2008; Liu, 2011;
Smith, 2005). Prejudice is defined as showing aversion or hostility towards an
individual or social group (Harris, & Fiske, 2006). Attitudes toward race, gender, age,
religion or sexuality may all lead to prejudice (Nosek, 2007). Prejudices can take the
form of subtle bias and even be born from good intentions (Toporek, 2013). The
current literature review aims to highlight the potential impact of class bias on
healthcare professional’s clinical reasoning.
Academics in the fields of health and epidemiology tend to have difficulty
defining, measuring and operationalising class in their research (Lau, Cho, Chang &
Huang, 2013), which may suggest why class is often neglected within healthcare
literature. Traditionally, lower social class is reflected by lower educational
attainment, reduced income, lower occupational standing and inferior social ranking
(Lareau, 2003). However, the correlation between objective markers of class, such as
income or occupation, is low (Braverman et al., 2005). The nature of these objective
cues is also influenced by subtle processes. For example, the proxy of income/wealth
may be ‘tied up’ with cues about nutrition, housing and recreation (Lau et al., 2013;
Shavers, 2007). These cues do not account for how/where the income/wealth is spent
and level of expenditure compared to income (Lau et al., 2013). Therefore, social
class is also dependent on subtle forms of differentiation based upon individuals’
preferences and interactions (Bennett, 2012; Bordieu, 1984). Class markers are
dependent on the culture they are within (Vanneman, 1980). Some have argued that
asking individuals what they subjectively perceive their ‘social class’ to be is a better
indication than using objective markers of class (e.g. wealth or occupation) because
10

individuals classify themselves according to an aggregation of the complex factors
associated with social class (Lau et al., 2013; Singh-Manoux, Adler, & Marmot,
2003). However, many empirical research studies still use ‘objective’ markers such as
education or occupation as proxies for class regardless of their limitations (Braverman
et al., 2005; Krieger, Williams & Moss, 1997).
Previous research has shown that individuals from lower class groups
(however defined) have lower life expectancies, higher rates of mortality and
increased ill health across western cultures (Chen & Patterson, 2006; James, Nelson,
Ralph, & Leather, 1997; Mackenbach et al., 2008). The mortality rate for those of a
lower social class is reported to be between 1.1 to four times higher than those from
higher classes (Drever & Whitehead, 1997; Hopps, & Liu, 2006; Kareholt, 2001;
Logue & Jarjoura, 1990). In terms of health trajectory, significantly higher incidence
of oncological risk (4.3-8 times higher for Oesophageal cancer; Brown et al., 2001),
cardiovascular problems (1.5- 4 times higher; James et al., 1997; Kareholt, 2001),
childhood attention-deficit ‘diagnoses’ (2.23 times more likely; Russell, Ford, &
Russell, 2015), stroke (2-5 times higher; James et al., 1997) and obesity (1.5 – 1.9
times higher; James et al., 1997; HSCIC, 2010) have been reported. They are also at
increased risk of being at receipt of violence, toxins and environmental stress (Hopps
& Liu, 2006; Sapolsky, 2005). It is important to understand the mechanisms by which
social class can lead to adverse outcomes.
The mechanisms involved with poorer health outcomes for lower classed
individuals may relate to lifestyle factors. This includes quality of diet (Barton &
Talbot, 2014; Darmon & Drenowski, 2004), increased likelihood of sedentary
lifestyle (Powell, Slater, & Chaloupka, 2004; Roemmich et al., 2006) and increased
alcohol and tobacco use (Chen, & Patterson, 2006; Kendler et al., 2014). Kipping,
11

Smith, Heron, Hickman & Campbell (2014) report that those of a lower social class
are 1.8 times more likely to experience multiple health related risk factors and
behaviours than higher class equivalents. These determinants interact with each other.
For example, increased social networks, availability of activities and increased
financial security can lead to a decrease in alcohol and tobacco consumption (Cohen,
& Lemay, 2007; Liu, 2011).
Lifestyle alone does not account for poorer health outcomes, those from lower
social class backgrounds have increased difficulty attending and gaining appropriate
medical care compared to those from higher class backgrounds. Lantz et al. (2001),
have outlined that behaviour risk factors (e.g. diet, physical activity, alcohol used)
only statistically account for a small amount of the variance in poor health status.
Those from lower social class backgrounds have increased barriers attending and
gaining appropriate medical care compared to those from higher class backgrounds
(Garland, 2005; USDHHS, 2000, 2003). They are also more likely to receive poorer
quality medical care (Asch et al., 2006); have decreased satisfaction with care
received (USDHHS, 2003). These failings may lead such individuals to have a
reduced perception in their capability to influence their own health, due to poor
health-related experiences (Eriksen & Ursin, 2002). In turn, this can lead to
internalised beliefs that an individual cannot control certain aspects of their life (e.g.
health status) (Poortinga, Dustan & Fone, 2008).
The level of inequality within a population is a determinant of health status
(Pickett & Wilkinson, 2010; Wilkinson, 1996; Wilkinson & Pickett, 2009). Self-
perceptions of lower social class or disadvantage, without objective markers (e.g.
education, income), have all been shown to be related to the adverse health
trajectories described above (Ghaed & Gallo, 2007; Schnittker, & McLeod, 2005).
12

Many individuals are discriminated against based on class (Lott, 2002). Despair
caused by classism and discrimination can lead to substance misuse, mental illness,
antisocial behaviour and in extreme cases homicide (Chen, & Paterson, 2006; Elliot,
2016; Liu, 2011). The ‘lower class’ are made to feel ‘lower class’ and distinguished as
such by others which can create a more hostile environment for them, leading to
higher levels of shame, psychological distress and associated health risks (Coburn,
2015; Sapolsky, 2005; Smail, 2005; Wilkinson, 2000). Therefore, it is not just class
status which leads to diminished health status, but the discrimination received for
being of a lower status. Of equal importance is the identification and reduction of
ways in which the medical profession inadvertently perpetuate such inequality and
bias.
Primum non nocere (First Do No Harm), is the Hippocratic Oath many
medical professionals agree to upon qualification; treat all patients with equal respect.
Similarly, nurses and allied health care professionals (e.g. psychologists, dietitians)
are expected to follow a code of conduct and are monitored in relation to a
professional body (Freckelton, 2006). Many ethical decisions are required in clinical
practice and should be made in terms of patient autonomy, beneficence, non-
maleficence and justice (Beauchamp & Childress, 2013; Gillion, 1994). However,
numerous articles and reports are dedicated to the harm that medicine and healthcare
can do in its attempts to prevent, manage and treat illness (Boyd, 2006; Illich, 1974;
Ogden, 2016). Additionally, many medical and healthcare professionals are met with
difficult decisions around resource allocation (Orme-Smith, & Spicer, 2001). This
can lead to ethical quandaries and debates around utilitarian (Mill, 1962) and
egalitarian (Nozick, 1974) approaches. Regardless, implicit values held by the
13

practitioner in relation to the patients’ deservingness for treatment may impact upon
the care which they provide.
It is unlikely practitioners exert explicit prejudice upon their patients, but may
rather be influenced by implicit biases held by themselves or society in general
(Chapman, Kaatz, & Carnes, 2013; Guilfoyle, Kelly, & Pierre-Hansen, 2008).
Healthcare professionals are often viewed as ‘objective’ and ‘scientific’ due to ‘their
training’ and therefore are not often seen as a vehicle for prejudice. They may appear
‘objective’ when explaining medical reasoning by referring to a patient’s biological
test scores (Griffiths, & Hughes, 1994), ‘gut instinct’ based on training (Hughes, &
Griffiths, 1996), using medico-technical language (Atkinson, 1994) and
depersonalisation techniques (Anspach, 1988) to justify decisions that are based upon
a patient’s lifestyle. These strategies both legitimise this process and can disguise
subtle prejudices. To counteract this, many forms of medical and healthcare training
require reflection on the dynamics of the professional-patient relationship (Burnham,
2005; Surbone, 2005, 2008) and the power and privilege of being in a healthcare role
(Liu, Picket & Ivey, 2007; Peppin, 1994). Emphasis is placed on nonjudgementality,
understanding the role of diversity and becoming aware of personal biases (Ancis &
Landany, 2010; Beagan & Kumas-Tan, 2009; Burnham, 2005; Surbone, 2008).
Nonetheless, professional biases in relation to clients’ sexuality, race and gender have
been seen to impact: willingness to work with a patient (Eubanks-Carter & Goldfried,
2006), attributions of difficulties (Hayes & Erkis, 2000), the treatments recommended
(Prout & Frederickson, 1991), diagnosis (Mikton & Grounds, 2007), prognosis
(Lewis, Croft-Jerreys, & David, 1990) and perceptions of risk and violence (Abreu,
1999). McClellan, White, Kimenez and Fahmy (2012) have directly studied the
practitioner perception in America that ‘socially disadvantaged’ people sue doctors
14
more frequently; although in terms of actual ligation data the opposite appears to be
true (Burnstin, Johnson, Lipsitz, & Brennan, 1993; Mussman, Zawistowich,
Weisman, Malitz, & Morlock, 1991). They found that perceived relationship between
poverty and increased likelihood of malpractice litigation may arise from unconscious
physician bias. In these cases, being discriminated against for being of a lower class
may reduce access to treatment or lead to poor prognosis (in this case due to fear of
litigation), alongside environmental and social factors (e.g. diet, alcohol intake, social
environment) associated with being of a lower-class background (Lantz et al., 2001;
Ladany & Krikorian, 2013; Liu, 2013)
Class prejudice is widespread, subtle and can be difficult to define (Bennett,
2013; Lott, 2002; Liu, 2011). People are actively discriminated against based on class
and this can lead to poor life outcomes (Lott, 2002; Roberts, 2001). Being of a lower
social class is related to certain health risks (adverse environments, poor diet, alcohol
consumption) (Kipping et al., 2014), poorer quality medical care (USDHHS, 2003)
and outcomes (cancer, heart disease, obesity) (Mackenbach et al., 2008). The
mechanism by which social class influences health and mortality outcomes therefore
needs to be understood. Despite the codes of conduct that doctors and allied
healthcare professionals refer to treat patients equally (Burnham, 2005; Freckelton,
2006), subtle biases arising from their perceptions may affect patients’ treatment
(Hughes, & Griffiths, 1996; Mikton & Grounds, 2007). The aim of this literature
review is to critically examine and assimilate the existing evidence for the impact of
practitioners’ class biases on medical and clinical decision making.
15

Methods
Data sources
To operationalise the review’s aim search criteria were developed using terms related
to social class prejudice and medical health care professions. To encompass the wide
range of medical/healthcare professions, the search terms were based on lists of
professions and medical specialities such as NHS Careers
(www.healthcareers.nhs.uk) and General Medical Council (http://www.gmc-uk.org/).
Multiple terms were used to denote class prejudice to encapsulate the subtle ways in
which class is written about within academic discourse (Bennett, 2012), See Table 1
for the Boolean Search terms. To obtain relevant studies, five databases (PsychInfo,
PsychArticles, Psychology and Behavioural Sciences Collection, PubMed and
ProQuest – Including Medline) were searched in April 2016. Titles and abstracts were
searched to maximise the likelihood of finding relevant articles. No date limit was
imposed. Additionally, a hand search of eligible articles and excluded
editorials/reviews was screened for references.
16

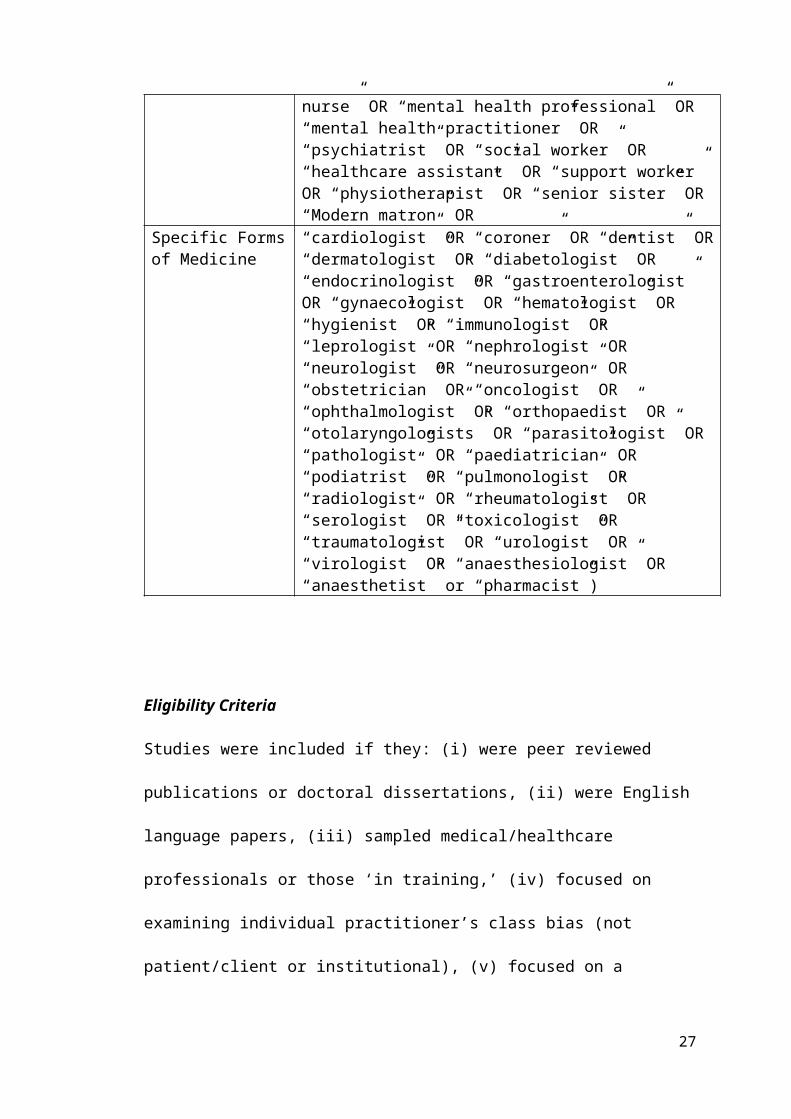
Table 1. – Search Terms used to Obtain Relevant Literature.
Component of Search
Boolean Search AND Terms
Prejudice (“classism” OR “social class prejudice” OR “povertyism” OR “socioeconomic prejudice” OR “class prejudice” OR “class discrimination” OR “socioeconomic discrimination” OR “social class discrimination” OR “class envy” OR “social class envy” OR “social class bias” OR “class bias”
OR ORPrejudice plus Component (“bias” AND “___”)
OR
(“prejudice” AND “___”)
OR
(“preference” AND “___”)
(“social class” OR “socioeconomic” OR “unemploy*” OR “poverty” OR“affluence” OR “wealth*” OR “working class*” OR “lower class*” OR “middle class*” OR “upper class*” OR “proletariat” OR “bourgeois*” OR “homeless”)
AND ANDHealth Care Profession
(“doctor” OR “physician” OR “nurse” OR “occupational therapist” OR “dietician” OR “medical student” OR “surgeon” OR “general practitioner” OR “healthcare professional” OR“clinical Psychologist” OR “psychotherapist” OR “counsellor” OR “counsellor” OR “counselling psychologist” OR “counseling psychologist” OR “psychiatric nurse” OR “mental health nurse” OR “mental health professional” OR “mental health practitioner” OR “psychiatrist” OR “social worker” OR “healthcare assistant” OR “support worker” OR “physiotherapist” OR “senior sister” OR “Modern matron” OR
Specific Forms of Medicine
“cardiologist” OR “coroner” OR “dentist” OR “dermatologist” OR “diabetologist” OR “endocrinologist” OR “gastroenterologist” OR “gynaecologist” OR “hematologist” OR “hygienist” OR “immunologist” OR “leprologist” OR “nephrologist” OR “neurologist” OR “neurosurgeon” OR “obstetrician” OR “oncologist” OR “ophthalmologist” OR “orthopaedist” OR “otolaryngologists” OR “parasitologist” OR “pathologist” OR “paediatrician” OR “podiatrist” OR “pulmonologist” OR “radiologist” OR “rheumatologist” OR “serologist” OR “toxicologist” OR “traumatologist” OR “urologist” OR “virologist” OR “anaesthesiologist” OR “anaesthetist” or “pharmacist”)
17
Eligibility Criteria
Studies were included if they: (i) were peer reviewed publications or doctoral
dissertations, (ii) were English language papers, (iii) sampled medical/healthcare
professionals or those ‘in training,’ (iv) focused on examining individual
practitioner’s class bias (not patient/client or institutional), (v) focused on a
component of medical/clinical reasoning (vi) involved the direct comparison of ‘lower
class’ clients to another class group (vii) used a quantitative methodology. This was as
qualitative studies exploring practitioner bias tend to look at the general processes
involved practitioner bias rather than specifically at the impact of patient class (e.g.
Beagan & Kumas-Tan, 2009; Griffiths & Hughes, 1994; Minick et al., 1998). See
Figure 1 for the article selection process.
Data Extraction
18
Figure 1. Summary of study selection process

Data was first extracted, where reported, to collect demographic and background
information in relation to each study. This included: (i) the location of the study; (ii)
sample size; (iii) number of patient encounters; (iv) percentage of female participants;
(v) profession (sub-profession); (vi) other demographic variables; (vii) illness studied;
(viii) definitions of social class.
Data was secondly extracted to explore the methodology, statistics and
findings of the study, this included (i) design (including methodology); (ii) how
clinical reasoning was operationalised (dependant variable); (iii) how clinical
reasoning was conceptualised (with Cronbach’s α of any measures used if provided);
(iv) results (group means, standard deviations, effect sizes and significance). To allow
for a comprehensive and consistent account of the research, all information was
extracted using the above criteria. In terms of assessing research quality, the findings
were extracted for the purpose of exploring how social class and clinical reasoning
were operationalised. As a result, no formal quality evaluation tool was used to
evaluate the studies to allow for a focus on these specific areas and to provide a wider
scope for critique.
Data Analysis
Due to the heterogeneity across studies used in this review, a narrative synthesis was
conducted. This included differences in definitions of class and methodology..
Homogeneity of results is required to allow for a meta-analysis to be completed
(Borenstein, Hedges, Higgins, & Rothstein, 2009). This is to ensure the coherence of
the findings presented (Borenstein, Hedges, Higgins, & Rothstein, 2009). Therefore,
due to the variety in the studies, a qualitative synthesis was completed. Data was split
and discussed in relation to the area of clinical reasoning studied.
19

The results are presented in terms of the effect sizes, to explore the magnitude
of the effect of class prejudice on clinical reasoning processes; the strength of the
findings that occur within studies (Durlak, 2009; Vacha-Hasse & Thompson, 2004).
Where possible, if papers did not directly provide effect sizes they were calculated in
line with statistical guidelines (Cohen, 1988; Cramer, 1999; Rosenthal, 1994). The
studies reported effects in terms of standardised mean difference (Cohen’s D),
Cramer’s v for nominal data, odds ratios, correlation and regression coefficients
(Cohen, 1988; Cramer, 1999; Durlak, 2009; Haddock, Rindskopf & Shadish, 1998;
Nieminen, Lehtiniemi, Vahakangas, Huusko, & Rautio, 2013). Whilst it has been
argued that converting and presenting standardised effect sizes across studies in
literature reviews allow for direct comparisons for the reader (Thompson, 2006;
Durlak, 2009; Borenstein et al., 2009), this may impact the robustness of the effect
presented and not accurately describe the nature of the effect (Hedges & Olkin, 1985;
Hunter & Schmidt, 2004; Lepper, Henderlong, & Gingras, 1999). Therefore, the
current review presents effect sizes as calculated/reported.
Results
General Overview
The 18 studies that were included in this review were published between 1980 and
2015 and assessed 6973 participants in relation to social class bias and
medical/clinical reasoning. Actual patient data/contacts were reported within five
studies and ranged between 79 and 1972 cases. In terms of location, 16 studies took
place in North America and three in the UK. The main characteristics and results of
these studies are summarised in Table 2.
20
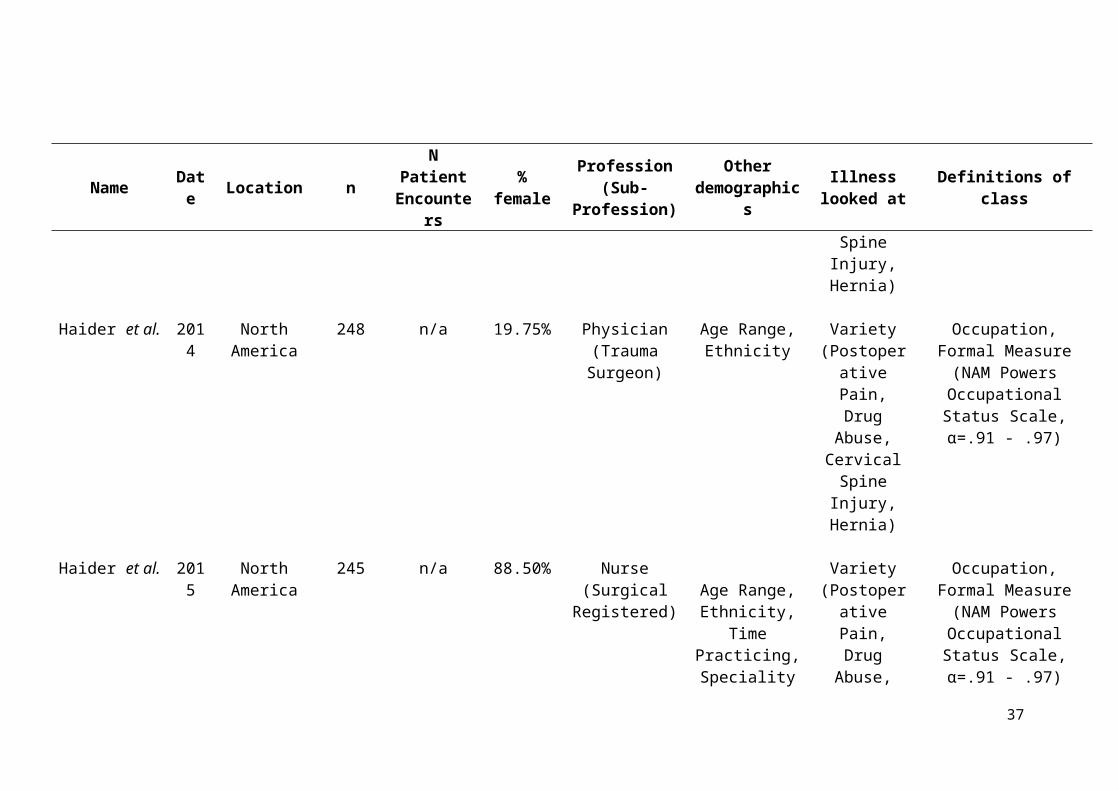
Professional Demographics
Twelve different medical and healthcare professions were represented across the
studies, this included 12 studies focusing on physicians, three on medical students,
two on counsellors, one on nurses and one on psychologists, psychotherapists, trainee
counsellors and social workers. In regards to additional professional demographics,
eight specified the amount of time practicing, seven studies specified the speciality of
the professional, seven the practice location/setting, three included patient
demographic information, two included level of seniority held, one looked at specific
levels of expertise (in relation to the clinical reasoning task area), one number of
patients seen on average in practice, and one included policies/details relating to the
hospital the participant worked at.
In regards to the illness or difficulty which was to be reasoned about, seven
studies contained a variety (with three being non-specific in the illnesses studied), five
specifically looked at five pain, four cardiology, four addiction, four injury, two
oncology, two mental health, and two general health (e.g. unexplained weight-loss,
general health assessment).
Personal Demographics
Studies provided a variety of demographic details to provide information in regards to
generalisability, or to act as predictor variables or covariates. There was an average of
37% female participants across study samples, with three solely male, and four which
did not report genders. Eleven studies provided details about ethnicity of practitioners.
Two studies actively excluded practitioners based on their gender (female) and
ethnicity (minority status). Five studies provided the mean age of practitioners and ten
provided the range of ages involved. One study provided information about the
practitioners’ marital status.
21

Table 2. Main Characteristics of Review Studies
Name Date Location n N Patient
Encounters % femaleProfession
(Sub-Profession)
Other demographics
Illness looked at Definitions of class
Arber, McKinlay,
Adams, Marceau, Link and O'Donnell
2006
North America, United
Kingdom
256 n/a Not Reported
Physician (Family
Practice/GP)
Practice Location (USA or UK), Time
Practising
Cardiology (Coronary
Heart Disease)
Occupation, Appearance
Baig and Heisler
2008
North America
169 n/a 60% Physician Speciality, Time Practicing, Ethnicity
Variety (Periodic Health
Assessment)
Occupation
Boulton, Tuckett, Olson and Williams
1983
United Kingdom
16 405 Not Reported
Physician (Family
Practice/GP)
Patient Demographics (Social Class,
Ethnicity, Age, Gender,
Education)
Variety (Nonspecific)
Occupation, Formal Measure (Hope-
Goldthorpe Classification of
Occupations, α=.60-.73)
Dougall and Schwartz
2011
North America
141 n/a 59% Counsellor, Trainee
Counsellor
Mean Age, Age Range,
Ethnicity, Household
Income, Social Class, Time
Mental Health Difficulties
(Ambiguous)
Education, Occupation, Income, Lifestyle
Name Date Location n N Patient
Encounters % femaleProfession
(Sub-Profession)
Other demographics
Illness looked at Definitions of class
Practising, Speciality
Haider et al. 2011
North America
202 n/a 52% Medical Students
Age Range, Ethnicity, Time
Practising
Variety (Postoperative
Pain, Drug Abuse,
Cervical Spine Injury,
Hernia)
Occupation, Formal Measure (NAM Powers
Occupational Status Scale, α=.91 - .97)
Haider et al. 2014
North America
248 n/a 19.75% Physician (Trauma Surgeon)
Age Range, Ethnicity
Variety (Postoperative
Pain, Drug Abuse,
Cervical Spine Injury,
Hernia)
Occupation, Formal Measure (NAM Powers
Occupational Status Scale, α=.91 - .97)
Haider et al. 2015
North America
245 n/a 88.50% Nurse (Surgical Registered) Age Range,
Ethnicity, Time Practicing, Speciality
Variety(Postoperative
Pain, Drug Abuse,
Broken Wrist, Consent)
Occupation, Formal Measure (NAM Powers
Occupational Status Scale, α=.91 - .97)
Haider et al. 201 North 230 n/a 37.40% Physicians Age Range, Variety Occupation, Formal
23

Name Date Location n N Patient
Encounters % femaleProfession
(Sub-Profession)
Other demographics
Illness looked at Definitions of class
5 America (Acute Care Surgeon)
Ethnicity, Level of Seniority, Speciality.
(Postoperative Pain, Drug
Abuse, Cervical
Spine Injury, Hernia)
Measure (NAM Powers Occupational Status Scale, α=.91 - .97)
Kerr 2014
North America
Not Provided
98 48% Physician Age Range, Ethnicity, Practice Location
Significant weight loss
Income, Environment/Housing,
Appearance, Use of Language
MacCormick and Mackinnon
1990
North America
58 n/a Not Reported
Medical Students
Control Group Demographic (Occupation)
Oncology (Oesophageal
cancer, metastatic
cancer)
Occupation, Education
Martin, Russell,
Goodwin, Chapman, North and Sheridan
1991
United Kingdom
4 1972 0% Physician (Family
Practice/GP)
Practice Location, Patient Contacts, Patient Demographics
(Gender, Ethnicity, Age,
Occupation, Self-rated Social
Class).
Variety (Nonspecific)
Occupation, Formal Measure (Hope-
Goldthorpe Classification of
Occupations, α=.60-.73)
Mckinlay et al. 1997 North 128 n/a 0% Physician Type of Practice, Oncology Medical Insurance Status,
24
Name Date Location n N Patient
Encounters % femaleProfession
(Sub-Profession)
Other demographics
Illness looked at Definitions of class
America Time Practicing, Speciality
(Breast Cancer) Appearance, Use of Language
McKinlay, Potter, and Feldman
1996 North America
192 n/a 0% Physician Type of Practice (Office, Hospital,
HMO), Time Practicing, Speciality
Cardiology (Chest Pain
and Dyspnea)
Medical Insurance status, Occupation, Use of
Language
Nampiaparampil,
Nampiaparampil, and Harden
2009 North America
90 n/a 26.70% Physician Age Range,Ethnicity, Level
of Seniority, Marital Status,
Level of Experience (Pain
Management), Time Practising,
Speciality
Chronic Back Pain
Medical Insurance Status
Pendelton and Bochner
1980 United Kingdom
6 79 Not Reported
Physician (Family Practice/GP)
Social Class (Occupation)
Variety (Nonspecific)
Occupation, Formal Measure (Hope-
Goldthorpe Classification of Occupations, α=.60-.73)
Thompson, Diestelmann,
Cole, Keller, and Minami
2014 North America
192 n/a 69.79% Psychologist, Psychotherapist, Social Worker,
Counsellor
Mean Age, Age Range, Ethnicity,
Sexual Orientation,
Disability, Social Class, Educational
Mental Health Difficulties
(Panic)
Income, Occupation, Lifestyle
25

Name Date Location n N Patient
Encounters % femaleProfession
(Sub-Profession)
Other demographics
Illness looked at Definitions of class
Level, Speciality, Practice Type.
van Ryn and Burke
2000 North America
193 618 7.00% Physicians (cardiologists,
cardiac surgeon, other)
Mean Age, Age Range, Ethnicity, Speciality, Patient
demographics (Ethnicity, Cell Sizes, Objective Suitability for Intervention,
Income, Education Level,
Level of Depression, Social
Assertiveness, Self-Efficacy).
Cardiology (Coronary
Heart Disease)
Income, Education
Williams et al. 2015 North America
4603 n/a 50.40% Medical Students Mean Age, Ethnicity, Social Class (Family of Origin), Speciality Plans. Demographic details of training centre (e.g. location, school ownership).
Cardiology (Cardiac Events)
Occupation, Formal Measure (Four Factor Index of Social Status,
α=.84-.85)
26
In relation to the social class of practitioners only four studies directly reported
this demographic information. In these four cases one described this as ‘class of
family of origin’, one was based upon occupation, and two were unspecified.
Relatedly, one provided information of educational level of practitioners, and one
collected household income.
Class Definitions
The studies applied a variety of methods to define social class for the actual or
hypothetical patients used within their methodologies. Nine studies used a
combination of factors (more than one) to represent social class. Occupation was the
main way in which class was constructed with fourteen studies using this factor (eight
of which used ‘formal measures’ of occupation based class). Four used income, three
educational attainment, two used lifestyle (hobbies, interests, social interactions),
three used medical insurance status (potentially as a proxy for income), three others
used appearance cues (e.g. clothing, grooming), one used environmental/housing
factors (e.g. social housing) and one on use of language (accent, syntax, grammar,
colloquialisms). None of the studies aggregated these areas, instead they were
presented as separate class variables.
Of the fourteen studies who used occupation to define social class, eight used
specific measures to denote the social class of patients, four studies used the NAM
Powers Occupational Status Scale (Nam & Boyd, 2004) which ranks vocations on a
scale from 1-100 (α=.91 - .97; Miller, 19991). Three used the Hope-Goldthorpe
Classification of Occupations (Goldthorpe & Llewellyn, 1977), which ranks
participants into one of seven social class categories: I and II (service class), III, IV
and V (intermediate Class) and VI, VII (working class), based on occupation.

(α=.60-.73; Evans, 1992). One used occupations from the Four Factor Index of Social
Status (α=.84-.85; Hollingshead, 1975/2011).
Design/Methodology
The studies have been split into two categories dependent on their method, 14 of
which used an experimental methodology using vignettes where the class of a
hypothetical patient was manipulated, and four studies were based upon naturalistic
design using actual patients or hospital data.
Methodology Details of Studies Based on Vignette Manipulation
Of the fourteen vignette studies, twelve were based on written material, four were
based on videos, three were a combination (e.g. video alongside written medical
reports), and one was acted live (where General Practitioners interacted with an actor
whose responses varied upon condition). Seven studies presented participants with
only one social class manipulated vignette, two studies presented two vignettes, four
studies presented four and one study presented eight. Most of the studies (seven) only
included two conditions (upper/lower class in their vignettes), one study presented
three conditions, two studies presented four, two studies presented twelve and two
other studies presented sixteen conditions. For those which contained more than two
manipulations, six varied the patients’ race, three their gender, two their age and
medical comorbidities, physical mobility, assertiveness of the patient and level of
depression were each respectively altered once.
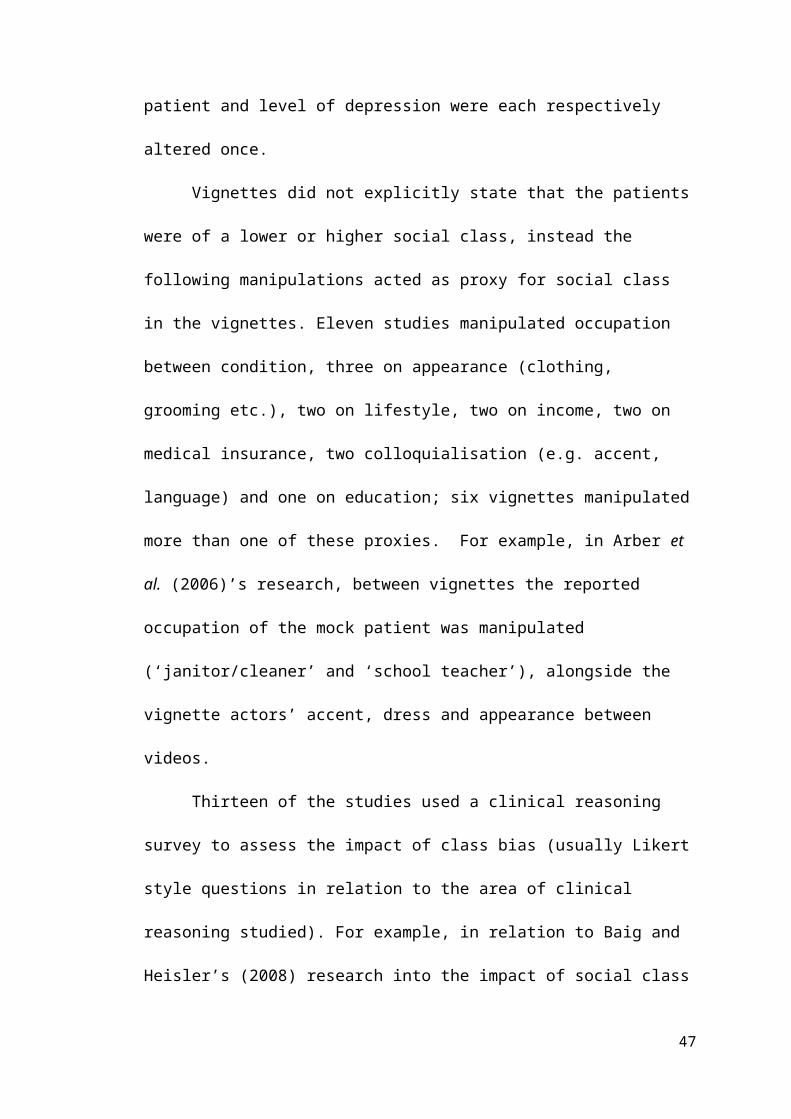
Vignettes did not explicitly state that the patients were of a lower or higher
social class, instead the following manipulations acted as proxy for social class in the
vignettes. Eleven studies manipulated occupation between condition, three on
appearance (clothing, grooming etc.), two on lifestyle, two on income, two on medical
insurance, two colloquialisation (e.g. accent, language) and one on education; six
28

vignettes manipulated more than one of these proxies. For example, in Arber et al.
(2006)’s research, between vignettes the reported occupation of the mock patient was
manipulated (‘janitor/cleaner’ and ‘school teacher’), alongside the vignette actors’
accent, dress and appearance between videos.
Thirteen of the studies used a clinical reasoning survey to assess the impact of
class bias (usually Likert style questions in relation to the area of clinical reasoning
studied). For example, in relation to Baig and Heisler’s (2008) research into the
impact of social class biases on preventative screening in physicians, after being
presented with a clinical vignette manipulated as either ‘upper’ or ‘lower class’,
participants were asked “How important are the following routine screens in this
patient.” Areas such as ‘sexual behaviour,’ ‘physical activity,’ ‘depression,’ and ‘diet’
were listed and these were rated from 1-5 (very important – not important). Only two
studies reported using previously validated scales of clinical reasoning (Dougal &
Schwartz, 2011; Thompson et al., 2014); both of which were exploring social class
biases within psychotherapists: the Clinical Attribution Scale (Chen et al., 1997)
(α=.87), Professional Contact Questionnaire, (Hayes & Erkis, 2000) (α=.86), Impact
Message Inventory-Circumplex (Kiesler & Schmidt, 2006) (α=.72-.78), Therapist
Personal Reaction Questionnaire (Tyron, 1989) (α=.8), (Karuza, Zevon, Gleason,
Karuza & Nash, 1999) (Cause α=.81, Solution=.79), and the Global Assessment of
Functioning (APA, 1994). Finally, Kerr (2014) used live actors in recorded sessions
with the practitioner participants, and then used a roter analysis process to extract and
code data/timings from the recorded sessions.
Methodology Details of Studies Based on Naturalistic Design.
Of the four studies that employed a naturalistic design (collecting data from
practitioners based on genuine patient data), two used a survey questionnaire (Martin
29

et al.,1991, van Ryn & Burke, 2000) and two video recorded consultation sessions
with patients which were then coded (Boulton et al., 1983; Pendelton and Bochner,
1980). One study additionally collected patient opinions (Martin et al., 1991). Like
the vignettes these studies collated information in relation to the impact social class
biases have on clinical reasoning, by either behaviour in consultation sessions, or
exploring perceptions related to ‘upper’ and ‘lower’ class patients.
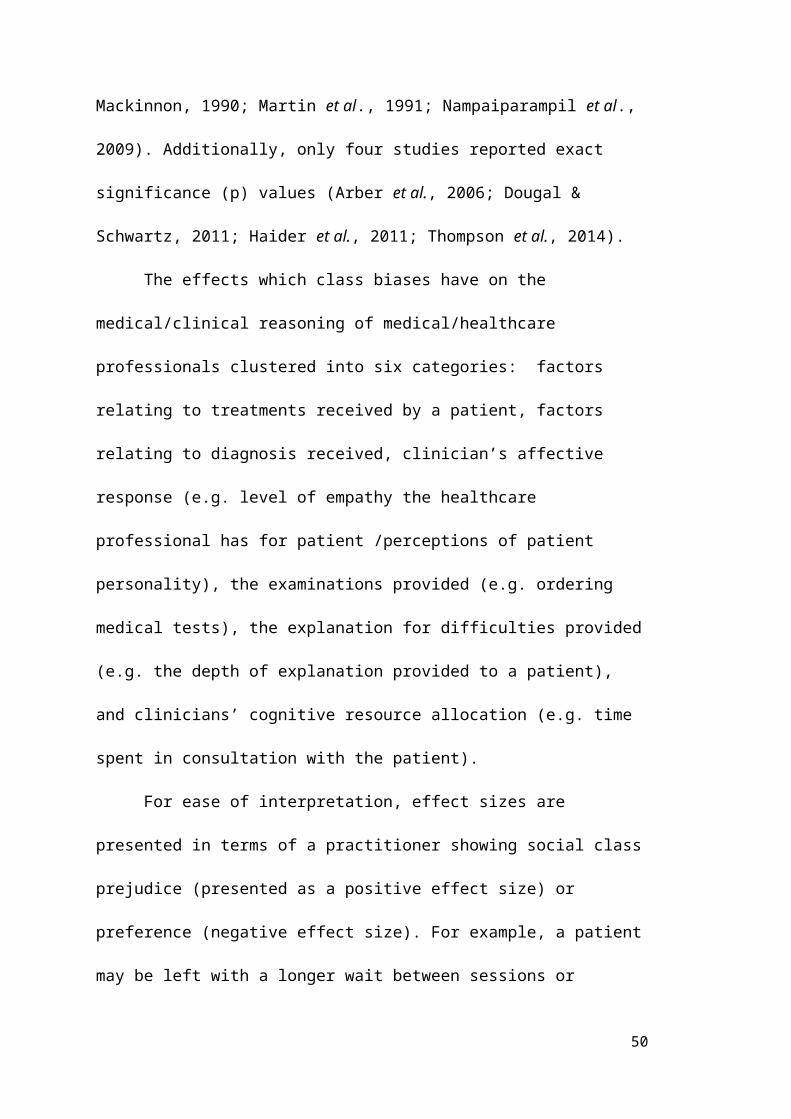
Findings and Effect Sizes
The main effects reported indicate differences in judgements of medical/healthcare
professionals by social class of their patients. It was not possible to derive effect sizes
from four studies due to lack of information presented in text (Arber et al., 2006;
MacCormick & Mackinnon, 1990; Martin et al., 1991; Nampaiparampil et al., 2009).
Additionally, only four studies reported exact significance (p) values (Arber et al.,
2006; Dougal & Schwartz, 2011; Haider et al., 2011; Thompson et al., 2014).
The effects which class biases have on the medical/clinical reasoning of
medical/healthcare professionals clustered into six categories: factors relating to
treatments received by a patient, factors relating to diagnosis received, clinician’s
affective response (e.g. level of empathy the healthcare professional has for patient
/perceptions of patient personality), the examinations provided (e.g. ordering medical
tests), the explanation for difficulties provided (e.g. the depth of explanation provided
to a patient), and clinicians’ cognitive resource allocation (e.g. time spent in
consultation with the patient).
For ease of interpretation, effect sizes are presented in terms of a practitioner
showing social class prejudice (presented as a positive effect size) or preference
(negative effect size). For example, a patient may be left with a longer wait between
sessions or perceived as less likely to listen to medical advice. However, in clinical
30

practice, the impact of certain ‘biases’ is more complex and it is less obvious what
would indicate prejudice or preference towards the lower-class patient. For example,
in some circumstances it may be more beneficial for a clinician to perceive their
patient as dominant, and in other situations less so. In terms of a bias for providing a
diagnosis this might be useful for some (e.g. recognising cancer) but not others (e.g.
receiving a socially stigmatised mental health diagnosis). Therefore, the reader should
bear in mind the difficulty in making ‘value judgements’ about what constitutes
prejudice and preference and make their own judgements based on the descriptive
statistics presented.
Effect of Social Class Bias on Treatment Received
Ten studies explored the effect social class bias has on treatment provided to a patient.
This included the amount/type of medication prescribed, referrals to specialist
treatment, or whether the patient would be provided with treatment (e.g. Arber et al.,
2006; Haider et al., 2014; Williams et al., 2015). Table 3 shows that most effect sizes
are in the direction indicating less treatment and therefore negative impact for lower
class patients. Where presented, the effect sizes varied from negligible to large. Four
comparisons reached statistical significance, two of which were in relation to
treatment of cardiac patients, one that related to chronic pain and one related to
oncology, all in the direction of less treatment provided for lower class patients.
Overall there was no clear pattern of results in relation to how each of the studies
defined class. In relation to differences between professions, acute care surgeons were
more likely to refer a ‘lower class’ patient with cervical spine injury to a specialist
and provide aftercare for a patient with substance related difficulties (Haider et al.,
2015b). In contrast, surgical nurses were less likely to provide aftercare for the same
patient misusing substances when lower class. However, they showed preference in
31

Table 3. The Effect of Social Class Bias on Treatment Received
Treatment Clinical Reasoning Method
Lower Class Mean
(SD)/ %
Middle Class Mean
(SD)/ %
Upper Class Mean (SD)/ %
Effect Size Used Effect Size p
Arber, McKinlay, Adams, Marceau, Link and O'Donnell (2006)
Video Vignette
Physician likelihood of prescribing appropriate Coronary medication
59.0% 57.0% na na .803
Physician likelihood of referring to Cardiologist or Specialist Facility
19.0% 23.0% na na .386
Physician likelihood of referring patient to a non-cardiac specialist
17.0% 19.0% na na .732
Haider et al. (2014) Text VignetteAmount of pain medication Trauma Surgeon would
provide to a patient with postoperative pain.na na β 1.02 (0.72 -
1.39)ns
Trauma Surgeon perceptions if a patient who may be misusing substances requires aftercare
na na β 0.89 (0.63-1.26)
ns
Likelihood Trauma Surgeon would refer patient with cervical spine injury on to specialist
na na β 0.65 (0.4-1.06) ns
Likelihood Trauma Surgeon would provide a patient with a hernia belt
na na β 1.19 (0.74-1.91)
Ns
Treatment Clinical Reasoning Method Lower Middle Upper Class Effect Size Effect Size p
Treatment Clinical Reasoning Method
Lower Class Mean
(SD)/ %
Middle Class Mean
(SD)/ %
Upper Class Mean (SD)/ %
Effect Size Used Effect Size p
Class Mean
(SD)/ %
Class Mean
(SD)/ %Mean (SD)/ % Used
Haider et al. (2015a) Text VignetteAmount of pain medication Surgical Nurse would
provide to a patient with postoperative pain.na na β - 0.32 (-0.79-
0.16)ns
Surgical Nurses perceptions of a patient who may be misusing substances requires aftercare
na na β 0.02 (-0.46-0.50)
ns
Likelihood Surgical Nurse would refer a patient with a wrist injury to social services
na na β - 0.17 (-0.62-0.28)
ns
Haider et al. (2015b) Text VignetteAmount of pain medication Acute Care Surgeon
would provide to a patient with postoperative pain.na na β 0.41 (-0.10-
0.92)ns
Acute Care Surgeons perceptions of a patient who may be misusing substances requires aftercare
na na β - 0.27 (-0.80-0.26)
ns
Likelihood Acute Care Surgeon would refer patient with Cervical Spine injury on to specialist
na na β -0.42 (-0.91-0.08)
ns
Likelihood Acute Care Surgeon would provide a patient with a hernia belt
na na β 0.12 (-0.35-0.60)
ns
MacCormick and Mackinnon (1990) Text VignetteLikelihood Medical Students would offer Cancer
Treatment to Patient17.0% 73.0% na na .001***
33

Treatment Clinical Reasoning Method
Lower Class Mean
(SD)/ %
Middle Class Mean
(SD)/ %
Upper Class Mean (SD)/ %
Effect Size Used Effect Size p
Treatment Clinical Reasoning Method
Lower Class Mean
(SD)/ %
Middle Class Mean
(SD)/ %
Upper Class Mean (SD)/ %
Effect Size Used Effect Size p
Mckinlay et al. (1997)Text/Video
VignetteLikelihood Physician would request Auxiliary Node
Dissection for Oncology Patientna na OR 1.40 (0.6 - 3.0) ns
Likelihood Physician would request Metastatic Evaluation for an Oncology Patient
na na OR 0.8 (0.3-1.8) ns
Likelihood Physician would request Adjuvant Therapy for an Oncology Patient
53.0% 73.0% OR 2.5 (1.3 - 5.0) ns
Likelihood Physician would request Chemotherapy for an Oncology Patient
na na OR 1.8 (0.7-4.5) ns
Likelihood Physician would request Tamoxifen for an Oncology Patient
na na OR 1.5 (0.7-3.1) ns
Likelihood Physician would request Reconstructive Surgery Following Mastectomy for an Oncology
Patient
na na OR 1 (0.4 - 2.6) ns
34

Treatment Clinical Reasoning Method
Lower Class Mean
(SD)/ %
Middle Class Mean
(SD)/ %
Upper Class Mean (SD)/ %
Effect Size Used Effect Size p
Nampiaparampil, Nampiaparampil, and Harden (2009)
Text Vignette
Overall rate Physician would prescribe treatment to a patient with chronic back pain
na na na na ns
Physician's likelihood of providing referral for Nerve Block to a patient with chronic back pain
na na na na .040*
Physician's likelihood of prescribing opioid medication for a patient with chronic back pain
na na na na .053
Physician likelihood of prescribing all other interventions for a patient with chronic back pain.
na na na na ns
Thompson et al. (2014) Text VignettePsychotherapeutic/Psychological Professionals
perceived solutions for a client with mental difficulties
14.2 (3.0) 13.4 (2.8) Cohens D -0.25 .120
35

Treatment Clinical Reasoning Method
Lower Class Mean
(SD)/ %
Middle Class Mean
(SD)/ %
Upper Class Mean (SD)/ %
Effect Size Used Effect Size p
Van Ryn and Burke (2000)Naturalistic Study
Cardiologist perceived likelihood a patient would participate in cardiac rehabilitation
30.0% 40.0% 48.0% OR 1.49/1.85 .1/.01**
Williams et al. (2005) - Text VignetteMedical Students likelihood of offering a cardiac
patient procedural treatment39.9% 41.4% 47.0% Cramers V 0.05 .001***
Note. Dependent Variables are presented were from likert scales (higher value indicating a higher levels of the variable) unless otherwise specified. ‘na’ denotes that the information was not available from the publication. ‘ns’ denotes that the result was nonsignificant but the paper did not report the exact p values. * denotes significance p<.05, ** denotes significance p<.01 *** denotes significance p<.001.
36
relation to referring a patient with a wrist injury for social service support (Haider et
al., 2015a).
Effect of Social Class Bias on Diagnostic Reasoning
Nine studies explored the effect of social class bias on practitioners’ diagnostic
reasoning. This included the type of diagnosis assigned, certainty of diagnosis,
perceived cause of difficulties, and severity of condition (e.g. Mckinlay et al., 1996;
Haider et al., 2015; Thompson et al., 2014). Table 4 shows that effect sizes were
predominantly in the direction of lower class patients being less likely to receive a
diagnosis or that their difficulties would be perceived as less severe. Where effect
sizes were presented, they ranged from small to medium size. Significant differences
were seen in three comparisons, in relation to diagnosis and perceived severity in
patients relating to mental health (Dougall & Scwartz, 2011), cardiology (Mckinlay et
al., 1996) and oncology (Mckinlay et al., 1997). However, other studies examining
similar comparison did not find significant differences, even though the type of
professionals (psychotherapists and physicians respectively) remained the same
(Arber et al., 2006; Thompson et al., 2014). Like treatment reasoning, there was no
clear pattern of results in relation to how each study defined class.
Effects of Social Class bias on Clinicians’ Affective Response to Patients
Eight studies explored the affective response practitioners have in relation to their
patient. This included their perceptions of the patient, their perceived likeability,
dominance, level of empathy, ability to build rapport, or desire to meet their
expectations (e.g. Dougal & Schwartz, 2011; Haider et al., 2011; Kerr, 2014). Table 5
shows that effect sizes were predominantly in the direction of the clinician being less
willing to work with a lower-class patient or the clinician displaying less empathy
towards the patient. Where reported, effect sizes presented ranged from small – large.

Table 4: Effect of Social Class Bias on Diagnostic Reasoning
Diagnostic Clinical Reasoning Method
Lower ClassMean
(SD)/%
Upper ClassMean
(SD)/ %
Effect Size Used Effect Size p
Arber, McKinlay, Adams, Marceau, Link and O'Donnell (2006)
Video Vignette
Percentage of Physicians mentioning coronary heart disease (CHD) as a possible diagnosis
89.0% 95.0% na na .129
Physician certainty of a CHD diagnosis 49.0% 55.0% na na .108
No of cardiac diagnostic tests ordered by physician 5.00 4.80 na na .634
Percentage of Physicians ordering tests for CHD diagnosis 84.0% 86.0% na na .613
Number of tests Physicians ordered for CHD diagnosis 2.50 2.60 na na .777
Dougall and Schwartz (2011) Text/Video VignetteCounsellors; perceived severity of client's mental health
difficulties5.5
(1.3)4.9
(1.5)Cohens D 0.433 .050*
Haider et al. (2011) Text VignetteMedical Students' clinical assessment of patient's pain
levelna na OR 0.34 (-0.13-0.71) .420
Diagnostic Clinical Reasoning Method Lower Upper Effect Effect Size p

Diagnostic Clinical Reasoning Method
Lower ClassMean
(SD)/%
Upper ClassMean
(SD)/ %
Effect Size Used Effect Size p
ClassMean
(SD)/%
ClassMean
(SD)/ %Size Used
Haider et al. (2014) Text VignetteTrauma Surgeon perceived urgency of post-operative
patients' need for pain medicationna na β 1.26 (0.91-1.75) ns
Trauma Surgeon perceived likelihood of patient having a cervical spine injury
na na β 0.73 (0.33-1.20) ns
Trauma Surgeon perception of patient's surgical risk na na β 0.74 (0.45-1.20) ns
Haider et al. (2015a) Text VignetteSurgery Nurses' perceived urgency of post-operative
patients' need for pain medicationna na β 0.32 (-0.14-0.79) ns
Haider et al. (2015b) Text VignetteAcute Care Surgeon perceived urgency of post-operative
patients' need for pain medicationna na β 0.16 (-0.33-0.65) ns
Acute Care Surgeon's perceived likelihood of patient having a cervical spine injury
na na β - 0.22 (-0.72-0.28) ns
Acute Care Surgeon perceptions of a patient's surgical risk na na β - 0.34 (-0.83- 0.14) ns
39

Diagnostic Clinical Reasoning Method
Lower ClassMean
(SD)/%
Upper ClassMean
(SD)/ %
Effect Size Used Effect Size p
Diagnostic Clinical Reasoning Method
Lower Class
Mean (SD)/%
Upper ClassMean
(SD)/ %
Effect Size Used Effect Size p
McKinlay, Potter, and Feldman (1996) Text/Video VignettePhysicians’ assignation of cardiac diagnosis (Patient age
30)~5.0% ~6.0% OR 0.81 (0.22-3.01) ns
Physicians’ assignation of cardiac diagnosis (Patient age 62)
~50.0% ~75.0% OR 4.10 (1.53-10.98) .050*
Mckinlay et al. (1997) Text/Video VignettePhysicians’ certainty of breast cancer diagnosis 42.0% 26.0% OR 2.10 (0.5-2.4) .100
Physicians’ perceived likelihood that cancer is a primary diagnosis for patient
68.0% 75.0% na na .050*
Thompson, Diestelmann, Cole, Keller, and Minami (2014)
Text Vignette
Psychologist/Psychotherapist attribution of client’s difficulties
11.8 (4.2)
12.3(3.7)
Cohens D 0.12 .270
Psychologist/Psychotherapists perception of client’s level 63.0 61.8 (7.1) Cohens D -0.16 .340
40

of functioning (8.3)Note. Dependent Variables are presented were from likert scales (higher value indicating a higher levels of the variable) unless otherwise specified. ‘na’ denotes that the information was not available from the publication. ‘ns’ denotes that the result was nonsignificant but the paper did not report the exact p values. * denotes significance p<.05, ** denotes significance p<.01 *** denotes significance p<.001.
Table 5: Effects of Social Class bias on Clinicians’ Affective Response to Patients
Affective Clinical Reasoning Method Lower ClassMean (SD)/%
Middle Class Mean
(SD)/%
Upper ClassMean (SD)/ %
Effect Size Used Effect Size p
Dougall and Schwartz (2011) Text/Video Vignette
Counsellor attribution of responsibility for patient’s difficulty
Na Na Cohens D 0 0.810
Counsellor countertransference response to client
Na Na Cohens D 0.7031 0.003 **
Counsellor perceptions of client’s level of dominance
8.6 (2.7) 9.9 (2.7) Cohens D -0.52 0.002 **
Haider et al. (2011) Text Vignette
Medical Student perceived appropriateness of gaining informed
consent from patient
Na Na OR 0.49 (0.03-3.24) 0.280
Medical Student perceived reliability rating of patient and family
Na Na OR 0.63(0.28-1.41) 0.580
Medical Student trust of the accuracy of patient history/symptom reporting
Na na OR 0.69 (0.27-1.76) 0.570
Haider et al. (2014) Text Vignette
Trauma Surgeon perceptions of the extent postoperative patient is
exaggerating pain
Na na β 1.1 (0.72-1.38) ns
Trauma Surgeon perception on clients use of opiod pain medication
Na na β 1.00 (0.72-1.39) ns
Trauma Surgeon perception of client Na na β 1.24 (0.9-1.72) ns
41

Affective Clinical Reasoning Method Lower ClassMean (SD)/%
Middle Class Mean
(SD)/%
Upper ClassMean (SD)/ %
Effect Size Used Effect Size p
abusing pain medicationTrauma Surgeon perceptions of patient’s
liklihood to comply with Hernia Beltna na β 0.84 (0.52-1.35) ns
Affective ReasoningMethod Lower Class
Mean (SD)/%
Middle Class Mean
(SD)/%
Upper ClassMean (SD)/ %
Effect Size Used Effect Size p
Haider et al. (2015a) Text Vignette
Surgical Nurse perceptions of the extent postoperative patient is exaggerating
pain
Na na β - 0.09 (-0.55 to 0.37) ns
Surgical Nurses perception on clients use of opioid pain medication
Na na β -0.07 (-0.52-0.37) ns
Surgical Nurses perceptions of client is abusing pain medication
Na na β 0.32 (-0.13-0.76) ns
Surgical Nurses rating of family relationship of patient with a wrist injury
Na na β - 0.08 (-0.54-0.37) ns
Surgical Nurse suspicions of abusive relationship between family and patient
with wrist injury
Na na β - 0.02 (-0.48-0.43) ns
Surgical Nurses’ perception if further action is required in a patient's consent
process
Na na β 0.53 (0.01-1.05) .05*
Haider et al. (2015b) Text Vignette
Acute Care Surgeon perceptions of the extent postoperative patient is
exaggerating pain
Na na β -0.03 (-0.52-0.45) ns
Acute Care Surgeon perception on Na na β 0.09 (-0.4-0.59) ns
42

Affective Clinical Reasoning Method Lower ClassMean (SD)/%
Middle Class Mean
(SD)/%
Upper ClassMean (SD)/ %
Effect Size Used Effect Size p
clients use of opioid pain medicationAcute Care Surgeons perceptions if
client is abusing pain medicationNa na β 0.14 (-0.36-0.63) ns
Acute Care Surgeon perceptions of patient’s likelihood to comply with
Hernia Belt
na na β - 0.21 (-0.68-0.27) ns
Affective ReasoningMethod Lower Class
Mean (SD)/%
Middle Class Mean
(SD)/%
Upper ClassMean (SD)/ %
Effect Size Used Effect Size p
Kerr (2014) Live Acted Vignette
Physician level of person centred communication with patient
0.8 (0.05) 0.8 (.04) Cohens D -0.18 ns
Physician level of person centred Communication with patient whose
social class was revealed
0.9 (.06) 0.7 (.04) Cohens D -2.17 ns
Physician level of person centred communication with patient whose social
class was not revealed
0.8 (.05) 0.9 (.1) Cohens D 1.54 ns
Physician level of rapport building 54.7 (5.3) 67.3(5.2) Cohens D 1.95 ns
Physician level of rapport building with patient whose social class was revealed
57.7 (7.2) 62.5 (4.5) Cohens D 0.61 ns
Physician level of rapport building with patient whose social class was not
revealed
58.7 (7.3) 58.7 (5.4) Cohens D 0.00 ns
Physician provided engagement 1.4 (0.04) 1.6 (.04) Cohens D 4.01 ns
Physician provided engagement when 35.6 (4.6) 41.9 (2.9) Cohens D 1.26 ns
43

Affective Clinical Reasoning Method Lower ClassMean (SD)/%
Middle Class Mean
(SD)/%
Upper ClassMean (SD)/ %
Effect Size Used Effect Size p
patient social class was revealedPhysician provided engagement when
patient social class was not revealed1.5 (0.05) 1.6 (.04) Cohens D 2.72 ns
Physicians level of verbal dominance 1.6 (0.1) 1.5 (0.1) Cohens D -0.86 ns
Physicians level of verbal dominance when patient social class was revealed
1.3 (0.1) 1.6 (0.1) Cohens D 2.16 ns
Physicians level of verbal dominance when patient social class was not
revealed
1.3 (0.1) 1.6 (.08) Cohens D 2.24 .05*
Physicians level of positive affect 11.4 (0.3) 12.3 (0.3) Cohens D 2.69 ns
Physicians level of positive affect when patient social class was revealed
12.1 (0.4) 11.9 (0.2) Cohens D -0.52 ns
Affective ReasoningMethod Lower Class
Mean (SD)/%
Middle Class Mean
(SD)/%
Upper ClassMean (SD)/ %
Effect Size Used Effect Size
p
Kerr (2014) continued.
Physicians level of positive affect when patient social class was not revealed
12.1 (0.4) 12.1 (0.3) Cohens D 0.14 ns
Physicians level of emotional rapport building
14.2 (2.0) 21.0 (2.0) Cohens D 2.79 ns
Physicians level of emotional rapport Building when patient social class was
revealed
14.7 (2.7) 18.8 (1.7) Cohens D 1.40 ns
Physicians level of emotional rapport Building when patient social class was
not revealed
14.7 (2.8) 21.1 (2.1) Cohens D 2.04 ns
Thompson, Diestelmann, Cole, Keller, and Minami (2014)
Text Vignette Design
Psychologist/Psychotherapist attraction 12.2 (7.1) 12.6 (8.0) Cohens D 0.06 .710
44

Affective Clinical Reasoning Method Lower ClassMean (SD)/%
Middle Class Mean
(SD)/%
Upper ClassMean (SD)/ %
Effect Size Used Effect Size p
to working with a client with mental health difficulties
Psychologist/Psychotherapist willingness to work with a client with mental health
difficulties
9.9 (2.1) 9.6 (2.1) Cohens D 0.11 .480
van Ryn and Burke (2000) Naturalistic Study
Physicians’ perception of a cardiac patient as 'very' independent
32.0% 45.0% 48.0% OR 1.76/1.94 .050*/.010**
Physicians' Perception of a cardiac patient as 'very' responsible
19.0% 28.0% 30.0% OR 1.73/1.73 .050*/.050*
Physician's perception of a cardiac patient as very 'rational'
27.0% 41.0% 37.0% OR 1.78/1.48 .010**/ns
Physicians’ perception of a cardiac patient as 'very' intelligent
10.0% 18.0% 27.0% OR 2.03/2.79 .050*/.010**
Affective Reasoning Method Lower ClassMean (SD)/%
Middle Class Mean(SD)/%
Upper ClassMean (SD)/ % Effect Size Used Effect Size p
Physicians’ perceived likelihood of a cardiac patient having to care for others
11.0% 17.0% 22.0% na na na
Physicians’ perceived likelihood of cardiac patient desiring a physical
lifestyle
9.0% 17.0% 29.0% na na na
Note. Dependent Variables are presented from likert scales (higher value indicating a higher levels of the variable) unless otherwise specified. ‘na’ denotes that the information was not available from the publication. ‘ns’ denotes that the result was nonsignificant but the paper did not report the exact p values. * denotes significance p<.05, ** denotes significance p<.01 *** denotes significance p<.001.
45

Whilst there were many studies with large effect sizes (Cohens D>0.8) most were not
significant. It is important to note this may be due to a lack of power due to sample
size (e.g. n=98; Kerr, 2014). Eight comparisons were statistically significant. Four
were in regards to higher-class cardiology patients being perceived as more
independent, responsible, rational and intelligent by physicians (van Ryn & Burke,
2000). Alongside this it was found that surgical nurses think lower class clients
required more support in surgery consent processes (Haider et al., 2015a), and that
counsellors have stronger positive countertransference reactions to higher class
patients (Dougall & Schwartz, 2011). Kerr (2014) found that physicians were
significantly more dominant in relation to a patient with unexplained weight loss
when the patient was upper class. However, Dougall and Schwartz (2011) found a
significant difference indicating that upper class patients were more verbally
dominant towards counsellors in mental health setting. Again, no clear patterns were
seen in the results in relation to patient diagnosis, physician type or how social class
was measured. However, it is notable that larger effect sizes were seen overall in
comparison to other areas of clinical reasoning.
Effects of Social Class bias on Clinician Examination
Eight studies explored the effect of social class biases on examinations carried out or
ordered by the practitioner. This included medical tests performed, psychosocial data
gathering and screening risk factors (e.g. Baig & Heisler, 2008; Kerr, 2014; Martin et
al., 1991). Table 6 shows effect sizes that suggest that lower class patients were less
likely to receive examinations, screening, and additional test referrals for their
presenting difficulties. Where reported, effect sizes ranged from negligible to large in
terms of lower-class prejudice, and small in relation to lower-class preference. There
were no notable patterns in the results in relation to profession, diagnosis and how
social class was measured. However, significant differences were only seen in Martin
et al. (1991) who used a naturalistic design (using actual patient data); it was found
finding that family practice physicians were more likely to perform examination and
tests if the client was of a higher social class.
Effects of Social Class Bias on Explanations Provided by Clinician
Six studies explored the effect social class biases have on explanations provided to the
patient by the practitioner. This included biomedical counselling, explaining
difficulties to the patient, and providing patient with reassurance (e.g. Boulton et al.,
1983; Pendelton & Bochner, 1980). Table 7 shows effect sizes that suggest that
clinicians are more likely to provide advice and explanations for difficulties to higher
class patients. Where reported, large effects were seen in relation to lower-class
prejudice, and smaller effects in relation to lower-class preference. Significant
findings were seen in three comparisons and were more likely to be seen in family
practice physicians relative to physicians in general/other disciplines, and also when
naturalistic study designs were used. This was specifically in relation to the amount of
time physicians spent responding to patients’ questions (Pendelton & Bochner, 1980),
and the amount of time clinicians spent advising or providing explanations to a patient
in relation to their difficulties (Martin et al., 1991). Like other areas of clinical
reasoning, no patterns were seen in the effect sizes in relation to diagnosis or how
social class was operationalised within the study.
Effects of Social Class bias on Cognitive Resource Allocation.
Finally, five studies explored the effect class biases have on the allocation of
cognitive resources. This included length of consultation, time until next appointment
and amount of information recalled about the patient (Arber et al., 2006; Boulton et
al., 1983; Mckinlay et al., 1997). Table 8 shows that effect sizes suggest that lower
47

Table 6: Effects of Social Class bias on Clinician Examination
Examination Clinical Reasoning Method
Lower Class Mean (SD)/
%
Middle Class Mean
(SD)/ %
Upper Class Mean (SD)/
%
Effect Size Used Effect Size p
Arber, McKinlay, Adams, Marceau, Link and O'Donnell (2006)
Video Vignette
Number of additional questions physicians would ask a cardiac patient in consultation
6.5 6.2 na na .587
% of physicians who would ask 4 or more questions 81.0% 80.0% na na .732Number of examinations physician would perform on a
cardiac patient4.6 4.8 na na .459
Baig and Heisler (2008) Text Vignette
Physician rated importance of screening sexual behaviour 71.0% 54.0% OR 0.5 (0.26-0.94) nsPhysician intention to screen for sexual behaviour 74.0% 65.0% OR 0.65 (0.33-1.26) ns
Physician rated Importance of screening physical activity 76.0% 76.0% OR 0.97 (0.48-1.97 ns
Physician Intention to screen for physical activity 80.0% 85.0% OR 1.39 (0.61-3.17) ns
Physician rated Importance of screening for depression 59.0% 60.0% OR 1.04 (0.56 -1.94)
ns
Physician Intention to screen for depression 62.0% 63.0% OR 1.03 (0.55-1.93) ns
Physician rated importance of screening diet 72.0% 70.0% OR 0.90 (0.46-1.76) ns
Physician intention to screen diet 77.0% 76.0% OR 0.91 (0.44-1.86) Ns

Examination Clinical Reasoning Method
Lower Class Mean (SD)/
%
Middle Class Mean
(SD)/ %
Upper Class Mean (SD)/
%
Effect Size Used Effect Size P
Haider et al. (2014) Text Vignette
Trauma Surgeons intention to refer patient with cervicalspine injury on for MRI of the C-Spine
na na β 0.49 (0.3-0.81) ns
Haider et al. (2015a) Text Vignette
Surgical Nurses assessment of a patients’ ability to consent to surgery
na na β -0.26 (-0.72-0.21)
ns
Haider et al. (2015b) Text Vignette
Acute Care Surgeons intention to refer patient with cervical spine injury on for MRI of the C-Spine
na na β -0.62(-1.11- - 0.12
ns
Kerr (2014) Live Acted Vignette
Physicians amount of psychosocial data gathering with a patient with significant weightloss
23.0 (2.4)
27.3 (2.4)
Cohens D 1.475 ns
Physicians amount of psychosocial data gathering with a patient with significant weightloss whose social class was
revealed in consultation
23.7 (3.2)
25.9 (2.0)
Cohens D 0.63 ns
Physicians amount of psychosocial data gathering with a patient with significant weightloss whose social class was not
revealed in consultation
23.7 (3.2)
29.2 (3.3)
Cohens D 1.41 ns
49
Examination Clinical Reasoning Method
Lower Class Mean (SD)/
%
Middle Class Mean
(SD)/ %
Upper Class Mean (SD)/
%
Effect Size Used Effect Size P
Martin, Russell, Goodwin, Chapman, North and Sheridan (1991)
Naturalistic Study
If an examination was provided on patient by Family Practice Physician
81.0% 65.0% 63.0% na na .01**
If a test was performed by Family Practice Physician 15.0% 21.0% 15.0% na na .01**Any 'other help' provided by Family Practice Physician 27.0% 18.0% 11.0% na na .01**
Mckinlay et al. (1997) Text/Video Vignette
Likelihood physician would obtain tissue analysis for an oncology patient
na na OR 0.78 (0.36-1.69) ns
Likelihood physician would make a radiologic study request for an oncology patient
na na OR 1.84 (0.77-4.41) ns
Note. Dependent Variables are presented were from likert scales (higher value indicating a higher levels of the variable) unless otherwise specified. ‘na’ denotes that the information was not available from the publication. ‘ns’ denotes that the result was nonsignificant but the paper did not report the exact p values. * denotes significance p<.05, ** denotes significance p<.01m *** denotes significance p<.001.
50
Table 7: Effects of Social Class Bias on Explanations Provided by Clinician
Explanation Clinical Reasoning Method
Lower ClassMean
(SD)/%
Middle Class Mean
(SD)/%
Upper ClassMean
(SD)/ %
Effect Size Used Effect Size p
Arber, McKinlay, Adams, Marceau, Link and O'Donnell (2006)
Video Vignette
Amount of advice given by physician on lifestyle or behaviour for a cardiac patient
2.20 1.80 na na 0.183
Boulton, Tuckett, Olson and Williams (1983) Naturalistic Design
If physician provided an Elaborate Explanation to their patient 34.0% 30.0% 32.0% na na nsIf physician provided a less elaborate explanation to their patient 40.0% 42.0% 49.0% na na ns
No Explanation provided to patient 26.0% 28.0% 19.0% na na ns
Haider et al. (2015a) Text Vignette
Likelihood Medical Student would provide reassurance to a surgical patient
na na na β -0.42 (-0.99 - 0.15)
ns
Kerr (2014) Live Acted Vignette
If physician provided patient with significant weight loss education/biomedical counselling
59.8 (8.) 72.7 (7.6) Cohens D 1.35 ns
If physician provided patient with significant weight loss education/biomedical counselling where patient class was
revealed
61.0 (10.2) 68.7 (6.2) Cohens D 0.69 ns
51
Explanation Clinical Reasoning Method
Lower ClassMean
(SD)/%
Middle Class Mean
(SD)/%
Upper ClassMean
(SD)/ %
Effect Size Used Effect Size p
Kerr (2014) continuedIf physician provided patient with significant weight loss
education/biomedical counselling where patient class was not revealed
59.6 (10.6) 79.3 (8.1) Cohens D 1.63 ns
Martin, Russell, Goodwin, Chapman, North and Sheridan (1991)
Naturalistic Design
If family practice physician spent time explaining and listening to patient
47.0% 53.0% 60.0% na na .010**
If family practice physician gave advice to patient 57.0% 67.0% 65.0% na na .010**
Pendelton and Bochner (1980) Naturalistic Design
Family practice physician volunteered information in consultation 1.6 2.4 3.1 Cohens D 0.60 nsFamily practice physician volunteered explanations in
consultation1.1 1.2 2.1 Cohens D 1.59 ns
Information response to patient questions by Family Practice Physician
0.7 1.5 1.1 Cohens D 1.73 .050*
Family Practice Physicians explanations provided in response to patient questions
0.3 0.8 0.5 Cohens D 0.77 ns
Note. Dependent Variables are presented were from likert scales (higher value indicating a higher levels of the variable) unless otherwise specified. ‘na’ denotes that the information was not available from the publication. ‘ns’ denotes that the result was nonsignificant but the paper did not report the exact p values. * denotes significance p<.05, ** denotes significance p<.01*** denotes significance p<.001.
52
Table 8: Effects of Social Class bias on Cognitive Resource Allocation.
Cognitive Resource Allocation Method Lower ClassMean
(SD)/%
Middle Class Mean
(SD)/%
Upper ClassMean
(SD)/ %
Effect Size Used
Effect Size
p
Arber, McKinlay, Adams, Marceau, Link and O'Donnell (2006)
Video Vignette Design
Amount of time physicians left until next appointment (days) for Cardiac Patient
11.7 10.6 na na .169
Boulton, Tuckett, Olson and Williams (1983) Naturalistic Design
Time Family Practice Physicians Spent in Consultation na na r -0.02 nsTime Family Practice Physicians Spent in Conversation with
Patientna na r -0.07 ns
Kerr (2014) Live Acted Vignette
Physician length of visit with patient with significant weight loss
22.9 (1.5)
23.8 (1.5) Cohens D 0.48 ns
Physician length of visit with patient with significant weight loss whose social class was revealed
23.2 (2.0)
23.4 (1.2) Cohens D 0.09 ns
Physician length of visit with patient with significant weight loss whose social class was not revealed
23.2 (1.9)
26.5 (1.4) Cohens D 1.56 ns
53
Cognitive Resource Allocation Method Lower ClassMean
(SD)/%
Middle Class Mean
(SD)/%
Upper ClassMean
(SD)/ %
Effect Size Used
Effect Size
p
Cognitive Resource Allocation Method Lower ClassMean
(SD)/%
Middle Class Mean
(SD)/%
Upper ClassMean
(SD)/ %
Effect Size Used
Effect Size
p
Mckinlay et al. (1997) Text/Video Vignette Design
Physician recall rate of oncology patient pre-diagnosis 13.7 13.8 na na ns
Inferences generated by a physician pre-diagnosis of an oncology patient
3.22 3.2 na na ns
Physician recall rate of an oncology patient post diagnosis 20.0 22.5 na na ns
Inferences generated by Physician post diagnosis of an oncology patient
3.7 3.5 na na ns
Pendelton and Bochner (1980) Naturalistic study
Physician's length of consultation 5.3 6.34 6.7 Cohens D 1.67 ns
Note. Dependent Variables are presented were from likert scales (higher value indicating a higher levels of the variable) unless otherwise specified. ‘na’ denotes that the information was not available from the publication. ‘ns’ denotes that the result was nonsignificant but the paper did not report the exact p values. * denotes significance p<.05, ** denotes significance p<.01*** denotes significance p<.001.
54

55

class patients received less time in physician consultation compared to their higher-class
counterparts. Other types of cognitive resources (e.g. time between appointments, amount
of information recalled about patients) remaining similar. Where reported, effect sizes
ranged from small to larger effects, however none of them were statistically significant.
No differences in patterns of effect sizes between definitions of social class were seen in
relation to study design or speciality of the physician.
Discussion
The aim of the present review was to synthesise and critically evaluate the existing
evidence in relation to medical and health practitioner social class biases and their impact
on areas of clinical reasoning. A summary of eighteen studies published between 1980-
2015 with an overall sample of 6973 practitioners was provided. There was large
diversity in the size of effects of social class biases on clinical reasoning, dependant on
the type of reasoning, professionals involved and type of illness; 108 separate effects
were found within these studies. Most of the results pointed towards small-medium
effects in the direction of preference for upper class patients, in terms of reasoning in
relation to diagnosis (e.g. McKinlay et al., 1996), treatment (e.g., van Ryn & Byrne,
2000), affective responses to patients (e.g., Dougal & Schwartz, 2010), explanations
provided (e.g., Kerr, 2014) and allocation of cognitive resources (e.g., Pendelton &
Bochner, 1980). However, in a third of incidences forms of lower class preference were
seen. Large effects were seen in terms of empathetic responses when the practitioners
were made aware of the negative outcomes of the patients’ level of poverty (Kerr, 2014)
and small effects in certain diagnoses and treatments were also seen (e.g. in relation to
cervical spine injury, Haider et al., 2014, 2015b).
In terms of the disparities in clinical reasoning between class groups, it may be
that qualified medical and healthcare professionals are disproportionately from middle
and upper social class groups; therefore they find it easier to treat individuals of a similar
class due to status homophily (Kandel, 1966; McKinlay et al., 1997). However physicians
can often struggle to recognise or acknowledge subtle cues (including class cues) during
patient consultations (Kerr, 2014; Weiner et al., 2010; Zimmerman, Del Piccolo, &
Dunset, 2007). It is most likely that practitioners hold similar implicit biases in relation to
social class. These biases in turn may impact clinical work (Haider et al., 2014). It is
important to note that these processes are not necessarily based around explicit prejudice
but rather implicit biases held in the practitioner and society in general (Chapman et al.,
2013; Guilfoyle et al., 2008). Such biases work into the language of professionals in
subtle ways which can reify class differences in clinical reasoning (Griffiths, & Hughes,
1994; Hughes, & Griffiths, 1996). Medical discourse downplays the ‘social’ elements of
clinical reasoning by appearing depersonalised and objective (Anspach 1988; Atkinson,
1994). Decisions seem legitimate as they are framed within scientific or medical
discourse, affirmed using diagnostic labels, quantitative test results, patient case
notes/histories which omit the emotional/social responses of the clinician and technical
‘jargon’. These factors may mask decisions which are implicitly made based on social
status and may perpetuate the myth that healthcare professionals are always objective
(Anspach 1988; Atkinson, 1994; Hughes & Griffiths, 1996).
It is not clear why certain areas of clinical reasoning are affected more than others.
Disparities are seen in effect sizes for the same area of clinical reasoning, for example
length of GP consultation (d=-.04, Boulton et al., 1983; d=1.67, Pendelton & Bochner,
1980) or counsellor/psychotherapists perception of the severity of a client’s mental health
difficulty (d=0.43, Dougal & Scwartz, 2011; d=-0.16 Thompson et al., 2014). Feasible
arguments could be that this is due to disparities across training in different areas of
clinical reasoning, disciplines or across training centres (Ancis & Landany, 2010;
57
Burnham, 2005; Surbone, 2008). It may be that in some areas of clinical reasoning the
diagnosis or treatment is more ambiguous or is constrained by service provision (e.g.
duration of consultations, diagnostic reasoning). In other words, individuals are more
likely to rely on implicit biases and stereotypes if the difficulty is ambiguous (Darly &
Gross, 1983; McConahay, 1986).
It could be hypothesised that differences in clinical reasoning reflect ‘actual’
epidemiological differences in class groups, for example holding different kinds of illness
beliefs (Allhouse, 1993; Helman, 2007), patterns in communication (Fisher, 1988;
Muller, 1990) and expectations about treatment (Martin et al., 1991). However, research
over time has suggested little ‘actual’ healthcare differences between class groups which
are not born from prejudice, poverty, inequality, or ‘middle class’ hegemonic
expectations (Cartwright, 1964; Pendelton, & Bochner, 1980; Liu, 2011). To combat this
Baig and Heisler (2008) checked their participants’ belief that there should be an
increased importance in screening lower class individuals’ sexual health with
epidemiological data; no relationship between social class and sexually transmitted
infection was found (Santelli, Lowry, Brener, & Robin, 2000), therefore the reasoning
was likely to derive from class bias.
Disparities in results may be indicative of differences in the conceptualisation of
social class between studies rather than differences in forms of clinical reasoning or
between practitioners. Studies operationalised class in at least eight different ways (e.g.
occupation, lifestyle, use of language) and nine studies used combinations within these.
Due to the multifaceted nature of class it is inherently difficult to measure it in a specific
index (Liu, 2011) and it can often be inconsistently on inadequately measured in
healthcare contexts (Blacksher, 2008). For example, Nampiaparampil et al. (2009) did not
distinguish between social class and ethnicity in their study, using the distinction that ‘in
58
America class and ethnicity highly correlate’ (Freeman & Payne, 2000; Kahn et al.,
1994). Whilst these are seen to correlate when studied together the social class
component of this is similarly measured inconsistently (Braverman et al., 2005; Krieger
et al., 1997).
Social class is seen to operationalise itself across differently across these cultures
and time (Skeggs, 2005; Vanneman, 1980). Regardless of the culture class is situated in,
class cues tend to be subtle based upon individuals’ preferences and interactions (Bennett,
2012; Bordieu, 1984). Therefore the use of income or occupation as a proxy for class in
some vignette studies and most naturalistic studies (e.g. Baig & Heisler, 2008; Martin et
al., 1991) may have been inadequate for measuring class differences (Blacksher, 2008;
Braverman et al., 2005, Krieger et al., 1997), whereas using more innocuous variations
such as dress (Bennett, 2012) or accent (Doss & Gross, 1994; Spencer, Clegg, &
Stackhouse, 2013) would have been more of an accurate proxy (Kerr, 2014), as
perceptions in relation to these areas can subtly change the way a person thinks about and
interacts towards another (Beal, 2009). Across the studies measuring patients’ subjective
class can reconcile this difficulty (e.g. asking the patient what they perceive their class to
be). This can be seen as a cognitive aggregation of individual’s personal markers of class
(such as occupation, finances, culture, beliefs) (Singh-Manoux et al., 2003). Vignettes
which used more than one marker of class (e.g. Dougal & Schwartz, 2011; McKinlay et
al., 1997) would have developed a more accurate proxy for class due to this aggregation.
Like differences in how class was conceptualised, disparities in results may be
indicative of differences in the methodologies used between studies. Vignettes were the
dominant method for studying medical and healthcare practitioner classism; Loring and
Powell (1988) report that vignettes are a superior method due to the allowance of
maximum control over conditions, and limiting of extraneous variance. However, in the
59

current review many studies were confounding by not accounting for differing levels of
valence across secondary factors such as aggression, attractiveness, likeability, positivity
etc., between stimuli. Results could be a facet of the struggle to balance valences of
stimuli between conditions, which could be the reason for bias (rather than prejudice). For
example, in Dougal and Schwartz’s (2011) study they included the patient’s salary in the
vignette stimuli, therefore the upper-class condition contains the value $150, 000 per year
which is inherently more positive and lucrative than the patient with a $20, 000 salary.
Therefore, using wage as a method to differentiate class in vignettes confounds the
experiment because the value used is inherently positive. Another example is in Baig and
Heisler (2008) vignette stimuli the patient’s job role was altered. The profession of a
‘lawyer’ is stereotypically more respected than a ‘fast food worker’ and therefore has a
higher social value and positive valence. The incurred confound can also be extreme, for
example in Kerr (2014) the lower social class condition was inherently negative (denoted
by the patient’s daughter being killed in domestic violence incident). Other studies do not
report how they manipulated class in their vignettes, for example Arber et al. (2006)
altered style of dress and appearance of the client but did not specify how. It may be that
these patients are preferred not solely due to their class but rather due to their social utility
(Piff, 2014), that “if I interact with this person, there may be more positive outcomes for
myself” (e.g. in terms of money, status, power) or from a preference of striving to be like
them; as Binswanger (2008) suggests: there is a tendency for individuals to have an
‘upward mobility’ bias to strive for social betterment or status.
Nonetheless, some studies reconciled difficulties in balancing confounding factors
through other means, for example in-depth rehearsal with actors to assure continuity
between class conditions (e.g. Kerr, 2014), or extensively piloted stimuli to reduce
additional variance (Arber et al., 2006; Feldman et al., 1996). Additionally, many
60

vignettes presented patients with ambiguous medical presentations; ambiguity within the
presentation of clinical symptoms increases the likelihood of the participant relying on
stereotypes (McConahay, 1986).
The use of vignette’s usefulness has also been questioned alongside analysing the
impact on clinical practice. They may not accurately reflect power differentials,
complicated interpersonal situations, emotionality, or contextual pressures of clinical
work (Lopez, 1989; Stolte, 1994). Additionally, vignettes provide the participant with
information, whereas in reality the practitioner gathers this for themselves (Mikon &
Grounds, 2007); information may be processed less carefully or seen as irrelevant.
However, vignettes can be altered to simulate clinical practice. Presentations of multiple
sources of information are seen to enhance reasoning cues and realism (Rosenthal &
Berven, 1999). This was the case in Mikinlay et al.’s (1996, 1997) studies, as participants
received additional medical test results upon request to go alongside the video vignette
and were provided with videos from two points in time: e.g. pre-diagnosis and post
biopsy.
Most vignettes did not provide heightened realism, focusing on presenting text in
favour of pragmatics. The naturalistic studies provided realism and active data from real
patients, however pitfalls are then found with explicit survey measures, which may be
open to practitioners’ demand characteristics and social desirability factors. However, this
was overcome across some of the naturalistic studies, through independent rating and
coding of video footage (Boulton et al., 1983) and receiving perceptions from the patient
as well as the practitioner (Pendelton & Bochner, 1980). These studies may have
benefited from the using an Implicit Association Test (IAT) to measure the inherent level
of class preference within the practitioner to be used alongside survey responses (akin to
Haider et al., 2011, 2014, 2015a, 2015b); implicit measures are preferred when measuring
61

prejudice (Lane, Banaji, Nosek, & Greenwald, 2007) as they reduce the impact of social-
desirability response biases. Nevertheless, using such measures has similar pitfalls to the
vignette studies due to the potential lack of balanced valence in their IAT stimuli. For
example, in Haider et al.’s (2011) research participants showed an implicit preference for
upper class stimuli, however this did not impact the medical student’s practice and
rapport. Unfortunately, the stimuli used to measure upper class preference was inherently
positive (privileged, wealthy) and inherently negative for lower class stimuli (uneducated,
poor); preference may have been a due to the terms themselves rather than their
association with social class.
Being mindful of the expense and time-consuming nature of naturalistic studies
and criticisms of naturalistic and vignette study, for the vignette allows experimental bias
to be actively linked to experimental manipulation of the variable which naturalistic
studies lack (Loring & Powell, 1988); therefore, the focus should be on making the
process more realistic for the participant. Kerr (2014) managed to bridge this increased
the level of realism using novel methodology (See Weiner et al., 2010). This was through
using trained actors to manipulate class cues within actual family practice consultation
sessions and then coding the responses from practitioners. Where cost and time
constraints are paramount efforts should be made to capture data representative of the
practitioner population; Willaims et al. (2015) ensured their medical student sample met
the general student population in terms of demographics.
A general flaw of the research included in this review is that effect sizes were not
calculable from four out of the 18 articles due to a lack of appropriate reporting of data.
Many more studies did not report direct effect sizes however these were calculable from
data within the text (Cohen, 1988; Cramer, 1999; Rosenthal, 1994). Many effects seen
within these studies were not statistical significant; whilst small differences in sample size
62

can shift significance values, effect sizes are more robust. This can lead a large effect size
being unreported (Snyder, & Lawson, 1993). Durlak (2009) notes that there is not a direct
relationship between the size of an effect based on the result of inferential statistics.
Therefore, studies which reported non-significant results may have been inadvertently
downplaying an effect in relation to social class biases. However, studies with relatively
smaller samples sizes e.g. (n=98, Kerr, 2014; n=79, Pendelton & Bochner, 1980),
reported large effect sizes (Cohen’s D between 0.8-4.0) without statistical significance. In
these cases, the large effect may be due to a lack of statistical power.
Future directions
It is documented that attending to the explicit activation of personal beliefs can reduced
the impact of stereotypes in clinical work (Devine, Plant, & Buswell, 2000). This may be
addressed, at a provider level, by increasing awareness through education (Green et al.,
2007). This has already been shown to be of benefit across training programs in different
healthcare professions, most notably clinical psychology/psychotherapy and increasingly
in medicine (Ancis & Landany, 2010; Burnham, 2005; Liu et al., 2007; Peppin, 1994;
Surbone, 2005, 2008). Importance should be placed on clinicians exploring their personal
assumptions and values (Beagan & Kumas, 2009). Rather than neutralising biases, a
reflexive approach can be taken to increase awareness of them and guide practice.
Practitioners who have experience working with people of lower social status, those who
feel mastery when working with such populations or those with a previous history of
financial hardship tend to report less prejudiced perceptions (Minick et al., 1998; Beagan
& Kumas-Tan, 2009). Clinicians may find it useful to reflect on personal experiences of
power, privilege marginalisation, disadvantage, difference and belonging to aid in their
connection with their patients (Ancis & Landany, 2010; Beagan & Kumas-Tan, 2009;
Burnham, 2005; Surbone, 2008).
63

In the United Kingdom, a precondition to ongoing registration is proof of
participating in ‘continuing professional development’ and accreditation (Freckelton,
2006). It is important that cultural competence and becoming aware of biases is
monitored throughout this process (Burnham, 2005) and practitioners not only strive for
betterment in their clinical skill, but also in the ways they respond to the diverse needs
and cultures of patients they treat. Whilst not an excuse for prejudice, oppression or
malpractice, it is difficult to be a healthcare professional in modern society. Healthcare
professions can be highly regulated and criticised (Harpwood, 2006). Professionals are
met with institutional, regulatory, and legislative changes, societal pressures, and
occupational stress which can impact their performance. Practitioner ‘burnout’ may lead
to physical and emotional fatigue (Rothschild & Rand, 2006) and professionals may
falsely rely on stereotypic view of patients to be pragmatic.
Research in this area has currently focused on physicians in the United States. It is
important to understand how these biases are enacted in other allied healthcare
professionals, and the impact that these biases may have in a British population,
especially as the British welfare agenda is based around the creation of opportunity rather
than direct financial and healthcare support to lower classed individuals (Coburn, 2015;
Dwyer, 2002; Peacock-Brennan & Harper, 2016), yet these individuals are likely to have
multiple increased health risks (Kipping et al., 2014) and are potentially discriminated
against subtly by healthcare professionals. In moving forward, it would seem beneficial
and pragmatic to create vignette material with increased realism (use of video, multiple
time points, and multiple modalities of information) and stimuli counterbalanced in
valence, whilst providing ambiguous clinical difficulties to elict stereotypic judgment. It
will be important to use stimuli which subtly encompass the multifaceted nature of social
class in the current culture, place and time of the research.
64

Conclusion
Medical and healthcare professionals are taught to treat all patients with equal respect,
however patients can be subtly discriminated against in relation to their social class. The
aim of the present review was to synthesise and critically evaluate the existing evidence
in relation to medical and health practitioner social class biases and how these impact
areas of clinical reasoning. An extensive search of class bias and clinical reasoning
literature was conducted incorporating five electronic databases and hand searches.
Eighteen papers, published between 1980-2015, met the eligibility criteria and were
included in this review. It was found that small–large effects of social class bias,
predominantly in the direction of upper class preference, were found for diagnostic
reasoning, treatments provided, affective responses to patients, explanations provided to
patients, examinations patients received and allocation of cognitive resources.
65

References
References included within the literature review are denoted with *
Abreu, J. M. (1999). Conscious and nonconscious African American stereotypes: Impact
on first impression and diagnostic ratings by therapists. Journal of Consulting and
Clinical Psychology, 67(3), 387-393. doi:10.1037//0022-006X.67.3.387
Allhouse, K. D. (1993). Treating Patients as Individuals. In M. Geirteis, S. Edgman-
Levitan, J. Daley, T. & Delbanco. (Eds). Through the Patients Eyes:
Understanding and Promoting Patient-Centred Care (pp.19-45). San Fransico:
Jossey-Bass.
Ancis, J. R., & Ladany, N. (2010). A Multicultural Framework for Counselor
Supervision. In N. Ladany & L. J. Bradley (Eds.) Counselor Supervision (4th ed.)
(pp. 53-94). New York, NY: Routledge.
Anspach, R. R. (1988). Notes on the Sociology of Medical Discourse: The Language of
Case Presentation. Journal of Health and Social Behaviour, 29, 357-375.
American Psychiatric Association (1994). Diagnostic and Statistical Manual of Mental
Disorders (4th Edition). Washington, DC: Author.
* Arber, S., McKinlay, J., Adams, A., Marceau, L., Link, C., & O'Donnell, A. (2006).
Patient characteristics and inequalities in doctors' diagnostic and management
strategies relating to CHD: A video-simulation experiment. Social Science &
Medicine, 62(1), 103-115. doi:S0277-9536(05)00244-3 [pii]
Asch, S. M., Kerr, E. A., Keesey, J., Adams, J. L., Setoji, C.M., Malik, S., & McGlynn,
E. A. (2006). Who is at greatest risk for receiving poor-quality health care? New
England Journal of Medicine, 354, 1147-1156. doi:10.1056/NEMsa044464
66
Atkinson, P. A. (1994). Rhetoric as Skill in a Medical Setting. In Bloor, M., and
Taraborrelli, P. (Eds.) Qualitative Studies in Health and Medicine (pp.110-
130) Aldershot: Avesbury.
*Baig, A. A., & Heisler, M. (2008). The influence of patient race and socioeconomic
status and resident physician gender and speciality on preventive screening.
Seminars in Medical Practice, 11, 27-35. pmid:20871739.
Barton, R. & Talbot, D. (2014). People in Low Income Groups. In Gandy, J. (Eds.)
Manual of Dietetic Practice (5th Ed.) (pp.104-111). Chichester: The British
Dietetic Association.
Beagan, B. L., & Kumas-Tan, Z. (2009). Approaches to diversity in family medicine: "I
have always tried to be colour blind". Canadian Family Physician Medecin De
Famille Canadien, 55(8), e21-28. doi:55/8/e21 [pii].
Beal, J. (2009). Enregisterment, commodification and historical context: ‘Geordie’
versus ‘Sheffieldish’. American Speech, 84, 138–156. doi:10.1215/00031283-
2009-012
Beauchamp, T. L., & Childress, J. F. (2013). Principles of Medical Ethics (7th Edition).
Oxford: Oxford University Press.
Bennett, J. (2012). Chav-spotting in Britain: the representation of social class as private
choice. Social Semiotics, 23 (1), 37–41. doi: 10.1080/10350330.2012.708158.
Bennett, J. (2013). Moralising Class: A discourse analysis of the mainstream political
response to Occupy and the August 2011 British riots. Discourse & Society, 24
(1), 27-45. doi: 10.1177/0957926512463634
67

Binswanger, M. (2006). Why does income growth fail to make us happier? Searching for
treadmills behind the paradox of happiness. The Journal of Socio-Economics, 35,
366-381. doi: 10.1016/j.socec.2005.11.040.
Blacksher, E. (2008). Healthcare Disparities: The Salience of Social Class. Cambridge
Quarterly of Healthcare Ethics, 17, 143-153. doi:10.1017/S0931801 08080171.
Bordieu, P. (1984). Distinction: A Social Critique of the Judgement of Taste. London:
Routledge.
Borenstein, M., Hedges, L. V., Higgins, J. P. T., & Rothstein, H. R. (2009).
Introduction to Meta-Analysis. Chichester: Wiley.
*Boulton, M., Tuckett, D., Olson, C., & Williams, A. (1989). Social Class and General
Practice Consultation. Sociology of Health & Illness, 8 (4), 325-350.doi:
10.1111/1467-9566.ep11340453.
Boyd, K. (2006). Medical Ethics: Hippocratic and Democratic Ideals. In S. A. Mclean
(Eds.) First Do No Harm: Law Ethics and Healthcare (pp.29-39). Aldershot:
Ashgate Publishing Ltd.
Braverman, P. A., Cubbin, C., Egerter, S., Chideya, S. Marchi, K. S., Metzler, M., &
Posner, S. (2005). Socioeconomic Status Research: One size does not fit all.
Journal of the American Medical Association, 22, 2879-2888. doi: 10.1001/
jama.294.22.2879.
Brown, L. M., Hoover, R., Silverman, D., Baris, D., Hayes, R., Swanson, G. M., …
Fraumeni, J. F. (2001). Excess incidence of squamous cell esophageal cancer among
US black men: Role of social class and other risk factors. American Journal of
Epidemiology, 153(2), 114–122. doi:10.1093/aje/153.2.114
68

Burnham, J. (2005) Relational reflexivity: a tool for socially constructing therapeutic
relationships. In C. Flaskas, B. Mason and A. Perlesz (Eds.), The Space Between:
Experience, Context, and Process in the Therapeutic Relationships (pp 1-18).
London: Karnac Books.
Burnstin, H. R., Johnson, W. G., Lipsitz, S. R., & Brennan, T. A. (1993). Do the poor sue
more? A case-control study of malpractice claims and socioeconomic status.
JAMA, 270, 1679-1701. pmid: 8411499.
Cartwright, A., (1964). Human Relations and Hospital Care. Routledge and Kegan
Paul: London
Chapman, E. N., Kaatz, A., & Carnes, M. (2013). Physicians and Implicit Bias: How
Doctors May Unwittingly Perpetuate Health Care Disparities. J Gen Intern
Med, 28(11), 1504-1510. doi:10.1007/s11606-013-2441-1.
Chen, E., & Paterson, L. Q. (2003). Neighbourhood, family, and subjective
socioeconomic status: How do they relate to adolescent health? Educational
Researcher, 25(6), 96–102. doi:10.1037/0278-6133.25.6.704
Chen, M., Froehle, T., & Morran, K. (1997). Deconstructing Dispositional bias in
Clinical Inference: Two Interventions. Journal of Counseling Development, 76, 74
– 81. doi: 10.1002/j.1556-6676.1997.tb02378.x
Cohen, J. (1988). Statistical power analysis for the behavioural sciences. Hillsdale, NJ:
Erlbaum.
Cohen, S., & Lemay, E. P. (2007). Why would social networks be linked to affect and
health practice? Health Psychology, 27, 268-274. doi: 10.1037/0278-6133.26.
4.410.
69
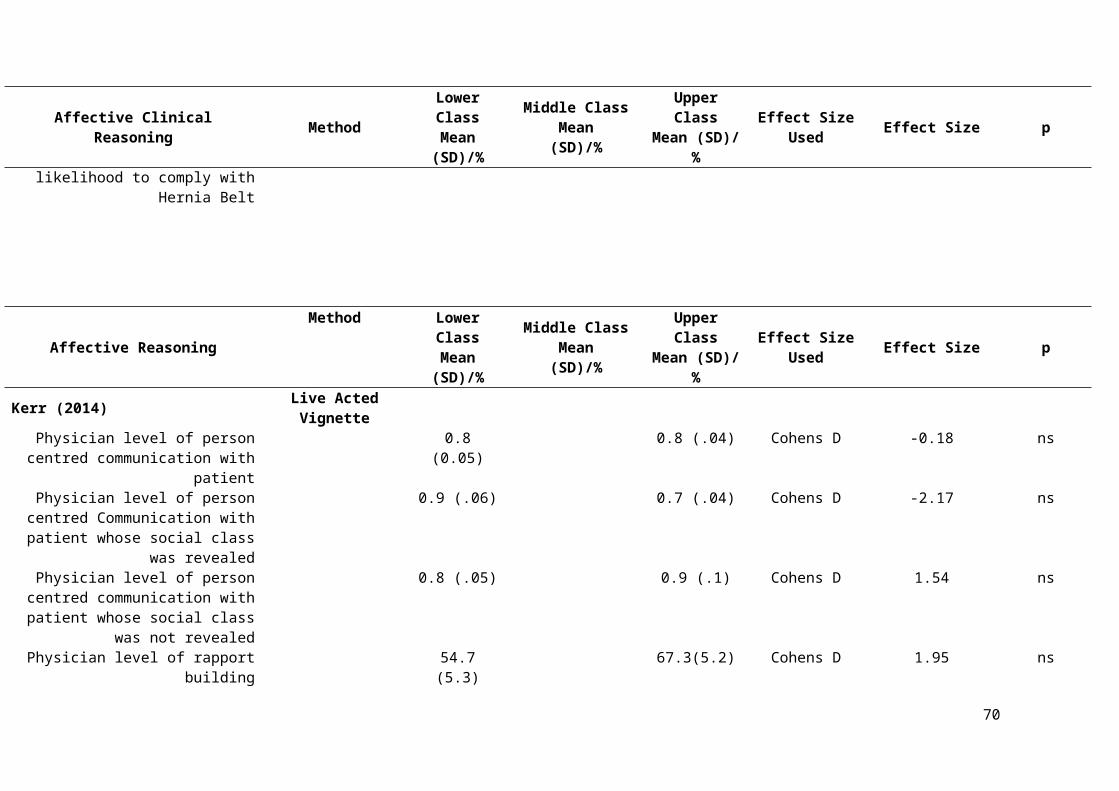
Coburn, D. (2015). Income inequality, welfare, class and health: a comment on
Pickett and Wilkinson, 2015. Social Science and Medicine, 146, 228-232.
doi:10.1016/j.socscimed.2015.09.002.
Cramér, H. (1999). Mathematical Methods of Statistics. New Jersey, NJ: Princeton
University Press
Darley, J. M., & Gross, P. H. (1983). A hypothesis-confirming bias in labelling effects.
Journal of Personality and Social Psychology, 44, 20-33. doi:0022-3514/83/4401-
0020$00.75
Darmon, N., & Drewnowski, A. (2008). Does Social Class Predict Diet Quality?
American Journal of Clinical Nutrition, 87, 1107-1117.
Devine, P. G., Plant, E. A., & Buswell, B. N. (2000). Breaking the Prejudice Habit:
Progress and Obstacles. In S. Oskamp (Ed.) Reducing Prejudice and
Discrimination (pp.185- 210). New Jersey, NJ: The Clairemont Symposium on
Applied Social Psychology.
Doss, R. C., & Gross, A. M. (1994). The Effects of Black English and Code-Switching on
Intraracial Perceptions. Journal of Black Psychology, 29, 282-93
* Dougall, J. L., & Schwartz, R. C. (2011). The influence of client socioeconomic
status on psychotherapists’ attributional biases and countertransference reactions.
American Journal of Psychotherapy, 65(3), 249–265.
Drever, F., & Whitehead, M. (1997). Health Inequalities. London: National Statistics
Durlak, J. A. (2009). How to Select, Calculate and Interpret Effect Sizes. Journal of
Pediatric Psychology, 34 (9), 917-928. doi:10.1093/jpepsy/jsp004
Dwyer, P. (2002). Making Sense of Social Citizenship: Some User Views on Welfare
Rights and Responsibilities. Critical Social Policy, 22 (2), 273–99. doi:
10.1177/02610183020220020601.
70

Elliott, I. (2016). Poverty and Mental Health: A review to inform the Joseph Rowntree
Foundation’s Anti-Poverty Strategy. London: Mental Health Foundation.
Eriksen, H. R., & Ursin, H. (2002). Social inequalities in health: biological, cognitive and
learning theory perspectives. The Norwegian Journal of Epidemiology, 12, 33-38.
doi:10.5324/nje.v12il.503.
Eubanks-Carter, C., & Goldfried, M. R. (2006). The impact of client sexual orientation
and gender on clinical judgments and diagnosis of borderline personality disorder.
Journal of Clinical Psychology, 62(6), 751–770. doi: 10.1002/jclp.20265.
Evans, G. (1992). Testing the Validity of the Goldthorpe Class Schema. European
Sociological Review, 8, 211–32. doi:10.1093/oxfordjournals.esr.a036638
Feldman, H. A., McKinlay, J. B., Potter, D. A., Freund, K. M., Burns, R. B.,
Moskowitz, M. A., & Kasten, L. E. (1996). Non-medical influence on medical
decision making: an experimental technique using videotapes, factorial design and
survey sampling. Health Services Research, 32 (3), 343-365. pmid: 9240285.
Fisher, S. (1998). In the Patient’s Best Interest: Women and the Politics of Medical
Decisions. New Jersey: Rutgers University Press.
Freckelton, I. (2006). Contemporary Challenges in the Regulation of Health
Practitioners. In S. A. Mclean (Eds.) First Do No Harm: Law Ethics and
Healthcare (pp.39-59). Aldershot: Ashgate Publishing Limited.
Freeman, H. P., & Payne, R. (2000). Racial Injustice in Health Care. N Engl J Med,
342, 1045-7. doi: 10.1056/NEJM200004063421411
Garland, A. F., Lau, A. S., Yeh, M., McCabe, K. M., Hough, R. L., & Landsverk, J. A.
(2005). Racial and ethnic differences in utilization of mental health services
among high-risk youths. American Journal of Psychiatry, 162, 1336-1343.doi:
10.1176/appi.ajp.162.7.1336
71
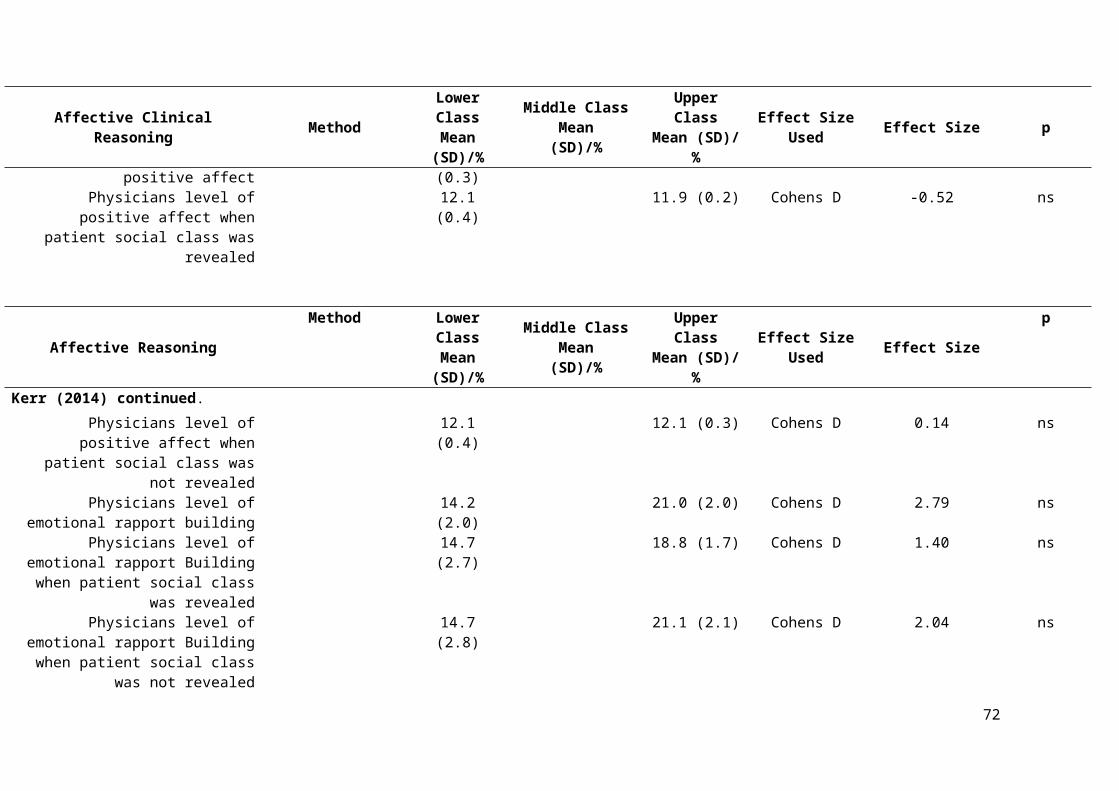
Ghaed, S. G., & Gallo, L. (2007). Subjective social status, objective socioeconomic
status, and cardiovascular risk in women. Health Psychology,26, 668-674.
doi:10.1037/0278-6133.26.6.668
Gillion, R. (1994). Medical Ethics: Four Principles Plus Attention to Scope. BMJ, 309,
184-8. pmcid:PMC2540719
Goldthorpe, J., & Llewellyn, C. (1977). Class Mobility in Modern Britain: Three Theses
Examined. Sociology, 11, 257-1987. doi:0.1177/003803857701100202
Green, A. R., Carney, D. R., Pallin, D.J., Ngo, L. H., Raymond, K. L., Iezzoni, L. I., &
Banaji, M. R. (2007). Implicit Bias among physicians and its prediction of
thrombolysis decisions for black and white patients. Journal of General Internal
Medicine, 22, 1231-1238. doi: 10.1007/s11606-007-0258-5.
Griffiths, L., & Hughes, D. (1994). “Innocent Parties” and “Disheartening”
Experiences: Natural Rhetoric in Neuro-Rehabilitation Admissions
Conferences. Qualitative Health Research, 4(4), 385-410. doi:
10.1177/104973239400400404
Guilfoyle, J., Kelly, L., & Pierre-Hansen, N. (2008). Prejudice in Medicine: Our Role in
Creating Health Care Disparities. Canadian Family Physician, 54, 1511-1513.
pmid: 19005106.
Haddock, C. K., Rinsdkopf, D., & Shadish, W. R. (1998). Using odds ratios as effect
sizes for meta-analysis of dichotomous data: A primer on methods and
issues. Psychological Methods ,3, 339-353.
*Haider, A. H., Schneider, E. B., Sriram, N., Dossick, D. S., Scott, V. K., Swoboda,
S.,Haider, A. H., Schneider, E. B., Sriram, N., Dossick, D. S., Scott, V. K.,
Swoboda, S. M., . . . Freischlag, J. A. (2015b). Unconscious race and social
72
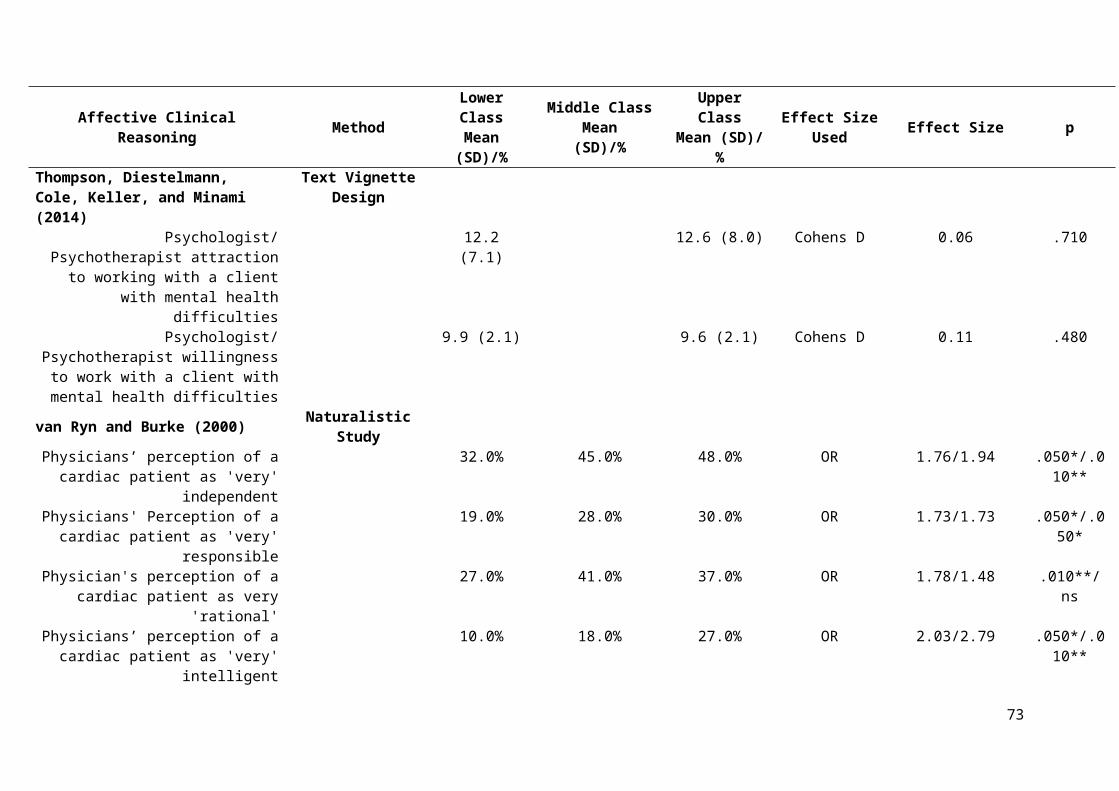
class bias among acute care surgical clinicians and clinical treatment decisions.
JAMA Surgery, 150(5), 457. doi:10.1001/jamasurg.2014.4038.
*Haider, A. H., Sexton, J., Sriram, N., Cooper, L. A., Efron, D. T., Swoboda, S., . . .
Cornwell,E. E. (2011). Association of unconscious race and social class bias
with vignette-based clinical assessments by medical students. JAMA, 306(9),
942-51. doi:10.1001/jama.2011.1248.
*Haider, A. H., Schneider, E. B., Sriram, N., Dossick, D. S., Scott, V. K., Swoboda, S.
M., … Cooper, L. A. (2014). Unconscious race and class bias: Its association with
decision making by trauma and acute care surgeons. The Journal of Trauma and
Acute Care Surgery, 77(3), 409-416. doi:10.1097/TA.0000000000000392 [doi]
*Haider, A. H., Schneider, E. B., Sriram, N., Scott, V. K., Swoboda, S. M., Zogg, C. K., .
. .Cooper, L. A. (2015a). Unconscious race and class biases among registered
nurses: Vignette- based study using implicit association testing. Journal of the
American College of Surgeons, 220(6), 1077-1086.e3.
doi:10.1016/j.jamcollsurg.2015.01.065 [doi]
Harpwood, V. (2006). In Defence of Doctors. In S. A. Mclean (Eds.) First Do No Harm:
Law Ethics and Healthcare (pp.587-605). Aldershot: Ashgate Publishing Limited.
Harris, L. T., & Fiske, S. T. (2006). Dehumanizing the Lowest of the Low:
Neuroimaging Responses to Extreme Out-Groups. Psychological Science, 17
(10), 847-853. doi: 10.1111/j.1467-9280.2006.01793
Hayes, J. A., & Erkis, A. J. (2000). Therapist homophobia, client sexual orientation and
source of client HIV infection as predictors of therapist reactions to clients with
HIV. Journal of Counselling Psychology, 51, 398–407.
Health and Social Care Information Centre (2010). National Child Measurement
Program England 2009/10 School Year. London: Public Health England
73

Hedges, L. V., & Olkin, I. (1985). Statistical methods for meta-analysis. New York,
NY: Academic Press.
Helman, C. G. (2007). Culture, Health and Illness (5th Ed). New York, NY: Oxford
University Press.
Hollingshead, A. (1975/2011). Four Factor Index of Social Status. Yale Journal of
Sociology, 8, 21-53.
Hopps, J., & Liu, W. M. (2006). Working for Social Justice from within the Health
Care System: The Role of Social Class in Psychology. In R. L. Toporek, L. H.,
Gerstein, N. A. Fouad, G. Roysircar, & T. Isreal (Eds.), Handbook for Social
Justice in Counselling Psychology: Leadership, Vision, and Action (pp.318-
337). Thousand Oaks, CA: Sage.
Hughes, D., & Griffiths, L. (1996). ‘But if you look at the coronary anatomy…’: risk and
rationing in cardiac surgery. Sociology of Health and Illness, 18(2), 172-
197.pmid:11660399.
Hunter, J. E. & Schmidt, F. L. (2004). Methods of Meta-Analysis (2nd Ed.) Thousand
Oakes, CA: Sage.
Illich, I. (1974). Medical Nemesis. London: Caldar Boyars.
James, W., Nelson, M., Ralph, A., & Leather, S. (1997). Socioeconomic Determinants of
Health: The Contribution of Nutrition to Inequalities in Health. BMJ, 314, 1545-
1549 doi:10.1136/bmj.314.7093.1545
Kahn, K. I., Pearson, N. L., Harrison, E. R., Desmond, K. A., Rogers, W. H.,
Rubenstein, L. V. … Emmett, B. (1994). Healthcare for black and poor
hospitalized Medicare Patients. JAMA, 271, 1169-74.
74

Kandel, D. B. (1966). Status Homophily, Social Context, and Participation in
Psychotherapy. American Journal of Sociology, 71, 640-650. pmid:5952361.
Kareholt, I. (2001). The relationship between heart problems and mortality in difference
social classes. Social Science and Medicine, 52, 1391-1402.pmid: 11286363
Karuza, J., Zevon, M. A., Gleason, T. A., Karuza, C. K., & Nash, L. (1999). Models of
helping and coping, responsibility attributions, and well-being in community
elderly and their helpers. Psychology and Aging, 5, 194-208.pmid:2378685.
Kendler, K. S., Gardner, C. O., Hickman, M., Heron, J., Macleod, J., Lewis, G., & Dick,
D. M. (2014). Socioeconomic status and alcohol-related behaviours in mid- to late
adolescence in the Avon Longitudinal Study of Parents and Children. Journal of
Studies on Alcohol and Drugs, 75, 541–5.pmid: 2498252.
* Kerr, A. N. (2014). Stereotypes and patient-provider communication: Testing the
effects of depression, socioeconomic status, and race. Loyola University Chicago
Dissertations, paper 523.
Kipping, R. R., Smith, M., Heron, J., Hickman, M., & Campbell, R. (2014). Multiple
Risk behaviours in adolescence and socio-economic status: findings from a UK
birth cohort. European Journal of Public Health, 25(1), 44-49.
doi:10.1093/eupub/cku078.
Krieger, N., Williams, D. R., & Moss, N. E. (1997). Measuring Social Class in US
Public Health Research: concepts, methodologies, and guidelines. Annual Review
of Public Health, 18, 341-278. doi:10.1146/annurev.publhealth. 18.1.341
Ladany, N., & Krikorian, M. (2013). Psychotherapy Process and Social Class. In W. M.
Liu (Ed.) The Oxford Handbook of Social Class in Counseling (pp.131-144). New
York, NY: Oxford University Press.
75

Lane, K. A., Banaji, M. R., Nosek, B. A., & Greenwald, A. G. (2007). Understanding and
Using the Implicit Association Test: What We Know (So Far) about the Method.
In B. Wittenbrink, & N. Schwarz (Eds.) Implicit Measures of Attitudes (pp.59-
103). London: The Guildford Press.
Lantz, P. M., Lynch, J. W., House, J. S., Lepkowski, J. M., Mero, R. P., Musick, M. &
Williams, D. R. (2001). Socioeconomic disparities in health change in a
longitudinal study of US adults: the role of health-risk behaviours. Social Science
& Medicine, 53, 29–40. doi:10.1016/S0277-9536(00)00319-1
Lareau, A. (2003). Unequal childhoods: Class, race, and family life. Berkeley, CA:
University of California Press.
Lau, M. Y., Cho, R. J., Chang, J. J., & Huang, J. (2013). Measurement and
Methodological Issues in Social Class Research: A Call for Theorization and
Study. In W. M. Liu (Ed.) The Oxford Handbook of Social Class in Counseling
(pp.59-81). New York, NY: Oxford University Press.
Lepper, M.R., Henderlong, J., & Gingras, I. (1999). Understanding the effects of extrinsic
rewards on intrinsic motivation - Uses and abuses of meta-analysis: Comment on
Deci, Koestner, and Ryan. Psychological Bulletin, 125, 669-676. pmid: 10589298.
Lewis, G., Croft-Jeffreys, C., & David, A. (1990). Are British Psychiatrists Racist.
British Journal of Psychiatry, 157, 410–415. doi:10.1192/bjp.157.3.410.
Liu, W. M. (2011). Social Class and Classism in the Helping Professions: Research,
Theory, and Practice. London: Sage Publications LTD.
Liu, W. M. (2013). Future Directions for Scholarship in Social Class and Classism in
Psychology. In W. M. Liu (Ed.) The Oxford Handbook of Social Class in
Counseling (pp.554-557). New York, NY: Oxford University Press.
76
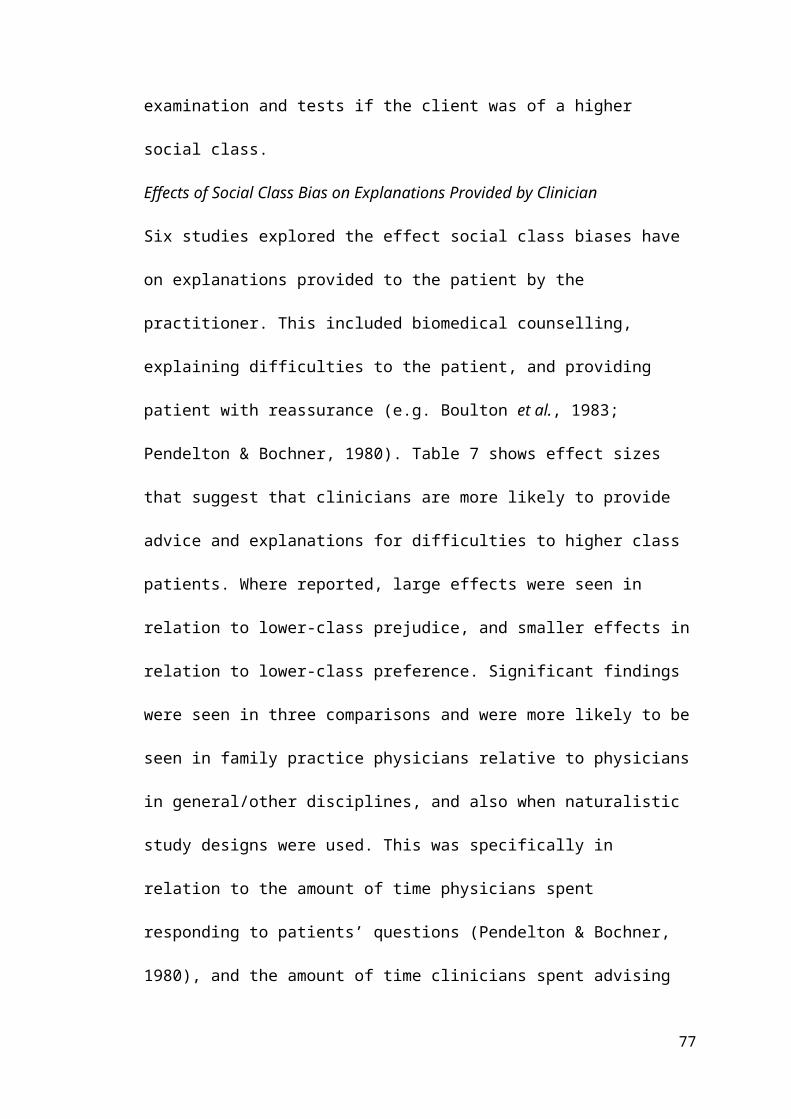
Liu, W. M., Pickett, T., & Ivey, A. E. (2007). White Middle-Class Privilege: Social
Bias and Implications for Training and Practice. Journal of Multicultural
Counseling and Development, 35, 95-122. doi:10.1002/j.2161-
1912.2007.tb00060.x
Logue, E. E., & Jarjoura, D. (1990). Modelling heart disease mortality with census
tract rates and social class mixtures. Social Science & Medicine, 31, 545-550.
pmid:2218636.
Lopez, S. R. (1989). Patient Variable Biases in Clinical Judgements: Conceptual
Overview and Methodological Considerations. Psychological Bulletin, 106, 184 –
203. pmid:2678201.
Loring, M., & Powell, B. (1988). Gender, Race and DSM-III: A study of the objectivity
of psychiatric diagnosis. Journal of Health and Social Behaviour, 29, 1-22.
pmid:3367027.
Lott, B. (2002). Cognitive and behavioural distancing from the poor. American
Psychologist, 57, 100– 110. doi: 10.1037/0003-066X.57.2.100.
Mackenbach, J. P., Stirbu, L., Roskam, A. J. R., Schaap, M. M., Menvielle, G., Leinsalu,
M., & Kunst, A. E. (2008). Socioeconomic Inequalities in Health in 22 European
Countries. New England Journal of Medicine, 358, 2468-2481.doi:
10.1056/NEJMsa0707519
*MacCormick, R. E., & Mackinnon, K. J. (1990). Decision making in cancer
treatment: Age and socio-economic status as independent variables.
Medical Teacher, 12, 353-355.pmid:2095454.
77

Malik, M. (2009). Anti-Muslim prejudice in the West, past and present: an
introduction. Patterns of Prejudice, 43, 207–212.
doi:10.1080/00313220903109144
Martin, E., Russell, D., Goodwin, S., Chapman, R., North, M., & Sheridan, P. (1991).
Why Patients Consult and What Happens When They Do. BMJ, 303, 289-292.
pmc:1670469.
McClellan, F. M., White, A. A., Kimenez, R. L. and Fahmy, S. (2012). Do Poor People
Sue Doctors More Frequently? Confronting Unconscious Bias and the Role of
Cultural Competency. Clin Orthop Relat Res, 470, 1393-1397. doi:
10.1007/s11999-012- 2254-2
McConahay, J. B. (1986). Modern Racism, Ambivalence, and the modern racism scale.
In J. F. Dovidio & S. L. Gaertner (Eds.) Prejudice, discrimination and racism,
(pp.91-125). Orlando, FL: Academic Press
*McKinlay, J. B., Potter, D. A., & Feldman, H. A. (1996). Non-Medical Influences on
Medical Decision-Making. Soc. Sci. Med., 42 (5), 769-776. pmid:8685745.
* McKinlay, J. B., Burns, R. B., Durante, R., Feldman, H. A., Freund, K. M., Harrow, B.
S. … &, Moskowitz, M. A. (1997). Patient, Physician and Presentational
Influences on Clinical Decision Making for Breast Cancer: Results from a
Factorial Experiment. Journal of Evaluation in Clinical Practice, 3(1), 23-
57.pmid:9238607
Mikton, C., & Grounds, A. (2007). Cross-cultural clinical judgment bias in personality
disorder diagnosis by forensic psychiatrists in the UK: A case-vignette study.
Journal of Personality Disorders, 21(4), 400–417. doi:
10.1521/pedi.2007.21.4.400
Mill, J. S. (1962). Utalitarianism. London: Harper Collins.
78
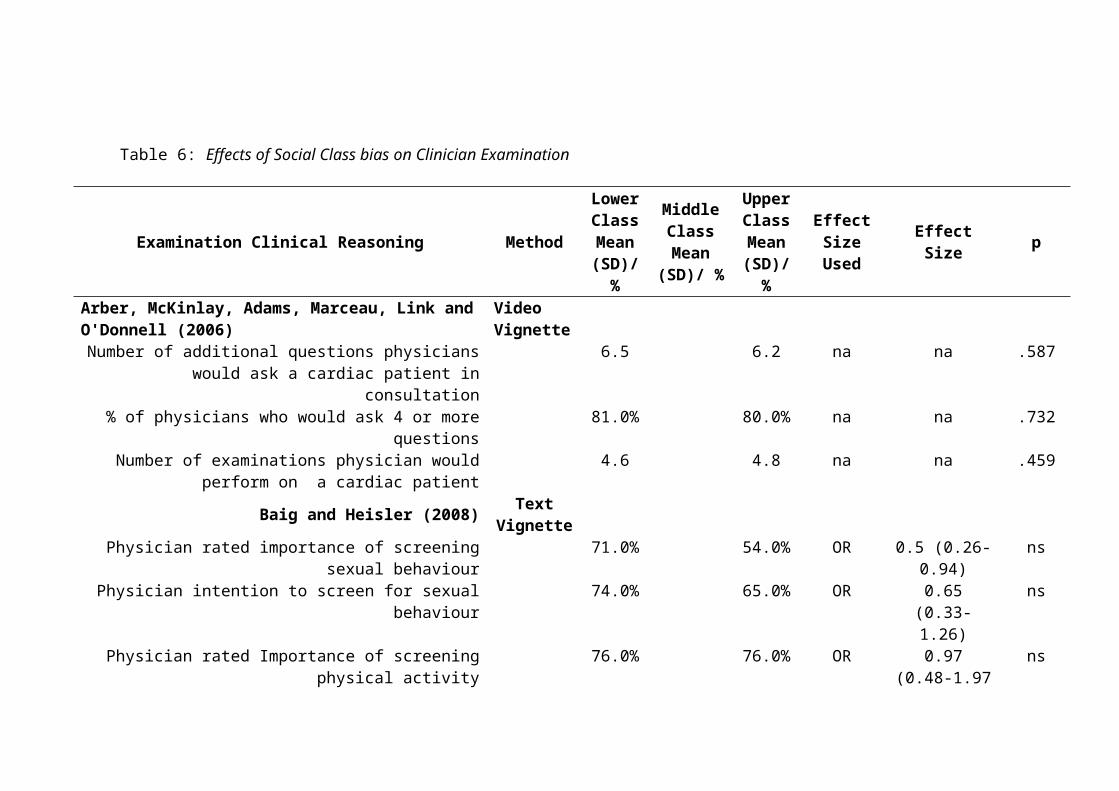
Miller, D. C. (1991). Handbook of Research Design and Social Measurements. Newbury
Park, CA: Sage Publications, Inc.
Minick, P., Kee, C. C., Borkat, L., Cain, T., & Oparah-Iwobi, T. (1998). Nurses'
perceptions of people who are homeless. Western Journal of Nursing Research,
20(3), 356-369. doi:10.1177/019394599802000307
Muller, C. (1990). Health Care and Gender. N.T.: Russell Sage Foundation
Mussman, M. G., Zawistowich, L., Weisman, C. S., Malitz, F. E., & Morlock, L. L.
(1991). Medical Malpractice Claims Filed by Medicare and non-Medicare
recipients in Maryland. JAMA, 265, 2992-2994.
Nam, C., & Boyd, M. (2004). Occupational Status in 2000; over a century of census-
based measurement. Popul Res Policy Rev, 23, 327-358.
*Nampiaparampil, D. E., Nampiaparampil, J. X., & Harden, R. N. (2009). Pain and
prejudice. Pain Medicine, 10(4), 716-721. doi:10.1111/j.1526-
4637.2009.00612.x
Nieminen, P., Lehtiniemi, H., Vahakangas, K., Huusko, A. & Rautio, A. (2013).
Standardised Regression Coefficient as an Effect Size Index in Summarising
Findings in Epidemiological Studies. Epidemiology, biostatistics and public
health, 10, e8854. doi:10.2427/8854.
Nosek, B. A. (2007). Implicit-Explicit Relations. Current Directions in Psychological
Science, 16(2), 65–69. doi : 10.1111/j.1467-8721.2007.00477.x.55.
Nozick, R. (1974). Anarchy, State and Utopia. Oxford: Blackwell.
Ogden, J. (2016). Do no harm: balancing the costs and benefits of patient outcomes in
health psychology research and practice. J Health Psychol, x, 1-13.
doi:10.1177/1359105316648760
79
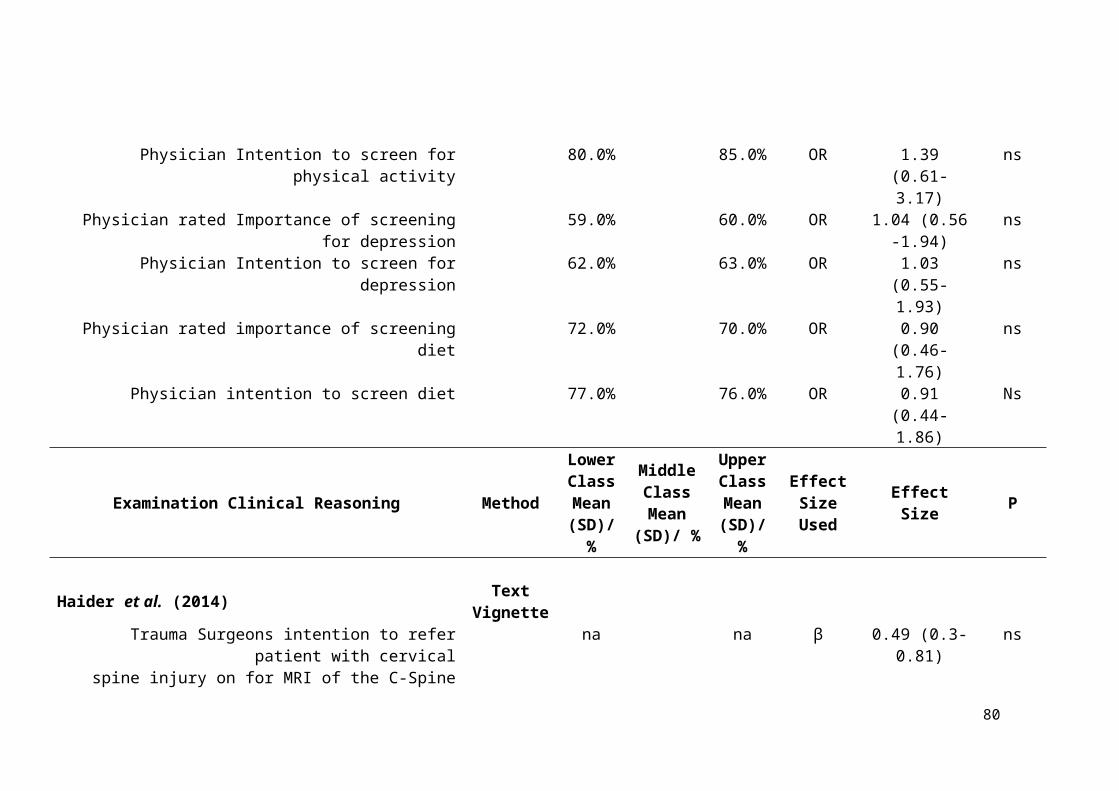
Orme-Smith, A., & Spicer, J. (2001). Ethics in General Practice: a practical handbook
for personal development. Oxon: Radcliffe Medical Practice Ltd.
Peacock-Brennan, S. & Harper, D. (2015). Improving Public Discussion About
Inequality. London: Psychologists Against Austerity.
*Pendelton, D. A., & Bochner, S. (1980). The Communication of Medical Information in
General Practice Consultations as a Function of Patients’ Social Class. Soc, Sci, &
Med, 14, 669-673. doi:10.1016/S0271-7123(80)80077-0
Peppin, P. (1994). Power and Disadvantage in Medical Relationships. Texas Journal of
Women and the Law, 3, 222-262. pmid:11660410
Pettigrew, T. F., & Meertens, R. W. (1995). Subtle and blatant prejudice in Western
Europe. European Journal of Social Psychology, 25(1), 57–75.
doi:10.1002/ejsp.2420250106
Pickett, K. E., & Wilkinson, R. G. (2010). Inequality: An underacknowledged source of
mental illness and distress. British Journal of Psychiatry, 197(6), 426–428. doi:
10.1192/bjp.bp.109.072066
Piff, P. K. (2014). Wealth and the Inflated Self: Class, Entitlement and Narcissism.
Personality and Social Psychology Bulletin, 40(1), 34-43. doi:10.1177/0146
167213501699.
Poortinga, W., Dustan, F. D., & Fone, D. L. (2008). Health Locus of Control Beliefs and
Socio-Economic Differences in Self-Rated Health. Preventative Medicine, 46,
374-380. doi: 10.1016/j.ypmed.2007.11.015
Powell, L. M., Slater, S., & Chaloupka, F. J. (2004). The Relationship Between
Community Physical Activity Setting and Race, Ethnicity and Socioeconomic
Status. Evidence-Based Preventative Medicine, 1(2), 135-144.
80

Prout, H. T., & Frederickson, A. K. (1991). Sex Bias in Clinical Judgment among
School-Psychologists. Psychology in the Schools, 28(3), 226–229.
doi:10.1002/1520-6807(199107)28:3<226::AID-PITS2310280307>3.0.CO;2-#
Roberts, K. (2001). Class in Modern Britain. Basingstoke: Palgrave.
Roemmich, J. N., Epstein, L. H., Raja, S., Yin, L., Robinson, J., & Winiewicz, D.
(2006). Association of access to parks and recreational facilities with the physical
activity of younger children. Preventative Medicine, 43, 437-441. doi:
10.1016/j.ypmed.2006.07.007.
Rosenthal, D. A., & Berven, N. L. (1999). Effects of client race on clinical judgment.
Rehabilitation Counseling Bulletin, 42, 243–265
Rosenthal, R. (1994). Parametric measures of effect size. In H. Cooper & L. V. Hedges
(Eds.), The Handbook of Research Synthesis (pp.231-244). New York, NY: Sage
Rothschild, B., & Rand, M. (2006). Help for the Helper: The Psychophysiology of
Compassion Fatigue and Vicarious Trauma. London: WW Norton & Co.
Russell, A. E., Ford, T., & Russell, G. (2015). Socioeconomic Associations with
ADHD: Findings from a Mediation Analysis. PLoS ONE, 10, e0128248.
doi:10.1371/journal.pone.0128248
Santelli, J. S., Lowry, R., Brener, N. D., & Robin, L. (2000). The association of
sexualbehaviours with socioeconomic status, family structure, and race/ethnicity
among US adolescents. Am J Public Health, 90, 1582 – 158. pmcid: PMC1446372
Sapolsky, R. M. (2005). The Influence of Social Hierarchy on Primate Health. Science,
308, 648–652. doi:10.1126/science.1106477
81

Schnittker, J., & McLeod, J. D. (2005). The social psychology of health disparities.
Annual Review of Sociology, 31, 75-103.
doi:10.1146/annurev.soc.30.012703.110622
Shavers, V. L. (2007). Measurement of Socioeconomic Status in Health Disparities
Research. Journal of National Medical Association, 99(9), 1013-1023.
pmcid:PMC2575866.
Singh-Manoux, A., Adler, N. E., & Marmot, M. G. (2003). Subjective social status: Its
determinants and its association with measures of ill-health in Whitehall II study.
Social Science and Medicine, 56, 1321-1333. doi:10.1016/S0277-
9536(02)00131-4.
Skeggs, B. (2005). Class, Self and Culture. London: Routledge.
Smail, D. J. (2005). Power, interest and psychology: Elements of a social materialist
understanding of distress. Ross-On-Wye: PCCS Books.
Smith, L. (2005). Psychotherapy, classism, and the poor: Conspicuous by their absence.
American Psychologist, 60 (7), 687-696. doi:10.1037/0003-066X.60.7.687
Snyder, P., & Lawson, S. (1993). Evaluating results using corrected and uncorrected
effect size estimates. Journal of Experimental Evaluation, 61, 334–349.
doi:10.1080/00220973.1993.10806594.
Spencer, S., Clegg, J., & Stackhouse, J. (2013). Language, social class and education:
listening to adolescents perceptions. Language and Education, 27 (2), 129-143.
doi: 10.1080/09500782.2012.760585.
Stolte, J. F. (1994). The context of satisficing in vignette research. Journal of Social
Psychology, 134, 727-733.doi:10.1080/00224545.1994.9923007.
Surbone, A. (2005). Cultural Competence: Why? Ann Oncol, 15, 697-699.
pmid:15111334.
82

Surbone, A. (2008). Cultural Aspects of Communication in Cancer Care. Support Care
Cancer, 16, 235-240.doi:10.1007/s00520-007-0366-0.
Thompson, B. (2006). Research synthesis: Effect sizes. In J. L. Green, G. Camilli, &
Patricia B. Elmore (Eds.), Handbook of complementary methods in
educational research (pp.583–603). Mahwah, NJ: Erlbaum
* Thompson, M., Diestelmann, J., Cole, O., Keller, A., & Minami, T. (2014). Influence of
social class perceptions on attributions among mental health practitioners.
Psychotherapy Research: Journal of the Society for Psychotherapy Research,
24(6), 640–50. doi:10.1080/10503307.2013.873556
Toporek, R. L. (2013). Social Class, Classism, and Social Justice. In W. M. Liu (Ed.) The
Oxford Handbook of Social Class in Counseling (pp.21-35). New York, NY:
Oxford University Press
Tyron, G. S. (1989). The Therapist Personal Reaction Questionnaire: A cluster
analysis. Measurement and Evaluation in Counselling and Development, 21,
149-156. eric:EJ390300
U.S. Department of Health and Human Services (2000). National Health Interview
Survey. Washington, DC: Author
U.S. Department of Health and Human Services (2003). 2003 HHS Poverty Guidelines.
Washington, DC: Author
Vacha-Haase, T., & Thompson, B. (2004). How to estimate and interpret effect
sizes. Journal of Counseling Psychology, 51, 473-481.
*van Ryn, M., & Burke J. (2000). The effect of patient race and socio-economic status on
physicians’ perceptions of patients. Social Science and Medicine, 50, 813-823.
pmid:10695979
83

Vanneman, R. D. (1980). U.S. and British Perceptions of Class. American Journal of
Sociology, 85 (4), 769-790. doi: 10.2307/2778706.
Weiner, S.J., Schwartz, A., Weaver, F., Goldberg, J., Yudowsky, R., Sharma, G., …
Abrams, R. I. (2010). Contextual errors and failures in individualising patient
care: a multicentre study. Annal of Internal Medicine, 153 (3), 69-75.
doi:10.7326/0003-4819-153-2-201007200-00002
Wilkinson, R. (1996). Unhealthy Societies: The Afflictions of Inequality. Routledge:
London
Wilkinson, R. (2000). Deeper than neo-liberalism: a reply to David Coburn. Social
Science and Medicine, 51, 997-1000. pmid:11005386.
Wilkinson, R., & Pickett, K. (2009). The spirit level: Why greater equality makes
societies stronger. London: Penguin.
*Williams, R. L., Romney, C., Kano, M., Wright, R., Skipper, B., Getrich, C. M., …
Zyzanski, S. J. (2015). Racial, gender, and socioeconomic status bias in senior
medical student clinical decision-making: a national survey. Journal of General
Internal Medicine, 30 (6), 756-767. doi:10.1007/s11606-014-3168-3.
Zimmerman, C., Del Piccolo, L., & Finset, A. (2007). Cues and concerns by patients in
medical consultations: a literature review. Psychological Bulletin, 133 (3), 438-
463. doi:10.1037/0033-2909.133.3.438
84

Part Two
The Impact of Social Class Bias on Psychological and Psychotherapeutic Practitioners’ Clinical Reasoning
85

Abstract
Objective:
To explore the impact social class biases may have on the treatment of clients by
psychological and psychotherapeutic professionals in Britain.
Design:
A cross-sectional on-line study among 156 psychological and psychotherapeutic
professionals working in the NHS incorporating a comparison between two groups -
video vignettes representing ‘lower’ and ‘upper’ class clients.
Methods:
The video vignette depicted a psychological assessment session of a client who had been
referred by his general practitioner after incidences involving deliberate self-harm. The
accent and dress of the client were varied. Study participants completed measures of
clinical reasoning relating to diagnosis, risk and treatment, measures of their awareness of
the influence of social class on their work and a social class brief implicit association test.
Results:
Within the context of this study participants tended not to discriminate against clients in
relation to their class. However, they believed that a ‘lower-class’ client was more likely
to receive an ‘alcohol or substance misuse’ diagnosis (p= .002; d=0.40). They also scored
the ‘lower-class’ client as more motivated to make changes (p=.032; d=.29). Seeing a
‘lower-class’ client resulted in significantly higher scores indicating participants
reflection on personal conflicts relating to their own social class and the impact such
biases may have on their work.
86

Conclusions
There was no general pattern of discrimination against clients in relation to their social
class. This may be due to client class cues priming the psychologist to reflect on their
position.
Practitioner Points:
Training and professional development for Psychological and Psychotherapeutic
Professionals in ways to raise awareness of their personal beliefs about social
class may help reduce class bias.
Working with clients such professionals perceive to be a ‘lower’ class allows them
to reflect on these personal beliefs.
87
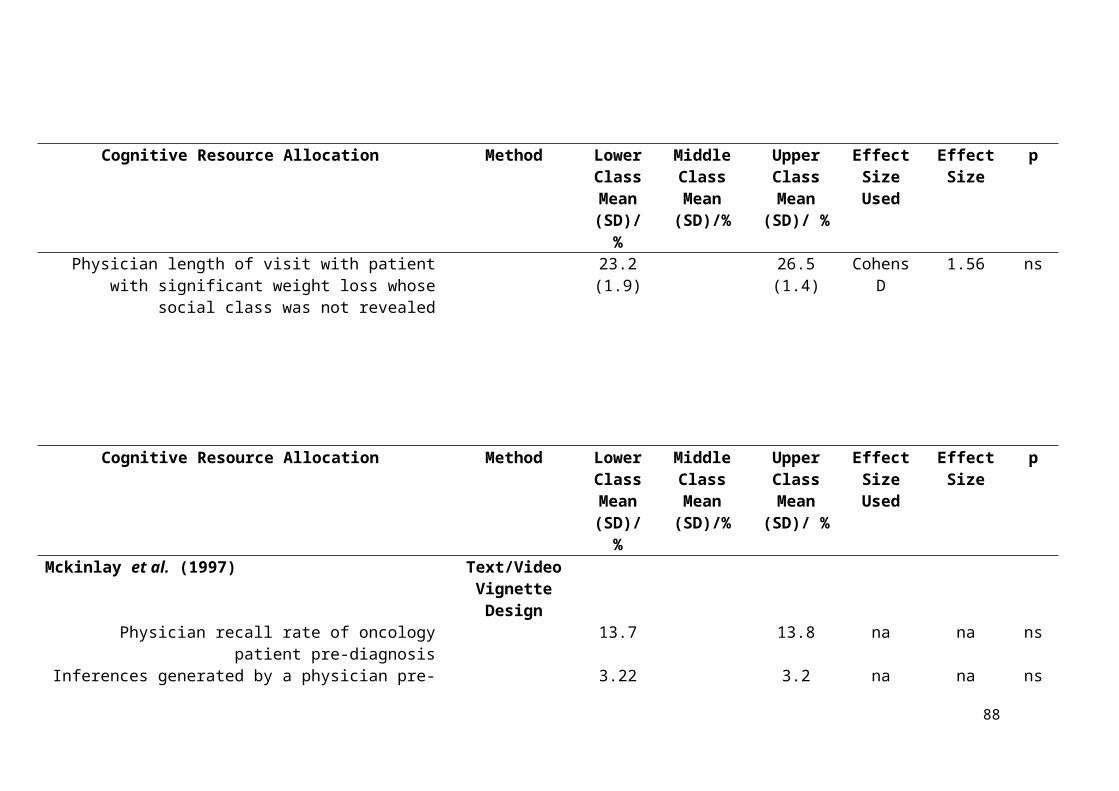
Introduction:
This paper examines the extent to which social class biases influence British
psychological and psychotherapeutic professionals, within the National Health Service
(NHS), and how this may impact the clients who use their services. This introduction
starts by orientating the reader to the relatively understudied field of class within the
psychological professions in Britain, highlighting the difficulties of defining British social
class and the trajectories of social class bias (Balmforth, 2009; Bennett, 2012a, 2013; Liu,
2011; Tyler, 2008). It goes on to consider how such biases may impact therapeutic
professions, and the methodologies used to explore them. This leads to the main
hypothesis that British psychological and psychotherapeutic professionals will be
susceptible to discrimination against ‘lower-class’ clients in relation to their clinical
reasoning.
It has been suggested that modern psychological research in Britain has only a
sporadic engagement with ‘social class’ (Balmforth, 2009; Peacock-Brennan & Harper,
2016), although there is a larger research base within America (Kraus & Stephens, 2012;
Liu, 2011; Piff, 2014; Spencer & Castano, 2007). Balmforth (2009) found in a
qualitative study that British therapists and clients of different social classes felt there was
a decreased likelihood of being understood, a lack of awareness and connection, and an
increase in discomfort due to the imbalance of power related to social class. However,
Ladany and Krikorian (2013) noted that research into such therapeutic mechanisms and
their relationship with social class in general remains relatively unrefined. Research
related to those classism has not been engaged within psychological, mental health and
psychotherapeutic fields to the same extent of other areas of bias such as race, ethnicity
and sexuality (Blacksher, 2008; Liu, 2011; Smith, 2005). There has been research in areas
whichcorrelate with class. For example, ethnicity, education, poverty, occupation and
88

health status but the extent to which these ‘correlates’ actually capture class is not clear
(Braverman et al., 2005; Keister, 2000; Krieger, Williams & Moss, 1997)
One possible reason for the lack of research on class bias ‘contentious nature’ of
defining a person’s social class in modern Britain (Bennett, 2013). This is complicated by
the concept of ‘social mobility’ (Saunders, 2002; Tyler, 2008), which has led to the
development of an ‘increasingly hard to define’ or ‘hegemonic’ British ‘middle-class’
(Hollingworth & Williams, 2009; Stanwell-Smith, 2014). When a construct, such as
social class, is studied what is observed depends on how it is measured and defined
(Macintyre, McKay, Der, & Hiscock, 2003). Traditionally, lower social class has been
defined by lower educational attainment, income and occupational standing as well as
inferior social ranking (Gallo & Matthews, 2003; Lareau, 2003). Being ascribed a ‘lower-
class’ label can result from of physical illness or mental health difficulties through a
process of ‘downward mobility’ (Hudson, 2005). However, indicators such as educational
attainment, occupation and income do not represent the multifaceted nature of social
class, which is dependent on subtle forms of differentiation based upon individuals’
preferences and interactions (Bennett, 2012a). This therefore makes ‘measuring class’
complex (Macintyre et al., 2003). For example, in health research some have argued that
asking individuals what they subjectively perceive their ‘social class’ to be is a better
indication than using objective markers of class (e.g. wealth or occupation) because
individuals classify themselves via an aggregation of the complex factors associated with
class (Lau, Cho, Chang & Huang, 2013; Singh-Madoux, Adler & Marmot, 2003;).
However, many empirical research studies still use ‘objective’ markers such as education
or occupation as proxies for class regardless of their limitations (Krieger et al., 1997;
Braverman et al., 2005).
89

It has been argued that an individual’s social class can be conceptualised as their
‘symbolic capital’ within society (Bordieu, 1990) and that economic or occupational
status does not solely represent this ‘capital’ (Bordieu, 1994). Rather ‘tastes’ or ‘values’
often distinguish a group based on their preferences (Bordieu, 1984). This might include
a person’s interests or hobbies, or distinctions based upon innocuous variations such as
dress (Bennett, 2012a) or speech (Bennett, 2012b; Doss & Gross, 1994). These variations
thus become visual or auditory resources to conceptualise and categorise individuals in
society in relation to their ‘social class’ in Britain (Bennet, 2013; Law & Mooney, 2012;
van Leeuwen, 2008). Certain accents are seen as indicating poorer, less educated and
lower status people than other accents (Bennett, 2012a, 2012b; Luhman, 1990). However,
accents seen as more educated and status possessing may also be seen as negative in that
they can be perceived as pompous and alienating (Liu, et al., 2004a, 2004b; Spencer,
Clegg & Stackhouse, 2013). Such perceptions can subtly change the way a person thinks
about and interacts with another (Beal, 2009). Distinctions based upon accent can become
a heuristic for individuals to stereotype people in relation to the complex factors
associated with class (Elias, 2012; Law & Mooney, 2012), and act as a basis of
distinguishing between ‘us and them’ (Southerton, 2002).
Many individuals are discriminated against on the basis of class (Lott, 2002).
Tyler (2008) reports that middle-class perceptions in Britain of lower-class involve a
‘disgust response’ where individuals of lower-classes are vilified (Tyler, 2008). The
rhetoric around ‘social mobility’ and ‘meritocracy’ (Binswanger, 2006; Saunders, 2002)
is suggested to lead to perceptions of a ‘feckless poor’ (Tyler, 2008). Leondar-Wright
and Yeskel (2007) described how members of dominant middle and upper-class groups
tend to believe themselves to be more intelligent, articulate, superior and deserving of
success compared to lower-class counterparts. They are also more likely to stereotype
90
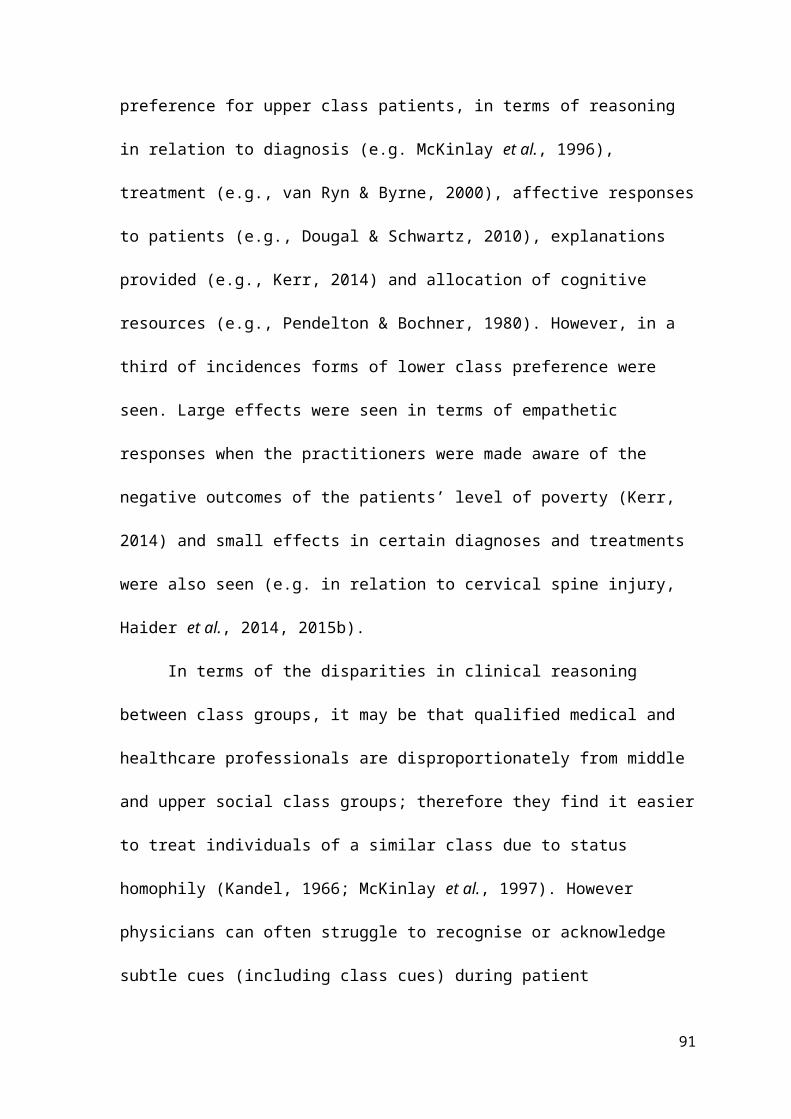
someone from a ‘lower social class’ as ‘criminal’ or an ‘alcohol and drug user’ (Hoyt,
1999). It has been argued that despair caused by classism and discrimination can lead to
substance misuse, mental illness, antisocial behaviour and in extreme cases homicide
(Chen & Paterson, 2006; Elliot, 2016; Liu, 2011).
There is a complex interaction between class, poverty, bias and health status
(Elliott, 2016); class discrimination can become internalised (Bennett, 2012a; Liu, 2011).
Individuals may blame their ‘personal failings’ if they have not achieved markers of
higher social class (occupation, finances, etc.), when in fact it is societal disadvantage
makes this less likely (Leondar-Wright & Yeskel, 2007; Peacock-Brennan & Harper,
2016; Smith & Redington, 2010). This may maintain a belief that ‘my poverty is
deserved’ and can lead to perceptions of powerlessness and feelings of shame (Bennett,
2012a; Coburn, 2015; Smail, 2005). In countries, such as Britain, where there is growing
socioeconomic inequality, social divisions have become more marked (Coburn, 2015;
Wilkinson & Pickett, 2009; Peacock-Brennan & Harper, 2016) thus perpetuating bias and
marginalisation (Miller, 2001).
Understanding of one’s assumptions, paradigm and intentions, including being
mindful of the impact of social class on one’s clinical work, is important for clinical
psychologists and psychotherapists (Roysircar, 2008; Toporek, 2013). There has been a
call for greater research engagement within the psychological and psychotherapeutic
professions in the area of social class (Ladany & Krikorian, 2013; Liu, 2011, 2013;
Smith, 2009). It has been argued that this research should include, determining links
between social class and psychotherapy process and psychotherapy outcome (Falconnier,
2010), as well as considering to what extent social class bias exists and perpetuates
inequality within the profession in general (Ladany & Krikorian; 2013; Liu, 2011, 2013)
and across training programs (Miller, Miller & Stull, 2007). This seems particularly
91

pertinent due to inequality’s direct relationship with mental health difficulties within
modern Britain (Elliot, 2016) and the barriers to accessing mental health services due to
‘classed’ factors (Peacock-Brennan & Harper, 2016).
Many areas of the psychological or psychotherapeutic profession require
reflection on the dynamics of the professional-client relationship (Burnham, 2005; Sue &
Sue, 2008); emphasis is placed on nonjudgementality, understanding the role of diversity
and becoming aware of personal biases (Ancis & Landany, 2010) and privileges (Curry-
Stevens, 2007). This is so the practitioner can appreciate the differences between the
clients they work with and be mindful of potential biases which may negatively impact
their clinical work. A recent review (Vlietstra, 2015) highlighted biases within the
psychological professions in relation to clients’ sexuality, race and gender which
impacted: the willingness to work with a client (Eubanks-Carter & Goldfried, 2006), the
treatments recommended (Kales et al., 2005), diagnosis (Mikton & Grounds, 2007),
prognosis (Kales et al., 2005) and perceptions of risk and violence (Abreu, 1999).
Healthcare practitioners are often viewed making clinical decisions based on ‘medical
facts’ or ‘evidence.’ However, these decisions can be influenced by personal biases and
are then legitimised because of being framed within ‘objective’ scientific, medical or
psychotherapeutic ‘models’ (Anspach 1988; Atkinson, 1994; Hughes & Griffiths, 1996).
Social class bias is likely to influence therapeutic work (Ballinger & Wright,
2007), similar to the other areas of bias mentioned above. For example, therapists might
struggle with internalised classism (Liu et al., 2004a) or feel challenged by difficult
countertransference reactions (Aronson, 2006; Balmforth, 2009; Ladany & Krikorian,
2013).. A recent review showed class biases to have had direct impact on the treatment of
patients across a range of healthcare professions (Vlietstra, 2017). In this review, only
two studies were found to have measured psychological/ psychotherapeutic practitioner
92
classism in America and its impact on clinical decision making. Both manipulated class
within their respective vignette designs and assessed participants’ clinical reasoning.
Thompson, Diestelmann, Cole, Keller and Minami (2014) manipulated financial and
occupational cues (e.g. administrative assistant vs. chemist). Dougal and Schwartz (2011)
manipulated similar cues alongside education (high school vs. degree level) and hobbies
(bowling vs. golfing). Dougal and Schwartz’s (2011) participants perceived ‘upper-class’
clients as more dominant with milder difficulties across video vignettes, while Thompson,
et al. (2014) reported no significant differences.
Vignette methodologies may not accurately reflect power differentials,
complicated interpersonal situations, emotionality, or contextual pressures of therapeutic
work (Lopez, 1989; Stolte, 1994). Lau et al. (2013) outline how the difficulty of studying
the impact of class is partially due the effect of variables which have correlations with
social class (e.g. income, education, ethnicity, occupation and health status) (Braverman
et al., 2005; Keister, 2000). Therefore, they suggest that vignette methodology allows
maximum control of cues related predominantly to social class. However, in the vignettes
used by these two studies the variation of income or occupation as a proxy for class
means that the subtler cues for measuring class differences may not be captured. For
example, the proxy of income may be ‘tied up’ with cues about nutrition, housing, and
recreation (Shavers, 2007; Lau et al., 2013). It also does not account for how/where the
wealth is spent and level of expenditure compared to income (Lau et al., 2013). Also, the
correlation between wealth/income and other objective markers of class, e.g. occupation,
is low (Braverman, et al., 2005). An additional limitation for both studies is that they did
not fully balance the valence (positivity, threat, emotionality) of their upper and lower-
class stimuli. For example, in Dougal and Schwartz’s (2011) study they manipulated the
clients’ salary in the vignette stimuli, therefore the upper-class condition contains the
93

value $150,000 per year which is inherently more positive and lucrative than the patient
with a $20,000 salary. Using wage as a method to differentiate class in the vignettes
confounds the experiment because one of the values used is inherently positive.
A major aim of the present study was to examine how perceptions of clients based
upon their social class might influence clinical reasoning amongst British clinical
psychologists and psychotherapeutic professionals. Within British society there is
evidence that individuals are discriminated against in relation to their social class (Lott,
2002; Tyler, 2008) and this can impact their level of wellbeing (Liu, 2011). The impacts
of social class biases have been described in other health care professions, predominantly
in American settings (Vlietstra, 2017). Distinctions made in relation to patient social class
have small-large effects upon clinical reasoning in relation to diagnosis, treatment and
affective response to patients, dependent upon the type of professional, illness presented
and setting. However, due to the onus on developing awareness of potential biases in
clinical psychology and psychotherapeutic training programs (Ancis & Landany, 2010;
Boysen & Vogel, 2008; Burnham, 2005) there may be a possibility that a professionals’
clinical training or egalitarian beliefs may enable them to override their implicit biases
through their own self-awareness (De Houwer & Moors, 2007) so the present study aimed
to measure these.
One of the difficulties in measuring reactions to social classes is that these are
often unconciously enacted (Aronowitz, 2004; Skeggs & Wood, 2004), therefore there
has been a call for understanding the impact of such bias through ‘priming’ and ‘implicit’
methodologies (Dougal & Schwartz, 2011; Lau et al., 2013; Liu, 2011, 2013).
Psychologists have theorised that implicit biases must be a key component in societal
inequalities (Chugh, 2004; Rudman, 2004). Many have argued the most robust measure
for studying implicit attitudes is Greenwald, McGhee and Schwartz’s (1998) Implicit
94

Association Test (IAT) (Banaji & Greenwald, 2013; Greenwald et al., 2009; Wittenbrink,
2007). This claim is not without healthy debate and criticism (see Oswald, Mitchell,
Blanton, Jaccard & Tetlock, 2013; Shanks, 2016). IATs are response interference tasks,
which assess automatic associations. IATs measure the response time used to pair
evaluative stimuli (‘positive’/‘negative’) with the concept that is being investigated (e.g.
‘male’/’female’). The faster the response time, the more congruent the pairing is with
implicit assumptions. The dominant view is that an IAT effect represents bias towards a
certain group (Nosek, 2007; Tetlock & Mitchell, 2009) and can be predictive of real-
world behaviour (Roccato, & Zogmaister, 2010; Rooth, 2010). Other plausible
explanations suggest it represents culturally available stereotypes (Arkes & Tetlock,
2004). Additionally, outcomes of IAT research are frequently applied to legal and
government frameworks (Levinson, Young & Rudman, 2012). A brief version of the
implicit association test (BIAT) has been developed and the test output has been shown to
significantly correlate with the longer IAT equivalent (e.g. r=.68, p<.001) (Sriram &
Greenwald, 2009).
There is limited research on implicit class bias using the IAT. Haider et al. (2011,
2014, 2015a, 2015b) have developed a research framework looking at class biases within
the medical professions, using clinical vignette and an IAT. Across the studies their
participants have shown an implicit preference for upper-class stimuli. However, while
implicit bias was present, it did not directly impact clinical reasoning apart from in a few
areas. Significant biases were seen in relation to surgical nurses’ perceptions a patient
would understand their operation (Haider et al., 2015a), and acute care surgeons’
likelihood of obtaining medical scans for cervical spine injury (Haider et al., 2015b). This
research has similar limitations to the vignette studies in that there was a lack of balanced
valence in their IAT stimuli. The stimuli they developed to measure upper-class
95

preference was inherently positive (privileged, wealthy) and inherently negative for
lower-class stimuli (uneducated, poor). Therefore, preference may have been a due to the
‘wealth’ and ‘education ‘themselves rather than their association with social class. The
current study draws on a similar epistemological framework to Haider et al. (2011, 2014,
2015a, 2015b) but using IAT stimuli with counterbalanced valence. Previous research by
the current authors (using counterbalanced visual stimuli) found that the average IAT
effect size for social class bias in Britain was considerably stronger than those typically
reported in other domains of bias, such as race and gender, and was consistent with those
found in American class bias research (Vlietstra, Peel & McNamara, Under Review).
Overall the onus needs to be placed on subtly manipulating class cues, and
understanding the way participants’own social class, their levels of implicit class biases
and awareness of these biases impact clinical reasoning and this will be addressed in the
current study. Therefore, the IAT was applied alongside vignette methodology to assess
the impact social class biases have on British NHS psychological professionals’ clinical
reasoning.
Main Hypotheses
1. There will be a significant difference between the responses of participants
assessing a ‘lower-class client’ compared to ‘upper-class client’ in terms of:
Lower allocation of cognitive resources (e.g. time spent formulating the
client’s difficulties) to the ‘lower-class’ client.
Clinical reasoning in relation to the client (e.g. severity, risk, diagnosis,
treatment).
2. IAT scores will be significantly greater than zero indicating that participants hold
a significant ‘upper-class’ implicit bias.
96

3. Discrimination against the ‘lower-class’ client will be greater when there is more
implicit class bias, lower levels of class awareness and higher self-categorised
social class. That is, these variables will moderate the effect of the social class
manipulation.
Design
A cross-sectional experimental design was employed in this online study. Comparison
was between-subjects with two conditions: ‘upper social class’ vignette vs. ’lower social
class’ vignette.
Participation
An opportunity sample of NHS psychotherapeutic and psychological professionals and
those in training was obtained. Prequalified staff (e.g. assistant psychologists) were
included in the sample to provide an understanding of the views across all levels of the
profession. Some were recruited through NHS trusts, while others were recruited via
advertisements at associated training centres, conferences and social media accounts.
Private practitioners were not included as they may have different time constraints,
pressures and resources, therefore may approach clinical reasoning differently (e.g.
Margallo-Lana et al., 2000). To ensure participants had assimilated cues of British class,
they were required to be a British citizen living in Britain since the age of five years. This
age cut-off was chosen as British children’s ability to discriminate in relation to social
status tends to become present around the age of four (Ruck & Tenenbaum, 2014).
Sample size calculations suggested that a minimum sample size of 156
participants was required. The calculation was based on the effect estimate from a study
by Dougal and Schwartz (2011) which was the only psychotherapeutic class-bias study,
to the author’s knowledge, to report an effect. They reported that for the dependent
variable of severity of client difficulties (clinical reasoning) d=0.45. Therefore, for our
97

sample size calculation we aimed for a power of 0.8 to detect a difference between means
with an effect of d=0.45, with a 2-tailed test and alpha = 0.05. A priori calculation using
G*Power 3.1.7. (Faul, Erdfelder, Land & Buchner, 2007) resulted in the minimum sample
size of 156.
Measures, Stimuli and Apparatus:
Video Vignette:
A five-minute video vignette with two conditions (upper-class client/lower-class client)
was embedded into the on-line survey to be presented to participants. It was framed as an
assessment session of a client in his mid-twenties; the type of service and the client’s
mental health presentation remained ambiguous. The participant received the following
information:
“David White is a 25 year old white British male from London. He was referred to
psychological services by his GP.
In the GP’s letter, it stated that David had punched through a window in his flat and this
required a visit to A&E due to the severity of the cuts. When removing the stitches the GP
was concerned by David’s presentation and description of difficulties…”
Ambiguity within the presentation of clinical symptoms increases the likelihood
of the participant relying on stereotypes (Darly & Gross, 1983; McConahay, 1986);
vignettes that use a mixed clinical presentation have been found to increase such reliance
(Kales et al., 2005). Ambiguity was created in the script by using symptoms, which are
diagnostically similar across mental health disorders in the DSM V (APA, 2013). (See
Appendix A). This script was independently analysed by two qualified clinical
psychologists and two trainee clinical psychologists, who agreed the transcript seemed
accurate and was clinically ambiguous. They unanimously provided a ‘forced choice’
diagnosis of ‘depressive disorder.’
98

Previous studies have manipulated social class by inadvertently using inherently
positive stimuli for upper-class and inherently negatively for lower-class stimuli (Dougal
& Schwartz, 2011; Haider et al., 2011). In the present study, only the dress (Bennet,
2013; Hayward & Yar, 2006; Tyler, 2008) and accent (Beal, 2009; Bennett, 2012b; Doss
& Gross, 1994; Luhman, 1990; Spencer et al., 2013) were altered to elicit class cues. This
was significantly likely to elicit British social class stereotypes (Law & Mooney, 2012) in
a subtle way which utilizes both verbal and visual cues of social class (van Leeuwen,
2008). This meant that areas which do not index class, but correlate with it, remained
absent (See Lau et al., 2013). The script and performance were as similar as possible in
terms of emotionality, pacing and valence (See Figure 1). Additionally, the actor
employed a Stanislavskian framework when approaching character development,
rehearsal and performance which allowed the ‘motivations,’ ‘physicality’ and ‘essence’
of the character to remain as similar as possible although the accent changed (See
Stanislavski, 1936/1988, 1961).
Figure 1: Visual Similarities between Video Vignettes
99

The above two stills represent each social class vignette paused at the same place within
the script. The left image depicts the ‘Lower-Class’ client and the right depicts the
‘Upper-Class’ client. For the full video (including accent manipulation) please see:
Upper-class Condition: https://www.youtube.com/watch?v=_kuREQGFWRs
Lower-class Condition: https://www.youtube.com/watch?v=L7OqBKN0hIY
Cognitive Resource Task:
Cognitive resources are units which are based on perceived worthiness or utility, for
example the amount of time spent in consultation with a client, or the amount of time
spent thinking about a client (Arber et al.,2006; Kerr, 2014; McKinlay et al., 1997). One
way this was assessed in the project was in the dropout rate when being presented with
either the upper or lower-class condition video. Additionally, participants were asked to:
“Tell us in your own words what you believe David’s difficulties to be. If you feel it is
necessary, please provide a brief formulation and information about any potential
treatment recommendations.”
Cognitive resource outcome measures were: amount of ‘time taken’ and ‘amount of
words/characters used’ for the formulation.
Clinical Reasoning task:
A 23-item visual analogue scale (VAS) relating to areas of clinical reasoning was
developed based on those used within previous studies (e.g. Eubanks-Carter & Goldfried,
2006; Gushue, 2004). The main outcome measures could be clustered into four
categories: Severity, Diagnosis, Risk and Treatment. For each item participants
completed sliding VAS (between 0-100). In terms of severity participants were asked to
rate their perceived seriousness of the client’s difficulties (0 not serious, 100 very
serious). In terms of diagnosis participants were asked to rate the perceived likelihood (0
very unlikely, 100 very likely) the client would receive diagnoses from 8 clusters of the
100

DSM V (APA, 2013) and were then asked to assign the most likely primary diagnosis.
Participants then answered three questions around: level of risk (0 no risk, 100 high risk);
causing harm to self; harm to others and potential to have a future suicide attempt. Next,
participants answered three questions in relation to suitability for treatment (0 no need,
100 high needs). This included views on medication, psychological treatment and
hospitalisation. Then three questions about therapeutic engagement (0 very unlikely, 100
very likely): ability to develop therapeutic relationship, motivation for change and ability
to improve with treatment. Finally, they rated the likelihood the client would benefit from
five different types of psychotherapy . See Appendix B for the full measure used.
Diversity Awareness:
Participants were asked to write down three areas of diversity they feel practitioners need
to be most aware of in clinical practice (and rank them 1 – 3, with 1 being the most salient
to them). This was to assess if social class was underrepresented compared to other areas
of diversity as is reflected in the research literature (Liu, 2013). This was expected to
indicate the participants’ awareness of class as a potential area for bias. Participants typed
their response into three ranked text boxes and these were then coded and tallied to create
normative data.
Class Awareness Scale:
At the time of designing the study, there were no specific measures of class awareness in
relation to clinical practice, to the author’s knowledge. However, two measures of general
awareness were quoted in the literature: Hayes, Gelso, VanWagoner and Diemer’s (1991)
Self Insight Measure and Larson et al.’s (1992) Awareness of Values Scale. These scales
have internal consistency of α=.71 and α=.62 respectively (Gelso, Fassinger, Gomez &
Latts, 1995; Mohr, Weiner, Chopp & Wong, 2009). These measures were too general to
tap into the specific nature of class bias and therefore 11 single item questions were
101

developed based upon the questions from these existing scales and general research on
awareness of difference/diversity (e.g. Beagan & Kumas-Tan, 2009; Burnham, 2005) and
missing dialogues in the psychotherapeutic and social class literature. An example would
be the existence of class based discussions in clinical supervision or formulation
(Falconnier, 2010; Ladany & Krikorian, 2013; Smith, 2009).
Participants were asked to rate their response on a sliding VAS (0 not at all like me, 100
completely like me), example items included:
“I am aware a client’s social class may elicit personal feelings” (based directly
upon Hayes et al., 1991).
“I have discussed a client’s difficulties in terms of their social class with my
supervisor” (based generally upon Smith, 2009).
See Appendix B for the full measure used.
Demographic Characteristics:
Participants were asked a set of demographic questions at the end of the experiment.
Questions to retrieve data based on the participants’ profession was derived from Agenda
for Change: NHS Terms and Conditions of Service Handbook (NHS Staff Council, 2016).
This included job title, pay scales/level of responsibility (‘NHS banding’), supervisory
status and length of NHS service. In terms of ‘social class’, participants were asked to
categorise themselves per their current social class and perceived childhood social class.
The term ‘underclass’ was included as a class group. Whilst this a pejorative term (see
Tyler, 2008), participants had defined themselves as such when describing their
‘childhood class’ in previous research (Vliestra et al., under review), and therefore was
included and collapsed into ‘working class’ during analysis. Participants were also asked
if they felt they belonged to a particular class group; this was to gauge participants’ views
of explicit class groupings or their perceived ‘place’ within society (See Sennet & Cobb,
102
1972; Skeggs & Wood, 2004). Questions of age, gender and ethnicity were adapted from
the British Household Panel Survey (Wave 6) (ESRC, 2009).
Brief Implicit Association Test:
A Brief Implicit Association Test (BIAT) was used to assess implicit class bias and was
presented as outlined by Sriram and Greenwald (2009). Participants were required to sort
pairings of words (‘Good’/’Bad’) and images (‘Upper-class’/‘Lower-class’) (See Figure
2). The BIAT has a training block (using stimuli of birds and animals) and then four
response blocks, two for each pairing condition (e.g. ‘Upper-class’- ‘Bad’ or ‘Lower-
class’ - ‘Good’). See Figure 2 for a visual representation of this process. The BIAT effect
is computed via the differences between reaction times taken to sort particular pairings.
BIATs tend to show an average internal consistency of α=.78 and highly correlate with
other implicit measures (Nosek, Bar-Anan, Sriram, Axt & Greenwald, 2014). The internal
consistency of the BIAT is derived from assessing the correlation between responses on
the first pairings and second pairings of response blocks (Nosek et al., 2014). The order
of
103
Figure 2. The BIAT Process
A visual diagram explaining the process of the BIAT. For further information please see
Appendix C.

the pairing presentation of blocks is counterbalanced between participants, to account for
practice and fatigue effects. It is argued that BIATs do not prime explicit measures (or
vice versa) therefore can be presented any place within a study without order effects
(Hofman et al., 2005a, 2005b).The current BIAT was based upon an IAT developed by
Vlietstra et al. (under review). Images were piloted so that pairs images were significantly
different in terms of class (lower/higher) but similar in terms of levels of positivity, threat
and emotionality. From this the BIAT was then developed by the project co-supervisor as
part of an undergraduate dissertation (unpublished).
Procedure:
Participants were recruited from NHS trusts, training sites and professional bodies/on-line
groups. Participants were recruited from five NHS trusts, four from the South East (also
covering London) and one from the East Midlands. In the first instance ‘in-trust sponsors’
were recruited via networking to represent the study within their trust (in line with
research and development policies). This was usually a head of psychology within each
trust. The in-trust sponsor then contacted each psychological/psychotherapeutic lead
within each trust via email to distribute the study. Additionally, each team within the
trusts (n= 550) were individually written to requesting participation (See Appendix C)
and provided with advertisement materials (e.g. posters, web links) (See Appendix D). In
addition to recruiting through the trusts, training course centres related to the above trusts,
forums, social media sites and professional bodies were contacted in a similar way to
advertise the project (e.g. using an online version of the poster).
Those who consented to participate and met the inclusion criteria then followed a web
link to an online survey created through Qualtrics software (Qualtrics, 2017), which was
presented as a study on ‘Clinical decision making’. Participants then completed the
104

experiment in the following order (The item order within each measure was randomised
where possible to account for order and fatigue effects):
1. Information sheet
2. Informed consent
3. Demographic information (bar class)
4. Video vignette (participants were assigned to ‘lower-class’ or ‘upper-class’
condition)
5. Cognitive resource task (timed formulation)
6. Clinical reasoning task
7. Diversity awareness task
8. Class awareness scale
9. Class demographic information
10. BIAT (stimuli counterbalanced between participants)
11. Debrief
Ethical Considerations
The project required approval from the University of Surrey. This included full ethical
consideration from the Faculty of Medical and Health Sciences Ethics Board, approval
from the Research Integrity and Governance Office.. After this was acquired approval
was requested and accepted from the Health Research Authority to distribute the project
to NHS staff. Then each of the five NHS trusts were contacted and their own Research
and Development processes were followed (See Appendix E). The research was
conducted in line with the British Psychological Society’s guidelines for on-line research.
Although unlikely, there was a possibility the video content could trigger a
distressing response in an individual. In line with best practice support lines/websites
were provided at the end of the study. Participants were deceived to the true nature of the
105
project within the first half of the study but were likely to have surmised it was about
social class once they got to the questions which focused on social class specifically.
Sharing the true nature of the study at the start might have influenced responses to the
vignettes; similarly, they would be less likely to be relying on implicit mechanisms. At
worst, this deception may have caused individuals to question their practice. The debrief
process was framed in such a way that the course of this experiment could be seen as a
learning process. As Burnham (2005) outlines, Psychologists and Psychotherapists
should be striving for ways to become aware of their biases and the impact they have on
their practice.
Scoring and Data Analysis:
For hypothesis one, the main outcome variables for the study (cognitive resource
allocation and clinical decision making) were compared between the two vignette groups
using analysis of variance. Assumptions for these models (particularly normality of the
distributions and homogeneity of variance) were examined and because of concerns about
normality, nonparametric equivalent tests were also conducted. Comparison with the
parametric test results enabled assessment of the robustness of the parametric results to
some non-normality of the data. The current study required multiple separate analyses.
Bonferroni adjustments were not applied due to the explorative nature of the research,
focusing on a relatively understudied concept (Armstrong, 2014; Perneger, 1988). This is
as the use of such adjustments would produce overly conservative results (Bland, 2000).
Participants’ BIAT results (implicit class bias) were scored using the accepted
‘improved’ scoring algorithm (Greenwald, Nosek & Banaji, 2003; Nosek et al., 2014;
Sriram & Greenwald, 2009), which gives a BIAT effect in terms of a D score. This has
been seen to substantially reduce method-related variance compared to Greenwald et al.’s
(1998) original algorithm (Back, Schmukle & Egloff, 2005). D scores can range from -2
106

to +2. In the context of this study, positive scores indicate a preference for the ‘higher-
class’ social group, and negative scores indicate a preference for the ‘lower-class’ social
group. For hypothesis two, a one sample t-test was used to compare the mean sample
IAT score to 0 to assess whether there was significant class bias.
To test hypothesis three, moderators were the added to the analysis of variance
models used to examine hypothesis one. Three potential moderators were considered:
personal social class, class awareness and implicit class bias. In addition to including any
outcome variables found to be significantly different from the analysis for hypothesis one,
two variables were chosen a priori to be analysed. They were participant perceptions of
‘severity of difficulties’ and the likelihood of the client ‘requiring hospitalisation’. This
was because these two variables could be conceptualised as combinations of factors
associated with ‘diagnoses’ and ‘clinical risk’ respectively, that are hypothesised to be
affected by class bias.
Results
Response Rate
Initially, 457 people proceeded to the screen to consent to participate in the study, but of
these 11 did not progress past the consent screen. An additional 77 were not eligible to
participate as they did not meet the inclusion criteria; 26 of these were not NHS
employees; 23 did not have a British Citizenship and 41 had not lived in Britain since the
age of five. Of the remaining 380 eligible participants, a further 224 dropped out, leading
to an overall response rate of 41%. Response rates from previous research on practitioner
bias (where reported) have ranged from 33% (Olfson, Zarin, Mittman & McIntyre, 2001)
to 61% (Bowers & Bieschke, 2005). Of the 224 who dropped out, 59.8% (n=134)
dropped out on onset of the video vignette stage, the remaining 40.2% (n=90) dropped
out before a ‘full dataset’ for the main hypothesis was completed. Comparing those who
107
proceeded beyond this stage to those who dropped out at this stage Pearson Chi-Square
showed that none of the demographic variables significantly related to drop out (e.g. age,
gender, level of seniority, supervisor status), neither did the social class of the client
displayed in the video. This provided a sample size of 156 for hypotheses one and three
for the study. This sample size exactly met the desired number of participants to achieve
reasonable statistical power (see methodology).
Of the 156 participants who completed the study far enough to test the main
hypothesis, and therefore were included in analysis, a further 40.3% (n=63) dropped out
at the start of the BIAT. This level of dropout is consistent with online based IAT studies
(Sabin, Rivara & Greenwald, 2008). Reasons for this may have included ‘genuine
dropout’, participants completing the study on their mobile phone, or using a computer
without JAVA updated. Therefore, for analysis involving BIAT data the sample was 93.
Characteristics of the Participants
The sample of 156 practitioners consisted of predominantly of white British, females with
‘middle-class’ backgrounds (See Table 1). The distribution of participants in relation to
gender, race and self-perceived class in the sample was similar to that of the distribution
of demographic details of those entering the Clinical Psychology Profession (See
Clearing House for Postgraduate Courses in Clinical Psychology, 2016). As would be
expected with randomisation, none of the demographic variables were significantly
different between vignette groups.
In terms of social class, no practitioners reported having an ‘upper-class
background,’ either currently or during their childhood. In terms of ‘social mobility’
47.2% (n=74) of participants felt they were now of a higher social class than in their
childhood, 45.9% (n=72) felt they had remained of a similar social class, and 6.9%
(n=10) felt that their level of social class had decreased. Participants who took part in the
108

study were predominantly from professions relating directly to Clinical psychology
(71.9%), with 22.5% as qualified Clinical Psychologists, 27.6% as Trainee Clinical
Psychologists and 21.8% Assistant Psychologists. The remaining practitioners were
21.1% Cognitive Behavioural Backgrounds (8.3% Cognitive Behavioural
Psychotherapist, 7.1% Psychological Wellbeing Practitioner (PWP), 3.8% Trainee PWP,
1.9% Trainee CBT Therapist), 2.5% Art Psychotherapists (e.g. art, dance, music) (0.6%
qualified, 1.9% in training), 1.3% Systemic or Family Therapist, and 1.2% Counselling
professionals (0.6% qualified councillor, 0.6% trainee counselling psychologist) and
1.9% other Psychotherapist. For information on Educational Level, NHS banding,
therapeutic experience and level of seniority (e.g. supervisory role) see Table 1.
109

110
Table 1.
Sociodemographic Characteristics of Participants
CharacteristicLower-Class
Vignette Group(n=79)
Higher-ClassVignette
Group (n=77)χ2 (df)/ t(df) p
Gender (% Female) 86.1% 83.10% 0.26 (1) .609
Average Age (Mean SD) 31.6 (8.6) 33.6 (9.6) -1.30 (154) .194
Age Distribution 2.57(2) .277
20-29 (% of sample) 53.2% 41.6%30-39 (% of sample) 35.4% 40.3%
40+ (% of sample) 11.4% 18.2%
Ethnicity (%BME) 10.1% 10.4% 0.00, (1) .957
Education Distribution 1.79(2) .408
Degree (or Equivalent) (% of sample) 24.1% 15.6%
Postgraduate Degree (Non-Doctoral) (% of sample) 38.1% 50.6%
Postgraduate Degree (Doctoral) (% of sample) 29.1% 33.8%
NHS Banding Distribution 2.06 (2) .358
Up to Band 4 (% of sample) 27.8% 18.2%Band 5-6 (% of sample) 40.5% 45.4%Band 7+ (% of sample) 31.6% 36.4%
Supervisory Role (% Yes) 34.7% 31.2% 0.16 (1) .689
Band 7+ (% of sample) 31.6% 36.4%
Supervisory Role (% Yes) 34.7% 31.2% 0.16 (1) .689
Average Years of Clinical Experience (Mean, SD)
6.3 (6.0) 7.6 (7.1) -1.21 (154) .194
Average Years of Clinical Experience (Mean, SD)
6.3 (6.0) 7.6 (7.1) -1.21 (154) .194
Years of Clinical Experience Distribution 1.55 (2) .4611-5 Years Experience (% of sample) 40.5% 41.6%
5-10 Years Experience (% of sample) 40.5% 32.5%
10+ Years Experience (% of sample) 19.0% 26.0%
Believe they belong to a 'Social Class' (% yes) 75.9% 70.1% 0.67(1) .413
Subjective Current Social Class Distribution 3.83 (3) .280

Comparisons of main outcomes between the ‘upper’ and ‘lower’ class vignette groups
Hypothesis one was that cognitive resources and clinical reasoning would vary depending
on the social class of the client in the video. For most outcomes, little difference was seen
between psychological and psychotherapeutic professionals’ clinical reasoning by client
social class (Table 2). There was no significant difference between whether participants
completed the study based upon the class of the client displayed in the video (χ2 (1,
n=379) =0.801, p=.459, v=.046). This was also the case for cognitive resource allocation,
diagnostic reasoning, perceptions of risk, and perceptions of treatment. Furthermore,
across both conditions clinical depression was deemed the most likely diagnosis the client
would receive (72.9%), followed by an anxiety disorder diagnosis (18.1%). The only
significant difference between groups was in terms of a client receiving a diagnosis of an
alcohol or substance misuse disorder, which was seen to be more likely in the lower-class
condition compared to the upper-class, (U=2165.5, z=-3.109, p=.002, d=0.40).
Additionally, in terms of treatment the client was perceived to be more motivated for
change if they were in the lower-class condition than the upper-class (U=2436, z=-2.147,
p=.032, d=.29). As previously mentioned, because most continuous outcomes were single
item and showed some non-normality (See Appendix F), nonparametric tests were also
conducted to check the robustness of the parametric analyses. P values for both analyses
were similar (Table 2).
Implicit Class Bias
Hypothesis two was that a significant implicit class bias would be found amongst the
participants. The mean BIAT D Score was found to be 0.06 (SD=0.45). Comparing this D
Score to 0 there was no statistical evidence of implicit class bias (t(92)=1.42, p=1.57,
111
d=0.21). However, there was a large range between strong upper-class preference to
strong lower-class preference (d= -1.08 to 1.31). Many participants’ reaction times were
much higher than expected for an implicit test (greater than ten seconds) (See Nosek et
al., 2014) perhaps suggesting participants were considering their responses rather than
answering immediately. In the BIAT scoring criteria, reaction times greater than 10
seconds are usually excluded from the analysis (Nosek et al., 2014). Doing this with the
current dataset resulted in 32.3% (n=30) of the BIAT
112

Table 2. Comparing the Main Study Variables between 'Higher' and 'Lower' Class VignettesLower-Class
Vignette Group(n=79)
Higher-ClassVignette Group
(n=77)Variable Mean (SD) Median Mean (SD) Median Cohens D t (154) p U p
Cognitive Resource Allocation
Number of Words Written 117.5 (91.2) 92.5 102.1 (85.2) 79.0 0.14 1.03 .306 2729.0 .268
Time Thinking about Client 477.6 (506.7) 377.133 402.8 (354.1) 265.0 0.13 1.09 .276 2679.0 .199
Diagnostic Reasoning
Seriousness of Client's Difficulties 58.7 (15.4) 60.0 61.9 (15.9) 61.5 -0.17 -1.18 .240 3341.5 .287Neurodevelopmental Disorder
Diagnosis 6.6 (14.3) 0.0 11.1 (19.1) 1.0 -0.23 -1.39 .167 3361.0 .215
Schizophrenia Spectrum Diagnosis 6.6 (14.3) 0.0 9.0 (16.3) 2.0 -0.13 -0.86 .389 3227.5 .481
Bipolar Disorder Diagnosis 16.4 (20.8) 4.5 17.7 (21.9) 7.0 -0.05 -0.28 .781 3130.5 .746
Depressive Disorder Diagnosis 81.9 (17.9) 85.0 77.4 (22.3) 82.0 0.19 1.26 .212 2711.5 .241
Anxiety Disorder Diagnosis 67.9 (25.4) 74.0 66.0 (23.4) 69.5 0.06 0.40 .691 2846.0 .488Substance-Related and Addictive
Disorder Diagnosis 40.4 (28.5) 39.0 26.9 (25.1) 18.0 0.40 3.15 .002** 2165.5 .002**
Borderline Personality Disorder Diagnosis 17.1(23.7) 3.5 18.8 (26.5) 4.0 -0.06 -0.36 0.716 3119.5 0.776
Antisocial Personality Disorder Diagnosis 9.0 (17.0) 0.5 6.6 (11.3) 0.5 0.13 1.04 0.301 3014.5 0.918
Note. ‘U’ denotes Mann Whitney U Statistic, * denotes significance p<.05, ** denotes significance p<.01
Lower-Class Higher-Class

Vignette Group(n=79)
Vignette Group (n=77)
Variable Mean (SD) Median Mean (SD) Median
Effect Size (Cohens D)
t (154) p U p
RiskCausing harm to self 79.0 (17.4) 80.0 81.4 (15.7) 81.5 -0.12 -0.73 .466 3217.0 .533
Causing harm to others 19.9 (17.8) 18.0 16.5 (18.4) 10.5 0.15 1.25 .213 2601.0 .117Having a future suicide attempt 59.2 (20.7) 58.0 62.3 (20.5) 64.5 -0.12 -0.75 .452 3301.0 .358
Requires hospitalisation 47.5 (25.0) 51.0 48.5 (27.8) 50.5 -0.03 -0.08 .940 3021.0 .942Requires hospitalisation 19.3 (20.6) 11.0 19.7 (18.3) 17.0 -0.02 -0.02 .987 3218.0 .531
TreatmentSuitability for Psychological
Treatment 81.2 (16.2) 84.5 81.0 (16.9) 81.0 0.01 -0.20 .841 3123.0 .772
Ability to Develop a Therapeutic Relationship 74.5 (20.9) 79.0 73.7 (16.1) 75.0 0.04 0.05 .962 2801.0 .395
Motivation for Change 66.4 (18.7) 69.0 59.5 (19.8) 60.5 0.29 1.93 .056 2436.0 .032*Improvement with Treatment 77.1 (15.5) 79.5 75.1 (18.5) 79.0 0.10 0.55 .584 2978.5 .823
Skills based psycho-education 56.6 (30.3) 56.5 58.9 (27.9) 59.0 -0.06 -0.57 .571 3143.0 .719Benefit from Short term
therapy 69.1 (24.1) 74.0 62.7 (29.4) 70.5 0.20 1.38 .171 2754.0 .308
Benefit from Long term therapy 62.7 (28.4) 69.0 58.7 (27.4) 68.0 0.12 0.83 .407 2737.5 .281Benefit from Family Therapy 17.9 (23.6) 7.5 16.6 (21.4) 7.0 0.05 0.32 .746 3059.5 .948Benefit from Self-Help Book 33.3 (30.3) 28.5 30.0 (28.1) 27.5 0.09 0.64 .524 2867.5 .537
Note. ‘U’ denotes Mann Whitney U statistic, * denotes significance p<.05, ** denotes significance p<.01
114
participants being excluded. Therefore, instead of exclusion, reaction times greater
than 10 seconds were reduced to that score. Whilst clear session effects on overall
reaction time were expected for each block (decreasing respectively on average from
2136ms in the first block to 1322ms in the second block in one condition and from
1116ms to 559ms in the counterbalanced condition), the BIAT had poor internal
consistency (α=.06, p=.057).
Social Class Characteristics of Participants
Prior to conducting the moderation analysis for hypothesis three, the potential
moderator of social class awareness was compared between groups. Surprisingly there
were significant differences between the vignette groups in some of the social class
awareness measures, and it seemed to be those that described practitioners’ potential
adverse feelings towards those of a different class. The awareness measures were
completed after the assigned video and clinical reasoning questions and it therefore
appears were influenced by the video. The results for these items were not
hypothesised to be different between groups but for several variables, greater levels of
‘awareness’ were shown for the ‘lower-class’ vignette condition (See Table 3). This
was specifically in relation to a practitioners’ awareness that a client’s social class
may elicit personal feelings for themselves (U=2138.5, z=-3.204, p=.001, d=0.48),
that they are aware of unresolved conflicts in relation to their own social class
(U=2156, z=-3.140, p=.002, d=0.41), and an awareness that they might make
judgements of a client if they perceive their social class to be different to their own
(U=2151, z=-3.156, p=.002, d=0.45.). As for the main outcomes, these continuous
single items showed some non-Normality in their distributions and therefore non-
parametric tests were also conducted but showed a similar pattern of results.
In terms of participants’ perceptions of which areas of ‘diversity and
difference’ they were most aware of in their general clinical work, after responses
were coded, 5.8% (n=9) placed class as the most salient area of diversity, with 33.3%
(n=51) of participants placing it within the top three areas. In terms of differences
between groups, the lower-class condition were more likely to see this as most salient
(7.6%, n=6 compared to 3.9%, n=3), however this difference was not statistically
significant (χ2=.981 (df1), p=.322, v=0.79). This was similarly seen in terms of them
placing social class in the top three areas (38% compared to 28%, χ2=1.552 (df1),
p=.213, v=.100.
Moderation Analysis
It was hypothesised that the effect of the social class manipulation would be more
marked when the participants’ implicit class bias score was high, their level of class
awareness low and for those with a higher self-categorised social class. This was
assessed for the two clinical reasoning variables where there was a significant main
effect (i.e. likelihood of a diagnosis of ‘alcohol or substance misuse disorder’ and
likelihood of ‘being motivated for change). In addition, two clinical reasoning
variables were included a priori: perceptions of ‘severity of difficulty’ (proxy for
impact of diagnosis) and likelihood of ‘requiring hospitalisation’ (proxy for clinical
risk). Despite some concerns about non-Normality (See Appendix G) it was assumed
that the models fitted would be relatively robust due to the distribution of the
residuals. Social class awareness was not included as a moderator variable as it was
found to affected by the clients ‘social class’ condition and therefore may be better
represented by inclusion in a mediation model (which is outside the scope of the
present report). However, the variables childhood social class, current social class and
116

Table 3. Comparing Class Awareness Variables between 'Higher' and 'Lower' Class Vignettes
Lower-ClassVignette Group
(n=79)
Higher-ClassVignette Group
(n=77)
Class Characteristics Mean (SD) Median Mean
(SD) Median Effect Size(Cohen's D)
t (154) p U p
"I am aware a client’s social class may elicit personal feelings for me"
75.5 (21.9) 79 61.0(29.4) 66.0 0.48 3.49 .001**
* 2138.5 .001***
"I am capable of reflecting on my feelings in relation to my own social
class"
82.6 (82.6) 84 79.9
(19.2) 84.5 0.03 0.93 .354 2885.5 .579
"I am aware of unresolved personal conflicts I may have in relation to my
own social class"
58.4 (31.9) 66 42.1
(33.7) 46.5 0.41 3.08 .002** 2156.0 .002**
"I am aware that my own social class may impact the treatment of a client"
70.7 (25.1) 76 66.5
(27.0) 71.0 0.13 0.94 .348 2816.5 .425
"I do make assumptions of a client I perceive to be of a similar social class"+
51.8 (30.8) 55 54.4
(29.2) 53.0 0.09 -0.53 .591 3170.0 .649
"I am aware I may make judgments of a client I perceive to be of a different
social class"
70.4 (24.9) 75 55.9
(29.1) 59.0 0.45 3.09 .002** 2151.0 .002**
"My social class would lead me to 42.1
(29.6) 43 38.3 (29.4) 40.0 0.13 0.79 .429 2798.5 .389

impose beliefs onto a client"+
"I am more likely to give advice to a client of a different social class"
19.78 (20.6) 9 22.0
(24.1) 14.5 -0.09 -0.45 .651 3030.5 .969
"I am able to process perceptions of a client based on their social class" +
83.9 (16.5) 89 77.6
(23.1) 86.0 0.31 1.97 .051 2696.0 .220
"I have discussed a client’s difficulties in terms of their social class with my
supervisor"
65.9 (31.2) 71.5 55.4
(36.9) 63.5 0.26 1.93 .055 2614.0 .129
"I tend to include the impact of a client's social class in the formulation of their
difficulties"+
58.9(28.0) 63 62.7(32.1) 74.0 0.13 -0.83 .41 3384.0 .225
Note. + denotes that score has been reverse coded from presentation to participants. ‘U’ denotes Mann Whitney U statistic, * denotes significance p<.05, ** denotes significance p<.01, *** denotes significance p<.001.
118

BIAT effect size were not influenced by client class (See Table 1) and were therefore
included as moderators.
Moderation analysis found that there were no significant interactions between
the social class condition participants were assigned to, participant self-rated social
class (childhood and current) or level of implicit class bias (BIAT D Score) and how
this impacted clinical reasoning. This was in relation to perceptions of ‘severity of
difficulties,’ and the likelihood of the client: receiving an ‘alcohol and substance
misuse diagnosis,’ ‘requiring hospitalisation’ or ‘being motivated for change’ (See
Table 4). However, a trend towards significance was noted between the interaction of
the assigned vignette client’s social class and participant’s self-categorised childhood
class and how serious they perceived the vignette client’s difficulties to be (F (3, 148)
=2.581, p=.056). The pattern of results was that among those who viewed the lower-
class condition, those who came from an upper-middle class background rated the
client’s difficulties as more serious whilst those who came from a lower-middle class
background rated the client’s difficulties as less serious. This pattern was not seen
among those who viewed the ‘upper class’ condition (See Table 4).
Table 4 - Moderation comparison of 'lower-class' and 'upper class' vignette
Seriousness of Client's Difficulties
Substance-Related and Addictive Disorder Diagnosis Requires hospitalisation Motivation for Change
Lower Class Upper Class Lower Class Upper Class Lower Class Upper Class Lower Class Upper Class
Moderator n mean (sd) n mean
(sd) n mean (sd) n mean
(sd) n mean (sd) n mean
(sd) n mean (sd) n mean
(sd)
Subjective Childhood Social Class
Upper Middle Class 8
67.0 (15.5
)9 58.1
(24.6) 8 45.5 (37.7) 9 32.8
(34.8) 8 15.4 (25.4) 9 23.4
(24.4) 8 73 (13.8) 9 59.3
(20.8)
Middle Class 2460.6 (15.0
)20 62.9
(13.5) 24 39.7 (28.5) 20 31.6
(23.1) 24 25.3 (21.0) 20 19.8
(16.4) 24 62.7 (19.9) 20 51.0
(17.8)
Lower-Middle Class 17
47.4 (13.2
)18 61.6
(15.2) 17 31.4 (24.8) 18 22.7
(25.8) 17 15.4 (13.2) 18 19.9
(18.3) 17 62.8 (20) 18 66.1
(20.3)
Working Class 3058.8 (15.4
)30 62.2
(15.1) 30 44.0 (28.0) 30 23.7
(23.1) 30 18.1 (20.5) 30 17.8
(18.3) 30 68.3 (19.3) 30 61.2
(19.5)
f(3, 148) 2.581 0.562 0.688 1.213
p .056 .641 .561 .307
Seriousness of Client's Difficulties
Substance-Related and Addictive Disorder Diagnosis Requires hospitalisation Motivation for Change
Lower Class Upper Class Lower Class Upper Class Lower Class Upper Class Lower Class Upper Class
Moderator n mean (sd) n mean
(sd) n mean (sd) n mean
(sd) n mean (sd) n mean
(sd) n mean (sd) n (mean
(sd)
Subjective Current Social Class
Upper Middle Class 3 68.7 (21.1) 8 61.8
(17.7) 3 31.3 (35.6) 8 18.0
(26.4) 3 3.7 (6.4) 8 27.4
(11.7) 3 71.0 (4.6) 8 57.9
(27.4)
Middle Class 47 57.4 (15.5) 38 61.3
(13.9) 47 40.6 (30.0) 38 32.1
(26.0) 47 20.2 (19.8) 38 21.4
(21.5) 47 66.1 (19.5) 38 59.1
(19.5)
Lower-Middle Class 21 61.7 (15.1) 25 60.8
(17.9) 21 34.2 (22.7) 25 18.2
(23.6) 21 16.6 (22.0) 25 15.6
(15.7) 21 65.0 (20.1) 25 62 (18.4)
Working Class 8 56.3 (13.6) 6 68.7
(18.3) 8 56.4 (28.7) 6 37.8
(8.4) 8 28.1 (22.2) 6 13.0
(7.5) 8 64.9 (20.6) 6 58.2
(21.8)
f(3, 148) 0.951 0.282 1.815 0.196
p .418 .838 .147 .899
Seriousness of Client's Difficulties
Substance-Related and Addictive Disorder Diagnosis Requires hospitalisation Motivation for Change
Lower Class Upper Class Lower Class Upper Class Lower Class Upper Class Lower Class Upper Class
121

Moderator n mean (sd) n mean
(sd) n mean (sd) n mean
(sd) n mean (sd) n mean
(sd) n mean (sd) n (mean
(sd)
Level of ImplicitClass Bias(BIAT D Score)
Lower Class Preference (<0) 20 56.5
(13.4) 20 61.7 (15.7) 20 42.5
(29.4) 20 27.5 (27.2) 20 22.4
(22.8) 20 24.4 (21.7) 20 67.0
(18.9) 20 64.5 (19.9)
Upper Class Preference (>0) 30 58.2
(13.6) 23 63.7 (16.6) 30 44.5
(26.2) 23 23.7 (27.6) 30 14.8
(16.6) 23 17.1 (13.8) 30 64.1
(20.6) 23 59.5 (20.8)
f(1,91) 0.209 0.007 0.237 0.019
p .649 .932 .628 .891
Note. Although the BIAT variable was included as a continuous moderator in analysis for ease of interpretation those with positive and negative lower class bias are presented.
122
123
Discussion
The current study used an online vignette-based design to compare the clinical reasoning of
British psychological and psychotherapeutic professionals between an ‘upper’ and ‘lower’
social class condition. The main hypothesis was that there would be a significant difference
between the responses of participants assessing a ‘lower-class client’ compared to ‘upper-
class client’ in terms of: allocation of cognitive resources (e.g. time spent formulating the
client’s difficulties) and clinical reasoning in relation to the client (e.g. severity, risk,
diagnosis, treatment). This hypothesis was mostly not supported, as it was found that for most
outcome variables, psychologists and psychotherapists did not discriminate between social
class conditions in relation to perceptions of severity, overall diagnosis, risk and treatment.
However, a significant effect was seen in that the likelihood of a client receiving an ‘alcohol
or substance misuse disorder’ was higher in the ‘lower-class’ client group. The only other
difference was that the ‘lower-class’ client was perceived as being more motivated for
change. The second hypothesis that BIAT scores would be significantly greater than zero
indicating that participants hold a significant ‘upper-class’ implicit bias was not supported.
The third hypothesis that discrimination against ‘lower-class’ clients would be greater in the
presence of higher implicit class bias and self-categorised ‘social class’ was also not
supported by moderation analysis. An unexpected finding was that the ‘lower-class client’
video seemed to significantly prime participants’ social class awareness, resulting in
significant differences, albeit with small effect sizes, in relation to individuals’ reflections on
their own social class, and the way their own perceptions of social class may impact their
clinical work.
One explanation of the finding of little difference between the two social class
vignettes in the allocation of cognitive resources and clinical reasoning is that it is a positive
finding, suggesting that in this sample of British psychologists and psychotherapists there
123

124
was little indication of class bias. This is supported by the findings of a similar research
study conducted with American practitioners (Dougall & Schwartz, 2011; Thompson et al.,
2014). An alternative explanation is that the video did not portray class cues accurately
enough to evoke a difference, for example it excluded the positive utility associated with
having a ‘higher status job’ or ‘increased wealth’ (Piff, 2014). However, this is countered by
the fact that vignette induced differences in social class awareness. Instead the results seem to
support the importance of reflecting on diversity and difference within training and
continuing practice (Ancis & Landany, 2010; Burnham, 2005). Components of such training
mitigating class bias may include focusing on personal reflection and adversity (Hardy &
Laszoffy, 1995, 1997; Phillips, 2011), understanding and appreciation of systemic factors and
inequalities (Burnham, 2011; Divac & Heaphy, 2005), the importance of continuing
professional development (Freckelton, 2006), or the profession’s increasing voice in relation
to national inequality (Peacock-Brennan & Harper, 2016).
The British clinical psychologists and psychotherapists in this study significantly
perceived the ‘lower-class client’ to be more likely to have a diagnosis of an ‘alcohol or
substance misuse disorder.’ Potential explanations of these findings include them being an
accurate account of epidemiological data, evidence of British class bias, or statistical chance.
Firstly, in terms of epidemiological research and global alcohol use overall excessive
consumption is more associated with those of a higher social status, with risky single
occasional drinking (‘binge drinking’) associated with lower social status within these
cultures (Grittner, Kuntsche, Gmel & Bloomfield, 2012). Erskine, Maheswaran, Pearson and
Gleeson (2010) report that those from more deprived backgrounds are 4.24-4.73 times more
likely to die of alcohol or substance related disorders. However, literature has found a
plethora of inconsistent positive and negative associations between substance use and social
class, and this was usually dependent on how ‘social class’ was measured (Goodman &
124

125
Huang, 2002; Partiali, Takamatsu & Iwamoto, 2013; Wohlfarth & Van Den Brink, 1998).
Stapinski et al. (2016) argued that British adolescents consume similar amounts of alcohol
between class groups but it is more likely that lower-class adolescents would use alcohol as a
means of coping with low mood, whereas those from higher socioeconomic groups were
more likely to drink alcohol to ‘increase their social confidence.’ Regardless of the social
class of an individual, alcohol and substance abuse are seen as a coping mechanism for
distress/traumatic events. For example, there is a high relationship between experiences of
post-traumatic stress disorder and alcohol and substance misuse (Simpson et al., 2014),
including the aftermath of childhood sexual abuse (Simpson, 2003) and being victim of a
catastrophic event/natural disaster (Dell’Osso, 2012). Therefore, the finding may be
indicative of epidemiological differences of alcohol use or an appreciation for the potential
distress of being of a lower social class, and alcohol/substance use being a secondary coping
mechanism.
Secondly, this finding may also be indicative of stereotypes within British society.
There is evidence that those who misuse alcohol in Britain do disproportionately consume
cheaper alcohol (Haydock, 2014; Purhouse et al., 2009), and that alcohol misuse tends to be
associated with family conflict, violence, and risky sexual behaviours (Macdonald et al.,
2003; Miller, Naimi, Brewer & Jones, 2007; Partiali et al., 2013). However, it is a British
stereotype that these factors are associated with lower-class individuals (Haydock, 2014;
Hayward & Yar, 2008). These include vilified perceptions that people from lower-class
backgrounds are ‘impulsive’, ‘violent’, ‘addicts,’ who drink in an ‘uncivilised way’ and ‘in
excess’ because they are ‘out of control’ (Haydock, 2014; Measham, 2002; Rudolfsdottir &
Morgan, 2009; Skeggs, 2005).
Finally, the current study uses many single item analyses (n=25 clinical reasoning
comparisons), it would be expected that expect 1 in 20 results to be significant by chance,
125

126
therefore it is important to acknowledge this result may be a chance finding. The extent to
which this finding reflects an accurate assessment of the epidemiological evidence around
social class and alcohol use or class bias is impossible to resolve in the current paper. Further
research could focus on a qualitative exploration on how British clinical psychologists
perceive client’s substance use based upon social class, for example using a similar
methodology to Rudolfsdottir and Morgan (2009) and Day, Gough and McFadden (2003)
who have explored British women’s relationship with alcohol in relation to their own social
class.
Another finding was that the lower-class client was perceived as more motivated for
change during the psychological assessment session. This finding was unexpected as the
opposite would have been assumed. This was due to the focus on difficulty accessing
services, and perceived motivation of ‘lower-class’ clients within therapy in the general
literature (Asch et al., 2006; Garland et al., 2005; Lantz et al., 2001; Liu, 2011). Those of a
‘lower-class’ may be perceived to be less future orientated (Wardle & Steptoe, 2003) and
have a more external health locus of control (Poortinga, Dustan & Fone, 2008; Taylor &
Seeman, 1999). Individuals from ‘higher-class’ backgrounds may have higher expectancy in
their capability to influence their own health due to an increase in positive experiences
(Eriksen & Ursin, 2002). This leads those from ‘lower-class’ backgrounds to internalise a
belief that they cannot control certain aspects of their life (e.g. health status) (Poortinga,
Dustan & Fone, 2008).This result might tap into more historic perceptions of social class,
such as that ‘the poor are humble and hardworking’ and ‘the rich are snobbish and lazy’ (Kay
& Jost, 2003; Spencer et al., 2013). However, it seems more plausible that this was due to
the ‘lower-class client’ surpassing stereotypical expectations around non-attendance, and
being ‘engaged’ in the psychological assessment process. It may be that when a client of such
a background is being assessed for access to services they are seen as more motivated due to
126

127
‘overcoming’ the barriers associated with attendance, whereas a middle-class client would be
expected to attend without difficulty (Liu et al., 2004a, 2004b). This is as they are perceived
as ‘motivated in general’ or to have fewer barriers to service access (Hollingworth &
Williams, 2009; Skeggs, 2005; Southerton, 2002).
Practitioners who were assigned to the lower-class condition showed a significant
increased awareness in feelings associated with their own social class and the impact it could
have on their clients. It is plausible that this may have been because the participants in the
lower-class condition were more likely to notice the class of the client in the manipulation
rather than the upper-class group, which could have been accounted for by asking participants
what they believed the manipulation to be at the debrief stage. Research has suggested that
dominant groups e.g. ‘white,’ ‘male’ and ‘heterosexual’ can act as a category norm (Hegarty,
2017; Hegarty & Pratto, 2004; Pratto, Korchmaros, & Hegarty, 2007). Individuals are only
‘noticed’ in terms of their diversity factors if they are in a minority group/different to a
hegemonic majority. A similar effect may take place in relation to social class. Overall, this
suggests that work alongside individuals who experience social adversity might allow the
practitioners to reflect on their own personal factors, which may reduce bias. This builds
upon literature discussing the importance of becoming more aware of ones’ assumptions and
intentions when reflecting upon the importance of social class in clinical work (Roysircar,
2008; Toporek, 2013).
This finding is more hopeful than previous research which reports therapists avoiding
clients of lower social classes to avoid difficult transference reactions (Aronson, 2006),
imbalances of power (Balmforth, 2009) and lacking an understanding of privilege differences
between themselves and their clients (Liu, Pickett & Ivey, 2007). This increase in the level
of reflection may be indicative of an increase in awareness of the inequality associated with
being of a lower social class, and how the privilege of being a clinical practitioner may
127
128
influence this (Piff, Martinex & Keltner, 2012). Individuals are motivated to perceive groups
that they belong to as moral (such as ‘middle-class’ or ‘psychotherapist’); personal distress is
caused when this view is challenged (Leach, Ellemers & Barreto, 2007; Sullivan, Landau,
Branscombe & Rothschild, 2012). It leads the individual to internalise the personal threat of
being positioned as someone who discriminates against others (Eidelman & Biernat, 2003).
For example, Iyer, Schmader and Lickel (2007) found that when British Citizens were
exposed to threatening depictions of the ingroup they reported increased feelings of anger
towards both British People and the British Government. Working with a client of a lower-
class may create a form of ‘collective shame,’ which is prompted by appraisals that ingroup
transgressions (e.g. societal perceptions of the lower-class) have threated one’s self-image
(Johns, Schmader & Lickel, 2005). Since the privilege of the professional cannot be ‘given
away’ (Messner, 2000, 2011; Ridgeway, 2009), this may lead to heightened awareness of
personal privilege, advocacy, accountability, activism and appreciation for difference and
diversity within the profession (Dreher, 2009; Hernandez-Wolfe & McDowell, 2012; Smith,
2010; Smith, Shellman & Smith, 2013).
Whilst the demographic characteristics of the study participants were similar to those
in the Clinical Psychology population (CHPCCP, 2016) it is possible that the sample was not
representative of the profession as a whole as it used opportunity sample. Furthermore 65%
of the participants were prequalified or in training. Whilst this limits the generalisability of
the results to qualified professionals, chi-squared analysis suggested little difference in results
due to this factor. In addition, there were weaknesses due to the use of single item measures
(Clark & Tate, 2008; Fuchs & Diamantopoulos, 2009). Also there are difficulties with
accurately representing social class within research (Lau et al., 2013) and the
representativeness of vignette methodology (Lopez, 1989; Stolte, 1994). Watching a five-
minute vignette does not accurately reflect power differentials, complicated interpersonal
128

129
situations, emotionality, or the contextual pressures of clinical work (Lopez, 1989; Stolte,
1994). However, the use of vignette allowed experimental manipulation of the variable which
naturalistic studies lack (Loring & Powell, 1988) and allowed the manipulations of class to be
indexed accordingly, without additional variance from extraneous cues (Lau et al., 2013).
Additionally, as the script was constructed of ambiguous symptoms, derived from replication
across clinical diagnoses in the DSM-V (APA, 2013), this increased the likelihood
participants would rely on implicit class biases and stereotypes, in their clinical reasoning,
due to the ambiguity (Darly & Gross, 1983; McConahay, 1986). Additional experimental
control was provided by using the same actor and script between conditions, which led to
balance in terms of the valence of the stimuli. Furthermore, an experienced actor was
employed, who applied relevant theatrical technique to reduce additional variance
(Stanislavski, 1936/1988, 1961). There are unavoidably minor differences between the
videos, but these were minimised as much as possible in the filming and editing process.
Additionally, the study aimed to combat the potential issues of using objective markers to
denote social class (e.g. occupation, income, education), and instead employed subjective
measures such as accent and dress as these can be seen as a cognitive aggregation of an
individual’s personal markers of class (Lau et al., 2013; Singh-Manoux et al. 2003) and
remove the associated ‘cognitive value’ of working with a client with a ‘high income’ or
‘prestigious job’ (Piff, 2014).
One of the main methodological limitations in the current study arose because of how
the BIAT was completed. The BIAT effect found in the study did not indicate the ‘upper-
class bias’ which has been found in similar research completed by Haider et al. (2011, 2014,
2015a, 2015b) in America or previously by the current author in Britain (Vlietstra et al.,
under review). This is unlikely to be due to order effects, as such implicit measures are
resistant the priming effect the vignette may have had (see Hofmann et al., 2005a, 2005b).
129
130
One interpretation could be that clinical psychologists and psychotherapists within Britain do
not hold a significant level of implicit class bias compared to the general population.
However, in view of the issues with operationalising the BIAT in the current study it may be
more likely due to these. The results for the current BIAT broke a main scoring assumption in
relation to maximum response time (See Nosek et al., 2014). This may be because the current
test was completed online compared to in a laboratory setting; this could have reduced
participants’ clarity on how to complete the task, the time taken for the survey software to
process the response, or allowed space for the participants to make a more deliberate
decision, as they were not being explicitly prompted to go ‘as fast as they could’ during the
test (and thus the longer reaction time).
In future research using BIATs on-line the response time problem noted here might
be reduced in the following way. Prior to the BIAT, if participants received a short block of
unrelated reaction time tasks which ‘punished’ long responses (e.g. using a red cross on the
screen) and ‘rewarded’ (using a green tick) this might decrease participant reaction times and
increase reliance on implicit cues (Sternberg, 2001). Regardless, differences in clinical
reasoning were not seen to be significantly moderated by BIAT scores, and this replicated the
results of Haider et al. (2011, 2014, 2015a, 2015b) in a medical setting. Critics of the IAT
question its’ predictive validity when differences in behaviour are seen (Oswald et al., 2013;
Shanks, 2016). An example would be in the current experiment, where differences were seen
in relation to ‘alcohol and substance misuse’ diagnosis but this was not moderated by implicit
class bias.
The results of the current study have implications for therapeutic practice and
training. One explanation for the overall lack of discrimination on the basis of social class
might be that upon seeing a lower-class client, practitioners are primed to reflect on personal
feelings in relation to social class and how this may impact their practice. This has
130

131
implications for the training of mental health professionals. For example, attending to the
explicit activation of personal beliefs can reduce the impact of stereotypes in clinical work
(Devine, Plant & Buswell, 2000; Green et al., 2007). Training programs already have means
for discussion and teaching in relation to difference and diversity (Beagan & Kumas-Tan,
2009; Burnham, 2005; Sue & Sue, 2008), however specific frameworks for training,
reflection and continuing professional development in relation to social class biases and
privilege have been put forward by both Liu (2011) and Curry-Stevens (2007) which could be
integrated into curricular. It is important for clinicians to be encouraged to employ a level of
reflexivity; not to nullify biases but to increase awareness of them (Beagan & Kumas-Tan,
2009). Practitioners who develop a sense of mastery when working with people of a lower
social class or those with a previous history of financial hardship tend to report less biased
perceptions (Beagan & Kumas-Tan, 2009; Minick, Kee, Borkat, Cain & Oparah-Iwobi,
1998). If the professional can reflect on their own experiences of privilege and
marginalisation (Messner, 2000, 2011; Hernadez-Wolfe & McDowell, 2012), this can
increase the ability to sit alongside clients, broaden clinical perspectives, increase a level of
compassion and lead to increased nonjudgmental support (Comas-Diaz, 2006; Hernandez-
Wolfe & McDowell, 2012; Liu, 2011; Weingarten, 2003); this may potentially promote
systemic change within the national system the work is completed within.
Conclusion
Overall the results of the study suggest that clinical psychologists and
psychotherapeutic professionals within the NHS generally do not discriminate against their
clients in relation to their social class. However, discrimination was observed in relation to
perceptions of client motivation and alcohol and substance use. . Further research should
focus on replicating the avenues of research that the American psychotherapeutic and social
class literature has already begun to examine (Ladany & Krikorian, 2013; Liu, 2011; Smith,
131

132
2009; Toporek, 2013), for example, understanding the mediators and moderators of both the
impact of class bias in clinical settings in Britain. This study has suggested another avenue of
research: the priming effect that contact with a lower-class client seems to heighten
awareness of social class processes. Finally, the finding of the study prompt the following
reflection: if the impact of inequality and being in receipt of social class bias is a cause and
perpetuator of mental health difficulties in Britain (Coburn, 2015; Eliot, 2016; Peacock-
Brennan & Harper, 2016), then advocacy and awareness in relation to this is not additional to
the role of therapy, but rather is the role of therapy (Smith, 2010; Smith, Shellman & Smith,
2013).
132
133
References
Abreu, J. M. (1999). Conscious and nonconscious African American stereotypes: Impact on
first impression and diagnostic ratings by therapists. Journal of Consulting and
Clinical Psychology, 67(3), 387-393. doi:10.1037//0022-006X.67.3.387
American Psychiatric Association (2013). Diagnostical and Statistical Manual of Mental
Disorders 5th Edition. Arlington, VA: Author.
Ancis, J. R., & Ladany, N. (2010). A Multicultural Framework for Counselor
Supervision. In N. Ladany & L. J. Bradley (Eds.) Counselor Supervision (4th ed.) (pp.
53-94). New York, NY: Routledge.
Anspach, R. R. (1988). Notes on the Sociology of Medical Discourse: The Language of Case
Presentation. Journal of Health and Social Behaviour, 29, 357-375.
Arber, S., McKinlay, J., Adams, A., Marceau, L., Link, C., & O'Donnell, A. (2006).
Patient characteristics and inequalities in doctors' diagnostic and management
strategies relating to CHD: A video-simulation experiment. Social Science &
Medicine, 62(1), 103-115. doi:S0277-9536(05)00244-3 [pii]
Arkes, H. R., & Tetlock, P. E. (2004). Attributions of Implicit Prejudice, or “Would
Jesse Jackson ‘Fail’ the Implicit Association Test?” Psychological Inquiry, 15,
257-278. doi: 10.1207/s15327965pli1504_01.
Armstong, R. A. (2014). When to use the Bonferroni correction. Ophthalmic &
Physiological Optics, 34 (5), 502-508. doi: 10.1111/opo.12131.
Aronowitz, S. (2004). How Class Works: Power and Social Movement. New Haven,
CT:Yale University Press
Aronson, H. (2006). Treating the “poor:” classism or rigid loyalty to theory? American
Psychologist, 61 (4), 335-336. doi:10.1037/0003-066X.61.4.335.
133

134
Asch, S. M., Kerr, E. A., Keesey, J., Adams, J. L., Setoji, C.M., Malik, S., & McGlynn, E. A.
(2006). Who is at greatest risk for receiving poor-quality health care? New England
Journal of Medicine, 354, 1147-1156. doi:10.1056/NEMsa044464
Atkinson, P. A. (1994). Rhetoric as Skill in a Medical Setting. In Bloor, M., and
Taraborrelli, P. (Eds.) Qualitative Studies in Health and Medicine (pp.110-
130) Aldershot: Avesbury.
Back, M.D., Schmukle, S.C., & Egloff, B. (2005). Measuring task-switching ability in the
Implicit Association Test. Experimental Psychology, 52, 167–179. doi: 10.1027/1618-
3169.52.3.167.
Ballinger, L., & Wright, J. (2007). “Does class count?” Social Class and Counseling.
Counseling and Psychotherapy Research, 7 (3), 157-163.
doi:10.1080/14733140701571316
Balmforth, J. (2009). “The weight of class:” Clients’ experiences of how perceived
differences in social class between counsellor and client affect the therapeutic
relationship. British Journal of Guidance and Counseling, 37 (3), 375-386.
doi:10.1080/03069880902956942.
Banaji, M. R., & Greenwald, A. G. (2013). Blindspot: Hidden Biases of Good People.
New York, NY: Random House.
Beagan, B. L., & Kumas-Tan, Z. (2009). Approaches to diversity in family medicine: "I have
always tried to be colour blind". Canadian Family Physician Medecin De Famille
Canadien, 55(8), e21-28. doi:55/8/e21 [pii].
Beal, J. (2009). Enregisterment, commodification and historical context: ‘Geordie’
versus ‘Sheffieldish’. American Speech, 84, 138–156. doi:10.1215/00031283-
2009-012
134

135
Bennett, J. (2012a). Chav-spotting in Britain: the representation of social class as private
choice. Social Semiotics, 23 (1), 37–41. doi: 10.1080/10350330.2012.708158.
Bennett, J. (2012b). ‘And what comes out may be a kind of screeching’: The stylisation of
chavspeak in contemporary Britain. Journal of Sociolinguistics, 16, 5-27.
doi:10.1111/j.1467-9841.2011.00521.x
Bennett, J. (2013). Moralising Class: A discourse analysis of the mainstream political
response to Occupy and the August 2011 British riots. Discourse & Society, 24 (1),
27-45. doi: 10.1177/0957926512463634
Biaggo, M., Roades, L. A., Staffelbach, D., Cardinali, J., & Duffy, R. (2000). Clinical
evaluations: Impact of sexual orientation, gender, and gender role. Journal of
Applied Social Psychology, 30(8), 1657–1669. doi:10.1111/j.1559-
1816.2000.tb02460.x
Binswanger, M. (2006). Why does income growth fail to make us happier? Searching for
treadmills behind the paradox of happiness. The Journal of Socio-Economics, 35,
366-381. doi: 10.1016/j.socec.2005.11.040.
Blacksher, E. (2008). Healthcare Disparities: The Salience of Social Class. Cambridge
Quarterly of Healthcare Ethics, 17, 143-153. doi:10.1017/S0931801 08080171.
Bland, M. (2000). An Introduction to Medical Statistics (3rd Ed.). Oxford: Oxford Medical
Publications.
Bordieu, P. (1984). Distinction: A Social Critique of the Judgement of Taste. London:
Routledge.
Bordieu, P. (1990). The Logic of Practice. Cambridge: Polity Press.
135

136
Bordieu, P. (1994). In Other Words: Essays Towards a Reflexive Sociology.
Cambridge : Polity Press.
Boulton, M., Tuckett, D., Olson, C., & Williams, A. (1989). Social Class and General
Practice Consultation. Sociology of Health & Illness, 8 (4), 325-350.doi:
10.1111/1467-9566.ep11340453.
Bowers, A. M. V., & Bieschke, K. J. (2005). Psychologists’ Clinical Evaluations and
Attitudes: An Examination of the Influence of Gender and Sexual Orientation.
Professional Psychology: Research and Practice, 36(1), 97–103. doi:10.1037/0735-
7028.36.1.97
Boysen, G. A., & Vogel, D. L. (2008). The relationship between level of training, implicit
bias, and multicultural competency among counselor trainees. Training and
Education in Professional Psychology, 2, 103–110. doi:10.1037/1931-3918.2.2.103
Braverman, P. A., Cubbin, C., Egerter, S., Chideya, S. Marchi, K. S., Metzler, M., &
Posner, S. (2005). Socioeconomic Status Research: One size does not fit all.
Journal of the American Medical Association, 22, 2879-2888. doi: 10.1001/
jama.294.22.2879.
Burnham, J. (2005) Relational reflexivity: a tool for socially constructing therapeutic
relationships. In C. Flaskas, B. Mason and A. Perlesz (Eds.), The Space Between:
Experience, Context, and Process in the Therapeutic Relationships (pp 1-18).
London: Karnac Books.
Burnham, J. (2011) 'Developments in Social GRRRAAACCEEESSS: Visible-invisible and
voiced unvoiced'. In I.B. Krause (Ed.) Culture and Reflexivity in Systemic
Psychotherapy: Mutual Perspectives (pp. 139-160). London: Karnac Books,
136

137
Chen, E., & Paterson, L. Q. (2006). Neighbourhood, family, and subjective
socioeconomic status: How do they relate to adolescent health? Educational
Researcher, 25(6), 96–102. doi:10.1037/0278-6133.25.6.704
Chugh, D. (2004). Societal and Managerial Implications of Implicit Social Cognition:
Why Milliseconds Matter. Social Justice Research, 17, 203-222.
doi:10.1023/B:SORE.0000027410.26010.40
Clark, K. D., & Tate, C. (2008). Measuring racial prejudice in a multiracial world:
New methods and new constructs. In M. A. Morrison & T. G. Morrison (Eds.)
Psychology of Modern Prejudice (pp. 93-122). Hauppauge, NY: Nova Science.
Clearing House for Postgraduate Courses in Clinical Psychology (2016). Equal
Opportunities 2015 Entry. Retrieved on 07/02/2017 from
http://www.leeds.ac.uk/chpccp/equalopps.html
Coburn, D. (2015). Income inequality, welfare, class and health: a comment on
Pickett and Wilkinson, 2015. Social Science and Medicine, 146, 228-232.
doi:10.1016/j.socscimed.2015.09.002.
Comas-Diaz, L. (2006). Cultural Variation in the therapeutic relationship. In C. D.
Goodheart, A. E. Kazdin & R. J. Sternberg (Eds.) Evidence Based Psychotherapy:
Where Practice and Research Meet (pp.81-105). Washington, DC: American
Psychological Association.
Curry-Stevens, A. (2007). New forms of Transformative Education: Pedagogy for the
Privileged. Journal of Transformative Education, 5, 33-58. doi:
10.1177/1541344607299394
Darley, J. M., & Gross, P. H. (1983). A hypothesis-confirming bias in labelling effects.
Journal of Personality and Social Psychology, 44, 20-33. doi:10.1037/0022-
3514.44.1.20
137

138
Day, K., Gough, B. & McFadden, M. (2003). Women who drink and fight: A discourse
analysis of working-class women’s talk. Feminism & Psychology, 13, 141-158.
doi:10.1177/0959353503013002002.
De Houwer, J., & Moors, A. (2007). How to Define and Examine the Implicitness of Implicit
Measures. London: The Guildford Press.
Dell’Osso, L., Carmassi, C., Conversano, C., Massimetti, G., Corsi, M., Stratta, P.,
Akiskal, K., Rossi, A., & Akiskal, H. (2012). Post-Traumatic Stress Spectrum and
Maladaptive Behaviours (drug abuse included) after catastrophic events: L’Aquila
2009 Earthquake as Case Study. Heroin Addiction and Related Clinical Problems, 14
(4), 95-103.
Devine, P. G., Plant, E. A., & Buswell, B. N. (2000). Breaking the Prejudice Habit:
Progress and Obstacles. In S. Oskamp (Ed.) Reducing Prejudice and
Discrimination (pp185-210). New Jersey, NJ: The Clairemont Symposium on
Applied Social Psychology.
Divac, A., & Heaphy, G. (2005). Space of GRRAACCES: training for cultural
competence in supervision. Journal of Family Therapy, 27 (3), 280-284.doi:
10.1111/j.1467-6427.2005.00318.x
Doss, R. C., & Gross, A. M. (1994). The Effects of Black English and Code-Switching on
Intra-racial Perceptions. Journal of Black Psychology, 29, 282-93.
Dougall, J. L., & Schwartz, R. C. (2011). The influence of client socioeconomic status on
psychotherapists’ attributional biases and countertransference reactions. American
Journal of Psychotherapy, 65(3), 249–265.
138
139
Dreher, T. (2009). Listening across Difference: Media and Multiculturalism Beyond the
Politics of Voice. Continuum: A Journal of Media and Cultural Studies, 23(4), 445-
458. ris id: 35293.
Eidelman, S. & Biernat, M. (2003). Derogating Black Sheep: Individual or Group Protection.
Journal of Experimental Social Psychology, 39, 602-609. doi:10.1016/S0022-
1031(03)00042-8.
Elias, N. (2012). On the Process of Civilisation: Sociogenetic and Psychogenetic
Investigations. Dublin: University Dublin Press.
Elliott, I. (2016). Poverty and Mental Health: A review to inform the Joseph Rowntree
Foundation’s Anti-Poverty Strategy. London: Mental Health Foundation.
Eriksen, H. R., & Ursin, H. (2002). Social inequalities in health: biological, cognitive and
learning theory perspectives. The Norwegian Journal of Epidemiology, 12, 33-38.
doi:10.5324/nje.v12il.503.
Erskine, S. Maheswaran, R., Pearson, T., & Gleeson, D. (2010). Socioeconomic
deprivation, urban-rural location and alcohol-related mortality in England and
Wales. BMC Public Health, 10, 1-8. doi:10.1186/1471-2458-10-99.
ESRC. (2009). British Household Panel Survey: Waves 1-18, 1991 – 2009. Retrieved 15th
September, 2016, from http://discover.ukdataservice.ac.uk/catalogue?sn=5151
Eubanks-Carter, C., & Goldfried, M. R. (2006). The impact of client sexual orientation and
gender on clinical judgments and diagnosis of borderline personality disorder. Journal
of Clinical Psychology, 62(6), 751–770.doi: 10.1002/jclp.20265.
Falconnier, L. (2010). Social Class and Work Functioning in Treatment for
Depression. Psychiatric Services, 61 (7), 718-721. doi:10.1176/ps.2010.61.
7.718.
139

140
Faul, F., Erdfelder, E., Lang, A. G., & Buchner, A. (2007). G*Power 3: A flexible
statistical power analysis for the social, behavioural and biomedical sciences.
Behavioural Research Methods, 39, 175-191. doi:10.3758/BF03193146
Freckelton, I. (2006). Contemporary Challenges in the Regulation of Health
Practitioners. In S. A. Mclean (Eds.) First Do No Harm: Law Ethics and Healthcare
(pp39-59). Aldershot: Ashgate Publishing Limited.
Fuchs, C., & Diamantopoulos, A. (2009) Using single-item measures for construct
measurement in management research: Conceptual issues and application
guidelines. Die Betriebswirtschaft, 69(2),195–210.
Gallo, L. C., & Matthews, K. A. (2003). Understanding Association Between
Socioeconomic Status and Physical Health: do negative emotions play a role?
Psychological Bulletin, 129, 10-51. pmid:12555793.
Garland, A. F., Lau, A. S., Yeh, M., McCabe, K. M., Hough, R. L., & Landsverk, J. A.
(2005). Racial and ethnic differences in utilization of mental health services among
high-risk youths. American Journal of Psychiatry, 162, 1336-1343.doi:
10.1176/appi.ajp.162.7.1336
Gelso, C. J., Fassinger, R. E., Gomez, M. J., & Latts, M. G. (1995).
Countertransference Reactions to Lesbian Clients - the Role of Homophobia,
Counselor Gender, and Countertransference Management. Journal of Counseling
Psychology, 42(3), 356–364. eric:EJ511371.
Goodman, E., & Huang, B. (2002). Socioeconomic status, depressive symptoms, and
adolescent substance use. Archives of Paediatric and Adolescent Medicine,
156, 448-453. pmid:11980549
140

141
Green, A. R., Carney, D. R., Pallin, D.J., Ngo, L. H., Raymond, K. L., Iezzoni, L. I., &
Banaji, M. R. (2007). Implicit Bias among physicians and its prediction of
thrombolysis decisions for black and white patients. Journal of General Internal
Medicine, 22, 1231-1238. doi: 10.1007/s11606-007-0258-5.
Greenwald, A.G., McGhee, D. E., & Schwartz, J. L. K. (1998). Measuring individual
differences in implicit cognition: The Implicit Association Test. Journal of Personality
and Social Psychology, 74, 1464- 1480. pmid:9654756.
Greenwald, A. G., Nosek, B. A. & Banaji, M. R. (2003). Understanding and using the
Implicit Association Test: I. An improving scoring algorithm. Journal of personality
and social psychology, 74, 1464-1480. doi: 10.1037/0022-3514.85.2.197.
Greenwald, A. G., Poehlman, T. A., Uhlmann, E. L., & Banaji, M. R. (2009).
Understanding and using the Implicit Association Test: III Meta-analysis of
predictive validity. Journal of Personality and Social Psychology, 97, 17-
41.doi:10.1037/a0015575.
Grittner, U., Kuntsche, S., Gmel, G., & Bloomfield, K. (2012). Alcohol Consumption and
Social Inequality at the Individual and Country Levels: Results from an International
Study. European Journal of Public Health, 23(2), 332-339.
doi:10.1093/eurpub/cks044.
Gushue, G. V. (2004). Race, Color-Blind Racial Attitudes, and Judgments about Mental
Health: A Shifting Standards Perspective. Journal of Counseling Psychology, 51(4),
398–407. doi:10.1037/0022-0167.51.4.398
Haider, A. H., Schneider, E. B., Sriram, N., Dossick, D. S., Scott, V. K., Swoboda, S.
M.,Haider, A. H., Schneider, E. B., Sriram, N., Dossick, D. S., Scott, V. K.,
Swoboda, S. M., . . . Freischlag, J. A. (2015b). Unconscious race and social
141

142
class bias among acute care surgical clinicians and clinical treatment decisions. JAMA
Surgery, 150(5), 457. doi:10.1001/jamasurg.2014.4038.
Haider, A. H., Sexton, J., Sriram, N., Cooper, L. A., Efron, D. T., Swoboda, S., . . .
Cornwell,E. E. (2011). Association of unconscious race and social class bias
with vignette-based clinical assessments by medical students. JAMA, 306(9),
942-51. doi:10.1001/jama.2011.1248.
Haider, A. H., Schneider, E. B., Sriram, N., Dossick, D. S., Scott, V. K., Swoboda, S. M., . . .
Cooper, L. A. (2014). Unconscious race and class bias: Its association with decision
making by trauma and acute care surgeons. The Journal of Trauma and Acute Care
Surgery, 77(3), 409-416. doi:10.1097/TA.0000000000000392
Haider, A. H., Schneider, E. B., Sriram, N., Scott, V. K., Swoboda, S. M., Zogg, C. K., . . .
Cooper, L. A. (2015a). Unconscious race and class biases among registered nurses:
Vignette- based study using implicit association testing. Journal of the American
College of Surgeons, 220(6), 1077-1086.e3. doi:10.1016/j.jamcollsurg.2015.01.065
Hardy, K., & Laszloffy, T. (1995). The Cultural Genogram: A Key to Training Culturally
Competent Family Therapists. Journal of Marital and Family Therapy, 21, 227-237.
doi: 10.1111/j.1752-0606.1995.tb00158.x.
Hardy, K., & Laszloffy, T. (1997). The Cultural Genogram: An Application. In C.L.
Storn & T. C. Todd (Eds.) The Reasonably Complete Systemic Supervisor Resource
Guide (pp34-39). Needham Heights, MA: Allyn & Bacon.
Haydock, W. (2014). ’20 tins of Stella for a fiver’: The making of class through Labour and
Coalition government alcohol policy. Capital and Class, 38(3), 583-600.
doi:10.1177/0309816814550455.
142
143
Hayes, J. A., Gelso, C. J., VanWagoner, S., & Diemer, R. (1991). Managing
Countertransference: What the Experts Think. Psychological Reports, 69, 139-
148. doi:10.2466/pr0.1991.69.1.139.
Hayward, K. & Yar, M. (2006). The ‘Chav’ Phenomenon: Consumption, Media and the
Construction of a New Underclass. Crime Media Culture, 2(1), 9-28.doi:
10.1177.1741659006061708.
Hegarty, P. (2017). On the Failure to Notice that White People are White: Generating and
Testing Hypotheses in the Celebrity Guessing Game. Journal of Experimental
Psychology: General, 146 (1), 41-62. doi:10.1037/xge0000243.
Hegarty, P. & Pratto, F. (2004). The differences that norms make: Empiricism, social
constructionism, and the interpretation of group differences. Sex Roles, 50,
445-453. doi:10.1023/B:SERS.0000023065.56633.cb
Hernadez-Wolfe, P., & McDowell, T. (2012). Speaking of Privilege: Family Therapy
Educators Journey towards Awareness and Compassionate Action. Family
Process, 51(2), 163-178. doi:10.1111/j.1545-5300.2012.01394.
Hofmann, W., Gawronski, B., Gshwender, T., Le. H., & Schmitt, M. (2005a). A Meta-
analysis on the correlation between the Implicit Association Test and Explicit Self-
report measures. Personality and Social Psychology Bulletin, 31, 1369-1385.
doi:10.1177/0146167205275613.
Hofmann, W., Gshwendner, T., Nosek, B. A., & Schmitt, M. (2005b). What moderates
implicit-explicit consistency? European Review of Social Psychology, 16, 335-390.
doi:10.1080/10463280500443228.
Hollingworth, S. & Williams, K. (2009). Constructions of the working-class ‘Other’
among urban, white, middle-class youth: ‘chavs’, subculture and the valuing of
143

144
education. Journal of Youth Studies, 12(5), 467-482.
doi:10.1080/13676260903081673
Hoyt, S. K. (1999). Mentoring with Class. In A. J. Murrell and F. J. Crosby (Eds.)
Mentoring Dilemmas: Developmental Relationships within Multicultural
Organizations (pp. 189-210). Mahwah, NJ: Erlbaum.
Hudson, C. G. (2005). Socioeconomic Status and Mental Illness: Tests of the Social
Causation and Selection Hypothesis. American Journal of Orthopsychiatry, 75, 3-18.
doi:10.1037/0002-9432.75.1.3.
Hughes, D., & Griffiths, L. (1996). ‘But if you look at the coronary anatomy…’: risk and
rationing in cardiac surgery. Sociology of Health and Illness, 18(2), 172-
197.pmid:11660399.
Iyer, A., Schmader, T., & Lickel, B. (2007). Why Individuals Protest the Perceived
Transgression of their Country: The role of anger, shame and guilt. Personality and
Social Psychology Bulletin, 33, 572-587. doi:10.1177/0146167206297402
Johns, M., Schmader, T., & Lickel, B. (2005). Ashamed to be American? The role of
identification in predicting vicarious shame for anti-Arab prejudice after 9-11. Self
and Identity, 4, 331-348. doi:10.1080/15298860500145822.
Kales, H. C., Neighbors, H. W., Blow, F. C., Taylor, K. K. K., Gillon, L., Welsh, D. E., …
Mellow, A. M. (2005). Race, gender, and psychiatrists’ diagnosis and treatment of
major depression among elderly patients. Psychiatric Services (Washington, D.C.),
56(6), 721–728. doi:10.1176/appi.ps.56.6.721.
Kay, A. C., & Jost, J. T. (2003). Complementary justice: effects of “poor but happy” and
“poor but honest” stereotype exemplars on system justification and implicit activation
144
145
of the justice motive. Journal of Personality and Social Psychology, 85, 823– 3. doi:
10.1037/0022-3514.85.5.823.
Keister, L. A. (2000). Wealth in America: Trends in Wealth Inequality. Cambridge:
Cambride University Press.
Kerr, A. N. (2014). Stereotypes and patient-provider communication: Testing the effects of
depression, socioeconomic status, and race. Loyola University Chicago Dissertations,
paper 523.
Kraus, M. W., & Stephens, N. M. (2012). A Road Map for an Emerging Psychology of Social
Class. Social and Personality Psychology Compass, 6(9), 642-656. doi:
10.1111/j.1751-9004.2012.00453.x
Krieger, N., Williams, D. R., & Moss, N. E. (1997). Measuring Social Class in US
Public Health Research: concepts, methodologies, and guidelines. Annual Review of
Public Health, 18, 341-278. doi:10.1146/annurev.publhealth. 18.1.341
Ladany, N., & Krikorian, M. (2013). Psychotherapy Process and Social Class. In W. M. Liu
(Ed.) The Oxford Handbook of Social Class in Counseling (pp.131-144). New York,
NY: Oxford University Press.
Lantz, P. M., Lynch, J. W., House, J. S., Lepkowski, J. M., Mero, R. P., Musick, M., &
Williams, D. R. (2001). Socioeconomic disparities in health change in a longitudinal study of
US adults: the role of health-risk behaviours. Social Science & Medicine, 53, 29–40.
doi:10.1016/S0277-9536(00)00319-1
Lareau, A. (2003). Unequal childhoods: Class, race, and family life. Berkeley, CA:
University of California Press.
145
146
Larson, L. M., Suzuki, L., Gillespie, K., Pontenza, M. T., Toulouse, A. L., & Bechtel, M. A.
(1992). The development and validation of the Counseling Self-Estimate Inventory.
Journal of Counseling Psychology, 39, 105-120. doi:10.1037/0022-0167.39.1.105
Lau, M. Y., Cho, R. J., Chang, J. J., & Huang, J. (2013). Measurement and
Methodological Issues in Social Class Research: A Call for Theorization and
Study. In W. M. Liu (Ed.) The Oxford Handbook of Social Class in Counseling
(pp.59-81). New York, NY: Oxford University Press.
Law, A. & Mooney, G. (2012). The Decivilizing Process and Urban Working-Class
Youth in Scotland. Social Justice, 38(4), 106-126.
Leach, C. W., Ellemers, N., & Barreto, M. (2007). Group Virtue: The Importance of
Morality (vs. Competence and Sociability) in the Positive Evaluation of Ingroups.
Journal of Personality and Social Psychology, 93, 234-249. doi:10.1037/0022-
3514.93.2.234
Leondar-Wright, B., & Yeskel, F. (2007). Classism Curriculum Design. In M. Adams, L. Bell
& P. Griffin (Eds.) Teaching for Diversity and Social Justice (2nd Ed.) (pp.309-334).
New York, NY: Routledge.
Levinson, J. D., Young, D. M., & Rudman, L. A. (2012). Implicit Racial Bias: A social
science overview. In J. D. Levinson & R. J. Smith (Eds.) Implicit Racial Bias Across
the Law (pp.9-24). Cambridge: Cambridge University Press.
Liu, W. M. (2011). Social Class and Classism in the Helping Professions: Research,
Theory, and Practice. London: Sage Publications LTD.
Liu, W. M. (2013). Future Directions for Scholarship in Social Class and Classism in
Psychology. In W. M. Liu (Ed.) The Oxford Handbook of Social Class in Counseling
(pp.554-557). New York, NY: Oxford University Press.
146

147
Liu, W. M., Ali, S. R., Soleck, G., Hopps, J., Dunston, K., & Pickett, T. (2004a). Using
Social Class in Counseling Psychology Research. Journal of Counselling Psychology,
51(1), 3-18. eric:EJ684845
Liu, W. M., Pickett, T., & Ivey, A. E. (2007). White Middle-Class Privilege: Social
Bias and Implications for Training and Practice. Journal of Multicultural Counseling
and Development, 35, 95-122. doi:10.1002/j.2161- 1912.2007.tb00060.x
Liu, W. M., Soleck, G., Hopps, J., Dunston, K., & Pickett, T. (2004b). A new framework to
understand social class in counselling: The Social Class Worldview Model and
Modern Classism Theory. Journal of Multicultural Counselling and Development, 32,
95-122. doi:10.1002/j.2161-1912.2004.tb00364.x
Lopez, S. R. (1989). Patient Variable Biases in Clinical Judgements: Conceptual Overview
and Methodological Considerations. Psychological Bulletin, 106, 184 – 203.
pmid:2678201.
Loring, M., & Powell, B. (1988). Gender, Race and DSM-III: A study of the objectivity of
psychiatric diagnosis. Journal of Health and Social Behaviour, 29, 1-22.
pmid:3367027.
Lott, B. (2002). Cognitive and behavioural distancing from the poor. American
Psychologist, 57, 100– 110. doi: 10.1037/0003-066X.57.2.100.
Luhman, R. (1990). Appalachian English Stereotypes: Language attitudes in Kentucky.
Language in Society, 19, 331-348. doi:10.1017/S00474045000114548
Macdonald, S., Anglin-Bodrug, K., Mann, R. E., Erickson, P. Hathaway, A., Chipman, M., &
Rylett, M. (2003). Injury risk associated with cannabis and cocaine use. Drug and
Alcohol Dependence, 72, 99-115. pmid:14636965.
147

148
Macintyre, S., McKay, L., Der, G., & Hiscock, R. (2003). Socio-economic position and
health: What you observe depends on how you measure it. Journal of Public Health
Medicine, 25, 288-294. pmid:14747587.
Margallo-Lana, M., Reichelt, K., Hayes, P., Lee, L., Fossey, J., O’Brien, J., & Ballard C.
(2001). Longitudinal comparison of depression, coping, and turnover among NHS and
private sector staff caring for people with dementia. BMJ, 322(7289), 769–770.
doi:10.1136/bmj.322.7289.769
McConahay, J. B. (1986). Modern Racism, Ambivalence, and the modern racism scale. In J.
F. Dovidio & S. L. Gaertner (Eds.) Prejudice, discrimination and racism, (pp.91-
125). Orlando, FL: Academic Press
McKinlay, J. B., Burns, R. B., Durante, R., Feldman, H. A., Freund, K. M., Harrow, B. S. …
&, Moskowitz, M. A. (1997). Patient, Physician and Presentational Influences on
Clinical Decision Making for Breast Cancer: Results from a Factorial Experiment.
Journal of Evaluation in Clinical Practice, 3(1), 23-57.pmid:9238607
Measham, F. (2002). Doing Gender-Doing Drugs! Conceptualising the gendering of
drugs culture. Contemporary Drug Problems, 29, 335-373. doi:
10.1177/009145090202900206
Messner, M. A. (2000). White Guy Habitus in the Classroom: Confronting the
Reproduction of Privilege. Men and Masculinities, 2, 457-469.
Messner, M. A. (2011). The Privilege of Teaching About Privilege. Sociological
Perspectives, 54 (1), 3-13. doi: 10.1525/sop.2011.54.1.3
Mikton, C., & Grounds, A. (2007). Cross-cultural clinical judgment bias in personality
disorder diagnosis by forensic psychiatrists in the UK: A case-vignette study. Journal
of Personality Disorders, 21(4), 400–417. doi: 10.1521/pedi.2007.21.4.400
148

149
Miller, D. T. (2001). Disrespect and the experience of injustice. Annual Review of
Psychology, 52, 527-553. doi:10.1146.annurev.psych.52.1.527.
Miller, K. L., Miller, S. M., & Stull, J. C. (2007). Predictors of Counselor Educators’
Cultural Discriminatory Behaviours. Journal of Counselling and Development, 85,
325-336. doi:10.1002/j.1556-6678.2007.tb00481.x
Miller, J. W., Naimi, T. S., Brewer, R. D., & Jones, S. E. (2007). Binge Drinking and
associated health risk behaviours among high school students. Paediatrics,
119, 76-85. doi:10.1542/peds,2006-1517.
Minick, P., Kee, C. C., Borkat, L., Cain, T., & Oparah-Iwobi, T. (1998). Nurses'
perceptions of people who are homeless. Western Journal of Nursing Research, 20(3),
356-369. doi:10.1177/019394599802000307
Mohr, J. J., Weiner, J. L., Chopp, R. M., & Wong, S. J. (2009). Effects of client bisexuality
on clinical judgment: When is bias most likely to occur? Journal of Counseling
Psychology, 56(1), 164–175. doi:10.1037/a0012816.
NHS Staff Council (2016). Agenda for Change: NHS Terms and Conditions of Service
Handbook (Amendment Number 37). Leeds: Author.
Nosek, B. A. (2007). Implicit-Explicit Relations. Current Directions in Psychological
Science, 16(2), 65–69. doi : 10.1111/j.1467-8721.2007.00477.x.55.
Nosek, B. A., Bar-Anan, Y., Sriram, N., Axt, J., & Greenwald, A. G. (2014).
Understanding and Using the Brief Implicit Association Test: Recommended
Scoring Procedures. PLOS one, 9(12), 1-31. doi:10.1371/journal.pone.0110938.
Olfson, M., Zarin, D. A., Mittman, B. S., & McIntyre, J. S. (2001). Is gender a factor in
psychiatrists’ evaluation and treatment of patients with major depression? Journal of
Affective Disorders, 63(1-3), 149–157. pmid:11246091
149

150
Oswald, F.L., Mitchell, G., Blanton, H., Jaccard, J., & Tetlock, P.E. (2013). Predicting ethnic
and racial discrimination: a meta-analysis of IAT criterion studies. Journal of
Personality and Social Psychology, 105, 171–192. doi: 10.1037/a0032734
Partiali, N. R., Takamatsu, S. K., & Iwamoto, D. K. (2013). Social Class: The Hidden
Disparity in Substance Abuse and Treatment. In W. M. Liu (Ed.) The Oxford
Handbook of Social Class in Counseling (pp.247-260). New York, NY: Oxford
University Press.
Peacock-Brennan, S. & Harper, D. (2015). Improving Public Discussion About Inequality.
London: Psychologists Against Austerity.
Perneger, T. V. (1998). What’s wrong with Bonferroni adjustments. BMJ, 316, 1236. doi:
101.1136/bmj.316.7139.1236
Phillips, S. B. (2011). Up Close and Personal: A Consideration of the Development of a
Psychotherapist. In R. H. Klein, H. S. Bernard & V. L. Schermer (Eds.), On Becoming
a Psychotherapist: The Personal and Professional Journey (pp.144-165). Oxford
University Press.
Piff, P. K. (2014). Wealth and the Inflated Self: Class, Entitlement and Narcissism.
Personality and Social Psychology Bulletin, 40(1), 34-43. doi:10.1177/0146
167213501699.
Piff, P. K., Martinez, A. G., & Keltner, D. (2012). Me against we: Ingroup
transgression, collective shame and ingroup-directed hostility. Cognition and
Emotion,26(4), 634-649.doi: 10.1080//02699931.2011.595394.
Poortinga, W., Dustan, F. D., & Fone, D. L. (2008). Health Locus of Control Beliefs and
Socio-Economic Differences in Self-Rated Health. Preventative Medicine, 46, 374-
380. doi: 10.1016/j.ypmed.2007.11.015
150
151
Pratto F., Korchmaros J. D., & Hegarty P. (2007) When race and gender go without
saying. Social Cognition, 25, 221–247. doi: 10.1521/soco.2007.25.2.221
Purhouse, R., Brennan, A., Latimer, N., Meng, Y., Radia, R., Jackson, R., & Meier, P.
(2009). Modelling to assess the effectiveness and cost effectiveness of public
health related strategies and interventions to reduce alcohol attributable harm in
England using the Sheffield Alcohol Poly Model Version 2.0. London: NICE Public
Health Program Development Group.
Qualtrics (2017). Qualtrics Version: April 2016 - Dec 2016. Provo, UT: Qualtrics.
Ridgeway, C. (2009). Framed before we know it: How gender shapes social relations.
Gender & Society, 23(2), 145-160. doi:10.1177/0891243208330313
Roccato, M., & Zogmaister, C. (2010). Predicting the Vote through Implicit and Explicit
Attitudes: A Field Research. Political Psychology, 31(2), 249- 274. doi:
10.1111/j.1467-9221.2009.00751.x.
Rooth, S. (2010). Automatic Associations and Discrimination in Hiring: Real world evidence.
Labour Economics, 17(3), 523-534. doi: 10.1016/j.labeco.2009.04.005
Roysircar, G. (2008). A response to “Social privilege, social justice and group
counselling: an enquiry; Social privilege: Counselors’ competence with
systemically determined inequalities. Journal for specialists in group work,
33(4), 377-384. doi: 10.1080/01933920802424456.
Ruck, M. D., & Tenenbaum, H. R. (2014). Does moral and social conventional reasoning
predict British young people’s judgments about the rights of asylum-seeker
youth? Journal of Social Issues, 70, 47-62. doi: 10.1111/josi.12046.
Rudman, L. A. (2004). Social justice in our minds, homes and society: The nature,
causes and consequences of implicit bias. Social Justice Research, 17, 129-
142. doi:10.1023/B:SORE.0000027406.32604.f6
151

152
Rudolfsdottir, A. G., & Morgan, P. (2009). ’Alcohol is my Friend’: Young Middle
Class Women Discuss their Relationship with Alcohol. Journal of Community and
Applied Social Psychology, 19, 492-505. doi:10.1002/casp.999.
Sabin, J. A., Rivara, F. P., & Greenwald, A. G. (2008). Physician Implicit Attitudes and
Stereotypes about Race and Quality of Medical Care. Medical Care, 46(7), 678-685.
doi:10.1097/MLR.0b013e3181653d58.
Saunders, P. (2002). Reflections on the meritocracy debate in Britain: a response to
Richard Breen and John Goldthorpe. British Journal of Sociology, 53 (4), 559-74. doi:
10.1080/0007131022000021489.
Sennet, R., & Cobb, J. (1972). The Hidden Injuries of Class. New York, NY: WW.
Norton and Company.
Shanks, D. R. (2016). Regressive Research: the pitfalls of post hoc data selection in the study
of unconscious mental processes. Psychonomic Bulletin & Review, x, 1-24. doi:
10.3758/s13423-016-1170-y.
Shavers, V. L. (2007). Measurement of Socioeconomic Status in Health Disparities
Research. Journal of National Medical Association, 99(9), 1013-1023.pmcid:
PMC2575866.
Simpson, T. L. (2003). Childhood Sexual Abuse, PTSD, and the Functional Roles of
Alcohol Use Among Women Drinkers. Substance Use & Misuse, 38(2), 249-
270.
Simpson, T. L., Stappenbeck, C. A., Luterek, J. A., Lehavot, K., Kaysen, D. L., &
Goodman, S. (2014). Drinking Motives Moderate Daily Relationships Between PTSD
Symptoms and Alcohol Use. Journal of Abnormal Psychology, 123(1), 237-247.
pmid:12625430.
152

153
Singh-Manoux, A., Adler, N. E., & Marmot, M. G. (2003). Subjective social status: Its
determinants and its association with measures of ill-health in Whitehall II study.
Social Science and Medicine, 56, 1321-1333. doi:10.1016/S0277- 9536(02)00131-4.
Skeggs, B. & Wood, H. (2004). Notes on ethical scenarios of self on British Reality TV.
Feminist Media Studies, 4(1), 205-208.
Skeggs, B. (2005). Class, Self and Culture. London: Routledge.
Smail, D. J. (2005). Power, interest and psychology: Elements of a social materialist
understanding of distress. Ross-On-Wye: PCCS Books.
Smith, L. (2005). Psychotherapy, classism, and the poor: Conspicuous by their absence.
American Psychologist, 60 (7), 687-696. doi:10.1037/0003-066X.60.7.687
Smith, L. (2009). Training and Education in Professional Psychology. American
Psychological Association, 3(2), 84-93.
Smith, L. (2010). Poverty, Psychology, and the End of Social Exclusion: Putting our
practice to work. New York, NY: Teachers College Press.
Smith, L., & Redington, R. (2010). Class Dismissed: Making the Case for the Study of
Classist Microaggressions. In D. W. Sue (Ed.) Microagressions and marginalized
groups in society: race, gender, sexual orientation, class and religious manifestations
(pp.269-286). New York, NY: Wiley.
Smith, L., Shellman, A., & Smith, R. (2013). Inequality, Poverty, and Counseling Practice. In
W. M. Liu (Ed.) The Oxford Handbook of Social Class in Counseling, (pp.428-446).
New York, NY: Oxford University Press.
Southerton, D. (2002). Boundaries of ‘us’ and ‘them’: class, mobility, and identification in a
new town. Sociology, 36(1), 171-193.doi: 10.1177/003803 8502036001009.
153
154
Spencer, B., & Castano, E. (2007). Social Class is Dead. Long Live Social Class! Stereotype
Threat among Low Socioeconomic Status Individuals. Soc Jus Res, 20, 418-432.
doi:10.1007/s11211-007-0047-7.
Spencer, S., Clegg, J., & Stackhouse, J. (2013). Language, social class and education:
listening to adolescents’ perceptions. Language and Education, 27 (2), 129-143. doi:
10.1080/09500782.2012.760585.
Sriram, N., & Greenwald, A. G. (2009). The Brief Implicit Association Test.
Experimental Psychology 56 (4), 283-294. doi: 10.1027/1618-3169.56.4.283.
Stanislavski, K. (1936/1988). An Actor Prepares. London: Methuen.
Stanislavski, K. (1961). Creating a Role. London: Mentor.
Stanwell-Smith, R. (2014). Health Inequality – is it all about social class? Perspectives in
Public Health, 134(6), 306. doi:10.1177/1757913914552776.
Stapinski, L., Edwards, A. C., Hickman, M., Araya, R., Teesson, M., Newton, N. C., …
Heron, J. (2016). Drinking to Cope: a Latent Class Analysis of Coping Motives for
Alcohol Use in a Large Cohort of Adolescents. Prevention Science, 17, 584–594.
doi:10.1007/s11121-016-0652-5
Sternberg, S. (2001) Separate modifiability, mental modules, and the use of pure and
composite measures to reveal them. Acta Psychologica, 106, 147-246.pmid:
11256336.
Stolte, J. F. (1994). The context of satisficing in vignette research. Journal of
Social Psychology, 134, 727-733.doi:10.1080/00224545.1994.9923007.
Sue, D. W., & Sue, D. (2008). Counseling the Culturally Diverse: Theory and Practice (5th
ed.). New York, NY: Wiley.
154
155
Sullivan, D., Landau, M., Branscombe, N., & Rothschild, Z. (2012). Competitive
Victimhood as a Response to Accusations of Ingroup Harm Doing. Journal of
Personality and Social Psychology, 102(4), 778-795. doi:10.1037/a0026573.
Taylor, S. E. & Seeman, T. E. (1999). Psychosocial resources and the SES-Health
Relationship. Annals of the New York Academy of Sciences, 896, 210-225.
pmid: 10681899
Tetlock, P. E. & Mitchell, G. (2009). Implicit bias and accountability systems: what
must organisations do to prevent discrimination? Research in Organisational
Behaviour, 29, 3-38. doi:10.1016/j.riob.2009.10.002.
Thompson, M., Diestelmann, J., Cole, O., Keller, A., & Minami, T. (2014). Influence of
social class perceptions on attributions among mental health practitioners.
Psychotherapy Research: Journal of the Society for Psychotherapy Research, 24(6),
640–50. doi:10.1080/10503307.2013.873556
Toporek, R. L. (2013). Social Class, Classism, and Social Justice. In W. M. Liu (Ed.) The
Oxford Handbook of Social Class in Counseling (pp.21-35). New York, NY: Oxford
University Press.
Tyler, I. (2008). Chav Mum Chav Scum. Feminist Media Studies, 8(10), 17-34. doi:
10.1080/14680770701824779.
van Leeuwen, T. (2008). Discourse and Practice. Oxford: Oxford University Press.
Vlietstra, T. (2015). How is Mental Health Practitioner Bias Measured in regards to
Clinical Reasoning? Unpublished
Vlietstra, T. (2017). The impact of Social Class Bias on healthcare professionals’ Clinical
reasoning. Unpublished
155
156
Vlietstra, T., Peel, Z. & McNamara, A. (Under Review). Hiding in Plain Sight: Implicit
Class Prejudice in British Society. Under Review
Wardle, J., & Steptoe, A. (2003). Socioeconomic differences in attitudes and beliefs
about healthy lifestyles. Journal of Epidemiology and Community Health, 57,
440-443. doi:10.1136/jech.57.6.440.
Weingarten, K. (2003). Common Shock. Boston, MA: Dutton.
Wilkinson, R., & Pickett, K. (2009). The spirit level: Why greater equality makes societies
stronger. London: Penguin.
Wittenbrink, B. (2007). Measuring Attitudes through Priming. In B. Wittenbrink, & N.
Schwarz (Eds.) Implicit Measures of Attitudes (pp. 17-59). London: The Guildford
Press.
Wohlfarth, T. & Van Den Brink, W. (1998). Social Class and Substance Use Disorders: The
Value of Social Class as Distinct from Socioeconomic Status. Social Science and
Medicine, 47, 51-58. pmid: 9683378.
156

157
List of Appendices
Appendix A: Script for Vignettes.......................................................................................157Appendix B: Full Procedure and Measures Used...............................................................161Appendix C: Advertisement - Letters.................................................................................174Appendix D: Advertisement - Poster..................................................................................175Appendix E: Ethical Acceptance........................................................................................176Appendix F: Main Effect Normality Plot...........................................................................184Appendix G: Residual Plots for Moderation......................................................................190
157

158
Appendix A – Script of Vignettes
Content:
The script meets the formal criteria for multiple diagnoses from the DSM-V (APA, 2013);
symptoms are distributed throughout the script from the following diagnostic categories
1. Schizophrenia spectrum or other psychotic disorder2. Bipolar disorder3. Depressive disorder 4. Anxiety disorder5. Substance-related and addictive disorder6. Borderline personality disorder7. Antisocial personality sisorder
Script:
David White is a 25 year old White British Male from London. He was referred to
psychological services by his GP. David had been punching through a window in his flat and
this required a visit to A&E due to the severity of the cuts. When removing the stiches the GP
was concerned by David’s presentation and description of difficulties…
Therapist:
Hi David, thanks for much for coming today. I wondered if you could begin by telling me…
David:
I’m kind of embarrassed to be honest … I put my fist through a window at my flat, went to
A&E and had to have a stiches. When my GP removed them …we were talking about what
happened and he said he was concerned … and said coming here might help… not sure if I
can be helped… but worth a try, you know.
158
159
Therapist:
That sounds really tough, what’s been going on for you?
David:
Yeah it has been tough…
Things have been going properly wrong for like a year, I’m not saying stuffs been perfect
before then, like it’s always been up and down since I was a teenager, but it’s like, different
now you know?
I always enjoyed going out for a drink or having a smoke with my friends, but I find I’m
doing this more and more often by myself in my flat. Just to like feel something you know?
I’m just at the point where I don’t think I can go on… Like what’s the point? Before the
window - I hadn’t slept in three nights. Like there have been times if I’m stressed I might
burn myself with my lighter, but that’s just superficial, the window was different.
The day with the window, I just felt so empty and drained. And I was thinking about stuff and
that’s when I did it, I put my fist through it. Like that’s not me, you know? I just look in the
mirror and I’m like “who even is this person.”
I’ve just been feeling so low and shaky, like some days I don’t even get out of bed. Like if I
get out of bed I’m not going to cope; my head feels like it’s buzzing and like I’m just so
panicked. Like I’m having a heart attack or stroke or something. Like today… I’m here now,
but it’s like I’ve got a mask, you know? Like I want to walk out because I can’t cope, and feel
so anxious.
159

160
…pause…
I just lost my train of thought, what was I supposed to be talking about?
Therapist:
You mentioned that things have changed the past year…
David:
Oh yeah… sorry… I remember now.
Yeah about a year ago, it seemed my job was going really well. I mean I still had a couple of
bad days. But the company was going through a big restructure. I felt like I was doing really
well at work.
…Like I would mess about at school, but you know what it’s like in that kind of
environment; me and my friends thought we were invincible. But I still tried to focus hard…
At work it was different, and I loved my job – and had a good set of friends who I’d go for
drinks with. But when I heard we would be losing jobs in the restructure I felt so anxious, and
then I started to have more bad days. Sometimes it was too much and then I wouldn’t come
in. And then I would worry that people could tell what was going on with me; I was 100%
sure they would be talking about me when I wasn’t in.
I just feel so stupid, because like, I stopped turning up at work and felt like I couldn’t tell
anyone…. And then with the restructure, they didn’t renew my contract but renewed my
friends. My friends were kind of supportive at the time but more relieved because they still
had their job. And I felt kind of alone and isolated myself, like, I was really really angry but
then in turn I just gave up and felt really sad. My friends would post things on facebook, like
photos of drinks after work, probably to spite me, and they were still hanging out with a
group of girls we used to hang out with, and I really liked one of them.
160

161
I have had girlfriends, and dated, but now I just don’t want to. Or rather, I can’t. Like I feel I
need someone to depend on, but they’d probably cheat on me or leave me when they found
out how worthless I am. So I just don’t bother.
I tried to make myself feel better by buying things, but you know how that ends. I would
impulse buy like big things or go out on nights out by myself, but that was short lived and I’d
feel rubbish after. So that’s when I just began staying in bed and not doing anything, getting
scared I couldn’t cope and all that. Like I don’t even like going out now… like today… in
case I see someone from work, or an ex or someone who knows them, because they’ll see
how much of a loser I am. You know? I just want it to change… but I can’t see how.
161

162
Appendix B – Full Procedure and Measures Used
Below is the procedure and measures of the study as presented in Qualtrics (2017). NHS trust
identifiers have been removed to preserve confidentiality:
1.Information Sheet
Psychological Professions and Clinical Decision Making within the NHS
Participant Information Sheet
My name is Tom Vlietstra (Trainee Clinical Psychologist, University of Surrey) and I would like to invite you to take part in my study which looks at how the Psychological and Therapeutic professions within the NHS engage in Clinical Decision making. The research is supervised by Linda Morison, a Chartered Psychologist and Senior Lecturer at the University of Surrey and Dr. Adam McNamara, Research Fellow at the University of Nottingham.
Am I eligible to take part?To be eligible to take part, you will need to be over the age of 18 years, have a British Citizenship and lived in Britain since the age of 5. You are required to be an NHS employee working within a psychological profession or training program. This would include (but would not be limited to): Trainee Psychological Wellbeing Practitioner, Psychological Wellbeing Practitioner, Assistant Psychologist, Trainee Clinical Psychologist, Trainee Counselling Psychologist, Clinical Psychologist, Counselling Psychologist, Cognitive-Behavioural Therapist, Family Therapist, Systemic Psychotherapist, Psychodynamic Psychotherapist, Counsellor, and Art Psychotherapist.
Do I have to take part?Participation in this research is entirely voluntary. You are under no obligations to take part and have a right to withdraw from the study at any point up until completion of the online survey. After completion of the study, as all of the data is anonymised, your responses will not be able to be removed as you will not be able to be identified from your data. To withdraw from the research during the survey, simply close the browser by clicking on the X in the top right hand corner of the window.
What will I have to do?You will require the volume of your computer to be turned on or use headphones. Please minimise any distractions prior to completing the survey.You will be asked to watch a 5 minute video vignette of part of a psychological assessment session and then complete a survey and a reaction time experiment. The survey will comprise of questions around formulation, aspects of clinical decision making and your own personal responses. The reaction time task will involve sorting pictures and words in relation to the above.The survey will take approximately 20-25 minutes to complete.This study can not be completed on telephone or tablet devices.
162

163
What will happen to my data?No personal data will be collected during the survey. Your responses will remain confidential, and anonymous upon completion of the survey. There will be no way to identify you or your responses; therefore once the survey is complete it would not be possible to retract your data. The data will be handled by the researcher and shared with the supervisor. In- line with University of Surrey Policy, all data will be securely stored for a minimum of 10 years. The study will be completed and submitted to the University in March 2017. It is usual practice for researchers to publish their findings in professional journals so that research can be shared within the profession. Additionally, data provided may be used in further research projects (including undergraduate research projects). Again, your anonymity will be upheld throughout this process.
What are the benefits and downsides of taking part in this research?Although there may be no direct benefits of taking part in this research, the process of completing the survey will allow you to reflect on aspects of your work which you may find useful on personal and professional levels. The results may be beneficial in developing our understanding of clinical decision making for psychologists within the NHS, which may have implications for service development and future training programs.The video footage and questions contain reference to experiences of mental health service users. This may include: suicidality, self-harm, distress, challenging language. It is expected that you would implement strategies to manage this as you would in your clinical work. However, if you find some of the footage or questions too upsetting or personal then you do not have to answer them or can leave the survey at any time. As we are aware of the potential that some people may be caused upset upon completion of the survey, you will receive a full debriefing at the end of the survey and will be signposted to appropriate sources of support if you feel that you need to discuss things further.
Thank you for taking the time to read this information sheet.
If you would like to continue to take part in the research then select the “PLEASE CLICK HERE TO START THE SURVEY” button at the bottom of the page. If you have decided not to take part, then please close the browser.
Who can I contact about this research?This study has been reviewed and received a favourable ethical opinion from the University of Surrey Faculty of Health and Medical Sciences Ethics Committee and NHS Health Research Authority (IRAS ID: ____________________).
Permission to be completed on NHS sites has been provided from:________________________
As additional permissions are granted they shall appear at the bottom of this survey.
Researcher:Tom VlietstraContact Address and Email
163
164
Supervisor:Linda MorisonContact Address and Email
Program Director:Mary JohnContact Address and Email
2. Consent Form
Please read each statement and tick each box to provide informed consent to take part in this study.
I voluntarily agree to take part in the study I have read and understood the Information Sheet provided. I have been given an
explanation by the investigators of the nature, purpose, location and likely duration of the study, and of what I will be expected to do. I have been advised about any discomfort and possible ill-effects on my health and well-being which may result.
I have been given the researcher’s details and have had the opportunity to contact them and to ask questions on all aspects of the study
I have been advised that participation in this research is of a clinically sensitive nature and may cause me some distress and I have been advised of that sources of support will be provided that I can contact if that occurs.
I agree to comply with any instruction given to me during the study and to co-operate fully with the investigators.
I am happy for the researcher to write about and publish my responses given in the survey on the understanding that my data will remain anonymous.
I consent to my personal data, as outlined in the accompanying information sheet, being used for this study and other research. I understand that all personal data relating to volunteers is held and processed in the strictest confidence, and in accordance with the Data Protection Act (1998).
I understand that I am free to withdraw from the study at any time without needing to justify my decision and without prejudice.
I confirm that I have read and understood the above and freely consent to participating in this study. I have been given adequate time to consider my participation and agree to comply with the instructions and restrictions of the study
3. Exclusion Criteria
Are you an NHS Employee (Yes/No)
164

165
Are you a British Citizen (Yes/No)
Have you lived in the UK since the age of 5 (Yes/No)
4. Demographic Information
1. What is your Gender:
MaleFemaleOther (please specify):
2. What is your age?
3. What is your highest educational qualification?
No QualificationsGCSEs, O- Levels (or equivalent)A Levels (or equivalent)Diploma (or equivalent)Degree Level (or equivalent)Postgraduate (non-doctoral)Postgraduate (doctoral)
4. What ethnicity do you consider yourself to be?
WhiteBritishIrishAny other White BackgroundMixedWhite and Black CarribbeanWhite and Black AfricanWhite and AsianAny other Mixed BackgroundAsian or Asian BritishIndianPakistaniBangladeshiAny other Asian BackgroundBlack or Black British
165

166
CaribbeanAfricanAny other Black backgroundChinese or Other Ethnic groupChineseAny other Ethnic groupOther (please specify):Do not wish to say
5. What is your current job role within the NHS?
6. What is your current NHS banding?
Honorary (unpaid)Student (unpaid)Band 1Band 2Band 3Band 4Band 5Band 6Band 7Band 8aBand 8bBand 8cBand 8dBand 9
7. How many years’ experience do you have working in a psychological/therapeutic profession?
8. Do you supervise other employees or students?
YesNo
5. Video Vignette
See Figure 1 and Appendix A
166

167
6. Formulation Task (timed for cognitive resources)
Tell us in your own words what you believe David’s difficulties to be. If you feel necessary, provide a brief formulation and information about any potential treatment recommendations.
7. Clinical Reasoning Task
(All questions presented on a sliding bar visual analogue scale 1-100)
Please answer the following questions in relation to the assessment session you have observed, place a mark on the line which you feel best represents your response.
Seriousness of Current Problems (0 – not serious, 10 – very serious)
How would you rate the seriousness of David’s current difficulties?
Specific Diagnoses
Please select the likelihood David would be diagnosed with (0 not at all, 100 incredibly likely):
Neurodevelopmental Disorder (e.g. Autism Spectrum, Attention Deficit, Learning Disorder)
Schizophrenia Spectrum or Other Psychotic Disorder (e.g. Schizophrenia, Schizoaffective Disorder)
Bipolar Disorder
Depressive Disorder
Anxiety Disorder (e.g. Panic, Social Anxiety, Generalised Anxiety)
Substance-Related and Addictive Disorder (e.g. Alcohol, Cannabis, Stimulant, Gambling)
Borderline Personality Disorder
Antisocial Personality Disorder
Primary Diagnosis
Please select the most likely condition David would be diagnosed with:
167

168
Neurodevelopmental DisorderSchizophrenia Spectrum or Other Psychotic DisorderBipolar DisorderDepressive DisorderAnxiety DisorderSubstance-Related and Addictive DisorderBorderline Personality DisorderAntisocial Personality Disorder
Risk
What is the risk of David…
Causing harm to self (0 – no risk, 100 – high risk)
Causing harm to others (0 – no risk, 100 – high risk)
Having a future suicide attempt (0 – no risk, 100 – high risk)
Treatment
Using your clinical judgment rate David’s…
Need for medication (0 – no need, 100 – high need)
Need for hospitalisation (0 no need, 100 – high need)
Suitability for psychological treatment (0 – not suitable, 100 – highly suitable)
Ability to develop therapeutic relationship (0 – no ability, 100 high ability)
Motivation for change (0 very unmotivated, 100 – high motivated)
Likelihood client will improve with treatment (0 very unlikey – 100 highly likely)
Please rate the Likelihood David would benefit from:
Skills based psycho-education (0 – very unlikely, 100 – highly likely)
Short term therapy (0 – very unlikely, 100 – highly likely)
Long term therapy (0 – very unlikely, 100 – highly likely)
Family Therapy (0 – very unlikely, 100 – highly likely)
Self-Help Book (0 – very unlikely, 100 – highly likely)
8. Diversity Awareness
168
169
When thinking about your Clinical Work in general, which are the three areas of 'diversity and difference' you are most aware of? (please list)
123
9. Class Awareness Scale
(Sliding VAS 0 Strongly disagree, 100 – Strongly Agree)
Please mark on the line where the statement best represents your experience in your clinical work.
1. I am aware a client’s social class may elicit personal feelings *2. I am capable of reflecting on my feelings in relation to my own social class*3. I am aware of unresolved personal conflicts I may have in relation to my own social
class*4. I am aware that my own social class may impact the treatment of a client*5. I do not make assumptions of a client I perceive to be of a similar social class.*
(reverse scoring)6. I am aware I may make judgements of a client I perceive to be of a different social
class.#7. I am certain that my social class would not lead me to impose beliefs onto a client #
(reverse scoring)8. I am more likely to give advice to a client of a different social class#9. I am unable to process perceptions of a client based on their social class^ (reverse
scoring)10. I have discussed a client’s difficulties in terms of their social class with my
supervisor.<11. I tend not to include the impact of a client’s social class in the formulation of their
difficulties~ (reverse scoring)
Questions developed from:
* - Self Insight Measure (Hayes et al., 1991)
169

170
# - Awareness of Values Scale (Larson et al., 1992)
^ - Based on Ladany and Krikorian (2013)
< - Based on Smith (2009)
~ - Based on Falconnier (2010)
10.Social Class Demographic Information
1. Do you think of yourself as belonging to any particular social class?
YesNo
2. (If you had to choose) place the slider where you would position yourself on the following continuum (0 Lowest Social Class, 100 Highest Social Class)
Current Social Class Childhood Social Class
3. (If you had to choose). Which social class would you say you belong to?
Upper ClassUpper-Middle ClassMiddle ClassLower-Middle ClassWorking ClassUnder Class
4. (If you had to choose). Which social class would you say you grew up as?
Upper ClassUpper-Middle ClassMiddle ClassLower-Middle ClassWorking ClassUnder Class
10. Brief Implicit Association Test
170
171
This section contains further information the BIAT used in the experiment, alongside examples of the stimuli used. For a practical example of how a BIAT works and runs please see projectimplicit.net.
BIAT procedure:
Block Trials Trial Structure Focal Stimuli Non-Focal Stimuli1 16 4 Attribute only + 12
trials alternating between category and attribute
Good Words (attribute) and Mammals (category)
Bad Words (attribute) and birds (category)
2 20 4 Attribute only + 16 trials alternating category and attribute
Good Words (attribute) and Upper Class (category)
Bad Words (attribute) and Lower Class (category)
3 20 4 Attribute only + 16 trials alternating category and attribute
Good Words (attribute) and Lower Class (category)
Bad Words (attribute) and Upper Class (category)
4 20 4 Attribute only + 16 trials alternating category and attribute
Good Words (attribute) and Upper Class (category)
Bad Words (attribute) and Lower Class (category)
5 20 4 Attribute only + 16 trials alternating category and attribute
Good Words (attribute) and Lower Class (category)
Bad Words (attribute) and Upper Class (category)
Block 1 contains neutral stimuli (Mammals/Birds) to habituate participants to the measure. The order of blocks 2 and 3 with blocks 3 and 5 will be counterbalanced. The trial begins with the onset of the stimulus and ends once a correct categorisation has been made. Clarity between the two dimensions (Lower Class/Upper Class and Good/Bad) will be enhanced by presenting the labels and stimulus items from each dimension in a different colour or stimulus format (Lower Class/Upper Class as images; Good/Bad as words)
Stimuli of the BIAT:
Good Words:
Love, Nice, Smile, Happy,
Bad Words:
Horrible, Ugly, Sick, Nasty
Bird Images:
171

172
Mammal Images:
Lower Class Images:
Upper Class Images:
11. Debrief Sheet
Thank you for participating in this research. The survey is nearly complete. Below is some further information about the nature of the study.
Post-survey Information Sheet
You were told on the information sheet that this research was investigating how Psychological Professionals within the NHS engage in clinical decision making. The research specifically focused on looking at implicit Social Class Biases and the impact they have on Psychologists’ decision making. Sharing the true nature of the study at the beginning would have decreased the impact implicit mechanisms would have on your reasoning.
Many forms of mental health training require reflection on the dynamics of the professional-client relationship; emphasis is placed on nonjudgementality, understanding the role of diversity and becoming aware of personal biases. Nonetheless, professional biases in relation to clients’ sexuality, race and gender have been seen to impact willingness to work with a
172

173
client including: treatment recommendations, diagnosis, prognosis, and perceptions of risk and violence. To date, there has been minimal engagement with social class bias, especially within British or NHS settings.
During the experiment, you were randomly allocated into one of two conditions when asked to watch the assessment video. Both videos had the same script, actor and pacing- however the accent and dress of the client were altered to represent British class stereotypes. The presentation of the client was designed to create ambiguity to increase the likelihood that biases were elicited.
After this, you completed a formulation task, and answered questions around clinical reasoning and your personal response to the client. These will be compared between the video conditions to assess for any differences.
You were then asked to rate factors of diversity which could impact clinical work. We are interested to see if social class was included in the list and how highly it was rated relative to other areas of diversity.
You were then asked questions around class and your clinical work; these were developed to see if they impacted any of the responses given.
The reaction time experiment was called a ‘Brief Implicit Association Test’ – this measures your ability to compare positive and negative terms to class based images. This would then give a rating of implicit bias/preference towards certain levels of social standing. Our previous research has found that individuals in Britain, regardless of their social standing, tend to have an implicit preference towards the upper class.
Your response to this study was completely anonymous therefore any answers given during the survey cannot be linked to yourself or your place of work.
This research will potentially have implications for training of mental health programs, staff training and guiding reflections and discussions in supervision. As Burnham (2005) has outlined, members of the Psychological profession should be striving for ways to become aware of their biases and the impact they have on their practice. We hope that the survey has allowed you to reflect on the ways social class bias (akin to other diversity factors: gender, race, sexuality) could impact you in your work. This may be a basis for further reflections or discussion in supervision.
If any issues have arisen for you throughout the completion of this survey you may wish to raise these for reflection with your NHS supervisor, or if you have been left feeling upset or distressed and would like to talk to someone then please contact the following support line:
Samaritans: 116 123
Alternatively, you can also contact your GP or NHS counselling service to discuss any concerns that you may have.
173

174
If you have any further questions about the research then please do not hesitate to contact Tom on __________________
If you wish to make a comment or complaint about the current study then please contact the project supervisor Linda Morison on _______________ or head of the Clinical Psychology program, Mary John on ________________
If you know any other Psychological Professional within your trust who you think would also like to take part in this study, then I would be grateful if you could forward the hyperlink for this survey on to them.
Please do not share the true nature of the study as it may impact their response.
Thank you again for your participation.
174

175
Appendix C – Advertisement Letters:
Below is an anonymised version of the letters sent to teams to request advertisement of
the research project.
“Dear ___________________________
My name is Tom Vlietstra (Trainee Clinical Psychologist, University of Surrey) and I am completing my training research on Clinical Reasoning in NHS Psychological and Psychotherapeutic professionals.
I was wondering if you could please share the online project with relevant psychological/psychotherapeutic professionals in your team. This would include (but would not be limited to): Trainee Psychological Wellbeing Practitioner, Psychological Wellbeing Practitioner, Assistant Psychologist, Trainee Clinical Psychologist, Trainee Counselling Psychologist, Clinical Psychologist, Counselling Psychologist, Neuropsychologist, Health Psychologist, Cognitive-Behavioural Therapist, Family Therapist, Systemic Psychotherapist, Psychodynamic Psychotherapist, Counsellor, and Arts Psychotherapists (Dance Movement, Drama, Art, Play).
The study would take between 20-25 minutes to complete on a laptop/desktop computer. No personal data will be collected during the survey. It has received support from University of Surrey Faculty of Health and Medical Sciences Ethics Committee, NHS Health Research Authority (IRAS ID: __________), and _____________ Research and Development Team.
For further information, contact information and a link to the study:
___________________________________________
I have also included posters containing the main information.
Thank you in advance for your time
Yours Sincerely,
[signature]
Tom Vlietstra
Trainee Clinical Psychologist”
175

176
Appendix D – Advertisement Poster
176
Please take part in this anonymous online study looking at Clinical reasoning processes in NHS psychological and psychotherapeutic professions.
For full information and to complete the study click:
__________________________
The study has been reviewed and received a Favourable Ethical Opinion (FEO) from the University of Surrey Ethics Committee and approval from ______ Research and Development.
Are you a Psychological or Psychotherapeutic Professional in the NHS?
OR Are you on a Psychological Training Program or
Clinical Reasoning StudyStudy Hyperlink
Clinical Reasoning StudyStudy Hyperlink
Clinical Reasoning StudyStudy Hyperlink
Clinical Reasoning StudyStudy Hyperlink
Clinical Reasoning StudyStudy Hyperlink
Clinical Reasoning StudyStudy Hyperlink
Clinical Reasoning StudyStudy Hyperlink
Clinical Reasoning StudyStudy Hyperlink
Clinical Reasoning StudyStudy Hyperlink
Clinical Reasoning StudyStudy Hyperlink
177
Appendix E – Ethical Agreements
Below are the ethical agreements which were put in place for the project. NHS agreements
have been suitably anonymised.
Faculty of Health and Medical Sciences Ethics Committee:
Chair’s Action
Proposal Ref: ____________
Names of Student/Trainee:
THOMAS VLIETSTRA
Title of Project: The Impact of Implicit Social Class Bias on NHS Psychological Practitioners’ Clinical Reasoning
Supervisors: Linda Morison, Dr Adam McNamara
Date of submission: 5th January 2016
The above Research Project has been re-submitted to the Faculty of Health and Medical Sciences Ethics Committee and has received a favourable ethical opinion on the basis described in the protocol and supporting documentation.
177

178
The final list of documents reviewed by the Committee is as follows:
Protocol Cover Sheet
Detailed protocol for the project
Participant Information sheet
Consent Form
Risk Assessment (If appropriate)
Insurance Documentation (If appropriate)
All documentation from this project should be retained by the student/trainee in case they are notified and asked to submit their dissertation for an audit.
Signed and Dated: _23/02/2016________________
Dr Anne Arber, Professor Bertram Opitz
Co-Chairs, Ethics Committee
Please note:
If there are any significant changes to your proposal which require further scrutiny, please contact the Faculty of Health and Medical Sciences Ethics Committee before proceeding with your Project.
Health Research Authority:
178

179
“Dear Mr Vlietstra
Study title: The Impact of Implicit Social Class Bias on NHS Psychological Practitioners’ Clinical Reasoning IRAS project ID: ________ Sponsor University of Surrey
Thank you for your request for HRA Approval to be issued for the above referenced study.
I am pleased to confirm that the study has been given HRA Approval. This has been issued on the basis of an existing assessment of regulatory compliance, which has confirmed that the study is compliant with the UK wide standards for research in the NHS. The extension of HRA Approval to this study on this basis allows the sponsor and participating NHS organisations in England to set-up the study in accordance with HRA Approval processes, with decisions on study set-up being taken on the basis of capacity and capability alone.
If you have submitted an amendment to the HRA between 23 March 2016 and the date of this letter, this letter incorporates the HRA Approval for that amendment, which may be implemented in accordance with the amendment categorisation email (e.g. not prior to REC Favourable Opinion, MHRA Clinical Trial Authorisation etc., as applicable). If the submitted amendment included the addition of a new NHS organisation in England, the addition of the new NHS organisation is also approved and should be set up in accordance with HRA Approval processes (e.g. the organisation should be invited to assess and arrange its capacity and capability to deliver the study and confirm once it is ready to do so).
Please note that full information to enable set up of participating NHS organisations in England is not provided in this letter, on the basis that activities to set up these NHS organisations is likely to be underway already.
179

180
The sponsor should provide a copy of this letter, together with the local document package and a list of the documents provided, to participating NHS organisations in England that are being set up in accordance with HRA Approval Processes. It is for the sponsor to ensure that any documents provided to participating organisations are the current, approved documents.
For non-commercial studies the local document package should include an appropriate Statement of Activities and HRA Schedule of Events. The sponsor should also provide the template agreement to be used in the study, where the sponsor is using an agreement in addition to the Statement of Activities. Participating NHS organisations in England should be aware that the Statement of Activities and HRA Schedule of Events for this study have not been assessed and validated by the HRA. Any changes that are appropriate to the content of the Statement of Activities and HRA Schedule of Events should be agreed in a pragmatic fashion as part of the process of assessing, arranging and confirming capacity and capability to deliver the study. If subsequent NHS organisations in England are added, an amendment should be submitted to the HRA.
For commercial studies the local document package should include a validated industry costing template and the template agreement to be used with participating NHS organisations in England.
It is critical that you involve both the research management function (e.g. R&D office and, if the study is on the NIHR portfolio, the LCRN) supporting each organisation and the local research team (where there is one) in setting up your study. Contact details and further information about working with the research management function for each organisation can be accessed from www.hra.nhs.uk/hra-approval.
After HRA Approval The attached document “After HRA Approval – guidance for sponsors and investigators” gives detailed guidance on reporting expectations for studies with HRA Approval, including: Working with organisations hosting the research, Registration of Research, Notifying amendments, Notifying the end of the study
The HRA website also provides guidance on these topics and is updated in the light of changes in reporting expectations or procedures.
HRA Approval provides an approval for research involving patients or staff in NHS organisations in England.
180

181
If your study involves NHS organisations in other countries in the UK, please contact the relevant national coordinating functions for support and advice. Further information can be found at http://www.hra.nhs.uk/resources/applying-for-reviews/nhs-hsc-rd-review/. If there are participating non-NHS organisations, local agreement should be obtained in accordance with the procedures of the local participating non-NHS organisation.
User Feedback The Health Research Authority is continually striving to provide a high quality service to all applicants and sponsors. You are invited to give your view of the service you have received and the application procedure. If you wish to make your views known please email the HRA at [email protected]. Additionally, one of our staff would be happy to call and discuss your experience of HRA Approval.
HRA Training We are pleased to welcome researchers and research management staff at our training days – see details at http://www.hra.nhs.uk/hra-training/.
If you have any queries about the issue of this letter please, in the first instance, see the further information provided in the question and answer document on the HRA website.
Your IRAS project ID is ___________. Please quote this on all correspondence.
Yours sincerely ______________ Assessor “
181

182
University of Surrey Intellectual Property Agreement
182

183
Anonymised Trust Specific Agreement:
(All agreements available on request)
“Dear Mr Vlietstra,
Study Title: The Impact of Social Class Bias on Psychologists' Clinical Reasoning Trust Ref: IRAS ______________
Thank you for your application to _____________ Trust to conduct the above named study with in the Trust. I am pleased to inform you that ____________ has the capacity and capability to conduct this study at the following sites:
____________________________________
Our confirmation of capacity and capability to host this research study relates to the specific protocol and informed consent procedures described in your HRA application form approved by the HRA, and by the Statement of Activities agreed with ________. Any deviation from this will be deemed to invalidate this confirmation.
The documents reviewed for this approval were:
Document Version Date Full Protocol V4 04/02/2015 Consent Form V3 04/02/2015 Debrief Sheet V3 23/12/2015 Participant Information Sheet V4 04/02/2016 Poster V1 04/02/2015
Conditions of Approval
CI Responsibilities: As Chief Investigator of the study you agree to fully comply with the Department of Health Research Governance Framework, in particular that you are aware of and fully discharge your responsibilities in respect to Data Protection, Health and Safety, financial probity, ethics and scientific quality
Conflict of Interest: You are responsible for insuring that any conflict of interest by any member of the research team will be disclosed. This includes any arising during the course of the research.
Honorary contracts: Members of the research team must have appropriate substantive or honorary contracts or letters of access (as appropriate) with the Trust prior to conducting any research on Trust premises. Any additional researchers who join the study at a later stage must also hold a suitable contract or must contact the R&D department to arrange an honorary contract/letter of access prior to commencing work on this research study.
Essential Documents: A project file or site file will be maintained for this study. Support from the R&D Office can be sought in creating and maintaining a site file.
Amendments: Project amendment details dated after the issue of this approval letter should be emailed to the Research and Development Office (_____________). Trust confirmation of capacity and capability must be issued prior to the implementation of any amendment.
183

184
Adverse Events: All adverse events and safety incidents will be reported to the study Sponsor as defined by the study protocol. In addition in line with _________ Research Policy, you must report any adverse events and incidents to the R&D Office.
Monitoring: The Trust has a duty to ensure that all research is conducted in accordance with the Research Governance Framework and to ICH-GCP standards. In order to ensure compliance the Sponsor, Trust or Regulatory Body may undertake random audits and inspections. If your project is selected for a Trust inspection you will be given 4 weeks’ notice to prepare all documentation for inspection. The trust undertakes annual monitoring of all research studies, please respond to any requests for information. Failure to do this may result in the Trust withdrawing its confirmation of capacity and capability. The information contained in this application, any supporting documentation and all correspondence with the R&D office may be subject to the provisions of the Freedom of Information Acts and may be disclosed in response to requests made under the Acts except where statutory exemptions apply.
Dissemination: Upon completion of the research the study team will be contacted to confirm arrangements for dissemination. Dissemination of findings is a condition of approval and will be monitored by the Research & Development Office. Failure to disseminate may result in the Trust being unable to support future studies.
I wish you luck with your project and would be grateful if you could inform me when the project is complete or due to be closed on this site.
________________”
184

185
Appendix F - Main Effects Normality Plots
Below are the Normality Histograms for the main effects of the study (clinical reasoning
measures). All Histograms and other tests of normality are available upon request.
185
186
186

187
187
188
188

189
189

190
Appendix G - Residual Plots for Moderation
The below histogram plots of standardised residuals are presented to support use of
moderation analysis.
Perceived Childhood Social Class
190

191
Perceived Current Social Class
191

192
Implicit Class Bias (BIAT D Score)
192
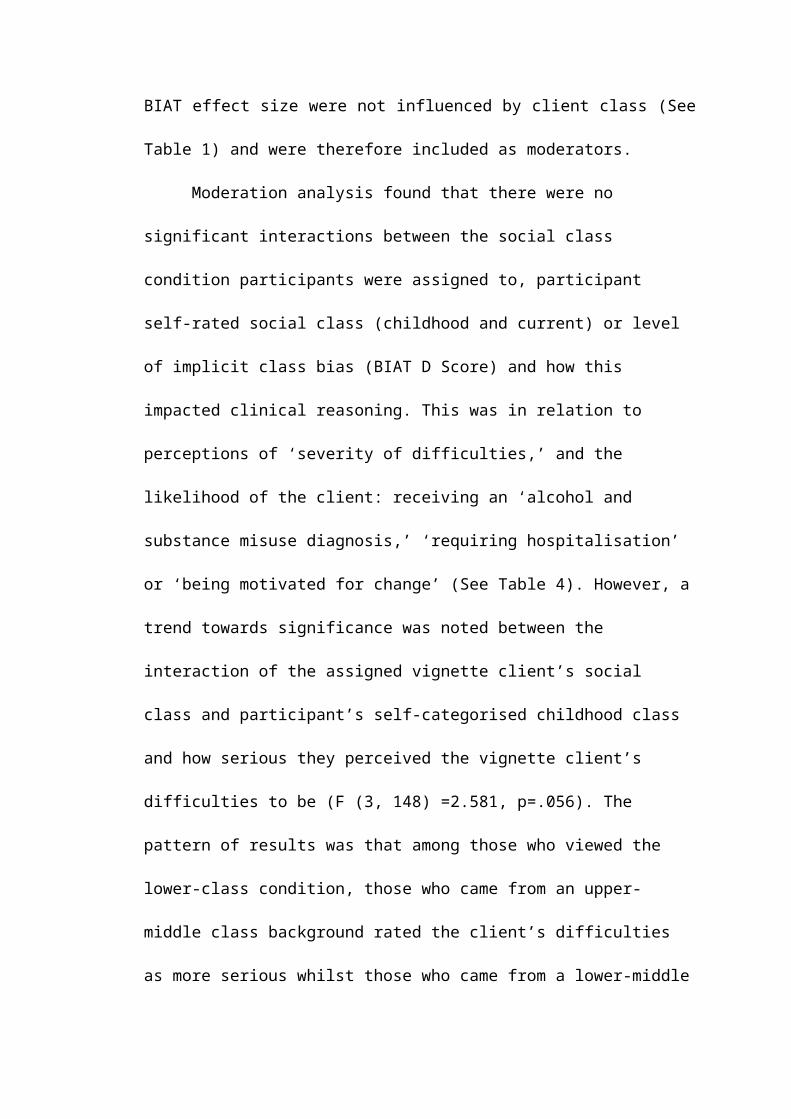
193
Part Three
Summary of Clinical Experience
Adult Placement:
My first placement was in a community mental health team (CMHT) alongside an inpatient
mental health ward. During this placement, I predominantly gained experience in cognitive
behavioural therapy (CBT) and behavioural therapy, working with adults of various ages,
with complex and enduring mental health difficulties. This included people living with
‘psychosis’, ‘complex grief’, ‘severe depression’, ‘bulimia nervosa’, ‘severe anxiety’,
‘bipolar disorder’, ‘borderline personality disorder’, ‘dissociative amnesia’, ‘behaviour which
challenged’ and ‘autism spectrum conditions’. Additionally, I gained systemic skills through
being part of a reflective team as part of family therapy for psychosis team. I also co-
facilitated an inpatient psychoeducation group, ‘bipolar mood management’ group and
STEPPs group for clients with a ‘BPD’ diagnosis. Additionally, I cofacilitated a workshop
for carers called ‘being a friend to yourself’, and provided training to hostel staff on
supporting clients with ‘autism-spectrum conditions’ and anxiety.
I completed two cognitive assessments, using the WAIS-IV, WMS IV, Hopkins
Verbal Learning Test, Controlled Oral Word Association Test, Semantic Verbal Fluency
Test, Hayling and Brixton, BADS (Key Search). Throughout the placement, I also used the
following standardised measures: ACE-R, CORE 10, PHQ-9, GAD-7, Outcome Rating
Scale, Session Rating Scale, SCRS for Voices, BEST and EIC. During the placement, I
completed a service-related research project auditing the team’s caseload and job roles, how
this was represented in the trust information management systems, and the impact this had on
client discharge.
Child Placement
My second placement was in a tier 3 child and adolescent mental health service (CAMHS).
During this placement, I worked alongside young people (aged 4-17) and with their family
members. I used CBT predominantly but also used systemic therapy as part of the family
therapy team. This placement included working with the following difficulties: ‘obsessive
compulsive disorder’, ‘anxiety’, ‘depression’, ‘gender dysphoria’, ‘Munchausen via proxy’,
193

194
‘behaviour which challenged’, ‘Tourette’s syndrome’, ‘dog phobia’, ‘diabetes management’,
‘emotion regulation’, ‘autism spectrum conditions’, ‘attention deficit disorder’, ‘post-
traumatic stress’, ‘bereavement’ and ‘sexualised play’. I also provided ‘Targeting Mental
Health in Schools’ training for primary school teachers, and provided consultation to schools,
council social workers and residential housing teams.
I completed two cognitive assessments using the WPSSI-III, WAIT-II, WISC IV and
BADS-C, completed two school/playground observations, and supported four ADOS
assessments. I used the following standardised measures: BSCI-Y, BAI-Y, BDI-Y, BANI-Y,
BDBI-Y, Australian Scale Questionnaire, OCI-CV, RCADS-C, RCADS-P, SCORE 15,
CGAS, DEX-C, Yale Global Tic Scale, FEAR Questionnaire, Self-Efficacy with Dogs,
SPENCE-P, Connors Parent – Short Form and Connors Teacher – Long Form.
Later Life Placement
My third placement was a split between a ‘Living Well with Dementia’ community team,
CMHT, inpatient dementia ward and inpatient mental health ward. I gained experience in
assessment, formal observation and working therapeutically directly/indirectly with older
adults living with Alzheimer’s, vascular, lewy body, and semantic (progressive
prosopagnosia) dementias, alongside ‘anxiety’, ‘sexual disinhibition’, ‘aggression towards
others’, ‘depression’, ‘psychosis’, ‘complex grief’, ‘bipolar disorder’, ‘chronic pain’, and
‘erectile dysfunction’. The main models used were ‘person centred dementia care’, positive
behaviour support (PBS), CBT, narrative and systemic.
I provided training in relation to validating de-escalation techniques on an inpatient
ward and cofacilitated a therapeutic music group for clients living with dementia in an
inpatient setting. I carried out dementia assessments using a full battery of
neuropsychological tests, including WAIS-IV, DKEFs, WMS-IV, TOPF, RBANs, ACE-III.
Alongside standardised measures such as the HADS, Poole Activity Scale, Androgen
Deficiency in Aging Male, Abbey Pain Scale, Pain Quality Assessment Scale and McGill
Pain Questionnaire.
Learning Disabilities Placement
This placement was in a community learning disability health team based within a county
194

195
council. I worked directly and indirectly with clients with ‘mild to profound learning
disabilities’ and their families/carers, including clients with ‘Williams Syndrome’ and
‘Downs Syndrome’. The main models of this placement involved PBS, adapted CBT, and
narrative therapy. Clinical work included focuses on: ‘complex grief’, ‘dog phobia’, ‘sexual
health and function’, ‘anger’, ‘behaviour which challenges’, ‘anxiety’, ‘living with dementia’,
and ‘autism spectrum conditions’.
I also completed formal learning disability eligibility, autism-spectrum, sexual
understanding and dementia assessments. Throughout the placement, I used the following
psychometric measures and interview schedules: British Picture Vocabulary Scale, Bodies,
Exploring your Emotions, DSQUID, Sensory Behaviour Schedule, Life Events Checklist,
Self-Efficacy with Dogs, AQ-10, CORE LD, HALO, Imaginal Provocation Test, Adapted
Friends and Family Test, Autism Diagnostic Inventory, Interview Guide for Suspected
Dementia (LD), Exploring Sexual and Social Understanding and Sex and the 3 Rs.
Specialist Placement
My specialist placement was in a clinical health psychology service specialising in HIV and
sexual health. This included within polyclinic, inpatient, sexual health, HIV and trans*
clinics. I worked predominantly within a pan-theoretical framework which involved social
constructionism, compassion focused, CBT, systemic, psychosexual therapy (including
Sensate Focus), mindfulness, acceptance and commitment, dialectic behavioural and
psychodynamic therapy. Clinical work included support in relation to: ‘substance misuse’,
‘medication adherence’, shame (e.g. sexuality, HIV diagnosis, sexual kinks), ‘repeated sexual
infection’, ‘high risk’ sex, intimacy, ‘borderline personality disorder’, ‘gender identity’,
‘gender dysphoria’, ‘complex grief’, ‘depression’, ‘social anxiety’, ‘sexual health anxiety’,
‘compulsive masturbation’, ‘erectile dysfunction’, ‘vulvodynia’, and ‘post-traumatic stress’.
Teaching included ‘sexuality and gender variance’ training to clinical psychology
trainees, ‘gender identity and young people’ to CAMHS and ‘sexual health and personality
disorders’ to health advisors. Measures used across the placement included: AUDIT, PHQ-9,
GAD-7, SOS-10, and BASHH Core Sexual History.
195
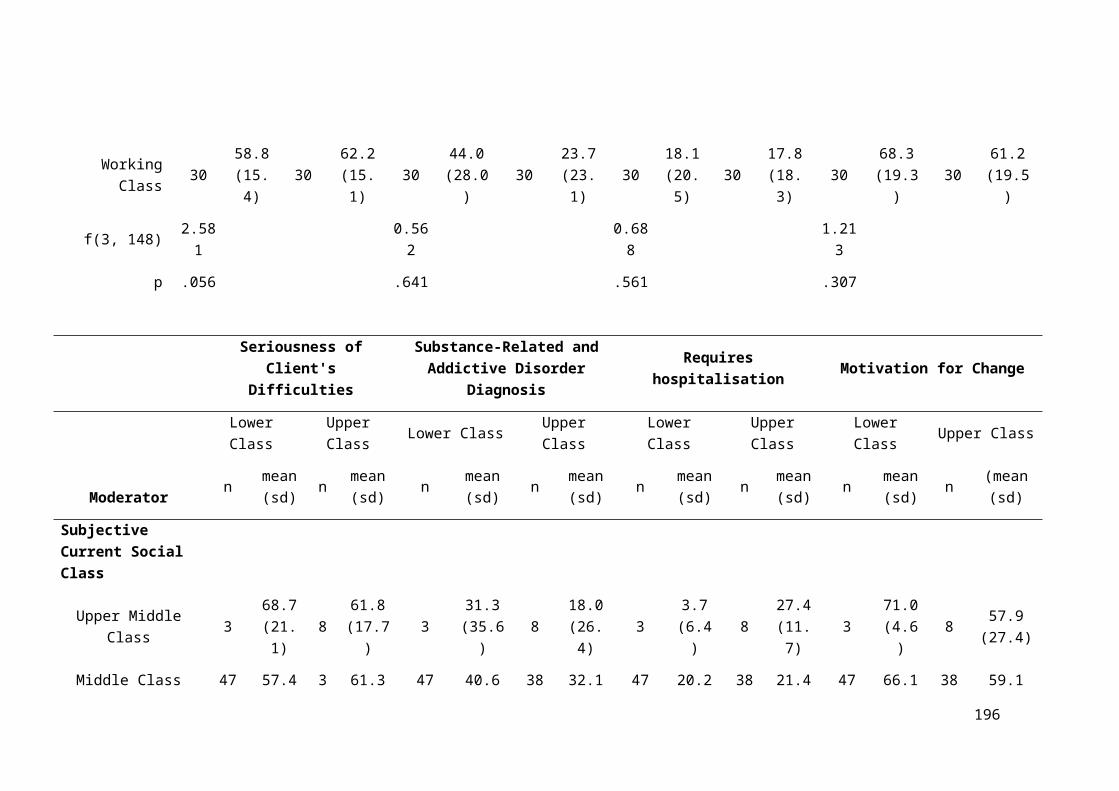
196
Part Four
Table of Assignments Completed During Training
Year 1 Assessments
Assessment
WAIS WAIS Interpretation (Online Assessment)
Practice Report of Clinical Activity Distraction techniques for intrusive
thoughts: the assessment of an adult male in
his mid-twenties.
Audio Recording of Clinical Activity with
Critical Appraisal
Critical Appraisal of a Cognitive
Behavioural Intervention Session for
Complex Grief with a Woman in her Mid-
fifties.
Report of Clinical Activity n=1 An Assessment and Cognitive Behavioural
Intervention for Complex Grief with a
woman in her mid-fifties.
Major Research Project Literature Survey How is Mental Health Practitioner Bias
Measured in regards to Clinical Reasoning?
Service-Related Project An Audit of a Community Mental Health
Team’s Caseload and Job Roles: how this
is represented in Trust Information
Management Systems and the impact this
has on client discharge.
Year 2 Assessments
Assessment
Report of Clinical Activity – Formal
Assessment
An Extended Cognitive Assessment of a
White British Girl in Key Stage 1 of
Primary Education.
PPLD Process Account Personal and Professional Learning and
Development Group (PPDLG) process
196
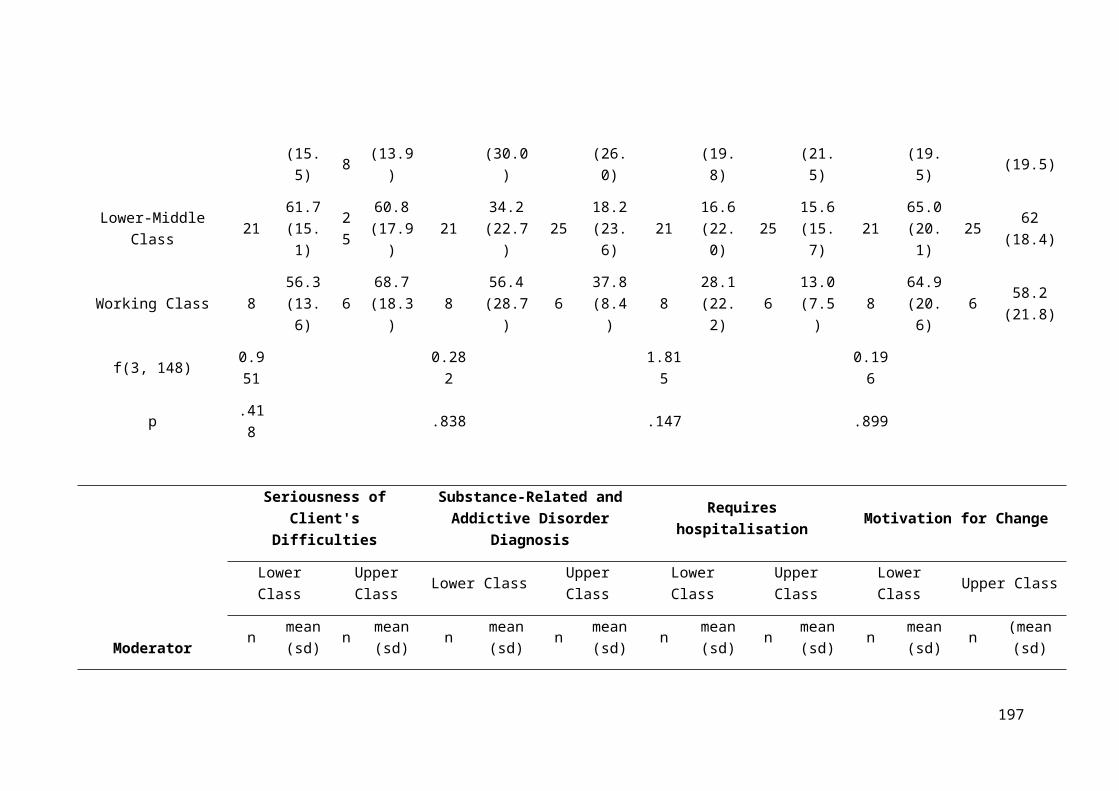
197
account.
Presentation of Clinical Activity Person-Centred Dementia Care:
Implementation of a Positive Behaviour
Support Plan with a White British Woman
Living with Alzheimer’s Type Dementia.
Year 3 Assessments
Assessment
Major Research Project Literature Review The Impact of Social Class Bias on
Healthcare Professionals’ Clinical
Reasoning.
Major Research Project Empirical Paper The Impact of Social Class Bias on
Psychological and Psychotherapeutic
Practitioners’ Clinical Reasoning
Report of Clinical Activity An emergent Narrative Intervention for dog
phobia with a man in his early twenties with
a moderate learning disability and autism
spectrum condition and his family.
Final Reflective Account Becoming a Clinical Psychologist,
Becoming a Man: A retrospective,
developmental, reflective account of the
experience of training
197