Embed Size (px)
Citation preview
EIA/EMP Report for Expansion of Chemicals and APIs production unit by IOLCP
EQMS India Pvt. Ltd. 1
December, 2018
EQMS India Pvt. Ltd.
304-305, Rishabh Corporate Tower, Plot No. 16,
Community Center, Karkardooma, Delhi – 110092,
Phone: 011-30003200; E-mail : [email protected];
Website : www.eqmsindia.com
Environmental Impact Assessment Report for
Expansion of Chemicals and APIs production
Unit.
By
M/s IOL CHEMICALS AND PHARMACEUTICALS
LIMITED
Village Fatehgarh Channa on Mansa Road Tehsil and
District Barnala, Punjab-148101
EIA/EMP Report for Expansion of Chemicals and APIs production unit by IOLCP
EQMS India Pvt. Ltd. 2
Table of Contents
Chapter 1. INTRODUCTION ...................................................................................... 12
1.1. IMPORTANCE AND NEED OF AN EIA ................................................................... 12
1.2. PROJECT & PROJECT PROPONENT ................................................................... 12
1.3. IMPORTANCE AND BENEFIT OF THE PROJECT ................................................. 13
1.4. PURPOSE OF THE EIA STUDY ............................................................................. 14
1.5. PROJECT LOCATION ............................................................................................ 14
1.6. REGULATORY FRAMEWORK ............................................................................... 17
1.7. PUBLIC HEARING .................................................................................................. 17
1.8. SCOPE & METHODOLOGY OF THE STUDY ......................................................... 22
1.9. APPROVED TERMS OF REFERENCE FOR EIA STUDY BY EAC ........................ 23
1.8.1 TOR Compliance Status ........................................................................... 23
1.10. STRUCTURE OF THE REPORT ............................................................................. 31
Chapter 2. Project Description .................................................................................... 33
2.1. NEED AND JUSTIFICATION OF THE PROJECT ................................................... 34
2.2. SITE DETAILS AND LOCATION ............................................................................. 34
i. Site Location ............................................................................................. 34
2.3. Approach to Site ...................................................................................................... 36
2.4. LAND REQUIREMENT ........................................................................................... 36
2.5. PRODUCTS WITH CAPACITIES FOR THE PROPOSED PROJECTS ................... 38
2.6. MANUFACTURING PROCESS ............................................................................... 40
2.7. DETAILS OF RAW MATERIALS, CONSUMPTION AND SOURCE ...................... 109
2.7.2. Raw Material Storage (Liquids) ............................................................... 119
2.8. INFRASTRUCTURE & UTILITIES REQUIRED FOR THE EXPANSION PROJECT
119
2.8.1. Land ........................................................................................................ 119
2.8.2. Water ...................................................................................................... 119
2.8.3. Power ..................................................................................................... 121
2.8.4. Boiler ...................................................................................................... 121
2.8.5. Fuel ......................................................................................................... 121
2.8.6. Man Power .............................................................................................. 122
2.8.7. Facilities for worker ................................................................................. 122
2.8.8. Wastewater treatment: ............................................................................ 122
EIA/EMP Report for Expansion of Chemicals and APIs production unit by IOLCP
EQMS India Pvt. Ltd. 3
2.8.9. Multiple Effect Evaporator ....................................................................... 127
2.9. SOLVENT MANAGEMENT SYSTEM: ................................................................... 129
2.10. AIR EMISSION AND AIR POLLUTION CONTROL MEASURES ........................... 131
2.11. NOISE ................................................................................................................... 134
2.12. HAZARDOUS WASTE MANAGEMENT ................................................................ 134
2.13. AUXILIARY & GENERAL WELFARE FACILITIES................................................. 136
2.13.1. Fire and Safety System: .......................................................................... 136
2.14. OHS System.......................................................................................................... 136
2.15. PROJECT COST ESTIMATES & IMPLEMENTATION SCHEDULE ...................... 137
2.16. CSR Activities ........................................................................................................ 137
Chapter 3. Description of environment ...................................................................... 139
3.1 Background and Salient Environmental Features of the Study Area ...................... 139
3.1.1 Environmental Setting and Salient Environmental Features of the Project Area .... 139
3.1.2 Primary Data Collection: Monitoring Plan and Quality Assurance Procedures ....... 144
3.2 Physical Environment ............................................................................................ 147
3.2.1 Topography ........................................................................................................... 147
3.2.2 Drainage ................................................................................................................ 147
3.2.3 Geology & Hydrogeology ....................................................................................... 147
3.2.4 Ground water Resources ....................................................................................... 147
3.2.5 Depth to Ground Water Table ................................................................................ 147
3.2.6 Seismicity of the Study Area .................................................................................. 149
3.3 Land use ............................................................................................................... 149
3.4 Meteorology........................................................................................................... 152
3.4.1 Met Data Generated at Site ................................................................................... 153
3.5. Air Environment ..................................................................................................... 155
3.5.1. Selection of Monitoring Stations .............................................................. 155
3.5.2. Analysis of Ambient Air Quality of the Project Area ................................. 155
3.5.3. Observation on Ambient Air Quality ........................................................ 157
3.5.4. Comparison of Ambient Air Quality Data with Available Secondary Data 158
3.6. Noise Environment ................................................................................................ 158
3.4.2 Observation on Ambient Noise Quality: ................................................................. 159
3.7. Traffic Study .......................................................................................................... 160
3.8. Water Quality ......................................................................................................... 160
3.8.1. Ground Water Quality ............................................................................................ 160
EIA/EMP Report for Expansion of Chemicals and APIs production unit by IOLCP
EQMS India Pvt. Ltd. 4
3.8.2. Surface Water Quality ........................................................................................... 164
3.9. Soil Quality ............................................................................................................ 168
3.8.1. Methodology ........................................................................................... 168
3.8.2. Soil Sampling Locations .......................................................................... 169
3.8.3. Analysis of Soil Samples ......................................................................... 169
2.4 Interpretation of Analytical Results & Conclusion ............................................. 170
3.10. Ecology ................................................................................................................. 171
3.10.1. Flora of Study Area ................................................................................. 172
3.11. Socio-Economic Environment ................................................................................ 178
Chapter 4. AnticIpated environmental impacts and mitigation mearsures ................. 194
4.1. General ................................................................................................................. 194
4.2. Construction Phase ............................................................................................... 194
4.2.1. Air Environment ..................................................................................................... 194
4.2.2. Operation Phase ................................................................................................... 195
4.2.3. Model Details ......................................................................................................... 195
4.2.4. Predicted GLC due to Proposed Project ................................................................ 196
4.2.5. Meteorological Data ............................................................................................... 197
4.2.6. Receptor Locations................................................................................................ 197
4.2.7. Summary of Predicted GLC‘s ................................................................................ 197
4.3. Noise Environment ................................................................................................ 204
4.3.1. Construction Phase ............................................................................................... 204
4.3.2. Operation Phase ................................................................................................... 204
4.4. Water Environment ................................................................................................ 205
4.4.1. Construction Phase ............................................................................................... 205
4.4.2. Operation Phase ................................................................................................... 205
4.5. Land Environment ................................................................................................. 205
4.6. Biological Environment .......................................................................................... 206
4.7. Socio – Economic Environment ............................................................................. 208
4.8. Infrastructure ......................................................................................................... 210
Chapter 5. Environment Management Plan .............................................................. 212
5.1. Introduction ........................................................................................................... 212
5.2. Objectives of EMP ................................................................................................. 212
5.3. Components of EMP ............................................................................................. 212
5.4. Air Environment ..................................................................................................... 212
EIA/EMP Report for Expansion of Chemicals and APIs production unit by IOLCP
EQMS India Pvt. Ltd. 5
5.4.1. Air Pollution Control Measures .............................................................................. 213
5.5. Fly ash Management ............................................................................................. 215
5.6. Noise Environment ................................................................................................ 215
5.7. Water Environment ................................................................................................ 217
5.7.1. Construction Phase: ................................................................................ 217
5.7.2. Strom water management ....................................................................... 219
5.8. Biological Environment .......................................................................................... 219
5.9. Green Belt development plan ................................................................................ 219
5.10. Land Environment ................................................................................................. 221
5.11. Resource Conservation/ Waste Minimization ........................................................ 222
5.12. Facilities for Employees ......................................................................................... 224
5.13. IOLCP HSE Policy ................................................................................................. 224
5.14. Environment Management Cell ............................................................................. 225
5.14.1. Post – Operational Monitoring Program .................................................. 228
5.14.2. Budget for environmental management plan ........................................... 228
Chapter 6. Risk Assessment& DISASTER MANAGEMENT PLAN ........................... 230
6.1. Introduction ........................................................................................................... 230
6.2. Risk Assessment ................................................................................................... 230
6.3. Risk Screening Approach ...................................................................................... 233
6.4. Hazardous Materials Storage ................................................................................ 245
6.5. QRA Approach ...................................................................................................... 245
6.6. Thermal Hazards ................................................................................................... 246
6.7. Toxic Release ........................................................................................................ 248
6.8. Data Limitations ..................................................................................................... 248
6.9. Likely Failure Scenarios ........................................................................................ 248
6.10. Weather Effect ....................................................................................................... 248
6.11. Incidents Impacts .................................................................................................. 249
6.12. Consequential Impacts .......................................................................................... 255
6.13. Thermal and Explosion Hazards ............................................................................ 255
6.14. Toxic Hazards ....................................................................................................... 255
6.15. Other Hazards ....................................................................................................... 256
6.16. Other Toxic Hazards .............................................................................................. 256
6.17. General Control Measures ..................................................................................... 256
EIA/EMP Report for Expansion of Chemicals and APIs production unit by IOLCP
EQMS India Pvt. Ltd. 6
6.18. Flammable Gas Fires ............................................................................................ 256
6.19. Process Safety System to be Developed at IOLCP ............................................... 256
6.20. Safety System for Toxic Material Handling ............................................................ 257
6.21. WORKPLACE MONITORING PLAN ..................................................................... 258
6.22. Arrangement for ensuring health and safety of workers engaged in handling of toxic
materials ............................................................................................................................ 259
6.23. Safety Recommendations...................................................................................... 259
6.23.1. Commonly Recommended Control Measures ....................................................... 259
6.23.2. Occupational Health and Safety ............................................................................ 260
6.23.3. Transportation: ...................................................................................................... 261
6.24. Emergency facilities ............................................................................................... 266
Objectives ......................................................................................................................... 266
6.25. Emergency Management Plan [EMP] .................................................................... 266
6.26. Conclusion & Recommendations ........................................................................... 266
Chapter 7. SUMMARY AND CONCLUSION ............................................................. 267
Chapter 8. DISCLOSURE OF CONSULTANTS ....................................................... 272
EIA/EMP Report for Expansion of Chemicals and APIs production unit by IOLCP
EQMS India Pvt. Ltd. 7
List of Tables
Table 1.1 : Details of permits and clearance applicable ....................................................... 17
Table 1.2 : Compliance Status of Terms of Reference ........................................................ 24
Table 2.1 : Salient features ................................................................................................. 34
Table 2.2 : Land Distribution at site ..................................................................................... 36
Table 2.3 : List of Products.................................................................................................. 38
Table 2.4 : List of Raw materials, consumption and its source .......................................... 109
Table 2.5 : Area Breakup .................................................................................................. 119
Table 2.6 : Water Breakup ................................................................................................ 119
Table 2.7 Stacks in the API Plant with emission details ..................................................... 131
Table 2.8 : Hazardous waste details ................................................................................. 134
Table 3.1 : Salient Environmental Features of Proposed Site ............................................ 140
Table 3.2 : Summary of Methodology for Primary/Secondary Baseline Data Collection .... 144
Table 3.3 : Land use of the Study Area ............................................................................. 150
Table 3.4 Long Term Meteorological Data of Ludiana (30 years average) ........................ 152
Table 3.5 Site Specific Meteorological Data ...................................................................... 153
Table 3.6 : Ambient Air Quality Monitoring Locations ........................................................ 155
Table 3.7 : Ambient Air Quality Monitoring Results for PM2.5 and PM10(24-hour average) .................................................................................................................................. 156
Table 3.7 Conti... Ambient Air Quality Monitoring Results for SOx and NOx (24-hrs avg.) 156
Table 3.7 Conti... Ambient Air Quality Monitoring Results for SOx and NOx (24-hrs avg.) 156
Table 3.8 Month wise AAQ Data (Jan to May 2018) .......................................................... 158
Table 3.9 Ambient Noise Quality Monitoring Locations ..................................................... 158
Table 3.10 Ambient Noise Quality in the Study Area ......................................................... 159
Table 3.11 Ground Water Sampling Locations .................................................................. 160
Table 3.12 Ground Water Quality in the Study Area .......................................................... 161
Table 3.15 Continued..........Ground Water Quality in the Study Area ............................... 162
Observation on Water Quality ........................................................................................... 164
Ground water .................................................................................................................... 164
Table 3.13 CPCB Best Designated Use Standard (Source-CPCB) ................................... 164
Table 3.14 Sampling Location Surface Water ................................................................... 165
Table 3.15 Surface Water Quality in the Study Area ......................................................... 166
Table 3.16 : Soil Sampling Locations ................................................................................ 169
Table 3.17 Physiochemical Characteristics of Soil ............................................................ 169
Table 3.18 Type of Forest in Barnala District .................................................................... 171
Table 3.19 List of Common Plant Species Present in Study Area ..................................... 172
EIA/EMP Report for Expansion of Chemicals and APIs production unit by IOLCP
EQMS India Pvt. Ltd. 8
Table 3.20 List of Medicinal Plants and their Medicinal Value ........................................... 174
Table 3.21 : Mammalian Fauna reported in study area ..................................................... 176
*Conservation status is LC (Least Concerned species) ..................................................... 176
Table 3.22 : Reptiles and Amphibian observed in Study Area ........................................... 176
Table 3.23 : Avifauna Sighted during the primary survey .................................................. 177
Table 3.24 : Caste-wise Population Distribution of 2.0-km Radial Study Zone................... 179
Table 3.25 : Caste wise Population Distribution of 10-km Radial Study Area .................... 180
Table 3.26 : Male-female wise Literates & Illiterates ......................................................... 182
Table 3.27 Distribution of Work Participation Rate ............................................................ 184
Table 3.28 Village wise Occupational Pattern in the Study Area ....................................... 185
Table 3.29 : Composition of Non-Workers ......................................................................... 187
Table 3.30 Village wise Basic Amenities Availability ......................................................... 191
Table 4.1 : Stack emissions .............................................................................................. 197
Table 4.2 : Summary of Maximum 24-hour Incremental GLC due to the Proposed Project Stacks ........................................................................................................................ 198
Table 4.3 Ambient Air Quality Monitoring Results (24-hour average) ................................ 198
Table 4.4 Ambient Air Quality Monitoring Results (24-hour average) ................................ 198
Table 5.1 : Design Features for Minimization of Fugitive Emissions .................................. 214
Table 5.2 : Ambient air environment impact and management plan ................................... 214
Table 5.3 : Ambient noise environment impact and management plan .............................. 216
Table 5.4 : Water environment impact and management plan ........................................... 218
Table 5.5 : Impact and management plan ......................................................................... 222
Table 5.6 : Budget for environmental management plan ................................................... 229
EIA/EMP Report for Expansion of Chemicals and APIs production unit by IOLCP
EQMS India Pvt. Ltd. 9
List of Figures
Figure 1.1 : Plant coordinates ............................................................................................. 15
Figure 1.2 : Project Location (on Toposheet) ...................................................................... 16
Figure 2.1 : Project Location Map ....................................................................................... 35
Figure 2.2 : Site Layout ....................................................................................................... 37
Figure 2.3 : Process flow diagram ....................................................................................... 42
Figure 2.4 : Process flow diagram of Acetic Anhydride ........................................................ 44
Figure 2.5 : Process flow diagram ....................................................................................... 46
Figure 2.6 : Process flow diagram of Iso Butyl benzene ...................................................... 48
Figure 2.7 :Process flow diagram of Diclofenac Sodium ...................................................... 49
Figure 2.8 : Process flow diagram of Metformin Hydrochloride ............................................ 51
Figure 2.9 : Process flow diagram of Fenofibrate ................................................................ 52
Figure 2.10 : Process flow diagram of Clopidogrel Bisulphate ............................................. 55
Figure 2.11 : Process flow diagram of Amlodipine ............................................................... 59
Figure 2.12 : Process Flow diagram of Ibuprofen ................................................................ 63
Figure 2.13 : Process Flow Diagram ................................................................................... 65
Figure 2.14 : Process flow diagram ..................................................................................... 67
Figure 2.15 : Process flow diagram ..................................................................................... 68
Figure 2.16 Process flow diagram Ursodeoxycholic acid ..................................................... 71
Figure 2.17 : Process flow diagram ..................................................................................... 74
Figure 2.18 : Process flow diagram ..................................................................................... 76
Figure 2.19 Process flow diagram ....................................................................................... 78
Figure 2.20 : Process flow diagram ..................................................................................... 82
Material balance of of Pentaprozole .................................................................................... 82
Figure 2.21 : Process flow diagram ..................................................................................... 86
Figure 2.22 : Process flow diagram ..................................................................................... 89
Figure 2.23 : Process flow diagram ..................................................................................... 90
Figure 2.24 : Process flow diagram ..................................................................................... 91
Figure 2.25 : Process flow diagram ..................................................................................... 94
Figure 2.26 : Process flow diagram ..................................................................................... 97
Figure 2.27 : Process flow diagram ..................................................................................... 99
Figure 2.28 : Process flow diagram ..................................................................................... 99
Figure 2.29 : Process flow diagram ................................................................................... 100
Figure 2.30 :Process flow diagram .................................................................................... 101
Figure 2.31 : Process flow diagram ................................................................................... 102
Figure 2.32 : Process flow diagram ................................................................................... 103
Figure 2.33 : Process flow diagram ................................................................................... 104
EIA/EMP Report for Expansion of Chemicals and APIs production unit by IOLCP
EQMS India Pvt. Ltd. 10
Figure 2.34 : Process flow diagram ................................................................................... 105
Figure 2.35 : Process flow diagram ................................................................................... 106
Figure 2.36 : Process flow diagram ................................................................................... 107
Figure 2.37 : Process flow diagram ................................................................................... 108
Figure 2.1: Proposed Water Balance (After expansion) ..................................................... 120
Figure 2.38 Flow Diagram of MEE .................................................................................... 128
Figure 3.1 Road Connectivity Map .................................................................................... 140
Figure 3.2 Location Map of Study area ............................................................................. 142
Figure 3.3 Google Map of 10 km Study area ..................................................................... 143
Figure 3.4 Environment Sampling Location Map ............................................................... 146
Figure 3.5 Depth to water level (Pre Monsoon season) ..................................................... 148
Figure 3.6 Depth to water level (Post Monsoon Season) ................................................... 148
Figure 3.7 Seismic Zones Map .......................................................................................... 149
Figure 3.8 Area statistics for Land Use / Land Cover Categories in the Study Area .......... 150
Source: Interpretation of Satellite image............................................................................ 151
Figure 3.9 Land Use Map of the Study Area (10 km Radial Zone)..................................... 151
Figure 3.10 Wind Rose Diagram of Study Area (Pre Monsoon Season)............................ 154
Figure 3.11 Wind Class Frequency Distribution ................................................................. 154
Figure 3.12 Figure: Male-Female wise Population Distribution in the Study Area .............. 181
Figure 3.13 : Scheduled Caste Population in the Study Area ............................................ 181
Figure 3.14 : Male-Female wise Distribution of Literates & Illiterates ................................. 182
Figure 3.15 : Workers Scenario of the Study Area ............................................................ 185
Figure 3.16 : Composition of Main Workers Population .................................................... 186
Figure 3.17 : Composition of Marginal Workers................................................................. 187
Figure 3.18 : Composition of Non-Workers ....................................................................... 188
Figure 5.1 National Energy Conservation Award - 2016 .................................................... 224
Figure 5.2 : HSE Policy ..................................................................................................... 225
EIA/EMP Report for Expansion of Chemicals and APIs production unit by IOLCP
EQMS India Pvt. Ltd. 11
List of Annexure
Annexure I : Nabet Certificate
Annexure II : Copy of earlier EC
Annexure III : Copy of approval for change in product mix
Annexure IV : Copy of certified Compliance
Annexure V : Copy of consent approval
Annexure VI : Copy of TSDF membership
Annexure VII : Public Hearing Minutes of Meeting
Annexure VIII : Surface water permission and Letter for Ground water abstraction
permission
Annexure IX : Baseline Environmental Monitoring report
Annexure X : Annual Health checkup report
Annexure XI : PPCB ETP testing report
EXECUTIVE SUMMARY - EIA/EMP Report for expansion of Chemicals and APIs production unit by IOLCP
EQMS India Pvt. Ltd. 2
EXECUTIVE SUMMARY
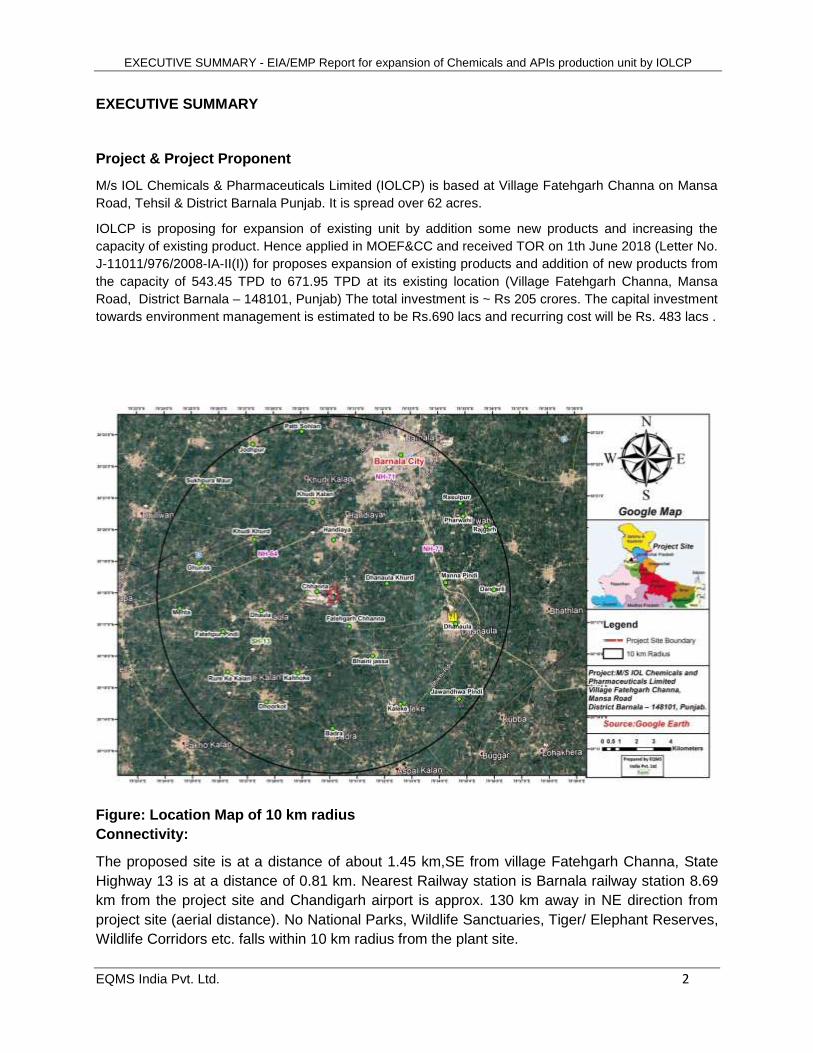
Project & Project Proponent
M/s IOL Chemicals & Pharmaceuticals Limited (IOLCP) is based at Village Fatehgarh Channa on Mansa
Road, Tehsil & District Barnala Punjab. It is spread over 62 acres.
IOLCP is proposing for expansion of existing unit by addition some new products and increasing the
capacity of existing product. Hence applied in MOEF&CC and received TOR on 1th June 2018 (Letter No.
J-11011/976/2008-IA-II(I)) for proposes expansion of existing products and addition of new products from
the capacity of 543.45 TPD to 671.95 TPD at its existing location (Village Fatehgarh Channa, Mansa
Road, District Barnala – 148101, Punjab) The total investment is ~ Rs 205 crores. The capital investment
towards environment management is estimated to be Rs.690 lacs and recurring cost will be Rs. 483 lacs .
Figure: Location Map of 10 km radius
Connectivity:
The proposed site is at a distance of about 1.45 km,SE from village Fatehgarh Channa, State
Highway 13 is at a distance of 0.81 km. Nearest Railway station is Barnala railway station 8.69
km from the project site and Chandigarh airport is approx. 130 km away in NE direction from
project site (aerial distance). No National Parks, Wildlife Sanctuaries, Tiger/ Elephant Reserves,
Wildlife Corridors etc. falls within 10 km radius from the plant site.
EXECUTIVE SUMMARY - EIA/EMP Report for expansion of Chemicals and APIs production unit by IOLCP
EQMS India Pvt. Ltd. 3
PUBLIC HEARING
As per Ministry of Environment and Forest, GOI, New Delhi vide its Notification No. S.O.1533
dated September 14, 2006 and subsequent amendment thereof. A draft EIA report has
submitted (Prepared as per prescribe TOR) at Punjab Pollution Control Board report. Further an
advertisement was published in three prominent newspapers, ‘The Tribune’, ‘Ajit’ and
‘Spokesman’ dated 25 Sep 2018. In the presence of ADC-Barnala, Representative of Punjab
Pollution Control Board, Patiala & Regional office PPCB, Sangrur with near by public, Public
Hearing was conducted on 26th Oct 2018 at Village Fatehgarh Channa, Mansa Road, Barnala,
Punjab for the Proposed Expansion of Chemicals and APIs production unit, from capacity of
543.45 TPD to 671.95 TPD by M/s IOL Chemicals & Pharmaceuticals Limited. which is covered
under Category-A. Most of the issue raised during public hearing were related to employment,
CSR and clarity oriented related to environmental aspects and the proceeding are addressed
Project Description:
The present EIA study covers enhancement of existing capacity and addition of new products
hence the capacity increases from 543.45 TPD to 671.95 TPD for the manufacturing of bulk
drug and API drugs production unit. IOLCP has applied for TOR in 19 April 2018 and Standard
TOR has been issued on 1st June 2018.
All the products are not manufactured at a time. The likely production capacities of the products
will depend upon market demand but limited to the sanctioned capacity as mentioned above.
Description of Environment:
Primary baseline data has been collected as per the TOR prescribed by MOEF during 15th
March 2018 to 15th June 2018 for one complete season Baseline Data was generated by
following the standard procedures of the Ministry of Environment & Forests and the Central
Pollution Control Board.
Air Environment: Ambient air quality was monitored at eight locations in the study area. The
locations were selected as per CPCB guidelines. The mean concentration of PM2.5 in all location
ranges between 42 to 48 µg/m3.. The mean concentration of PM10 in all location ranges between
85 to 93 µg/m3 This may be due to the dust generated from thrashing of Wheat crop in the
agricultural field, presence of industries in addition to plying of heavy traffic such as trucks and
other combustion engine vehicles in nearby roads. Mean value are found well within National
Ambient Air Quality standards. SO2 level in all the location ranges between 6.2-20.5 µg/m3,
NOx level in all the location ranges between 14.0-41.2 µg/m3, which was found well within
National Ambient Air Quality standards i.e. NAAQMS (80µg/m3). The NH3 level in all monitoring
locations ranges between 9 to 23 µg/m3. The NH3 level in all monitoring location is under
permissible limit i.e. NAAQMS 400 µg /m³.The 8 hrs. CO level in all monitoring locations ranges
between 0.14 to 0.81 mg/m³.
EXECUTIVE SUMMARY - EIA/EMP Report for expansion of Chemicals and APIs production unit by IOLCP
EQMS India Pvt. Ltd. 4
Noise Environment:The ambient noise level of all the monitoring locations were found well
within the National Ambient Noise Quality Standards prescribed for industrial (Standards - 75
dBA during day time and 70 dBA during night time) residential area (Standards - 55 dBA during
day time and 45 dBA during night time) and commercial area (Standards - 65 dBA during day
time and 55 dBA during night time)
Water Quality: Six surface water samples and eight groundwater samples were collected from
the area for chemical and biological analysis. Overall the ground water quality of the study area
is found well within the permissible limits. No metallic and bacterial contaminations were
observed in ground water samples.
Surface water quality is determined by the help of water quality criteria defined in CPCB best
designated uses criteria. Surface water monitoring is performed for nalla near project site at 100
upstream and downstream point of the project site high bacterial contamination were observed
in Nala water quality meeting the BDU criteria Class D which is fit for propagation of wildlife and
fisheries.
Canal Water quality: The canal water quality is good for Drinking water source after
conventional treatment and disinfection and meeting the class C of Best designated uses of
CPCB.
Pond Water Quality: Bacterial contaminations were observed in pond water samples. Dissolve
oxygen is found within the range while BOD was found slightly high than the Class C of Best
designated uses. Hence the pond water is fit for Propagation of Wild life and Fisheries and
meeting the criteria D of Best designated uses of CPCB.
Soil Quality: The soil quality of study area is sandy loam. The pH and conductivity of the soil is
within acceptable range. The soil analysis describes that the soil of the study area is moderately
fertile.
Sensitive Ecosystem:There are no environmentally sensitive components such as National
Park, Wildlife Sanctuary, Elephant / Tiger Reserve, migratory routes of fauna and wet land
present within 10 Km radius of plant site.
Socio economic environment: As per Census of India- 2011, Barnala district had a total
population of 5, 95,527 out of which 3, 17,522 are males and 2, 78,005 are females. Males
constitute the 53.31% and female constitutes 46.68 % of total population. Barnala has an
average literacy rate 67.8% which is 7.5% more than the 2001 Census data. The percentage of
decadal growth in population has been 13.0% during 2001-11 and sex ratio (number of females
per 1000) has been 876 in 2011 as compared to 872 in 2001 .In the district 0-6 years of
population in the district has been 10.9 which is on the decreasing trend in comparison of 2001
when it was 13.3% . As per the census records 2011, in Barnala district there are 78.5% Sikhs,
19.0% Hindus, 2.2% Muslims, 0.1% Christians, Jains and Buddhists are negligible.
EXECUTIVE SUMMARY - EIA/EMP Report for expansion of Chemicals and APIs production unit by IOLCP
EQMS India Pvt. Ltd. 5
Environmental Impact and Mitigation Measures
Air Quality:
The main sources of air pollution due to the operation of the plant are the Boiler, process stack /vent,
pump, DG set and other stacks. Gaseous emission from fuel burning, consist of common pollutants like
PM, SO2, NO2, and HCL would be discharged into atmosphere through Stack of suitable height as per
CPCB norms. The operation of centrifuging/ filter will be done in closed equipment to avoid any vapours
coming out in the local atmosphere. The vents of centrifuges / filters will be connected to scrubbers.
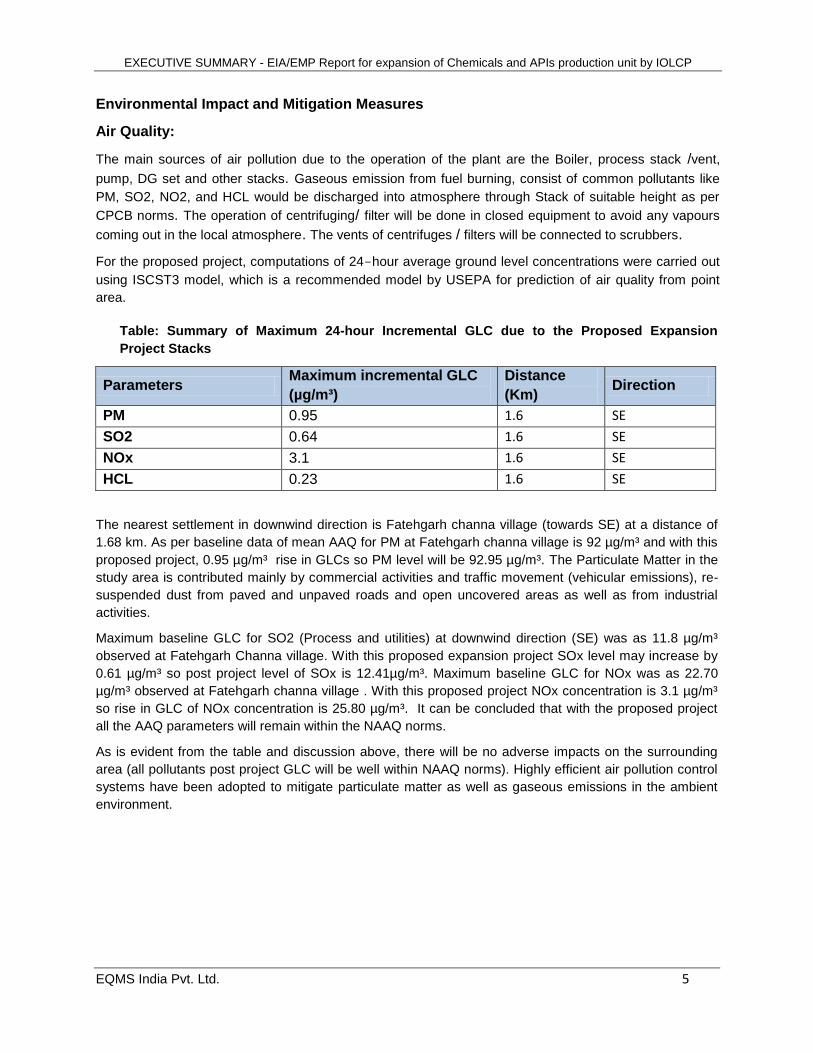
For the proposed project, computations of 24-hour average ground level concentrations were carried out
using ISCST3 model, which is a recommended model by USEPA for prediction of air quality from point
area.
Table: Summary of Maximum 24-hour Incremental GLC due to the Proposed Expansion
Project Stacks
Parameters Maximum incremental GLC
(µg/m³)
Distance
(Km) Direction
PM 0.95 1.6 SE
SO2 0.64 1.6 SE
NOx 3.1 1.6 SE
HCL 0.23 1.6 SE
The nearest settlement in downwind direction is Fatehgarh channa village (towards SE) at a distance of
1.68 km. As per baseline data of mean AAQ for PM at Fatehgarh channa village is 92 µg/m³ and with this
proposed project, 0.95 µg/m³ rise in GLCs so PM level will be 92.95 µg/m³. The Particulate Matter in the
study area is contributed mainly by commercial activities and traffic movement (vehicular emissions), re-
suspended dust from paved and unpaved roads and open uncovered areas as well as from industrial
activities.
Maximum baseline GLC for SO2 (Process and utilities) at downwind direction (SE) was as 11.8 µg/m³
observed at Fatehgarh Channa village. With this proposed expansion project SOx level may increase by
0.61 µg/m³ so post project level of SOx is 12.41µg/m³. Maximum baseline GLC for NOx was as 22.70
µg/m³ observed at Fatehgarh channa village . With this proposed project NOx concentration is 3.1 µg/m³
so rise in GLC of NOx concentration is 25.80 µg/m³. It can be concluded that with the proposed project
all the AAQ parameters will remain within the NAAQ norms.
As is evident from the table and discussion above, there will be no adverse impacts on the surrounding
area (all pollutants post project GLC will be well within NAAQ norms). Highly efficient air pollution control
systems have been adopted to mitigate particulate matter as well as gaseous emissions in the ambient
environment.
EXECUTIVE SUMMARY - EIA/EMP Report for expansion of Chemicals and APIs production unit by IOLCP
EQMS India Pvt. Ltd. 6
Noise Quality:
The main source of noise generation during operation stages are mainly from pumps, blowers,
compressors, DG sets, vehicle movement for transportation of raw materials, finished goods
etc. DG sets will be provided with acoustics enclosures. Mufflers, silencers, acoustics treatment
of room will be done wherever required. Equipment will be maintained so that noise level does
not increase due to improper maintenance. Material handling operations and movement of
vehicles will be properly scheduled to minimize construction noise. Workers working in noisy
areas will be given ear plugs. The noise level will be restricted within the plant boundary to meet
the standards. Existing greenbelt developed within the plant premises will also act as a barrier
to the propagation of noise from the factory premises. This shall further reduce the noise levels
appreciably. Hence, no significant impact is envisaged.
Water Quality: Total water requirement–1800 KLD (Fresh water 1456 KLD and Recycle water
344 KLD).Water requirement will be made available through ground water and surface water.
Low TDS Effluent Treated in To ETP. ETP comprises of Four Stage , Two Stage Anaerobic ,
One Stage Aerobic and One Stage Tertiary. After treatment treated effluents discharge in to
plantation area within premises. High TDS effluent Treated in to MEE. Condensate recovery will
be reused in plant. Concentrated stream will be sent to ATFD for further treatment. MEE salt will
be sold out to end users.
Solid and Hazardous Wastes Disposal:
All the solid and hazardous waste generated from the proposed unit shall be disposed as per
the norm. Minor quantities of construction waste will be generated in the form of packaging
material and construction waste. Proper care will be taken for handling and reduction of the
solid waste generated during construction phase. ETP sludge/ process residue generated
during operation phase shall be disposed as per the hazardous wastes management, handling
and Trans-boundary movement Rule 2016 and amendment thereof.
Impact on Ecology: No national park, wildlife sanctuary, biosphere reserve exists within 10 km
area of the project. No endangered or rare or threatened plant or animal species was observed
within 10 km area of the project site. The impact on the surrounding ecology during the
operation of the project will mainly occur from the deposition of air pollutants. Air pollution
affects the biotic and abiotic components of the ecosystem individually and synergistically with
other pollutants. Chronic and acute effects on plants and animals may be induced when the
concentration of air pollutants exceeds threshold limits. Particulate emission and other gaseous
emissions from the proposed plant are the major pollutant that may affect the ecology of the
area. However the AAQ modeling proves that in worst condition the concentration of the PM
and other gaseous emission will not exceeds the AAQ standards. Further the mitigation
measures have been suggested for the same. By adopting the mitigation measures suggested
the impact due to operation of the proposed expansion will be negligible.
EXECUTIVE SUMMARY - EIA/EMP Report for expansion of Chemicals and APIs production unit by IOLCP
EQMS India Pvt. Ltd. 7
Risk Assessment and Disaster Management Plan: The hazard potential of chemicals and
estimation of consequences in case of their accidental release during storage, transportation
and handling has been identified and risk assessment has been carried out to quantify the
extent of damage and suggest recommendations for safety improvement for the proposed
facilities. Risk mitigation measures based on MCA analysis and engineering judgments are
incorporated in order to improve overall system safety and mitigate the effects of major
accidents.
An effective Disaster Management Plan (DMP) to mitigate the risks involved has been prepared.
This plan defines the responsibilities and resources available to respond to the different types of
emergencies envisaged. Training exercises will be held to ensure that all personnel are familiar
with their responsibilities and that communication links are functioning effectively.
Environmental Management Plan (EMP): EMP for effective management of environmental
impacts and ensuring overall protection of the environment through appropriate management
procedures has been recommended in the EIA report. The capital investment towards
environment management is estimated to be Rs.690 lacs and recurring cost will be Rs. 483
lacs.This amount shall be used for procurement of air and water pollution control devices, noise
pollution control, monitoring devices, strengthening of environment Cell, occupation health and
safety department, green belt development, etc.
ENVIRONMENT MONITORING PROGRAM
Post project environmental monitoring is important in terms of evaluating the performance of
pollution control equipment’s installed in the project. The sampling and analysis of the
environmental attributes will be as per the guidelines of CPCB/SPCB. The frequency of
sampling and location of sampling will be as per the directives of Punjab Pollution Control
Board.
Green belt development: IOLCP has planted approx 26000 tree/shrubs and herbs in existing
greenbelt. The tree species like Eucalyptus, neem, Daikan, sadabahar, Ficus spp., Champa,
kadam gulmohar along with shrubs and herbs has been planted under existing greenbelt.
Further maintenance of the existing greenbelt shall be done on regular basis for which IOL
Chemical has already kept a budget for Rs. 50 lakhs as a capital cost.
CSR Plan: Unit has committed to spend about Rs. 1.53 crores (0.75% of the capital investment)
towards CER. But the Approved TOR is for 2.5 % of the project cost and IOLCP follow the OM
issued on dated 1st May 2018, hence earmarked the fund of Rs 1.53 crores. The amount will be
spending in next 3 years for infrastructure development of surrounding area.
Project Benefits
Proposed expansion project will result in considerable growth of stimulating the industrial
and commercial activities in the state. Small and medium scale industries may be further
developed as a consequence.
EXECUTIVE SUMMARY - EIA/EMP Report for expansion of Chemicals and APIs production unit by IOLCP
EQMS India Pvt. Ltd. 8
The project will be beneficial in govt’s target of increase the production capacity and yield in
the field of pharmaceuticals.
Increased revenue to the state by way of royalty, taxes and duties;
Overall Growth of the neighbouring area viz. Health and family welfare; Watershed
development; Sustainable livelihood and strengthening of village Self Help Groups; and
Infrastructure development.
In operation phase, the proposed plant would require significant workforce of non-technical
and technical persons.
Migration of persons with better education and professional experience will result in increase
of population and literacy in the surrounding villages.
Civic amenities will be substantial after the commencement of project activities. The basic
requirement of the community needs will be strengthened by extending healthcare,
educational facilities to the community, building/strengthening of existing roads in the area.
The local population will be given preference to employment on the basis of their eligibility
and company requirement. The employment potential will ameliorate economic conditions of
these families directly and provide employment to many other families indirectly who are
involved in business and service oriented activities. The employment of local people in
primary and secondary sectors of project shall upgrade the prosperity of the region. This in-
turn will improve the socio-economic conditions of the area.
EIA/EMP Report for Expansion of Chemicals and APIs production unit by IOLCP
EQMS India Pvt. Ltd. 12
CHAPTER 1. INTRODUCTION
1.1. IMPORTANCE AND NEED OF AN EIA
Government of India, as per its policy has given emphasis on Sustainable
Development. While it is supporting the industrial growth, the environmental protection
has been made the integrated criteria for this support. In line with this policy, Ministry
of Environment, Forest and Climate Change has defined elaborated ‗Environment
Clearance (EC)‘ framework under The Environmental (Protection) Act, 1986
(Environmental Impact Assessment Notification, 2006) for establishing/expanding an
industry/development project. The EC process takes into consideration local
conditions, public concerns, effectiveness of impact assessment and proposed
mitigation measures in sustaining environmental equilibrium. The base
documentation/study report, called Environmental Impact Assessment (EIA) detailing
baseline conditions, environmental impacts, mitigation measures and management
plan is required to be prepared for start of EC process. Prior Environmental Clearance
is required from concerned authorities for all projects and activities mentioned in
―Schedule‖ as per Environmental Impact Assessment notification dated September 14,
2006. The project comes under ―project and activity-5 (f) of schedule‖ As the site
located outside the industrial area. Considering the products portfolio, the proposed
projects falls in ―Category A‖ of Schedule of the EIA notification which requires
Environmental Clearance (EC) from MoEFCC, New Delhi. Public Hearing is applicable
for the API drugs project (if site not located in notified industrial area). EIA report is
mandatory for appraisal by expert committee prior to EC. Since EIA preparation and
compliance to EC requirement is time consuming, MoEF&CC has started accepting
one season based EIA study to reduce the overall clearance cycle time.
1.2. PROJECT & PROJECT PROPONENT
IOL Chemicals & Pharmaceuticals Limited (IOLCP) is based at Village Fatehgarh
Channa on Mansa Road, Tehsil & District Barnala Punjab. It is spread over 62 acres.
IOLCP is the leading chemical and bulk drugs manufacturer of India as well as with
global presence in chemical and pharmaceuticals market.
IOLCP has adapted "Go Green" principles, with special units for designing
environmentally-friendly production processes in place in the Ethyl Acetate, IBB and
MCA Divisions. In the energy sphere, guidelines are in place to use passive
techniques for heating, cooling and air flow, improve air conditioning and heating
systems, and use natural light and insulation. Some major achievements of IOL
Chemicals & Pharmaceuticals Limited (IOLCP) are summarized with following
accreditation and awards.
The unit is a ISO 9001:2015, ISO 14001:2015 & ISO 18001: 2007 The unit is WHO GMP, Eu, GMP and USFDA compliant.
This chapter provides background information of the project, need of the project,
need of the EIA study, scope and EIA methodology adopted and structure of the
report.
EIA/EMP Report for Expansion of Chemicals and APIs production unit by IOLCP
EQMS India Pvt. Ltd. 13
The unit is already operating with Environmental Clearance dated August 24,2009 vide letter No. J-11011/976/2008-IA-II (I) and all consents from State Pollution Control Board.
The unit is awarded with the National Energy Conservation Award Consecutively for the years 2005,2006, 2007, 2008,2009,2010,2011,2012,2013,2014,2016 by Ministry of Power, Government of India
The unit is awarded with National Level Green Chemistry Award for Innovation to use dual technology for the production of Mono Chloro Acetic Acid and Acetyl Chloride in a single Plant by the Govt of India
The site equipped with 17 MW power plants that full fill all the in-house power requirements.
The unit is awarded with Third prize in Safety Award for the year 2013 by State Safety Council Chandigarh
The unit is awarded with Star Export House award by Government of India
By incorporating these & other business strengths, IOLCP have boosted our
capabilities and planned for expansion of existing unit by addition some new products
and increasing the capacity of exiting product. IOLCP applied in MOEF&CC and
received TOR on 1st June 2018 (Letter No. J-11011/976/2008-IA-II(I)) for proposes
expansion of existing products and addition of new products from the capacity of
543.45 TPD to 671.95 TPD at Village Fatehgarh Channa, Mansa Road District
Barnala – 148101, Punjab.
No National Parks, Wildlife Sanctuaries, Tiger/ Elephant Reserves, Wildlife Corridors
etc. falls within 10 km radius from the plant site.
1.3. IMPORTANCE AND BENEFIT OF THE PROJECT
India is witnessing a steady rise in healthcare expenditure from US$ 76.1 per head in
2012 to US$ 118 per head in 2016. Still, India remains among the bottom five
countries with the lowest public health expenditure globally. A major chunk of the
population (nearly 40% of Indians) lives on less than US$ 1 per day, and most of them
have to pay out of their own pockets for medical services2. Out-of-pocket spending in
India is over four times higher than public spending on healthcare. Therefore, there is
a rising need for advanced drugs that will help people to recover quickly at lower
cost.The need of APIs is increasing every year due to continual growth of
pharmaceutical industry. IOLCP products cater to the key industrial sectors of
chemicals, Pharmaceutical & Packaging. Efficient teamwork & strong associations
showed the success. Through an unwavering focus on Quality, Commitment &
Delivery, IOLCP have charted the way to success in operations and have won the
admiration of the customers. This project is expected to partially fulfill the demand of
bulk drugs and APIs of pharmaceutical industries.
Market demand for chemicals and its intermediates is growing at a Compounded
Annual Growth Rate (CAGR) of 4-5% globally. The proposed project will contribute in
bridging this demand and supply gap by expansion of its chemicals production unit.
EIA/EMP Report for Expansion of Chemicals and APIs production unit by IOLCP
EQMS India Pvt. Ltd. 14
1.4. PURPOSE OF THE EIA STUDY
The objectives of the present EIA are to:
To identify and describe the elements of the community and environment likely to be affected by the proposed project, and/or likely to cause impacts upon both the natural and man-made environment.
To describe the proposed project and associated works together along with the requirements.
To identify and quantify any environmental impacts associated with the proposed project and recommend appropriate mitigation measures.
To identify existing landscape and visual quality in the study area so as to evaluate the landscape and visual impacts of the proposed project.
To propose mitigation measures to minimize pollution, environmental disturbance and nuisance during construction and operation of the proposed project.
To identify, assess and specify methods, measures and standards, to be included in the detailed design, construction and operation of the proposed project which are necessary to mitigate these impacts and reduce them to allowable levels within established standards/guidelines.
To identify and justify the need for environmental monitoring to define the scope of the requirements necessary. To ensure the implementation and the effectiveness of the environmental protection and pollution control measures adopted.
To identify constraints associated with the mitigation measures recommended in this EIA.
To identify any additional studies necessary to fulfil the objectives required for the EIA Study
1.5. PROJECT LOCATION
M/s IOL Chemicals & Pharmaceuticals Limited (IOLCP) is based at Village Fatehgarh
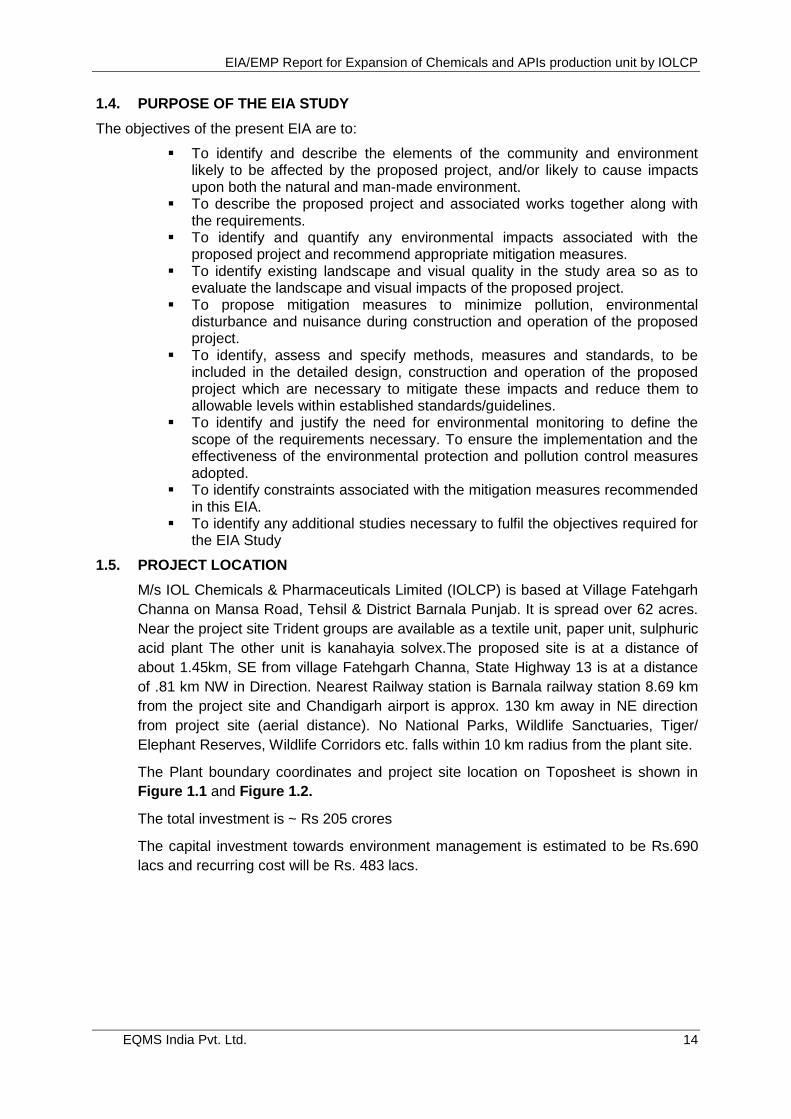
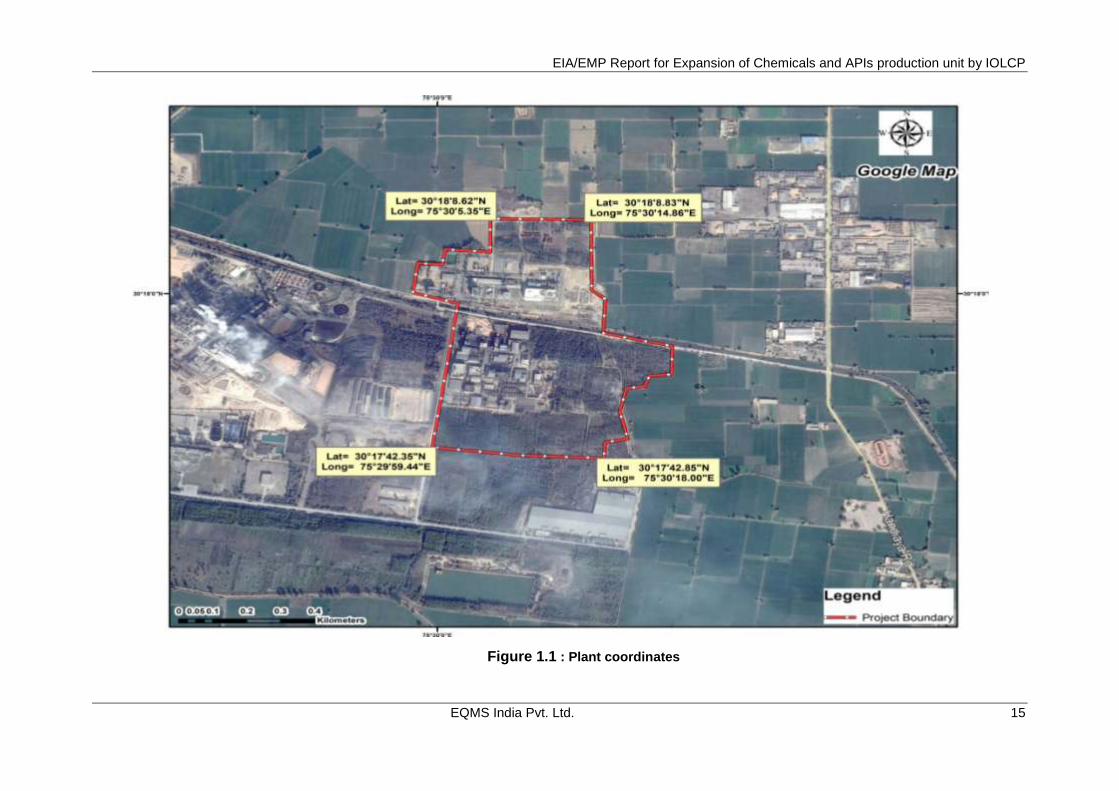
Channa on Mansa Road, Tehsil & District Barnala Punjab. It is spread over 62 acres.
Near the project site Trident groups are available as a textile unit, paper unit, sulphuric
acid plant The other unit is kanahayia solvex.The proposed site is at a distance of
about 1.45km, SE from village Fatehgarh Channa, State Highway 13 is at a distance
of .81 km NW in Direction. Nearest Railway station is Barnala railway station 8.69 km
from the project site and Chandigarh airport is approx. 130 km away in NE direction
from project site (aerial distance). No National Parks, Wildlife Sanctuaries, Tiger/
Elephant Reserves, Wildlife Corridors etc. falls within 10 km radius from the plant site.
The Plant boundary coordinates and project site location on Toposheet is shown in
Figure 1.1 and Figure 1.2.
The total investment is ~ Rs 205 crores
The capital investment towards environment management is estimated to be Rs.690
lacs and recurring cost will be Rs. 483 lacs.
EIA/EMP Report for Expansion of Chemicals and APIs production unit by IOLCP
EQMS India Pvt. Ltd. 15
Figure 1.1 : Plant coordinates
EIA/EMP Report for Expansion of Chemicals and APIs production unit by IOLCP
EQMS India Pvt. Ltd. 16
Figure 1.2 : Project Location (on Toposheet)
EIA/EMP Report for Expansion of Chemicals and APIs production unit by IOLCP
EQMS India Pvt. Ltd. 17
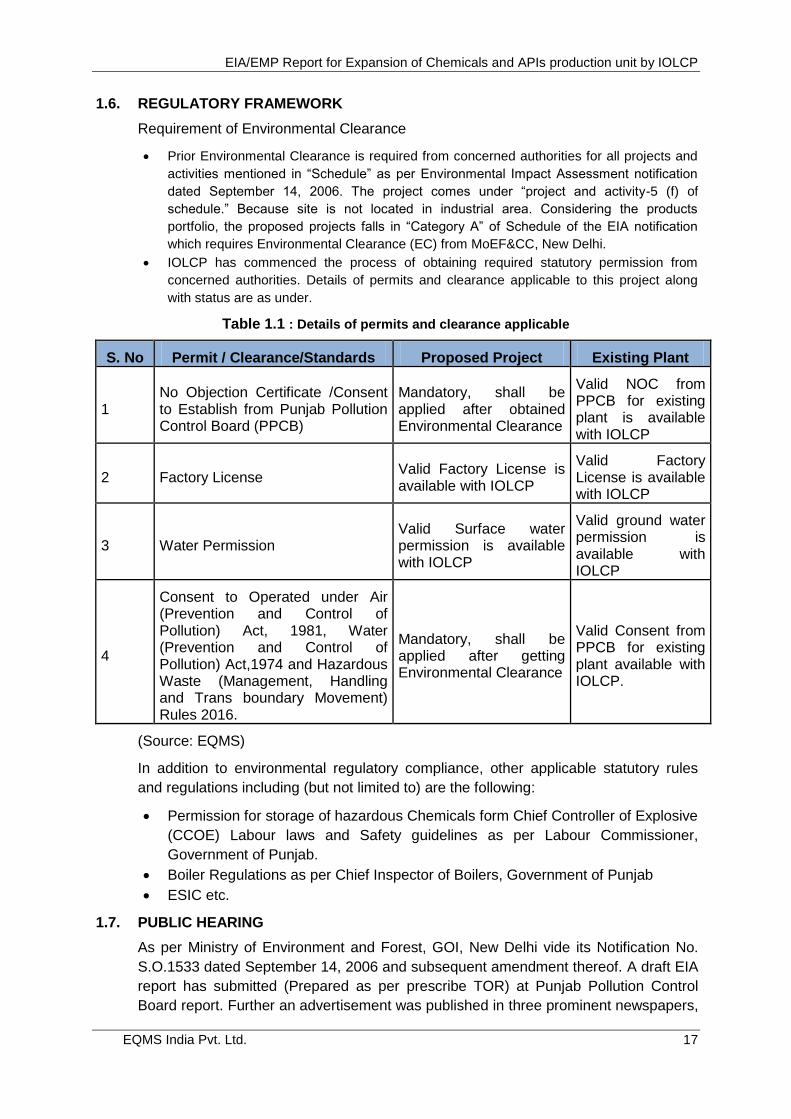
1.6. REGULATORY FRAMEWORK
Requirement of Environmental Clearance
Prior Environmental Clearance is required from concerned authorities for all projects and
activities mentioned in ―Schedule‖ as per Environmental Impact Assessment notification
dated September 14, 2006. The project comes under ―project and activity-5 (f) of
schedule.‖ Because site is not located in industrial area. Considering the products
portfolio, the proposed projects falls in ―Category A‖ of Schedule of the EIA notification
which requires Environmental Clearance (EC) from MoEF&CC, New Delhi.
IOLCP has commenced the process of obtaining required statutory permission from
concerned authorities. Details of permits and clearance applicable to this project along
with status are as under.
Table 1.1 : Details of permits and clearance applicable
S. No Permit / Clearance/Standards Proposed Project Existing Plant
1 No Objection Certificate /Consent to Establish from Punjab Pollution Control Board (PPCB)
Mandatory, shall be applied after obtained Environmental Clearance
Valid NOC from PPCB for existing plant is available with IOLCP
2 Factory License Valid Factory License is available with IOLCP
Valid Factory License is available with IOLCP
3 Water Permission Valid Surface water permission is available with IOLCP
Valid ground water permission is available with IOLCP
4
Consent to Operated under Air (Prevention and Control of Pollution) Act, 1981, Water (Prevention and Control of Pollution) Act,1974 and Hazardous Waste (Management, Handling and Trans boundary Movement) Rules 2016.
Mandatory, shall be applied after getting Environmental Clearance
Valid Consent from PPCB for existing plant available with IOLCP.
(Source: EQMS)
In addition to environmental regulatory compliance, other applicable statutory rules
and regulations including (but not limited to) are the following:
Permission for storage of hazardous Chemicals form Chief Controller of Explosive
(CCOE) Labour laws and Safety guidelines as per Labour Commissioner,
Government of Punjab.
Boiler Regulations as per Chief Inspector of Boilers, Government of Punjab
ESIC etc.
1.7. PUBLIC HEARING
As per Ministry of Environment and Forest, GOI, New Delhi vide its Notification No.
S.O.1533 dated September 14, 2006 and subsequent amendment thereof. A draft EIA
report has submitted (Prepared as per prescribe TOR) at Punjab Pollution Control
Board report. Further an advertisement was published in three prominent newspapers,
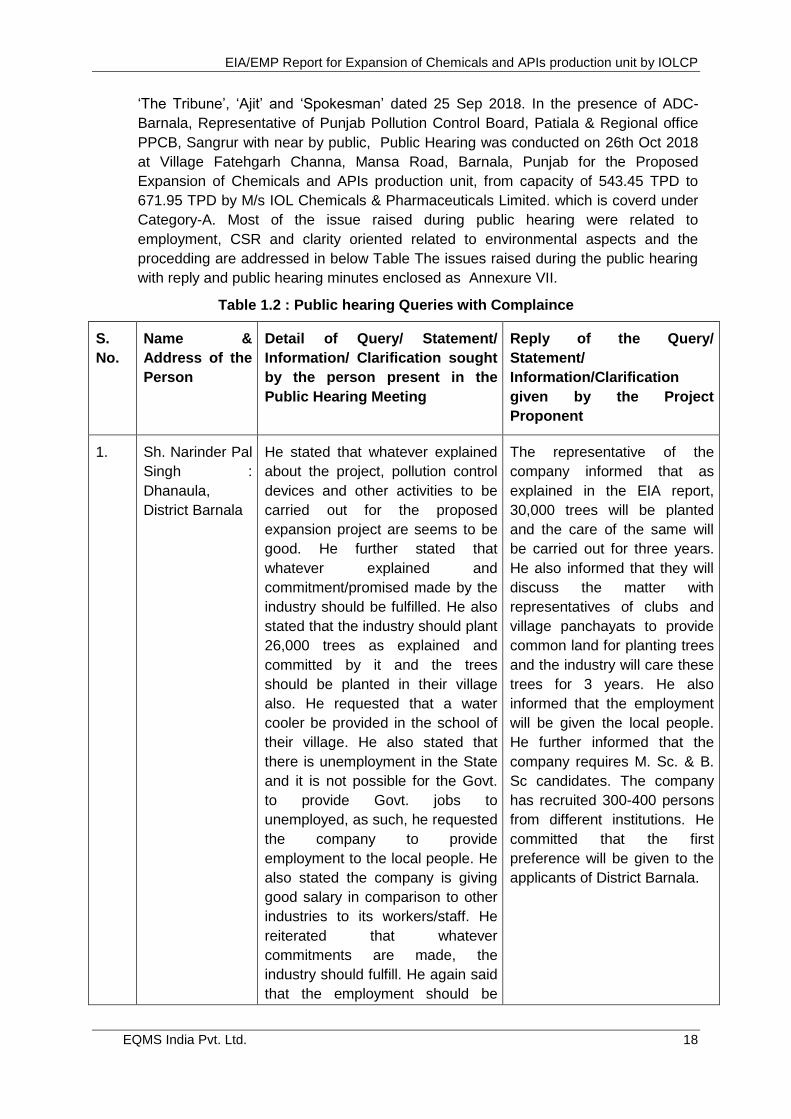
EIA/EMP Report for Expansion of Chemicals and APIs production unit by IOLCP
EQMS India Pvt. Ltd. 18
‗The Tribune‘, ‗Ajit‘ and ‗Spokesman‘ dated 25 Sep 2018. In the presence of ADC-
Barnala, Representative of Punjab Pollution Control Board, Patiala & Regional office
PPCB, Sangrur with near by public, Public Hearing was conducted on 26th Oct 2018
at Village Fatehgarh Channa, Mansa Road, Barnala, Punjab for the Proposed
Expansion of Chemicals and APIs production unit, from capacity of 543.45 TPD to
671.95 TPD by M/s IOL Chemicals & Pharmaceuticals Limited. which is coverd under
Category-A. Most of the issue raised during public hearing were related to
employment, CSR and clarity oriented related to environmental aspects and the
procedding are addressed in below Table The issues raised during the public hearing
with reply and public hearing minutes enclosed as Annexure VII.
Table 1.2 : Public hearing Queries with Complaince
S.
No.
Name &
Address of the
Person
Detail of Query/ Statement/
Information/ Clarification sought
by the person present in the
Public Hearing Meeting
Reply of the Query/
Statement/
Information/Clarification
given by the Project
Proponent
1. Sh. Narinder Pal
Singh :
Dhanaula,
District Barnala
He stated that whatever explained
about the project, pollution control
devices and other activities to be
carried out for the proposed
expansion project are seems to be
good. He further stated that
whatever explained and
commitment/promised made by the
industry should be fulfilled. He also
stated that the industry should plant
26,000 trees as explained and
committed by it and the trees
should be planted in their village
also. He requested that a water
cooler be provided in the school of
their village. He also stated that
there is unemployment in the State
and it is not possible for the Govt.
to provide Govt. jobs to
unemployed, as such, he requested
the company to provide
employment to the local people. He
also stated the company is giving
good salary in comparison to other
industries to its workers/staff. He
reiterated that whatever
commitments are made, the
industry should fulfill. He again said
that the employment should be
The representative of the
company informed that as
explained in the EIA report,
30,000 trees will be planted
and the care of the same will
be carried out for three years.
He also informed that they will
discuss the matter with
representatives of clubs and
village panchayats to provide
common land for planting trees
and the industry will care these
trees for 3 years. He also
informed that the employment
will be given the local people.
He further informed that the
company requires M. Sc. & B.
Sc candidates. The company
has recruited 300-400 persons
from different institutions. He
committed that the first
preference will be given to the
applicants of District Barnala.
EIA/EMP Report for Expansion of Chemicals and APIs production unit by IOLCP
EQMS India Pvt. Ltd. 19
given to the local residents. He
thanked the company for the
proposed expansion.
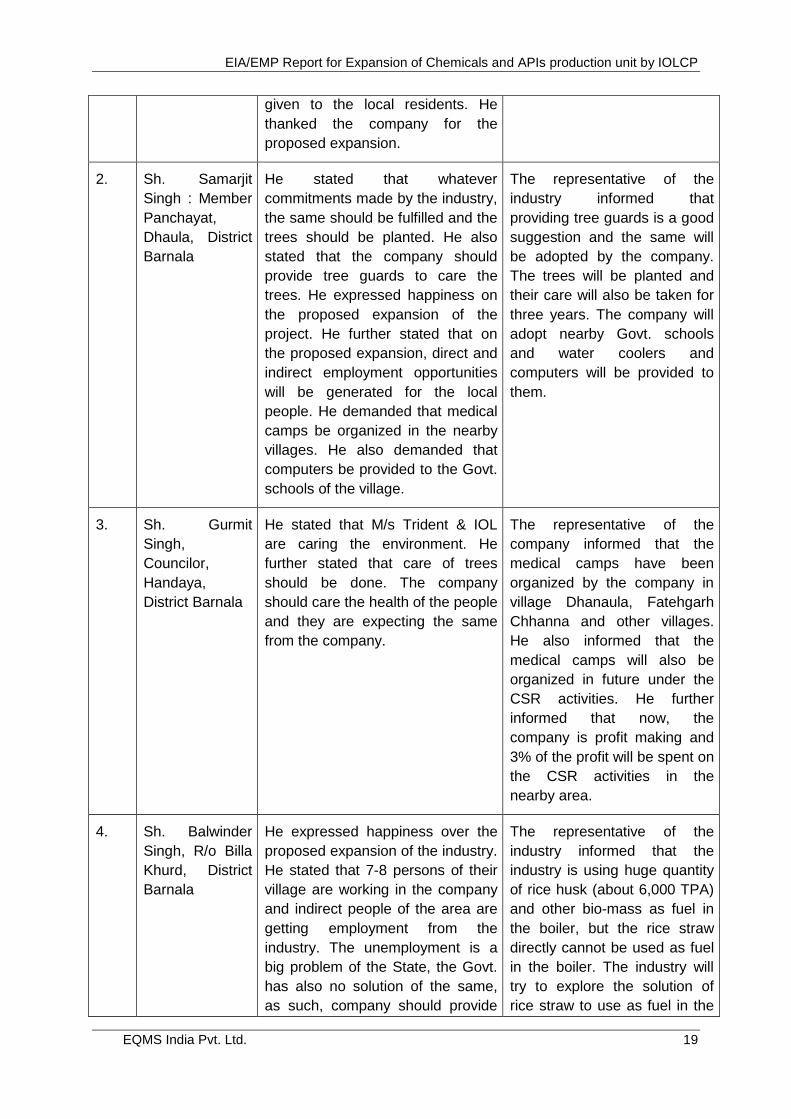
2. Sh. Samarjit
Singh : Member
Panchayat,
Dhaula, District
Barnala
He stated that whatever
commitments made by the industry,
the same should be fulfilled and the
trees should be planted. He also
stated that the company should
provide tree guards to care the
trees. He expressed happiness on
the proposed expansion of the
project. He further stated that on
the proposed expansion, direct and
indirect employment opportunities
will be generated for the local
people. He demanded that medical
camps be organized in the nearby
villages. He also demanded that
computers be provided to the Govt.
schools of the village.
The representative of the
industry informed that
providing tree guards is a good
suggestion and the same will
be adopted by the company.
The trees will be planted and
their care will also be taken for
three years. The company will
adopt nearby Govt. schools
and water coolers and
computers will be provided to
them.
3. Sh. Gurmit
Singh,
Councilor,
Handaya,
District Barnala
He stated that M/s Trident & IOL
are caring the environment. He
further stated that care of trees
should be done. The company
should care the health of the people
and they are expecting the same
from the company.
The representative of the
company informed that the
medical camps have been
organized by the company in
village Dhanaula, Fatehgarh
Chhanna and other villages.
He also informed that the
medical camps will also be
organized in future under the
CSR activities. He further
informed that now, the
company is profit making and
3% of the profit will be spent on
the CSR activities in the
nearby area.
4. Sh. Balwinder
Singh, R/o Billa
Khurd, District
Barnala
He expressed happiness over the
proposed expansion of the industry.
He stated that 7-8 persons of their
village are working in the company
and indirect people of the area are
getting employment from the
industry. The unemployment is a
big problem of the State, the Govt.
has also no solution of the same,
as such, company should provide
The representative of the
industry informed that the
industry is using huge quantity
of rice husk (about 6,000 TPA)
and other bio-mass as fuel in
the boiler, but the rice straw
directly cannot be used as fuel
in the boiler. The industry will
try to explore the solution of
rice straw to use as fuel in the
EIA/EMP Report for Expansion of Chemicals and APIs production unit by IOLCP
EQMS India Pvt. Ltd. 20
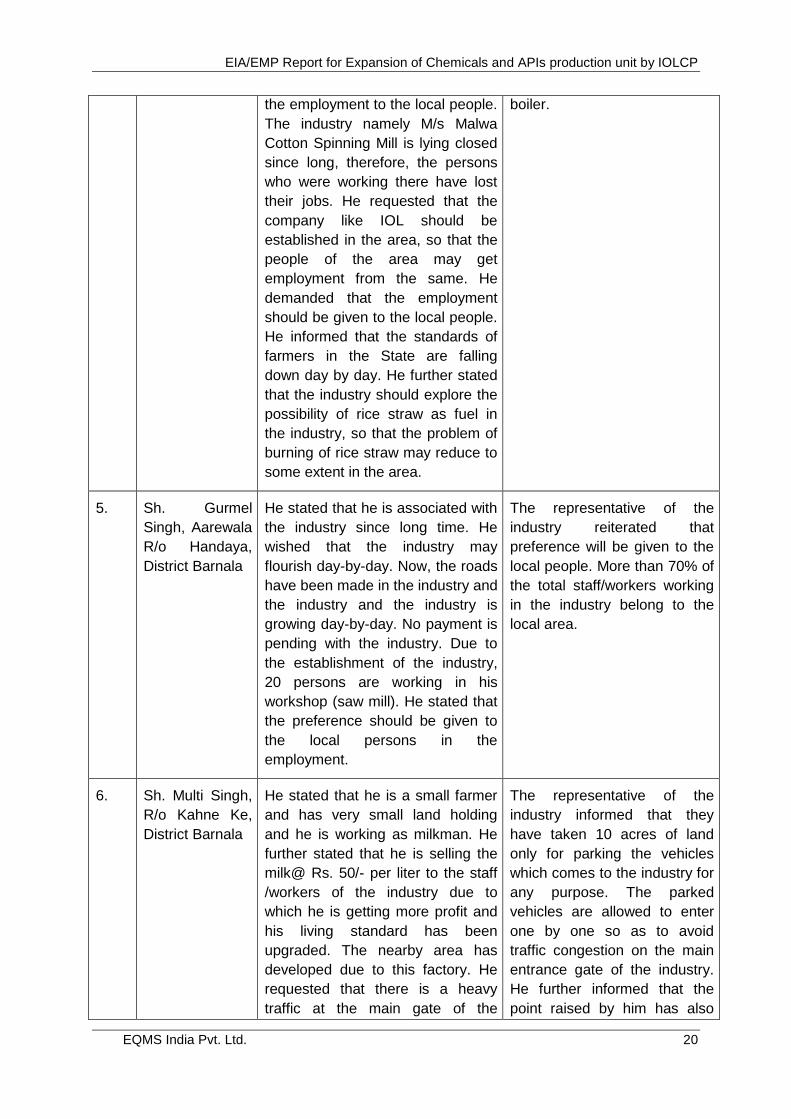
the employment to the local people.
The industry namely M/s Malwa
Cotton Spinning Mill is lying closed
since long, therefore, the persons
who were working there have lost
their jobs. He requested that the
company like IOL should be
established in the area, so that the
people of the area may get
employment from the same. He
demanded that the employment
should be given to the local people.
He informed that the standards of
farmers in the State are falling
down day by day. He further stated
that the industry should explore the
possibility of rice straw as fuel in
the industry, so that the problem of
burning of rice straw may reduce to
some extent in the area.
boiler.
5. Sh. Gurmel
Singh, Aarewala
R/o Handaya,
District Barnala
He stated that he is associated with
the industry since long time. He
wished that the industry may
flourish day-by-day. Now, the roads
have been made in the industry and
the industry and the industry is
growing day-by-day. No payment is
pending with the industry. Due to
the establishment of the industry,
20 persons are working in his
workshop (saw mill). He stated that
the preference should be given to
the local persons in the
employment.
The representative of the
industry reiterated that
preference will be given to the
local people. More than 70% of
the total staff/workers working
in the industry belong to the
local area.
6. Sh. Multi Singh,
R/o Kahne Ke,
District Barnala
He stated that he is a small farmer
and has very small land holding
and he is working as milkman. He
further stated that he is selling the
milk@ Rs. 50/- per liter to the staff
/workers of the industry due to
which he is getting more profit and
his living standard has been
upgraded. The nearby area has
developed due to this factory. He
requested that there is a heavy
traffic at the main gate of the
The representative of the
industry informed that they
have taken 10 acres of land
only for parking the vehicles
which comes to the industry for
any purpose. The parked
vehicles are allowed to enter
one by one so as to avoid
traffic congestion on the main
entrance gate of the industry.
He further informed that the
point raised by him has also
EIA/EMP Report for Expansion of Chemicals and APIs production unit by IOLCP
EQMS India Pvt. Ltd. 21
industry due to the parking of trucks
and tractor-trolleys, due to which
there are chances of accident. He
further stated that if any accident
took place near the industry, the
industry ambulance has helped the
victim to admit in the hospital. He
demanded that the employment
should be given to the local people.
been noted down and more
precautions/steps will be taken
to set right the said point.
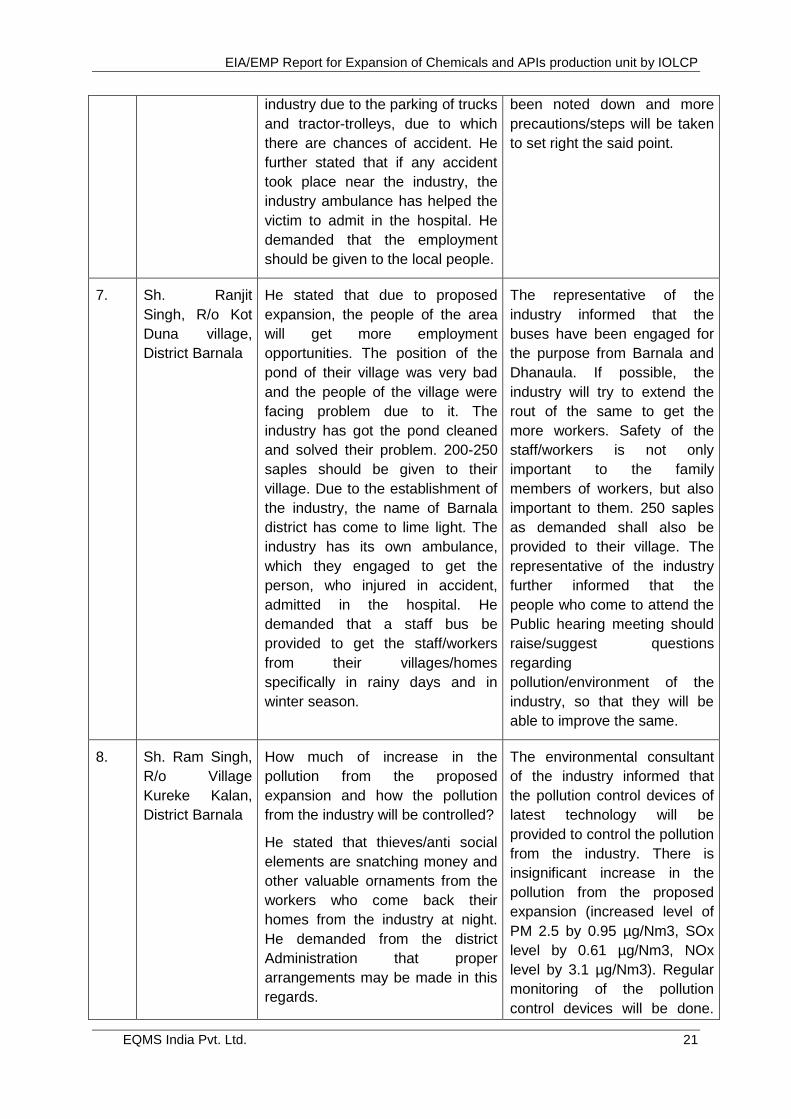
7. Sh. Ranjit
Singh, R/o Kot
Duna village,
District Barnala
He stated that due to proposed
expansion, the people of the area
will get more employment
opportunities. The position of the
pond of their village was very bad
and the people of the village were
facing problem due to it. The
industry has got the pond cleaned
and solved their problem. 200-250
saples should be given to their
village. Due to the establishment of
the industry, the name of Barnala
district has come to lime light. The
industry has its own ambulance,
which they engaged to get the
person, who injured in accident,
admitted in the hospital. He
demanded that a staff bus be
provided to get the staff/workers
from their villages/homes
specifically in rainy days and in
winter season.
The representative of the
industry informed that the
buses have been engaged for
the purpose from Barnala and
Dhanaula. If possible, the
industry will try to extend the
rout of the same to get the
more workers. Safety of the
staff/workers is not only
important to the family
members of workers, but also
important to them. 250 saples
as demanded shall also be
provided to their village. The
representative of the industry
further informed that the
people who come to attend the
Public hearing meeting should
raise/suggest questions
regarding
pollution/environment of the
industry, so that they will be
able to improve the same.
8. Sh. Ram Singh,
R/o Village
Kureke Kalan,
District Barnala
How much of increase in the
pollution from the proposed
expansion and how the pollution
from the industry will be controlled?
He stated that thieves/anti social
elements are snatching money and
other valuable ornaments from the
workers who come back their
homes from the industry at night.
He demanded from the district
Administration that proper
arrangements may be made in this
regards.
The environmental consultant
of the industry informed that
the pollution control devices of
latest technology will be
provided to control the pollution
from the industry. There is
insignificant increase in the
pollution from the proposed
expansion (increased level of
PM 2.5 by 0.95 µg/Nm3, SOx
level by 0.61 µg/Nm3, NOx
level by 3.1 µg/Nm3). Regular
monitoring of the pollution
control devices will be done.
EIA/EMP Report for Expansion of Chemicals and APIs production unit by IOLCP
EQMS India Pvt. Ltd. 22
No wastewater will be
discharged outside the
premises of the industry and
the unit will be zero liquid
discharge.
9. Sh. Bhagwat
Singh, R/o
Handaya,
District Barnala
He stated that due to the
establishment of the industry, the
area upto 20 km has been
developed significantly.
He wanted to know:
What will be manufactured in the
expansion project? Whether any
distillery unit is being established in
the premises.
How the air pollution especially
smoke will be controlled, so as to
save the fields & homes from this
pollution?
The representative of the
industry informed that:-
No distillery plant is being
established. The industry has
proposed to expand its existing
unit for manufacturing bulk
drugs and Active
Pharmaceutical Ingredients
(APIs) like ibuprofen,
medicines for heart, diabetic
patients & other pain killers.
To control the air pollution,
Electrostatic Precipitator (ESP)
of latest technology will be
installed, the efficiency of
which is 99.9%, which will
arrest the smaller dust
particles. As such, there will be
no significant effect on the air
pollution from the project.
1.8. SCOPE & METHODOLOGY OF THE STUDY
This study is aimed at providing a deeper insight into the proposed project and its
various environmental components. The present study area for the environmental
assessment is within 10 km radius of the location of the project. The methodology
used for the study is given below:
Monitoring and collection of baseline data for various environmental
components as per the MoEFCC guidelines.
Identification and quantification of significant environmental impacts
due to the project and associated activities.
Evaluation of impacts due to proposed activities and preparation of
an environmental impact statement.
Preparation of appropriate Environmental Management Plan (EMP)
encompassing strategies for minimizing identified adverse impacts
along with budgetary provisions to be made by the project authorities
for implementation of mitigation measures.
Delineation of post Environmental Quality Monitoring Programmed (EQMP) along with
organizational setup required for monitoring the effectiveness of mitigation measures.
EIA/EMP Report for Expansion of Chemicals and APIs production unit by IOLCP
EQMS India Pvt. Ltd. 23
1.9. APPROVED TERMS OF REFERENCE FOR EIA STUDY BY EAC
Online document submitted on 19th April 2018 to Expert Appraisal Committee
(Industry-2). Standard Terms of Reference (TOR) was issued by MoEF&CC vide their
letter No: 11011/976/2008-IA-II(I) dated 1st June 2018 (Proposal No.
IA/PB/IND2/74654/2018) for preparation of EIA/EMP. The compliance status of
proposed TOR is as follow in subsection 1.8.1.
1.8.1 TOR Compliance Status
The TOR compliance status of the project has been presented in Table 1.2
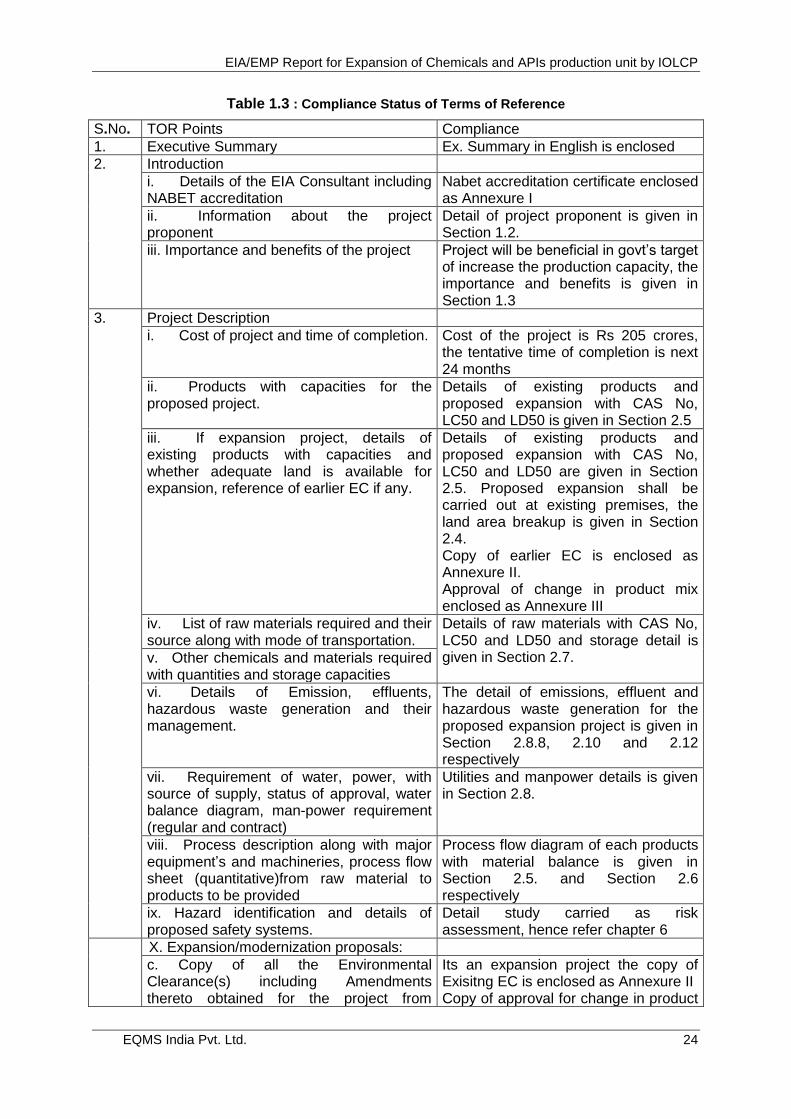
EIA/EMP Report for Expansion of Chemicals and APIs production unit by IOLCP
EQMS India Pvt. Ltd. 24
Table 1.3 : Compliance Status of Terms of Reference
S.No. TOR Points Compliance
1. Executive Summary Ex. Summary in English is enclosed
2. Introduction
i. Details of the EIA Consultant including NABET accreditation
Nabet accreditation certificate enclosed as Annexure I
ii. Information about the project proponent
Detail of project proponent is given in Section 1.2.
iii. Importance and benefits of the project Project will be beneficial in govt‘s target of increase the production capacity, the importance and benefits is given in Section 1.3
3. Project Description
i. Cost of project and time of completion. Cost of the project is Rs 205 crores, the tentative time of completion is next 24 months
ii. Products with capacities for the proposed project.
Details of existing products and proposed expansion with CAS No, LC50 and LD50 is given in Section 2.5
iii. If expansion project, details of existing products with capacities and whether adequate land is available for expansion, reference of earlier EC if any.
Details of existing products and proposed expansion with CAS No, LC50 and LD50 are given in Section 2.5. Proposed expansion shall be carried out at existing premises, the land area breakup is given in Section 2.4. Copy of earlier EC is enclosed as Annexure II. Approval of change in product mix enclosed as Annexure III
iv. List of raw materials required and their source along with mode of transportation.
Details of raw materials with CAS No, LC50 and LD50 and storage detail is given in Section 2.7. v. Other chemicals and materials required
with quantities and storage capacities
vi. Details of Emission, effluents, hazardous waste generation and their management.
The detail of emissions, effluent and hazardous waste generation for the proposed expansion project is given in Section 2.8.8, 2.10 and 2.12 respectively
vii. Requirement of water, power, with source of supply, status of approval, water balance diagram, man-power requirement (regular and contract)
Utilities and manpower details is given in Section 2.8.
viii. Process description along with major equipment’s and machineries, process flow sheet (quantitative)from raw material to products to be provided
Process flow diagram of each products with material balance is given in Section 2.5. and Section 2.6 respectively
ix. Hazard identification and details of proposed safety systems.
Detail study carried as risk assessment, hence refer chapter 6
X. Expansion/modernization proposals:
c. Copy of all the Environmental Clearance(s) including Amendments thereto obtained for the project from
Its an expansion project the copy of Exisitng EC is enclosed as Annexure II Copy of approval for change in product
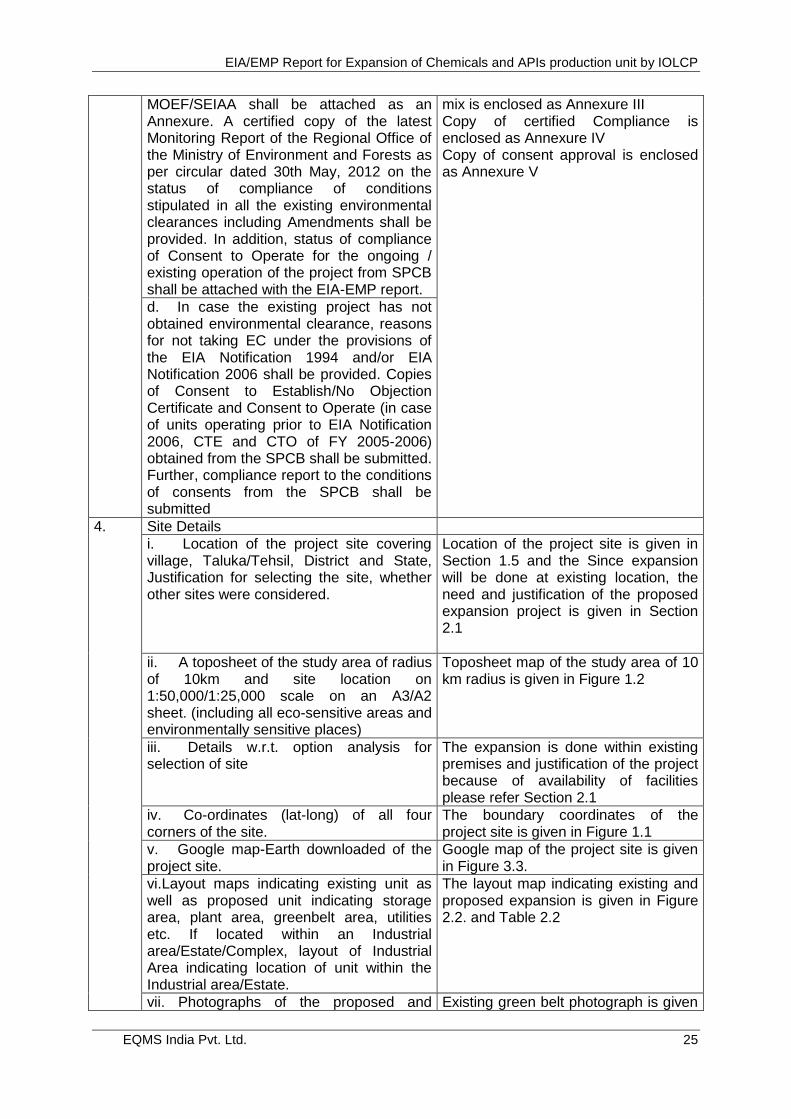
EIA/EMP Report for Expansion of Chemicals and APIs production unit by IOLCP
EQMS India Pvt. Ltd. 25
MOEF/SEIAA shall be attached as an Annexure. A certified copy of the latest Monitoring Report of the Regional Office of the Ministry of Environment and Forests as per circular dated 30th May, 2012 on the status of compliance of conditions stipulated in all the existing environmental clearances including Amendments shall be provided. In addition, status of compliance of Consent to Operate for the ongoing / existing operation of the project from SPCB shall be attached with the EIA-EMP report.
mix is enclosed as Annexure III Copy of certified Compliance is enclosed as Annexure IV Copy of consent approval is enclosed as Annexure V
d. In case the existing project has not obtained environmental clearance, reasons for not taking EC under the provisions of the EIA Notification 1994 and/or EIA Notification 2006 shall be provided. Copies of Consent to Establish/No Objection Certificate and Consent to Operate (in case of units operating prior to EIA Notification 2006, CTE and CTO of FY 2005-2006) obtained from the SPCB shall be submitted. Further, compliance report to the conditions of consents from the SPCB shall be submitted
4. Site Details
i. Location of the project site covering village, Taluka/Tehsil, District and State, Justification for selecting the site, whether other sites were considered.
Location of the project site is given in Section 1.5 and the Since expansion will be done at existing location, the need and justification of the proposed expansion project is given in Section 2.1
ii. A toposheet of the study area of radius of 10km and site location on 1:50,000/1:25,000 scale on an A3/A2 sheet. (including all eco-sensitive areas and environmentally sensitive places)
Toposheet map of the study area of 10 km radius is given in Figure 1.2
iii. Details w.r.t. option analysis for selection of site
The expansion is done within existing premises and justification of the project because of availability of facilities please refer Section 2.1
iv. Co-ordinates (lat-long) of all four corners of the site.
The boundary coordinates of the project site is given in Figure 1.1
v. Google map-Earth downloaded of the project site.
Google map of the project site is given in Figure 3.3.
vi.Layout maps indicating existing unit as well as proposed unit indicating storage area, plant area, greenbelt area, utilities etc. If located within an Industrial area/Estate/Complex, layout of Industrial Area indicating location of unit within the Industrial area/Estate.
The layout map indicating existing and proposed expansion is given in Figure 2.2. and Table 2.2
vii. Photographs of the proposed and Existing green belt photograph is given
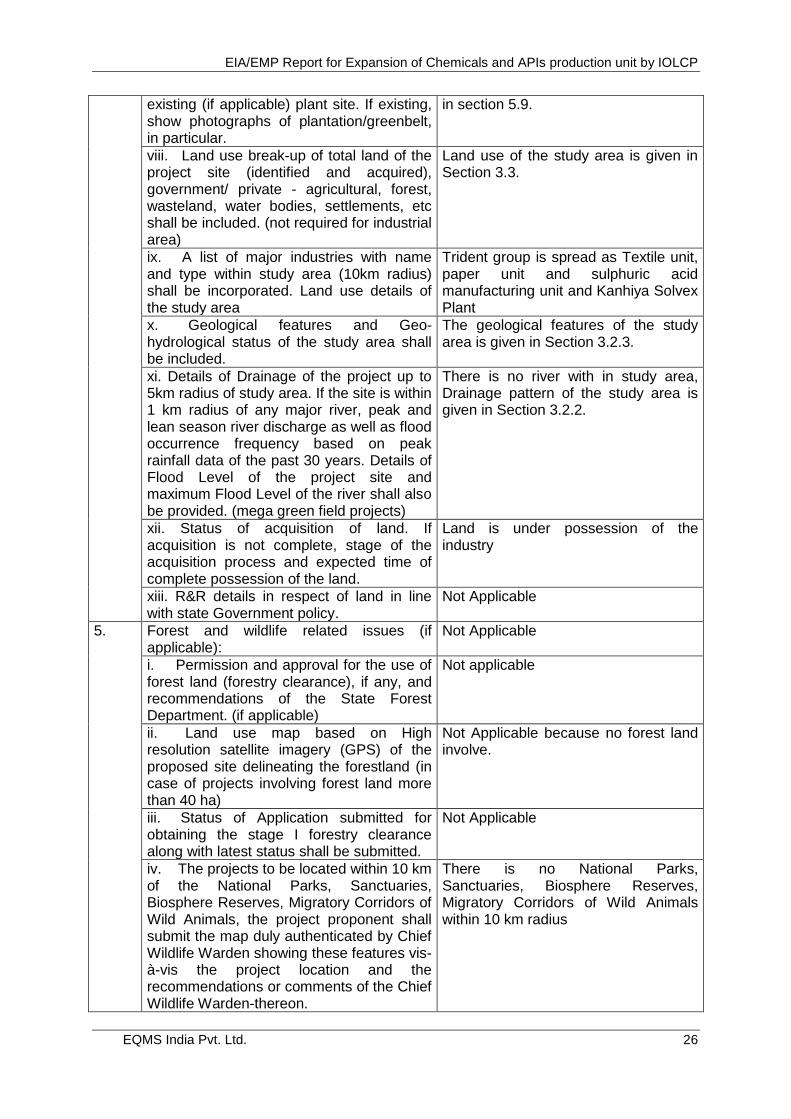
EIA/EMP Report for Expansion of Chemicals and APIs production unit by IOLCP
EQMS India Pvt. Ltd. 26
existing (if applicable) plant site. If existing, show photographs of plantation/greenbelt, in particular.
in section 5.9.
viii. Land use break-up of total land of the project site (identified and acquired), government/ private - agricultural, forest, wasteland, water bodies, settlements, etc shall be included. (not required for industrial area)
Land use of the study area is given in Section 3.3.
ix. A list of major industries with name and type within study area (10km radius) shall be incorporated. Land use details of the study area
Trident group is spread as Textile unit, paper unit and sulphuric acid manufacturing unit and Kanhiya Solvex Plant
x. Geological features and Geo-hydrological status of the study area shall be included.
The geological features of the study area is given in Section 3.2.3.
xi. Details of Drainage of the project up to 5km radius of study area. If the site is within 1 km radius of any major river, peak and lean season river discharge as well as flood occurrence frequency based on peak rainfall data of the past 30 years. Details of Flood Level of the project site and maximum Flood Level of the river shall also be provided. (mega green field projects)
There is no river with in study area, Drainage pattern of the study area is given in Section 3.2.2.
xii. Status of acquisition of land. If acquisition is not complete, stage of the acquisition process and expected time of complete possession of the land.
Land is under possession of the industry
xiii. R&R details in respect of land in line with state Government policy.
Not Applicable
5. Forest and wildlife related issues (if applicable):
Not Applicable
i. Permission and approval for the use of forest land (forestry clearance), if any, and recommendations of the State Forest Department. (if applicable)
Not applicable
ii. Land use map based on High resolution satellite imagery (GPS) of the proposed site delineating the forestland (in case of projects involving forest land more than 40 ha)
Not Applicable because no forest land involve.
iii. Status of Application submitted for obtaining the stage I forestry clearance along with latest status shall be submitted.
Not Applicable
iv. The projects to be located within 10 km of the National Parks, Sanctuaries, Biosphere Reserves, Migratory Corridors of Wild Animals, the project proponent shall submit the map duly authenticated by Chief Wildlife Warden showing these features vis-à-vis the project location and the recommendations or comments of the Chief Wildlife Warden-thereon.
There is no National Parks, Sanctuaries, Biosphere Reserves, Migratory Corridors of Wild Animals within 10 km radius
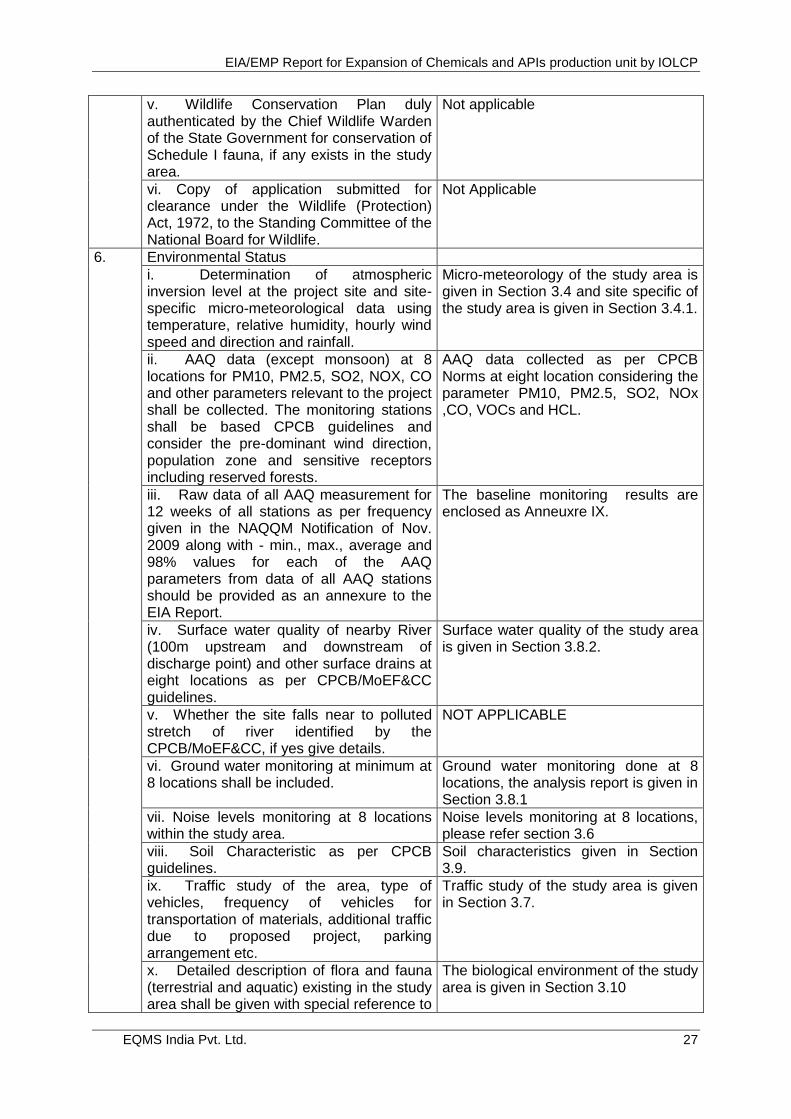
EIA/EMP Report for Expansion of Chemicals and APIs production unit by IOLCP
EQMS India Pvt. Ltd. 27
v. Wildlife Conservation Plan duly authenticated by the Chief Wildlife Warden of the State Government for conservation of Schedule I fauna, if any exists in the study area.
Not applicable
vi. Copy of application submitted for clearance under the Wildlife (Protection) Act, 1972, to the Standing Committee of the National Board for Wildlife.
Not Applicable
6. Environmental Status
i. Determination of atmospheric inversion level at the project site and site-specific micro-meteorological data using temperature, relative humidity, hourly wind speed and direction and rainfall.
Micro-meteorology of the study area is given in Section 3.4 and site specific of the study area is given in Section 3.4.1.
ii. AAQ data (except monsoon) at 8 locations for PM10, PM2.5, SO2, NOX, CO and other parameters relevant to the project shall be collected. The monitoring stations shall be based CPCB guidelines and consider the pre-dominant wind direction, population zone and sensitive receptors including reserved forests.
AAQ data collected as per CPCB Norms at eight location considering the parameter PM10, PM2.5, SO2, NOx ,CO, VOCs and HCL.
iii. Raw data of all AAQ measurement for 12 weeks of all stations as per frequency given in the NAQQM Notification of Nov. 2009 along with - min., max., average and 98% values for each of the AAQ parameters from data of all AAQ stations should be provided as an annexure to the EIA Report.
The baseline monitoring results are enclosed as Anneuxre IX.
iv. Surface water quality of nearby River (100m upstream and downstream of discharge point) and other surface drains at eight locations as per CPCB/MoEF&CC guidelines.
Surface water quality of the study area is given in Section 3.8.2.
v. Whether the site falls near to polluted stretch of river identified by the CPCB/MoEF&CC, if yes give details.
NOT APPLICABLE
vi. Ground water monitoring at minimum at 8 locations shall be included.
Ground water monitoring done at 8 locations, the analysis report is given in Section 3.8.1
vii. Noise levels monitoring at 8 locations within the study area.
Noise levels monitoring at 8 locations, please refer section 3.6
viii. Soil Characteristic as per CPCB guidelines.
Soil characteristics given in Section 3.9.
ix. Traffic study of the area, type of vehicles, frequency of vehicles for transportation of materials, additional traffic due to proposed project, parking arrangement etc.
Traffic study of the study area is given in Section 3.7.
x. Detailed description of flora and fauna (terrestrial and aquatic) existing in the study area shall be given with special reference to
The biological environment of the study area is given in Section 3.10

EIA/EMP Report for Expansion of Chemicals and APIs production unit by IOLCP
EQMS India Pvt. Ltd. 28
rare, endemic and endangered species. If Schedule-I fauna are found within the study area, a Wildlife Conservation Plan shall be prepared and furnished.
xi. Socio-economic status of the study area. Demography of the study area is given in Section 3.11.
7. Impact and Environment Management Plan
i. Assessment of ground level concentration of pollutants from the stack emission based on site-specific meteorological features. In case the project is located on a hilly terrain, the AQIP Modelling shall be done using inputs of the specific terrain characteristics for determining the potential impacts of the project on the AAQ. Cumulative impact of all sources of emissions (including transportation) on the AAQ of the area shall be assessed. Details of the model used and the input data used for modelling shall also be provided. The air quality contours shall be plotted on a location map showing the location of project site, habitation nearby, sensitive receptors, if any.
The ambient air modelling of the emission from the proposed expansion is cover in Section 4.2.4 to 4.2.7. The air quality contours is given in Chapter 4
ii. Water Quality modelling - in case of discharge in water body
No discharge to water body. Waste
water is treated in ETP & send to
greenbelt development with in
premises; hence water quality
modeling is not required.
iii. Impact of the transport of the raw materials and end products on the surrounding environment hall be assessed and provided. In this regard, options for transport of raw materials and finished products and wastes (large quantities) by rail or rail-cum road transport or conveyor-cum-rail transport shall be examined.
The site in located near SH 13, from the proposed expansion project additional 10-15 truck/tankers are increases which will neither increase the load nor effect the existing road
iv. A note on treatment of wastewater from different plant operations, extent recycled and reused for different purposes shall be included. Complete scheme of effluent treatment. Characteristics of untreated and treated effluent to meet the prescribed standards of discharge under E(P) Rules.
Complete scheme of effluent treatment with characteristics of inlet and outlet effluent is given in Section 2.8.8.
v. Details of stack emission and action plan for control of emissions to meet standards.
Stack emission details with controlling equipments is given in Section 2.10.
vi. Measures for fugitive emission control
vii. Details of hazardous waste generation and their storage, utilization and management. Copies of MOU regarding utilization of solid and hazardous waste in
Hazardous waste generation and their storage, utilization and management is given section 2.12 Copy of TSDF membership is enclosed as Annexure
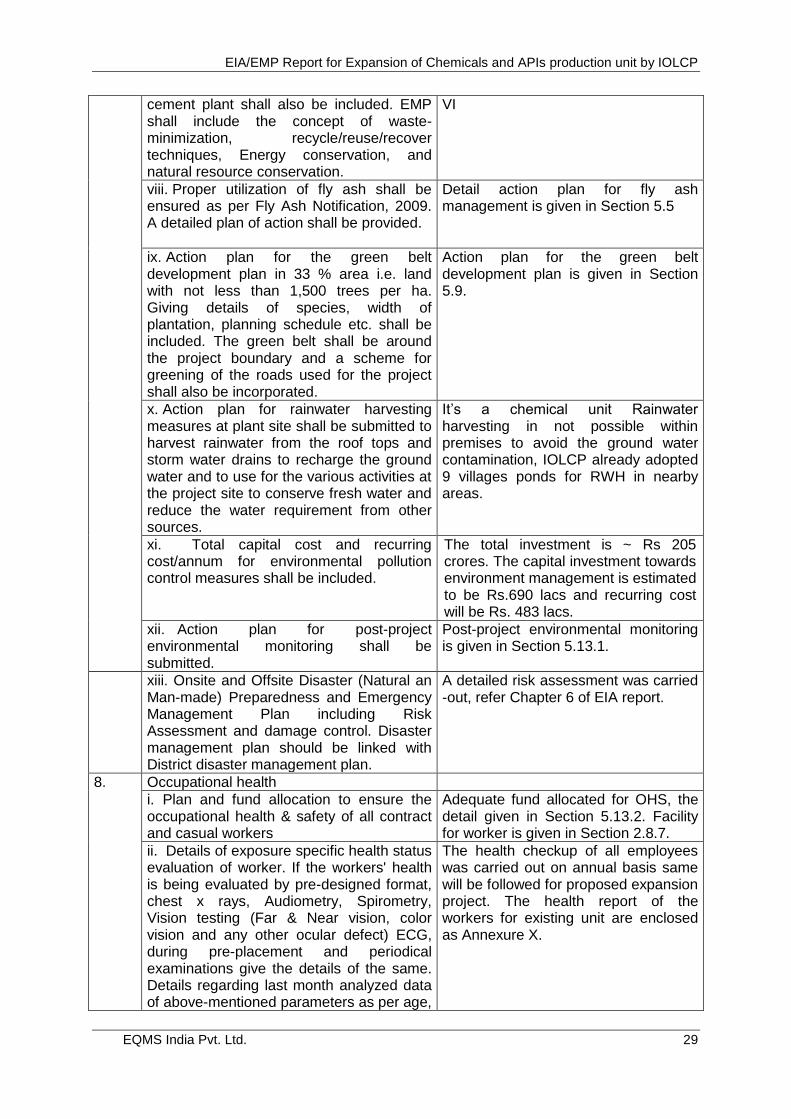
EIA/EMP Report for Expansion of Chemicals and APIs production unit by IOLCP
EQMS India Pvt. Ltd. 29
cement plant shall also be included. EMP shall include the concept of waste-minimization, recycle/reuse/recover techniques, Energy conservation, and natural resource conservation.
VI
viii. Proper utilization of fly ash shall be ensured as per Fly Ash Notification, 2009. A detailed plan of action shall be provided.
Detail action plan for fly ash management is given in Section 5.5
ix. Action plan for the green belt development plan in 33 % area i.e. land with not less than 1,500 trees per ha. Giving details of species, width of plantation, planning schedule etc. shall be included. The green belt shall be around the project boundary and a scheme for greening of the roads used for the project shall also be incorporated.
Action plan for the green belt development plan is given in Section 5.9.
x. Action plan for rainwater harvesting measures at plant site shall be submitted to harvest rainwater from the roof tops and storm water drains to recharge the ground water and to use for the various activities at the project site to conserve fresh water and reduce the water requirement from other sources.
It‘s a chemical unit Rainwater harvesting in not possible within premises to avoid the ground water contamination, IOLCP already adopted 9 villages ponds for RWH in nearby areas.
xi. Total capital cost and recurring cost/annum for environmental pollution control measures shall be included.
The total investment is ~ Rs 205 crores. The capital investment towards environment management is estimated to be Rs.690 lacs and recurring cost will be Rs. 483 lacs.
xii. Action plan for post-project environmental monitoring shall be submitted.
Post-project environmental monitoring is given in Section 5.13.1.
xiii. Onsite and Offsite Disaster (Natural an Man-made) Preparedness and Emergency Management Plan including Risk Assessment and damage control. Disaster management plan should be linked with District disaster management plan.
A detailed risk assessment was carried -out, refer Chapter 6 of EIA report.
8. Occupational health
i. Plan and fund allocation to ensure the occupational health & safety of all contract and casual workers
Adequate fund allocated for OHS, the detail given in Section 5.13.2. Facility for worker is given in Section 2.8.7.
ii. Details of exposure specific health status evaluation of worker. If the workers' health is being evaluated by pre-designed format, chest x rays, Audiometry, Spirometry, Vision testing (Far & Near vision, color vision and any other ocular defect) ECG, during pre-placement and periodical examinations give the details of the same. Details regarding last month analyzed data of above-mentioned parameters as per age,
The health checkup of all employees was carried out on annual basis same will be followed for proposed expansion project. The health report of the workers for existing unit are enclosed as Annexure X.
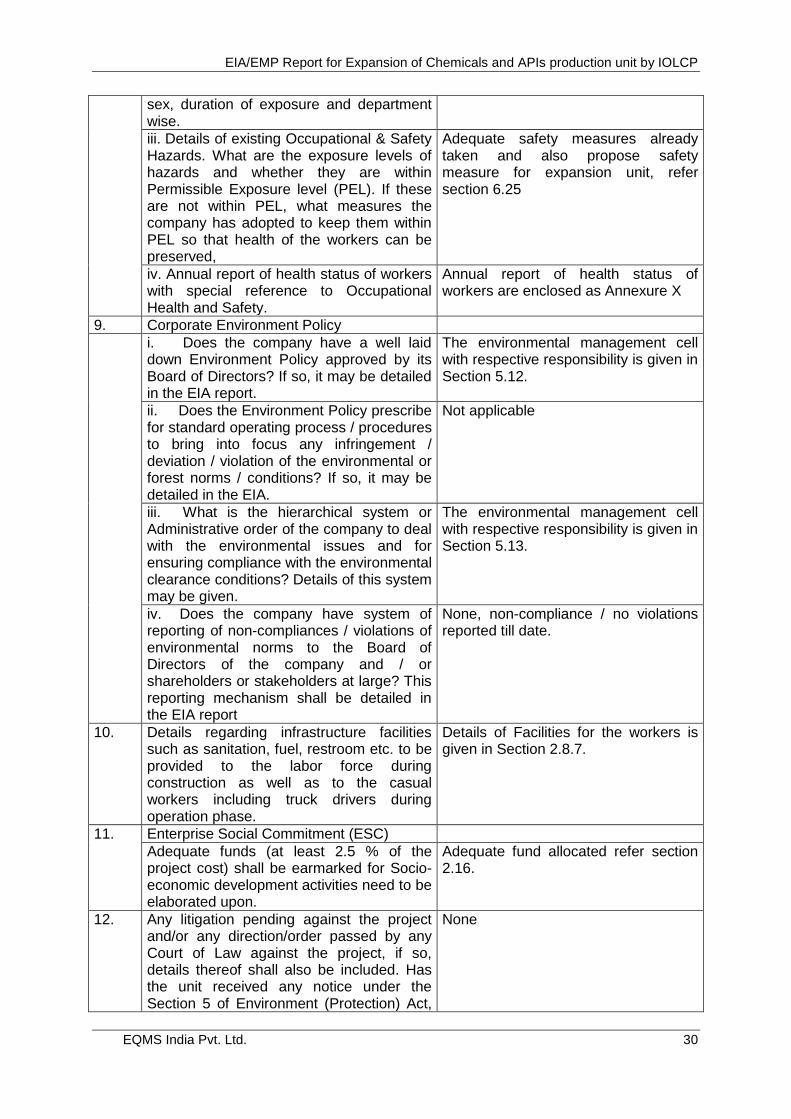
EIA/EMP Report for Expansion of Chemicals and APIs production unit by IOLCP
EQMS India Pvt. Ltd. 30
sex, duration of exposure and department wise.
iii. Details of existing Occupational & Safety Hazards. What are the exposure levels of hazards and whether they are within Permissible Exposure level (PEL). If these are not within PEL, what measures the company has adopted to keep them within PEL so that health of the workers can be preserved,
Adequate safety measures already taken and also propose safety measure for expansion unit, refer section 6.25
iv. Annual report of health status of workers with special reference to Occupational Health and Safety.
Annual report of health status of workers are enclosed as Annexure X
9. Corporate Environment Policy
i. Does the company have a well laid down Environment Policy approved by its Board of Directors? If so, it may be detailed in the EIA report.
The environmental management cell with respective responsibility is given in Section 5.12.
ii. Does the Environment Policy prescribe for standard operating process / procedures to bring into focus any infringement / deviation / violation of the environmental or forest norms / conditions? If so, it may be detailed in the EIA.
Not applicable
iii. What is the hierarchical system or Administrative order of the company to deal with the environmental issues and for ensuring compliance with the environmental clearance conditions? Details of this system may be given.
The environmental management cell with respective responsibility is given in Section 5.13.
iv. Does the company have system of reporting of non-compliances / violations of environmental norms to the Board of Directors of the company and / or shareholders or stakeholders at large? This reporting mechanism shall be detailed in the EIA report
None, non-compliance / no violations reported till date.
10. Details regarding infrastructure facilities such as sanitation, fuel, restroom etc. to be provided to the labor force during construction as well as to the casual workers including truck drivers during operation phase.
Details of Facilities for the workers is given in Section 2.8.7.
11. Enterprise Social Commitment (ESC)
Adequate funds (at least 2.5 % of the project cost) shall be earmarked for Socio-economic development activities need to be elaborated upon.
Adequate fund allocated refer section 2.16.
12. Any litigation pending against the project and/or any direction/order passed by any Court of Law against the project, if so, details thereof shall also be included. Has the unit received any notice under the Section 5 of Environment (Protection) Act,
None
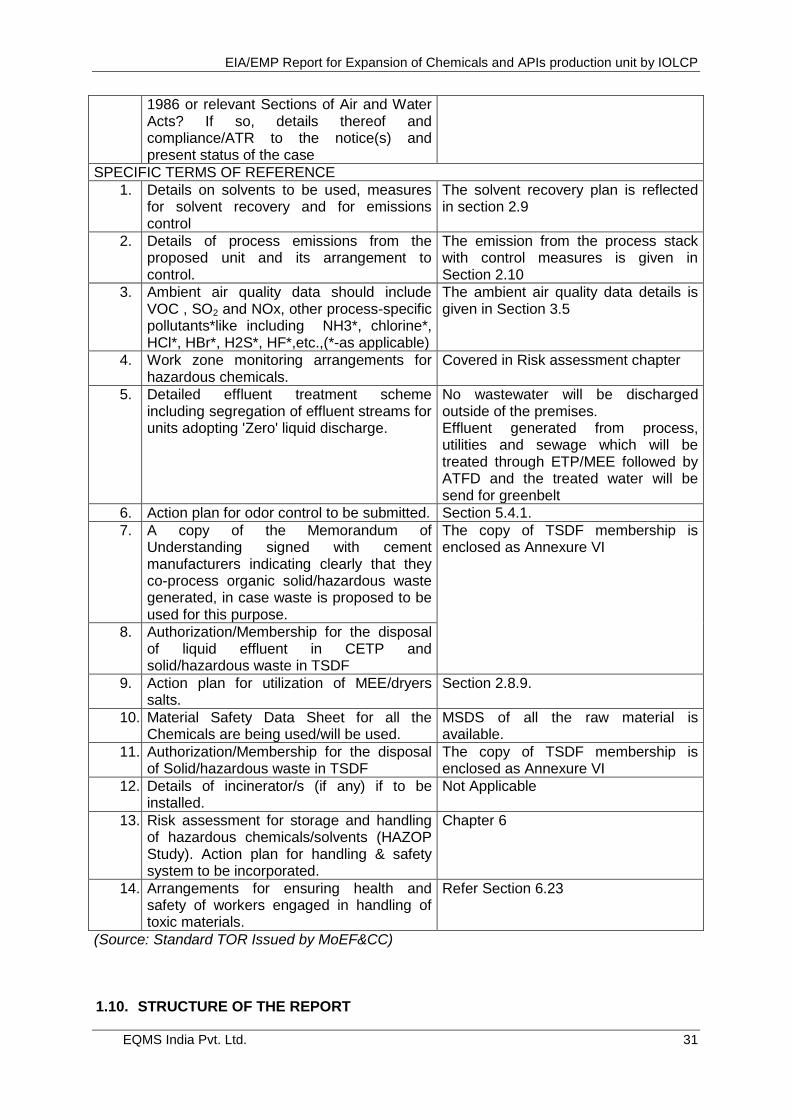
EIA/EMP Report for Expansion of Chemicals and APIs production unit by IOLCP
EQMS India Pvt. Ltd. 31
1986 or relevant Sections of Air and Water Acts? If so, details thereof and compliance/ATR to the notice(s) and present status of the case
SPECIFIC TERMS OF REFERENCE
1. Details on solvents to be used, measures for solvent recovery and for emissions control
The solvent recovery plan is reflected in section 2.9
2. Details of process emissions from the proposed unit and its arrangement to control.
The emission from the process stack with control measures is given in Section 2.10
3. Ambient air quality data should include VOC , SO2 and NOx, other process-specific pollutants*like including NH3*, chlorine*, HCl*, HBr*, H2S*, HF*,etc.,(*-as applicable)
The ambient air quality data details is given in Section 3.5
4. Work zone monitoring arrangements for hazardous chemicals.
Covered in Risk assessment chapter
5. Detailed effluent treatment scheme including segregation of effluent streams for units adopting 'Zero' liquid discharge.
No wastewater will be discharged outside of the premises. Effluent generated from process, utilities and sewage which will be treated through ETP/MEE followed by ATFD and the treated water will be send for greenbelt
6. Action plan for odor control to be submitted. Section 5.4.1.
7. A copy of the Memorandum of Understanding signed with cement manufacturers indicating clearly that they co-process organic solid/hazardous waste generated, in case waste is proposed to be used for this purpose.
The copy of TSDF membership is enclosed as Annexure VI
8. Authorization/Membership for the disposal of liquid effluent in CETP and solid/hazardous waste in TSDF
9. Action plan for utilization of MEE/dryers salts.
Section 2.8.9.
10. Material Safety Data Sheet for all the Chemicals are being used/will be used.
MSDS of all the raw material is available.
11. \ Authorization/Membership for the disposal of Solid/hazardous waste in TSDF
The copy of TSDF membership is enclosed as Annexure VI
12. Details of incinerator/s (if any) if to be installed.
Not Applicable
13. Risk assessment for storage and handling of hazardous chemicals/solvents (HAZOP Study). Action plan for handling & safety system to be incorporated.
Chapter 6
14. Arrangements for ensuring health and safety of workers engaged in handling of toxic materials.
Refer Section 6.23
(Source: Standard TOR Issued by MoEF&CC)
1.10. STRUCTURE OF THE REPORT
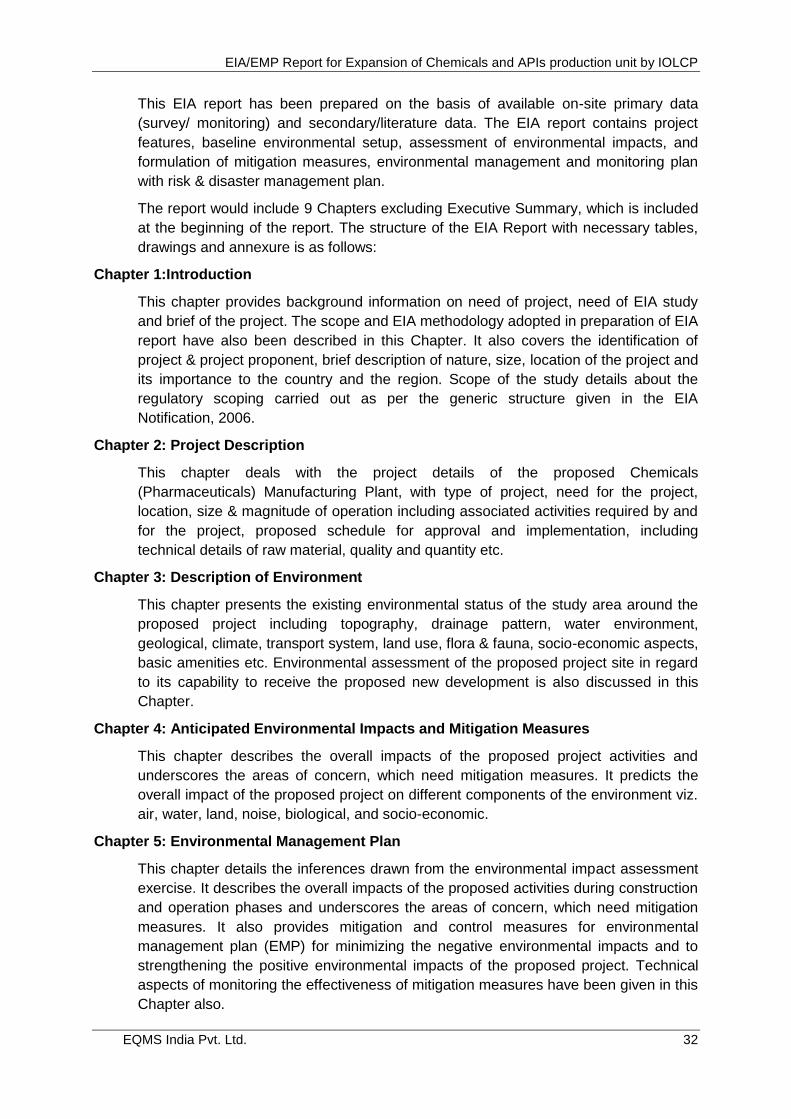
EIA/EMP Report for Expansion of Chemicals and APIs production unit by IOLCP
EQMS India Pvt. Ltd. 32
This EIA report has been prepared on the basis of available on-site primary data
(survey/ monitoring) and secondary/literature data. The EIA report contains project
features, baseline environmental setup, assessment of environmental impacts, and
formulation of mitigation measures, environmental management and monitoring plan
with risk & disaster management plan.
The report would include 9 Chapters excluding Executive Summary, which is included
at the beginning of the report. The structure of the EIA Report with necessary tables,
drawings and annexure is as follows:
Chapter 1:Introduction
This chapter provides background information on need of project, need of EIA study
and brief of the project. The scope and EIA methodology adopted in preparation of EIA
report have also been described in this Chapter. It also covers the identification of
project & project proponent, brief description of nature, size, location of the project and
its importance to the country and the region. Scope of the study details about the
regulatory scoping carried out as per the generic structure given in the EIA
Notification, 2006.
Chapter 2: Project Description
This chapter deals with the project details of the proposed Chemicals
(Pharmaceuticals) Manufacturing Plant, with type of project, need for the project,
location, size & magnitude of operation including associated activities required by and
for the project, proposed schedule for approval and implementation, including
technical details of raw material, quality and quantity etc.
Chapter 3: Description of Environment
This chapter presents the existing environmental status of the study area around the
proposed project including topography, drainage pattern, water environment,
geological, climate, transport system, land use, flora & fauna, socio-economic aspects,
basic amenities etc. Environmental assessment of the proposed project site in regard
to its capability to receive the proposed new development is also discussed in this
Chapter.
Chapter 4: Anticipated Environmental Impacts and Mitigation Measures
This chapter describes the overall impacts of the proposed project activities and
underscores the areas of concern, which need mitigation measures. It predicts the
overall impact of the proposed project on different components of the environment viz.
air, water, land, noise, biological, and socio-economic.
Chapter 5: Environmental Management Plan
This chapter details the inferences drawn from the environmental impact assessment
exercise. It describes the overall impacts of the proposed activities during construction
and operation phases and underscores the areas of concern, which need mitigation
measures. It also provides mitigation and control measures for environmental
management plan (EMP) for minimizing the negative environmental impacts and to
strengthening the positive environmental impacts of the proposed project. Technical
aspects of monitoring the effectiveness of mitigation measures have been given in this
Chapter also.
EIA/EMP Report for Expansion of Chemicals and APIs production unit by IOLCP
EQMS India Pvt. Ltd. 33
Chapter 6: Risk Assessment & Disaster Management Plan
This chapter deals with the risk assessment carried out for the proposed Synthetic
Organic Chemicals manufacturing plant and disaster management plan.
Chapter 7: Summary & Conclusion
This chapter provides the summary and conclusions of the EIA study of the proposed
project with overall justification for implementation of the project and also explanation
of how, adverse effects will be mitigated. This chapter also includes the conclusions of
the Public Hearing.
Chapter 8: Disclosure of Consultants Engaged
This chapter provides the disclosure of consultants engaged to carry out the EIA study
along with other additional studies.
CHAPTER 2. PROJECT DESCRIPTION
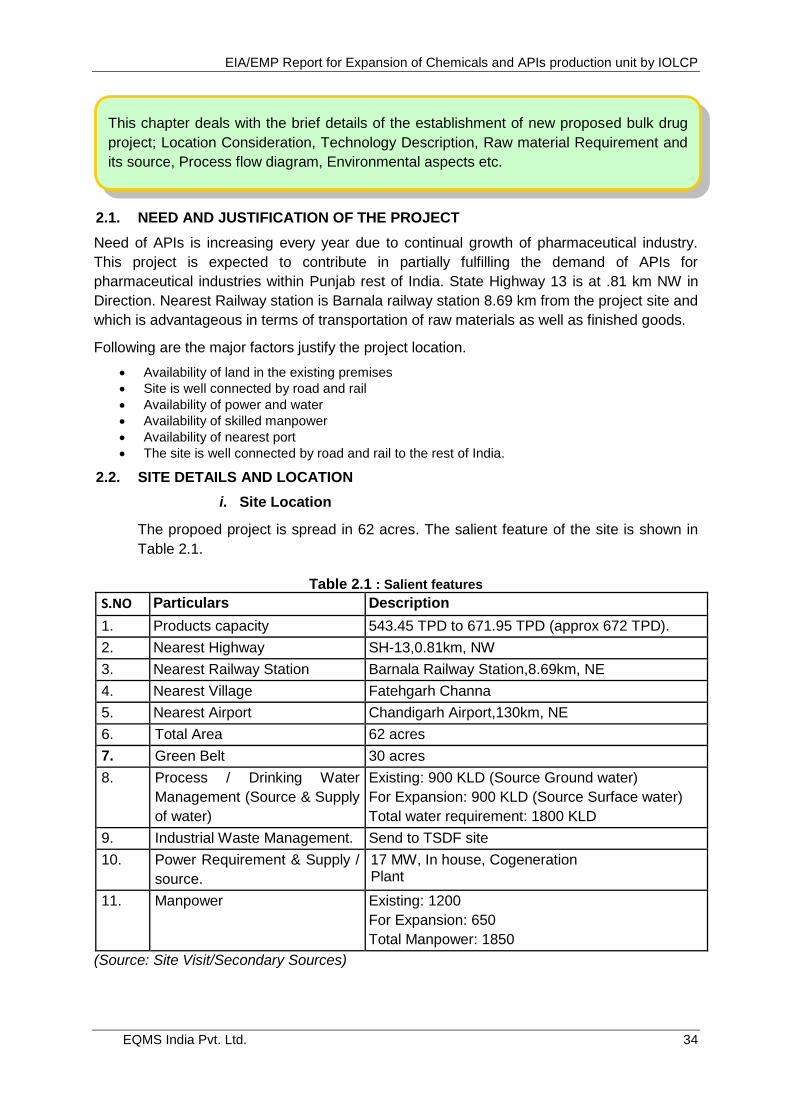
EIA/EMP Report for Expansion of Chemicals and APIs production unit by IOLCP
EQMS India Pvt. Ltd. 34
2.1. NEED AND JUSTIFICATION OF THE PROJECT
Need of APIs is increasing every year due to continual growth of pharmaceutical industry.
This project is expected to contribute in partially fulfilling the demand of APIs for
pharmaceutical industries within Punjab rest of India. State Highway 13 is at .81 km NW in
Direction. Nearest Railway station is Barnala railway station 8.69 km from the project site and
which is advantageous in terms of transportation of raw materials as well as finished goods.
Following are the major factors justify the project location.
Availability of land in the existing premises
Site is well connected by road and rail
Availability of power and water
Availability of skilled manpower
Availability of nearest port
The site is well connected by road and rail to the rest of India.
2.2. SITE DETAILS AND LOCATION
i. Site Location
The propoed project is spread in 62 acres. The salient feature of the site is shown in
Table 2.1.
Table 2.1 : Salient features
S.NO Particulars Description
1. Products capacity 543.45 TPD to 671.95 TPD (approx 672 TPD).
2. Nearest Highway SH-13,0.81km, NW
3. Nearest Railway Station Barnala Railway Station,8.69km, NE
4. Nearest Village Fatehgarh Channa
5. Nearest Airport Chandigarh Airport,130km, NE
6. Total Area 62 acres
7. Green Belt 30 acres
8. Process / Drinking Water
Management (Source & Supply
of water)
Existing: 900 KLD (Source Ground water)
For Expansion: 900 KLD (Source Surface water)
Total water requirement: 1800 KLD
9. Industrial Waste Management. Send to TSDF site
10. Power Requirement & Supply /
source.
17 MW, In house, Cogeneration Plant
11. Manpower Existing: 1200
For Expansion: 650
Total Manpower: 1850
(Source: Site Visit/Secondary Sources)
This chapter deals with the brief details of the establishment of new proposed bulk drug
project; Location Consideration, Technology Description, Raw material Requirement and
its source, Process flow diagram, Environmental aspects etc.
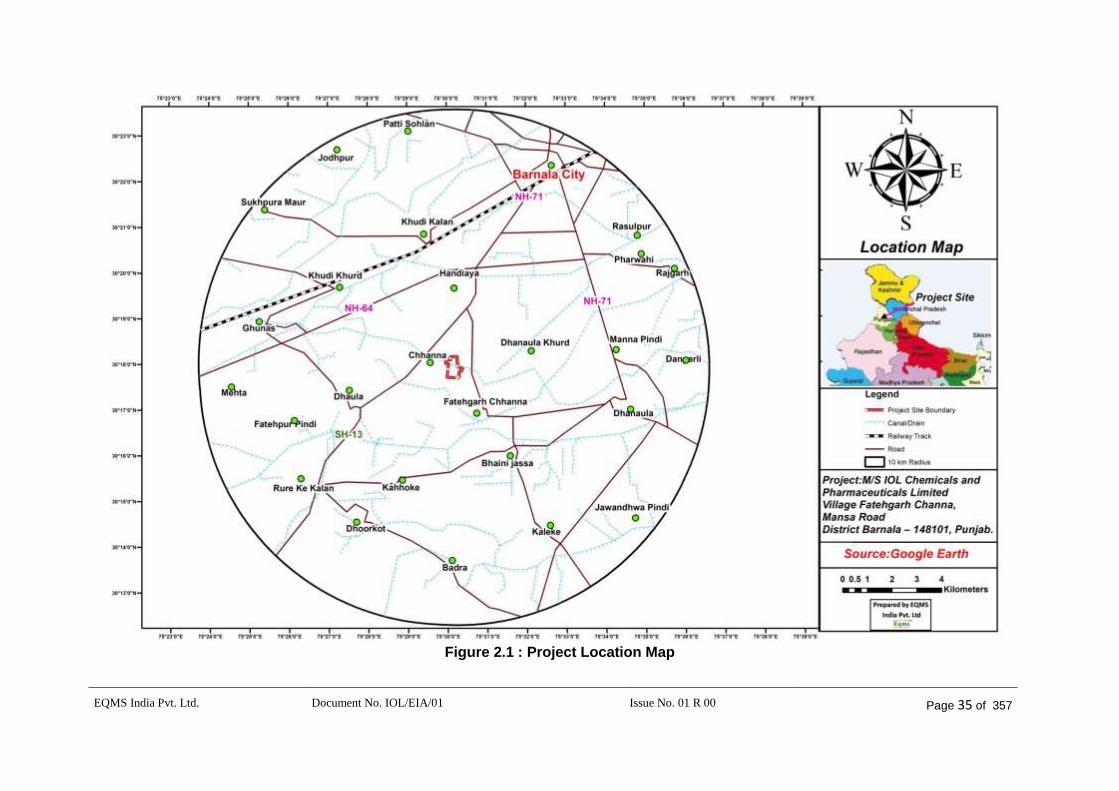
EQMS India Pvt. Ltd. Document No. IOL/EIA/01 Issue No. 01 R 00 Page 35 of 357
Figure 2.1 : Project Location Map
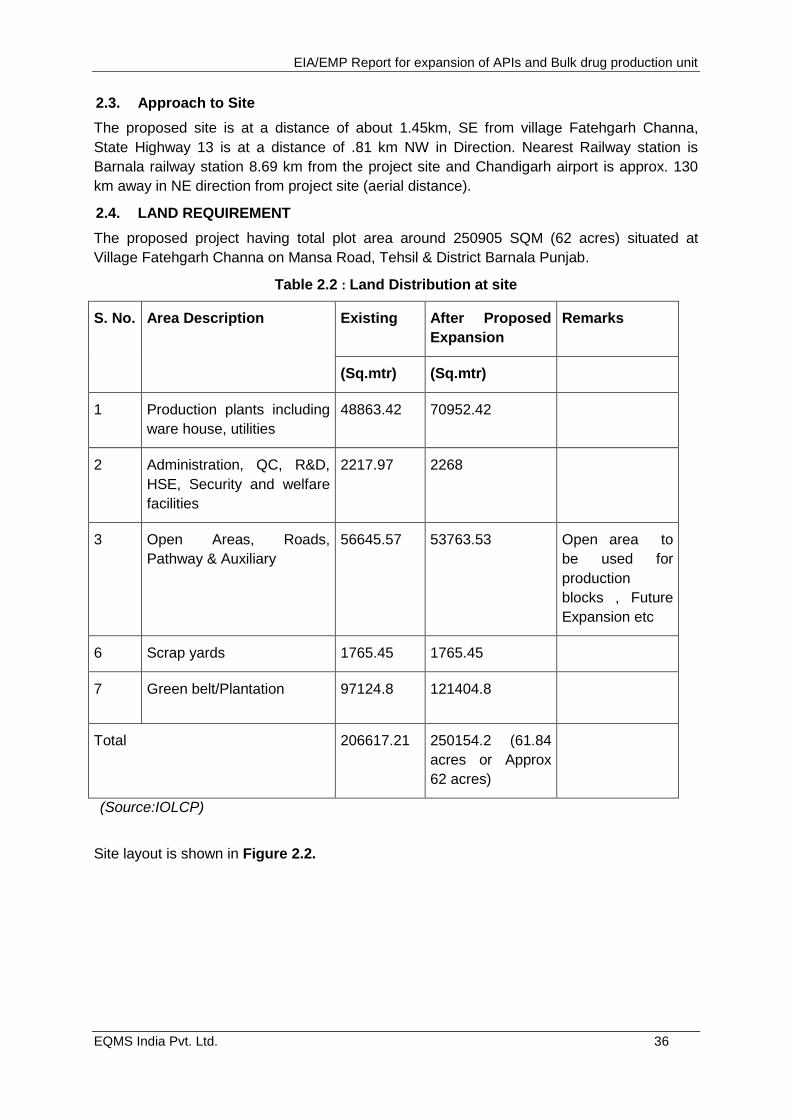
EIA/EMP Report for expansion of APIs and Bulk drug production unit
EQMS India Pvt. Ltd. 36
2.3. Approach to Site
The proposed site is at a distance of about 1.45km, SE from village Fatehgarh Channa,
State Highway 13 is at a distance of .81 km NW in Direction. Nearest Railway station is
Barnala railway station 8.69 km from the project site and Chandigarh airport is approx. 130
km away in NE direction from project site (aerial distance).
2.4. LAND REQUIREMENT
The proposed project having total plot area around 250905 SQM (62 acres) situated at
Village Fatehgarh Channa on Mansa Road, Tehsil & District Barnala Punjab.
Table 2.2 : Land Distribution at site
S. No. Area Description Existing After Proposed
Expansion
Remarks
(Sq.mtr) (Sq.mtr)
1 Production plants including
ware house, utilities
48863.42 70952.42
2 Administration, QC, R&D,
HSE, Security and welfare
facilities
2217.97 2268
3 Open Areas, Roads,
Pathway & Auxiliary
56645.57 53763.53 Open area to
be used for
production
blocks , Future
Expansion etc
6 Scrap yards 1765.45 1765.45
7 Green belt/Plantation 97124.8 121404.8
Total 206617.21 250154.2 (61.84
acres or Approx
62 acres)
(Source:IOLCP)
Site layout is shown in Figure 2.2.
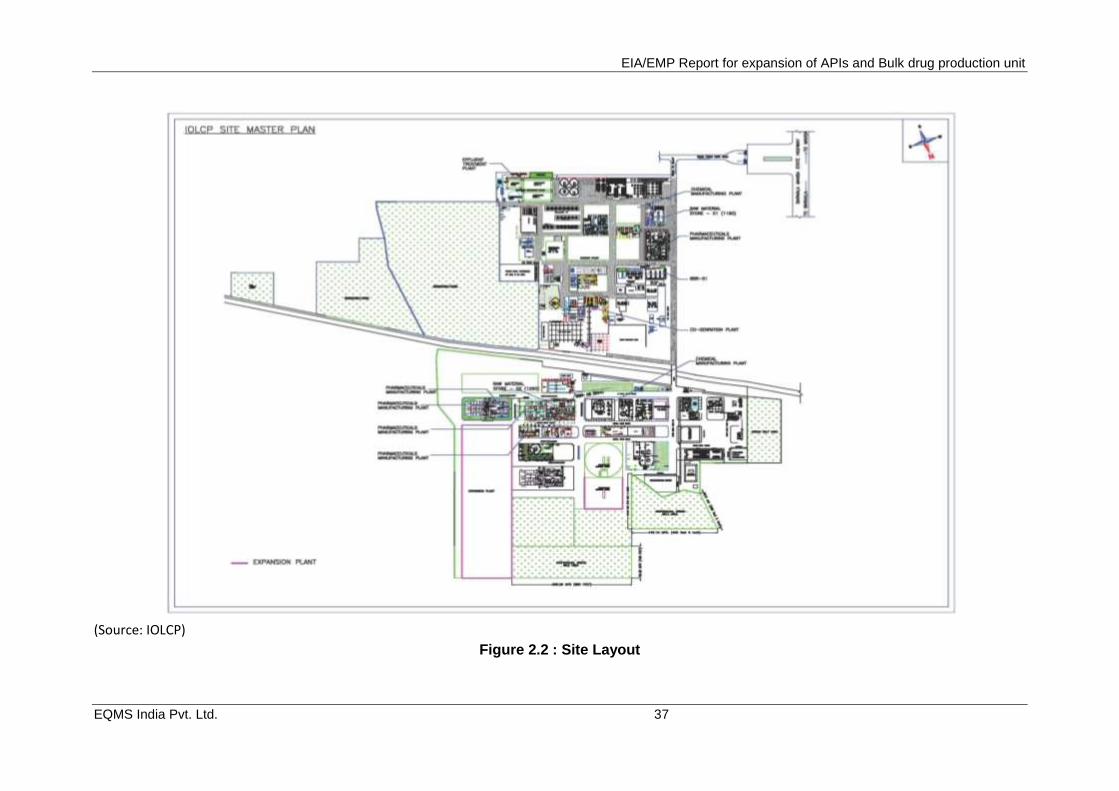
EIA/EMP Report for expansion of APIs and Bulk drug production unit
EQMS India Pvt. Ltd. 37
(Source: IOLCP)
Figure 2.2 : Site Layout
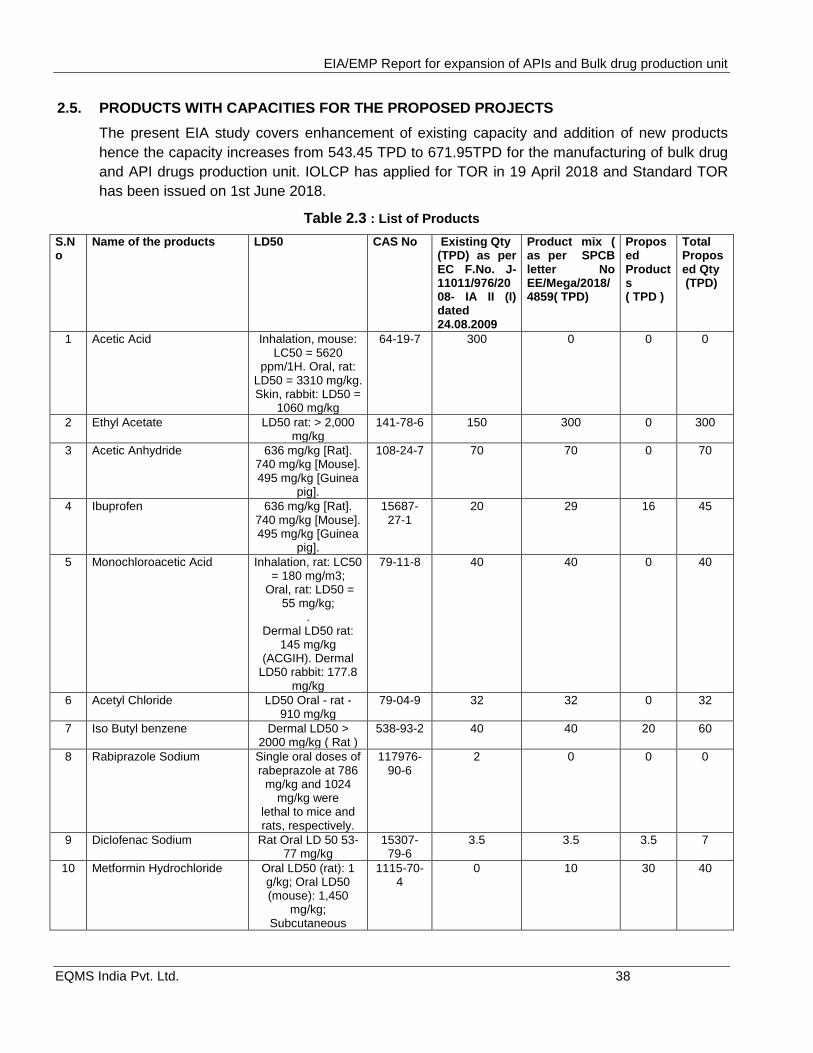
EIA/EMP Report for expansion of APIs and Bulk drug production unit
EQMS India Pvt. Ltd. 38
2.5. PRODUCTS WITH CAPACITIES FOR THE PROPOSED PROJECTS
The present EIA study covers enhancement of existing capacity and addition of new products
hence the capacity increases from 543.45 TPD to 671.95TPD for the manufacturing of bulk drug
and API drugs production unit. IOLCP has applied for TOR in 19 April 2018 and Standard TOR
has been issued on 1st June 2018.
Table 2.3 : List of Products
S.No
Name of the products LD50 CAS No Existing Qty (TPD) as per EC F.No. J-11011/976/2008- IA II (I) dated 24.08.2009
Product mix ( as per SPCB letter No EE/Mega/2018/4859( TPD)
Proposed Products ( TPD )
Total Proposed Qty (TPD)
1 Acetic Acid Inhalation, mouse: LC50 = 5620
ppm/1H. Oral, rat: LD50 = 3310 mg/kg. Skin, rabbit: LD50 =
1060 mg/kg
64-19-7 300 0 0 0
2 Ethyl Acetate LD50 rat: > 2,000 mg/kg
141-78-6 150 300 0 300
3 Acetic Anhydride 636 mg/kg [Rat]. 740 mg/kg [Mouse]. 495 mg/kg [Guinea
pig].
108-24-7 70 70 0 70
4 Ibuprofen 636 mg/kg [Rat]. 740 mg/kg [Mouse]. 495 mg/kg [Guinea
pig].
15687-27-1
20 29 16 45
5 Monochloroacetic Acid Inhalation, rat: LC50 = 180 mg/m3;
Oral, rat: LD50 = 55 mg/kg;
. Dermal LD50 rat:
145 mg/kg (ACGIH). Dermal
LD50 rabbit: 177.8 mg/kg
79-11-8 40 40 0 40
6 Acetyl Chloride LD50 Oral - rat - 910 mg/kg
79-04-9 32 32 0 32
7 Iso Butyl benzene Dermal LD50 > 2000 mg/kg ( Rat )
538-93-2 40 40 20 60
8 Rabiprazole Sodium Single oral doses of rabeprazole at 786
mg/kg and 1024 mg/kg were
lethal to mice and rats, respectively.
117976-90-6
2 0 0 0
9 Diclofenac Sodium Rat Oral LD 50 53-77 mg/kg
15307-79-6
3.5 3.5 3.5 7
10 Metformin Hydrochloride Oral LD50 (rat): 1 g/kg; Oral LD50 (mouse): 1,450
mg/kg; Subcutaneous
1115-70-4
0 10 30 40
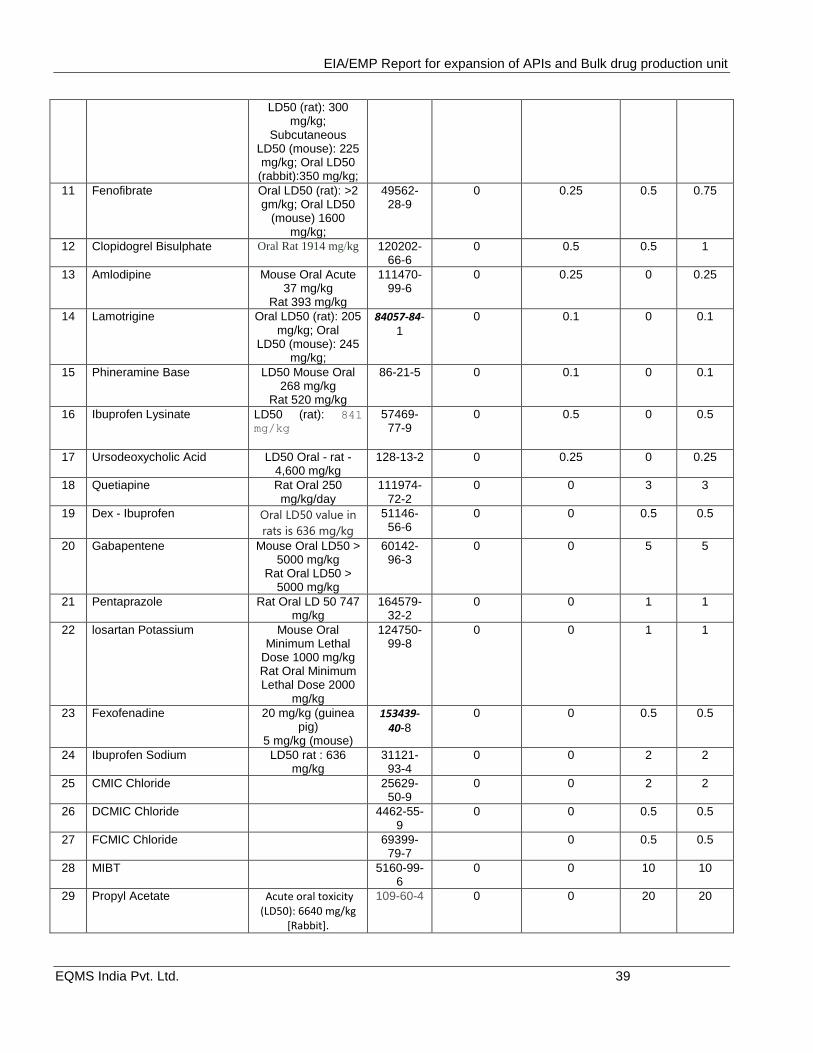
EIA/EMP Report for expansion of APIs and Bulk drug production unit
EQMS India Pvt. Ltd. 39
LD50 (rat): 300 mg/kg;
Subcutaneous LD50 (mouse): 225 mg/kg; Oral LD50 (rabbit):350 mg/kg;
11 Fenofibrate Oral LD50 (rat): >2 gm/kg; Oral LD50
(mouse) 1600 mg/kg;
49562-28-9
0 0.25 0.5 0.75
12 Clopidogrel Bisulphate Oral Rat 1914 mg/kg 120202-66-6
0 0.5 0.5 1
13 Amlodipine Mouse Oral Acute 37 mg/kg
Rat 393 mg/kg
111470-99-6
0 0.25 0 0.25
14 Lamotrigine Oral LD50 (rat): 205 mg/kg; Oral
LD50 (mouse): 245 mg/kg;
84057-84-
1
0 0.1 0 0.1
15 Phineramine Base LD50 Mouse Oral 268 mg/kg
Rat 520 mg/kg
86-21-5 0 0.1 0 0.1
16 Ibuprofen Lysinate LD50 (rat): 841
mg/kg
57469-77-9
0 0.5 0 0.5
17 Ursodeoxycholic Acid LD50 Oral - rat - 4,600 mg/kg
128-13-2 0 0.25 0 0.25
18 Quetiapine Rat Oral 250 mg/kg/day
111974-72-2
0 0 3 3
19 Dex - Ibuprofen Oral LD50 value in
rats is 636 mg/kg
51146-56-6
0 0 0.5 0.5
20 Gabapentene Mouse Oral LD50 > 5000 mg/kg
Rat Oral LD50 > 5000 mg/kg
60142-96-3
0 0 5 5
21 Pentaprazole Rat Oral LD 50 747 mg/kg
164579-32-2
0 0 1 1
22 losartan Potassium Mouse Oral Minimum Lethal
Dose 1000 mg/kg Rat Oral Minimum Lethal Dose 2000
mg/kg
124750-99-8
0 0 1 1
23 Fexofenadine 20 mg/kg (guinea pig)
5 mg/kg (mouse)
153439-40-8
0 0 0.5 0.5
24 Ibuprofen Sodium LD50 rat : 636 mg/kg
31121-93-4
0 0 2 2
25 CMIC Chloride 25629-50-9
0 0 2 2
26 DCMIC Chloride 4462-55-9
0 0 0.5 0.5
27 FCMIC Chloride 69399-79-7
0 0.5 0.5
28 MIBT 5160-99-6
0 0 10 10
29 Propyl Acetate Acute oral toxicity (LD50): 6640 mg/kg
[Rabbit].
109-60-4 0 0 20 20
EIA/EMP Report for expansion of APIs and Bulk drug production unit
EQMS India Pvt. Ltd. 40
30s Intermediate Products
1) HEEP 13349-82-1
0 0 1 1
2) Methyl-2-amino-3-chloropropionate HCl
33646-31-0
0 0 0.5 0.5
3) 2-(2-(Aminothiazole-4-yl)-2-[2-(terbutoxycarbonyl) isopropoxyimino] acetic acid (ATTBA) Ceftazidime intermediate
86299-47-0
0 0 0.25 0.25
4) 2-chloro-3-cyanopyridine Mirtazipine intermediate
6602-54-6
0 0 0.25 0.25
5) 4'-methyl-2-cyanobiphenyl (OTBN)
114772-53-1
0 0 1 1
6) m-Phenoxybenzaldehyde 39515-51-0
0 0 2 2
7) 4-aminobenzamide 2835-68-9
0 0 2 2
8) p-nitrobenzoyl chloride Oral, mouse: LD50 = 3440 mg/kg;
Oral, rabbit: LD50 = 4750 mg/kg;
122-04-3 0 0 3 3
9) Vanillin Oral, mouse: LD50 = 1480 mg/kg;
Oral, rat: LD50 = 1580 mg/kg;
121-33-5 0 0 2 2
31 Cogeneration 17 17 17
Total 674.5 543.45 128.5 671.95
(Source: PFR)
All the products are not manufactured at a time. The likely production capacities of the products
will depend upon market demand but limited to the sanctioned capacity as mentioned above.
2.6. MANUFACTURING PROCESS
2.6.1. Manufacturing Process of Ethyl Acetate
The basic raw material for the production of Ethyl Acetate is Ethyl Alcohol and Acetic Acid.
In order to have best quality Ethyl Acetate product, Ethyl Alcohol is firstly passed through a shell
and tube heat exchanger and then through a distillation column, so as to separate smell- causing
molasses from Alcohol. The distilled alcohol vapors are sent to the reaction kettle where acetic
acid is also added.
Ethyl Alcohol & Acetic Acid react together to produce Ethyl Acetate. As Ethyl Acetate produced is
of 99.9 %
The reaction is as follows:-
C2H5OH + CH3COOH ----------------------> CH3COOC2H5 + H2O Alcohol Acetic Acid 102- 105
0 C Ethyl Acetate Water
The Ethyl Alcohol & Acetic Acid are mixed in the Reaction Kettle. In the kettle, temperature of
102 to 1050 C and pressure of 0.1 to 0.15 kg/cm2 is maintained. The reaction is endothermic and
in order to provide required heat of reaction, heat is supplied by means of the reboilers attached
to the reaction kettle. The vapors from the top of the Reaction Kettle are sent to Ethyl Column
EIA/EMP Report for expansion of APIs and Bulk drug production unit
EQMS India Pvt. Ltd. 41
No. 1. The vapors coming from the top of the column are condensed in condenser No. 1 and 2
with the help of cooling water and then passed through another cooler. The condensed material
is then sent to the Decanter-1. Here two layers get formed in which the top layer is of Crude Ethyl
Acetate and the bottom layer consists of Alcohol, Water & Ester. A portion of the top layer is
recycled back to the Reaction column and the rest is fed to the Ethyl Column No. 2 where again
same procedure is repeated.
Now, the top layer of decanter of Column No. 1 and 2 are sent to Distillation Column, which has
an inbuilt Reboiler so as to provide proper heat for distillation. In the Distillation Column Ethyl
Acetate vapors are generated which are condensed and cooled and the finished Ethyl Acetate is
then diverted to the Daily Storage Tanks (DST) .
The vapors from the top of the Distillation Column are condensed in Condenser 1 and 2 and then
cooled in a Cooler. The cooled material is then taken in the Decanter – 2. Here also the two
layers get formed. The top layer is of Crude Ethyl Acetate and the bottom is of Alcohol, Water &
Ester. The top layer is recycled back to the Distillation Column and some part of it is send to the
Reaction Kettle. The bottom layers of the Decanters of Column No. 1 and 2 along with decanter
of distillation column are fed to the Recovery Column where Ester and Alcohol are recovered and
the water is drained out after recovering its heat in a Plate Type heat Exchanger installed at the
drain point of the recovery column.
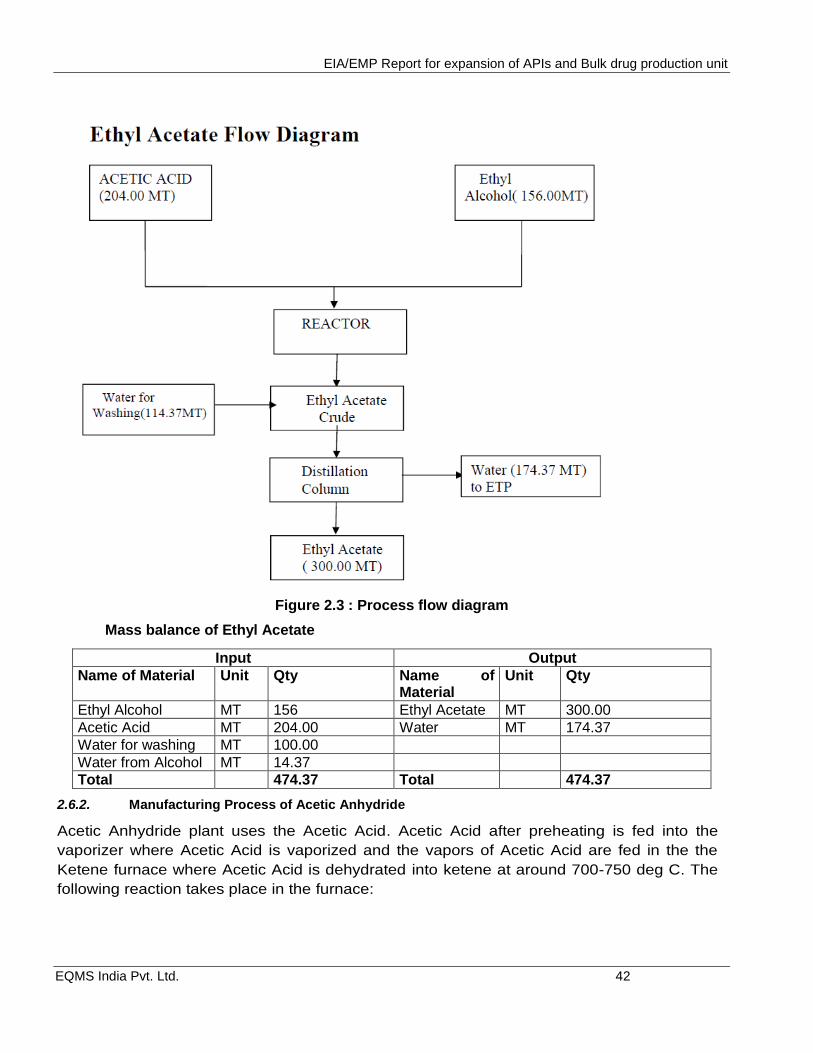
EIA/EMP Report for expansion of APIs and Bulk drug production unit
EQMS India Pvt. Ltd. 42
Figure 2.3 : Process flow diagram
Mass balance of Ethyl Acetate
Input Output
Name of Material Unit Qty Name of Material
Unit Qty
Ethyl Alcohol MT 156 Ethyl Acetate MT 300.00
Acetic Acid MT 204.00 Water MT 174.37
Water for washing MT 100.00
Water from Alcohol MT 14.37
Total 474.37 Total 474.37
2.6.2. Manufacturing Process of Acetic Anhydride
Acetic Anhydride plant uses the Acetic Acid. Acetic Acid after preheating is fed into the
vaporizer where Acetic Acid is vaporized and the vapors of Acetic Acid are fed in the the
Ketene furnace where Acetic Acid is dehydrated into ketene at around 700-750 deg C. The
following reaction takes place in the furnace:
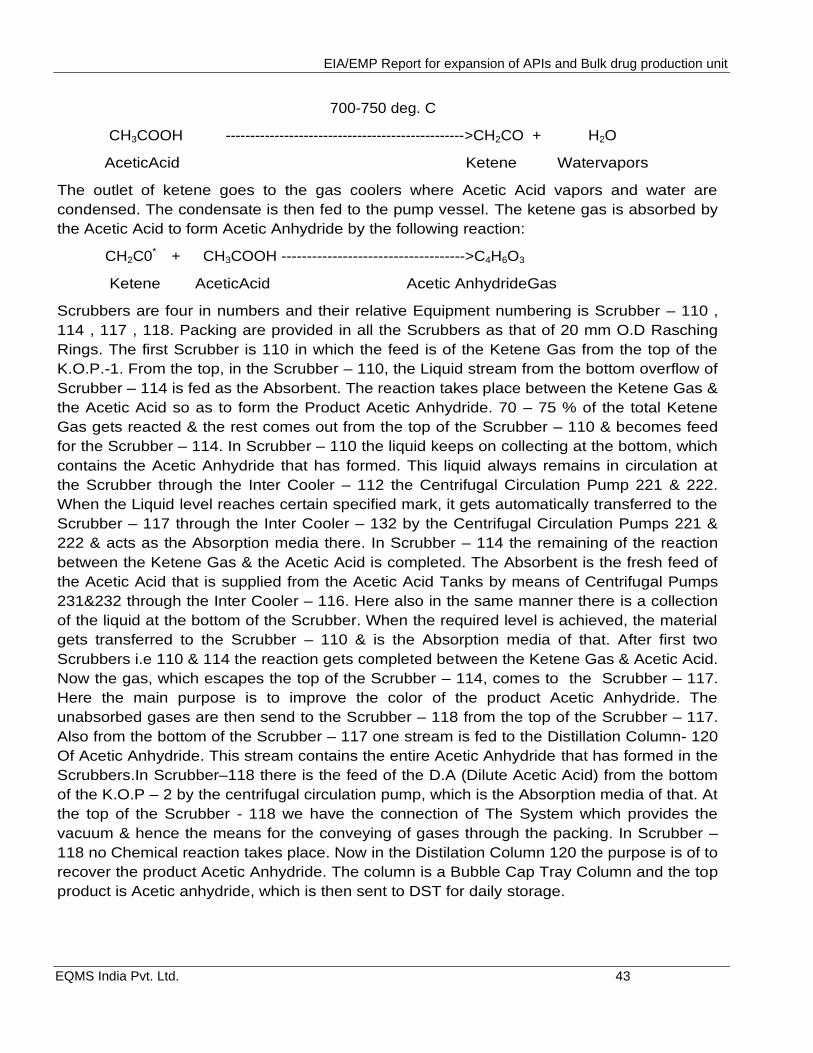
EIA/EMP Report for expansion of APIs and Bulk drug production unit
EQMS India Pvt. Ltd. 43
700-750 deg. C
CH3COOH ------------------------------------------------->CH2CO + H2O
AceticAcid Ketene Watervapors
The outlet of ketene goes to the gas coolers where Acetic Acid vapors and water are
condensed. The condensate is then fed to the pump vessel. The ketene gas is absorbed by
the Acetic Acid to form Acetic Anhydride by the following reaction:
CH2C0* + CH3COOH ------------------------------------>C4H6O3
Ketene AceticAcid Acetic AnhydrideGas
Scrubbers are four in numbers and their relative Equipment numbering is Scrubber – 110 ,
114 , 117 , 118. Packing are provided in all the Scrubbers as that of 20 mm O.D Rasching
Rings. The first Scrubber is 110 in which the feed is of the Ketene Gas from the top of the
K.O.P.-1. From the top, in the Scrubber – 110, the Liquid stream from the bottom overflow of
Scrubber – 114 is fed as the Absorbent. The reaction takes place between the Ketene Gas &
the Acetic Acid so as to form the Product Acetic Anhydride. 70 – 75 % of the total Ketene
Gas gets reacted & the rest comes out from the top of the Scrubber – 110 & becomes feed
for the Scrubber – 114. In Scrubber – 110 the liquid keeps on collecting at the bottom, which
contains the Acetic Anhydride that has formed. This liquid always remains in circulation at
the Scrubber through the Inter Cooler – 112 the Centrifugal Circulation Pump 221 & 222.
When the Liquid level reaches certain specified mark, it gets automatically transferred to the
Scrubber – 117 through the Inter Cooler – 132 by the Centrifugal Circulation Pumps 221 &
222 & acts as the Absorption media there. In Scrubber – 114 the remaining of the reaction
between the Ketene Gas & the Acetic Acid is completed. The Absorbent is the fresh feed of
the Acetic Acid that is supplied from the Acetic Acid Tanks by means of Centrifugal Pumps
231&232 through the Inter Cooler – 116. Here also in the same manner there is a collection
of the liquid at the bottom of the Scrubber. When the required level is achieved, the material
gets transferred to the Scrubber – 110 & is the Absorption media of that. After first two
Scrubbers i.e 110 & 114 the reaction gets completed between the Ketene Gas & Acetic Acid.
Now the gas, which escapes the top of the Scrubber – 114, comes to the Scrubber – 117.
Here the main purpose is to improve the color of the product Acetic Anhydride. The
unabsorbed gases are then send to the Scrubber – 118 from the top of the Scrubber – 117.
Also from the bottom of the Scrubber – 117 one stream is fed to the Distillation Column- 120
Of Acetic Anhydride. This stream contains the entire Acetic Anhydride that has formed in the
Scrubbers.In Scrubber–118 there is the feed of the D.A (Dilute Acetic Acid) from the bottom
of the K.O.P – 2 by the centrifugal circulation pump, which is the Absorption media of that. At
the top of the Scrubber - 118 we have the connection of The System which provides the
vacuum & hence the means for the conveying of gases through the packing. In Scrubber –
118 no Chemical reaction takes place. Now in the Distilation Column 120 the purpose is of to
recover the product Acetic Anhydride. The column is a Bubble Cap Tray Column and the top
product is Acetic anhydride, which is then sent to DST for daily storage.
EIA/EMP Report for expansion of APIs and Bulk drug production unit
EQMS India Pvt. Ltd. 44
Figure 2.4 : Process flow diagram of Acetic Anhydride
Material Balance
Input Output
Name of Material Unit Qty Name of Material Unit Qty
Acetic Acid MT 82.82 Acetic Anhydride MT 70.00
Water MT 10.00 Water MT 22.82
Total 92.82 Total 92.82
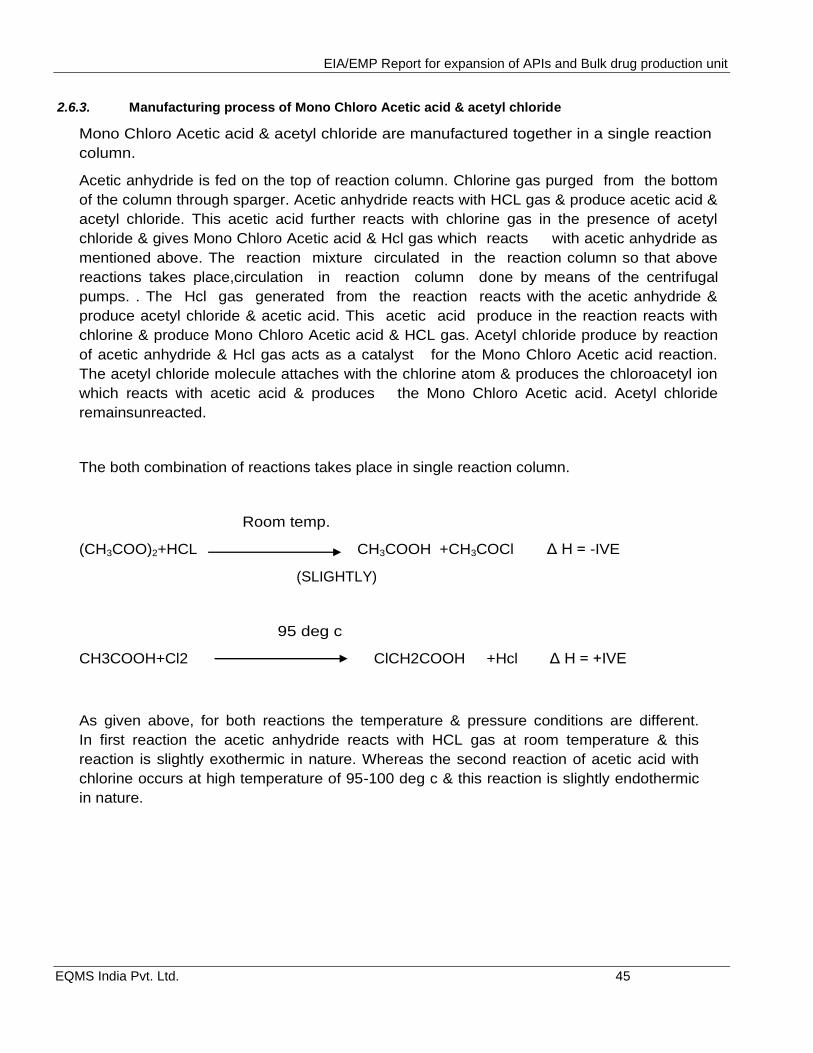
EIA/EMP Report for expansion of APIs and Bulk drug production unit
EQMS India Pvt. Ltd. 45
2.6.3. Manufacturing process of Mono Chloro Acetic acid & acetyl chloride
Mono Chloro Acetic acid & acetyl chloride are manufactured together in a single reaction
column.
Acetic anhydride is fed on the top of reaction column. Chlorine gas purged from the bottom
of the column through sparger. Acetic anhydride reacts with HCL gas & produce acetic acid &
acetyl chloride. This acetic acid further reacts with chlorine gas in the presence of acetyl
chloride & gives Mono Chloro Acetic acid & Hcl gas which reacts with acetic anhydride as
mentioned above. The reaction mixture circulated in the reaction column so that above
reactions takes place,circulation in reaction column done by means of the centrifugal
pumps. . The Hcl gas generated from the reaction reacts with the acetic anhydride &
produce acetyl chloride & acetic acid. This acetic acid produce in the reaction reacts with
chlorine & produce Mono Chloro Acetic acid & HCL gas. Acetyl chloride produce by reaction
of acetic anhydride & Hcl gas acts as a catalyst for the Mono Chloro Acetic acid reaction.
The acetyl chloride molecule attaches with the chlorine atom & produces the chloroacetyl ion
which reacts with acetic acid & produces the Mono Chloro Acetic acid. Acetyl chloride
remainsunreacted.
The both combination of reactions takes place in single reaction column.
Room temp.
(CH3COO)2+HCL CH3COOH +CH3COCl Δ H = -IVE
(SLIGHTLY)
95 deg c
CH3COOH+Cl2 ClCH2COOH +Hcl Δ H = +IVE
As given above, for both reactions the temperature & pressure conditions are different.
In first reaction the acetic anhydride reacts with HCL gas at room temperature & this
reaction is slightly exothermic in nature. Whereas the second reaction of acetic acid with
chlorine occurs at high temperature of 95-100 deg c & this reaction is slightly endothermic
in nature.
EIA/EMP Report for expansion of APIs and Bulk drug production unit
EQMS India Pvt. Ltd. 46
Figure 2.5 : Process flow diagram
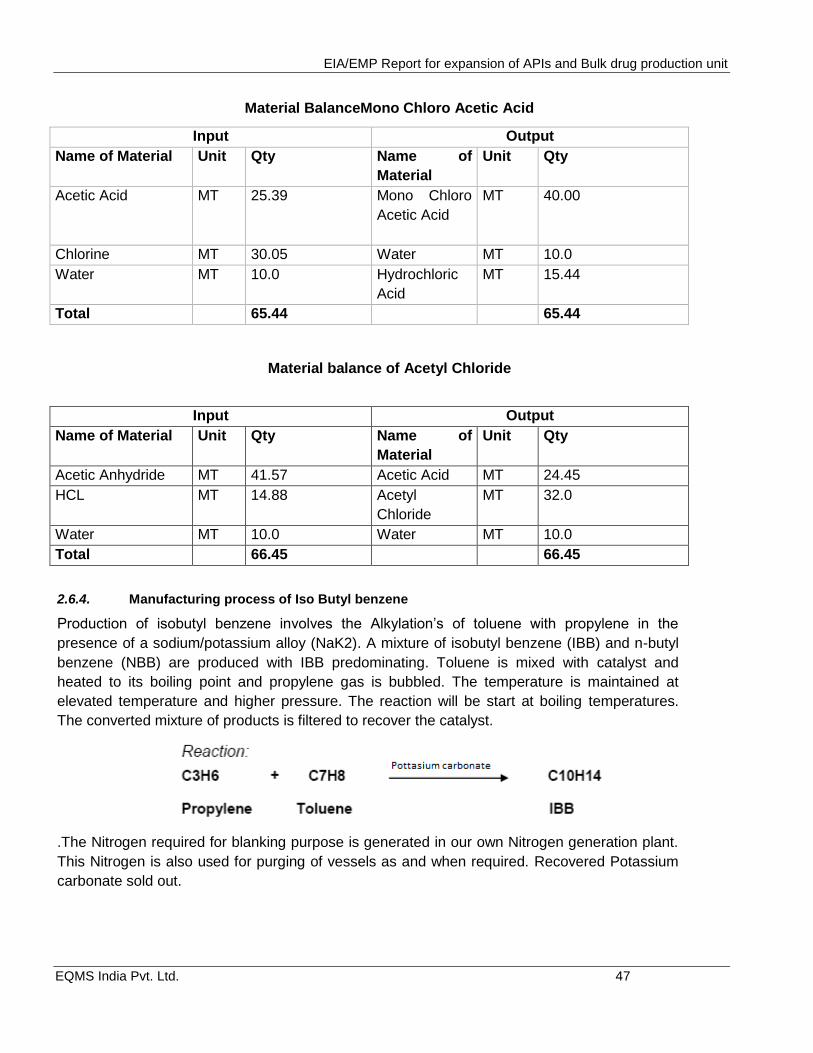
EIA/EMP Report for expansion of APIs and Bulk drug production unit
EQMS India Pvt. Ltd. 47
Material BalanceMono Chloro Acetic Acid
Input Output
Name of Material Unit Qty Name of
Material
Unit Qty
Acetic Acid MT 25.39 Mono Chloro
Acetic Acid
MT 40.00
Chlorine MT 30.05 Water MT 10.0
Water MT 10.0 Hydrochloric
Acid
MT 15.44
Total 65.44 65.44
Material balance of Acetyl Chloride
Input Output
Name of Material Unit Qty Name of
Material
Unit Qty
Acetic Anhydride MT 41.57 Acetic Acid MT 24.45
HCL MT 14.88 Acetyl
Chloride
MT 32.0
Water MT 10.0 Water MT 10.0
Total 66.45 66.45
2.6.4. Manufacturing process of Iso Butyl benzene
Production of isobutyl benzene involves the Alkylation‘s of toluene with propylene in the
presence of a sodium/potassium alloy (NaK2). A mixture of isobutyl benzene (IBB) and n-butyl
benzene (NBB) are produced with IBB predominating. Toluene is mixed with catalyst and
heated to its boiling point and propylene gas is bubbled. The temperature is maintained at
elevated temperature and higher pressure. The reaction will be start at boiling temperatures.
The converted mixture of products is filtered to recover the catalyst.
.The Nitrogen required for blanking purpose is generated in our own Nitrogen generation plant.
This Nitrogen is also used for purging of vessels as and when required. Recovered Potassium
carbonate sold out.
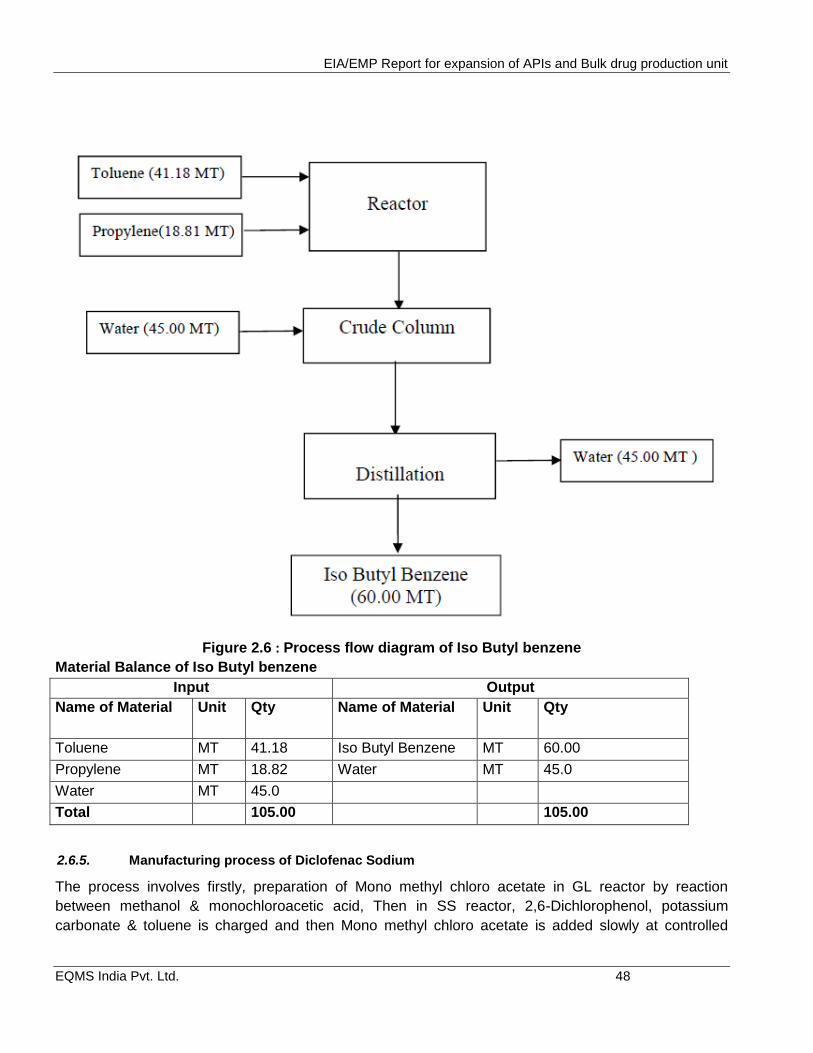
EIA/EMP Report for expansion of APIs and Bulk drug production unit
EQMS India Pvt. Ltd. 48
Figure 2.6 : Process flow diagram of Iso Butyl benzene
Material Balance of Iso Butyl benzene
Input Output
Name of Material Unit Qty Name of Material Unit Qty
Toluene MT 41.18 Iso Butyl Benzene MT 60.00
Propylene MT 18.82 Water MT 45.0
Water MT 45.0
Total 105.00 105.00
2.6.5. Manufacturing process of Diclofenac Sodium
The process involves firstly, preparation of Mono methyl chloro acetate in GL reactor by reaction
between methanol & monochloroacetic acid, Then in SS reactor, 2,6-Dichlorophenol, potassium
carbonate & toluene is charged and then Mono methyl chloro acetate is added slowly at controlled
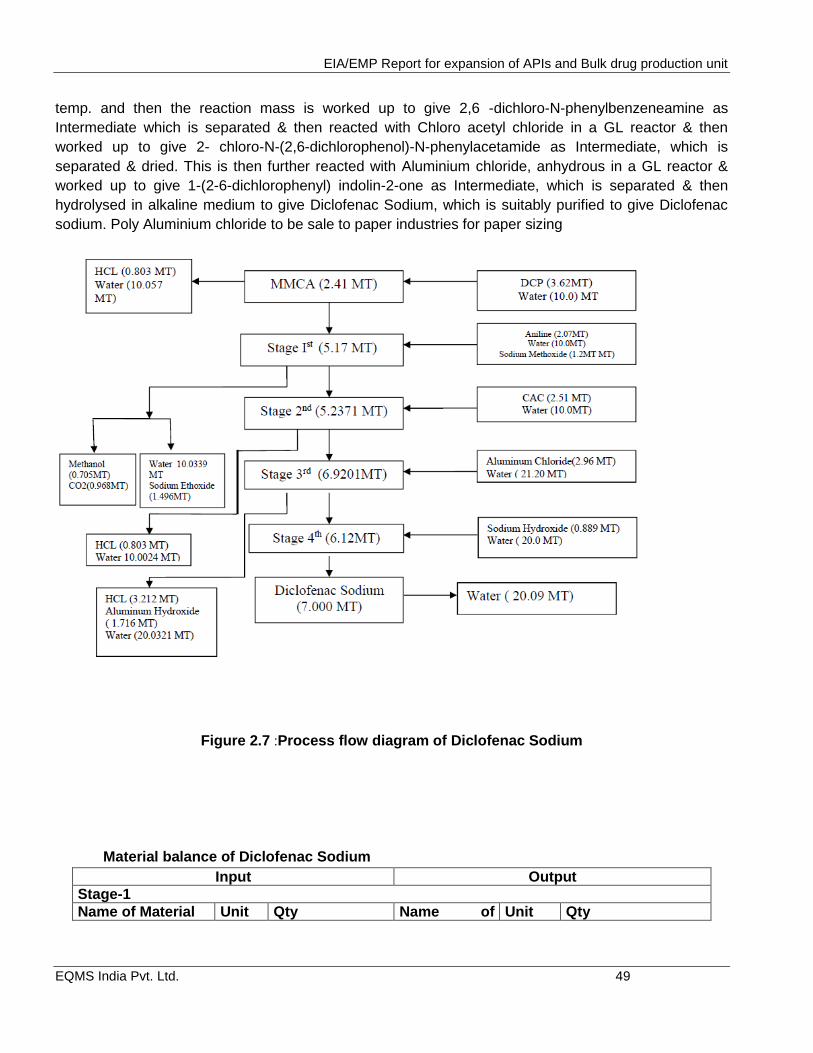
EIA/EMP Report for expansion of APIs and Bulk drug production unit
EQMS India Pvt. Ltd. 49
temp. and then the reaction mass is worked up to give 2,6 -dichloro-N-phenylbenzeneamine as
Intermediate which is separated & then reacted with Chloro acetyl chloride in a GL reactor & then
worked up to give 2- chloro-N-(2,6-dichlorophenol)-N-phenylacetamide as Intermediate, which is
separated & dried. This is then further reacted with Aluminium chloride, anhydrous in a GL reactor &
worked up to give 1-(2-6-dichlorophenyl) indolin-2-one as Intermediate, which is separated & then
hydrolysed in alkaline medium to give Diclofenac Sodium, which is suitably purified to give Diclofenac
sodium. Poly Aluminium chloride to be sale to paper industries for paper sizing
Figure 2.7 :Process flow diagram of Diclofenac Sodium
Material balance of Diclofenac Sodium
Input Output
Stage-1
Name of Material Unit Qty Name of Unit Qty
EIA/EMP Report for expansion of APIs and Bulk drug production unit
EQMS India Pvt. Ltd. 50
Material
Mono Methyl Chloro Acetate
MT 2.41 Methyl 2-(2,6-dichlorophenoxy) acetate
MT 5.17
2,6-dichlorophenol MT 3.62 HCL MT 0.803
Water MT 10 Water MT 10.057
Total 16.03 16.03
Stage-2
Name of Material Unit Qty Name of Material
Unit Qty
Aniline MT 2.07 2,6 dichloro-N-Phenylbenzene
MT 5.2371
Methyl 2-(2,6-dichlorophenoxy) acetate
MT 5.17 Methanol MT 0.7050
Water MT 10.0 Carbon Dioxide
MT 0.9680
Sodium Methoxide MT 1.20 Sodium Ethoxide
MT 1.4960
Water MT 10.0339
Total MT 18.44 Total MT 18.44
Stage-3
Name of Material Unit Qty Name of Material
Unit Qty
2,6 dichloro-N-Phenylbenzene
MT 5.2371 (2-Chloro-N-(2,6dichlorophenylacetamide)
MT 6.9201
Chloro Acetyl Chloride
MT 2.51 HCL MT 0.803
Water MT 10.0 Water MT 10.024
Total 17.7471 17.7471
Stage-4
Name of Material Unit Qty Name of Material
Unit Qty
(2-Chloro-N-(2,6dichlorophenylacetamide)
MT 6.9201 (1-(2,6-dichlorophenyl)indolin-2-one)
MT 6.12
Aluminium Chloride MT 2.96 Hydrochloric Acid
MT 3.212
Water MT 21.20 Aluminium Hydroxide
MT 1.716
Water MT 20.0321
Total MT 31.0801 Total MT 31.0801
Stage 5
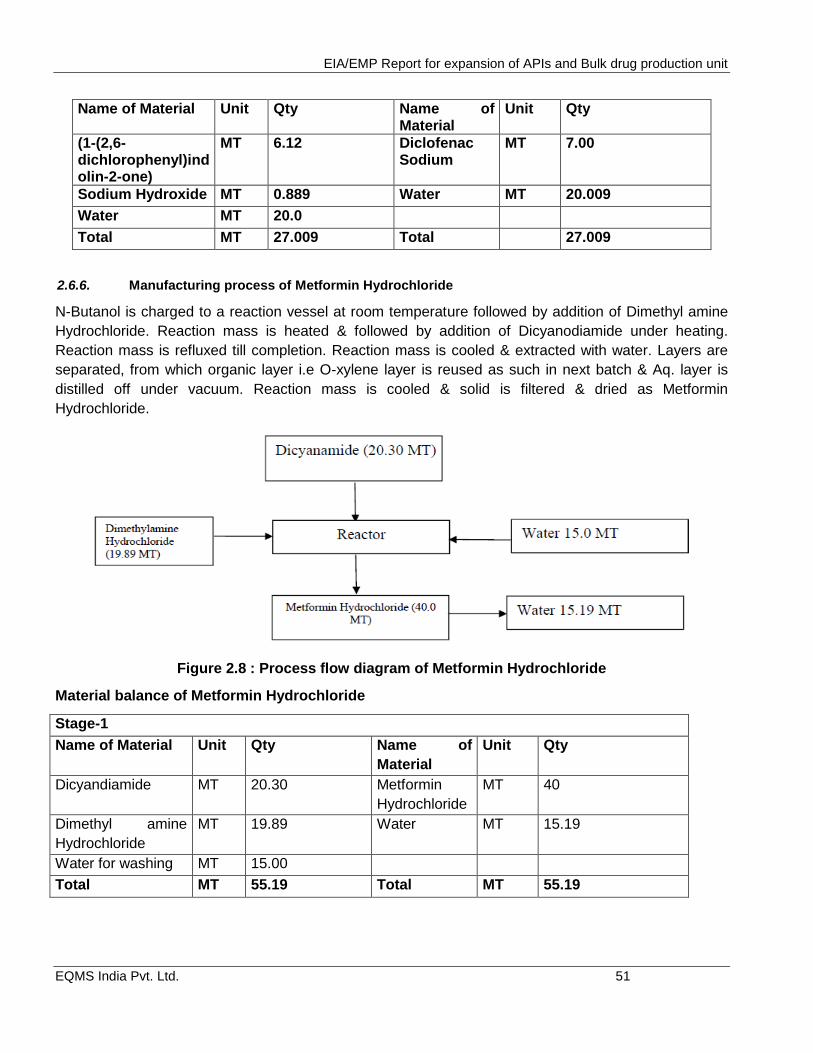
EIA/EMP Report for expansion of APIs and Bulk drug production unit
EQMS India Pvt. Ltd. 51
Name of Material Unit Qty Name of Material
Unit Qty
(1-(2,6-dichlorophenyl)indolin-2-one)
MT 6.12 Diclofenac Sodium
MT 7.00
Sodium Hydroxide MT 0.889 Water MT 20.009
Water MT 20.0
Total MT 27.009 Total 27.009
2.6.6. Manufacturing process of Metformin Hydrochloride
N-Butanol is charged to a reaction vessel at room temperature followed by addition of Dimethyl amine
Hydrochloride. Reaction mass is heated & followed by addition of Dicyanodiamide under heating.
Reaction mass is refluxed till completion. Reaction mass is cooled & extracted with water. Layers are
separated, from which organic layer i.e O-xylene layer is reused as such in next batch & Aq. layer is
distilled off under vacuum. Reaction mass is cooled & solid is filtered & dried as Metformin
Hydrochloride.
Figure 2.8 : Process flow diagram of Metformin Hydrochloride
Material balance of Metformin Hydrochloride
Stage-1
Name of Material Unit Qty Name of
Material
Unit Qty
Dicyandiamide MT 20.30 Metformin
Hydrochloride
MT 40
Dimethyl amine
Hydrochloride
MT 19.89 Water MT 15.19
Water for washing MT 15.00
Total MT 55.19 Total MT 55.19
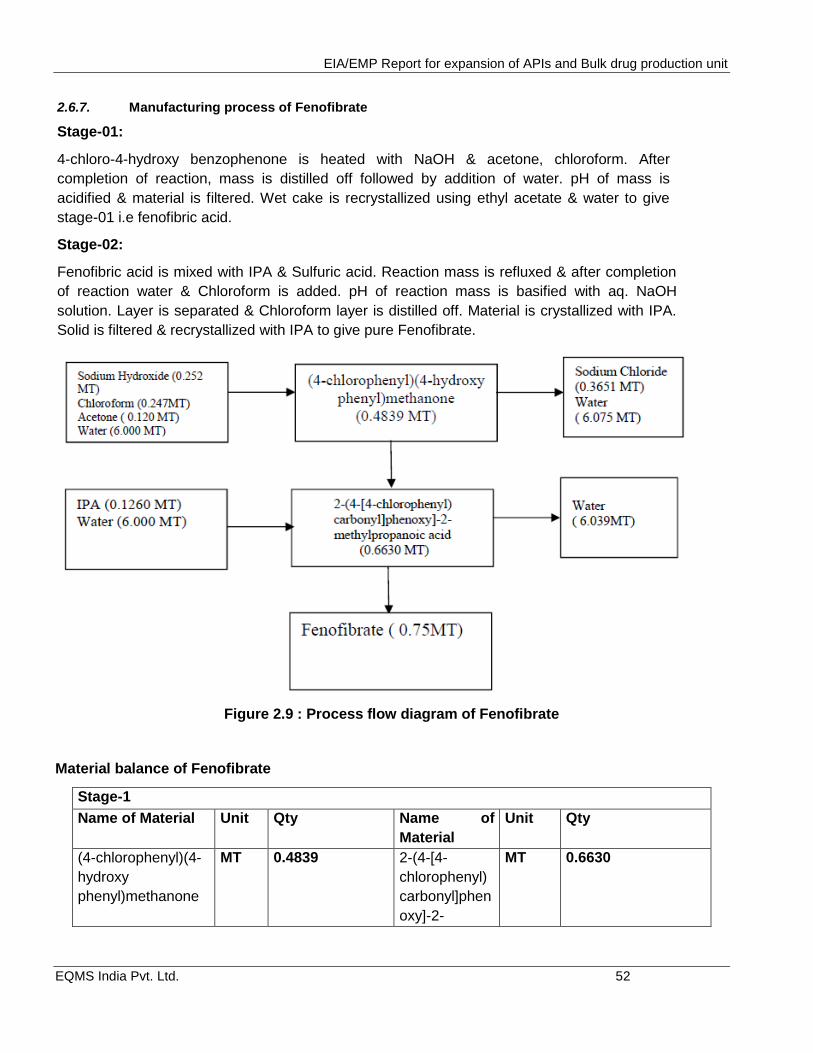
EIA/EMP Report for expansion of APIs and Bulk drug production unit
EQMS India Pvt. Ltd. 52
2.6.7. Manufacturing process of Fenofibrate
Stage-01:
4-chloro-4-hydroxy benzophenone is heated with NaOH & acetone, chloroform. After
completion of reaction, mass is distilled off followed by addition of water. pH of mass is
acidified & material is filtered. Wet cake is recrystallized using ethyl acetate & water to give
stage-01 i.e fenofibric acid.
Stage-02:
Fenofibric acid is mixed with IPA & Sulfuric acid. Reaction mass is refluxed & after completion
of reaction water & Chloroform is added. pH of reaction mass is basified with aq. NaOH
solution. Layer is separated & Chloroform layer is distilled off. Material is crystallized with IPA.
Solid is filtered & recrystallized with IPA to give pure Fenofibrate.
Figure 2.9 : Process flow diagram of Fenofibrate
Material balance of Fenofibrate
Stage-1
Name of Material Unit Qty Name of
Material
Unit Qty
(4-chlorophenyl)(4-
hydroxy
phenyl)methanone
MT 0.4839 2-(4-[4-
chlorophenyl)
carbonyl]phen
oxy]-2-
MT 0.6630
EIA/EMP Report for expansion of APIs and Bulk drug production unit
EQMS India Pvt. Ltd. 53
methylpropan
oic acid
Sodium Hydroxide MT 0.252 Sodium
Chloride
MT 0.3651
Chloroform MT 0.247 Rxn Water MT 0.075
Acetone MT 0.120 Water MT 6.000
Water MT 6.000
Total MT 7.1029 Total MT 7.1029
Stage-2
Name of Material Unit Qty Name of
Material
Unit Qty
2-(4-[4-
chlorophenyl)carbo
nyl]phenoxy]-2-
methylpropanoic
acid
MT 0.6630 Propan-2-yl 2-
(4-[(4-
chlorophenyl)
carbonyl]phen
oxy)-2-
methylpropan
oate (
Fenofibrate)
MT 0.7500
IPA MT 0.1260
water MT 6.0000 water MT 6.039
Total MT 6.789 Total MT 6.789
2.6.8. Manufacturing process of Clopidogrel Bisulphate
Stage-I: CPG methyl ester
2-Chloro phenyl glycine esterified with sulfuric acid and methanol at high temperature. After
completion of reaction distill methanol and isolated oil by adjusting pH of reaction mass. MDC
layer distilled to get oily mass of stage-1.Ammonium sulphate generated as by product which
will be sold out to users.
Stage-II: Tartrate salt
CPG ester (Stage-1) was added in a solution of methanol acetone mixture and L (+) tartaric
acid at ambient temperature. Solution was stirred followed by seeding of tartarate salt cooled to
low temperature and filtered. Wet cake was dried at high temperature to get tartarate salt.
Stage-III: Tosylate
Thiophene- 2- ethanol was tosylated with para toluene sulfonyl chloride and sodium hydroxide
solution at ambient temperature in presence of phase transfer catalyst. Tosylate was extracted
with Toluene and used as such in next step.
Stage-IVA: Chiral base
EIA/EMP Report for expansion of APIs and Bulk drug production unit
EQMS India Pvt. Ltd. 54
Tartrate salt was converted into chiral base by adjusting pH with ammonia solution. Base was
extracted with Toluene and used as such in next step.
Stage-IVB: Couple Amine Hydrochloride
Organic layer of chiral base and tosylate was coupled by using DPHOP as base in presence of
phase transfer catalyst at high temperature. After completion of reaction was worked up and
free base formed. Base converted to hydrochloride salt with IPA.HCl. Hydrochloride salt was
centrifuged and washed with toluene and dried.
Stage-V: Clopidogrel Bisulphate
Reaction of couple amine hydrochloride with paraformaldehyde followed by cyclization in acidic
medium to give Clopidogrel base thus obtained free base treated with sulfuric acid in acetone to
afford Clopidogrel bisulphate.
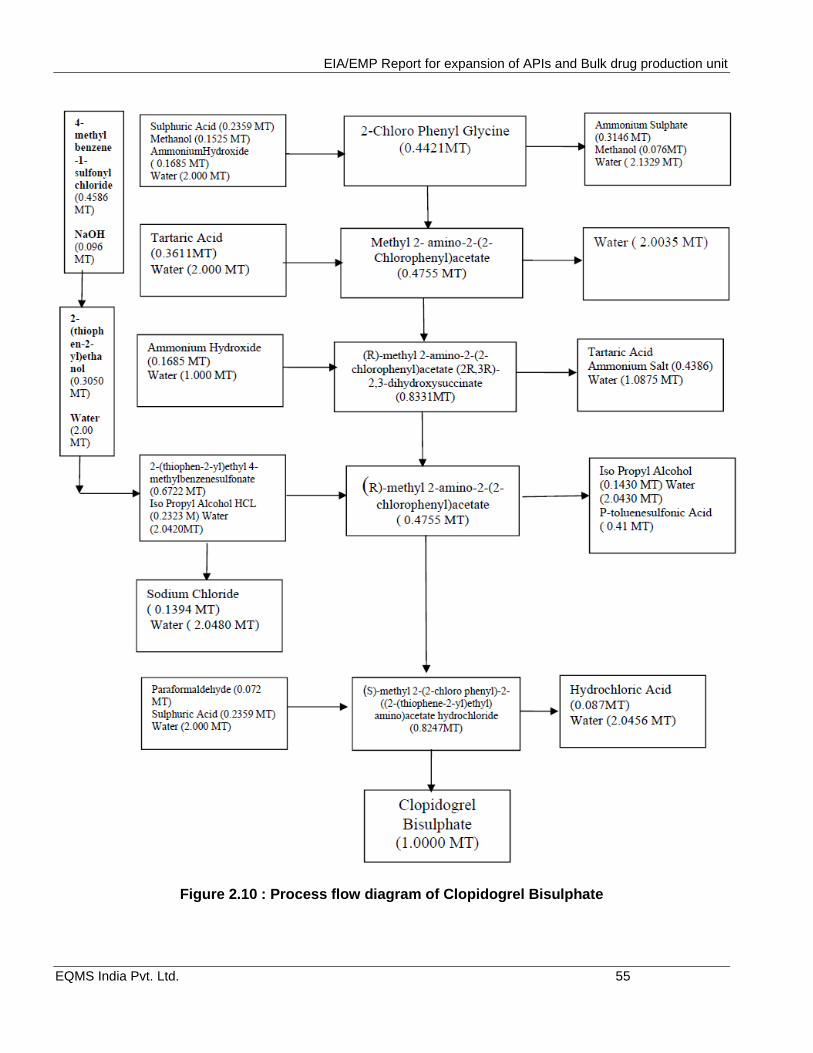
EIA/EMP Report for expansion of APIs and Bulk drug production unit
EQMS India Pvt. Ltd. 55
Figure 2.10 : Process flow diagram of Clopidogrel Bisulphate
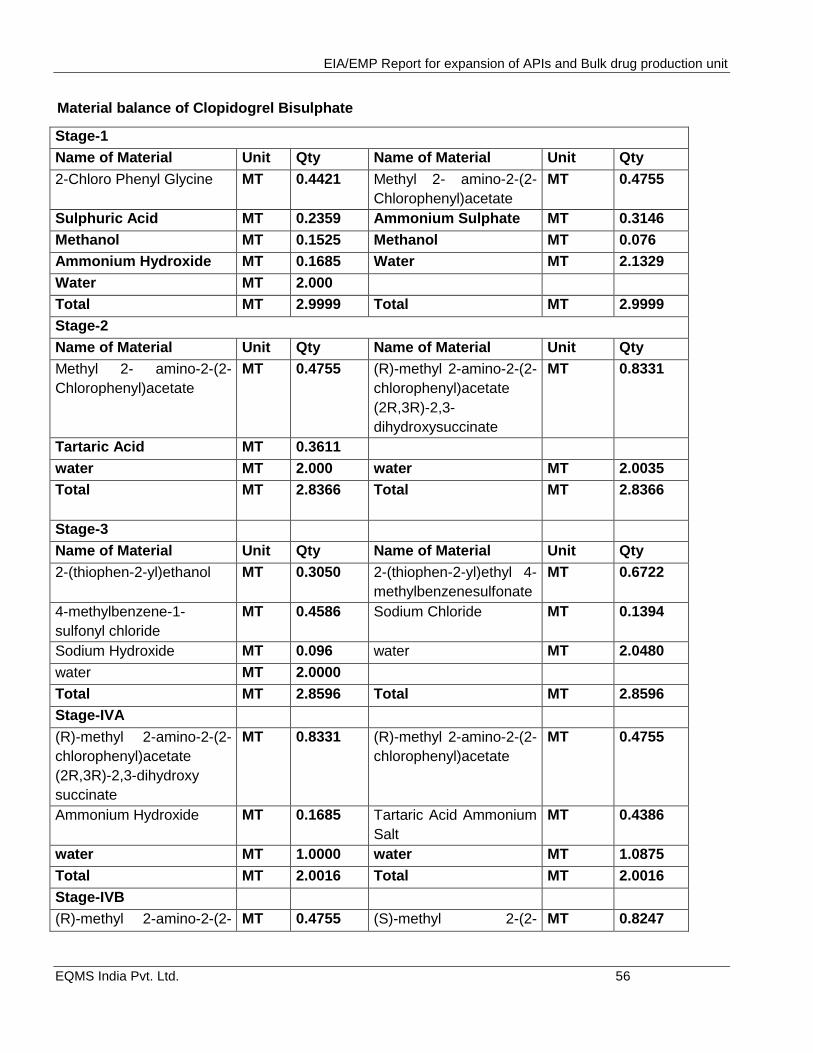
EIA/EMP Report for expansion of APIs and Bulk drug production unit
EQMS India Pvt. Ltd. 56
Material balance of Clopidogrel Bisulphate
Stage-1
Name of Material Unit Qty Name of Material Unit Qty
2-Chloro Phenyl Glycine MT 0.4421 Methyl 2- amino-2-(2-
Chlorophenyl)acetate
MT 0.4755
Sulphuric Acid MT 0.2359 Ammonium Sulphate MT 0.3146
Methanol MT 0.1525 Methanol MT 0.076
Ammonium Hydroxide MT 0.1685 Water MT 2.1329
Water MT 2.000
Total MT 2.9999 Total MT 2.9999
Stage-2
Name of Material Unit Qty Name of Material Unit Qty
Methyl 2- amino-2-(2-
Chlorophenyl)acetate
MT 0.4755 (R)-methyl 2-amino-2-(2-
chlorophenyl)acetate
(2R,3R)-2,3-
dihydroxysuccinate
MT 0.8331
Tartaric Acid MT 0.3611
water MT 2.000 water MT 2.0035
Total MT 2.8366 Total MT 2.8366
Stage-3
Name of Material Unit Qty Name of Material Unit Qty
2-(thiophen-2-yl)ethanol MT 0.3050 2-(thiophen-2-yl)ethyl 4-
methylbenzenesulfonate
MT 0.6722
4-methylbenzene-1-
sulfonyl chloride
MT 0.4586 Sodium Chloride MT 0.1394
Sodium Hydroxide MT 0.096 water MT 2.0480
water MT 2.0000
Total MT 2.8596 Total MT 2.8596
Stage-IVA
(R)-methyl 2-amino-2-(2-
chlorophenyl)acetate
(2R,3R)-2,3-dihydroxy
succinate
MT 0.8331 (R)-methyl 2-amino-2-(2-
chlorophenyl)acetate
MT 0.4755
Ammonium Hydroxide MT 0.1685 Tartaric Acid Ammonium
Salt
MT 0.4386
water MT 1.0000 water MT 1.0875
Total MT 2.0016 Total MT 2.0016
Stage-IVB
(R)-methyl 2-amino-2-(2- MT 0.4755 (S)-methyl 2-(2- MT 0.8247
EIA/EMP Report for expansion of APIs and Bulk drug production unit
EQMS India Pvt. Ltd. 57
chlorophenyl)acetate chlorophenyl)-2-((2-
(thiophene-2-
yl)ethyl)amino)acetate
hydrochloride
2-(thiophen-2-yl)ethyl 4-
methylbenzenesulfonateH
ydroxide
MT 0.6722 Iso propyl Alcohol MT 0.1430
Isopropyl alcohol
hydrochloride
MT 0.2323 p-Toluenesulfonic acid MT 0.4100
water MT 2.0420 Water MT 2.0430
Total MT 3.4220 Total MT 3.4220
Stage-V
(S)-methyl 2-(2-
chlorophenyl)-2-((2-
(thiophene-2-
yl)ethyl)amino)acetate
hydrochloride
MT 0.8247 Clopidogrel Bisulphate MT 1.0000
Paraformaldehyde MT 0.072
Sulphuric Acid MT 0.2359 Hydrochloric Acid MT 0.087
Water MT 2.000 Water MT 2.0456
Total MT 3.1326 Total MT 3.1326
2.6.9. Manufacturing process of Amlodipine
Step-I: 2-Hydroxyethylphthalimide (HEP) Procedure:
Charge toluene. Charge phthalic anhyride at 25-30oC. Stir for 15min. Heat the reaction mass to 90oC.
Add ethanolamine, at 90-100oC over a period of 1-2h. Raise the temperature to 100-106oC. Maintain
for 1hr. Raise the temperature to reflux point. Reflux for 12 h and remove water by azeotropic
distillation. Send sample to Q.C for TLC (absence of phthalic anhydride). If TLC is not OK, maintain till
TLC complies. Cool to 25-30oC over a period of8h.
Centrifuge the reaction mass at 25-30o C. Wash the cake with toluene, spin dry for 1hr. Unload the
material into double polythene bag weigh the product & label. Record the weight of product. Send
sample to Q.C for completeanalysis
Step – II :PHEEMA
Procedure:
Ensure the cleanliness of reactor (R-102). Charge toluene, Start flushing the reactor with nitrogen.
Draw toluene from the bottom valve of the reactor & send the sample to QC for moisture content
(moisture content < 0.05%). Meanwhile check the moisture content of the THF it should be < 0.1%.
Charge THF stir for 10 Minutes. Send an aliquot to QC for moisture content. It should be < 0.1%. Add
Sodium Hydride, in two lots (under N2 blanket). Cool the reaction mass from 25°C to 10°C. Add ethyl -
EIA/EMP Report for expansion of APIs and Bulk drug production unit
EQMS India Pvt. Ltd. 58
4 – chloroacetoacetate, in portions over a period of 9 – 11h at 10 – 15oC. Record addition time and
temperature for every 30min. slowly raise temperature from 15°C to 20°C. Add of HEP over a period of
10 to 12 h at 20°C-25°C. Maintain reaction mass for 12 – 16 h at 20°C-25°C. After 12 h maintenance
send sample to QC for TLC (absence of HEP). If TLC does not comply continue the reaction until TLC
complies. Add acetic acid slowly at 25°-30°C in 1 h and stir the mass for 1hr. Ensure that sodium
hydride is decomposed.
Meanwhile charge water in reactor (R-108) for quenching. Transfer the reaction mass from Reactor (R-
102) to R-108. Rinse the reactor R-102 with methanol. Stir the reaction mass in reactor (R-108) for 1hr
and settle for 1hr at 30°C – 35°C. Separate the bottom aqueous layer and discard. Give water washing
to the organic layer with water, stir for 30 min. and settle for 30 min. Separate the bottom aqueous layer
and discard. Repeat two washings with water separate the aqueous layer and discard. Collect the
organic layer. Transfer total organic layer from R-108 to R-103. Distill out toluene under 680 mm/Hg
vacuum and up to about 50°C. Cool the reaction mass to 30°-35°C at 680 mm/Hg. Add n-hexane, to
the reaction mass. Stir for 1 h and settle for 1 h. Separate the layers and collect bottom organic layer in
carboys.
Step – III : Procedure to Convert PHEEMA to phthaloylamlodipine.
Procedure:
Ensure the cleanliness of Reactor R-107. Charge IPA, PHEEMA and piperidine at 25°C-30°C followed
by acetic acid. At 25°C-30°C. Cool the mass to 15°C – 20°C and add slowly OCB at 15°C – 20°C over
a period of 3 – 4 h. raise the temperature from 20°C to 30°C. Maintain at 25°C -30°C for 36 to 40 h
under stirring. Send the sample to QC for TLC (absence of PHEEMA) if TLC does not comply maintain
till TLC complies. Transfer the reaction mass from R-107 to R-106 Apply vacuum to the Reactor R-106
Distill out IPA under vacuum 680 mm/Hg up to 50°C + 2°C. Ensure that reaction mass thick slurry.
(Record vacuum and temperature for every 1h). Cool the mass to 25°C -30°C. Transfer the organic
layer to R-107. If the mass is very thick charge acetic Acid. Stir for 30-40 minutes. Charge methyl
aminocrotonate at 25°C-30°C and stir for 30-40 min. Heat the mass 40°C – 45°C, maintain for 18 – 22
h at 40 – 45oC. (Record time and temperature for every 1h). Send the sample to QC for TLC (Absence
of OCB) If TLC does not comply maintain at 40°C-45°C till TLC complies. Slowly cool the mass to
20°C. Centrifuge the reaction mass in CF 101, spin dry and unload the crude cake into double poly
bags. Record weight of the product . Meanwhile charge water & acetic Acid in R-103. Charge the crude
cake. Stir for ½ h, Centrifuge the mass and wash the cake with water Spin dry for ½ h and unload the
wet cake. Send the sample to QC for HPLC analysis.
STEP – IV (Purification in toluene)
Procedure:
Ensure the cleanliness and dryness of reactor R-0 103. Charge toluene at room temperature. Charge
crude phthaloyl amlodipine under stirring at room temperature . Heat the reaction mass to 70°C-75°C.
Check for the dissolution if dissolution is OK separate the water layer and remove the particles from
bottom then Maintain for 1h at 70°C-75°C. Cool the mass to 0-5°C Maintain for 2h Centrifuge the
mass, spin dry for 30min and unload the wet cake into double polythene bags. Record the weight of
the product Collect toluene mother liquor in clean drums Send the sample to QC for HPLC analysis.
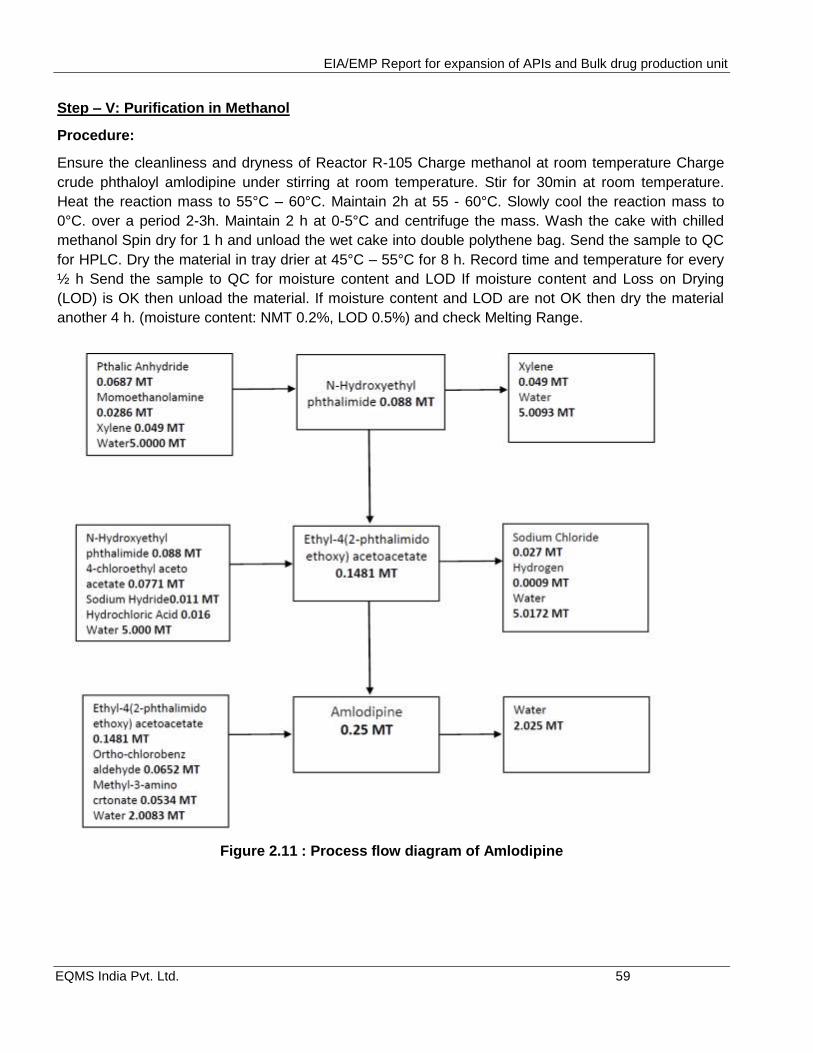
EIA/EMP Report for expansion of APIs and Bulk drug production unit
EQMS India Pvt. Ltd. 59
Step – V: Purification in Methanol
Procedure:
Ensure the cleanliness and dryness of Reactor R-105 Charge methanol at room temperature Charge
crude phthaloyl amlodipine under stirring at room temperature. Stir for 30min at room temperature.
Heat the reaction mass to 55°C – 60°C. Maintain 2h at 55 - 60°C. Slowly cool the reaction mass to
0°C. over a period 2-3h. Maintain 2 h at 0-5°C and centrifuge the mass. Wash the cake with chilled
methanol Spin dry for 1 h and unload the wet cake into double polythene bag. Send the sample to QC
for HPLC. Dry the material in tray drier at 45°C – 55°C for 8 h. Record time and temperature for every
½ h Send the sample to QC for moisture content and LOD If moisture content and Loss on Drying
(LOD) is OK then unload the material. If moisture content and LOD are not OK then dry the material
another 4 h. (moisture content: NMT 0.2%, LOD 0.5%) and check Melting Range.
Figure 2.11 : Process flow diagram of Amlodipine
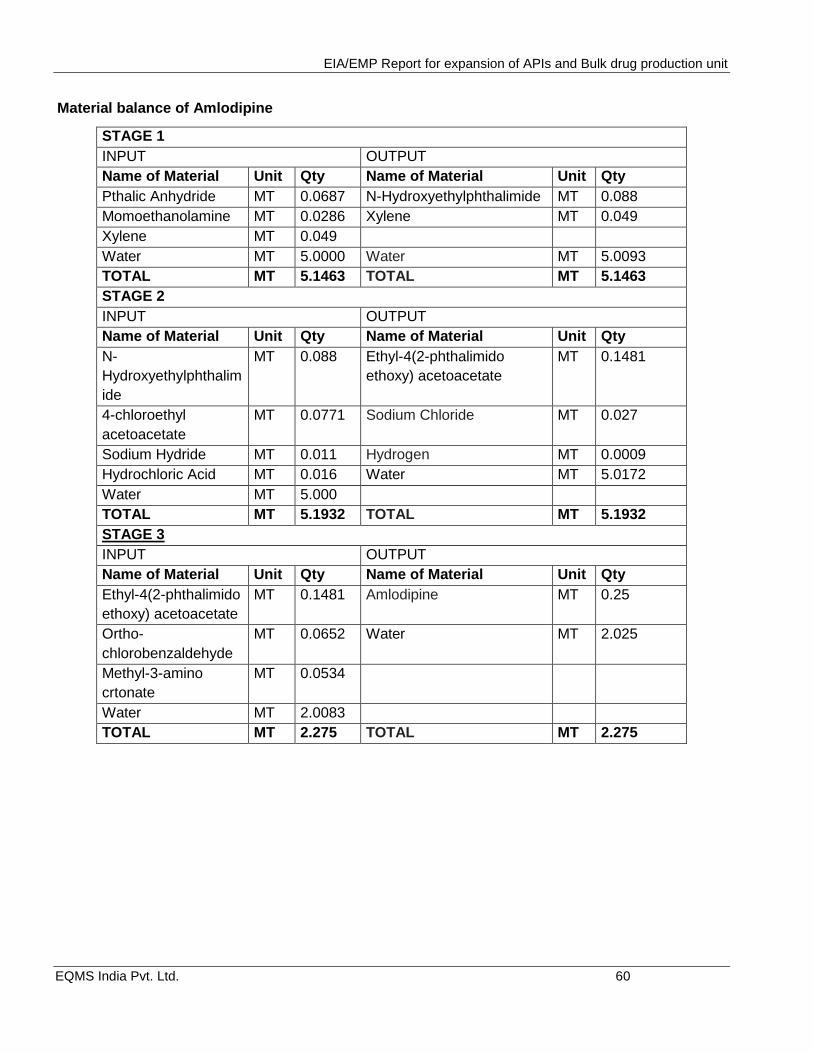
EIA/EMP Report for expansion of APIs and Bulk drug production unit
EQMS India Pvt. Ltd. 60
Material balance of Amlodipine
STAGE 1
INPUT OUTPUT
Name of Material Unit Qty Name of Material Unit Qty
Pthalic Anhydride MT 0.0687 N-Hydroxyethylphthalimide MT 0.088
Momoethanolamine MT 0.0286 Xylene MT 0.049
Xylene MT 0.049
Water MT 5.0000 Water MT 5.0093
TOTAL MT 5.1463 TOTAL MT 5.1463
STAGE 2
INPUT OUTPUT
Name of Material Unit Qty Name of Material Unit Qty
N-
Hydroxyethylphthalim
ide
MT 0.088 Ethyl-4(2-phthalimido
ethoxy) acetoacetate
MT 0.1481
4-chloroethyl
acetoacetate
MT 0.0771 Sodium Chloride MT 0.027
Sodium Hydride MT 0.011 Hydrogen MT 0.0009
Hydrochloric Acid MT 0.016 Water MT 5.0172
Water MT 5.000
TOTAL MT 5.1932 TOTAL MT 5.1932
STAGE 3
INPUT OUTPUT
Name of Material Unit Qty Name of Material Unit Qty
Ethyl-4(2-phthalimido
ethoxy) acetoacetate
MT 0.1481 Amlodipine MT 0.25
Ortho-
chlorobenzaldehyde
MT 0.0652 Water MT 2.025
Methyl-3-amino
crtonate
MT 0.0534
Water MT 2.0083
TOTAL MT 2.275 TOTAL MT 2.275
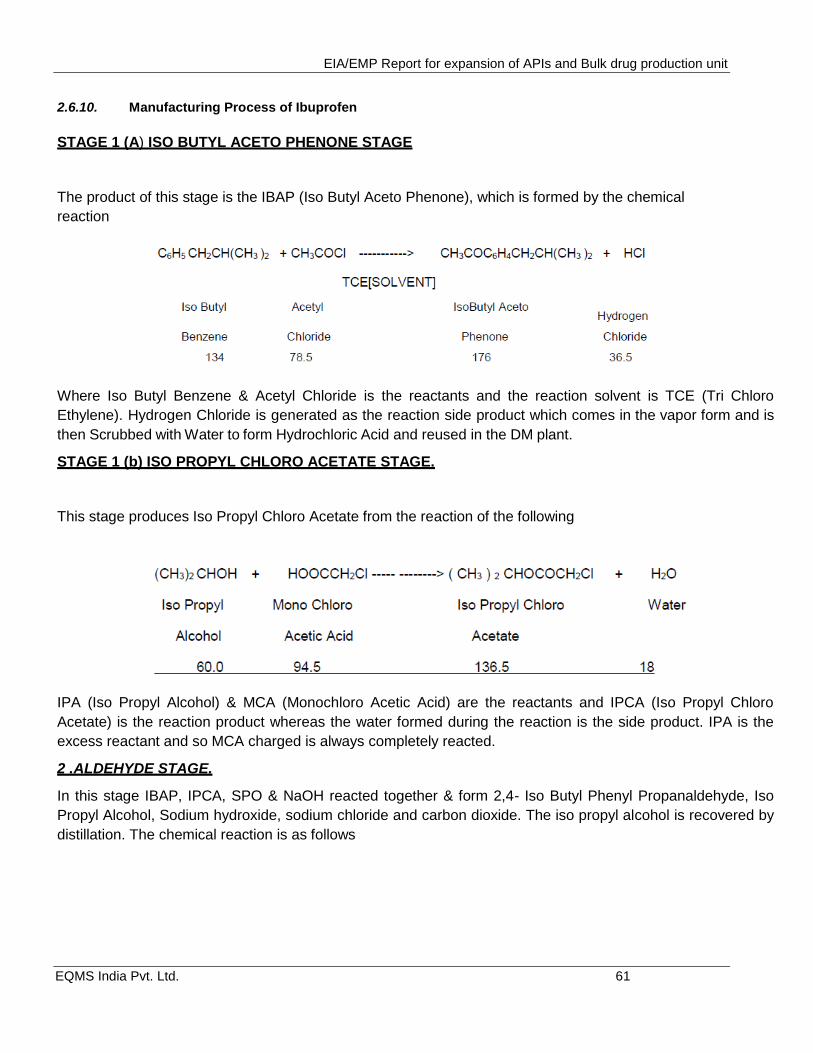
EIA/EMP Report for expansion of APIs and Bulk drug production unit
EQMS India Pvt. Ltd. 61
2.6.10. Manufacturing Process of Ibuprofen
STAGE 1 (A) ISO BUTYL ACETO PHENONE STAGE
The product of this stage is the IBAP (Iso Butyl Aceto Phenone), which is formed by the chemical
reaction
Where Iso Butyl Benzene & Acetyl Chloride is the reactants and the reaction solvent is TCE (Tri Chloro
Ethylene). Hydrogen Chloride is generated as the reaction side product which comes in the vapor form and is
then Scrubbed with Water to form Hydrochloric Acid and reused in the DM plant.
STAGE 1 (b) ISO PROPYL CHLORO ACETATE STAGE.
This stage produces Iso Propyl Chloro Acetate from the reaction of the following
IPA (Iso Propyl Alcohol) & MCA (Monochloro Acetic Acid) are the reactants and IPCA (Iso Propyl Chloro
Acetate) is the reaction product whereas the water formed during the reaction is the side product. IPA is the
excess reactant and so MCA charged is always completely reacted.
2 .ALDEHYDE STAGE.
In this stage IBAP, IPCA, SPO & NaOH reacted together & form 2,4- Iso Butyl Phenyl Propanaldehyde, Iso
Propyl Alcohol, Sodium hydroxide, sodium chloride and carbon dioxide. The iso propyl alcohol is recovered by
distillation. The chemical reaction is as follows
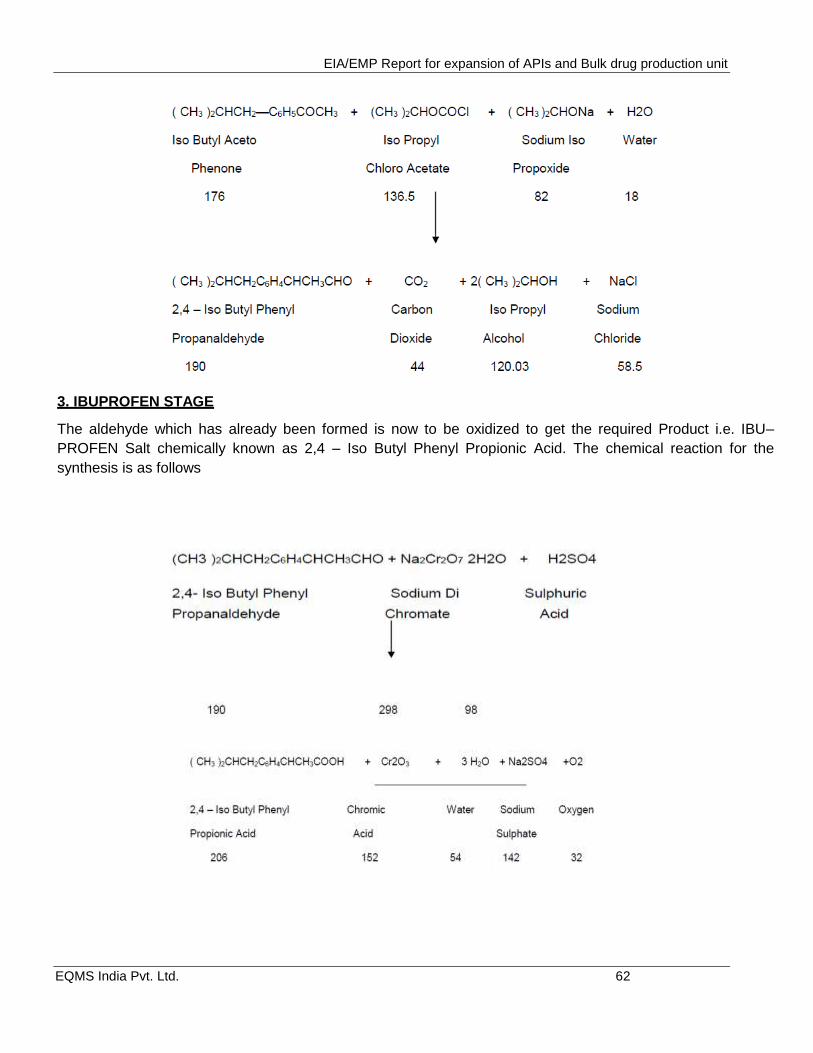
EIA/EMP Report for expansion of APIs and Bulk drug production unit
EQMS India Pvt. Ltd. 62
3. IBUPROFEN STAGE
The aldehyde which has already been formed is now to be oxidized to get the required Product i.e. IBU–
PROFEN Salt chemically known as 2,4 – Iso Butyl Phenyl Propionic Acid. The chemical reaction for the
synthesis is as follows
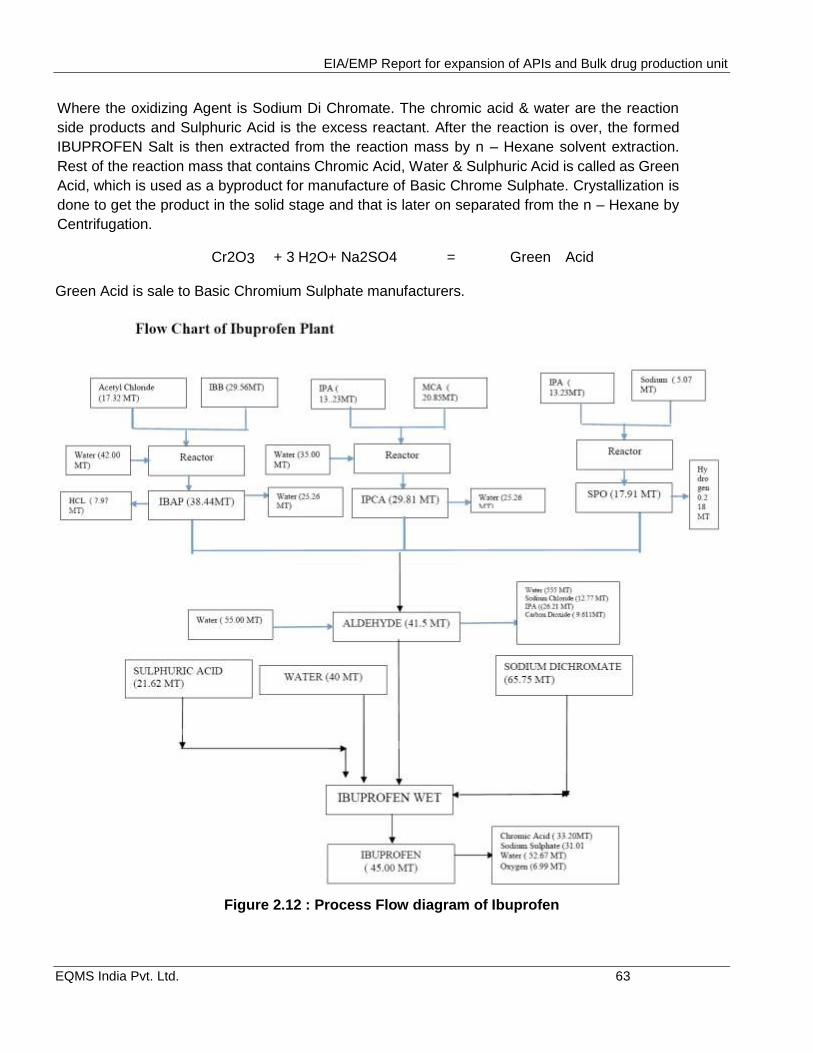
EIA/EMP Report for expansion of APIs and Bulk drug production unit
EQMS India Pvt. Ltd. 63
Where the oxidizing Agent is Sodium Di Chromate. The chromic acid & water are the reaction
side products and Sulphuric Acid is the excess reactant. After the reaction is over, the formed
IBUPROFEN Salt is then extracted from the reaction mass by n – Hexane solvent extraction.
Rest of the reaction mass that contains Chromic Acid, Water & Sulphuric Acid is called as Green
Acid, which is used as a byproduct for manufacture of Basic Chrome Sulphate. Crystallization is
done to get the product in the solid stage and that is later on separated from the n – Hexane by
Centrifugation.
Cr2O3 + 3 H2O+ Na2SO4 = Green Acid
Green Acid is sale to Basic Chromium Sulphate manufacturers.
Figure 2.12 : Process Flow diagram of Ibuprofen
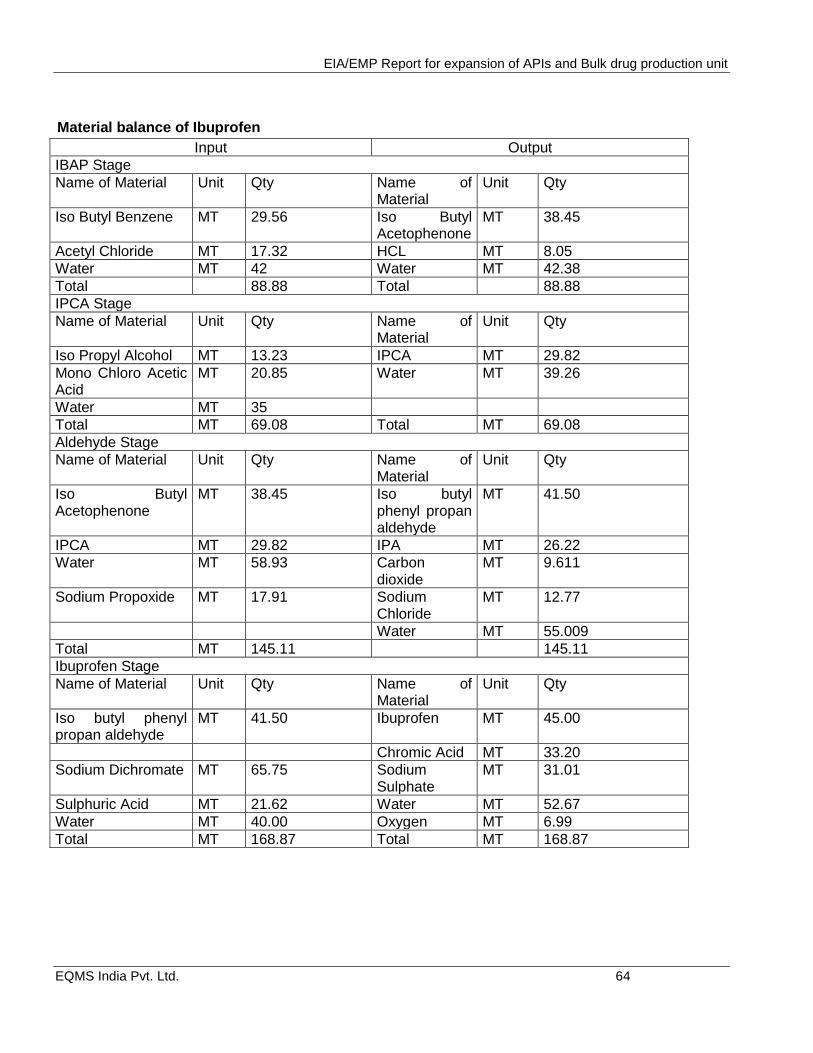
EIA/EMP Report for expansion of APIs and Bulk drug production unit
EQMS India Pvt. Ltd. 64
Material balance of Ibuprofen
Input Output
IBAP Stage
Name of Material Unit Qty Name of Material
Unit Qty
Iso Butyl Benzene MT 29.56 Iso Butyl Acetophenone
MT 38.45
Acetyl Chloride MT 17.32 HCL MT 8.05
Water MT 42 Water MT 42.38
Total 88.88 Total 88.88
IPCA Stage
Name of Material Unit Qty Name of Material
Unit Qty
Iso Propyl Alcohol MT 13.23 IPCA MT 29.82
Mono Chloro Acetic Acid
MT 20.85 Water MT 39.26
Water MT 35
Total MT 69.08 Total MT 69.08
Aldehyde Stage
Name of Material Unit Qty Name of Material
Unit Qty
Iso Butyl Acetophenone
MT 38.45 Iso butyl phenyl propan aldehyde
MT 41.50
IPCA MT 29.82 IPA MT 26.22
Water MT 58.93 Carbon dioxide
MT 9.611
Sodium Propoxide MT 17.91 Sodium Chloride
MT 12.77
Water MT 55.009
Total MT 145.11 145.11
Ibuprofen Stage
Name of Material Unit Qty Name of Material
Unit Qty
Iso butyl phenyl propan aldehyde
MT 41.50 Ibuprofen MT 45.00
Chromic Acid MT 33.20
Sodium Dichromate MT 65.75 Sodium Sulphate
MT 31.01
Sulphuric Acid MT 21.62 Water MT 52.67
Water MT 40.00 Oxygen MT 6.99
Total MT 168.87 Total MT 168.87
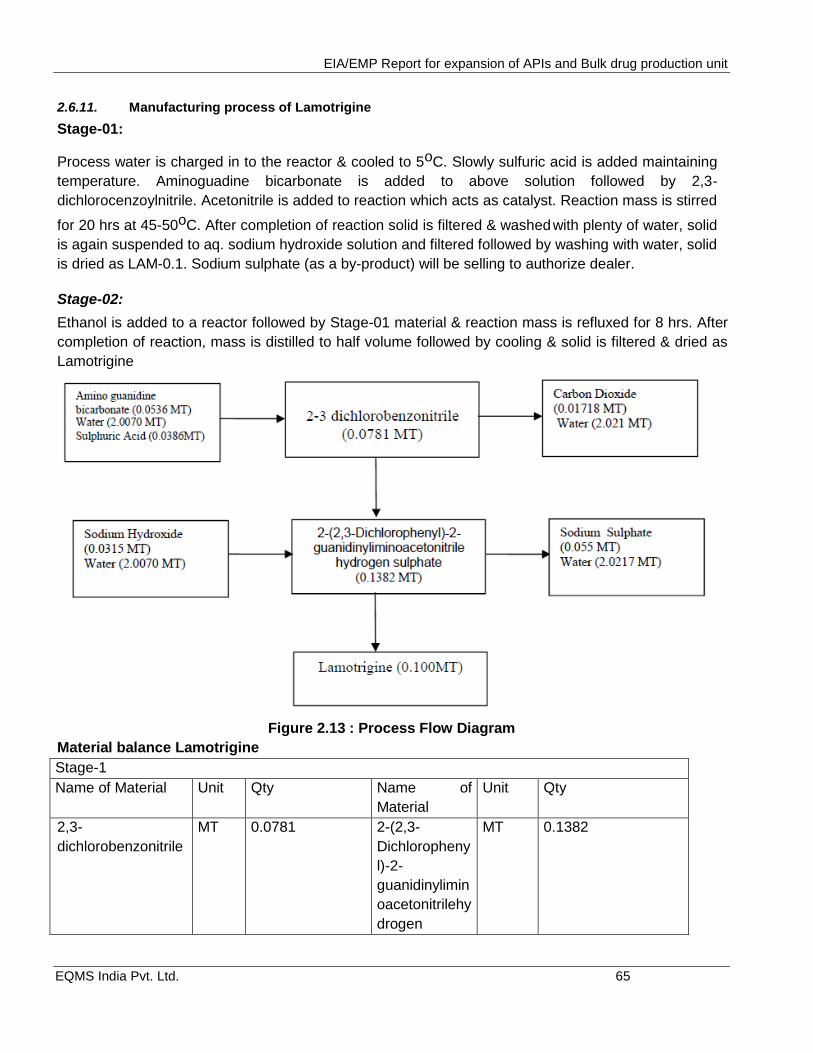
EIA/EMP Report for expansion of APIs and Bulk drug production unit
EQMS India Pvt. Ltd. 65
2.6.11. Manufacturing process of Lamotrigine
Stage-01:
Process water is charged in to the reactor & cooled to 5oC. Slowly sulfuric acid is added maintaining
temperature. Aminoguadine bicarbonate is added to above solution followed by 2,3-
dichlorocenzoylnitrile. Acetonitrile is added to reaction which acts as catalyst. Reaction mass is stirred
for 20 hrs at 45-50oC. After completion of reaction solid is filtered & washed with plenty of water, solid
is again suspended to aq. sodium hydroxide solution and filtered followed by washing with water, solid
is dried as LAM-0.1. Sodium sulphate (as a by-product) will be selling to authorize dealer.
Stage-02:
Ethanol is added to a reactor followed by Stage-01 material & reaction mass is refluxed for 8 hrs. After
completion of reaction, mass is distilled to half volume followed by cooling & solid is filtered & dried as
Lamotrigine
Figure 2.13 : Process Flow Diagram
Material balance Lamotrigine
Stage-1
Name of Material Unit Qty Name of
Material
Unit Qty
2,3-
dichlorobenzonitrile
MT 0.0781 2-(2,3-
Dichloropheny
l)-2-
guanidinylimin
oacetonitrilehy
drogen
MT 0.1382
EIA/EMP Report for expansion of APIs and Bulk drug production unit
EQMS India Pvt. Ltd. 66
sulphate
Amino guanidine
bicarbonate
MT 0.0536 Carbon
dioxide
MT 0.01718
Sulphuric Acid MT 0.0386
Water MT 2.0070 Water MT 2.021
Total MT 2.1773 Total MT 2.1773
Stage-2
Name of Material Unit Qty Name of
Material
Unit Qty
2-(2,3-
Dichlorophenyl)-2-
guanidinyliminoacet
onitrilehydrogen
sulphate
MT 0.1382 2-(2,3-
Dichloropheny
l)-2-
guanidinylimin
oacetonitrile
hydrogen
sulphate
MT 0.100
Sodium Hydroxide MT 0.0315 Sodium
Sulphate
MT 0.055
Water MT 2.0070 Water MT 2.0217
Total MT 2.1767 Total MT 2.1767
2.6.12. Manufacturing Process of Phineramine base
Toluene is charged to a clean reaction vessel at 25-35oC followed by charging of 2-Benzyl pyridine
under nitrogen atmosphere. Cool the reaction mass to 5-10oC & Charge sodium amide under
Nitrogen atmosphere. Stir the reaction mass for some time at same temperature & slowly raise the
temperature of reaction mass to 30-35oC. Meanwhile in another reaction vessel charge purified water
at 25-35oC & caustic lye solution at 25-35oC. Charge toluene & Cool the mass to 0-5oC. Charge 2-
chloro-N,N-dimethyl ethylamine Hydrochloride & Stir the reaction mass for 30 minutes at same
temperature. Stop agitation & allow to settle the mass for 15 minutes. Separated the organic layer to
a dry vessel. Add anhydrous potassium carbonate to organic layer to remove the moisture. Decant off
organic layer & slowly add to above reaction mass at 30-35oC in approx. 1hr. Maintain the reaction
mass monitor the reaction progress by HPLC till reaction complies (2-Benzyl pyridine <10%).
After reaction completion cool the reaction mass to 20-25oC. Slowly add methanol & stir for 10- 15
minutes & then add slowly water to quench the reaction mass at 20-25oC. Stir the mass for 30
minutes. Adjust the pH of reaction mass to 4-4.5 using dil. HCl at 20-30oC & stir for 10 minutes.
Separate the layer & collected the toluene layer for recovery of unreacted 2-Benzyl pyridine.
Charge aq. Layer back to reaction vessel at 25-30oC. Charge toluene to reaction vessel at 25- 30oC,
Stir the mass for 10-15 minutes. Settle & separate the toluene layer for recovery of unreacted 2-
Benzyl pyridine. Charge aq. Layer back to reaction vessel at 25-30oC. Adjust the pH of reaction mass
to 10-11 using aq. NaOH solution & Charge Hexane, stir for 30 minutes. Settle & separate the organic
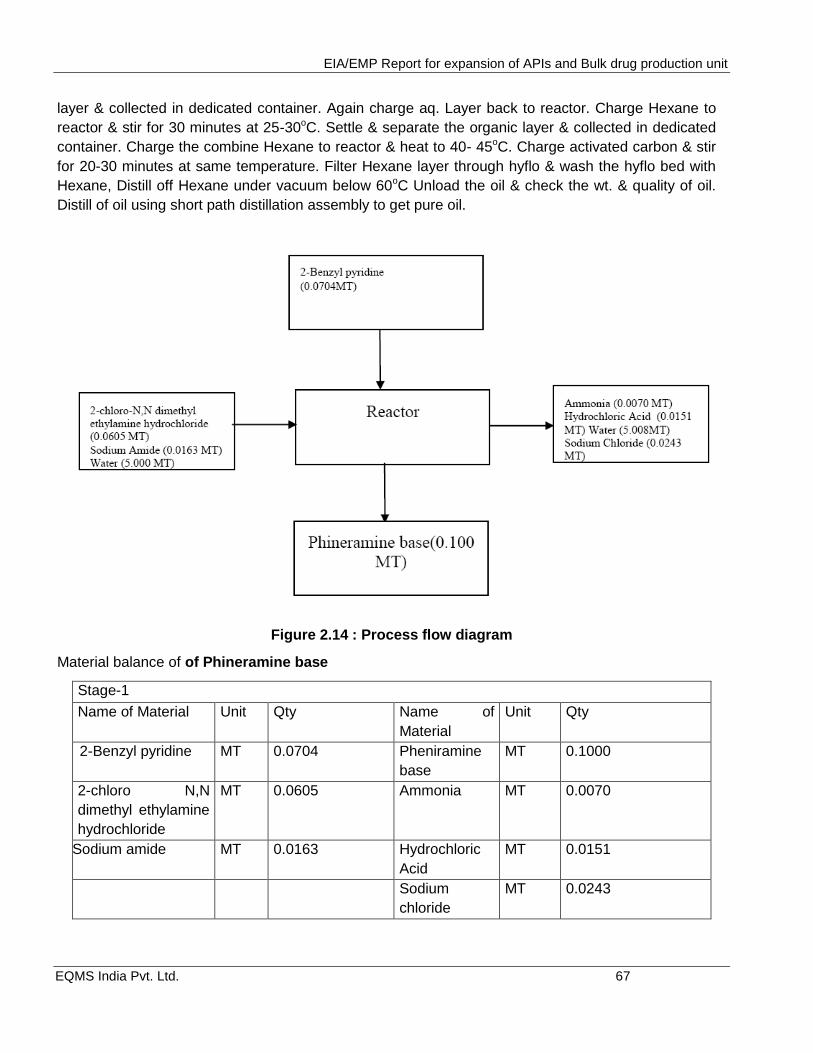
EIA/EMP Report for expansion of APIs and Bulk drug production unit
EQMS India Pvt. Ltd. 67
layer & collected in dedicated container. Again charge aq. Layer back to reactor. Charge Hexane to
reactor & stir for 30 minutes at 25-30oC. Settle & separate the organic layer & collected in dedicated
container. Charge the combine Hexane to reactor & heat to 40- 45oC. Charge activated carbon & stir
for 20-30 minutes at same temperature. Filter Hexane layer through hyflo & wash the hyflo bed with
Hexane, Distill off Hexane under vacuum below 60oC Unload the oil & check the wt. & quality of oil.
Distill of oil using short path distillation assembly to get pure oil.
Figure 2.14 : Process flow diagram
Material balance of of Phineramine base
Stage-1
Name of Material Unit Qty Name of
Material
Unit Qty
2-Benzyl pyridine MT 0.0704 Pheniramine
base
MT 0.1000
2-chloro N,N
dimethyl ethylamine
hydrochloride
MT 0.0605 Ammonia MT 0.0070
Sodium amide MT 0.0163 Hydrochloric
Acid
MT 0.0151
Sodium
chloride
MT 0.0243
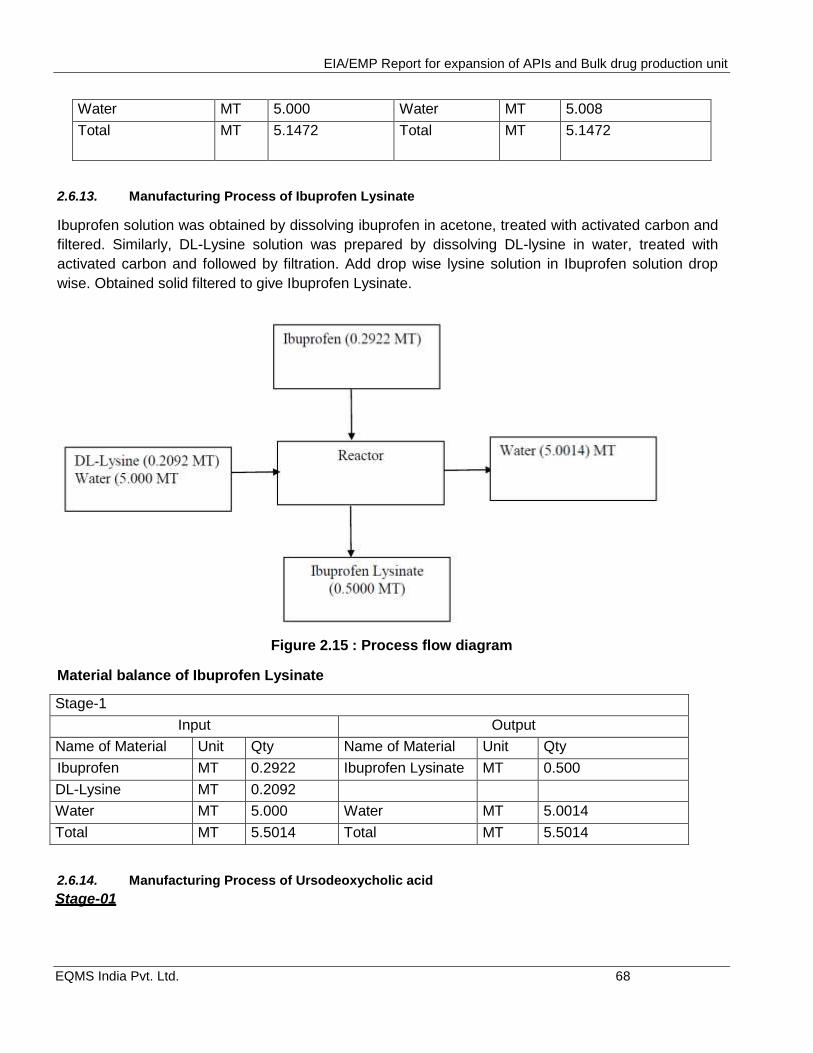
EIA/EMP Report for expansion of APIs and Bulk drug production unit
EQMS India Pvt. Ltd. 68
Water MT 5.000 Water MT 5.008
Total MT 5.1472 Total MT 5.1472
2.6.13. Manufacturing Process of Ibuprofen Lysinate
Ibuprofen solution was obtained by dissolving ibuprofen in acetone, treated with activated carbon and
filtered. Similarly, DL-Lysine solution was prepared by dissolving DL-lysine in water, treated with
activated carbon and followed by filtration. Add drop wise lysine solution in Ibuprofen solution drop
wise. Obtained solid filtered to give Ibuprofen Lysinate.
Figure 2.15 : Process flow diagram
Material balance of Ibuprofen Lysinate
Stage-1
Input Output
Name of Material Unit Qty Name of Material Unit Qty
Ibuprofen MT 0.2922 Ibuprofen Lysinate MT 0.500
DL-Lysine MT 0.2092
Water MT 5.000 Water MT 5.0014
Total MT 5.5014 Total MT 5.5014
2.6.14. Manufacturing Process of Ursodeoxycholic acid
Stage-01
EIA/EMP Report for expansion of APIs and Bulk drug production unit
EQMS India Pvt. Ltd. 69
Toluene is charged to reactor followed by charging of Cholic acid. Reaction mass is heated slowly
followed by Azeotropic reflux to remove water. After that cool the mass to 25-35, further cool to 5-10 &
maintain for 1 hr at same temperature. Filter the material & washed with chilled toluene. Charged the
wet cake back to reaction vessel followed by addition of methanol. Slowly added sulfuric acid & raise
the temperature of reaction mass to reflux. Stir the mass for 8-10 hrs & after completion of reaction
cool the mass to room temperature. Further cool the mass to zero degree & filter the material &
washed with chilled methanol, dry the wet cake in oven under vacuum till LOD came less than 1%.
Unload the dry material as UDCA-01.
Stage-02
Charge MDC into reaction at 25-30oC. Charged UDCA-01 & Dimethyl amino pyridine at same
temperature under stirring. Charge TEA & cool the mass to zero degree. Slowly added acetic
anhydride & stir at same temperature to for reaction completion. After reaction completion slowly add
water to reaction mass for reaction termination. Distill water azeotropically to remove MDC. Add ethyl
acetate & Heptane at 50-55 & stir. Cool the mass up to 20-22 & filter the solid. Wash the wet cake with
water followed by heptanes. Unload the wet cake & dry in air dryer at 500C till LOD came less than 1%.
Unload dry material as UDCA-02
Stage-03
Charge Ethyl acetate to reaction vessel. Charge UDCA-02 at 25-30oC & stir the mass. Charge
Sodium bromide & acetic acid at same temperature & cool the reaction mass to zero degree. Slowly
added sodium hypochlorite solution & stir the reaction mass at same temperature. Check the reaction
progress using HPLC. After reaction completion charge 10% aq. Sodium sulfite solution. Separate
the layer & wash the organic layer with aq.
Sodium bicarbonate solution. Charge DM water to organic layer & distill of ethyl acetate
azeotropically, cool the mass & filter the solid. Wash the wet cake with water & dry the solid in oven
under vacuum till LOD came NMT 0.5%. Unload the dry solid as UDCA- 03
Stage-04
Charge triethylene glycol to a reaction vessel. Charge UDCA-03 at 25-30oC & stir the mass. Slowly
added aq. Hydrazine hydrate solution. Charge 1-octanol in catalytic quantity & raise the temperature
of reaction to get clear solution. Slowly added aq. KOH solution under heating & start azetropic
distillation to remove water. After reaction completion cool the mass & add dil HCl to reaction vessel
to quench the reaction mass. Extract the reaction mass using ethyl acetate. Separate the organic
layer & again extract aq. Layer using ethyl acetate. To combined organic layer wash with aq. Sodium
bicarbonate. Wash the organic layer with aq. Sodium chloride & then distil of ethyl acetate completely
under vacuum below 45 to give UDCA-04.
EIA/EMP Report for Expansion of Chemicals and APIs production unit by IOLCP
EQMS India Pvt. Ltd. 70
Stage-05
Charge n-propanol & UDCA-04 to reaction vessel & stir to get a clear solution. Charge sodium
bromide & acetic acid followed by addition of DM water. Cool the reaction mass & slowly add
sodium hypochlorite solution. Maintain the reaction & after reaction completion slowly charge
aq. Sodium sulfite. Distill off water & n-propanol azeotropically. Cool the reaction mass & add
water. Slowly adjust the pH using Dil HCl & filter the solid. Wash the wet cake with Water & re
crystallize the solid in methanol, dry the solid in oven under vacuum till LOD came below
0.5%. Unload the solid as UDCA-05
UDCA-06
Charge IPA & tert-butoxide to a reaction vessel & stir to get a clear solution. Charge UDCA-05
& stir. Charge the reaction mass to pressure vessel. Slowly apply Hydrogen gas up to 3 bar &
raise the temperature of reaction mass up to 90 degree. Monitor the reaction Progress by
HPLC & after completion of reaction, release the pressure & filter the mass. Distill off IPA &
add water to residue. Slowly added sulfuric acid to adjust the pH 7-8 & again distill water &
traces of IPA. Charge water & heat the mass, adjust the pH to 2-2.5. Cool the mass & filter the
solid. Dry the wet cake in oven under vacuum till LOD came less than 0.5%. Unload the solid
as UDCA-06
UDCA-07
Charge Methyl ethyl ketone & UDCA-06 to reaction vessel. Heat the mass to 75-80 degree
& slowly add TEA. Stir the reaction mass & slowly cool to 20-25 degree. Filter the mass & re
crystallize the solid using methyl ethyl ketone. Dry the solid in oven till LOD came less than
0.5%. Unload the dry solid as UDCA-07
UDCA
Charge purified water & UDCA-07 to reaction vessel at 25-30oC. Heat the reaction mass
slowly added aq. NaOH solution to get a clear solution. Further heat the reaction mass to 80-
85oC & adjust the pH of reaction mass to 2.4 using dil. Sulfuric acid. Cool the reaction mass
to 35-40oC & filter the mass. Wash the wet cake with purified water & dry the solid in oven
under vacuum below 85 degree till LOD came below 0.5%. Unload the dry solid as UDCA &
submit the sample in QC for complete analysis.
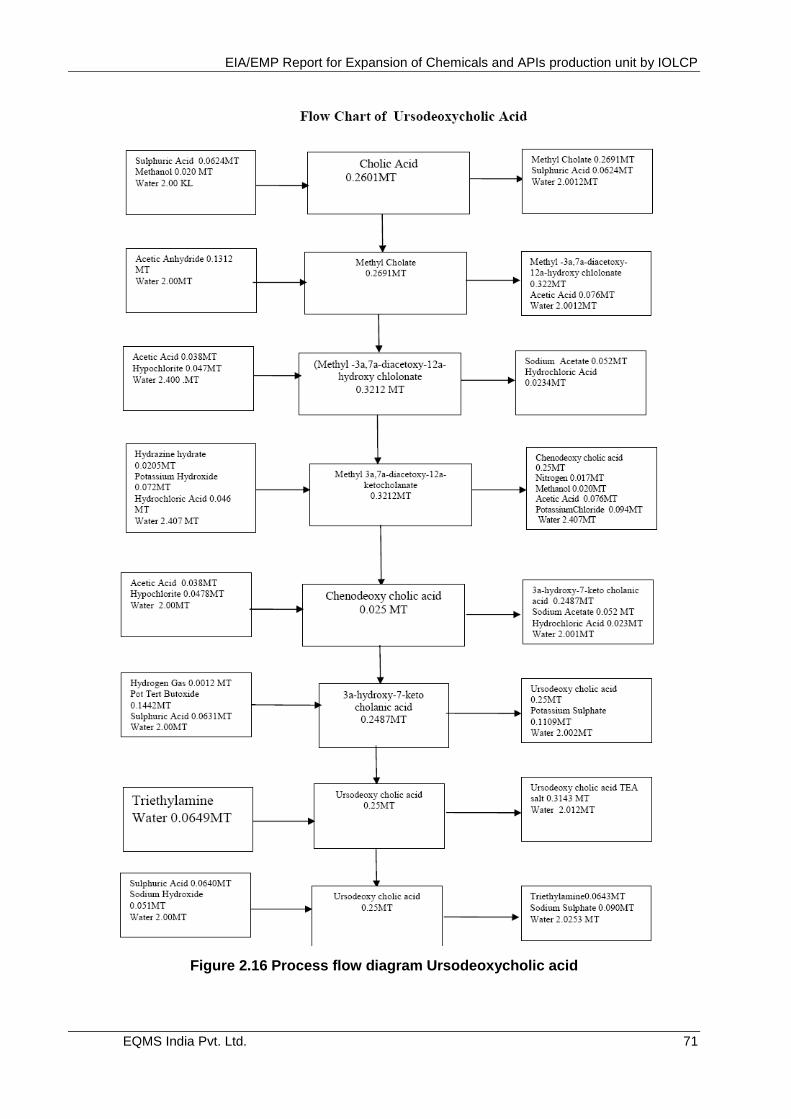
EIA/EMP Report for Expansion of Chemicals and APIs production unit by IOLCP
EQMS India Pvt. Ltd. 71
Figure 2.16 Process flow diagram Ursodeoxycholic acid
EIA/EMP Report for Expansion of Chemicals and APIs production unit by IOLCP
EQMS India Pvt. Ltd. 72
Material balance of Ursodeoxycholic acid
Stage-1
Input Output
Name of Material Unit Qty Name of Material Unit Qty
Cholic Acid MT 0.2601 Methyl Cholate MT 0.2691
Sulphuric Acid MT 0.0624 Sulphuric Acid MT 0.0624
Methanol MT 0.0204 Water MT 2.0114
Water MT 2.000
Total MT 2.3428 Total MT 2.3428
Stage-2
Input Output
Name of Material Unit Qty Name of Material Unit Qty
Methyl Cholate MT 0.2691 Methyl -3a,7a-diacetoxy-12a-hydroxy chlolonate
MT 0.3220
Acetic Anhydride MT 0.1312 Acetic Acid MT 0.076
Water MT 2.000 Water MT 2.0023
Total MT 2.4003 Total MT 2.4003
Stage-3
Input Output
Name of Material Unit Qty Name of Material Unit Qty
Methyl -3a,7a-diacetoxy-12a-hydroxy chlolonate
MT 0.322 Methyl 3a,7a-diacetoxy-12a-ketocholanate
MT 0.3213
Acetic Acid MT 0.038 Sodium Acetate MT 0.052
Hypochlorite MT 0.047 Hydrochloric Acid MT 0.0234
Water MT 2.000 Water MT 2.010
Total MT 2.407 Total MT 2.407
Stage-4
Input Output
Name of Material Unit Qty Name of Material Unit Qty
Methyl 3a,7a-diacetoxy-12a-ketocholanate
MT 0.321 Chenodeoxy cholic acid
MT 0.2500
Hydrazine Hydrate MT 0.020 Nitrogen MT 0.017
Potassium Hydroxide
MT 0.072 Methanol MT 0.020
Hydrochloric Acid MT 0.046 Acetic Acid MT 0.076
Potassium Chloride MT 0.094
Water MT 2.000 Water MT 2.002
Total MT 2.459 Total MT 2.459
Stage-5
Input Output
EIA/EMP Report for Expansion of Chemicals and APIs production unit by IOLCP
EQMS India Pvt. Ltd. 73
Name of Material Unit Qty Name of Material Unit Qty
Chenodeoxy cholic acid
MT 0.250 3a-hydroxy-7-keto cholanic acid
MT 0.248
Acetic Acid MT 0.038 Sodium Acetate MT 0.052
Hypochlorite MT 0.047 Hydrochloric Acid MT 0.023
Water MT 2.000 Water MT 2.012
Total MT 2.335 Total MT 2.335
Stage-6
Input Output
Name of Material Unit Qty Name of Material Unit Qty
3a-hydroxy-7-keto cholanic acid
MT 0.248 Ursodeoxy cholic acid MT 0.2500
Hydrogen Gas MT 0.0001 Tert Butanol MT 0.0942
Pot tert Butoxide MT 0.1442 Potassium Sulphate MT 0.1009
Sulphuric Acid MT 0.0631
Water MT 2.000 Water MT 2.00103
Total MT 2.4554 Total MT 2.4554
Stage-7
Input output
Name of Material Unit Qty Name of Material Unit Qty
Ursodeoxy cholic acid
MT 0.2500 Ursodeoxy cholic acid TEA salt
MT 0.3143
Triethylamine MT 0.0649
Water MT 2.000 Water MT 2.0006
Total MT 2.3149 Total MT 2.3149
Stage-8
Input Output
Name of Material Unit Qty Name of Material Unit Qty
Ursodeoxy cholic acid TEA salt
MT 0.3143 Ursodeoxy cholic acid MT 0.2500
Sulphuric Acid MT 0.0649 Triethylamine MT 0.0643
Sodium Hydroxide MT 0.051 Sodium Sulphate MT 0.090
Water MT 2.000 Water MT 2.0253
Total MT 2.4302 Total MT 2.4302
2.6.15. Manufacturing Process of Quetiapine
STAGE – I Formation of 11- Chlorodibenzo[b,f][1,4]thiazepine
Stage-I.
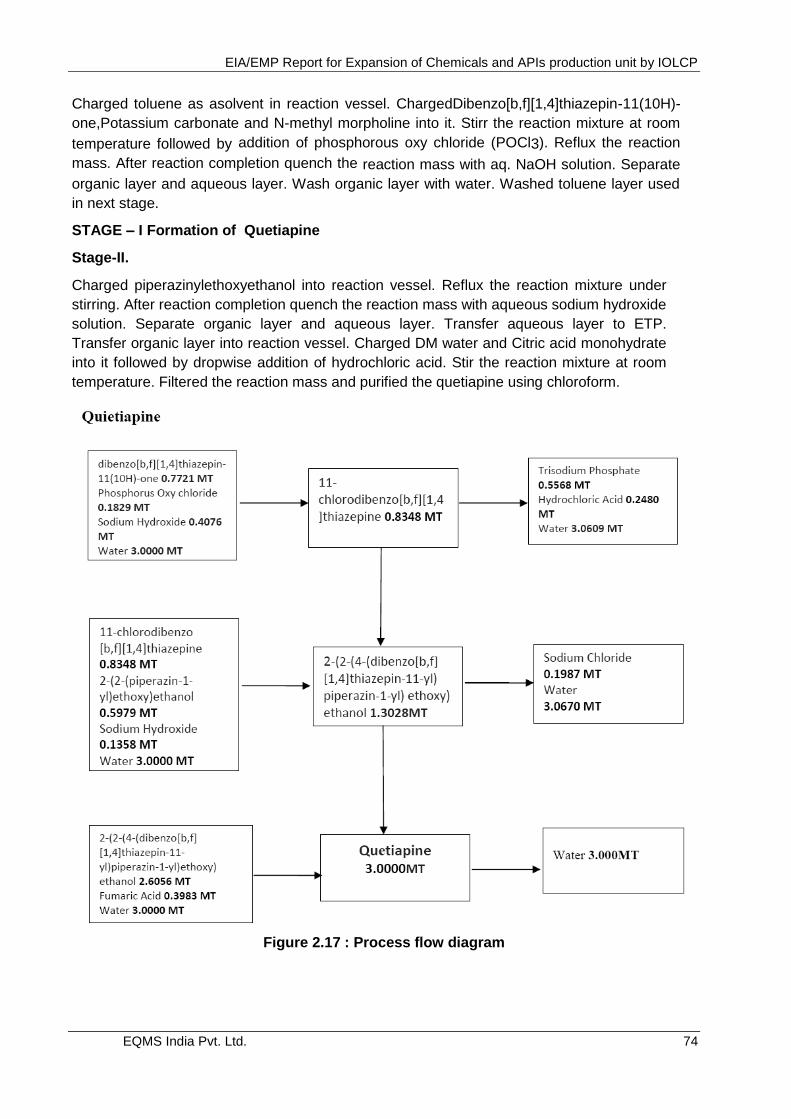
EIA/EMP Report for Expansion of Chemicals and APIs production unit by IOLCP
EQMS India Pvt. Ltd. 74
Charged toluene as asolvent in reaction vessel. ChargedDibenzo[b,f][1,4]thiazepin-11(10H)-
one,Potassium carbonate and N-methyl morpholine into it. Stirr the reaction mixture at room
temperature followed by addition of phosphorous oxy chloride (POCl3). Reflux the reaction
mass. After reaction completion quench the reaction mass with aq. NaOH solution. Separate
organic layer and aqueous layer. Wash organic layer with water. Washed toluene layer used
in next stage.
STAGE – I Formation of Quetiapine
Stage-II.
Charged piperazinylethoxyethanol into reaction vessel. Reflux the reaction mixture under
stirring. After reaction completion quench the reaction mass with aqueous sodium hydroxide
solution. Separate organic layer and aqueous layer. Transfer aqueous layer to ETP.
Transfer organic layer into reaction vessel. Charged DM water and Citric acid monohydrate
into it followed by dropwise addition of hydrochloric acid. Stir the reaction mixture at room
temperature. Filtered the reaction mass and purified the quetiapine using chloroform.
Figure 2.17 : Process flow diagram
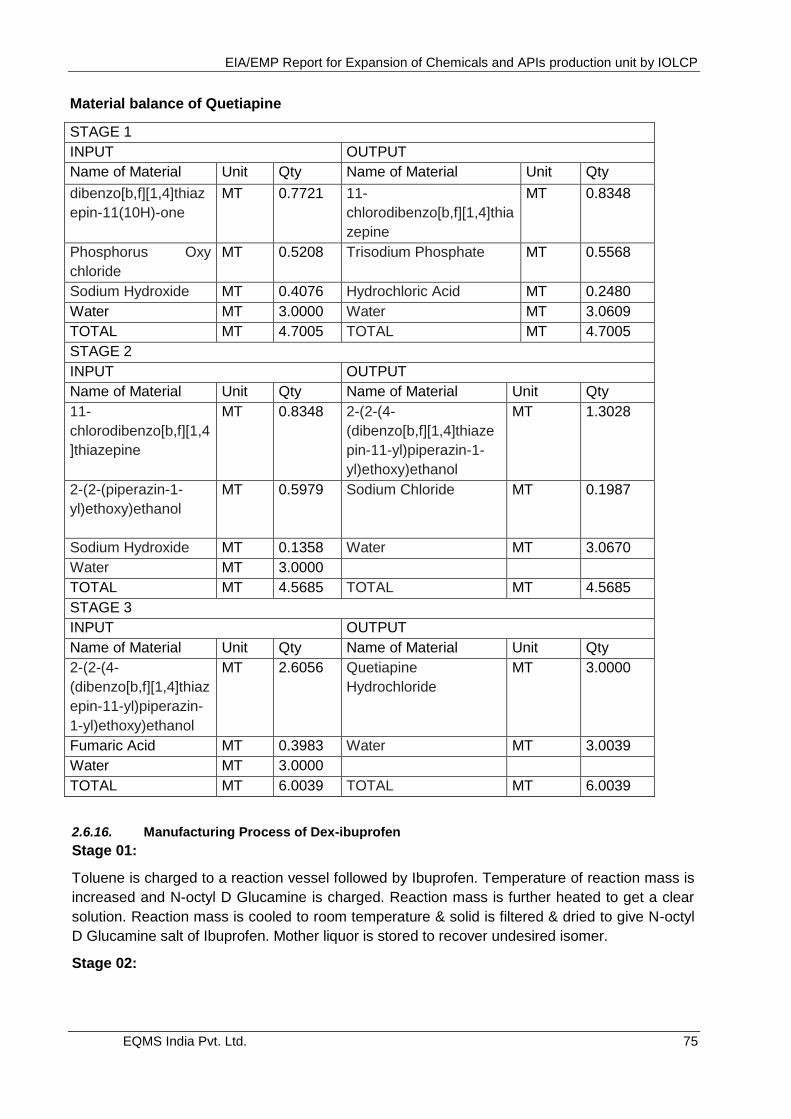
EIA/EMP Report for Expansion of Chemicals and APIs production unit by IOLCP
EQMS India Pvt. Ltd. 75
Material balance of Quetiapine
STAGE 1
INPUT OUTPUT
Name of Material Unit Qty Name of Material Unit Qty
dibenzo[b,f][1,4]thiaz
epin-11(10H)-one
MT 0.7721 11-
chlorodibenzo[b,f][1,4]thia
zepine
MT 0.8348
Phosphorus Oxy
chloride
MT 0.5208 Trisodium Phosphate MT 0.5568
Sodium Hydroxide MT 0.4076 Hydrochloric Acid MT 0.2480
Water MT 3.0000 Water MT 3.0609
TOTAL MT 4.7005 TOTAL MT 4.7005
STAGE 2
INPUT OUTPUT
Name of Material Unit Qty Name of Material Unit Qty
11-
chlorodibenzo[b,f][1,4
]thiazepine
MT 0.8348 2-(2-(4-
(dibenzo[b,f][1,4]thiaze
pin-11-yl)piperazin-1-
yl)ethoxy)ethanol
MT 1.3028
2-(2-(piperazin-1-
yl)ethoxy)ethanol
MT 0.5979 Sodium Chloride MT 0.1987
Sodium Hydroxide MT 0.1358 Water MT 3.0670
Water MT 3.0000
TOTAL MT 4.5685 TOTAL MT 4.5685
STAGE 3
INPUT OUTPUT
Name of Material Unit Qty Name of Material Unit Qty
2-(2-(4-
(dibenzo[b,f][1,4]thiaz
epin-11-yl)piperazin-
1-yl)ethoxy)ethanol
MT 2.6056 Quetiapine
Hydrochloride
MT 3.0000
Fumaric Acid MT 0.3983 Water MT 3.0039
Water MT 3.0000
TOTAL MT 6.0039 TOTAL MT 6.0039
2.6.16. Manufacturing Process of Dex-ibuprofen
Stage 01:
Toluene is charged to a reaction vessel followed by Ibuprofen. Temperature of reaction mass is
increased and N-octyl D Glucamine is charged. Reaction mass is further heated to get a clear
solution. Reaction mass is cooled to room temperature & solid is filtered & dried to give N-octyl
D Glucamine salt of Ibuprofen. Mother liquor is stored to recover undesired isomer.
Stage 02:
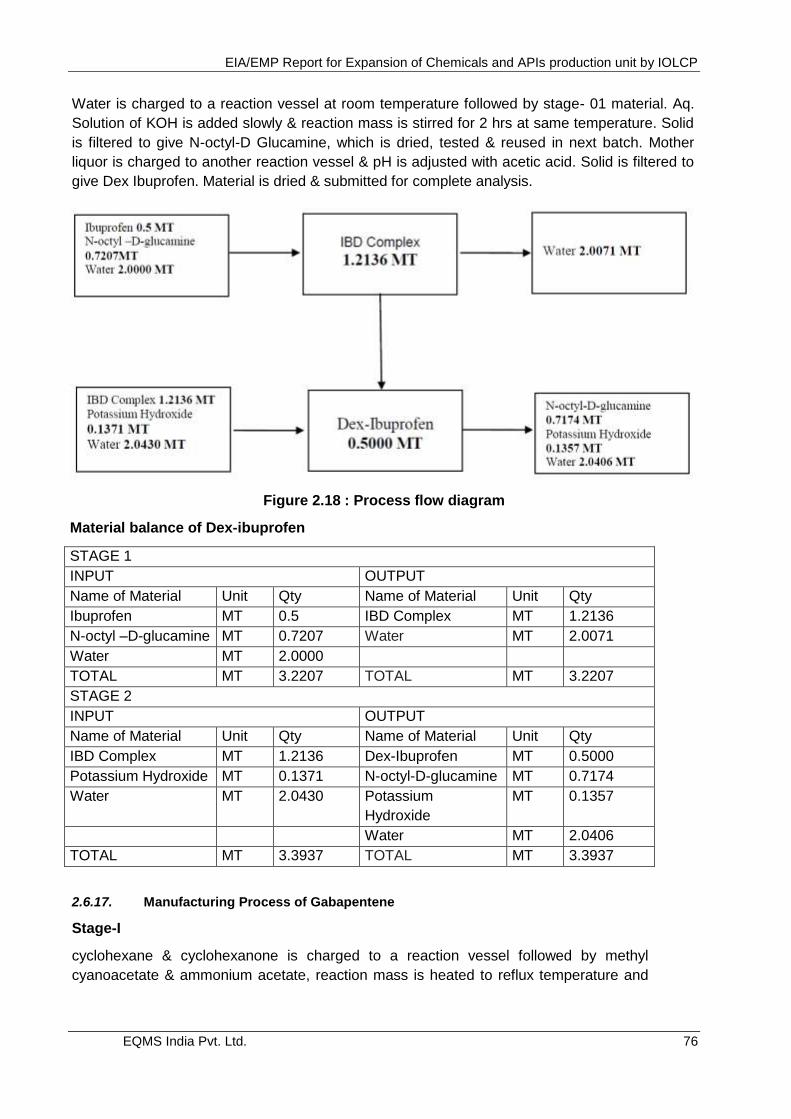
EIA/EMP Report for Expansion of Chemicals and APIs production unit by IOLCP
EQMS India Pvt. Ltd. 76
Water is charged to a reaction vessel at room temperature followed by stage- 01 material. Aq.
Solution of KOH is added slowly & reaction mass is stirred for 2 hrs at same temperature. Solid
is filtered to give N-octyl-D Glucamine, which is dried, tested & reused in next batch. Mother
liquor is charged to another reaction vessel & pH is adjusted with acetic acid. Solid is filtered to
give Dex Ibuprofen. Material is dried & submitted for complete analysis.
Figure 2.18 : Process flow diagram
Material balance of Dex-ibuprofen
STAGE 1
INPUT OUTPUT
Name of Material Unit Qty Name of Material Unit Qty
Ibuprofen MT 0.5 IBD Complex MT 1.2136
N-octyl –D-glucamine MT 0.7207 Water MT 2.0071
Water MT 2.0000
TOTAL MT 3.2207 TOTAL MT 3.2207
STAGE 2
INPUT OUTPUT
Name of Material Unit Qty Name of Material Unit Qty
IBD Complex MT 1.2136 Dex-Ibuprofen MT 0.5000
Potassium Hydroxide MT 0.1371 N-octyl-D-glucamine MT 0.7174
Water MT 2.0430 Potassium
Hydroxide
MT 0.1357
Water MT 2.0406
TOTAL MT 3.3937 TOTAL MT 3.3937
2.6.17. Manufacturing Process of Gabapentene
Stage-I
cyclohexane & cyclohexanone is charged to a reaction vessel followed by methyl
cyanoacetate & ammonium acetate, reaction mass is heated to reflux temperature and
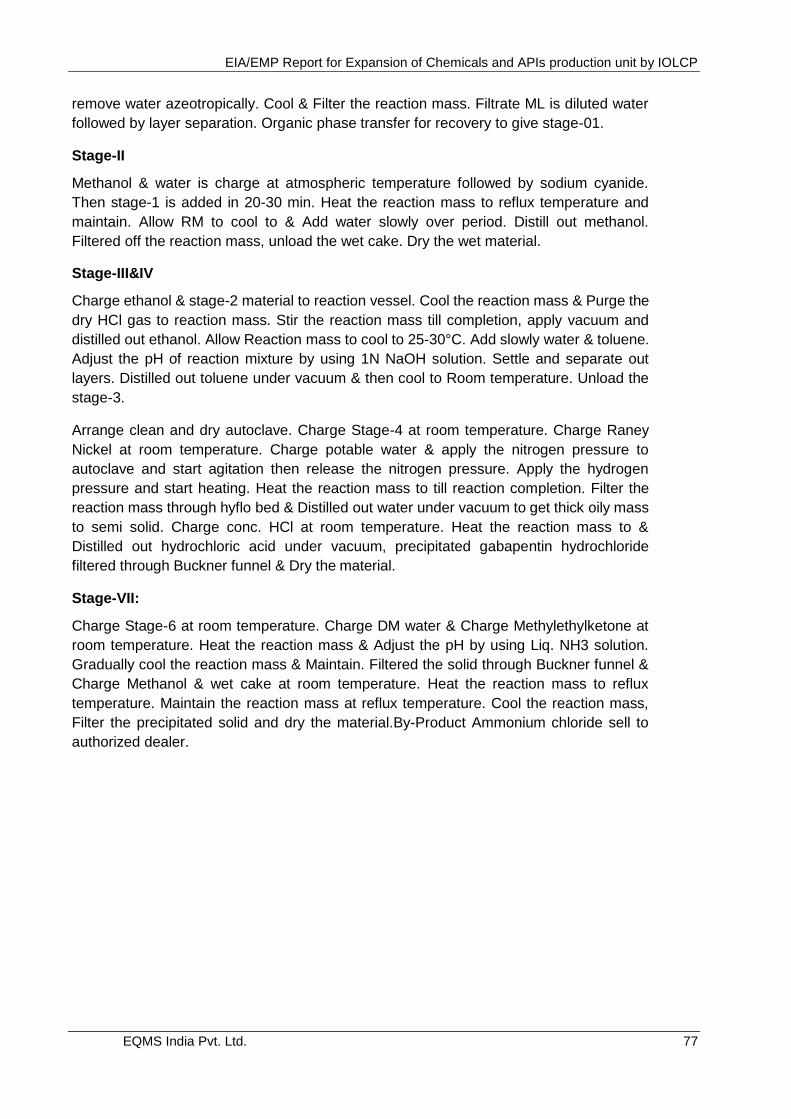
EIA/EMP Report for Expansion of Chemicals and APIs production unit by IOLCP
EQMS India Pvt. Ltd. 77
remove water azeotropically. Cool & Filter the reaction mass. Filtrate ML is diluted water
followed by layer separation. Organic phase transfer for recovery to give stage-01.
Stage-II
Methanol & water is charge at atmospheric temperature followed by sodium cyanide.
Then stage-1 is added in 20-30 min. Heat the reaction mass to reflux temperature and
maintain. Allow RM to cool to & Add water slowly over period. Distill out methanol.
Filtered off the reaction mass, unload the wet cake. Dry the wet material.
Stage-III&IV
Charge ethanol & stage-2 material to reaction vessel. Cool the reaction mass & Purge the
dry HCl gas to reaction mass. Stir the reaction mass till completion, apply vacuum and
distilled out ethanol. Allow Reaction mass to cool to 25-30°C. Add slowly water & toluene.
Adjust the pH of reaction mixture by using 1N NaOH solution. Settle and separate out
layers. Distilled out toluene under vacuum & then cool to Room temperature. Unload the
stage-3.
Arrange clean and dry autoclave. Charge Stage-4 at room temperature. Charge Raney
Nickel at room temperature. Charge potable water & apply the nitrogen pressure to
autoclave and start agitation then release the nitrogen pressure. Apply the hydrogen
pressure and start heating. Heat the reaction mass to till reaction completion. Filter the
reaction mass through hyflo bed & Distilled out water under vacuum to get thick oily mass
to semi solid. Charge conc. HCl at room temperature. Heat the reaction mass to &
Distilled out hydrochloric acid under vacuum, precipitated gabapentin hydrochloride
filtered through Buckner funnel & Dry the material.
Stage-VII:
Charge Stage-6 at room temperature. Charge DM water & Charge Methylethylketone at
room temperature. Heat the reaction mass & Adjust the pH by using Liq. NH3 solution.
Gradually cool the reaction mass & Maintain. Filtered the solid through Buckner funnel &
Charge Methanol & wet cake at room temperature. Heat the reaction mass to reflux
temperature. Maintain the reaction mass at reflux temperature. Cool the reaction mass,
Filter the precipitated solid and dry the material.By-Product Ammonium chloride sell to
authorized dealer.
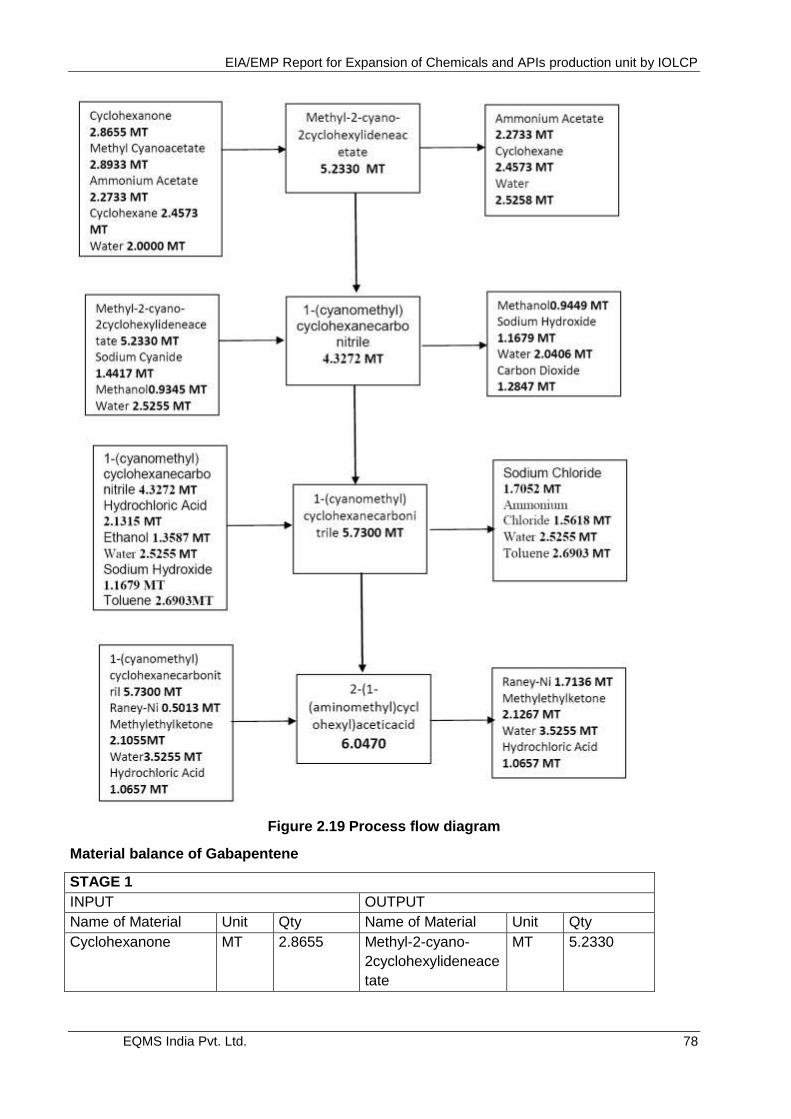
EIA/EMP Report for Expansion of Chemicals and APIs production unit by IOLCP
EQMS India Pvt. Ltd. 78
Figure 2.19 Process flow diagram
Material balance of Gabapentene
STAGE 1
INPUT OUTPUT
Name of Material Unit Qty Name of Material Unit Qty
Cyclohexanone MT 2.8655 Methyl-2-cyano-
2cyclohexylideneace
tate
MT 5.2330
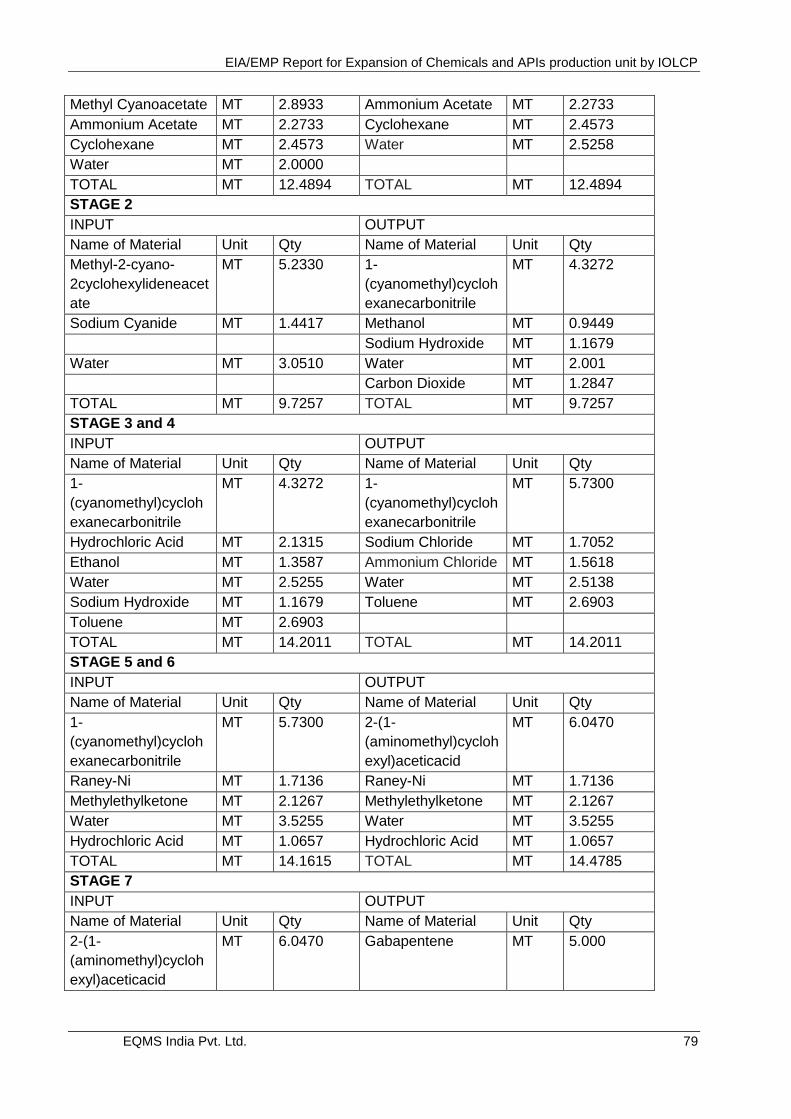
EIA/EMP Report for Expansion of Chemicals and APIs production unit by IOLCP
EQMS India Pvt. Ltd. 79
Methyl Cyanoacetate MT 2.8933 Ammonium Acetate MT 2.2733
Ammonium Acetate MT 2.2733 Cyclohexane MT 2.4573
Cyclohexane MT 2.4573 Water MT 2.5258
Water MT 2.0000
TOTAL MT 12.4894 TOTAL MT 12.4894
STAGE 2
INPUT OUTPUT
Name of Material Unit Qty Name of Material Unit Qty
Methyl-2-cyano-
2cyclohexylideneacet
ate
MT 5.2330 1-
(cyanomethyl)cycloh
exanecarbonitrile
MT 4.3272
Sodium Cyanide MT 1.4417 Methanol MT 0.9449
Sodium Hydroxide MT 1.1679
Water MT 3.0510 Water MT 2.001
Carbon Dioxide MT 1.2847
TOTAL MT 9.7257 TOTAL MT 9.7257
STAGE 3 and 4
INPUT OUTPUT
Name of Material Unit Qty Name of Material Unit Qty
1-
(cyanomethyl)cycloh
exanecarbonitrile
MT 4.3272 1-
(cyanomethyl)cycloh
exanecarbonitrile
MT 5.7300
Hydrochloric Acid MT 2.1315 Sodium Chloride MT 1.7052
Ethanol MT 1.3587 Ammonium Chloride MT 1.5618
Water MT 2.5255 Water MT 2.5138
Sodium Hydroxide MT 1.1679 Toluene MT 2.6903
Toluene MT 2.6903
TOTAL MT 14.2011 TOTAL MT 14.2011
STAGE 5 and 6
INPUT OUTPUT
Name of Material Unit Qty Name of Material Unit Qty
1-
(cyanomethyl)cycloh
exanecarbonitrile
MT 5.7300 2-(1-
(aminomethyl)cycloh
exyl)aceticacid
MT 6.0470
Raney-Ni MT 1.7136 Raney-Ni MT 1.7136
Methylethylketone MT 2.1267 Methylethylketone MT 2.1267
Water MT 3.5255 Water MT 3.5255
Hydrochloric Acid MT 1.0657 Hydrochloric Acid MT 1.0657
TOTAL MT 14.1615 TOTAL MT 14.4785
STAGE 7
INPUT OUTPUT
Name of Material Unit Qty Name of Material Unit Qty
2-(1-
(aminomethyl)cycloh
exyl)aceticacid
MT 6.0470 Gabapentene MT 5.000
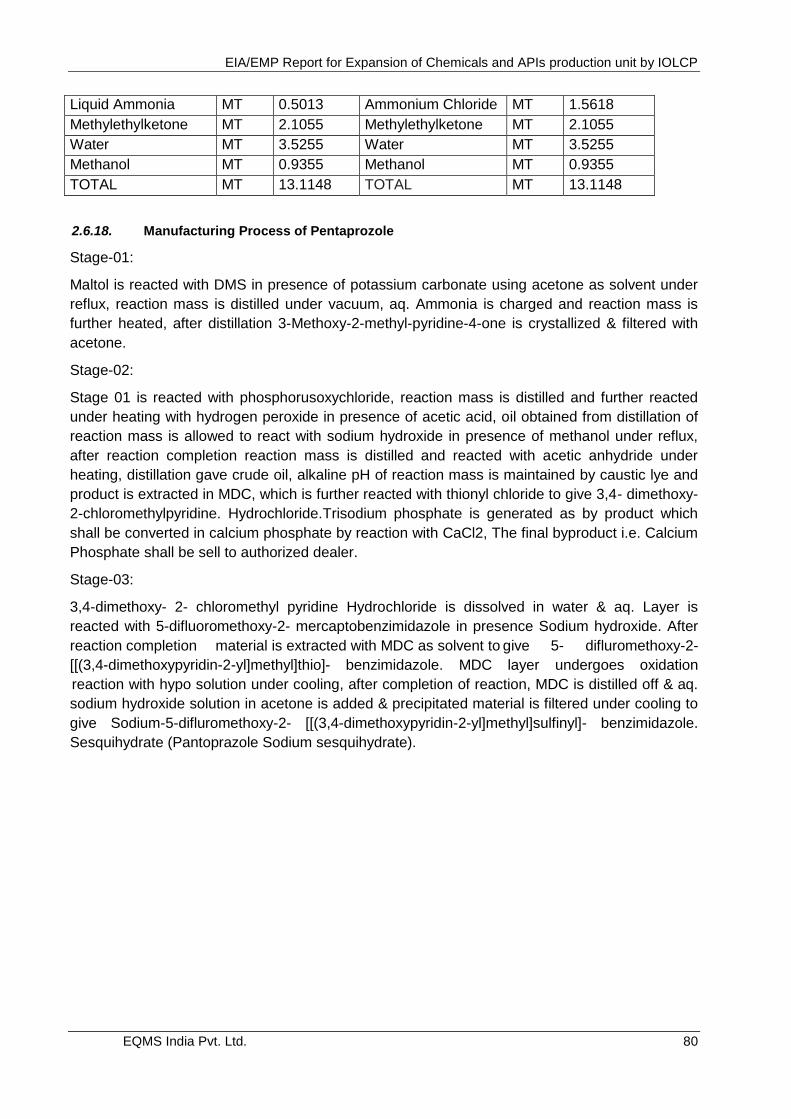
EIA/EMP Report for Expansion of Chemicals and APIs production unit by IOLCP
EQMS India Pvt. Ltd. 80
Liquid Ammonia MT 0.5013 Ammonium Chloride MT 1.5618
Methylethylketone MT 2.1055 Methylethylketone MT 2.1055
Water MT 3.5255 Water MT 3.5255
Methanol MT 0.9355 Methanol MT 0.9355
TOTAL MT 13.1148 TOTAL MT 13.1148
2.6.18. Manufacturing Process of Pentaprozole
Stage-01:
Maltol is reacted with DMS in presence of potassium carbonate using acetone as solvent under
reflux, reaction mass is distilled under vacuum, aq. Ammonia is charged and reaction mass is
further heated, after distillation 3-Methoxy-2-methyl-pyridine-4-one is crystallized & filtered with
acetone.
Stage-02:
Stage 01 is reacted with phosphorusoxychloride, reaction mass is distilled and further reacted
under heating with hydrogen peroxide in presence of acetic acid, oil obtained from distillation of
reaction mass is allowed to react with sodium hydroxide in presence of methanol under reflux,
after reaction completion reaction mass is distilled and reacted with acetic anhydride under
heating, distillation gave crude oil, alkaline pH of reaction mass is maintained by caustic lye and
product is extracted in MDC, which is further reacted with thionyl chloride to give 3,4- dimethoxy-
2-chloromethylpyridine. Hydrochloride.Trisodium phosphate is generated as by product which
shall be converted in calcium phosphate by reaction with CaCl2, The final byproduct i.e. Calcium
Phosphate shall be sell to authorized dealer.
Stage-03:
3,4-dimethoxy- 2- chloromethyl pyridine Hydrochloride is dissolved in water & aq. Layer is
reacted with 5-difluoromethoxy-2- mercaptobenzimidazole in presence Sodium hydroxide. After
reaction completion material is extracted with MDC as solvent to give 5- difluromethoxy-2-
[[(3,4-dimethoxypyridin-2-yl]methyl]thio]- benzimidazole. MDC layer undergoes oxidation
reaction with hypo solution under cooling, after completion of reaction, MDC is distilled off & aq.
sodium hydroxide solution in acetone is added & precipitated material is filtered under cooling to
give Sodium-5-difluromethoxy-2- [[(3,4-dimethoxypyridin-2-yl]methyl]sulfinyl]- benzimidazole.
Sesquihydrate (Pantoprazole Sodium sesquihydrate).
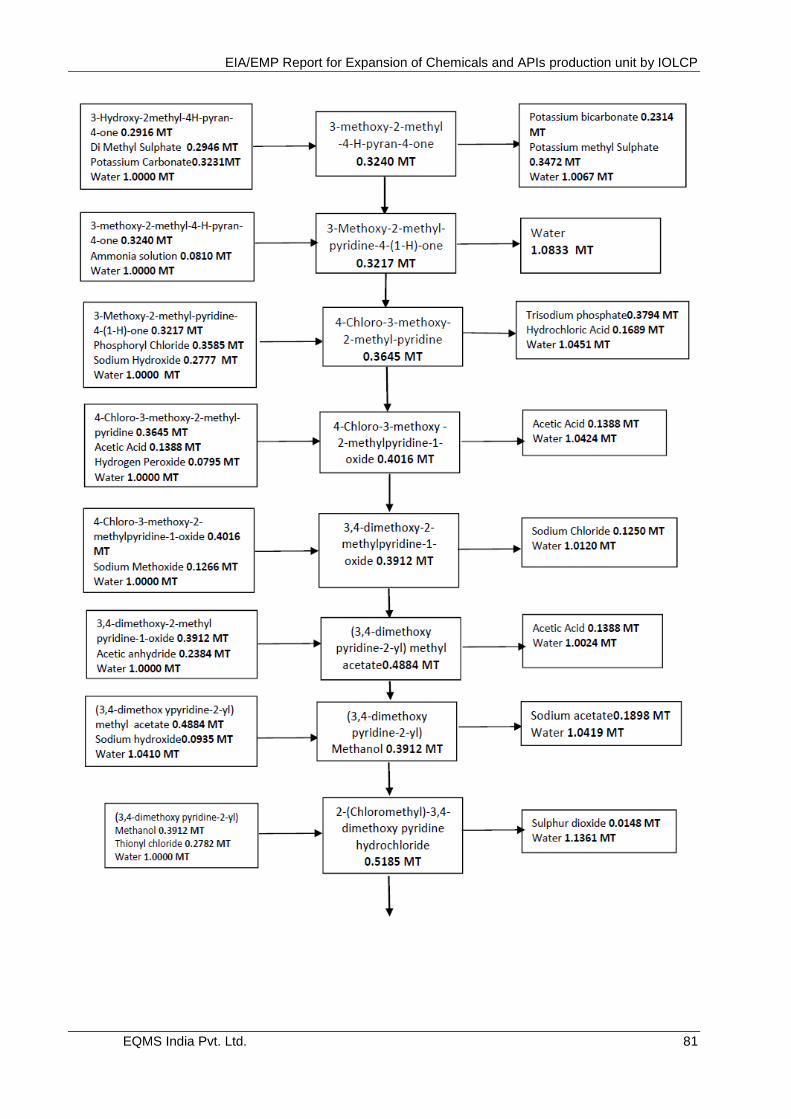
EIA/EMP Report for Expansion of Chemicals and APIs production unit by IOLCP
EQMS India Pvt. Ltd. 81
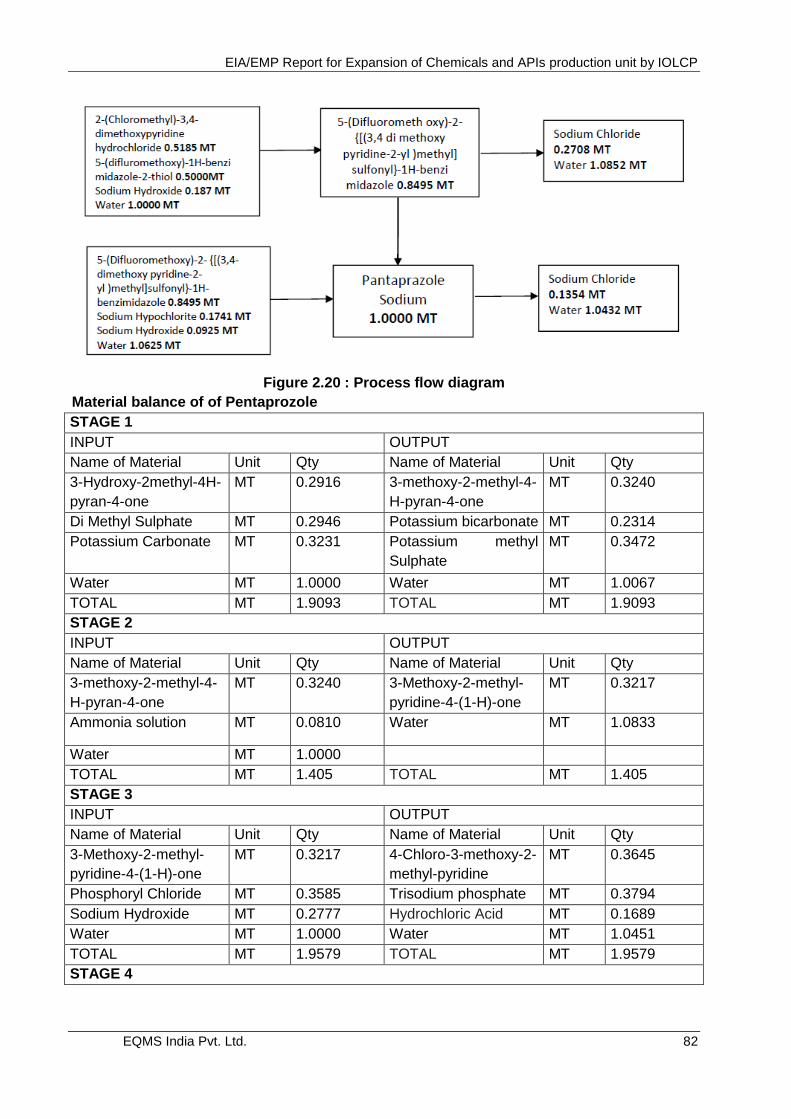
EIA/EMP Report for Expansion of Chemicals and APIs production unit by IOLCP
EQMS India Pvt. Ltd. 82
Figure 2.20 : Process flow diagram
Material balance of of Pentaprozole
STAGE 1
INPUT OUTPUT
Name of Material Unit Qty Name of Material Unit Qty
3-Hydroxy-2methyl-4H-
pyran-4-one
MT 0.2916 3-methoxy-2-methyl-4-
H-pyran-4-one
MT 0.3240
Di Methyl Sulphate MT 0.2946 Potassium bicarbonate MT 0.2314
Potassium Carbonate MT 0.3231 Potassium methyl
Sulphate
MT 0.3472
Water MT 1.0000 Water MT 1.0067
TOTAL MT 1.9093 TOTAL MT 1.9093
STAGE 2
INPUT OUTPUT
Name of Material Unit Qty Name of Material Unit Qty
3-methoxy-2-methyl-4-
H-pyran-4-one
MT 0.3240 3-Methoxy-2-methyl-
pyridine-4-(1-H)-one
MT 0.3217
Ammonia solution MT 0.0810 Water MT 1.0833
Water MT 1.0000
TOTAL MT 1.405 TOTAL MT 1.405
STAGE 3
INPUT OUTPUT
Name of Material Unit Qty Name of Material Unit Qty
3-Methoxy-2-methyl-
pyridine-4-(1-H)-one
MT 0.3217 4-Chloro-3-methoxy-2-
methyl-pyridine
MT 0.3645
Phosphoryl Chloride MT 0.3585 Trisodium phosphate MT 0.3794
Sodium Hydroxide MT 0.2777 Hydrochloric Acid MT 0.1689
Water MT 1.0000 Water MT 1.0451
TOTAL MT 1.9579 TOTAL MT 1.9579
STAGE 4
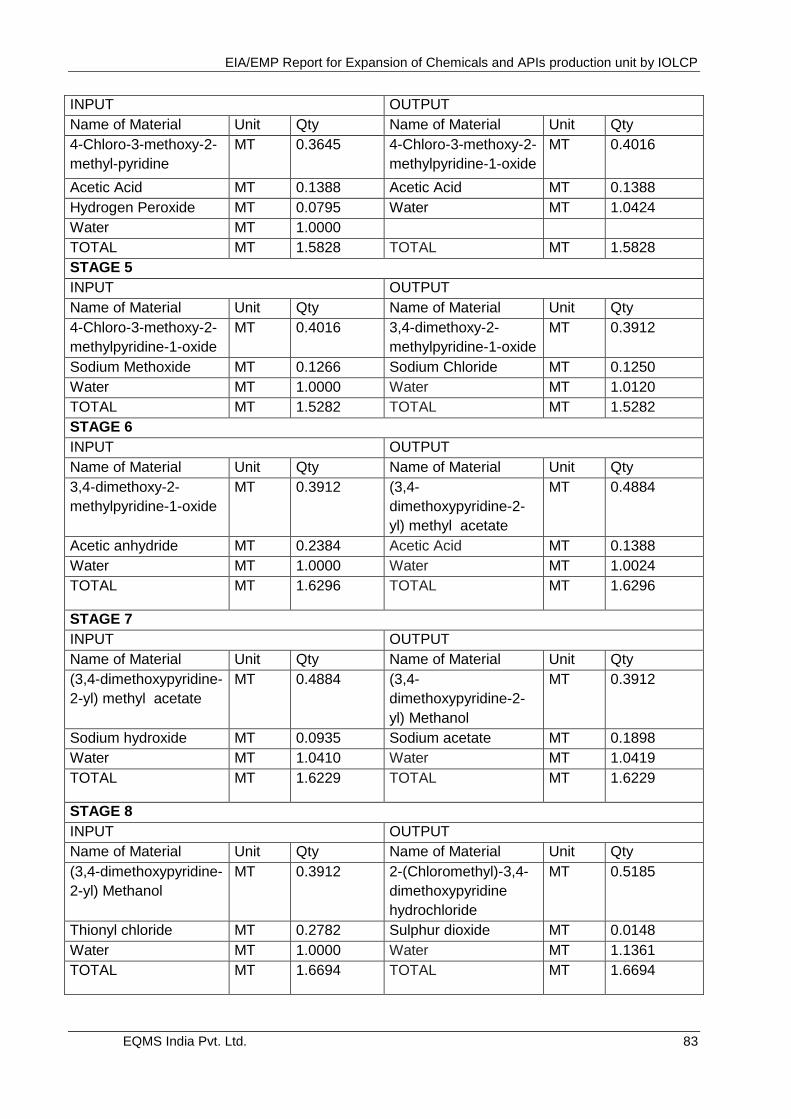
EIA/EMP Report for Expansion of Chemicals and APIs production unit by IOLCP
EQMS India Pvt. Ltd. 83
INPUT OUTPUT
Name of Material Unit Qty Name of Material Unit Qty
4-Chloro-3-methoxy-2-
methyl-pyridine
MT 0.3645 4-Chloro-3-methoxy-2-
methylpyridine-1-oxide
MT 0.4016
Acetic Acid MT 0.1388 Acetic Acid MT 0.1388
Hydrogen Peroxide MT 0.0795 Water MT 1.0424
Water MT 1.0000
TOTAL MT 1.5828 TOTAL MT 1.5828
STAGE 5
INPUT OUTPUT
Name of Material Unit Qty Name of Material Unit Qty
4-Chloro-3-methoxy-2-
methylpyridine-1-oxide
MT 0.4016 3,4-dimethoxy-2-
methylpyridine-1-oxide
MT 0.3912
Sodium Methoxide MT 0.1266 Sodium Chloride MT 0.1250
Water MT 1.0000 Water MT 1.0120
TOTAL MT 1.5282 TOTAL MT 1.5282
STAGE 6
INPUT OUTPUT
Name of Material Unit Qty Name of Material Unit Qty
3,4-dimethoxy-2-
methylpyridine-1-oxide
MT 0.3912 (3,4-
dimethoxypyridine-2-
yl) methyl acetate
MT 0.4884
Acetic anhydride MT 0.2384 Acetic Acid MT 0.1388
Water MT 1.0000 Water MT 1.0024
TOTAL MT 1.6296 TOTAL MT 1.6296
STAGE 7
INPUT OUTPUT
Name of Material Unit Qty Name of Material Unit Qty
(3,4-dimethoxypyridine-
2-yl) methyl acetate
MT 0.4884 (3,4-
dimethoxypyridine-2-
yl) Methanol
MT 0.3912
Sodium hydroxide MT 0.0935 Sodium acetate MT 0.1898
Water MT 1.0410 Water MT 1.0419
TOTAL MT 1.6229 TOTAL MT 1.6229
STAGE 8
INPUT OUTPUT
Name of Material Unit Qty Name of Material Unit Qty
(3,4-dimethoxypyridine-
2-yl) Methanol
MT 0.3912 2-(Chloromethyl)-3,4-
dimethoxypyridine
hydrochloride
MT 0.5185
Thionyl chloride MT 0.2782 Sulphur dioxide MT 0.0148
Water MT 1.0000 Water MT 1.1361
TOTAL MT 1.6694 TOTAL MT 1.6694
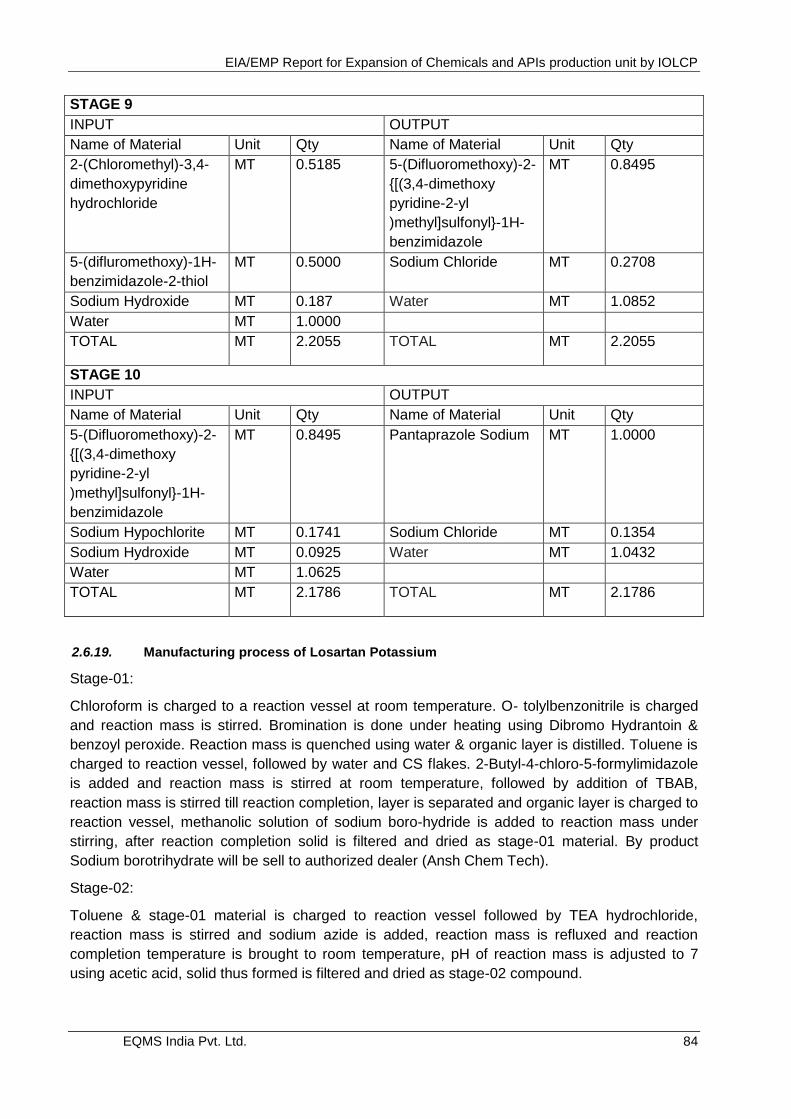
EIA/EMP Report for Expansion of Chemicals and APIs production unit by IOLCP
EQMS India Pvt. Ltd. 84
STAGE 9
INPUT OUTPUT
Name of Material Unit Qty Name of Material Unit Qty
2-(Chloromethyl)-3,4-
dimethoxypyridine
hydrochloride
MT 0.5185 5-(Difluoromethoxy)-2-
{[(3,4-dimethoxy
pyridine-2-yl
)methyl]sulfonyl}-1H-
benzimidazole
MT 0.8495
5-(difluromethoxy)-1H-
benzimidazole-2-thiol
MT 0.5000 Sodium Chloride MT 0.2708
Sodium Hydroxide MT 0.187 Water MT 1.0852
Water MT 1.0000
TOTAL MT 2.2055 TOTAL MT 2.2055
STAGE 10
INPUT OUTPUT
Name of Material Unit Qty Name of Material Unit Qty
5-(Difluoromethoxy)-2-
{[(3,4-dimethoxy
pyridine-2-yl
)methyl]sulfonyl}-1H-
benzimidazole
MT 0.8495 Pantaprazole Sodium MT 1.0000
Sodium Hypochlorite MT 0.1741 Sodium Chloride MT 0.1354
Sodium Hydroxide MT 0.0925 Water MT 1.0432
Water MT 1.0625
TOTAL MT 2.1786 TOTAL MT 2.1786
2.6.19. Manufacturing process of Losartan Potassium
Stage-01:
Chloroform is charged to a reaction vessel at room temperature. O- tolylbenzonitrile is charged
and reaction mass is stirred. Bromination is done under heating using Dibromo Hydrantoin &
benzoyl peroxide. Reaction mass is quenched using water & organic layer is distilled. Toluene is
charged to reaction vessel, followed by water and CS flakes. 2-Butyl-4-chloro-5-formylimidazole
is added and reaction mass is stirred at room temperature, followed by addition of TBAB,
reaction mass is stirred till reaction completion, layer is separated and organic layer is charged to
reaction vessel, methanolic solution of sodium boro-hydride is added to reaction mass under
stirring, after reaction completion solid is filtered and dried as stage-01 material. By product
Sodium borotrihydrate will be sell to authorized dealer (Ansh Chem Tech).
Stage-02:
Toluene & stage-01 material is charged to reaction vessel followed by TEA hydrochloride,
reaction mass is stirred and sodium azide is added, reaction mass is refluxed and reaction
completion temperature is brought to room temperature, pH of reaction mass is adjusted to 7
using acetic acid, solid thus formed is filtered and dried as stage-02 compound.
EIA/EMP Report for Expansion of Chemicals and APIs production unit by IOLCP
EQMS India Pvt. Ltd. 85
Stage-03:
IPA is charged to reaction vessel followed by KOH, reaction mass is stirred to get a clear
solution. Stage02 material is charged and stirred to get dissolved. Reaction mass is distilled and
1.5 Volume IPA is charged, reaction mass is cooled and stirred for 2 hrs. Solid is filtered and
dried to give Losartan potassium
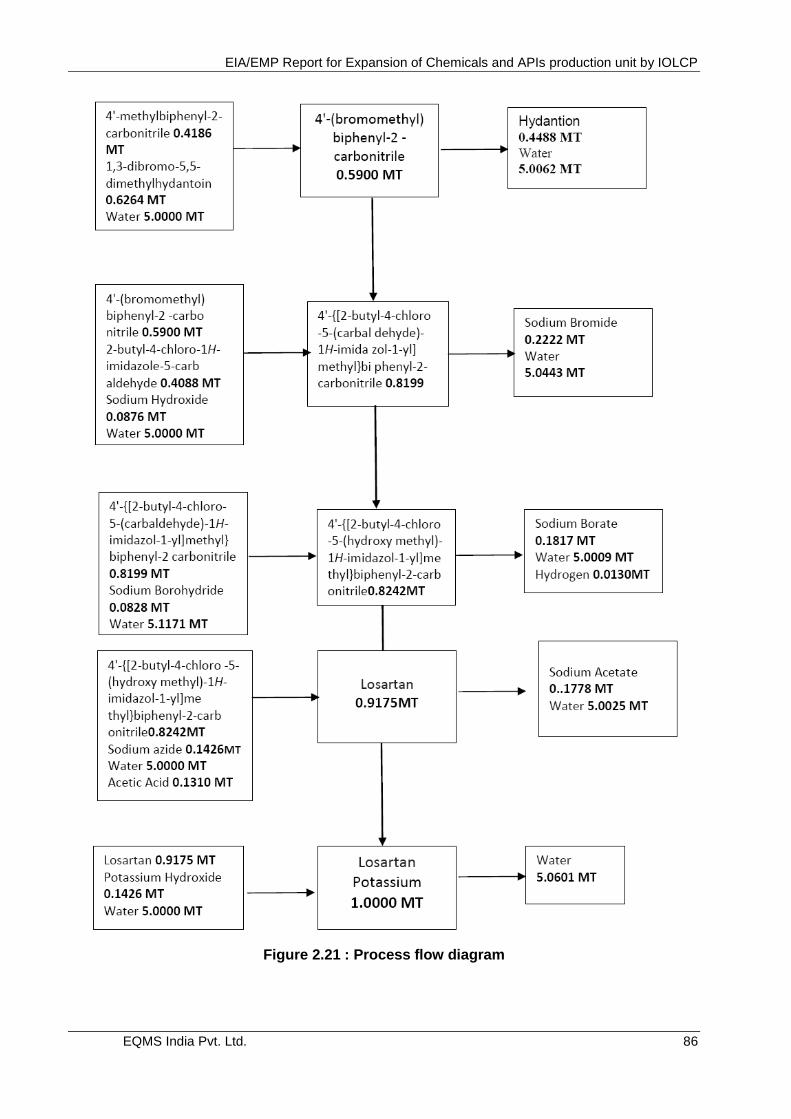
EIA/EMP Report for Expansion of Chemicals and APIs production unit by IOLCP
EQMS India Pvt. Ltd. 86
Figure 2.21 : Process flow diagram
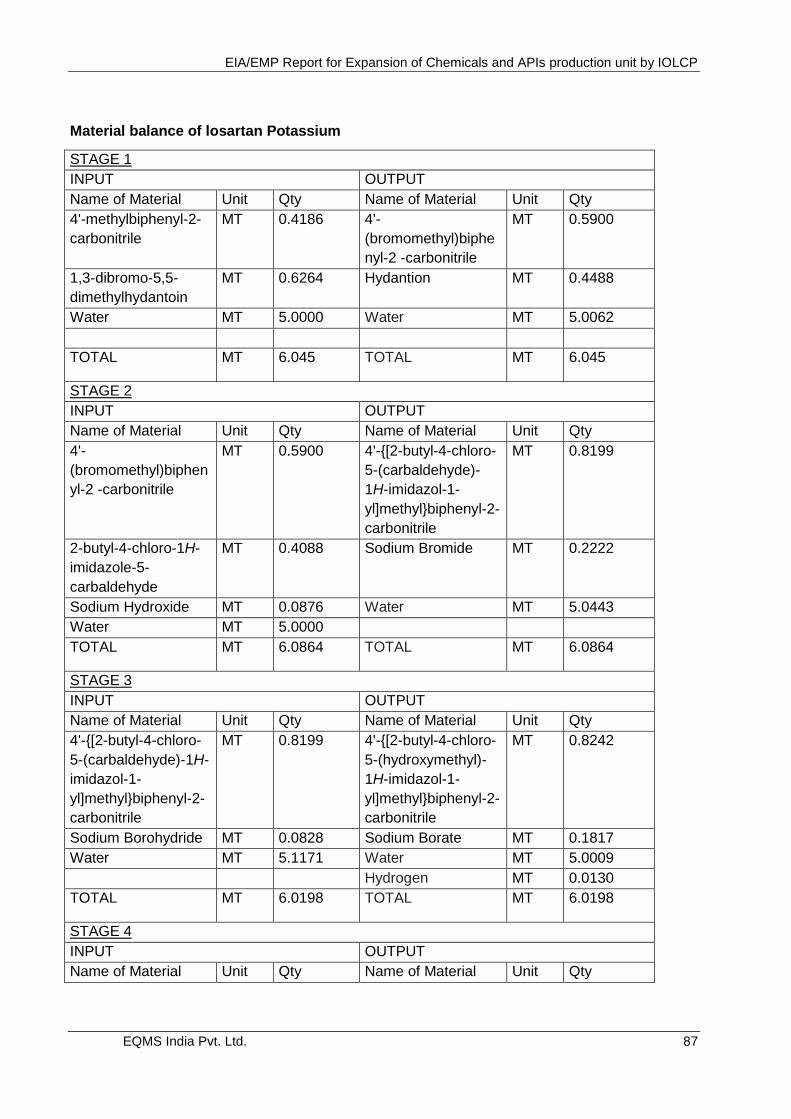
EIA/EMP Report for Expansion of Chemicals and APIs production unit by IOLCP
EQMS India Pvt. Ltd. 87
Material balance of losartan Potassium
STAGE 1
INPUT OUTPUT
Name of Material Unit Qty Name of Material Unit Qty
4'-methylbiphenyl-2-
carbonitrile
MT 0.4186 4'-
(bromomethyl)biphe
nyl-2 -carbonitrile
MT 0.5900
1,3-dibromo-5,5-
dimethylhydantoin
MT 0.6264 Hydantion MT 0.4488
Water MT 5.0000 Water MT 5.0062
TOTAL MT 6.045 TOTAL MT 6.045
STAGE 2
INPUT OUTPUT
Name of Material Unit Qty Name of Material Unit Qty
4'-
(bromomethyl)biphen
yl-2 -carbonitrile
MT 0.5900 4'-{[2-butyl-4-chloro-
5-(carbaldehyde)-
1H-imidazol-1-
yl]methyl}biphenyl-2-
carbonitrile
MT 0.8199
2-butyl-4-chloro-1H-
imidazole-5-
carbaldehyde
MT 0.4088 Sodium Bromide MT 0.2222
Sodium Hydroxide MT 0.0876 Water MT 5.0443
Water MT 5.0000
TOTAL MT 6.0864 TOTAL MT 6.0864
STAGE 3
INPUT OUTPUT
Name of Material Unit Qty Name of Material Unit Qty
4'-{[2-butyl-4-chloro-
5-(carbaldehyde)-1H-
imidazol-1-
yl]methyl}biphenyl-2-
carbonitrile
MT 0.8199 4'-{[2-butyl-4-chloro-
5-(hydroxymethyl)-
1H-imidazol-1-
yl]methyl}biphenyl-2-
carbonitrile
MT 0.8242
Sodium Borohydride MT 0.0828 Sodium Borate MT 0.1817
Water MT 5.1171 Water MT 5.0009
Hydrogen MT 0.0130
TOTAL MT 6.0198 TOTAL MT 6.0198
STAGE 4
INPUT OUTPUT
Name of Material Unit Qty Name of Material Unit Qty
EIA/EMP Report for Expansion of Chemicals and APIs production unit by IOLCP
EQMS India Pvt. Ltd. 88
4'-{[2-butyl-4-chloro-
5-(hydroxymethyl)-
1H-imidazol-1-
yl]methyl}biphenyl-2-
carbonitrile
MT 0.8242 Losartan MT 0.9175
Sodium azide MT 0.1426 Sodium Acetate MT 0.1778
Water MT 5.0000 Water MT 5.0025
Acetic Acid MT 0.1310
TOTAL MT 6.0978 TOTAL MT 6.0978
STAGE 5
INPUT OUTPUT
Name of Material Unit Qty Name of Material Unit Qty
Losartan MT 0.9175 Losartan Potassium MT 1.0000
Potassium Hydroxide MT 0.1426 Water MT 5.0601
Water MT 5.0000
TOTAL MT 6.0601 TOTAL MT 6.0601
2.6.20. Manufacturing Process of Fexofenadine
STAGE – I Formation of methyl-2-(4-(4-(4-(hydroxydiphenylmethyl)piperidin-1-
yl)butanoyl)phenyl)-2- methylpropanoate
Stage-I.
Charged DMF as asolvent in reaction vessel. Charged Diphenyl(piperidin-4-yl)methanol , Methyl-
2-(4-(4- chlorobutanoyl)phenyl)-2-methylpropanoate , K2CO3 and KI into it. Reflux for 16 hr
under stirring.
as a solvent in above reaction. After reaction completion ,quenched the reaction mass in water.
Separate organic layer and aqueous layer and extract aqueous layer with ethyl acetate and
washed organic layer with water.washing organics mass is distilled and recovered ethyl acetate
and DMF.methyl-2-(4-(4-(4- (hydroxydiphenylmethyl)piperidin-1-yl)butanoyl)phenyl)-2-
methylpropanoate used in next stage.
Stage-II.
Stage – I hydrolysed with aq. NaOH in presence of methanol. Reflux reaction mass under
stirring. After reaction completion filtered the reaction mass and proceed the solid obtained for
reduction with sodium borohydride in presence of toluene and methanol and maintain reaction
mass for 15 hr at room temperature. After reaction completion adjust ph of reaction mass with dil.
Acetic acid. Filtered the reaction mass and purified fexofenadine with iso propyl alcohol. Filtered
it and dried fexofinadine in oven.
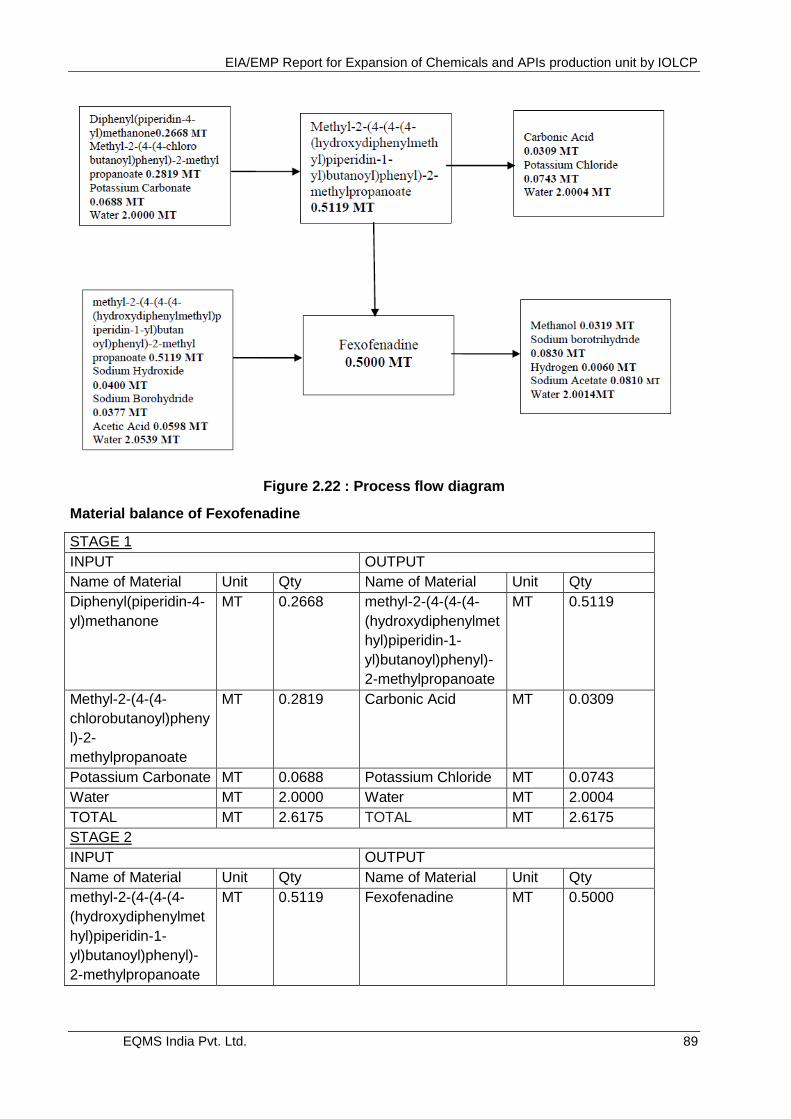
EIA/EMP Report for Expansion of Chemicals and APIs production unit by IOLCP
EQMS India Pvt. Ltd. 89
Figure 2.22 : Process flow diagram
Material balance of Fexofenadine
STAGE 1
INPUT OUTPUT
Name of Material Unit Qty Name of Material Unit Qty
Diphenyl(piperidin-4-
yl)methanone
MT 0.2668 methyl-2-(4-(4-(4-
(hydroxydiphenylmet
hyl)piperidin-1-
yl)butanoyl)phenyl)-
2-methylpropanoate
MT 0.5119
Methyl-2-(4-(4-
chlorobutanoyl)pheny
l)-2-
methylpropanoate
MT 0.2819 Carbonic Acid MT 0.0309
Potassium Carbonate MT 0.0688 Potassium Chloride MT 0.0743
Water MT 2.0000 Water MT 2.0004
TOTAL MT 2.6175 TOTAL MT 2.6175
STAGE 2
INPUT OUTPUT
Name of Material Unit Qty Name of Material Unit Qty
methyl-2-(4-(4-(4-
(hydroxydiphenylmet
hyl)piperidin-1-
yl)butanoyl)phenyl)-
2-methylpropanoate
MT 0.5119 Fexofenadine MT 0.5000
EIA/EMP Report for Expansion of Chemicals and APIs production unit by IOLCP
EQMS India Pvt. Ltd. 90
Sodium Hydroxide MT 0.0400 Methanol MT 0.0319
Sodium Borohydride MT 0.0377 Sodium
borotrihydride
MT 0.0830
Acetic Acid MT 0.0598 Hydrogen MT 0.0060
Water MT 2.0539 Sodium Acetate MT 0.0810
Water MT 2.0014
TOTAL MT 2.7033 TOTAL MT 2.7033
2.6.21. Manufacturing process of Ibuprofen sodium
Methanol is charged to a reaction vessel at room temperature followed by charging of Ibuprofen.
Reaction mass is stirred to till clarity. Reaction mass is heated & aq. Sodium Hydroxide solution
is added. Reaction mass is maintained under heating till reaction completion. After that methanol
is distilled out followed by addition of cyclohexane.
Cyclohexane is again distilled azeotropically. Reaction mass is cooled to RT & solid is filtered
& dried to give Ibuprofen sodium.
Figure 2.23 : Process flow diagram
Material balance of Ibuprofen sodium
STAGE 1
INPUT OUTPUT
Name of Material Unit Qty Name of Material Unit Qty
Ibuprofen MT 1.5610 IBU Sodium MT 2.0000
Sodium Hydroxide MT 0.3058 Water MT 5.0030
Water MT 5.1362
TOTAL MT 7.0030 TOTAL MT 7.0030
2.6.22. Manufacturing Process of CMIC Chloride
CMIC acid
Methanol and OCB are heated. HAS dissolved in water is added to the reaction mixture.
The oxime formed is brought in contact with chlorine. After chlorination is completed,
nitrogen gas is passed &methanol distillation is carried out The chloro-oxime is subjected to
neutralization by adding soda ash and recovered sodium sulphate sale to paper and glass
industries.. The pH of the reaction is adjusted between 1.0-1.2. In another flask sodium
hydroxide flakes and methanol are mixed together charged to methylacetoacetate to form
sodium salt of MAA. The sodium salt of MAA is added to chloro-oxime mass; the reaction
mass is heated & after reaction completion, cooled product is then subjected to
acidification with 20% sulphuric acid solution. The pH is maintained,after acidification the
reaction mass is filtered.

EIA/EMP Report for Expansion of Chemicals and APIs production unit by IOLCP
EQMS India Pvt. Ltd. 91
CMIC Chloride
Toluene and DMF are charged to CMIC Acid and reaction mixture is heated. Meanwhile
prepare solution of triphosgene in toluene. Slowly add the solution to reaction mixture.
Then maintain the reaction mixture, after maintaining cool the reaction mass to room temp.
Settle and separate the organic layer. Distill out toluene under vacuum. Charge n-Hexane
to oily residue.Heat to get clear reaction mass, further cool & maintain. Filter the solid under
nitrogen to give CMIC chloride.Sodium sulphate as a by-product will sell to authorized
dealer.
Figure 2.24 : Process flow diagram
2.6.23. Material balance of CMIC Chloride
STAGE 1
INPUT OUTPUT
Name of Material Unit Qty Name of Material Unit Qty
2-ChloroBenzaldehyde MT 1.0978 Oxime MT 1.215
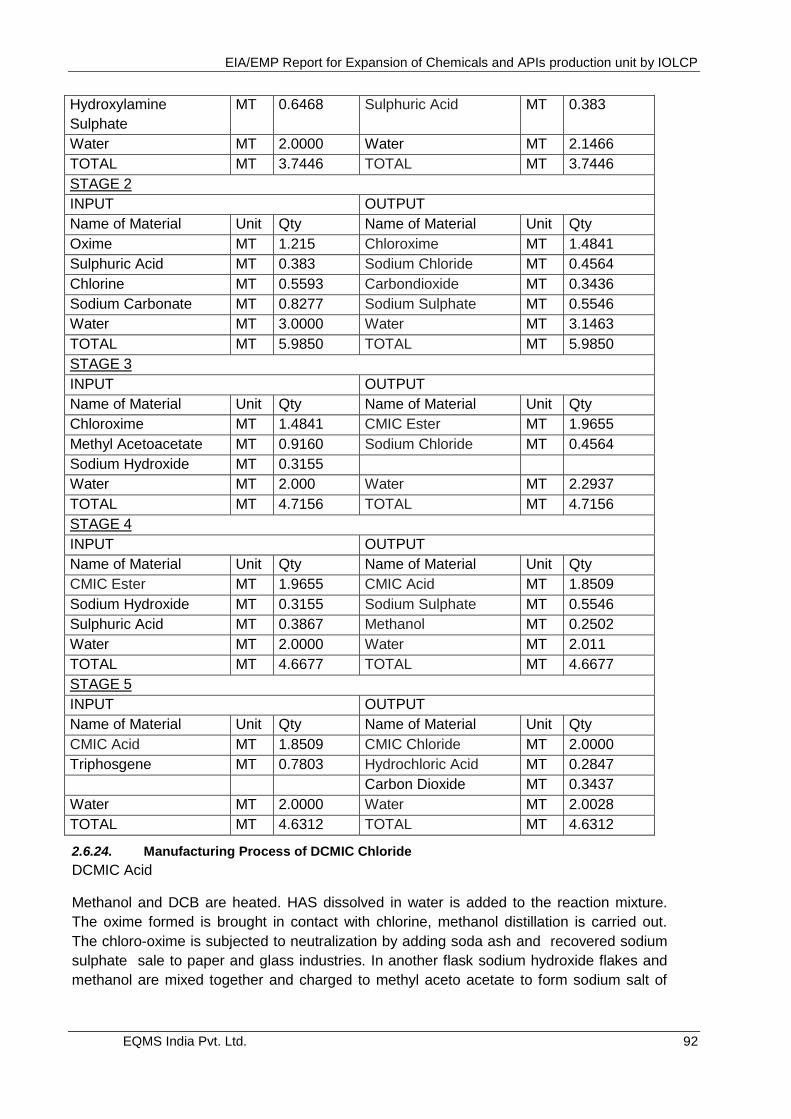
EIA/EMP Report for Expansion of Chemicals and APIs production unit by IOLCP
EQMS India Pvt. Ltd. 92
Hydroxylamine
Sulphate
MT 0.6468 Sulphuric Acid MT 0.383
Water MT 2.0000 Water MT 2.1466
TOTAL MT 3.7446 TOTAL MT 3.7446
STAGE 2
INPUT OUTPUT
Name of Material Unit Qty Name of Material Unit Qty
Oxime MT 1.215 Chloroxime MT 1.4841
Sulphuric Acid MT 0.383 Sodium Chloride MT 0.4564
Chlorine MT 0.5593 Carbondioxide MT 0.3436
Sodium Carbonate MT 0.8277 Sodium Sulphate MT 0.5546
Water MT 3.0000 Water MT 3.1463
TOTAL MT 5.9850 TOTAL MT 5.9850
STAGE 3
INPUT OUTPUT
Name of Material Unit Qty Name of Material Unit Qty
Chloroxime MT 1.4841 CMIC Ester MT 1.9655
Methyl Acetoacetate MT 0.9160 Sodium Chloride MT 0.4564
Sodium Hydroxide MT 0.3155
Water MT 2.000 Water MT 2.2937
TOTAL MT 4.7156 TOTAL MT 4.7156
STAGE 4
INPUT OUTPUT
Name of Material Unit Qty Name of Material Unit Qty
CMIC Ester MT 1.9655 CMIC Acid MT 1.8509
Sodium Hydroxide MT 0.3155 Sodium Sulphate MT 0.5546
Sulphuric Acid MT 0.3867 Methanol MT 0.2502
Water MT 2.0000 Water MT 2.011
TOTAL MT 4.6677 TOTAL MT 4.6677
STAGE 5
INPUT OUTPUT
Name of Material Unit Qty Name of Material Unit Qty
CMIC Acid MT 1.8509 CMIC Chloride MT 2.0000
Triphosgene MT 0.7803 Hydrochloric Acid MT 0.2847
Carbon Dioxide MT 0.3437
Water MT 2.0000 Water MT 2.0028
TOTAL MT 4.6312 TOTAL MT 4.6312
2.6.24. Manufacturing Process of DCMIC Chloride
DCMIC Acid
Methanol and DCB are heated. HAS dissolved in water is added to the reaction mixture.
The oxime formed is brought in contact with chlorine, methanol distillation is carried out.
The chloro-oxime is subjected to neutralization by adding soda ash and recovered sodium
sulphate sale to paper and glass industries. In another flask sodium hydroxide flakes and
methanol are mixed together and charged to methyl aceto acetate to form sodium salt of
EIA/EMP Report for Expansion of Chemicals and APIs production unit by IOLCP
EQMS India Pvt. Ltd. 93
MAA. The sodium salt of MAA is added to chloro- oxime mass; the reaction mass
temperature is maintained under cooling. The cooled product is then subjected to
acidification with 20% sulphuric acid solution. The pH is maintained,the reaction mass is
filtered to give DCMIC acid
DCMIC Chloride
Toluene and DMF are charged to DCMIC Acid and reaction mixture is heated. Meanwhile
prepare solution of triphosgene in toluene. Slowly add the solution to reaction mixture. After
maintaining cool the reaction mass to room temp. Settle and separate the oily layer. Distill
out toluene under vacuum. Charge n-Hexane .Heat to get clear reaction mass. Cool to RT.
and filter the solid under nitrogen. Sodium sulphate as a by-product will sell to authorized
dealer.
EIA/EMP Report for Expansion of Chemicals and APIs production unit by IOLCP
EQMS India Pvt. Ltd. 94
Figure 2.25 : Process flow diagram

EIA/EMP Report for Expansion of Chemicals and APIs production unit by IOLCP
EQMS India Pvt. Ltd. 95
Material balance of DCMIC Chloride
STAGE 1
INPUT OUTPUT
Name of Material Unit Qty Name of Material Unit Qty
DiChloroBenzaldehyde MT 0.3011 Oxime MT 0.3270
Hydroxylamine
Sulphate
MT 0.1431 Sulphuric Acid MT 0.0843
Water MT 1.0000 Water MT 1.0329
TOTAL MT 1.4442 TOTAL MT 1.4442
STAGE 2
INPUT OUTPUT
Name of Material Unit Qty Name of Material Unit Qty
Oxime MT 0.3270 Chloroxime MT 0.3863
Sulphuric Acid MT 0.0840 Sodium Chloride MT 0.1005
Chlorine MT 0.1232 Carbondioxide MT 0.075
Sodium Carbonate MT 0.1823 Sodium Sulphate MT 0.1222
Water MT 2.0000 Water MT 2.0325
TOTAL MT 2.7165 TOTAL MT 2.7165
STAGE 3
INPUT OUTPUT
Name of Material Unit Qty Name of Material Unit Qty
Chloroxime MT 0.3863 DCMIC Ester MT 0.4923
Methyl Acetoacetate MT 0.1998 Sodium Chloride MT 0.1006
Sodium Hydroxide MT 0.069 Water MT 1.0622
Water MT 1.000
TOTAL MT 1.6551 TOTAL MT 1.6551
STAGE 4
INPUT OUTPUT
Name of Material Unit Qty Name of Material Unit Qty
DCMIC Ester MT 0.4923 DCMIC Acid MT 0.4682
Sodium Hydroxide MT 0.069 Sodium Sulphate MT 0.2444
Sulphuric Acid MT 0.0852 Methanol MT 0.055
Water MT 1.0000 Water MT 1.011
TOTAL MT 1.6465 TOTAL MT 1.6465
STAGE 5
INPUT OUTPUT
Name of Material Unit Qty Name of Material Unit Qty
DCMIC Acid MT 0.4682 DICMIC Chloride MT 0.5000
Triphosgene MT 0.1719 Hydrochloric Acid MT 0.0620
Water MT 1.000 Carbon Dioxide MT 0.075
Water MT 1.0031
TOTAL MT 1.6401 TOTAL MT 1.6401
EIA/EMP Report for Expansion of Chemicals and APIs production unit by IOLCP
EQMS India Pvt. Ltd. 96
2.6.25. Manufacturing Process of FCMIC Chloride
FCMIC Acid
Methanol and 2-chloro-6-fluorobenzaldehyde are heated, HAS dissolved in water is added
to the reaction mixture and reaction is maintained. The oxime formed is brought in contact
with chlorine. After chlorination is completed, methanol distillation is carried out. The
Fluorochloro-oxime is subjected to neutralization by adding soda ash recovered sodium
sulphate sale to paper and glass industries. In another flask sodium hydroxide flakes and
methanol are mixed together to prepare sodium methoxide solution &Charged to
methylacetoacetate to form sodium salt of MAA. The sodium salt of MAA is added to chloro-
oxime mass. The above reaction is subjected to methanol distillation under atmospheric
condition.The cooled product is then subjected to acidification with 20% sulphuric acid
solution. After acidification the reaction mass is filtered.
FCMIC Chloride
Toluene and DMF are charged to FCMIC Acid and reaction mixture is heated. Meanwhile
prepare solution of triphosgene in toluene. Slowly add the solution to reaction mixture.
Then maintain the reaction mixture. After maintaining cool the reaction mass to room
temp. Settle and separate the oily layer. Distill out toluene under vacuum. Charge n-Hexane
.Heat to get clear reaction mass. cool and filter the solid under nitrogen. Sodium sulphate as
a by-product will be sell to authorized dealer.
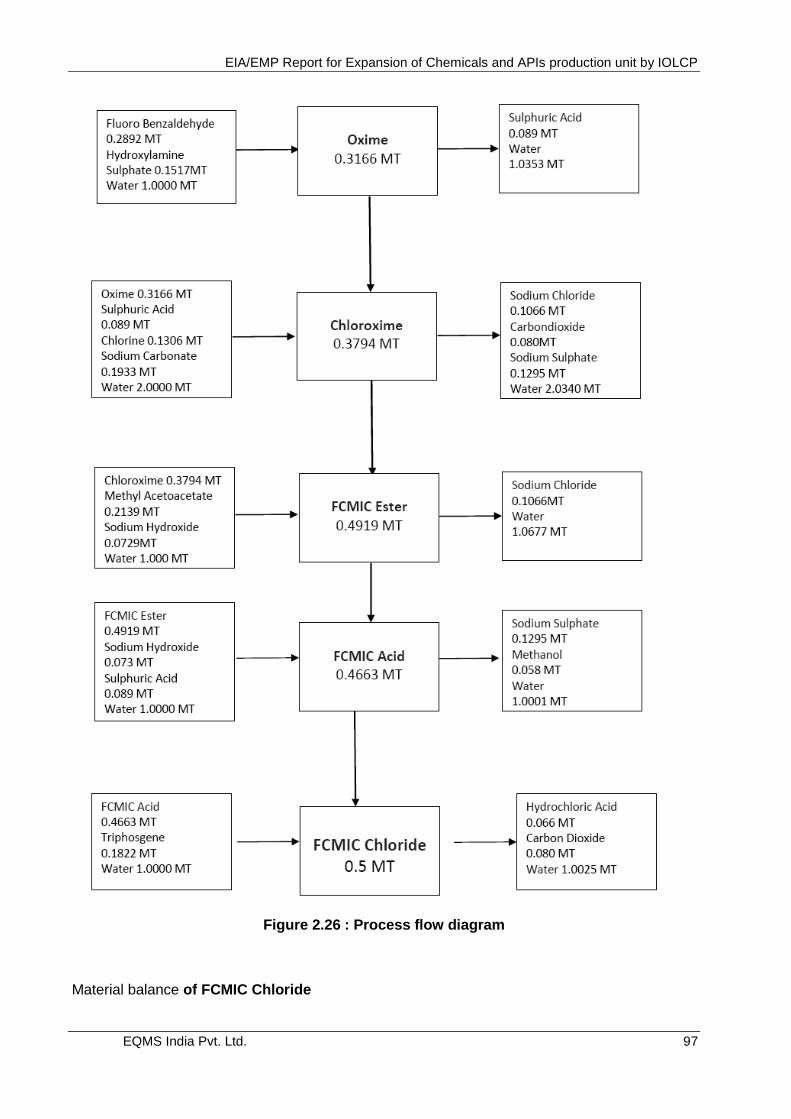
EIA/EMP Report for Expansion of Chemicals and APIs production unit by IOLCP
EQMS India Pvt. Ltd. 97
Figure 2.26 : Process flow diagram
Material balance of FCMIC Chloride
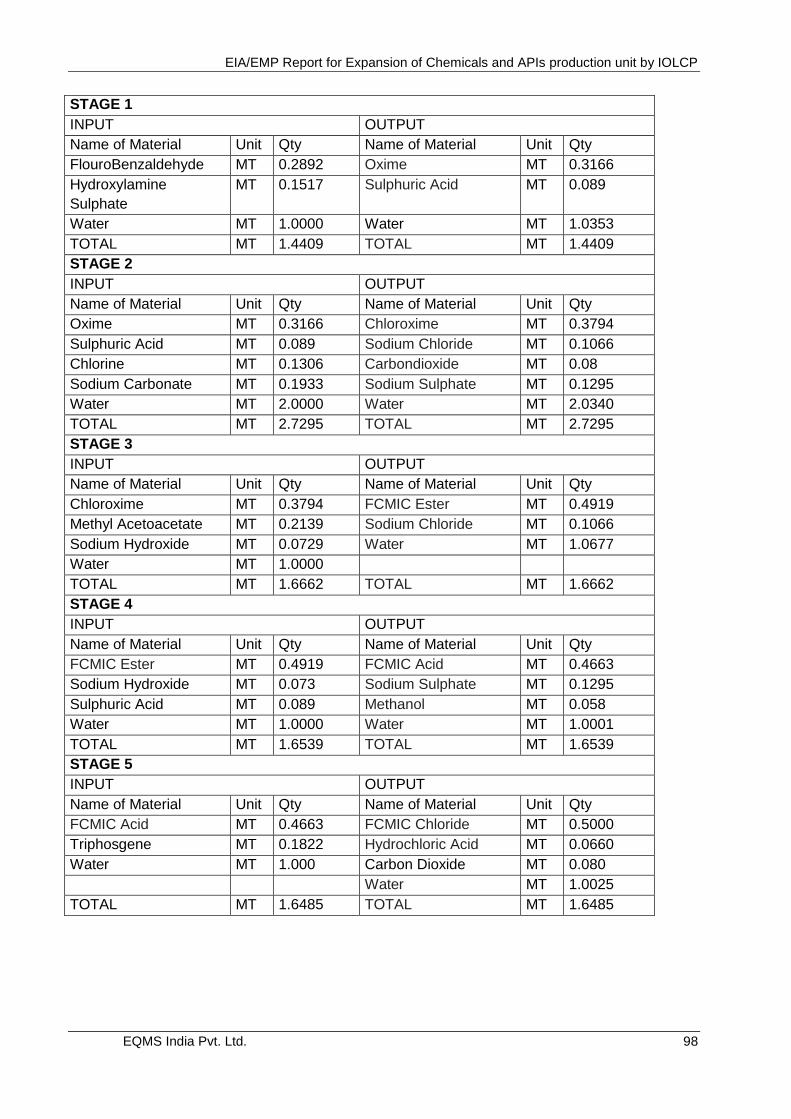
EIA/EMP Report for Expansion of Chemicals and APIs production unit by IOLCP
EQMS India Pvt. Ltd. 98
STAGE 1
INPUT OUTPUT
Name of Material Unit Qty Name of Material Unit Qty
FlouroBenzaldehyde MT 0.2892 Oxime MT 0.3166
Hydroxylamine
Sulphate
MT 0.1517 Sulphuric Acid MT 0.089
Water MT 1.0000 Water MT 1.0353
TOTAL MT 1.4409 TOTAL MT 1.4409
STAGE 2
INPUT OUTPUT
Name of Material Unit Qty Name of Material Unit Qty
Oxime MT 0.3166 Chloroxime MT 0.3794
Sulphuric Acid MT 0.089 Sodium Chloride MT 0.1066
Chlorine MT 0.1306 Carbondioxide MT 0.08
Sodium Carbonate MT 0.1933 Sodium Sulphate MT 0.1295
Water MT 2.0000 Water MT 2.0340
TOTAL MT 2.7295 TOTAL MT 2.7295
STAGE 3
INPUT OUTPUT
Name of Material Unit Qty Name of Material Unit Qty
Chloroxime MT 0.3794 FCMIC Ester MT 0.4919
Methyl Acetoacetate MT 0.2139 Sodium Chloride MT 0.1066
Sodium Hydroxide MT 0.0729 Water MT 1.0677
Water MT 1.0000
TOTAL MT 1.6662 TOTAL MT 1.6662
STAGE 4
INPUT OUTPUT
Name of Material Unit Qty Name of Material Unit Qty
FCMIC Ester MT 0.4919 FCMIC Acid MT 0.4663
Sodium Hydroxide MT 0.073 Sodium Sulphate MT 0.1295
Sulphuric Acid MT 0.089 Methanol MT 0.058
Water MT 1.0000 Water MT 1.0001
TOTAL MT 1.6539 TOTAL MT 1.6539
STAGE 5
INPUT OUTPUT
Name of Material Unit Qty Name of Material Unit Qty
FCMIC Acid MT 0.4663 FCMIC Chloride MT 0.5000
Triphosgene MT 0.1822 Hydrochloric Acid MT 0.0660
Water MT 1.000 Carbon Dioxide MT 0.080
Water MT 1.0025
TOTAL MT 1.6485 TOTAL MT 1.6485
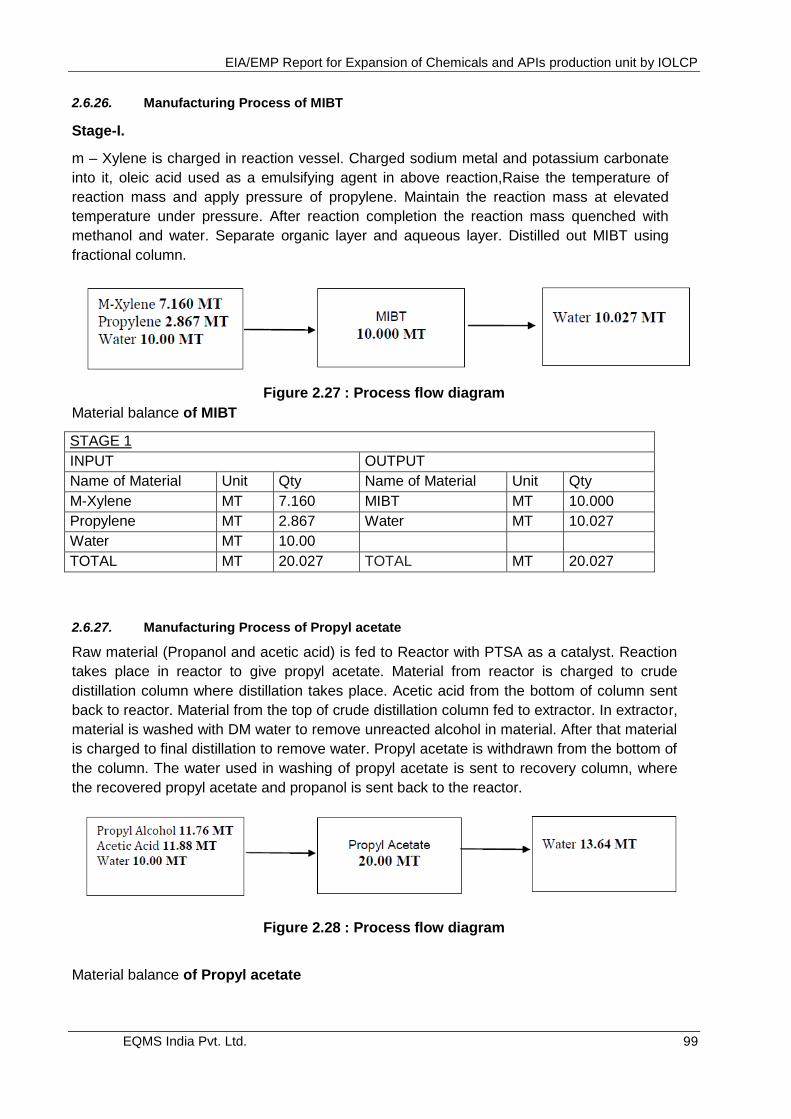
EIA/EMP Report for Expansion of Chemicals and APIs production unit by IOLCP
EQMS India Pvt. Ltd. 99
2.6.26. Manufacturing Process of MIBT
Stage-I.
m – Xylene is charged in reaction vessel. Charged sodium metal and potassium carbonate
into it, oleic acid used as a emulsifying agent in above reaction,Raise the temperature of
reaction mass and apply pressure of propylene. Maintain the reaction mass at elevated
temperature under pressure. After reaction completion the reaction mass quenched with
methanol and water. Separate organic layer and aqueous layer. Distilled out MIBT using
fractional column.
Figure 2.27 : Process flow diagram
Material balance of MIBT
STAGE 1
INPUT OUTPUT
Name of Material Unit Qty Name of Material Unit Qty
M-Xylene MT 7.160 MIBT MT 10.000
Propylene MT 2.867 Water MT 10.027
Water MT 10.00
TOTAL MT 20.027 TOTAL MT 20.027
2.6.27. Manufacturing Process of Propyl acetate
Raw material (Propanol and acetic acid) is fed to Reactor with PTSA as a catalyst. Reaction
takes place in reactor to give propyl acetate. Material from reactor is charged to crude
distillation column where distillation takes place. Acetic acid from the bottom of column sent
back to reactor. Material from the top of crude distillation column fed to extractor. In extractor,
material is washed with DM water to remove unreacted alcohol in material. After that material
is charged to final distillation to remove water. Propyl acetate is withdrawn from the bottom of
the column. The water used in washing of propyl acetate is sent to recovery column, where
the recovered propyl acetate and propanol is sent back to the reactor.
Figure 2.28 : Process flow diagram
Material balance of Propyl acetate
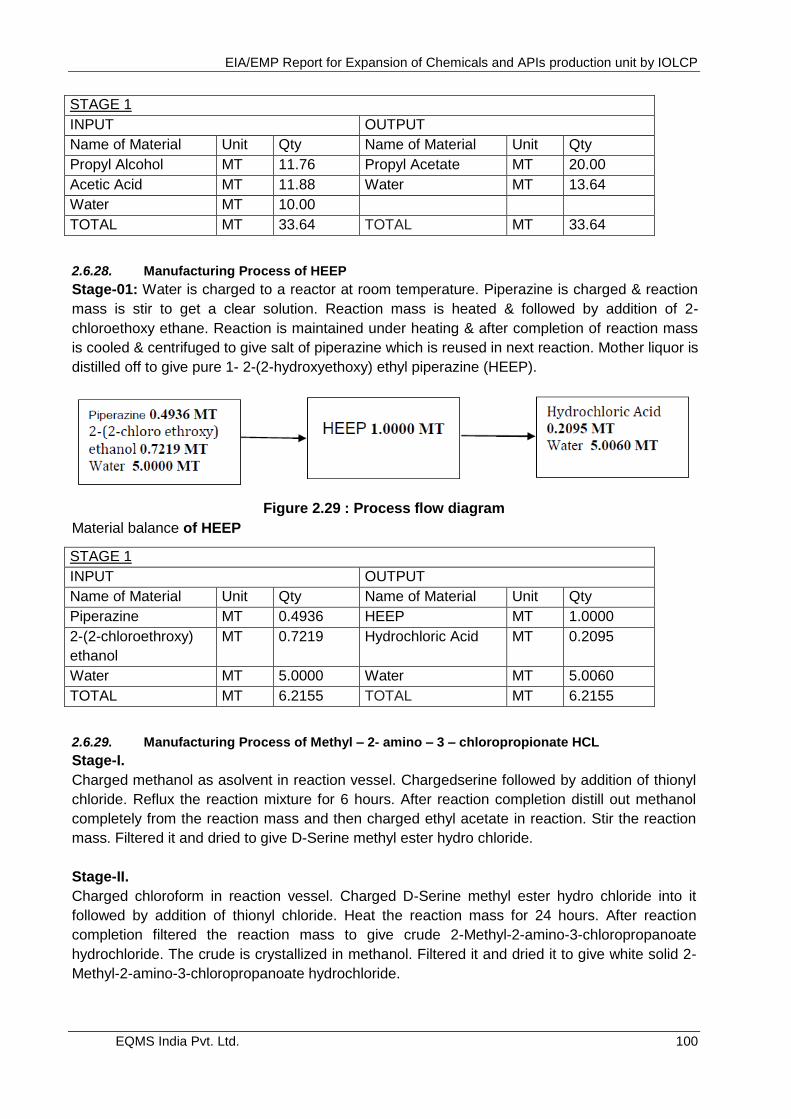
EIA/EMP Report for Expansion of Chemicals and APIs production unit by IOLCP
EQMS India Pvt. Ltd. 100
STAGE 1
INPUT OUTPUT
Name of Material Unit Qty Name of Material Unit Qty
Propyl Alcohol MT 11.76 Propyl Acetate MT 20.00
Acetic Acid MT 11.88 Water MT 13.64
Water MT 10.00
TOTAL MT 33.64 TOTAL MT 33.64
2.6.28. Manufacturing Process of HEEP
Stage-01: Water is charged to a reactor at room temperature. Piperazine is charged & reaction
mass is stir to get a clear solution. Reaction mass is heated & followed by addition of 2-
chloroethoxy ethane. Reaction is maintained under heating & after completion of reaction mass
is cooled & centrifuged to give salt of piperazine which is reused in next reaction. Mother liquor is
distilled off to give pure 1- 2-(2-hydroxyethoxy) ethyl piperazine (HEEP).
Figure 2.29 : Process flow diagram
Material balance of HEEP
STAGE 1
INPUT OUTPUT
Name of Material Unit Qty Name of Material Unit Qty
Piperazine MT 0.4936 HEEP MT 1.0000
2-(2-chloroethroxy)
ethanol
MT 0.7219 Hydrochloric Acid MT 0.2095
Water MT 5.0000 Water MT 5.0060
TOTAL MT 6.2155 TOTAL MT 6.2155
2.6.29. Manufacturing Process of Methyl – 2- amino – 3 – chloropropionate HCL
Stage-I.
Charged methanol as asolvent in reaction vessel. Chargedserine followed by addition of thionyl
chloride. Reflux the reaction mixture for 6 hours. After reaction completion distill out methanol
completely from the reaction mass and then charged ethyl acetate in reaction. Stir the reaction
mass. Filtered it and dried to give D-Serine methyl ester hydro chloride.
Stage-II.
Charged chloroform in reaction vessel. Charged D-Serine methyl ester hydro chloride into it
followed by addition of thionyl chloride. Heat the reaction mass for 24 hours. After reaction
completion filtered the reaction mass to give crude 2-Methyl-2-amino-3-chloropropanoate
hydrochloride. The crude is crystallized in methanol. Filtered it and dried it to give white solid 2-
Methyl-2-amino-3-chloropropanoate hydrochloride.
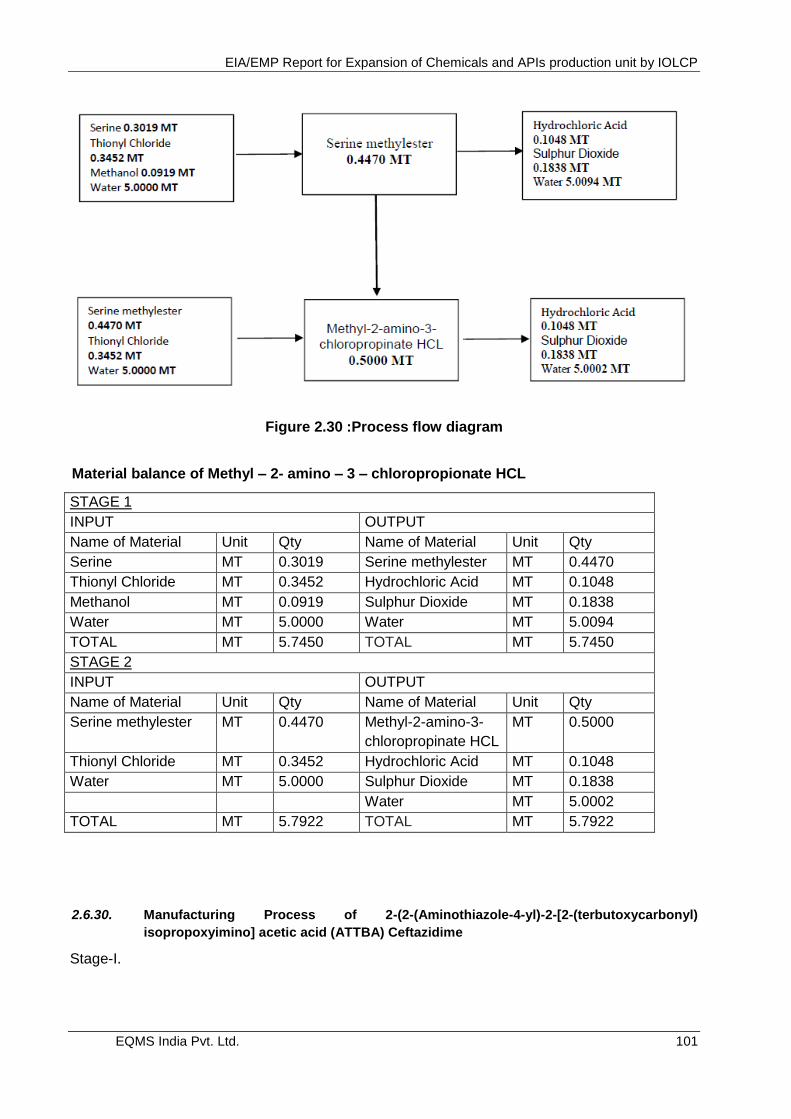
EIA/EMP Report for Expansion of Chemicals and APIs production unit by IOLCP
EQMS India Pvt. Ltd. 101
Figure 2.30 :Process flow diagram
Material balance of Methyl – 2- amino – 3 – chloropropionate HCL
STAGE 1
INPUT OUTPUT
Name of Material Unit Qty Name of Material Unit Qty
Serine MT 0.3019 Serine methylester MT 0.4470
Thionyl Chloride MT 0.3452 Hydrochloric Acid MT 0.1048
Methanol MT 0.0919 Sulphur Dioxide MT 0.1838
Water MT 5.0000 Water MT 5.0094
TOTAL MT 5.7450 TOTAL MT 5.7450
STAGE 2
INPUT OUTPUT
Name of Material Unit Qty Name of Material Unit Qty
Serine methylester MT 0.4470 Methyl-2-amino-3-
chloropropinate HCL
MT 0.5000
Thionyl Chloride MT 0.3452 Hydrochloric Acid MT 0.1048
Water MT 5.0000 Sulphur Dioxide MT 0.1838
Water MT 5.0002
TOTAL MT 5.7922 TOTAL MT 5.7922
2.6.30. Manufacturing Process of 2-(2-(Aminothiazole-4-yl)-2-[2-(terbutoxycarbonyl)
isopropoxyimino] acetic acid (ATTBA) Ceftazidime
Stage-I.
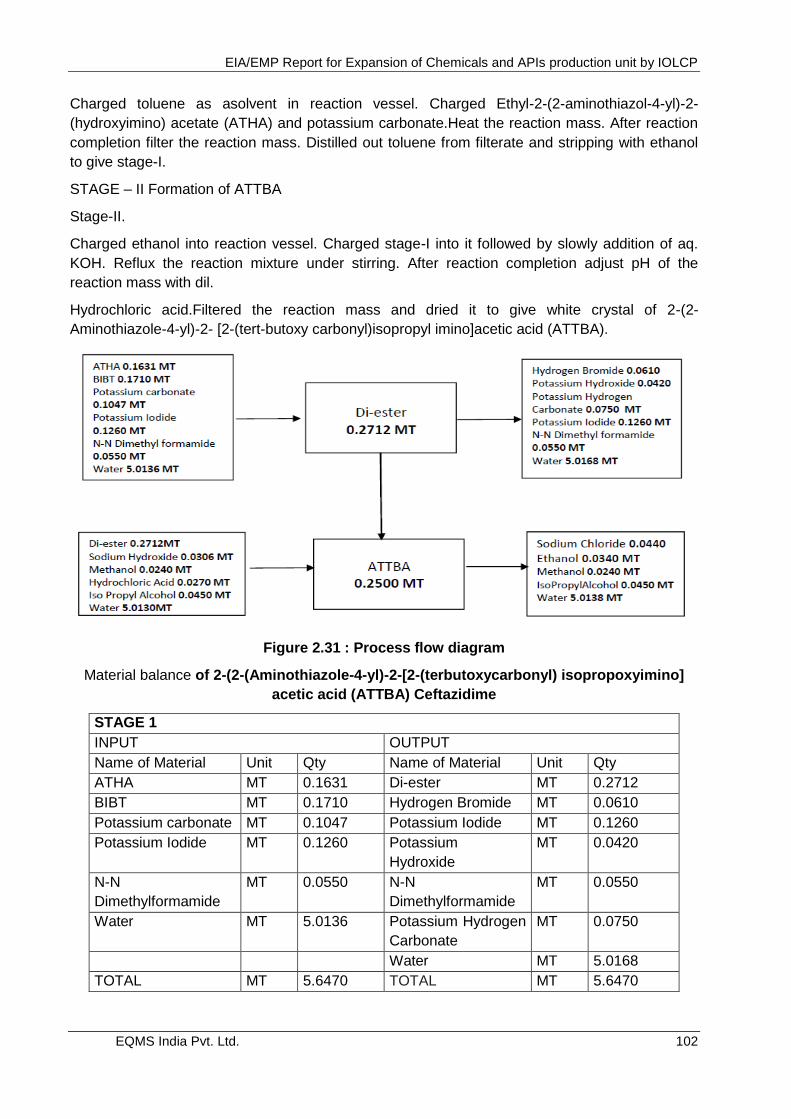
EIA/EMP Report for Expansion of Chemicals and APIs production unit by IOLCP
EQMS India Pvt. Ltd. 102
Charged toluene as asolvent in reaction vessel. Charged Ethyl-2-(2-aminothiazol-4-yl)-2-
(hydroxyimino) acetate (ATHA) and potassium carbonate.Heat the reaction mass. After reaction
completion filter the reaction mass. Distilled out toluene from filterate and stripping with ethanol
to give stage-I.
STAGE – II Formation of ATTBA
Stage-II.
Charged ethanol into reaction vessel. Charged stage-I into it followed by slowly addition of aq.
KOH. Reflux the reaction mixture under stirring. After reaction completion adjust pH of the
reaction mass with dil.
Hydrochloric acid.Filtered the reaction mass and dried it to give white crystal of 2-(2-
Aminothiazole-4-yl)-2- [2-(tert-butoxy carbonyl)isopropyl imino]acetic acid (ATTBA).
Figure 2.31 : Process flow diagram
Material balance of 2-(2-(Aminothiazole-4-yl)-2-[2-(terbutoxycarbonyl) isopropoxyimino]
acetic acid (ATTBA) Ceftazidime
STAGE 1
INPUT OUTPUT
Name of Material Unit Qty Name of Material Unit Qty
ATHA MT 0.1631 Di-ester MT 0.2712
BIBT MT 0.1710 Hydrogen Bromide MT 0.0610
Potassium carbonate MT 0.1047 Potassium Iodide MT 0.1260
Potassium Iodide MT 0.1260 Potassium
Hydroxide
MT 0.0420
N-N
Dimethylformamide
MT 0.0550 N-N
Dimethylformamide
MT 0.0550
Water MT 5.0136 Potassium Hydrogen
Carbonate
MT 0.0750
Water MT 5.0168
TOTAL MT 5.6470 TOTAL MT 5.6470
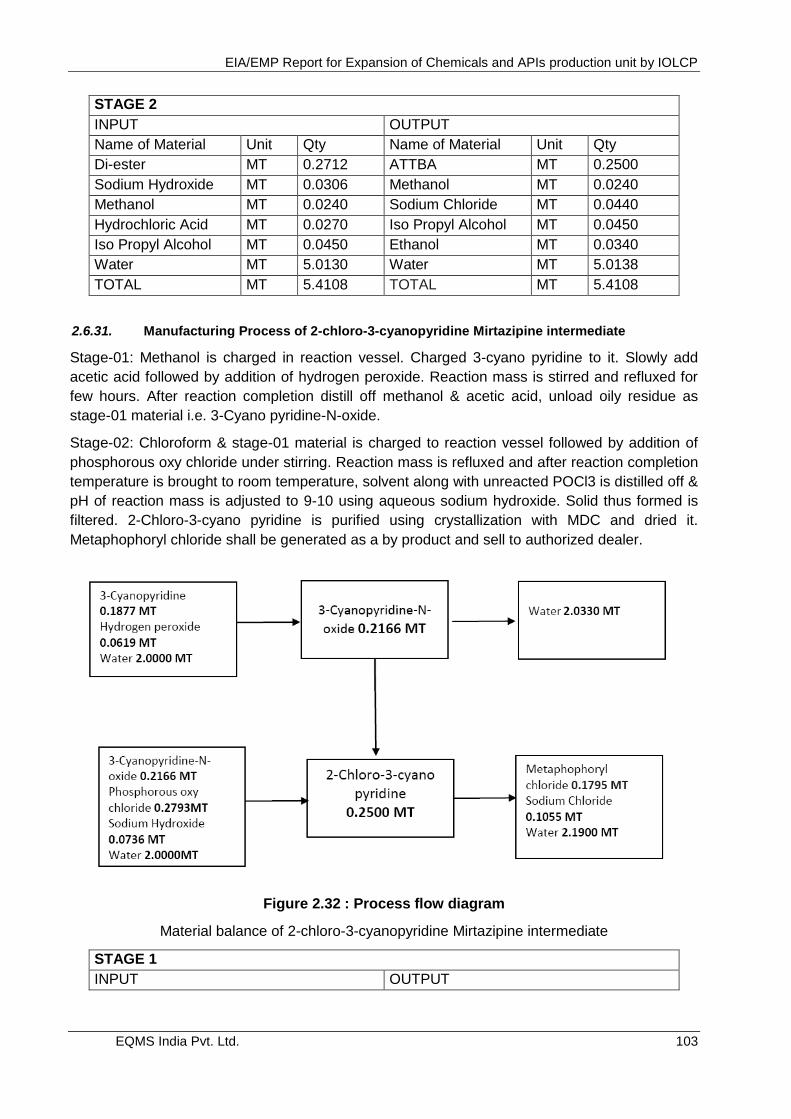
EIA/EMP Report for Expansion of Chemicals and APIs production unit by IOLCP
EQMS India Pvt. Ltd. 103
STAGE 2
INPUT OUTPUT
Name of Material Unit Qty Name of Material Unit Qty
Di-ester MT 0.2712 ATTBA MT 0.2500
Sodium Hydroxide MT 0.0306 Methanol MT 0.0240
Methanol MT 0.0240 Sodium Chloride MT 0.0440
Hydrochloric Acid MT 0.0270 Iso Propyl Alcohol MT 0.0450
Iso Propyl Alcohol MT 0.0450 Ethanol MT 0.0340
Water MT 5.0130 Water MT 5.0138
TOTAL MT 5.4108 TOTAL MT 5.4108
2.6.31. Manufacturing Process of 2-chloro-3-cyanopyridine Mirtazipine intermediate
Stage-01: Methanol is charged in reaction vessel. Charged 3-cyano pyridine to it. Slowly add
acetic acid followed by addition of hydrogen peroxide. Reaction mass is stirred and refluxed for
few hours. After reaction completion distill off methanol & acetic acid, unload oily residue as
stage-01 material i.e. 3-Cyano pyridine-N-oxide.
Stage-02: Chloroform & stage-01 material is charged to reaction vessel followed by addition of
phosphorous oxy chloride under stirring. Reaction mass is refluxed and after reaction completion
temperature is brought to room temperature, solvent along with unreacted POCl3 is distilled off &
pH of reaction mass is adjusted to 9-10 using aqueous sodium hydroxide. Solid thus formed is
filtered. 2-Chloro-3-cyano pyridine is purified using crystallization with MDC and dried it.
Metaphophoryl chloride shall be generated as a by product and sell to authorized dealer.
Figure 2.32 : Process flow diagram
Material balance of 2-chloro-3-cyanopyridine Mirtazipine intermediate
STAGE 1
INPUT OUTPUT
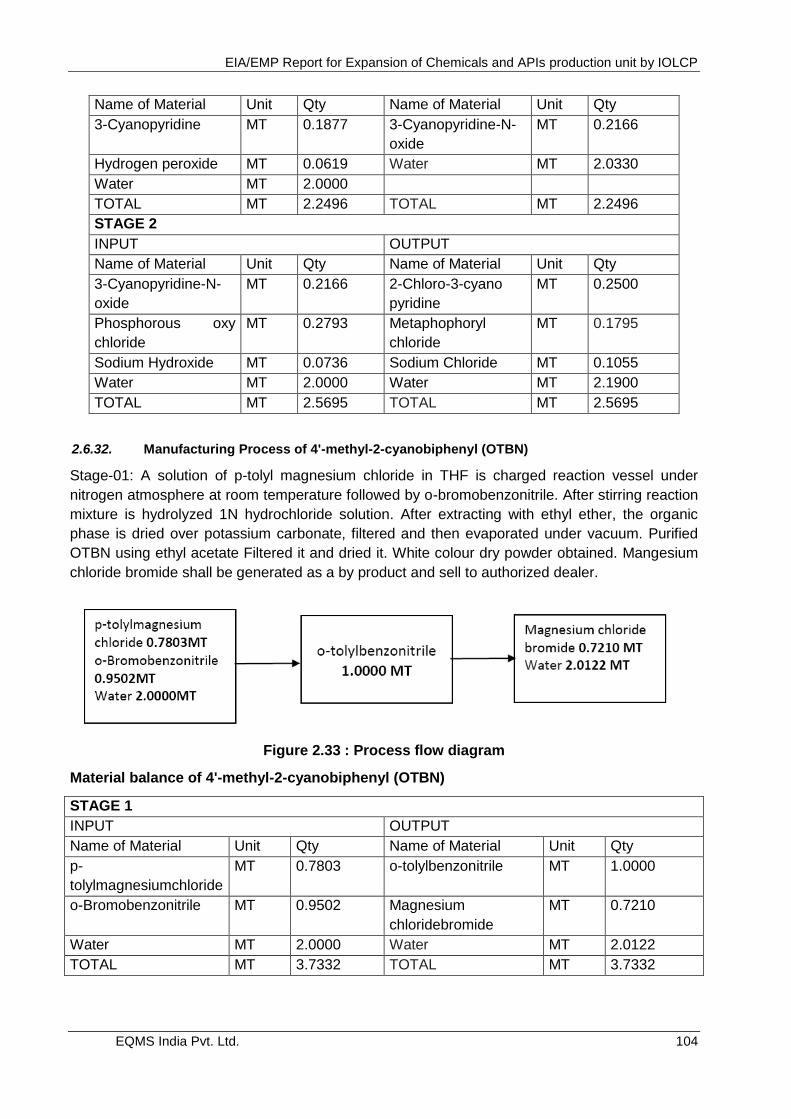
EIA/EMP Report for Expansion of Chemicals and APIs production unit by IOLCP
EQMS India Pvt. Ltd. 104
Name of Material Unit Qty Name of Material Unit Qty
3-Cyanopyridine MT 0.1877 3-Cyanopyridine-N-
oxide
MT 0.2166
Hydrogen peroxide MT 0.0619 Water MT 2.0330
Water MT 2.0000
TOTAL MT 2.2496 TOTAL MT 2.2496
STAGE 2
INPUT OUTPUT
Name of Material Unit Qty Name of Material Unit Qty
3-Cyanopyridine-N-
oxide
MT 0.2166 2-Chloro-3-cyano
pyridine
MT 0.2500
Phosphorous oxy
chloride
MT 0.2793 Metaphophoryl
chloride
MT 0.1795
Sodium Hydroxide MT 0.0736 Sodium Chloride MT 0.1055
Water MT 2.0000 Water MT 2.1900
TOTAL MT 2.5695 TOTAL MT 2.5695
2.6.32. Manufacturing Process of 4'-methyl-2-cyanobiphenyl (OTBN)
Stage-01: A solution of p-tolyl magnesium chloride in THF is charged reaction vessel under
nitrogen atmosphere at room temperature followed by o-bromobenzonitrile. After stirring reaction
mixture is hydrolyzed 1N hydrochloride solution. After extracting with ethyl ether, the organic
phase is dried over potassium carbonate, filtered and then evaporated under vacuum. Purified
OTBN using ethyl acetate Filtered it and dried it. White colour dry powder obtained. Mangesium
chloride bromide shall be generated as a by product and sell to authorized dealer.
Figure 2.33 : Process flow diagram
Material balance of 4'-methyl-2-cyanobiphenyl (OTBN)
STAGE 1
INPUT OUTPUT
Name of Material Unit Qty Name of Material Unit Qty
p-
tolylmagnesiumchloride
MT 0.7803 o-tolylbenzonitrile MT 1.0000
o-Bromobenzonitrile MT 0.9502 Magnesium
chloridebromide
MT 0.7210
Water MT 2.0000 Water MT 2.0122
TOTAL MT 3.7332 TOTAL MT 3.7332
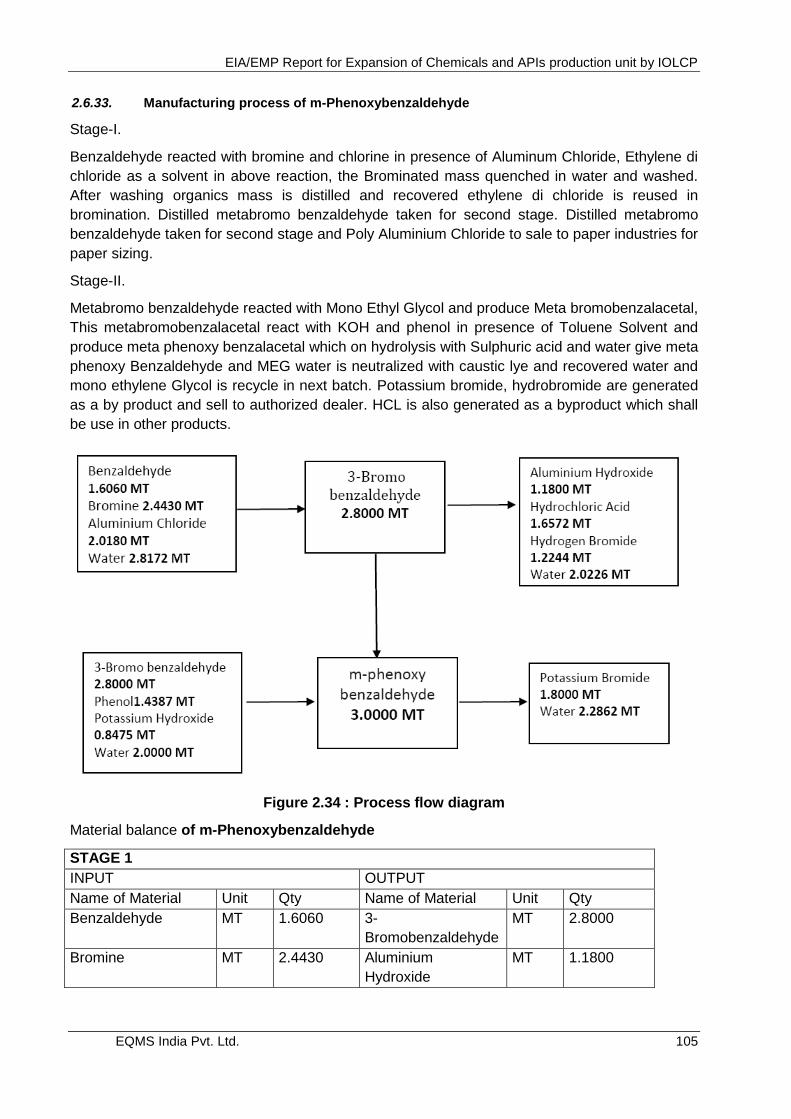
EIA/EMP Report for Expansion of Chemicals and APIs production unit by IOLCP
EQMS India Pvt. Ltd. 105
2.6.33. Manufacturing process of m-Phenoxybenzaldehyde
Stage-I.
Benzaldehyde reacted with bromine and chlorine in presence of Aluminum Chloride, Ethylene di
chloride as a solvent in above reaction, the Brominated mass quenched in water and washed.
After washing organics mass is distilled and recovered ethylene di chloride is reused in
bromination. Distilled metabromo benzaldehyde taken for second stage. Distilled metabromo
benzaldehyde taken for second stage and Poly Aluminium Chloride to sale to paper industries for
paper sizing.
Stage-II.
Metabromo benzaldehyde reacted with Mono Ethyl Glycol and produce Meta bromobenzalacetal,
This metabromobenzalacetal react with KOH and phenol in presence of Toluene Solvent and
produce meta phenoxy benzalacetal which on hydrolysis with Sulphuric acid and water give meta
phenoxy Benzaldehyde and MEG water is neutralized with caustic lye and recovered water and
mono ethylene Glycol is recycle in next batch. Potassium bromide, hydrobromide are generated
as a by product and sell to authorized dealer. HCL is also generated as a byproduct which shall
be use in other products.
Figure 2.34 : Process flow diagram
Material balance of m-Phenoxybenzaldehyde
STAGE 1
INPUT OUTPUT
Name of Material Unit Qty Name of Material Unit Qty
Benzaldehyde MT 1.6060 3-
Bromobenzaldehyde
MT 2.8000
Bromine MT 2.4430 Aluminium
Hydroxide
MT 1.1800
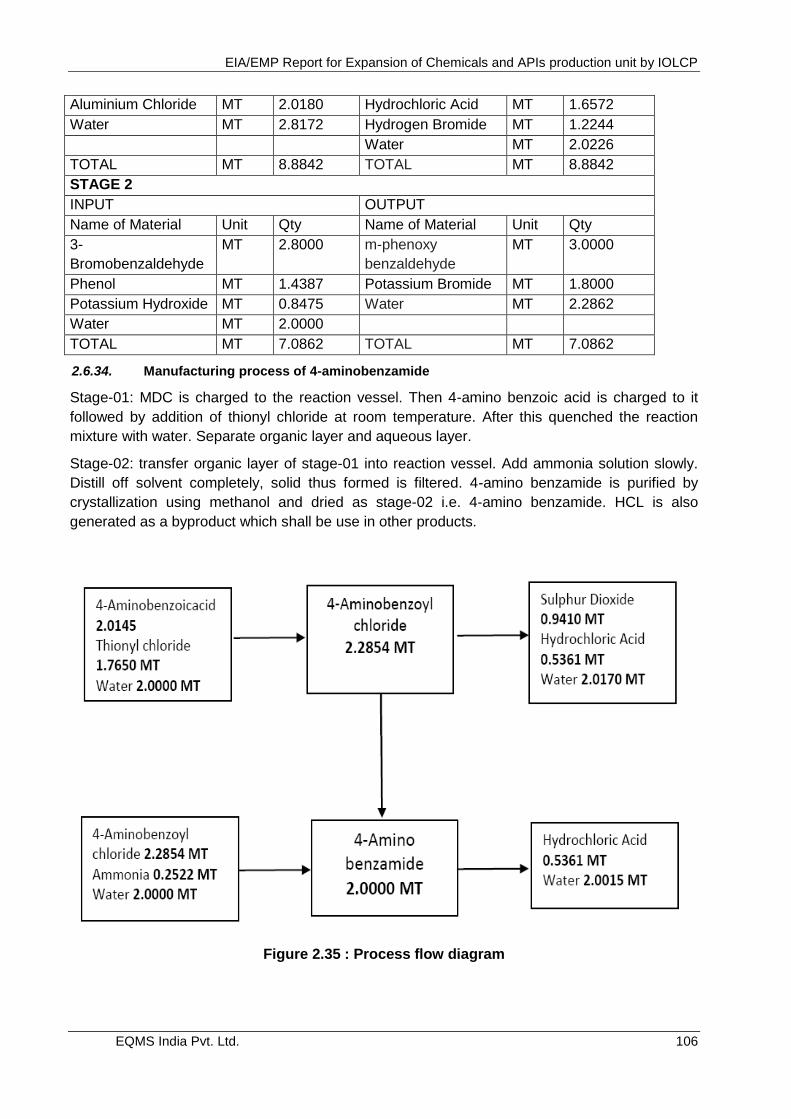
EIA/EMP Report for Expansion of Chemicals and APIs production unit by IOLCP
EQMS India Pvt. Ltd. 106
Aluminium Chloride MT 2.0180 Hydrochloric Acid MT 1.6572
Water MT 2.8172 Hydrogen Bromide MT 1.2244
Water MT 2.0226
TOTAL MT 8.8842 TOTAL MT 8.8842
STAGE 2
INPUT OUTPUT
Name of Material Unit Qty Name of Material Unit Qty
3-
Bromobenzaldehyde
MT 2.8000 m-phenoxy
benzaldehyde
MT 3.0000
Phenol MT 1.4387 Potassium Bromide MT 1.8000
Potassium Hydroxide MT 0.8475 Water MT 2.2862
Water MT 2.0000
TOTAL MT 7.0862 TOTAL MT 7.0862
2.6.34. Manufacturing process of 4-aminobenzamide
Stage-01: MDC is charged to the reaction vessel. Then 4-amino benzoic acid is charged to it
followed by addition of thionyl chloride at room temperature. After this quenched the reaction
mixture with water. Separate organic layer and aqueous layer.
Stage-02: transfer organic layer of stage-01 into reaction vessel. Add ammonia solution slowly.
Distill off solvent completely, solid thus formed is filtered. 4-amino benzamide is purified by
crystallization using methanol and dried as stage-02 i.e. 4-amino benzamide. HCL is also
generated as a byproduct which shall be use in other products.
Figure 2.35 : Process flow diagram
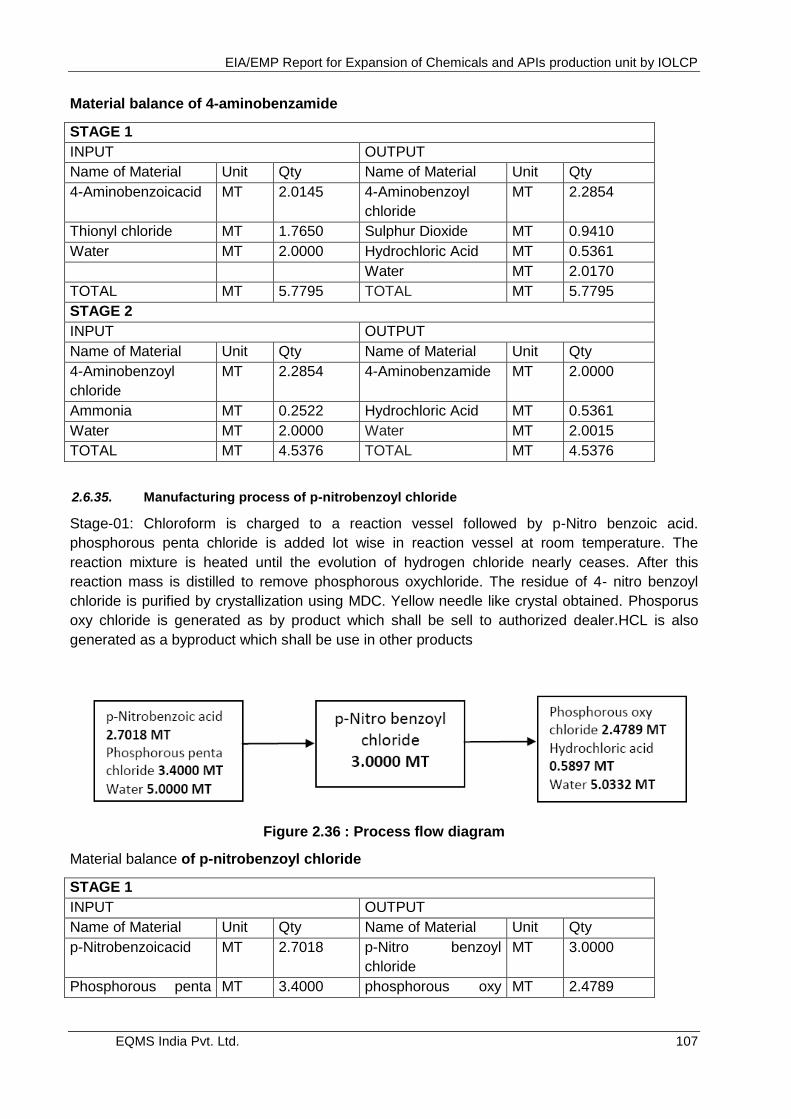
EIA/EMP Report for Expansion of Chemicals and APIs production unit by IOLCP
EQMS India Pvt. Ltd. 107
Material balance of 4-aminobenzamide
STAGE 1
INPUT OUTPUT
Name of Material Unit Qty Name of Material Unit Qty
4-Aminobenzoicacid MT 2.0145 4-Aminobenzoyl
chloride
MT 2.2854
Thionyl chloride MT 1.7650 Sulphur Dioxide MT 0.9410
Water MT 2.0000 Hydrochloric Acid MT 0.5361
Water MT 2.0170
TOTAL MT 5.7795 TOTAL MT 5.7795
STAGE 2
INPUT OUTPUT
Name of Material Unit Qty Name of Material Unit Qty
4-Aminobenzoyl
chloride
MT 2.2854 4-Aminobenzamide MT 2.0000
Ammonia MT 0.2522 Hydrochloric Acid MT 0.5361
Water MT 2.0000 Water MT 2.0015
TOTAL MT 4.5376 TOTAL MT 4.5376
2.6.35. Manufacturing process of p-nitrobenzoyl chloride
Stage-01: Chloroform is charged to a reaction vessel followed by p-Nitro benzoic acid.
phosphorous penta chloride is added lot wise in reaction vessel at room temperature. The
reaction mixture is heated until the evolution of hydrogen chloride nearly ceases. After this
reaction mass is distilled to remove phosphorous oxychloride. The residue of 4- nitro benzoyl
chloride is purified by crystallization using MDC. Yellow needle like crystal obtained. Phosporus
oxy chloride is generated as by product which shall be sell to authorized dealer.HCL is also
generated as a byproduct which shall be use in other products
Figure 2.36 : Process flow diagram
Material balance of p-nitrobenzoyl chloride
STAGE 1
INPUT OUTPUT
Name of Material Unit Qty Name of Material Unit Qty
p-Nitrobenzoicacid MT 2.7018 p-Nitro benzoyl
chloride
MT 3.0000
Phosphorous penta MT 3.4000 phosphorous oxy MT 2.4789
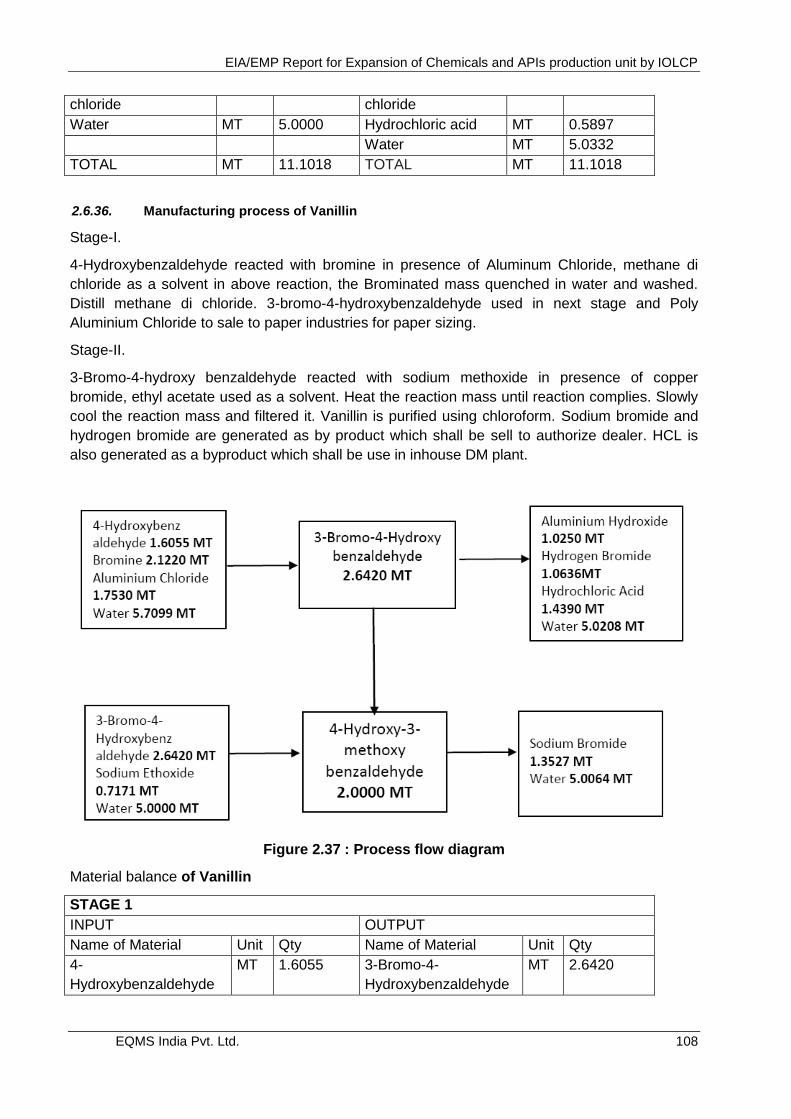
EIA/EMP Report for Expansion of Chemicals and APIs production unit by IOLCP
EQMS India Pvt. Ltd. 108
chloride chloride
Water MT 5.0000 Hydrochloric acid MT 0.5897
Water MT 5.0332
TOTAL MT 11.1018 TOTAL MT 11.1018
2.6.36. Manufacturing process of Vanillin
Stage-I.
4-Hydroxybenzaldehyde reacted with bromine in presence of Aluminum Chloride, methane di
chloride as a solvent in above reaction, the Brominated mass quenched in water and washed.
Distill methane di chloride. 3-bromo-4-hydroxybenzaldehyde used in next stage and Poly
Aluminium Chloride to sale to paper industries for paper sizing.
Stage-II.
3-Bromo-4-hydroxy benzaldehyde reacted with sodium methoxide in presence of copper
bromide, ethyl acetate used as a solvent. Heat the reaction mass until reaction complies. Slowly
cool the reaction mass and filtered it. Vanillin is purified using chloroform. Sodium bromide and
hydrogen bromide are generated as by product which shall be sell to authorize dealer. HCL is
also generated as a byproduct which shall be use in inhouse DM plant.
Figure 2.37 : Process flow diagram
Material balance of Vanillin
STAGE 1
INPUT OUTPUT
Name of Material Unit Qty Name of Material Unit Qty
4-
Hydroxybenzaldehyde
MT 1.6055 3-Bromo-4-
Hydroxybenzaldehyde
MT 2.6420
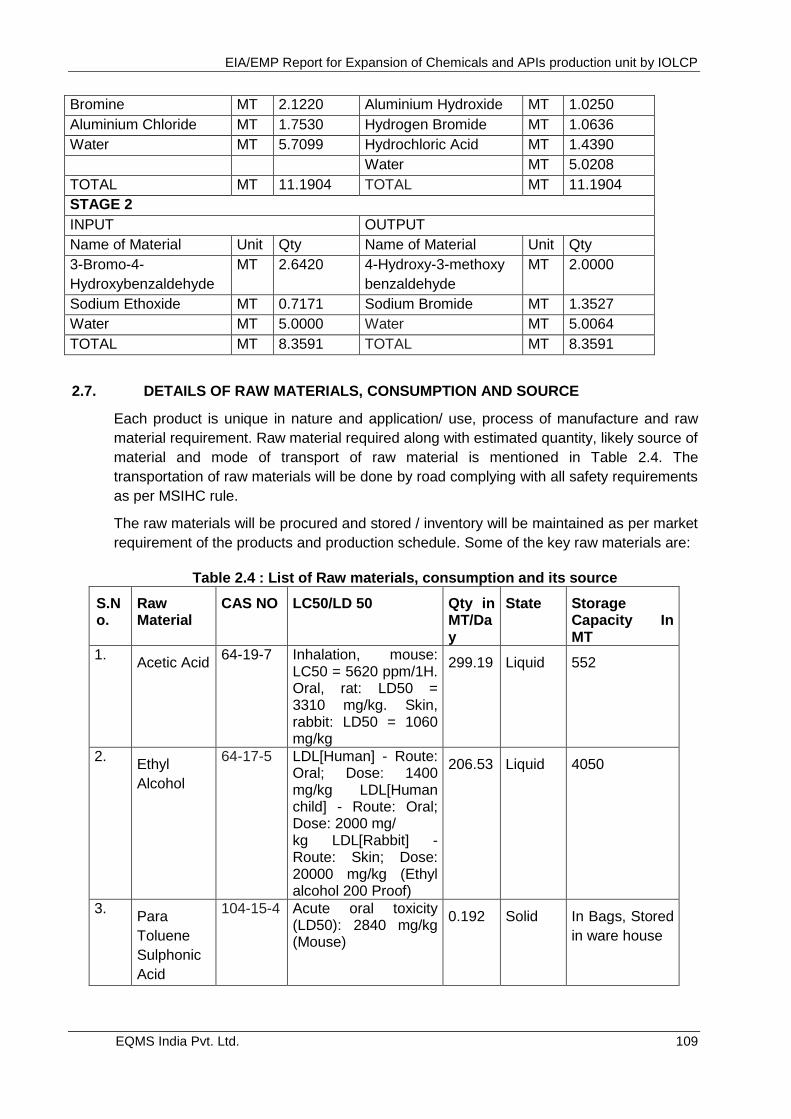
EIA/EMP Report for Expansion of Chemicals and APIs production unit by IOLCP
EQMS India Pvt. Ltd. 109
Bromine MT 2.1220 Aluminium Hydroxide MT 1.0250
Aluminium Chloride MT 1.7530 Hydrogen Bromide MT 1.0636
Water MT 5.7099 Hydrochloric Acid MT 1.4390
Water MT 5.0208
TOTAL MT 11.1904 TOTAL MT 11.1904
STAGE 2
INPUT OUTPUT
Name of Material Unit Qty Name of Material Unit Qty
3-Bromo-4-
Hydroxybenzaldehyde
MT 2.6420 4-Hydroxy-3-methoxy
benzaldehyde
MT 2.0000
Sodium Ethoxide MT 0.7171 Sodium Bromide MT 1.3527
Water MT 5.0000 Water MT 5.0064
TOTAL MT 8.3591 TOTAL MT 8.3591
2.7. DETAILS OF RAW MATERIALS, CONSUMPTION AND SOURCE
Each product is unique in nature and application/ use, process of manufacture and raw
material requirement. Raw material required along with estimated quantity, likely source of
material and mode of transport of raw material is mentioned in Table 2.4. The
transportation of raw materials will be done by road complying with all safety requirements
as per MSIHC rule.
The raw materials will be procured and stored / inventory will be maintained as per market
requirement of the products and production schedule. Some of the key raw materials are:
Table 2.4 : List of Raw materials, consumption and its source
S.No.
Raw Material
CAS NO LC50/LD 50 Qty in MT/Day
State Storage Capacity In MT
1. Acetic Acid
64-19-7 Inhalation, mouse: LC50 = 5620 ppm/1H. Oral, rat: LD50 = 3310 mg/kg. Skin, rabbit: LD50 = 1060 mg/kg
299.19 Liquid 552
2. Ethyl
Alcohol
64-17-5 LDL[Human] - Route: Oral; Dose: 1400 mg/kg LDL[Human child] - Route: Oral; Dose: 2000 mg/ kg LDL[Rabbit] - Route: Skin; Dose: 20000 mg/kg (Ethyl alcohol 200 Proof)
206.53 Liquid 4050
3. Para
Toluene
Sulphonic
Acid
104-15-4 Acute oral toxicity (LD50): 2840 mg/kg (Mouse)
0.192 Solid In Bags, Stored
in ware house
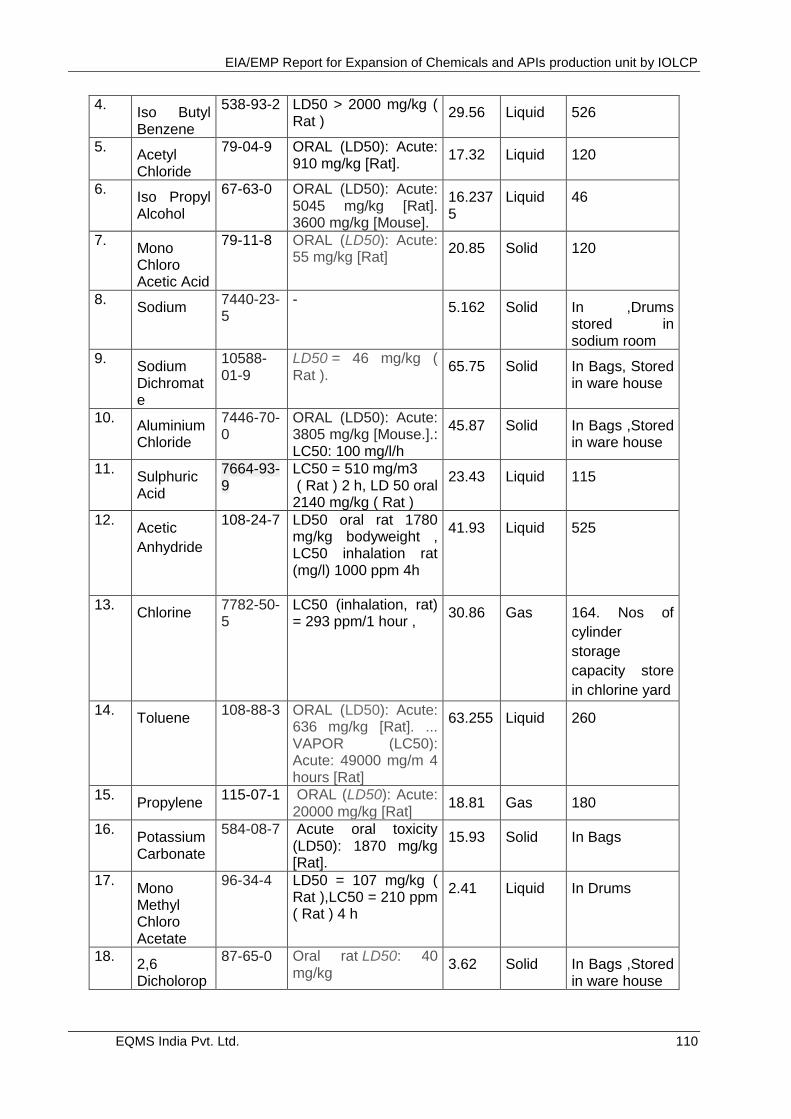
EIA/EMP Report for Expansion of Chemicals and APIs production unit by IOLCP
EQMS India Pvt. Ltd. 110
4. Iso Butyl Benzene
538-93-2 LD50 > 2000 mg/kg ( Rat )
29.56 Liquid 526
5. Acetyl Chloride
79-04-9 ORAL (LD50): Acute: 910 mg/kg [Rat].
17.32 Liquid 120
6. Iso Propyl Alcohol
67-63-0 ORAL (LD50): Acute: 5045 mg/kg [Rat]. 3600 mg/kg [Mouse].
16.2375
Liquid 46
7. Mono Chloro Acetic Acid
79-11-8 ORAL (LD50): Acute: 55 mg/kg [Rat]
20.85 Solid 120
8. Sodium
7440-23-5
- 5.162 Solid In ,Drums
stored in sodium room
9. Sodium Dichromate
10588-01-9
LD50 = 46 mg/kg ( Rat ).
65.75 Solid In Bags, Stored in ware house
10. Aluminium Chloride
7446-70-0
ORAL (LD50): Acute: 3805 mg/kg [Mouse.].: LC50: 100 mg/l/h
45.87 Solid In Bags ,Stored in ware house
11. Sulphuric Acid
7664-93-9
LC50 = 510 mg/m3 ( Rat ) 2 h, LD 50 oral 2140 mg/kg ( Rat )
23.43 Liquid 115
12. Acetic
Anhydride
108-24-7 LD50 oral rat 1780 mg/kg bodyweight , LC50 inhalation rat (mg/l) 1000 ppm 4h
41.93 Liquid 525
13. Chlorine
7782-50-5
LC50 (inhalation, rat) = 293 ppm/1 hour ,
30.86 Gas 164. Nos of
cylinder
storage
capacity store
in chlorine yard
14. Toluene
108-88-3 ORAL (LD50): Acute: 636 mg/kg [Rat]. ... VAPOR (LC50): Acute: 49000 mg/m 4 hours [Rat]
63.255 Liquid 260
15. Propylene
115-07-1 ORAL (LD50): Acute: 20000 mg/kg [Rat]
18.81 Gas 180
16. Potassium Carbonate
584-08-7 Acute oral toxicity (LD50): 1870 mg/kg [Rat].
15.93 Solid In Bags
17. Mono Methyl Chloro Acetate
96-34-4 LD50 = 107 mg/kg ( Rat ),LC50 = 210 ppm ( Rat ) 4 h
2.41 Liquid In Drums
18. 2,6 Dicholorop
87-65-0 Oral rat LD50: 40 mg/kg
3.62 Solid In Bags ,Stored in ware house
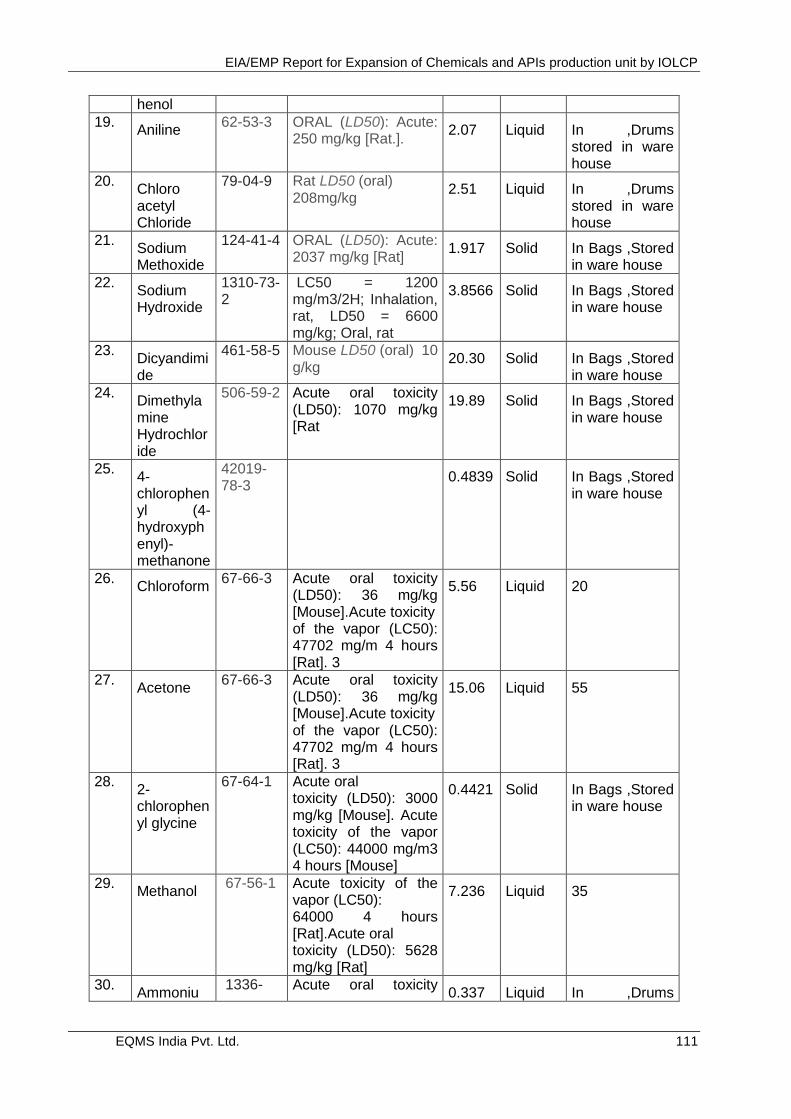
EIA/EMP Report for Expansion of Chemicals and APIs production unit by IOLCP
EQMS India Pvt. Ltd. 111
henol
19. Aniline
62-53-3 ORAL (LD50): Acute: 250 mg/kg [Rat.].
2.07 Liquid In ,Drums stored in ware house
20. Chloro acetyl Chloride
79-04-9 Rat LD50 (oral) 208mg/kg
2.51 Liquid In ,Drums stored in ware house
21. Sodium Methoxide
124-41-4 ORAL (LD50): Acute: 2037 mg/kg [Rat]
1.917 Solid In Bags ,Stored in ware house
22. Sodium Hydroxide
1310-73-2
LC50 = 1200 mg/m3/2H; Inhalation, rat, LD50 = 6600 mg/kg; Oral, rat
3.8566 Solid In Bags ,Stored in ware house
23. Dicyandimide
461-58-5 Mouse LD50 (oral) 10 g/kg
20.30 Solid In Bags ,Stored in ware house
24. Dimethylamine Hydrochloride
506-59-2 Acute oral toxicity (LD50): 1070 mg/kg [Rat
19.89 Solid In Bags ,Stored in ware house
25. 4-chlorophenyl (4-hydroxyphenyl)-methanone
42019-78-3
0.4839 Solid In Bags ,Stored
in ware house
26. Chloroform
67-66-3 Acute oral toxicity (LD50): 36 mg/kg [Mouse].Acute toxicity of the vapor (LC50): 47702 mg/m 4 hours [Rat]. 3
5.56 Liquid 20
27. Acetone
67-66-3 Acute oral toxicity (LD50): 36 mg/kg [Mouse].Acute toxicity of the vapor (LC50): 47702 mg/m 4 hours [Rat]. 3
15.06 Liquid 55
28. 2-chlorophenyl glycine
67-64-1 Acute oral toxicity (LD50): 3000 mg/kg [Mouse]. Acute toxicity of the vapor (LC50): 44000 mg/m3 4 hours [Mouse]
0.4421 Solid In Bags ,Stored in ware house
29. Methanol
67-56-1 Acute toxicity of the vapor (LC50): 64000 4 hours [Rat].Acute oral toxicity (LD50): 5628 mg/kg [Rat]
7.236 Liquid 35
30. Ammoniu
1336- Acute oral toxicity 0.337 Liquid In ,Drums
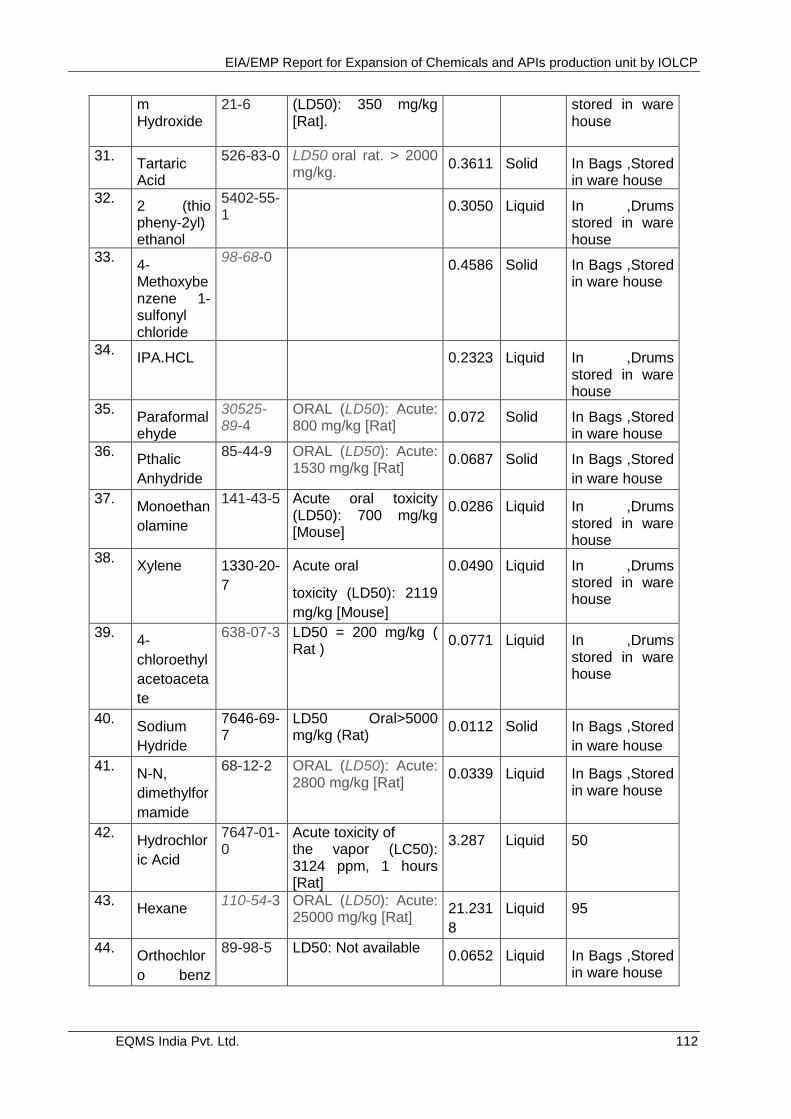
EIA/EMP Report for Expansion of Chemicals and APIs production unit by IOLCP
EQMS India Pvt. Ltd. 112
m Hydroxide
21-6 (LD50): 350 mg/kg [Rat].
stored in ware house
31. Tartaric Acid
526-83-0 LD50 oral rat. > 2000 mg/kg.
0.3611 Solid In Bags ,Stored in ware house
32. 2 (thio pheny-2yl) ethanol
5402-55-1
0.3050 Liquid In ,Drums
stored in ware house
33. 4-Methoxybenzene 1-sulfonyl chloride
98-68-0 0.4586 Solid In Bags ,Stored
in ware house
34. IPA.HCL 0.2323 Liquid In ,Drums
stored in ware house
35. Paraformalehyde
30525-89-4
ORAL (LD50): Acute: 800 mg/kg [Rat]
0.072 Solid In Bags ,Stored in ware house
36. Pthalic
Anhydride
85-44-9 ORAL (LD50): Acute: 1530 mg/kg [Rat]
0.0687 Solid In Bags ,Stored
in ware house
37. Monoethan
olamine
141-43-5 Acute oral toxicity (LD50): 700 mg/kg [Mouse]
0.0286 Liquid In ,Drums stored in ware house
38. Xylene 1330-20-
7
Acute oral
toxicity (LD50): 2119
mg/kg [Mouse]
0.0490 Liquid In ,Drums stored in ware house
39. 4-
chloroethyl
acetoaceta
te
638-07-3 LD50 = 200 mg/kg ( Rat )
0.0771 Liquid In ,Drums stored in ware house
40. Sodium
Hydride
7646-69-7
LD50 Oral>5000 mg/kg (Rat)
0.0112 Solid In Bags ,Stored
in ware house
41. N-N,
dimethylfor
mamide
68-12-2 ORAL (LD50): Acute: 2800 mg/kg [Rat]
0.0339 Liquid In Bags ,Stored in ware house
42. Hydrochlor
ic Acid
7647-01-0
Acute toxicity of the vapor (LC50): 3124 ppm, 1 hours [Rat]
3.287 Liquid 50
43. Hexane
110-54-3 ORAL (LD50): Acute: 25000 mg/kg [Rat]
21.231
8
Liquid 95
44. Orthochlor
o benz
89-98-5 LD50: Not available 0.0652 Liquid In Bags ,Stored
in ware house
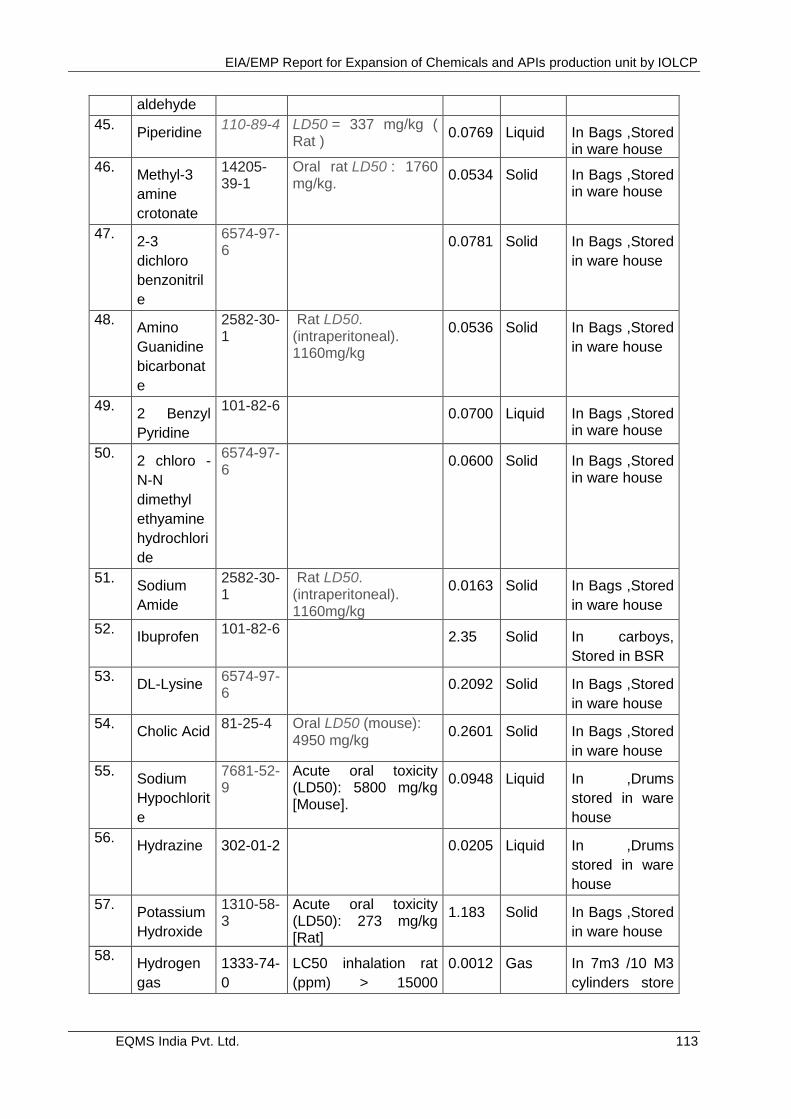
EIA/EMP Report for Expansion of Chemicals and APIs production unit by IOLCP
EQMS India Pvt. Ltd. 113
aldehyde
45. Piperidine
110-89-4 LD50 = 337 mg/kg ( Rat )
0.0769 Liquid In Bags ,Stored in ware house
46. Methyl-3
amine
crotonate
14205-39-1
Oral rat LD50 : 1760 mg/kg.
0.0534 Solid In Bags ,Stored in ware house
47. 2-3
dichloro
benzonitril
e
6574-97-6
0.0781 Solid In Bags ,Stored
in ware house
48. Amino
Guanidine
bicarbonat
e
2582-30-1
Rat LD50. (intraperitoneal). 1160mg/kg
0.0536 Solid In Bags ,Stored
in ware house
49. 2 Benzyl
Pyridine
101-82-6 0.0700 Liquid In Bags ,Stored
in ware house
50. 2 chloro -
N-N
dimethyl
ethyamine
hydrochlori
de
6574-97-6
0.0600 Solid In Bags ,Stored
in ware house
51. Sodium
Amide
2582-30-1
Rat LD50. (intraperitoneal). 1160mg/kg
0.0163 Solid In Bags ,Stored
in ware house
52. Ibuprofen
101-82-6 2.35 Solid In carboys,
Stored in BSR
53. DL-Lysine
6574-97-6
0.2092 Solid In Bags ,Stored
in ware house
54. Cholic Acid
81-25-4 Oral LD50 (mouse): 4950 mg/kg
0.2601 Solid In Bags ,Stored
in ware house
55. Sodium
Hypochlorit
e
7681-52-9
Acute oral toxicity (LD50): 5800 mg/kg [Mouse].
0.0948 Liquid In ,Drums
stored in ware
house
56. Hydrazine 302-01-2 0.0205 Liquid In ,Drums
stored in ware
house
57. Potassium
Hydroxide
1310-58-3
Acute oral toxicity (LD50): 273 mg/kg [Rat]
1.183 Solid In Bags ,Stored
in ware house
58. Hydrogen
gas
1333-74-
0
LC50 inhalation rat
(ppm) > 15000
0.0012 Gas In 7m3 /10 M3
cylinders store
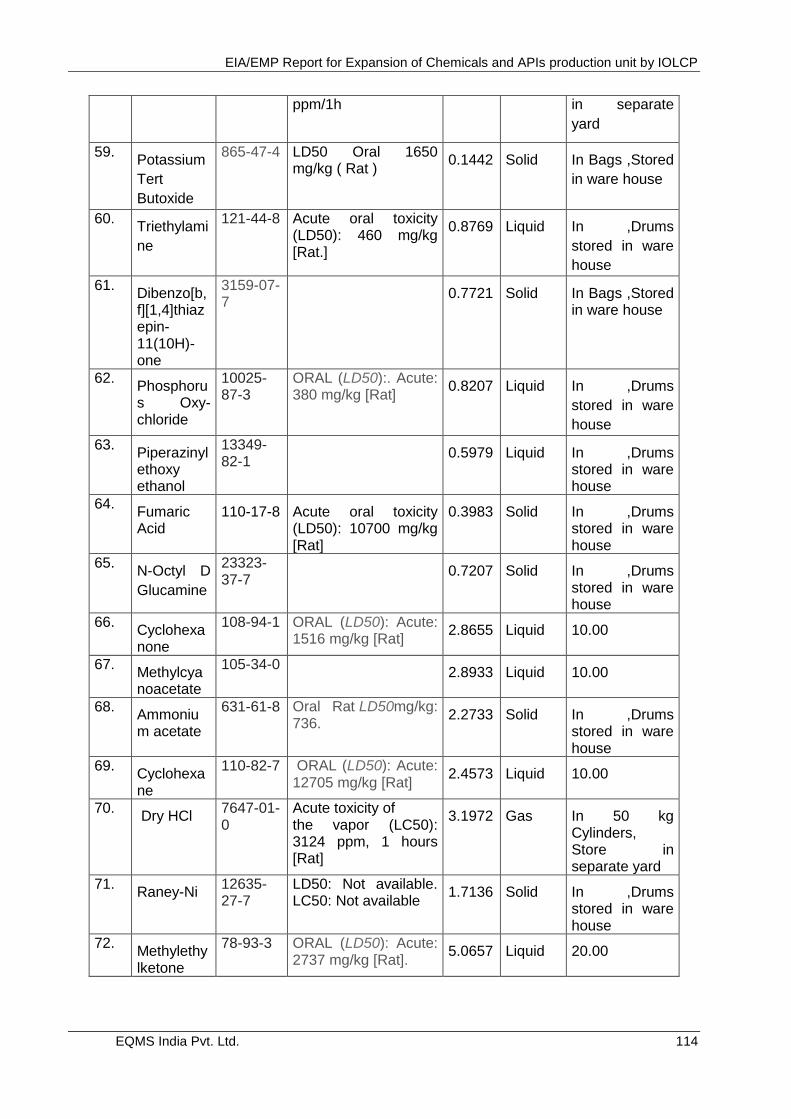
EIA/EMP Report for Expansion of Chemicals and APIs production unit by IOLCP
EQMS India Pvt. Ltd. 114
ppm/1h
in separate
yard
59. Potassium
Tert
Butoxide
865-47-4 LD50 Oral 1650 mg/kg ( Rat )
0.1442 Solid In Bags ,Stored
in ware house
60. Triethylami
ne
121-44-8 Acute oral toxicity (LD50): 460 mg/kg [Rat.]
0.8769 Liquid In ,Drums
stored in ware
house
61. Dibenzo[b,f][1,4]thiazepin-11(10H)-one
3159-07-7
0.7721 Solid In Bags ,Stored
in ware house
62. Phosphorus Oxy-chloride
10025-87-3
ORAL (LD50):. Acute: 380 mg/kg [Rat]
0.8207 Liquid In ,Drums
stored in ware
house
63. Piperazinyl ethoxy ethanol
13349-82-1
0.5979 Liquid In ,Drums
stored in ware house
64. Fumaric Acid
110-17-8
Acute oral toxicity (LD50): 10700 mg/kg [Rat]
0.3983 Solid In ,Drums stored in ware house
65. N-Octyl D
Glucamine
23323-37-7
0.7207 Solid In ,Drums
stored in ware house
66. Cyclohexanone
108-94-1 ORAL (LD50): Acute: 1516 mg/kg [Rat]
2.8655 Liquid 10.00
67. Methylcyanoacetate
105-34-0 2.8933 Liquid 10.00
68. Ammonium acetate
631-61-8 Oral Rat LD50mg/kg: 736.
2.2733 Solid In ,Drums stored in ware house
69. Cyclohexane
110-82-7 ORAL (LD50): Acute: 12705 mg/kg [Rat]
2.4573 Liquid 10.00
70. Dry HCl
7647-01-0
Acute toxicity of the vapor (LC50): 3124 ppm, 1 hours [Rat]
3.1972 Gas In 50 kg Cylinders, Store in separate yard
71. Raney-Ni
12635-27-7
LD50: Not available. LC50: Not available
1.7136 Solid In ,Drums stored in ware house
72. Methylethylketone
78-93-3 ORAL (LD50): Acute: 2737 mg/kg [Rat].
5.0657 Liquid 20.00
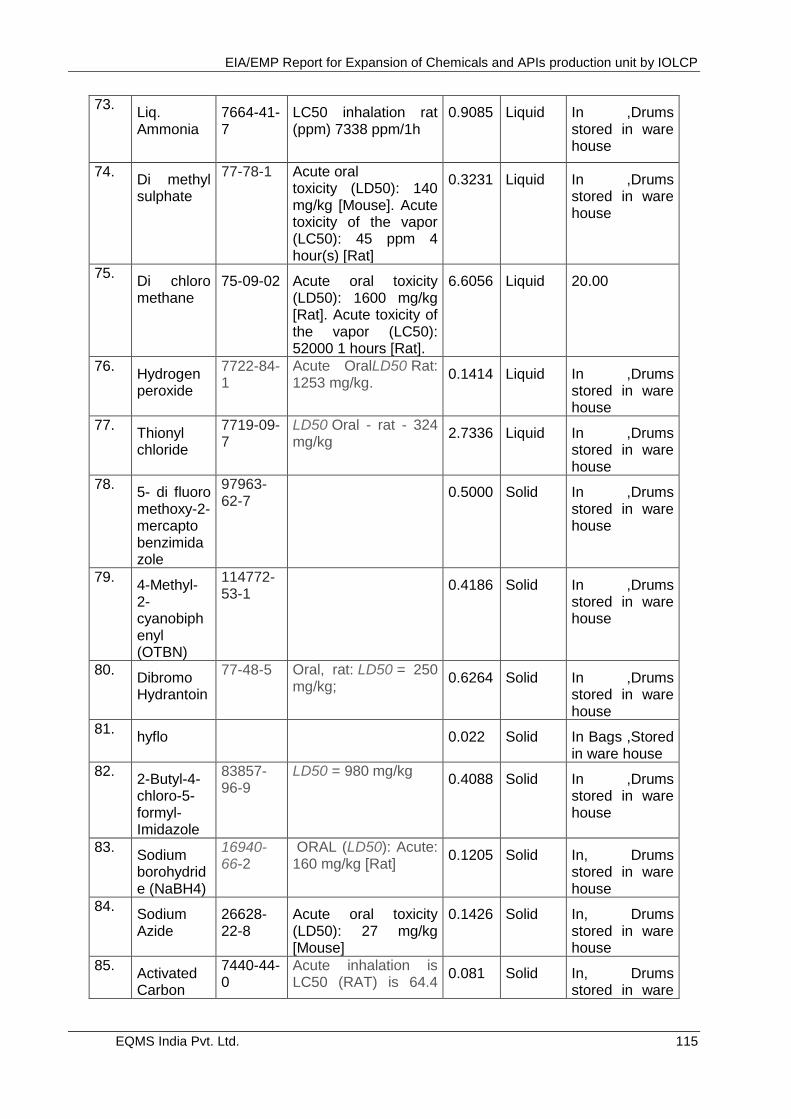
EIA/EMP Report for Expansion of Chemicals and APIs production unit by IOLCP
EQMS India Pvt. Ltd. 115
73. Liq. Ammonia
7664-41-7
LC50 inhalation rat (ppm) 7338 ppm/1h
0.9085 Liquid In ,Drums stored in ware house
74. Di methyl sulphate
77-78-1 Acute oral toxicity (LD50): 140 mg/kg [Mouse]. Acute toxicity of the vapor (LC50): 45 ppm 4 hour(s) [Rat]
0.3231 Liquid In ,Drums stored in ware house
75. Di chloro methane
75-09-02 Acute oral toxicity (LD50): 1600 mg/kg [Rat]. Acute toxicity of the vapor (LC50): 52000 1 hours [Rat].
6.6056 Liquid 20.00
76. Hydrogen peroxide
7722-84-1
Acute OralLD50 Rat: 1253 mg/kg.
0.1414 Liquid In ,Drums stored in ware house
77. Thionyl chloride
7719-09-7
LD50 Oral - rat - 324 mg/kg
2.7336 Liquid In ,Drums stored in ware house
78. 5- di fluoro methoxy-2-mercapto benzimidazole
97963-62-7
0.5000 Solid In ,Drums
stored in ware house
79. 4-Methyl-2-cyanobiphenyl (OTBN)
114772-53-1
0.4186 Solid In ,Drums
stored in ware house
80. Dibromo Hydrantoin
77-48-5 Oral, rat: LD50 = 250 mg/kg;
0.6264 Solid In ,Drums stored in ware house
81. hyflo 0.022 Solid In Bags ,Stored
in ware house
82. 2-Butyl-4-chloro-5-formyl-Imidazole
83857-96-9
LD50 = 980 mg/kg 0.4088 Solid In ,Drums
stored in ware house
83. Sodium borohydride (NaBH4)
16940-66-2
ORAL (LD50): Acute: 160 mg/kg [Rat]
0.1205 Solid In, Drums stored in ware house
84. Sodium Azide
26628-22-8
Acute oral toxicity (LD50): 27 mg/kg [Mouse]
0.1426 Solid In, Drums stored in ware house
85. Activated Carbon
7440-44-0
Acute inhalation is LC50 (RAT) is 64.4
0.081 Solid In, Drums stored in ware
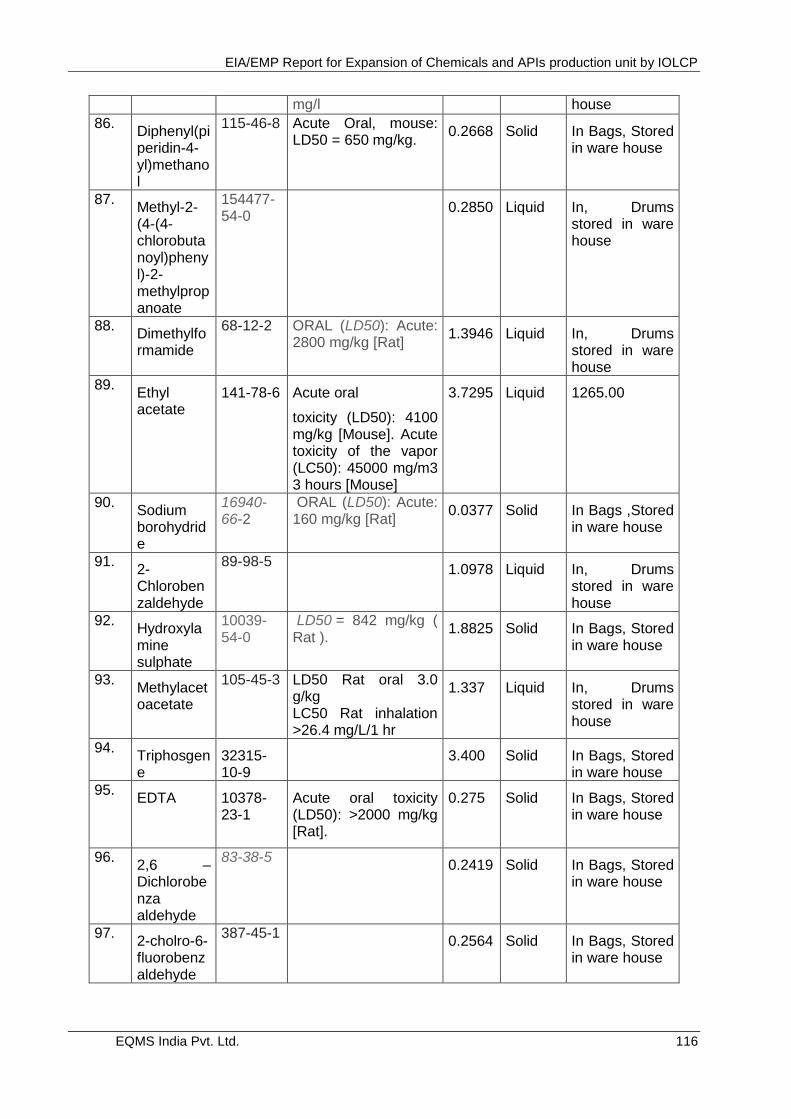
EIA/EMP Report for Expansion of Chemicals and APIs production unit by IOLCP
EQMS India Pvt. Ltd. 116
mg/l house
86. Diphenyl(piperidin-4-yl)methanol
115-46-8 Acute Oral, mouse: LD50 = 650 mg/kg.
0.2668 Solid In Bags, Stored in ware house
87. Methyl-2-(4-(4-chlorobutanoyl)phenyl)-2-methylpropanoate
154477-54-0
0.2850 Liquid In, Drums
stored in ware house
88. Dimethylformamide
68-12-2 ORAL (LD50): Acute: 2800 mg/kg [Rat]
1.3946 Liquid In, Drums stored in ware house
89. Ethyl acetate
141-78-6
Acute oral
toxicity (LD50): 4100 mg/kg [Mouse]. Acute toxicity of the vapor (LC50): 45000 mg/m3 3 hours [Mouse]
3.7295 Liquid 1265.00
90. Sodium borohydride
16940-66-2
ORAL (LD50): Acute: 160 mg/kg [Rat]
0.0377 Solid In Bags ,Stored in ware house
91. 2- Chlorobenzaldehyde
89-98-5 1.0978 Liquid In, Drums
stored in ware house
92. Hydroxylamine sulphate
10039-54-0
LD50 = 842 mg/kg ( Rat ).
1.8825 Solid In Bags, Stored in ware house
93. Methylacetoacetate
105-45-3 LD50 Rat oral 3.0 g/kg LC50 Rat inhalation >26.4 mg/L/1 hr
1.337 Liquid In, Drums stored in ware house
94. Triphosgene
32315-10-9
3.400 Solid In Bags, Stored in ware house
95. EDTA 10378-
23-1
Acute oral toxicity (LD50): >2000 mg/kg [Rat].
0.275 Solid In Bags, Stored in ware house
96. 2,6 – Dichlorobenza aldehyde
83-38-5 0.2419 Solid In Bags, Stored
in ware house
97. 2-cholro-6-fluorobenz aldehyde
387-45-1 0.2564 Solid In Bags, Stored
in ware house
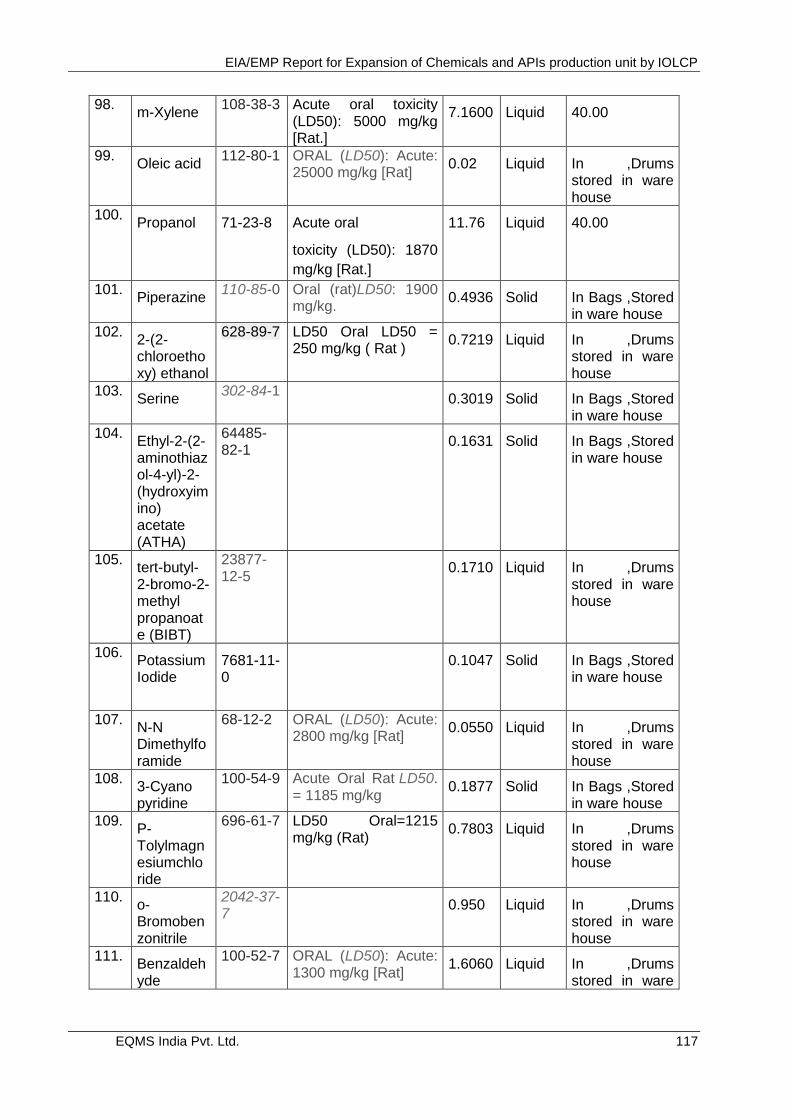
EIA/EMP Report for Expansion of Chemicals and APIs production unit by IOLCP
EQMS India Pvt. Ltd. 117
98. m-Xylene
108-38-3 Acute oral toxicity (LD50): 5000 mg/kg [Rat.]
7.1600 Liquid 40.00
99. Oleic acid
112-80-1 ORAL (LD50): Acute: 25000 mg/kg [Rat]
0.02 Liquid In ,Drums stored in ware house
100. Propanol 71-23-8
Acute oral
toxicity (LD50): 1870
mg/kg [Rat.]
11.76 Liquid 40.00
101. Piperazine
110-85-0 Oral (rat)LD50: 1900 mg/kg.
0.4936 Solid In Bags ,Stored in ware house
102. 2-(2-chloroethoxy) ethanol
628-89-7 LD50 Oral LD50 = 250 mg/kg ( Rat )
0.7219 Liquid In ,Drums stored in ware house
103. Serine
302-84-1 0.3019 Solid In Bags ,Stored
in ware house
104. Ethyl-2-(2-aminothiazol-4-yl)-2-(hydroxyimino) acetate (ATHA)
64485-82-1
0.1631 Solid In Bags ,Stored
in ware house
105. tert-butyl-2-bromo-2-methyl propanoate (BIBT)
23877-12-5
0.1710 Liquid In ,Drums
stored in ware house
106. Potassium Iodide
7681-11-0
0.1047 Solid In Bags ,Stored in ware house
107. N-N Dimethylforamide
68-12-2 ORAL (LD50): Acute: 2800 mg/kg [Rat]
0.0550 Liquid In ,Drums stored in ware house
108. 3-Cyano pyridine
100-54-9 Acute Oral Rat LD50. = 1185 mg/kg
0.1877 Solid In Bags ,Stored in ware house
109. P-Tolylmagnesiumchlo ride
696-61-7 LD50 Oral=1215 mg/kg (Rat)
0.7803 Liquid In ,Drums stored in ware house
110. o-Bromobenzonitrile
2042-37-7
0.950 Liquid In ,Drums
stored in ware house
111. Benzaldehyde
100-52-7 ORAL (LD50): Acute: 1300 mg/kg [Rat]
1.6060 Liquid In ,Drums stored in ware
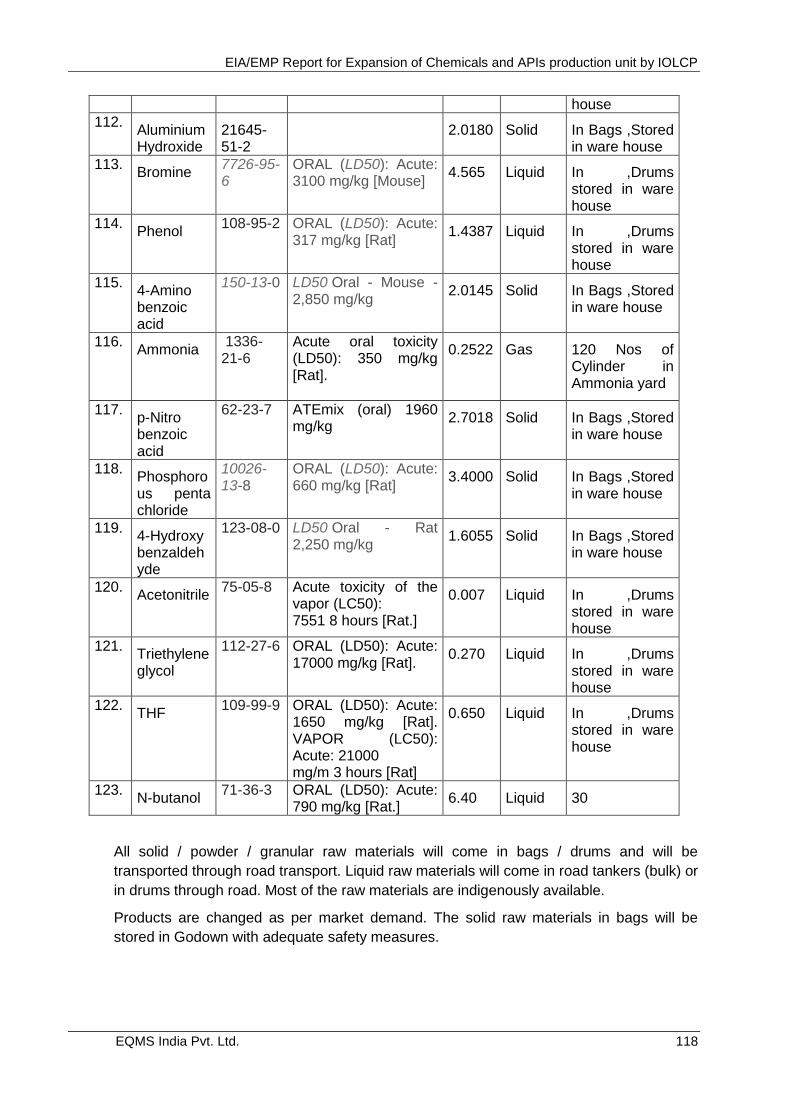
EIA/EMP Report for Expansion of Chemicals and APIs production unit by IOLCP
EQMS India Pvt. Ltd. 118
house
112. Aluminium Hydroxide
21645-51-2
2.0180 Solid In Bags ,Stored in ware house
113. Bromine
7726-95-6
ORAL (LD50): Acute: 3100 mg/kg [Mouse]
4.565 Liquid In ,Drums stored in ware house
114. Phenol
108-95-2 ORAL (LD50): Acute: 317 mg/kg [Rat]
1.4387 Liquid In ,Drums stored in ware house
115. 4-Amino benzoic acid
150-13-0 LD50 Oral - Mouse - 2,850 mg/kg
2.0145 Solid In Bags ,Stored in ware house
116. Ammonia
1336-21-6
Acute oral toxicity (LD50): 350 mg/kg [Rat].
0.2522 Gas 120 Nos of Cylinder in Ammonia yard
117. p-Nitro benzoic acid
62-23-7 ATEmix (oral) 1960 mg/kg
2.7018 Solid In Bags ,Stored in ware house
118. Phosphorous penta chloride
10026-13-8
ORAL (LD50): Acute: 660 mg/kg [Rat]
3.4000 Solid In Bags ,Stored in ware house
119. 4-Hydroxy benzaldehyde
123-08-0 LD50 Oral - Rat 2,250 mg/kg
1.6055 Solid In Bags ,Stored in ware house
120. Acetonitrile
75-05-8
Acute toxicity of the vapor (LC50): 7551 8 hours [Rat.]
0.007 Liquid In ,Drums stored in ware house
121. Triethylene glycol
112-27-6 ORAL (LD50): Acute: 17000 mg/kg [Rat].
0.270 Liquid In ,Drums stored in ware house
122. THF
109-99-9 ORAL (LD50): Acute: 1650 mg/kg [Rat]. VAPOR (LC50): Acute: 21000 mg/m 3 hours [Rat]
0.650 Liquid In ,Drums stored in ware house
123. N-butanol
71-36-3 ORAL (LD50): Acute: 790 mg/kg [Rat.]
6.40 Liquid 30
All solid / powder / granular raw materials will come in bags / drums and will be
transported through road transport. Liquid raw materials will come in road tankers (bulk) or
in drums through road. Most of the raw materials are indigenously available.
Products are changed as per market demand. The solid raw materials in bags will be
stored in Godown with adequate safety measures.
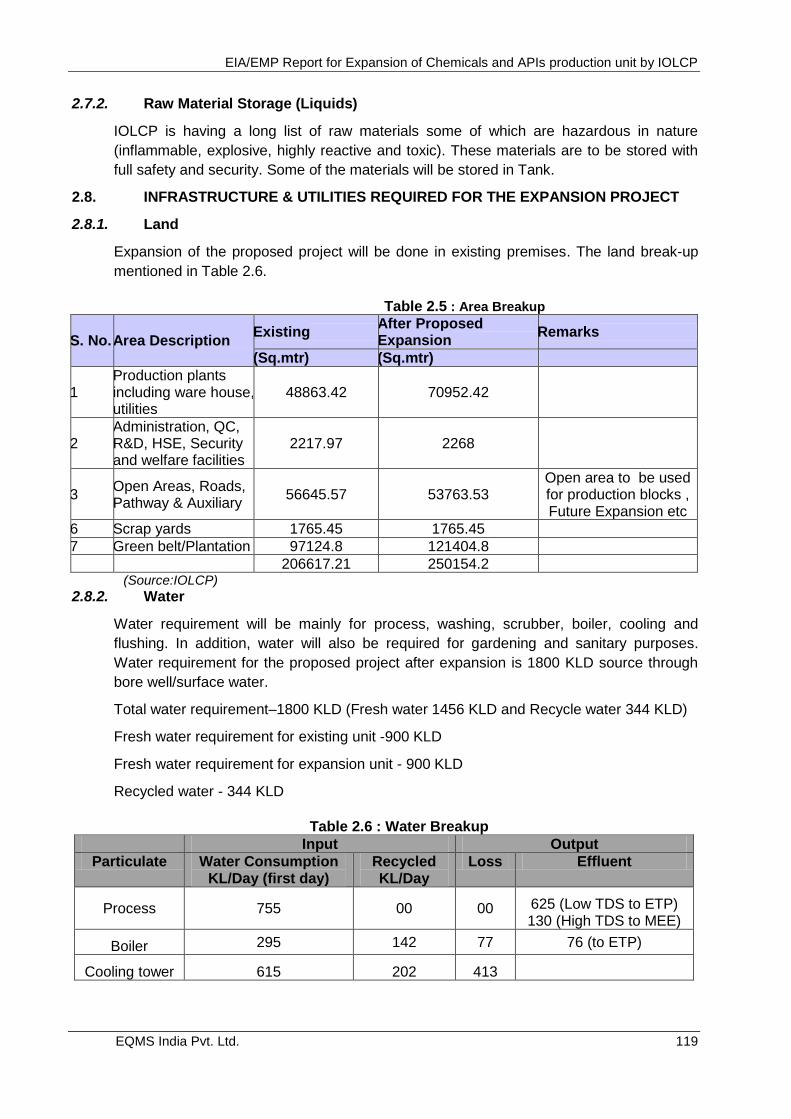
EIA/EMP Report for Expansion of Chemicals and APIs production unit by IOLCP
EQMS India Pvt. Ltd. 119
2.7.2. Raw Material Storage (Liquids)
IOLCP is having a long list of raw materials some of which are hazardous in nature
(inflammable, explosive, highly reactive and toxic). These materials are to be stored with
full safety and security. Some of the materials will be stored in Tank.
2.8. INFRASTRUCTURE & UTILITIES REQUIRED FOR THE EXPANSION PROJECT
2.8.1. Land
Expansion of the proposed project will be done in existing premises. The land break-up
mentioned in Table 2.6.
Table 2.5 : Area Breakup
S. No. Area Description Existing
After Proposed Expansion
Remarks
(Sq.mtr) (Sq.mtr)
1 Production plants including ware house, utilities
48863.42 70952.42
2 Administration, QC, R&D, HSE, Security and welfare facilities
2217.97 2268
3 Open Areas, Roads, Pathway & Auxiliary
56645.57 53763.53 Open area to be used for production blocks , Future Expansion etc
6 Scrap yards 1765.45 1765.45
7 Green belt/Plantation 97124.8 121404.8
206617.21 250154.2 (Source:IOLCP)
2.8.2. Water
Water requirement will be mainly for process, washing, scrubber, boiler, cooling and
flushing. In addition, water will also be required for gardening and sanitary purposes.
Water requirement for the proposed project after expansion is 1800 KLD source through
bore well/surface water.
Total water requirement–1800 KLD (Fresh water 1456 KLD and Recycle water 344 KLD)
Fresh water requirement for existing unit -900 KLD
Fresh water requirement for expansion unit - 900 KLD
Recycled water - 344 KLD
Table 2.6 : Water Breakup
Input Output
Particulate Water Consumption KL/Day (first day)
Recycled KL/Day
Loss Effluent
Process 755 00 00 625 (Low TDS to ETP) 130 (High TDS to MEE)
Boiler 295 142 77 76 (to ETP)
Cooling tower 615 202 413
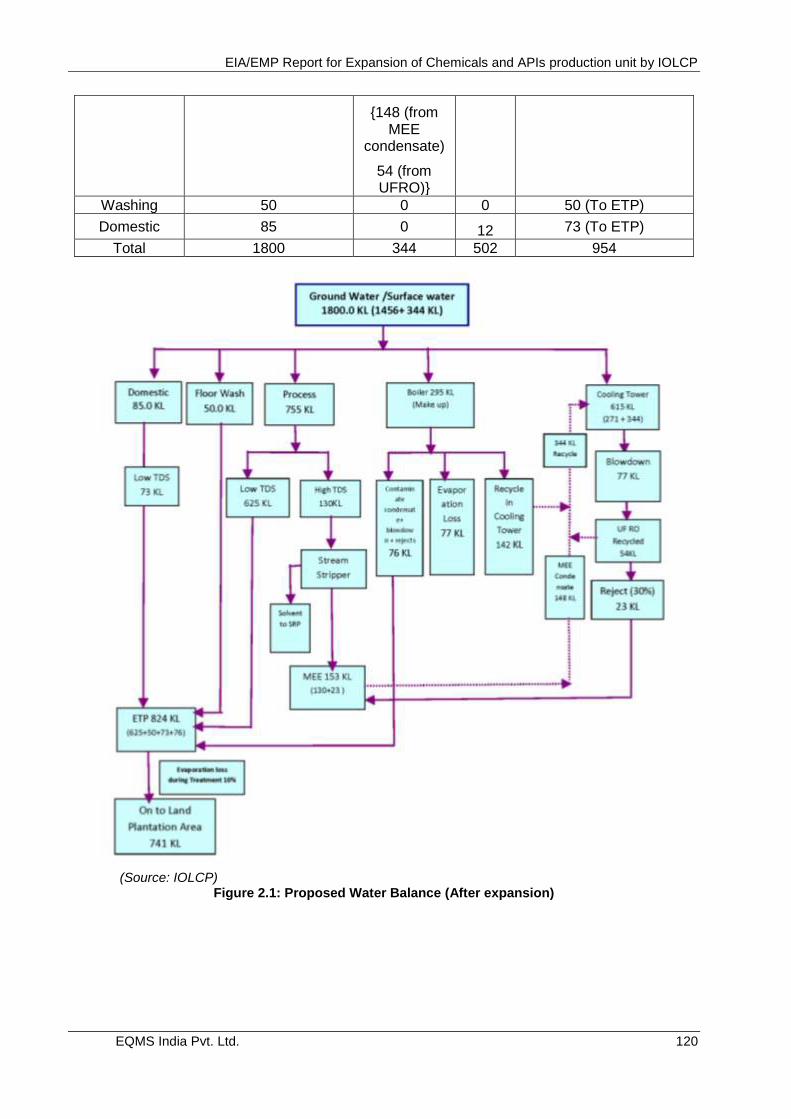
EIA/EMP Report for Expansion of Chemicals and APIs production unit by IOLCP
EQMS India Pvt. Ltd. 120
{148 (from MEE
condensate)
54 (from UFRO)}
Washing 50 0 0 50 (To ETP)
Domestic 85 0 12 73 (To ETP)
Total 1800 344 502 954
(Source: IOLCP)
Figure 2.1: Proposed Water Balance (After expansion)
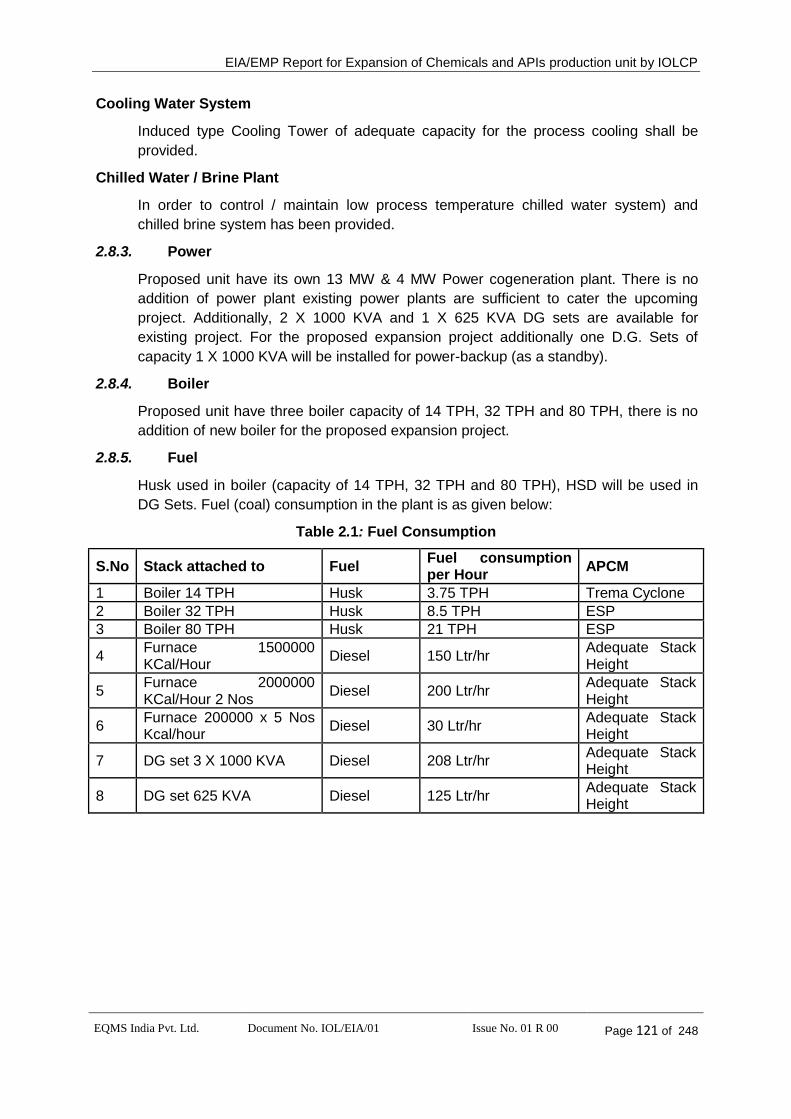
EIA/EMP Report for Expansion of Chemicals and APIs production unit by IOLCP
EQMS India Pvt. Ltd. Document No. IOL/EIA/01 Issue No. 01 R 00 Page 121 of 248
Cooling Water System
Induced type Cooling Tower of adequate capacity for the process cooling shall be
provided.
Chilled Water / Brine Plant
In order to control / maintain low process temperature chilled water system) and
chilled brine system has been provided.
2.8.3. Power
Proposed unit have its own 13 MW & 4 MW Power cogeneration plant. There is no
addition of power plant existing power plants are sufficient to cater the upcoming
project. Additionally, 2 X 1000 KVA and 1 X 625 KVA DG sets are available for
existing project. For the proposed expansion project additionally one D.G. Sets of
capacity 1 X 1000 KVA will be installed for power-backup (as a standby).
2.8.4. Boiler
Proposed unit have three boiler capacity of 14 TPH, 32 TPH and 80 TPH, there is no
addition of new boiler for the proposed expansion project.
2.8.5. Fuel
Husk used in boiler (capacity of 14 TPH, 32 TPH and 80 TPH), HSD will be used in
DG Sets. Fuel (coal) consumption in the plant is as given below:
Table 2.1: Fuel Consumption
S.No Stack attached to Fuel Fuel consumption per Hour
APCM
1 Boiler 14 TPH Husk 3.75 TPH Trema Cyclone
2 Boiler 32 TPH Husk 8.5 TPH ESP
3 Boiler 80 TPH Husk 21 TPH ESP
4 Furnace 1500000 KCal/Hour
Diesel 150 Ltr/hr Adequate Stack Height
5 Furnace 2000000 KCal/Hour 2 Nos
Diesel 200 Ltr/hr Adequate Stack Height
6 Furnace 200000 x 5 Nos Kcal/hour
Diesel 30 Ltr/hr Adequate Stack Height
7 DG set 3 X 1000 KVA Diesel 208 Ltr/hr Adequate Stack Height
8 DG set 625 KVA Diesel 125 Ltr/hr Adequate Stack Height
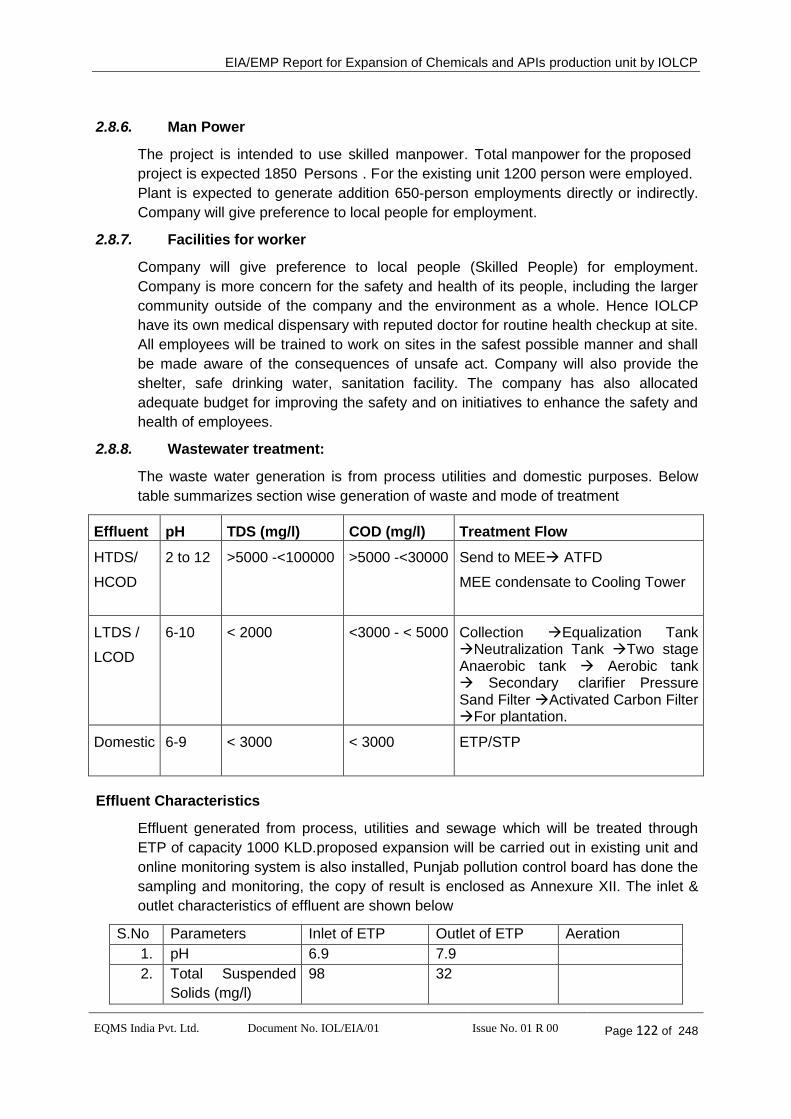
EIA/EMP Report for Expansion of Chemicals and APIs production unit by IOLCP
EQMS India Pvt. Ltd. Document No. IOL/EIA/01 Issue No. 01 R 00 Page 122 of 248
2.8.6. Man Power
The project is intended to use skilled manpower. Total manpower for the proposed
project is expected 1850 Persons . For the existing unit 1200 person were employed.
Plant is expected to generate addition 650-person employments directly or indirectly.
Company will give preference to local people for employment.
2.8.7. Facilities for worker
Company will give preference to local people (Skilled People) for employment.
Company is more concern for the safety and health of its people, including the larger
community outside of the company and the environment as a whole. Hence IOLCP
have its own medical dispensary with reputed doctor for routine health checkup at site.
All employees will be trained to work on sites in the safest possible manner and shall
be made aware of the consequences of unsafe act. Company will also provide the
shelter, safe drinking water, sanitation facility. The company has also allocated
adequate budget for improving the safety and on initiatives to enhance the safety and
health of employees.
2.8.8. Wastewater treatment:
The waste water generation is from process utilities and domestic purposes. Below
table summarizes section wise generation of waste and mode of treatment
Effluent pH TDS (mg/l) COD (mg/l) Treatment Flow
HTDS/
HCOD
2 to 12 >5000 -<100000 >5000 -<30000 Send to MEE ATFD
MEE condensate to Cooling Tower
LTDS /
LCOD
6-10 < 2000 <3000 - < 5000 Collection Equalization Tank Neutralization Tank Two stage Anaerobic tank Aerobic tank Secondary clarifierPressure Sand Filter Activated Carbon Filter For plantation.
Domestic 6-9 < 3000 < 3000 ETP/STP
Effluent Characteristics
Effluent generated from process, utilities and sewage which will be treated through
ETP of capacity 1000 KLD.proposed expansion will be carried out in existing unit and
online monitoring system is also installed, Punjab pollution control board has done the
sampling and monitoring, the copy of result is enclosed as Annexure XII. The inlet &
outlet characteristics of effluent are shown below
S.No Parameters Inlet of ETP Outlet of ETP Aeration
1. pH 6.9 7.9
2. Total Suspended
Solids (mg/l)
98 32
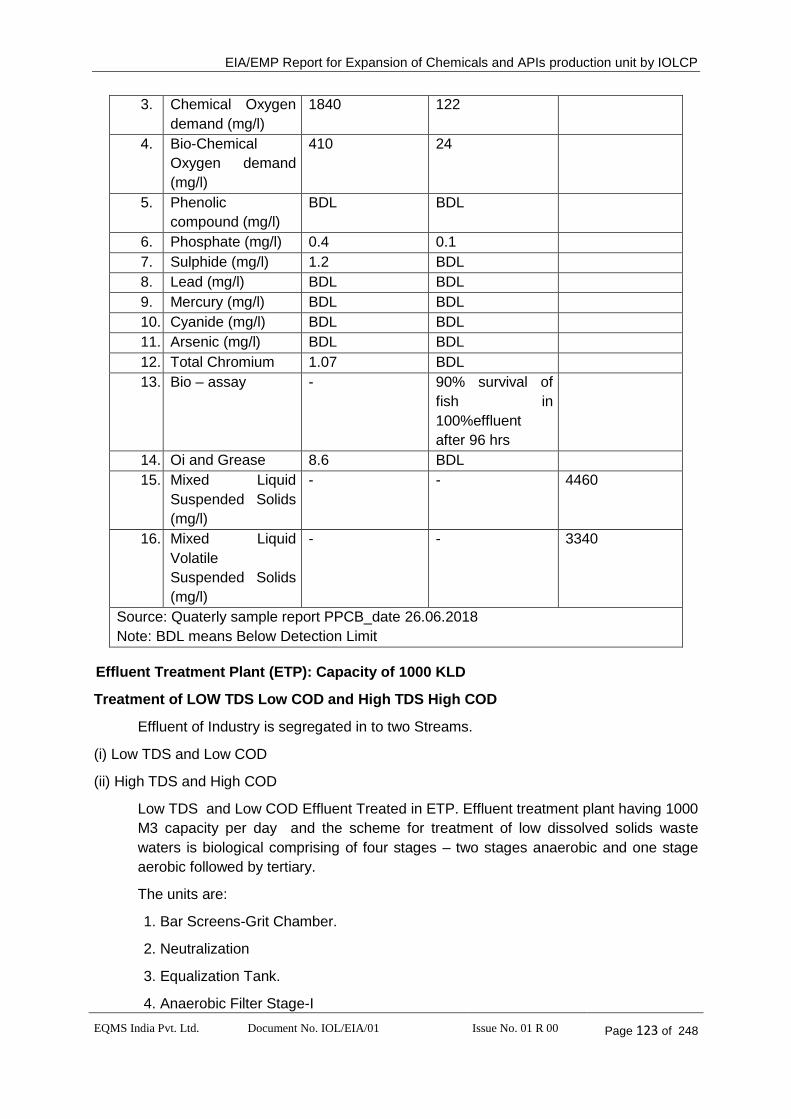
EIA/EMP Report for Expansion of Chemicals and APIs production unit by IOLCP
EQMS India Pvt. Ltd. Document No. IOL/EIA/01 Issue No. 01 R 00 Page 123 of 248
3. Chemical Oxygen
demand (mg/l)
1840 122
4. Bio-Chemical
Oxygen demand
(mg/l)
410 24
5. Phenolic
compound (mg/l)
BDL BDL
6. Phosphate (mg/l) 0.4 0.1
7. Sulphide (mg/l) 1.2 BDL
8. Lead (mg/l) BDL BDL
9. Mercury (mg/l) BDL BDL
10. Cyanide (mg/l) BDL BDL
11. Arsenic (mg/l) BDL BDL
12. Total Chromium 1.07 BDL
13. Bio – assay - 90% survival of
fish in
100%effluent
after 96 hrs
14. Oi and Grease 8.6 BDL
15. Mixed Liquid
Suspended Solids
(mg/l)
- - 4460
16. Mixed Liquid
Volatile
Suspended Solids
(mg/l)
- - 3340
Source: Quaterly sample report PPCB_date 26.06.2018
Note: BDL means Below Detection Limit
Effluent Treatment Plant (ETP): Capacity of 1000 KLD
Treatment of LOW TDS Low COD and High TDS High COD
Effluent of Industry is segregated in to two Streams.
(i) Low TDS and Low COD
(ii) High TDS and High COD
Low TDS and Low COD Effluent Treated in ETP. Effluent treatment plant having 1000
M3 capacity per day and the scheme for treatment of low dissolved solids waste
waters is biological comprising of four stages – two stages anaerobic and one stage
aerobic followed by tertiary.
The units are:
1. Bar Screens-Grit Chamber.
2. Neutralization
3. Equalization Tank.
4. Anaerobic Filter Stage-I
EIA/EMP Report for Expansion of Chemicals and APIs production unit by IOLCP
EQMS India Pvt. Ltd. Document No. IOL/EIA/01 Issue No. 01 R 00 Page 124 of 248
5. Anaerobic Filter Stage-II
6. Aerobic Reactor.
7. Secondary Sedimentation Tank.
8. Sand Filtration
9. Carbon Contractor
10. Sludge Dewatering.
Wastewaters flow under gravity from various sections into the equalization tank
through the bar screens and grit chamber. The bar screens arrest the floating debris,
like wood, rags, plastics, etc. and the grit chambers settle out the grit, sand, etc.V-
notch plates and Magnetic Flowmeter is provide data the outlet of the effluent
treatment plant for measurement of flow.
The pH of the influent to the treatment plant is acidic in nature most of the time.
Therefore, neutralization done by addition of alkali - sodium hydroxide to raise pH from
5 to between 6.8 and 7.2.
An equalization tank of forty-Eight hours capacity at peak flown provided to take care
of varying pollution loads discharged by the industry. The effluents shall then be lifted
with pump(s) from the equalization tank into a two-stage anaerobic filter system
provided in series.
Each anaerobic filter consists of a reactor filled with coarse inert graded packing
media. The wastewater enters at the base of the reactor through the under drainage
system and flow upwards through the filter bed. Anaerobic organisms shall
accumulate in the voids of the media as well as become attached to the media
surfaces. The waste thus, come into intimate contact with a large active biomass as it
passes through the reactor. Provision also made for effluent recycle to the filters to
achieve good mixing, optimum up flow velocities, reducing alkali & nutrient
requirements.
The effluent from the anaerobic stage be further treated for removal of Carbonaceous
BOD in a complete mix activated sludge reactor. The process has the capacity to hold
a high MLSS level in the aeration tank imparting increased Operational stability at
shock organic loadings.
The waste waters are deficient in nutrients especially nitrogen. This deficiency made
good by addition of DAP and Urea into each of the biological stages of treatment as
per requirement. Diffused aeration employed to maintain the desired DO level and
adequate mixing of liquor in the reactor. The mixed liquor from the aeration tank flow
in to the secondary sedimentation tank for separation of biomass.
The settled sludge from the sedimentation tank bottom lifted with the help of sludge
pump and re-circulated back into the aeration tank for reseeding. The surplus sludge
from aerobic stage pumped onto the sludge drying beds for Sun drying.
The overflow from the secondary sedimentation tank filtered through sand to remove
the organics associated with the suspended solids present in the secondary effluent.
This also prevent high influent suspended solids concentrations to enter and form
deposits on the carbon granules which otherwise result in pressure loss, flow

EIA/EMP Report for Expansion of Chemicals and APIs production unit by IOLCP
EQMS India Pvt. Ltd. Document No. IOL/EIA/01 Issue No. 01 R 00 Page 125 of 248
channeling, blockages and loss of adsorption capacity. Small doses of flocculants
alum/PAC added to improve filter efficiency. The filtered waste waters shall be
contacted with granular activated carbon for removal of toxic compounds.
The waste waters after carbon contact shall conform to the standards prescribed by
the Punjab Pollution Control Board discharged onto land for irrigation and gardening
High TDS is Treated in Multi Effect Evaporator having capacity 200 KL/Day . In High
TDS Concentrated Stream High TDS High COD taken in to Multi Effect Evaporator,
Where condensate of Multi Effect Evaporator is reused in Cooling Tower and solid
recovered as ( by product) that is sale in market or send to TSDF.
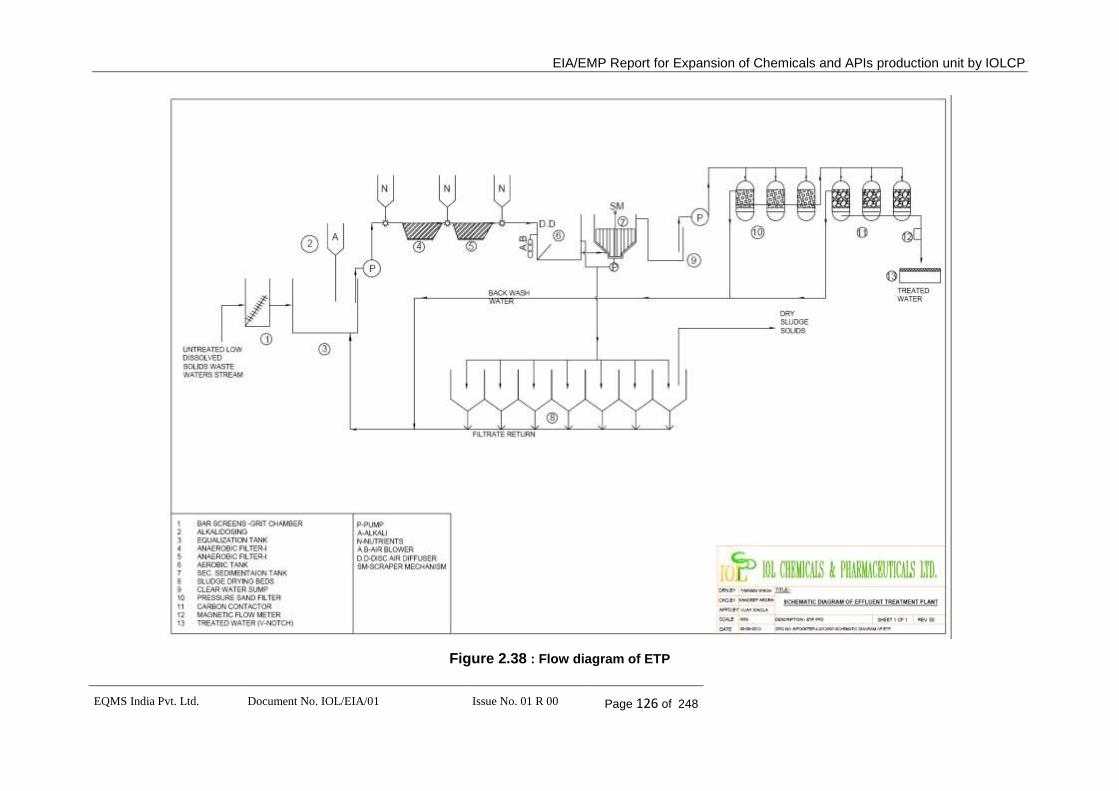
EIA/EMP Report for Expansion of Chemicals and APIs production unit by IOLCP
EQMS India Pvt. Ltd. Document No. IOL/EIA/01 Issue No. 01 R 00 Page 126 of 248
Figure 2.38 : Flow diagram of ETP
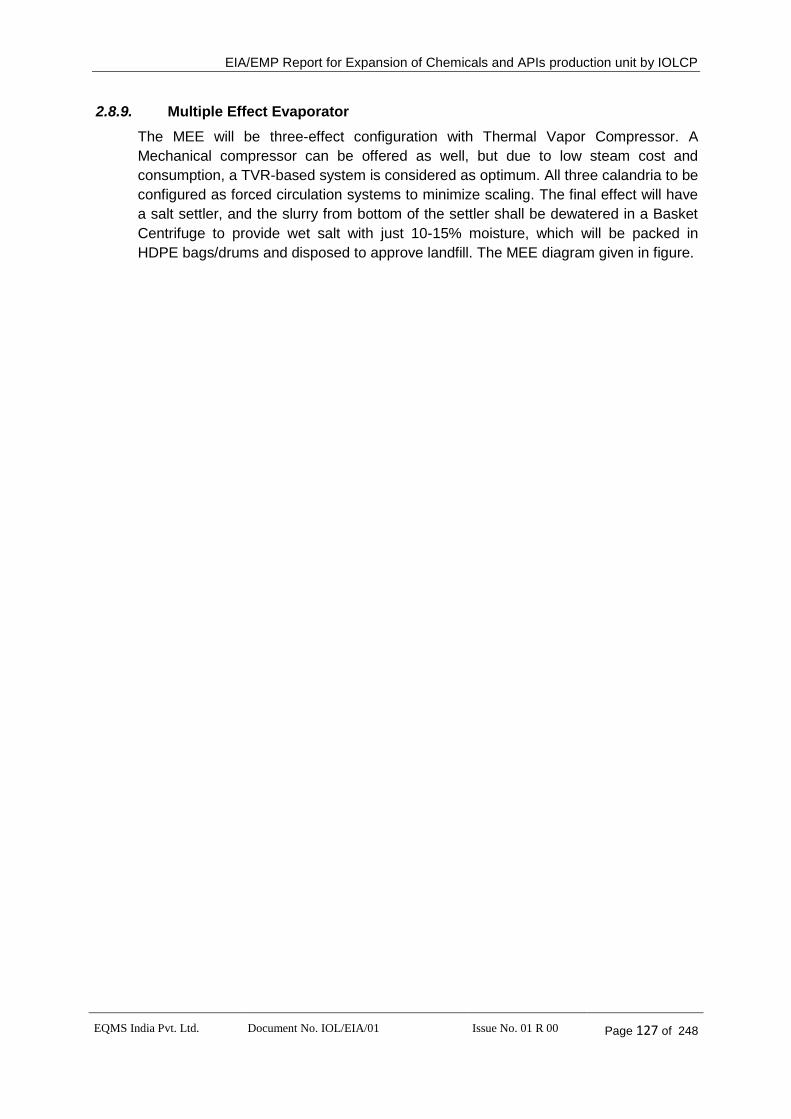
EIA/EMP Report for Expansion of Chemicals and APIs production unit by IOLCP
EQMS India Pvt. Ltd. Document No. IOL/EIA/01 Issue No. 01 R 00 Page 127 of 248
2.8.9. Multiple Effect Evaporator
The MEE will be three-effect configuration with Thermal Vapor Compressor. A
Mechanical compressor can be offered as well, but due to low steam cost and
consumption, a TVR-based system is considered as optimum. All three calandria to be
configured as forced circulation systems to minimize scaling. The final effect will have
a salt settler, and the slurry from bottom of the settler shall be dewatered in a Basket
Centrifuge to provide wet salt with just 10-15% moisture, which will be packed in
HDPE bags/drums and disposed to approve landfill. The MEE diagram given in figure.
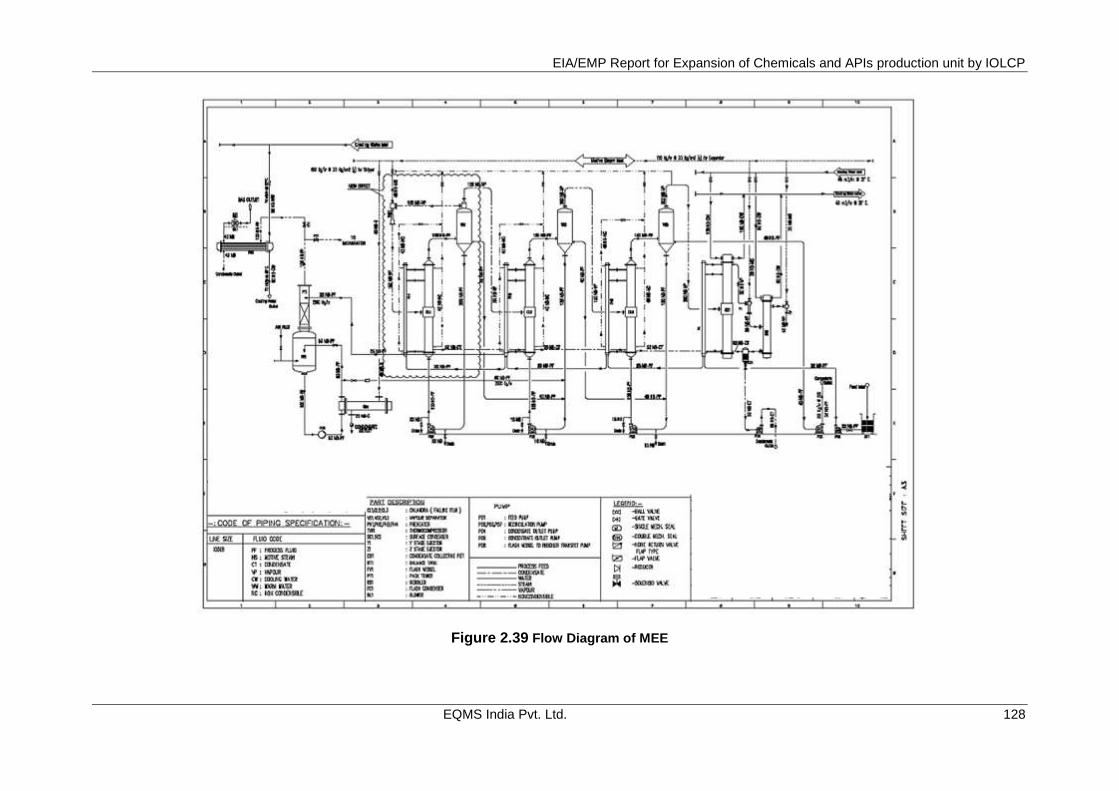
EIA/EMP Report for Expansion of Chemicals and APIs production unit by IOLCP
EQMS India Pvt. Ltd. 128
Figure 2.39 Flow Diagram of MEE
EIA/EMP Report for Expansion of Chemicals and APIs production unit by IOLCP
EQMS India Pvt. Ltd. 129
2.9. SOLVENT MANAGEMENT SYSTEM:
Solvent Recovery Measures:
IOLCP has a well-defined Solvent Recovery system. The existing solvent recovery is
98 %.
Process Steps for solvent recovery:
All the solvents as above are/ shall be recovered from reaction vessels
Each reaction vessels are shall have overhead condenser (primary and a vent
condenser)
The primary condenser shall have the utility connection of either cooling water (32-
37°C) or chilled water (5-10°C) or both.
The vent condenser is/shall have a utility connection of either chilled water (<7°C) or
brine (-15 to-20) or both.
By these measures the utilities in the condensers are/ shall always be below the
condensing temperature of various solvents and there for least vapor pressure or mole
fraction at condensing temperature.
Unit is/shall be using steam ejector for vacuum creation.
Each vacuum device is/shall also have a knockout pot and a condenser after suction
of the vacuum pump.
The reactor and solvent handling pumps is/shall have double mechanical seal/seal
less pumps to prevent leakages. Also, tank is/shall be provided with breather valve to
prevent losses.
Solvent is/will be taken from storage tank to reactors through closed pipe line. The
Storage Tank is/shall be vented through trap receiver & condenser operated on
cooling water.
The condenser is/shall be provided with sufficient HTA and residence time so as to
prevent any loss of solvent.
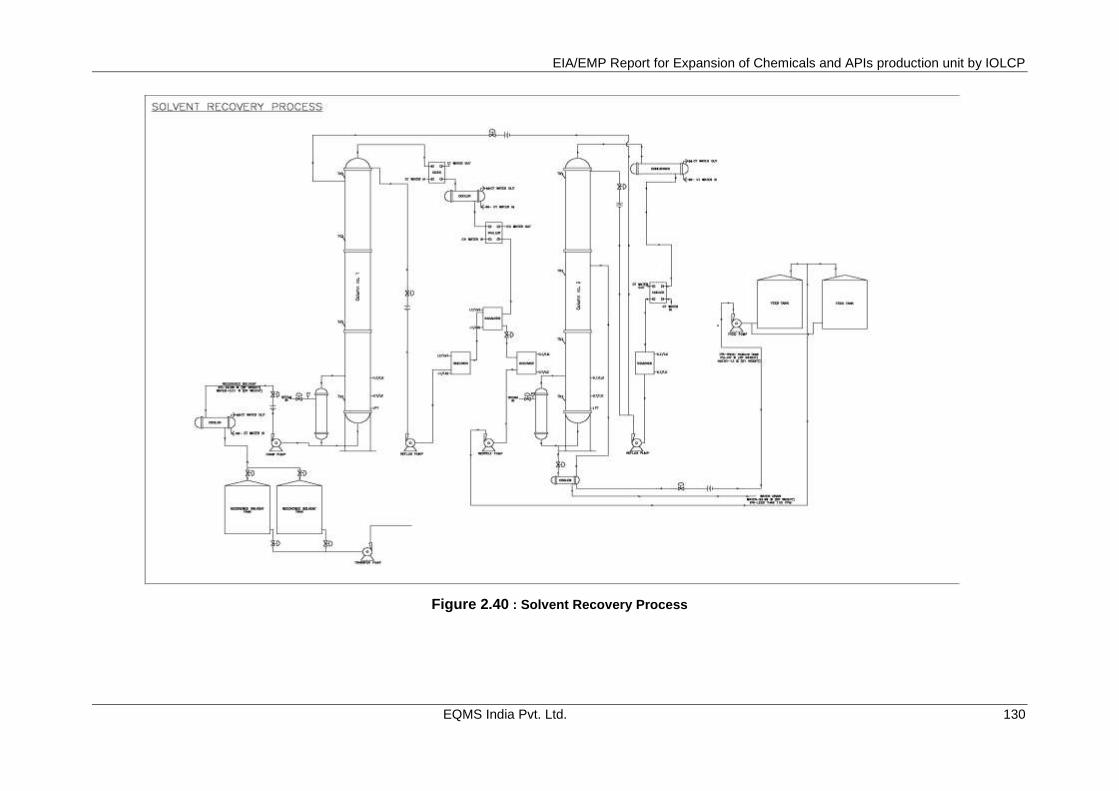
EIA/EMP Report for Expansion of Chemicals and APIs production unit by IOLCP
EQMS India Pvt. Ltd. 130
Figure 2.40 : Solvent Recovery Process
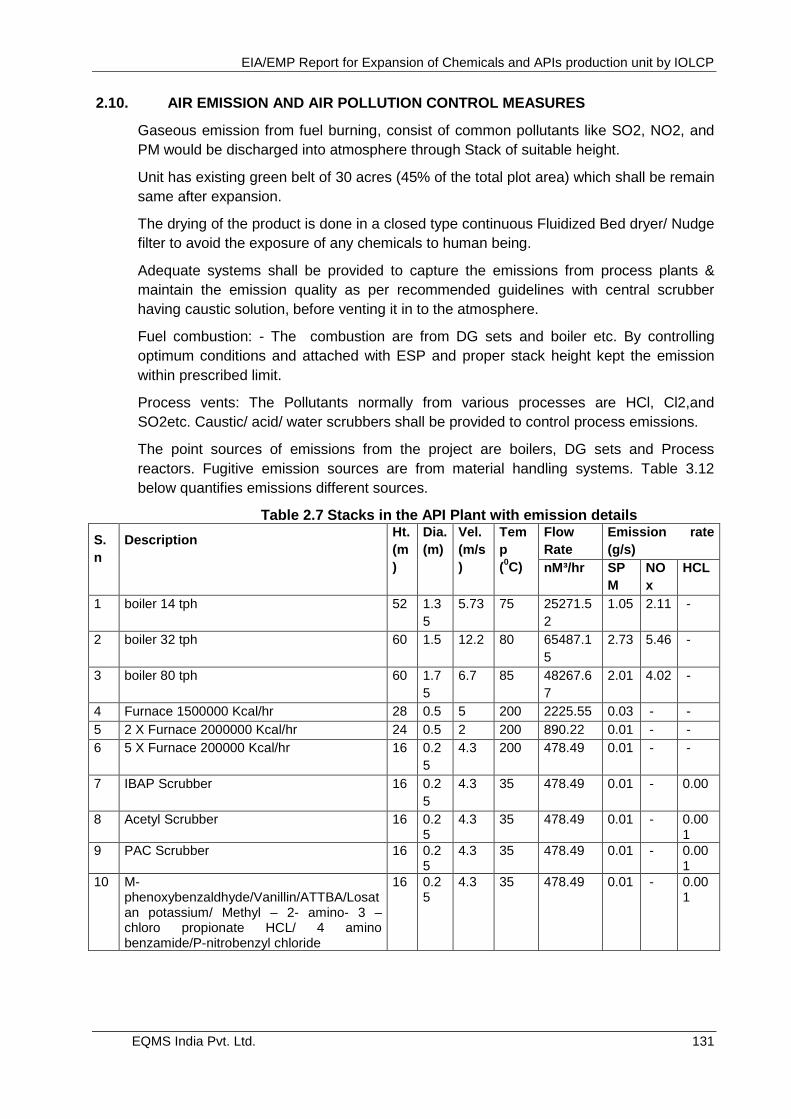
EIA/EMP Report for Expansion of Chemicals and APIs production unit by IOLCP
EQMS India Pvt. Ltd. 131
2.10. AIR EMISSION AND AIR POLLUTION CONTROL MEASURES
Gaseous emission from fuel burning, consist of common pollutants like SO2, NO2, and
PM would be discharged into atmosphere through Stack of suitable height.
Unit has existing green belt of 30 acres (45% of the total plot area) which shall be remain
same after expansion.
The drying of the product is done in a closed type continuous Fluidized Bed dryer/ Nudge
filter to avoid the exposure of any chemicals to human being.
Adequate systems shall be provided to capture the emissions from process plants &
maintain the emission quality as per recommended guidelines with central scrubber
having caustic solution, before venting it in to the atmosphere.
Fuel combustion: - The combustion are from DG sets and boiler etc. By controlling
optimum conditions and attached with ESP and proper stack height kept the emission
within prescribed limit.
Process vents: The Pollutants normally from various processes are HCl, Cl2,and
SO2etc. Caustic/ acid/ water scrubbers shall be provided to control process emissions.
The point sources of emissions from the project are boilers, DG sets and Process
reactors. Fugitive emission sources are from material handling systems. Table 3.12
below quantifies emissions different sources.
Table 2.7 Stacks in the API Plant with emission details
S.
n
Description Ht.
(m
)
Dia.
(m)
Vel.
(m/s
)
Tem
p
(0C)
Flow
Rate
Emission rate
(g/s)
nM³/hr SP
M
NO
x
HCL
1 boiler 14 tph 52 1.3
5
5.73 75 25271.5
2
1.05 2.11 -
2 boiler 32 tph 60 1.5 12.2 80 65487.1
5
2.73 5.46 -
3 boiler 80 tph 60 1.7
5
6.7 85 48267.6
7
2.01 4.02 -
4 Furnace 1500000 Kcal/hr 28 0.5 5 200 2225.55 0.03 - -
5 2 X Furnace 2000000 Kcal/hr 24 0.5 2 200 890.22 0.01 - -
6 5 X Furnace 200000 Kcal/hr 16 0.2
5
4.3 200 478.49 0.01 - -
7 IBAP Scrubber 16 0.2
5
4.3 35 478.49 0.01 - 0.00
8 Acetyl Scrubber 16 0.25
4.3 35 478.49 0.01 - 0.001
9 PAC Scrubber 16 0.25
4.3 35 478.49 0.01 - 0.001
10 M-phenoxybenzaldhyde/Vanillin/ATTBA/Losatan potassium/ Methyl – 2- amino- 3 – chloro propionate HCL/ 4 amino benzamide/P-nitrobenzyl chloride
16 0.25
4.3 35 478.49 0.01 - 0.001
EIA/EMP Report for Expansion of Chemicals and APIs production unit by IOLCP
EQMS India Pvt. Ltd. 132
Control of fugitive emission
Fugitive emissions are expected to be generated during construction and operation
stages of the proposed project. During construction stage, main source of fugitive
emission is dust which is expected mainly due to movement of vehicles carrying
construction material and vehicles used for construction. During operation stage, leakage
through valves, pumps, emission from open drum containing chemicals, open feeding;
storage tanks, etc. are the major sources of fugitive emissions of organic chemicals and
VOCs. Excess use of solvent may also result fugitive emission from the process vessels.
Following measures will be adopted to prevent and control fugitive emissions:
Airborne dust at all transfers operations/ points will be controlled either by
spraying water or providing enclosures.
Care will be taken to store construction material properly to prevent fugitive
emissions, if any.
Adequate ventilation will be provided.
Regular maintenance of valves, pumps and other equipment will be done to
prevent leakages and thus minimizing the fugitive emissions of VOCs.
Entire process will be carried out in the closed reactors with proper maintenance
of pressure and temperature.
Periodic monitoring of work area will be carried out to check the fugitive emission.
Breather valves will be provided on solvent tanks.
Solvent tank vents will be connected to vent chillers.
To eliminate chances of leakages from glands of pumps, mechanical seal will be
provided at all solvent pumps.
During transfer of material, steps shall be taken to reduce and prevent splashes
and spills. Any liquid or dry material spilled shall be cleaned as expeditiously as
possible.
Stand by pumps will be provided on all scrubbers. Besides, scrubbers will be
equipped with on-line pH meter for better operational control.
Close feeding system will be provided for centrifuges. Centrifuge and filtrate tank
vents will be connected to vent chillers.
Product filling stations will be equipped with vacuum duct hoods.
Good housekeeping, proper maintenance and continuous observation will
prevent the chances of any fugitive emission from the process plant.
When monitoring results indicate VOC above permissible limit repairing should be done
immediately. The repair should be conducted in such a way that there is no fugitive
emission from the particular component.
VOC Reduction Measures
EIA/EMP Report for Expansion of Chemicals and APIs production unit by IOLCP
EQMS India Pvt. Ltd. 133
Optimization of process parameters.
Change in utility services
Recycle / Reduction of Aqueous layer
Increase in settling time
Yield improvement
Stripping of Aqueous layer
Solvent input quantity reduction
Elimination of solvent wash
Common venting systems with spiral HEs
Ejectors replacement by Vacuum Pumps to capture VOC emission through open
ejector sumps
Vent Gas transportation from plants and treatment of the same in Incinerator
20 mbar nitrogen blanketing system in place
Vents of entire plant storage vessels, reactors condensors and any other
equipment are connected to a common header
Common header maintains 3-4 kg nitrogen pressure
When any solvent/reaction mixture is transferred from one equipment to other
equipment then Vapors displace from destination vessel and fill in the space
vacated in the source vessel not allowing any solvent vapors to escape
Secondary condensers are used in case of volatile solvents where chilled water
or chilled brine is used as a coolant
Vent line condenser after 3-4 kg nitrogen pressure header with suitable coolant to
trap volatile solvent
Instrumentation to prevent/control accidental/more release of solvent into the
atmosphere
Mechanical seal/seal less pumps are used for solvents
In unit operations/processes involving vacuum, vacuum is controlled by recycle of
vent gases from vacuum pump vent line
Instrumentation to prevent loss of solvent vapors (High vacuum trip with steam
block valve/feed block valve as the case may be)
Storage tanks and plant tanks are connected to same venting system. So no
escape of solvent during transfer
Appropriate design of condensers during detailed engineering phase of project.
(ensuring sufficient line size and thereby flowrate)
Annual cleaning of condensers to remove scaling (shutdown activity)
Storage of volatile liquids at lower temperature than boiling point to avoid losses
into the atmosphere. (Brine is used for the same)
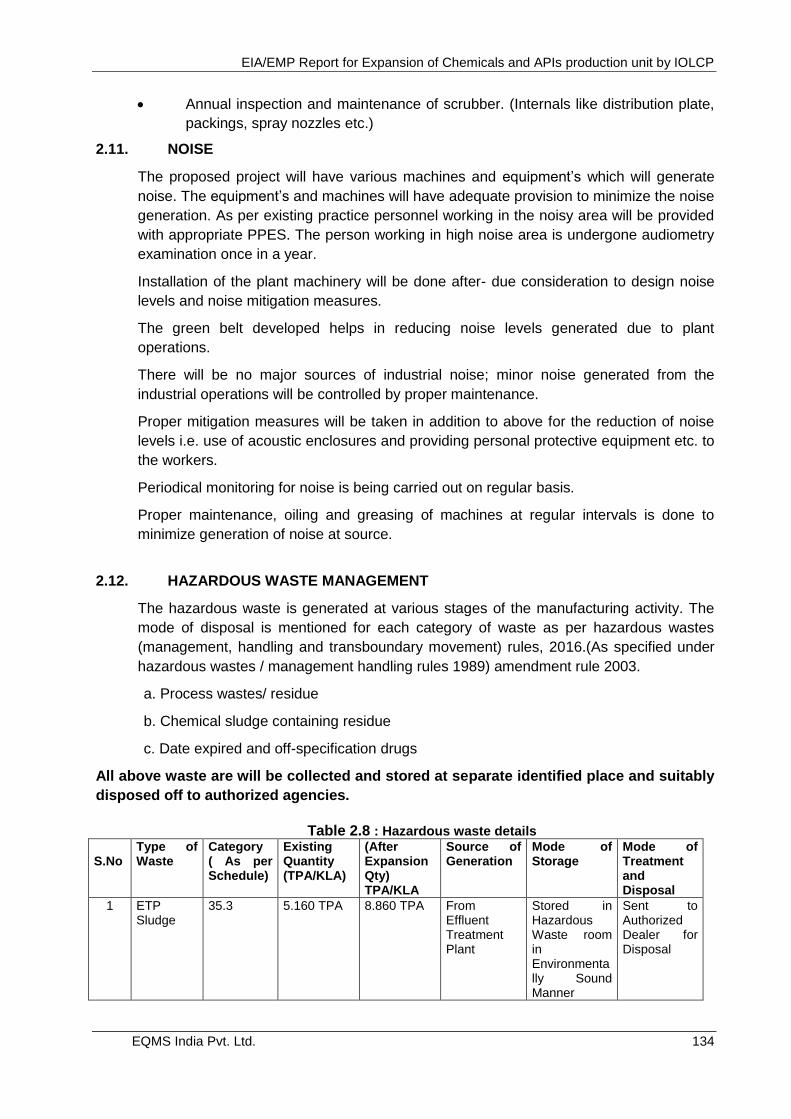
EIA/EMP Report for Expansion of Chemicals and APIs production unit by IOLCP
EQMS India Pvt. Ltd. 134
Annual inspection and maintenance of scrubber. (Internals like distribution plate,
packings, spray nozzles etc.)
2.11. NOISE
The proposed project will have various machines and equipment‘s which will generate
noise. The equipment‘s and machines will have adequate provision to minimize the noise
generation. As per existing practice personnel working in the noisy area will be provided
with appropriate PPES. The person working in high noise area is undergone audiometry
examination once in a year.
Installation of the plant machinery will be done after- due consideration to design noise
levels and noise mitigation measures.
The green belt developed helps in reducing noise levels generated due to plant
operations.
There will be no major sources of industrial noise; minor noise generated from the
industrial operations will be controlled by proper maintenance.
Proper mitigation measures will be taken in addition to above for the reduction of noise
levels i.e. use of acoustic enclosures and providing personal protective equipment etc. to
the workers.
Periodical monitoring for noise is being carried out on regular basis.
Proper maintenance, oiling and greasing of machines at regular intervals is done to
minimize generation of noise at source.
2.12. HAZARDOUS WASTE MANAGEMENT
The hazardous waste is generated at various stages of the manufacturing activity. The
mode of disposal is mentioned for each category of waste as per hazardous wastes
(management, handling and transboundary movement) rules, 2016.(As specified under
hazardous wastes / management handling rules 1989) amendment rule 2003.
a. Process wastes/ residue
b. Chemical sludge containing residue
c. Date expired and off-specification drugs
All above waste are will be collected and stored at separate identified place and suitably
disposed off to authorized agencies.
Table 2.8 : Hazardous waste details S.No
Type of Waste
Category ( As per Schedule)
Existing Quantity (TPA/KLA)
(After Expansion Qty) TPA/KLA
Source of Generation
Mode of Storage
Mode of Treatment and Disposal
1 ETP Sludge
35.3 5.160 TPA 8.860 TPA From Effluent Treatment Plant
Stored in Hazardous Waste room in Environmentally Sound Manner
Sent to Authorized Dealer for Disposal
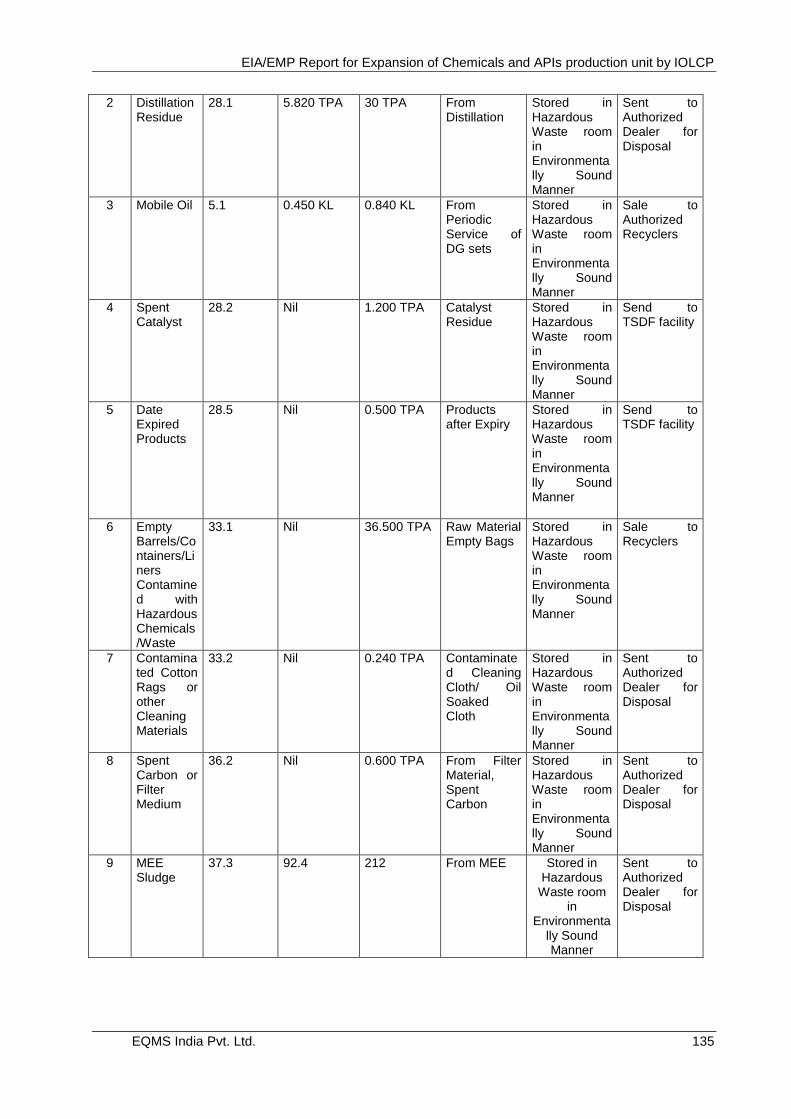
EIA/EMP Report for Expansion of Chemicals and APIs production unit by IOLCP
EQMS India Pvt. Ltd. 135
2 Distillation Residue
28.1 5.820 TPA 30 TPA From Distillation
Stored in Hazardous Waste room in Environmentally Sound Manner
Sent to Authorized Dealer for Disposal
3 Mobile Oil 5.1 0.450 KL 0.840 KL From Periodic Service of DG sets
Stored in Hazardous Waste room in Environmentally Sound Manner
Sale to Authorized Recyclers
4 Spent Catalyst
28.2 Nil 1.200 TPA Catalyst Residue
Stored in Hazardous Waste room in Environmentally Sound Manner
Send to TSDF facility
5 Date Expired Products
28.5 Nil 0.500 TPA Products after Expiry
Stored in Hazardous Waste room in Environmentally Sound Manner
Send to TSDF facility
6 Empty Barrels/Containers/Liners Contamined with Hazardous Chemicals/Waste
33.1 Nil 36.500 TPA Raw Material Empty Bags
Stored in Hazardous Waste room in Environmentally Sound Manner
Sale to Recyclers
7 Contaminated Cotton Rags or other Cleaning Materials
33.2 Nil 0.240 TPA Contaminated Cleaning Cloth/ Oil Soaked Cloth
Stored in Hazardous Waste room in Environmentally Sound Manner
Sent to Authorized Dealer for Disposal
8 Spent Carbon or Filter Medium
36.2 Nil 0.600 TPA From Filter Material, Spent Carbon
Stored in Hazardous Waste room in Environmentally Sound Manner
Sent to Authorized Dealer for Disposal
9 MEE Sludge
37.3 92.4 212 From MEE Stored in Hazardous
Waste room in
Environmentally Sound Manner
Sent to Authorized Dealer for Disposal
EIA/EMP Report for Expansion of Chemicals and APIs production unit by IOLCP
EQMS India Pvt. Ltd. 136
(Source:IOLCP)
2.13. AUXILIARY & GENERAL WELFARE FACILITIES
The following facilities have been considered under this head.
2.13.1. Fire and Safety System:
Site has full-fledged fire and safety system. Site has on-site emergency plan to get the
direction in case of emergency.
The fire and safety system shall be including:
Fire pumps (with emergency power from DG set) – 1 no. including 1 nos. jockey
pump, 1 nos. diesel driven, 1 no‘s electric pumps.
Water reservoir available for firefighting controlling
Full-fledged Emergency control centre
Fire hydrants
Other firefighting equipment including:
2.14. OHS System
IOLCP has well-organized Safety Management system with well defined ―Safety Health
& Environment Policy‖, ―Quality Policy‖. For the proposed expansion project, IOLCP is
committed to the principles of sustainable development. As a part of this commitment,
IOLCP protects the environment in which they operate and ensure the health and safety
of our employees, contractors, visitors and communities. All employees are responsible
for being aware about safety, health and environment needs in their area of work. The
proposed plant will also have these policies in place. The significance of safety & health
in chemical industries has been a vital issue in achieving productivity and an edge in
competitive world. Hence, all the pollution control measures envisaged at feasibility stage
will be implemented with due care.
The proposed plant will be designed as per guidelines comprising of separate entry &exit
for workers and material. The layout of plants will be under purview of various statutory
regulations and these regulations will be reviewed regularly. All reaction vessels will
relate to scrubber so that any toxic fumes/ vapor generated during reaction gets
neutralized.
The proposed plant will have Air Handling Units to keep temperature <25 deg in powder
processing area and filtered air will be supplied in other areas. Dust collector will be
provided in powder processing area to remove dust generated during sifting/ milling of
product. Workers engaged in powder processing work will be provided personal
protective equipment‘s like dust masks, respirators etc.
The proposed plant will be provided with sophisticated instrumentation for continuously
monitoring of operating parameters.
The plant premises will be strictly maintained as a ―NO SMOKING ―area. Firefighting
facility will be provided at site consisting of underground fire hydrant system and various
fire extinguishers.
EIA/EMP Report for Expansion of Chemicals and APIs production unit by IOLCP
EQMS India Pvt. Ltd. 137
For electrical instrumentation and installations, the entire plant will be sub divided into
hazardous and nonhazardous zone. In the hazardous zone, flameproof fittings &fixtures
will be provided. Arrangements will be made in each equipment to avoid static spark.
All reaction vessels will be provided safety valve, rupture disc, pressure gauges etc to
avoid any explosion. Provision for inert gas purging will be there in each reactor to avoid
possibility of developing any hazardous mixture.
The company will have On Site Emergency Plan to handle any emergencies e.g. fire,
chemical spillage and medical arising from any unforeseen reason.
Workers will be trained & make them aware regarding safety and proper hygiene in plant.
All workers will undergo periodic medical examination and will be provided personal
protective equipment‘s for their safety.
Major hazards can be avoided by proper implementation of Maintenance and Inspection
Schedule, Periodic maintenance will be in place to check the various types of
compressors, pumps, fan, and blowers and monitor the vibration level. Compliance of
Statuary Regulations related to Factory act and IBR in which all boilers will be hydro
tested all pressure vessels will be tested for ultrasonic thickness measurement and weld
joint by radiography. All hot/cold surfaces will be insulated. Waste generated during
process will be removed regularly. Proper housekeeping in maintenance block, utility
block will be done to ensure that spillage of oil, litters of maintenance material are
cleared off.
2.15. PROJECT COST ESTIMATES & IMPLEMENTATION SCHEDULE
This is a tentative schedule in which flexibility can be exercised depending upon the
market demand. Estimated project cost along with analysis in terms of economic viability
of the project.
Cost of Estimates of the Proposed Project is 205 crores. Project work will be start after
getting the environmental clearance.
2.16. CSR Activities
Unit has committed to spend about Rs. 1.53 crores (0.75% of the capital investment)
towards CER. But the Approved TOR is for 2.5 % of the project cost and IOLCP follow
the OM issued on dated 1st May 2018, hence earmarked the fund of Rs 1.53 crores. The
amount will be spending in next 3 years for infrastructure development of surrounding
area. Need based survey has been conducted in surrounding villages of the study area
and following facilities will be carried out and it will be continued for proposed expansion
project.
Allocation of funds for Public Development
Providing Bags of sugar to Jangham
Sponsor a child at CRY
Provide education expenditures for the physically disable persons i.e. deaf and
dumb ―Ek Prayas‖ and ―Govind Dham‖
Donation to schools such as Sacred Heart Convent School
Distribution of free medicines to the poor in nearby villages.
EIA/EMP Report for Expansion of Chemicals and APIs production unit by IOLCP
EQMS India Pvt. Ltd. 138
Misc. benefit like providing cash to poor students.
Celebrate Environment Day at Govt High School Village, Handiaya
Distribute Trees to peoples of Govt High School, Handiaya
Donation to NGO for Kedarnath Tragedy
Distribute Blankets and cloths Civil, Hospital, Ludhiana
Celebrate Children day at Govt High School, Longowal
Initiatives taken towards social commitments include:
Zero Tolerance to Narcotics
Zero Tolerance for work force violence
Zero tolerance to product quality by design
EIA/EMP Report for Expansion of Chemicals and APIs production unit by IOLCP
EQMS India Pvt. Ltd. 139
CHAPTER 3. DESCRIPTION OF ENVIRONMENT
3.1 Background and Salient Environmental Features of the Study Area
Generation of environmental baseline of a project area is an important phase of any Environmental
Assessment process. Baseline data provide vital information on the existing environmental quality in
which an expansion is planned. It is also useful for delineating environmental sensitive areas and for
preparing an Environmental Sensitivity Map for contingency planning. In this study, the environmental
characteristics of the project area (10 km study area) were established through extensive literature
search, field sampling/measurements, laboratory analysis, consultation and data interpretation.
Secondary data from literature search were also obtained from the Govt. sources i.e. Meteorological
Department, CPCB publications; Forest Department and other Govt. Sources. The baseline
environmental data generation has been done for the period of 15th March 2018 to 15
th Jun 2018. M/s JP
Test & Research Centre, Sahibabad, Uttar Pradesh with EQMS Team, carried out sampling and testing.
The study area within a 10 km radius around the proposed plant site has been considered as impact
zone for EIA study. Primary and secondary data has been collected for 10 Km radius of the project site.
3.1.1 Environmental Setting and Salient Environmental Features of the Project Area
The proposed project is an expansion project of existing unit situated at village Fatehgarh
Channa on Mansa road, Tehsil & District Barnala Punjab. As per the EIA notification dated 14th
September 2006, as amended till date, the proposed project falls under category 5(f), Synthetic
Organic chemical and site is not located in notified industrial area, hence proposed expansion
project shall be appraised as Category ―A‖ by MOEF&CC. The proposed project is expanding in
an area of 62 acres with a dense green belt of 30 acres (50% of the total plot area).
The proposed site is at a distance of about 1.45 km,SE from village Fatehgarh Channa. State Highway
13 is at a distance of .81 km NW in Direction. Nearest Railway station is Barnala railway station 8.69 km
from the project site and Chandigarh airport is approx. 130 km away in NE direction from project site
(aerial distance). The rail and road connectivity map of the site is provided in Figure 3.1. Nearest
settlement to the site is Fatehgarh Channa 1.47 km. There is no river present within the study area.
This Chapter describes the baseline environmental conditions around the project site for
various environmental attributes, i.e. physical, biological and socio-economic conditions,
within the 10 km radial zone of the proposed project site, which is termed as the study area.
Topography, drainage, meteorology, air, noise, water, soil and land constitute the physical
environment, where as flora and fauna constitute the biological environment. Demographic
details and occupational pattern in the study area constitute socio-economic environment.
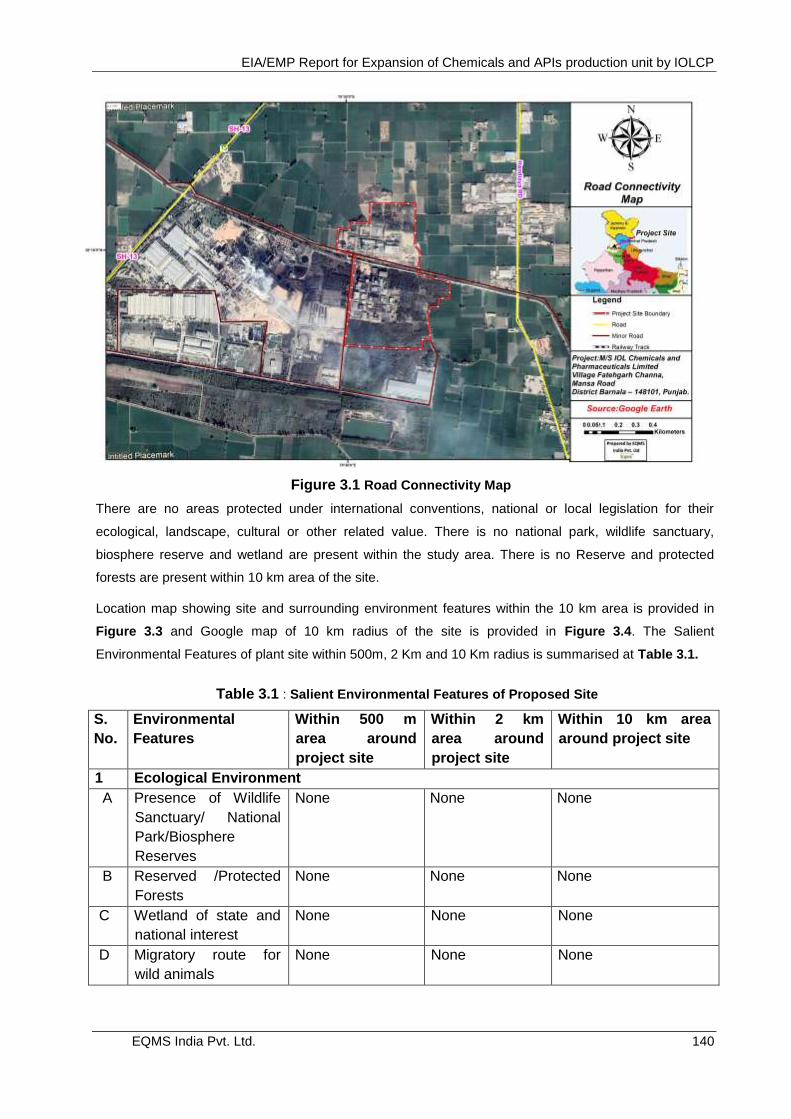
EIA/EMP Report for Expansion of Chemicals and APIs production unit by IOLCP
EQMS India Pvt. Ltd. 140
Figure 3.1 Road Connectivity Map
There are no areas protected under international conventions, national or local legislation for their
ecological, landscape, cultural or other related value. There is no national park, wildlife sanctuary,
biosphere reserve and wetland are present within the study area. There is no Reserve and protected
forests are present within 10 km area of the site.
Location map showing site and surrounding environment features within the 10 km area is provided in
Figure 3.3 and Google map of 10 km radius of the site is provided in Figure 3.4. The Salient
Environmental Features of plant site within 500m, 2 Km and 10 Km radius is summarised at Table 3.1.
Table 3.1 : Salient Environmental Features of Proposed Site
S.
No.
Environmental
Features
Within 500 m
area around
project site
Within 2 km
area around
project site
Within 10 km area
around project site
1 Ecological Environment
A Presence of Wildlife
Sanctuary/ National
Park/Biosphere
Reserves
None None None
B Reserved /Protected
Forests
None None None
C Wetland of state and
national interest
None None None
D Migratory route for
wild animals
None None None
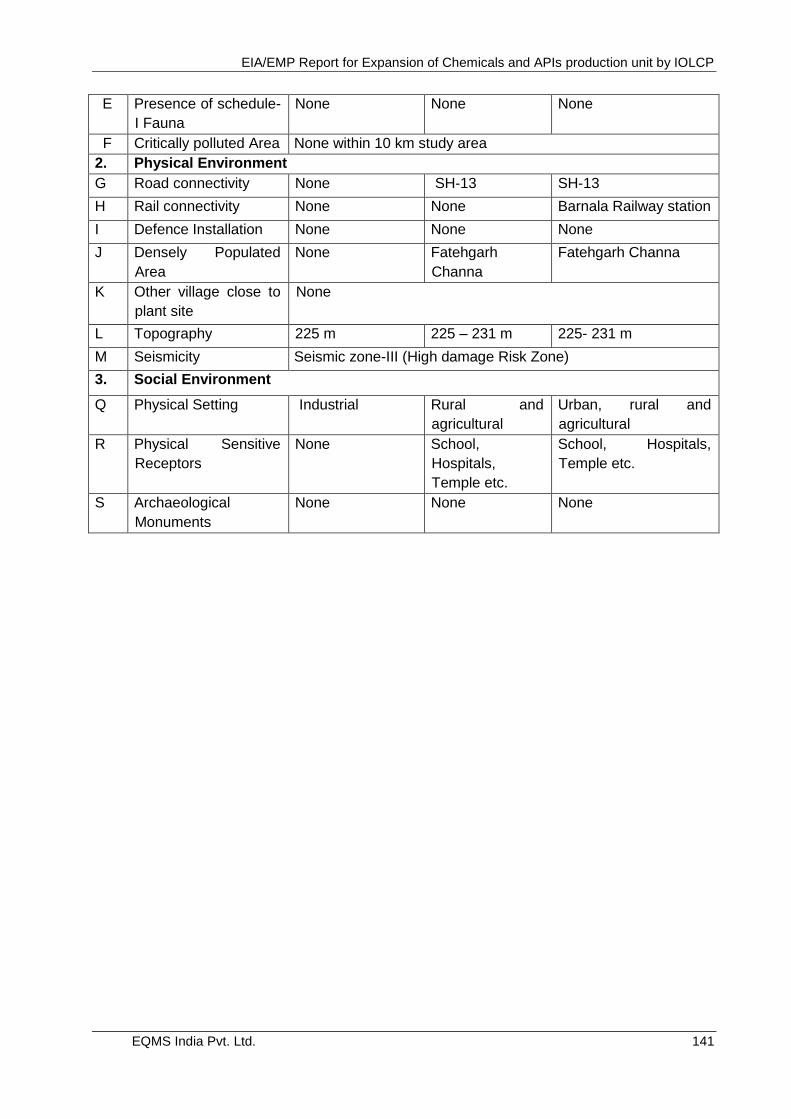
EIA/EMP Report for Expansion of Chemicals and APIs production unit by IOLCP
EQMS India Pvt. Ltd. 141
E Presence of schedule-
I Fauna
None None None
F Critically polluted Area None within 10 km study area
2. Physical Environment
G Road connectivity None SH-13 SH-13
H Rail connectivity None None Barnala Railway station
I Defence Installation None None None
J Densely Populated
Area
None Fatehgarh
Channa
Fatehgarh Channa
K Other village close to
plant site
None
L Topography 225 m 225 – 231 m 225- 231 m
M Seismicity Seismic zone-III (High damage Risk Zone)
3. Social Environment
Q Physical Setting Industrial Rural and
agricultural
Urban, rural and
agricultural
R Physical Sensitive
Receptors
None School,
Hospitals,
Temple etc.
School, Hospitals,
Temple etc.
S Archaeological
Monuments
None None None
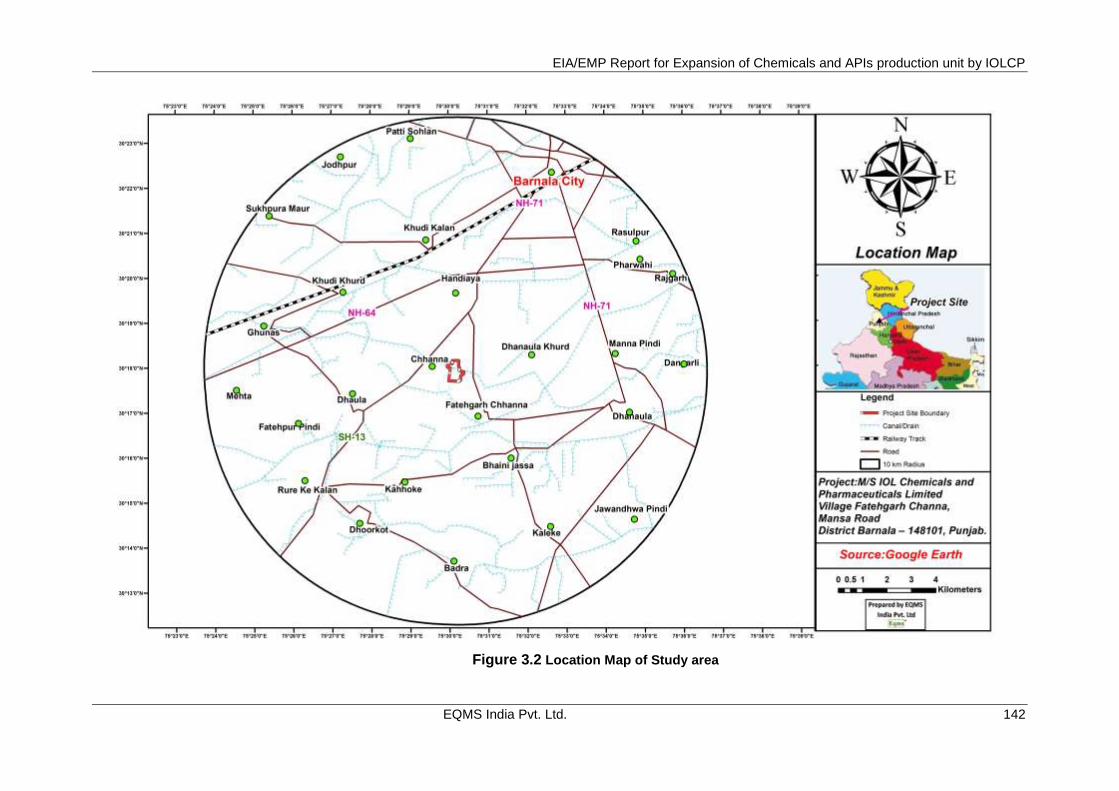
EIA/EMP Report for Expansion of Chemicals and APIs production unit by IOLCP
EQMS India Pvt. Ltd. 142
Figure 3.2 Location Map of Study area
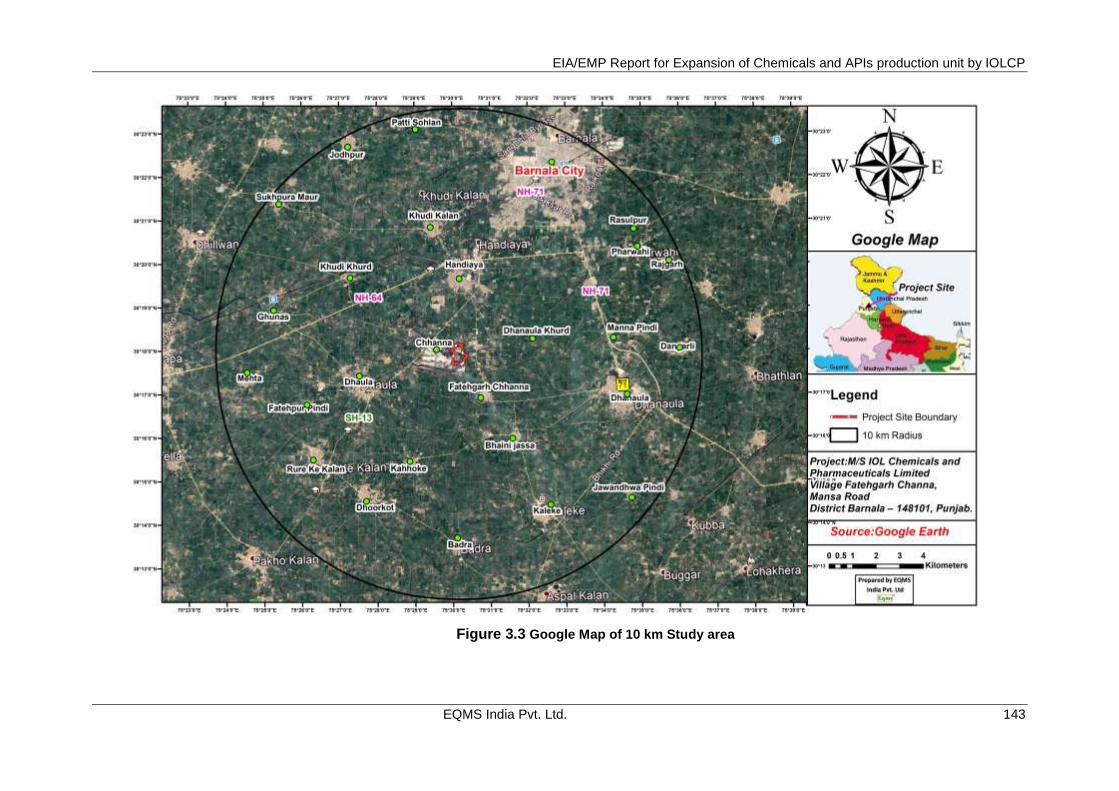
EIA/EMP Report for Expansion of Chemicals and APIs production unit by IOLCP
EQMS India Pvt. Ltd. 143
Figure 3.3 Google Map of 10 km Study area

EIA/EMP Report for Expansion of Chemicals and APIs production unit by IOLCP
EQMS India Pvt. Ltd. 144
3.1.2 Primary Data Collection: Monitoring Plan and Quality Assurance Procedures
Primary baseline data has been collected as per the TOR prescribed by MOEF during 15th March 2018 to
15th June 2018 for one complete season. The study period and methodology for primary data collection is
summarized in Table 3.2.
Table 3.2 : Summary of Methodology for Primary/Secondary Baseline Data Collection
Parameters No. Of
sampling locations
Frequency/ season
Remark
Ambient Air Quality
PM10, PM2.5, SO2 Nox NH3, , CO, HCl
8 locations (Refer Fig.
No.3.5 )
Twice a Week
For Pre-Monsoon season
AAQ monitoring was carried out at 8 locations (representing upwind, downwind and sensitive locations). 24 hours sampling at each location was carried out as per CPCB guide lines (CPCB Gazette notification dated 18.11.2009 on AAQ).
Meteorology
Temperature, Humidity, Wind speed, Direction, Rainfall etc.
One location
Hourly for Pre-
Monsoon season
Met station was established close to the site to record the site-specific hourly met data.
Ground Water Quality
Physical, chemical and biological parameters as per IS
10,500:2012
8 locations
in study area
(Fig 3.5)
Once in a season
Ground water: Sampling was conducted at 8 locations. Samples were preserved, transported and analyzed for different parameters based on APHA methods. Temp, conductivity and pH which were measured instantly at site itself.
Surface Water Quality
Physical, chemical and
biological parameters as per IS: 2296
two locations in study area (Fig 3.6)
Once in a season
Surface Water: Sampling was conducted at two locations. Samples were preserved and transported for analysis for different parameters based on APHA methods. Temp, conductivity, DO and pH which were measured instantly at site itself.
Soil
Texture, bulk density, pH, conductivity, cation exchange capacity, organic matter, Total N,P,K, and Heavy metals etc
6 locations in study area (Fig 3.5)
Once in a season
Soil samples were collected at six locations within the study area and analyzed as per IARI method
Noise
EIA/EMP Report for Expansion of Chemicals and APIs production unit by IOLCP
EQMS India Pvt. Ltd. 145
Parameters No. Of
sampling locations
Frequency/ season
Remark
Noise profiling for 24 hrs 8 locations in
study area (Fig 3.6)
Once in season
Noise monitoring was conducted within the 10 km area of project site for noise profiling for 24 hrs using integrated sound level meter, as per CPCB guidelines.
Ecology (Flora & Fauna)
Flora & Fauna
Once Primary survey and Secondary
sources
Demography & Socio-economics
Demography & Socioeconomic - Once Primary survey/ Secondary sources
Standard methods and procedures have been strictly adhered to in the course of this study. QA/QC
procedures were strictly followed which covers all aspects of the study, and includes sample collection,
handling, laboratory analyses, data coding, statistical analyses, presentation and communication of
results. All analysis was carried out in MoEF accredited/recognized laboratory. Environment sampling
Map is provided in Figure 3.5.
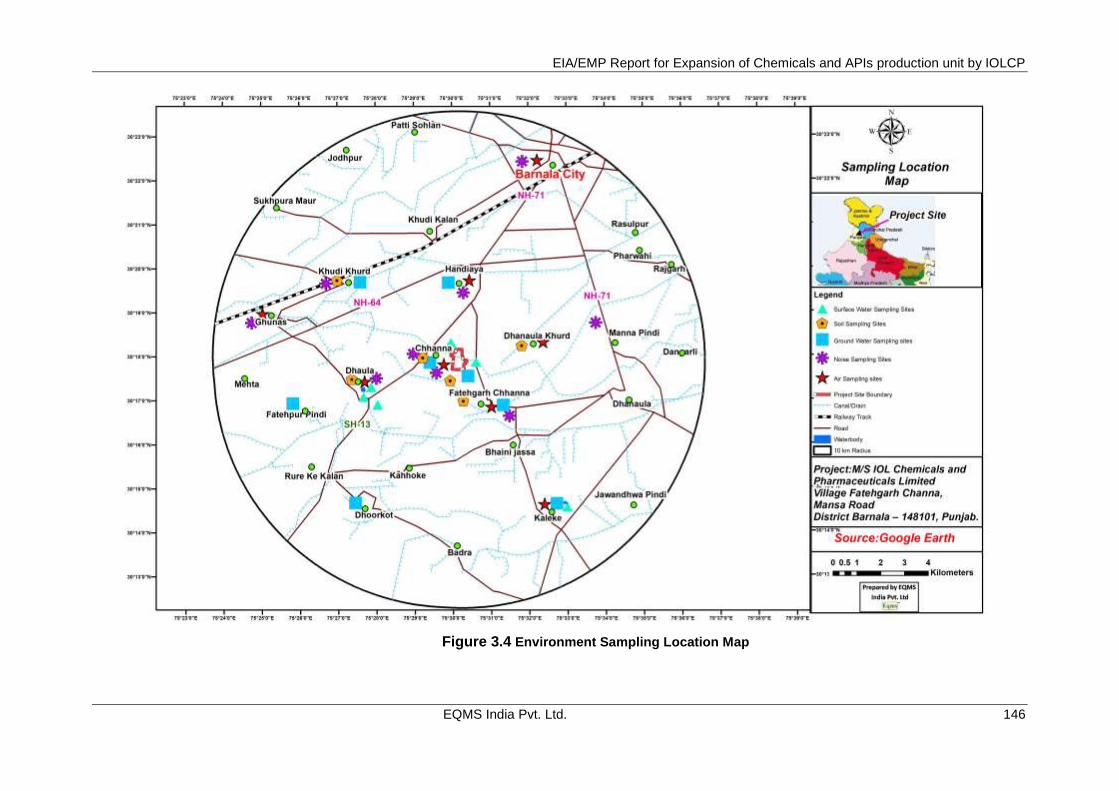
EIA/EMP Report for Expansion of Chemicals and APIs production unit by IOLCP
EQMS India Pvt. Ltd. 146
Figure 3.4 Environment Sampling Location Map
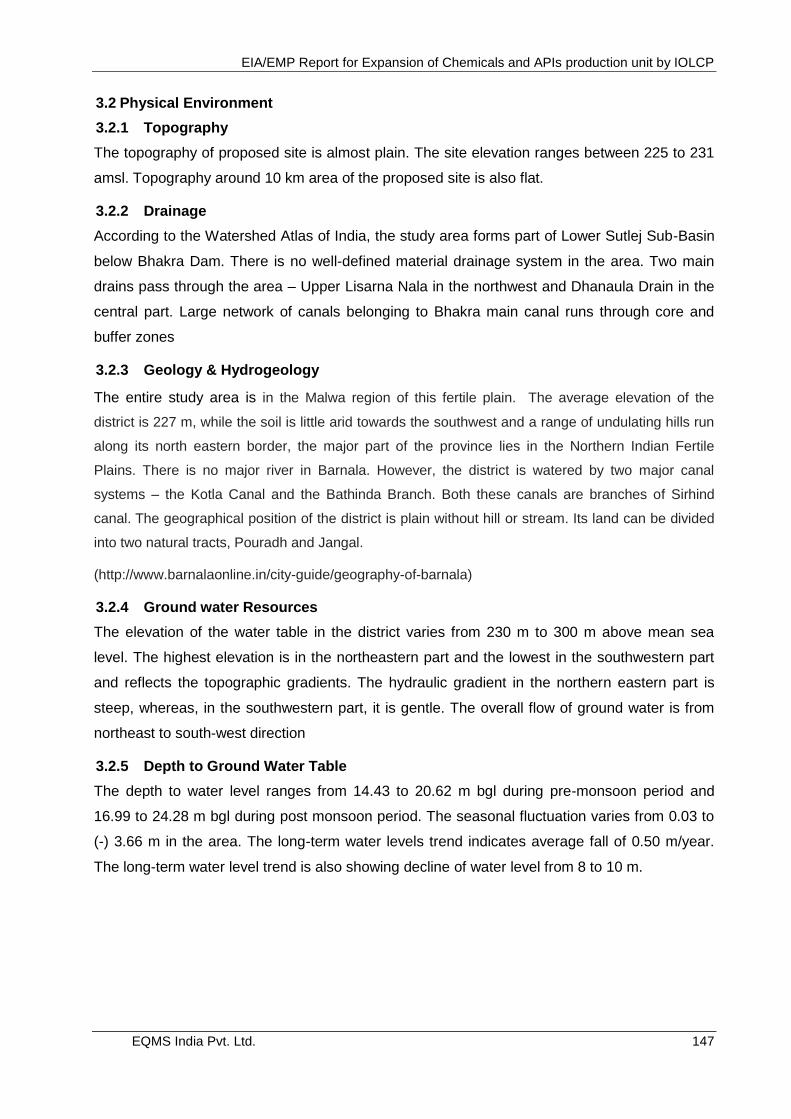
EIA/EMP Report for Expansion of Chemicals and APIs production unit by IOLCP
EQMS India Pvt. Ltd. 147
3.2 Physical Environment
3.2.1 Topography
The topography of proposed site is almost plain. The site elevation ranges between 225 to 231
amsl. Topography around 10 km area of the proposed site is also flat.
3.2.2 Drainage
According to the Watershed Atlas of India, the study area forms part of Lower Sutlej Sub-Basin
below Bhakra Dam. There is no well-defined material drainage system in the area. Two main
drains pass through the area – Upper Lisarna Nala in the northwest and Dhanaula Drain in the
central part. Large network of canals belonging to Bhakra main canal runs through core and
buffer zones
3.2.3 Geology & Hydrogeology
The entire study area is in the Malwa region of this fertile plain. The average elevation of the
district is 227 m, while the soil is little arid towards the southwest and a range of undulating hills run
along its north eastern border, the major part of the province lies in the Northern Indian Fertile
Plains. There is no major river in Barnala. However, the district is watered by two major canal
systems – the Kotla Canal and the Bathinda Branch. Both these canals are branches of Sirhind
canal. The geographical position of the district is plain without hill or stream. Its land can be divided
into two natural tracts, Pouradh and Jangal.
(http://www.barnalaonline.in/city-guide/geography-of-barnala)
3.2.4 Ground water Resources
The elevation of the water table in the district varies from 230 m to 300 m above mean sea
level. The highest elevation is in the northeastern part and the lowest in the southwestern part
and reflects the topographic gradients. The hydraulic gradient in the northern eastern part is
steep, whereas, in the southwestern part, it is gentle. The overall flow of ground water is from
northeast to south-west direction
3.2.5 Depth to Ground Water Table
The depth to water level ranges from 14.43 to 20.62 m bgl during pre-monsoon period and
16.99 to 24.28 m bgl during post monsoon period. The seasonal fluctuation varies from 0.03 to
(-) 3.66 m in the area. The long-term water levels trend indicates average fall of 0.50 m/year.
The long-term water level trend is also showing decline of water level from 8 to 10 m.
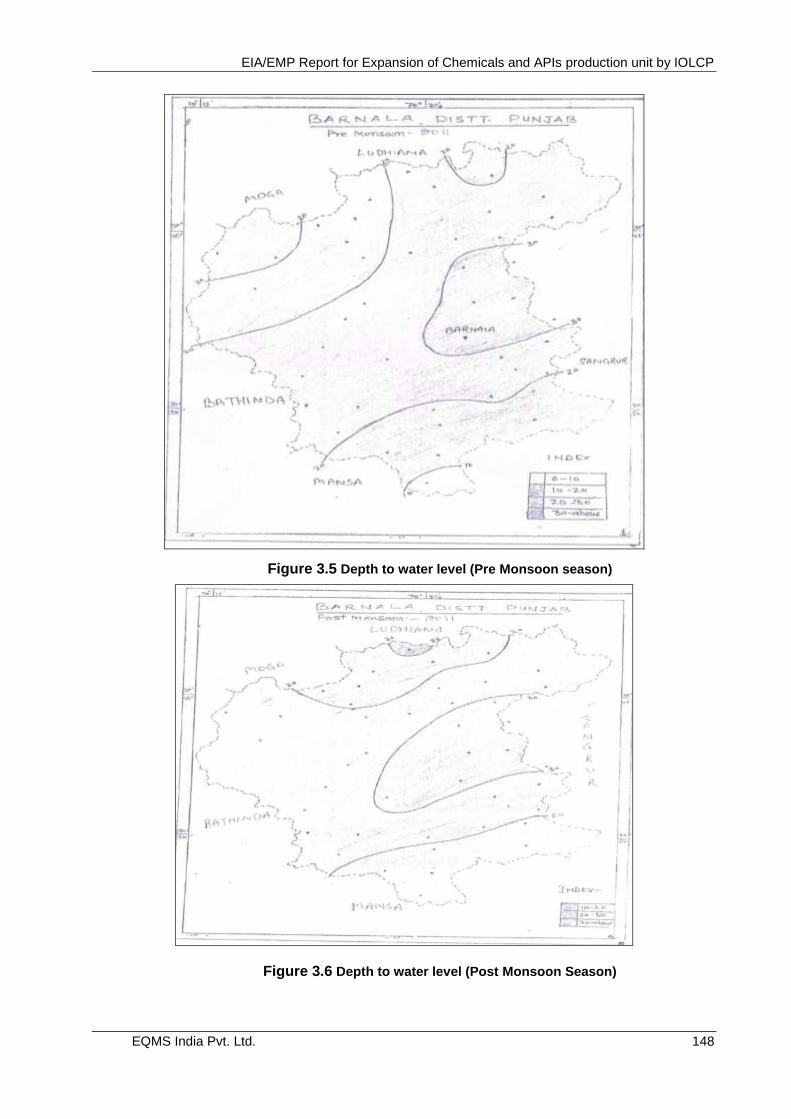
EIA/EMP Report for Expansion of Chemicals and APIs production unit by IOLCP
EQMS India Pvt. Ltd. 148
Figure 3.5 Depth to water level (Pre Monsoon season)
Figure 3.6 Depth to water level (Post Monsoon Season)
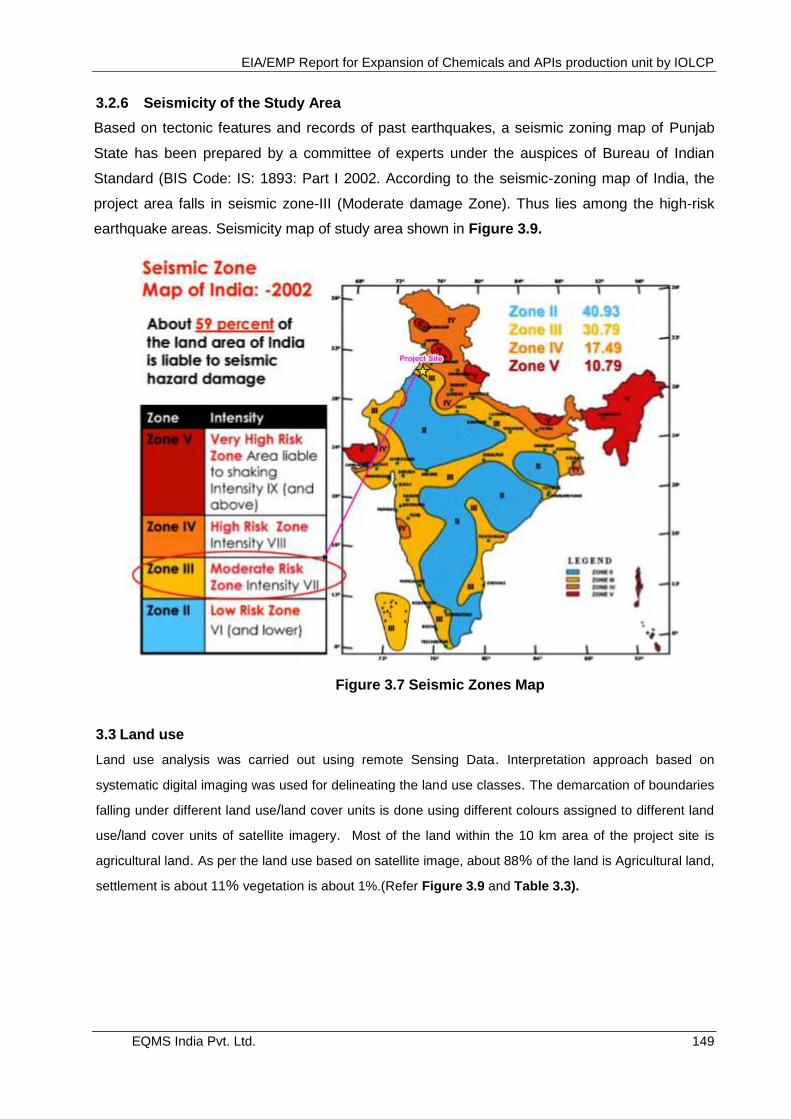
EIA/EMP Report for Expansion of Chemicals and APIs production unit by IOLCP
EQMS India Pvt. Ltd. 149
3.2.6 Seismicity of the Study Area
Based on tectonic features and records of past earthquakes, a seismic zoning map of Punjab
State has been prepared by a committee of experts under the auspices of Bureau of Indian
Standard (BIS Code: IS: 1893: Part I 2002. According to the seismic-zoning map of India, the
project area falls in seismic zone-III (Moderate damage Zone). Thus lies among the high-risk
earthquake areas. Seismicity map of study area shown in Figure 3.9.
Figure 3.7 Seismic Zones Map
3.3 Land use
Land use analysis was carried out using remote Sensing Data. Interpretation approach based on
systematic digital imaging was used for delineating the land use classes. The demarcation of boundaries
falling under different land use/land cover units is done using different colours assigned to different land
use/land cover units of satellite imagery. Most of the land within the 10 km area of the project site is
agricultural land. As per the land use based on satellite image, about 88% of the land is Agricultural land,
settlement is about 11% vegetation is about 1%.(Refer Figure 3.9 and Table 3.3).
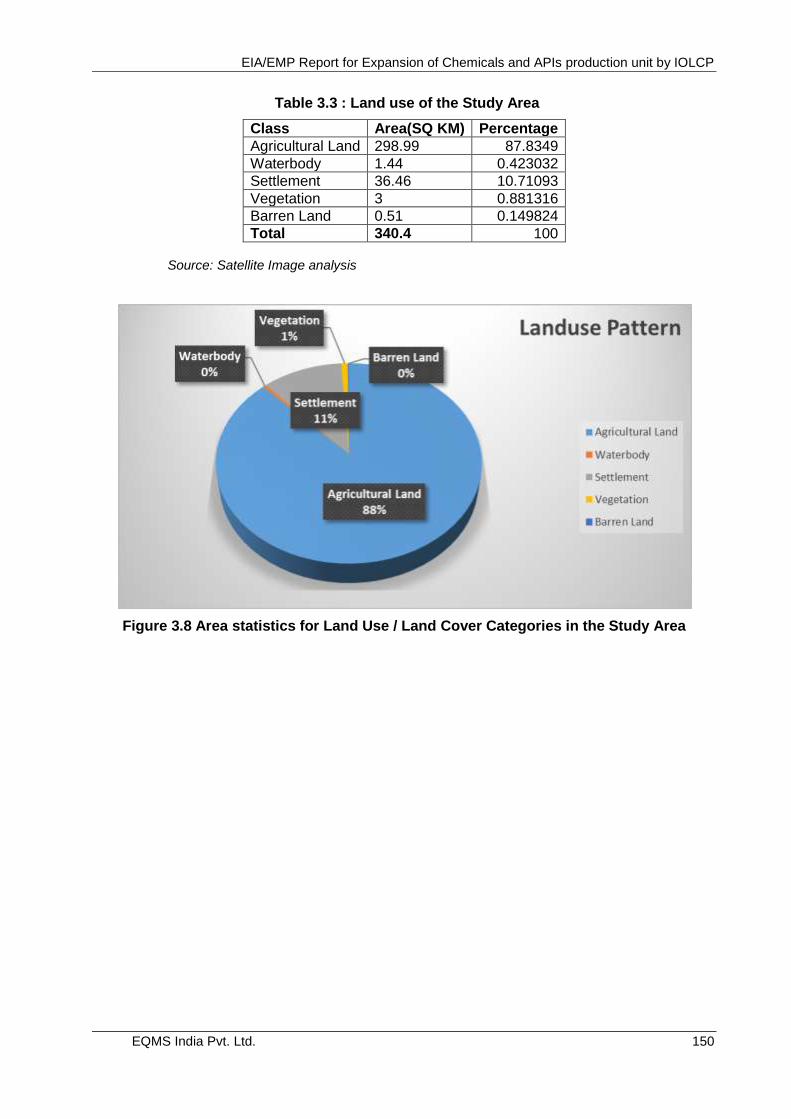
EIA/EMP Report for Expansion of Chemicals and APIs production unit by IOLCP
EQMS India Pvt. Ltd. 150
Table 3.3 : Land use of the Study Area
Class Area(SQ KM) Percentage
Agricultural Land 298.99 87.8349
Waterbody 1.44 0.423032
Settlement 36.46 10.71093
Vegetation 3 0.881316
Barren Land 0.51 0.149824
Total 340.4 100 Source: Satellite Image analysis
Figure 3.8 Area statistics for Land Use / Land Cover Categories in the Study Area
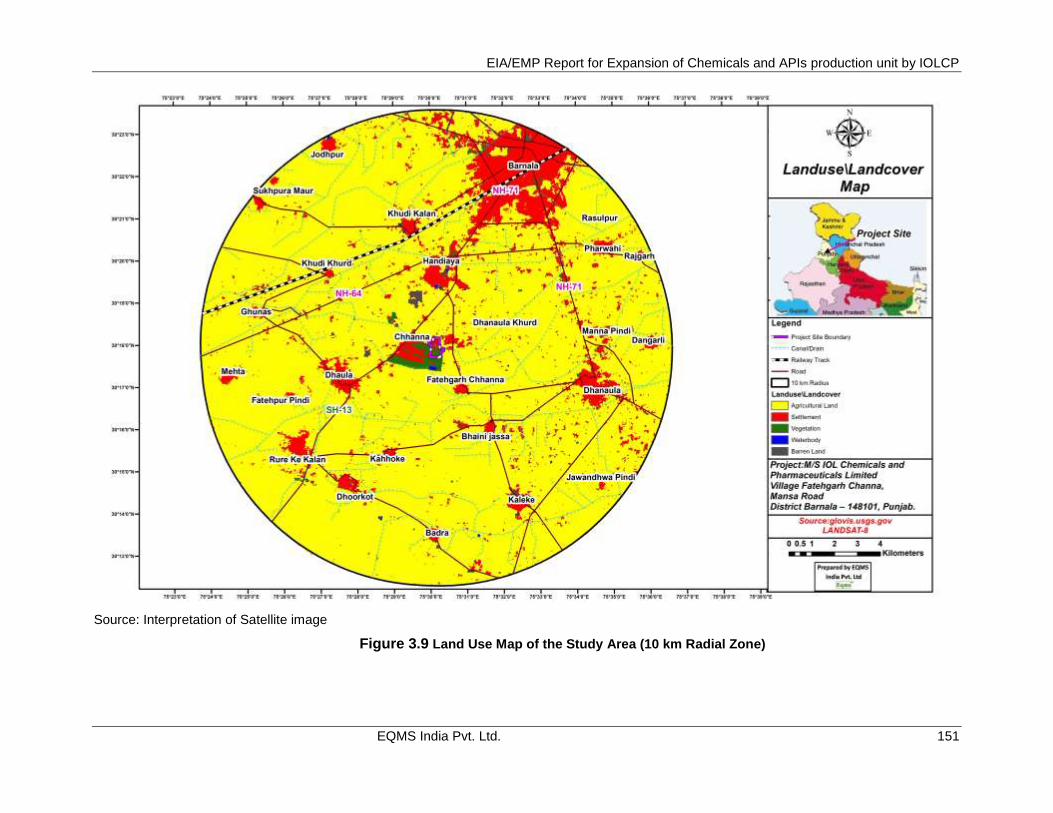
EIA/EMP Report for Expansion of Chemicals and APIs production unit by IOLCP
EQMS India Pvt. Ltd. 151
Source: Interpretation of Satellite image
Figure 3.9 Land Use Map of the Study Area (10 km Radial Zone)
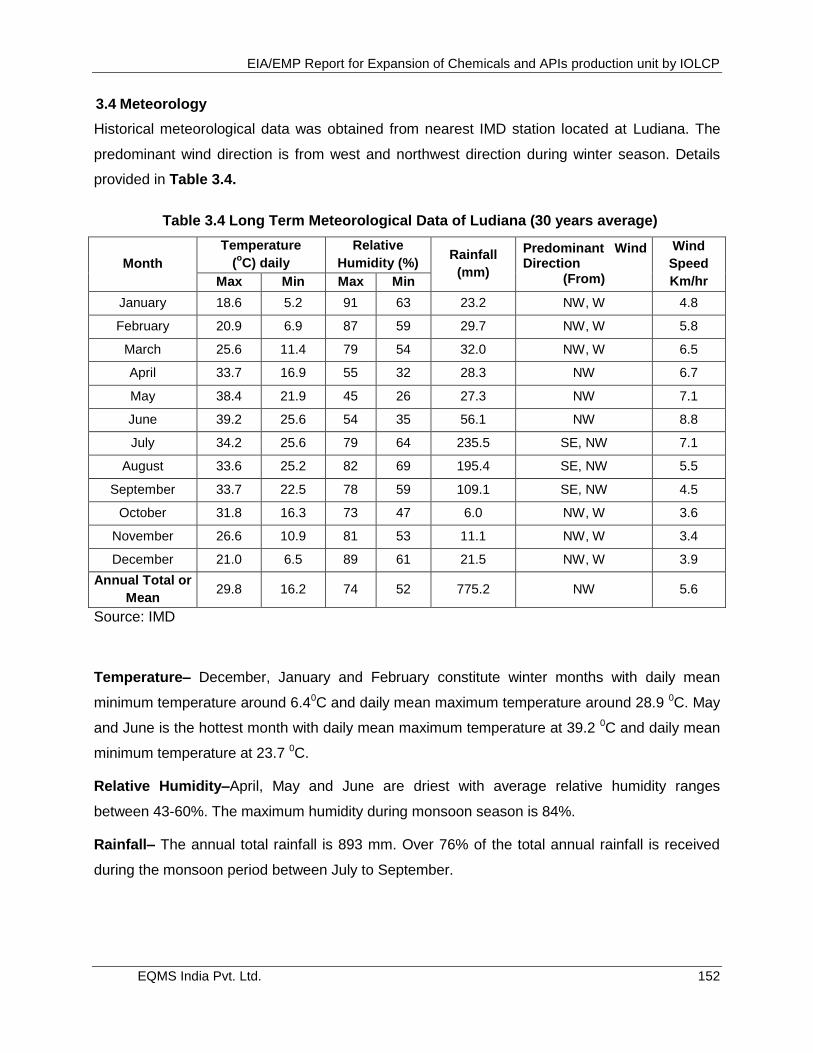
EIA/EMP Report for Expansion of Chemicals and APIs production unit by IOLCP
EQMS India Pvt. Ltd. 152
3.4 Meteorology
Historical meteorological data was obtained from nearest IMD station located at Ludiana. The
predominant wind direction is from west and northwest direction during winter season. Details
provided in Table 3.4.
Table 3.4 Long Term Meteorological Data of Ludiana (30 years average)
Month
Temperature
(oC) daily
Relative
Humidity (%) Rainfall
(mm)
Predominant Wind Direction
(From)
Wind
Speed
Km/hr Max Min Max Min
January 18.6 5.2 91 63 23.2 NW, W 4.8
February 20.9 6.9 87 59 29.7 NW, W 5.8
March 25.6 11.4 79 54 32.0 NW, W 6.5
April 33.7 16.9 55 32 28.3 NW 6.7
May 38.4 21.9 45 26 27.3 NW 7.1
June 39.2 25.6 54 35 56.1 NW 8.8
July 34.2 25.6 79 64 235.5 SE, NW 7.1
August 33.6 25.2 82 69 195.4 SE, NW 5.5
September 33.7 22.5 78 59 109.1 SE, NW 4.5
October 31.8 16.3 73 47 6.0 NW, W 3.6
November 26.6 10.9 81 53 11.1 NW, W 3.4
December 21.0 6.5 89 61 21.5 NW, W 3.9
Annual Total or
Mean 29.8 16.2 74 52 775.2 NW 5.6
Source: IMD
Temperature– December, January and February constitute winter months with daily mean
minimum temperature around 6.40C and daily mean maximum temperature around 28.9 0C. May
and June is the hottest month with daily mean maximum temperature at 39.2 0C and daily mean
minimum temperature at 23.7 0C.
Relative Humidity–April, May and June are driest with average relative humidity ranges
between 43-60%. The maximum humidity during monsoon season is 84%.
Rainfall– The annual total rainfall is 893 mm. Over 76% of the total annual rainfall is received
during the monsoon period between July to September.
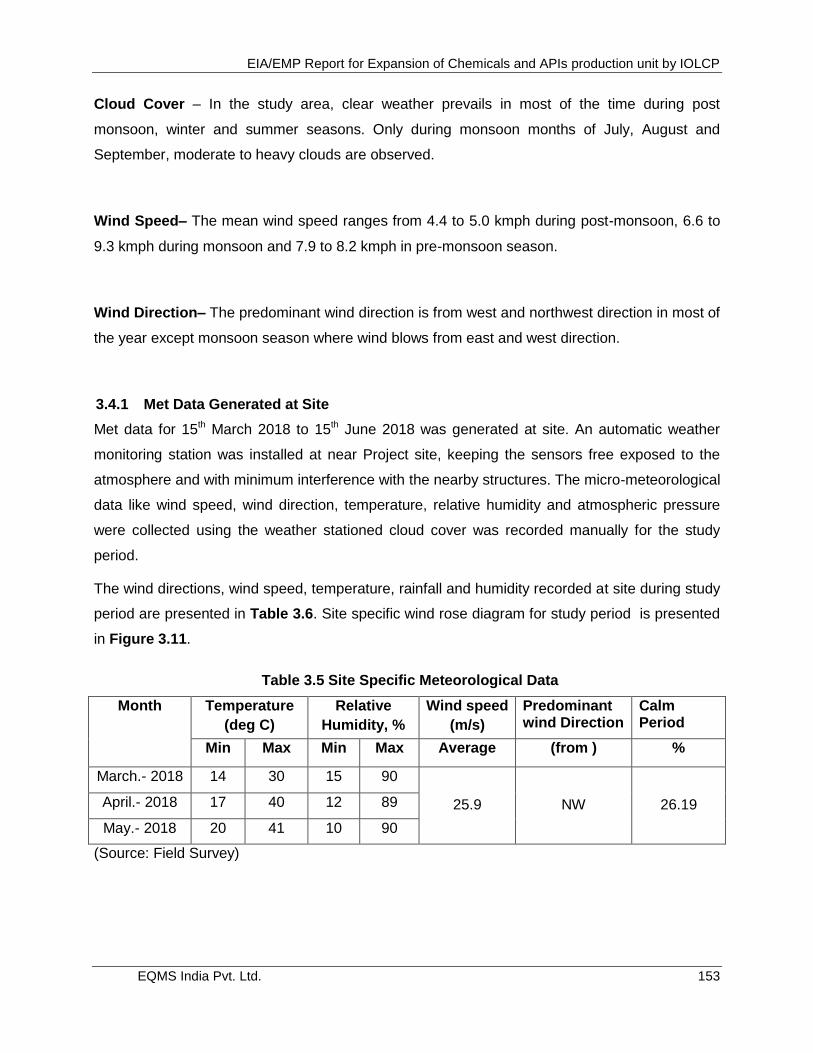
EIA/EMP Report for Expansion of Chemicals and APIs production unit by IOLCP
EQMS India Pvt. Ltd. 153
Cloud Cover – In the study area, clear weather prevails in most of the time during post
monsoon, winter and summer seasons. Only during monsoon months of July, August and
September, moderate to heavy clouds are observed.
Wind Speed– The mean wind speed ranges from 4.4 to 5.0 kmph during post-monsoon, 6.6 to
9.3 kmph during monsoon and 7.9 to 8.2 kmph in pre-monsoon season.
Wind Direction– The predominant wind direction is from west and northwest direction in most of
the year except monsoon season where wind blows from east and west direction.
3.4.1 Met Data Generated at Site
Met data for 15th March 2018 to 15th June 2018 was generated at site. An automatic weather
monitoring station was installed at near Project site, keeping the sensors free exposed to the
atmosphere and with minimum interference with the nearby structures. The micro-meteorological
data like wind speed, wind direction, temperature, relative humidity and atmospheric pressure
were collected using the weather stationed cloud cover was recorded manually for the study
period.
The wind directions, wind speed, temperature, rainfall and humidity recorded at site during study
period are presented in Table 3.6. Site specific wind rose diagram for study period is presented
in Figure 3.11.
Table 3.5 Site Specific Meteorological Data
Month Temperature
(deg C)
Relative
Humidity, %
Wind speed
(m/s)
Predominant wind Direction
Calm Period
Min Max Min Max Average (from ) %
March.- 2018 14 30 15 90
25.9 NW 26.19 April.- 2018 17 40 12 89
May.- 2018 20 41 10 90
(Source: Field Survey)
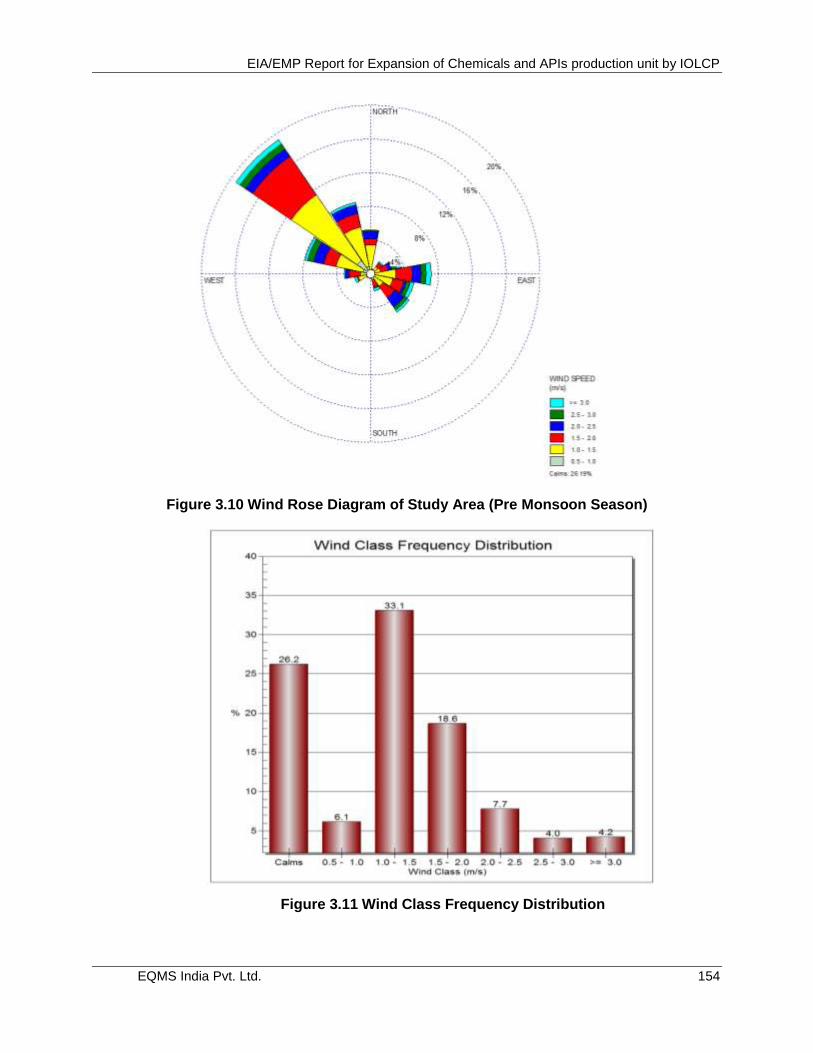
EIA/EMP Report for Expansion of Chemicals and APIs production unit by IOLCP
EQMS India Pvt. Ltd. 154
Figure 3.10 Wind Rose Diagram of Study Area (Pre Monsoon Season)
Figure 3.11 Wind Class Frequency Distribution
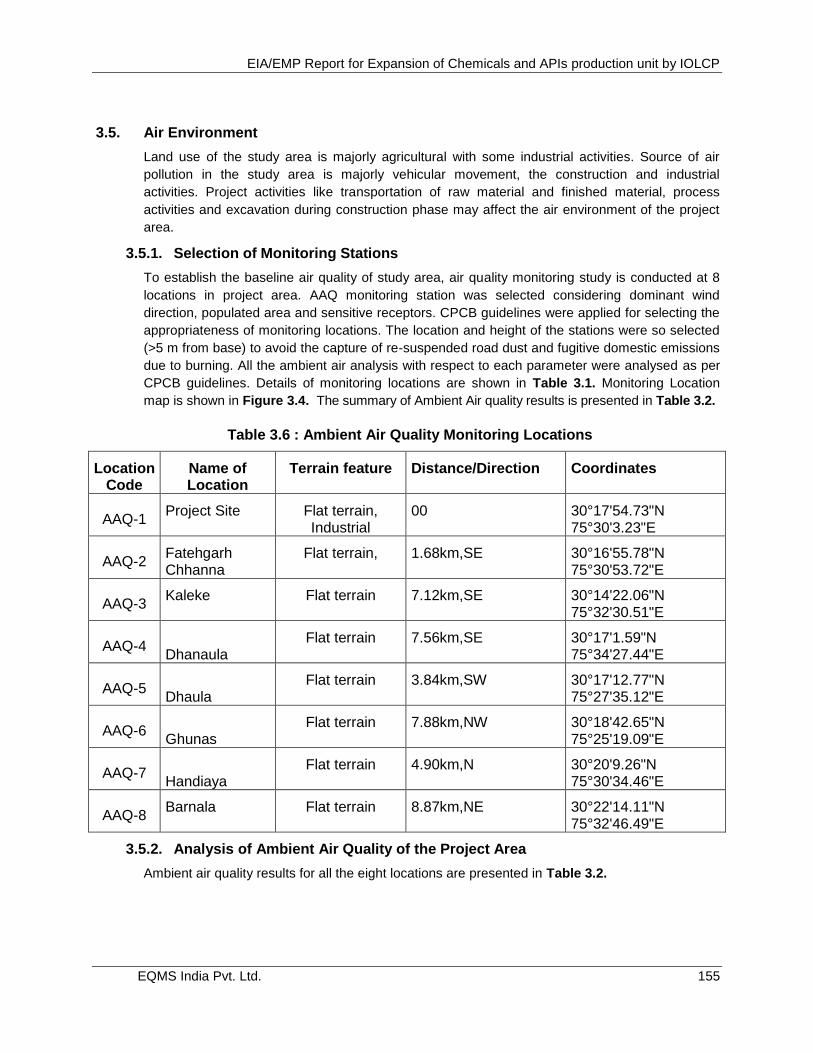
EIA/EMP Report for Expansion of Chemicals and APIs production unit by IOLCP
EQMS India Pvt. Ltd. 155
3.5. Air Environment
Land use of the study area is majorly agricultural with some industrial activities. Source of air
pollution in the study area is majorly vehicular movement, the construction and industrial
activities. Project activities like transportation of raw material and finished material, process
activities and excavation during construction phase may affect the air environment of the project
area.
3.5.1. Selection of Monitoring Stations
To establish the baseline air quality of study area, air quality monitoring study is conducted at 8
locations in project area. AAQ monitoring station was selected considering dominant wind
direction, populated area and sensitive receptors. CPCB guidelines were applied for selecting the
appropriateness of monitoring locations. The location and height of the stations were so selected
(>5 m from base) to avoid the capture of re-suspended road dust and fugitive domestic emissions
due to burning. All the ambient air analysis with respect to each parameter were analysed as per
CPCB guidelines. Details of monitoring locations are shown in Table 3.1. Monitoring Location
map is shown in Figure 3.4. The summary of Ambient Air quality results is presented in Table 3.2.
Table 3.6 : Ambient Air Quality Monitoring Locations
Location Code
Name of Location
Terrain feature Distance/Direction Coordinates
AAQ-1 Project Site Flat terrain,
Industrial 00 30°17'54.73"N
75°30'3.23"E
AAQ-2 Fatehgarh Chhanna
Flat terrain, 1.68km,SE 30°16'55.78"N 75°30'53.72"E
AAQ-3 Kaleke Flat terrain 7.12km,SE 30°14'22.06"N
75°32'30.51"E
AAQ-4 Dhanaula
Flat terrain 7.56km,SE 30°17'1.59"N 75°34'27.44"E
AAQ-5 Dhaula
Flat terrain 3.84km,SW 30°17'12.77"N 75°27'35.12"E
AAQ-6 Ghunas
Flat terrain 7.88km,NW 30°18'42.65"N 75°25'19.09"E
AAQ-7 Handiaya
Flat terrain 4.90km,N 30°20'9.26"N 75°30'34.46"E
AAQ-8 Barnala Flat terrain 8.87km,NE 30°22'14.11"N
75°32'46.49"E
3.5.2. Analysis of Ambient Air Quality of the Project Area
Ambient air quality results for all the eight locations are presented in Table 3.2.
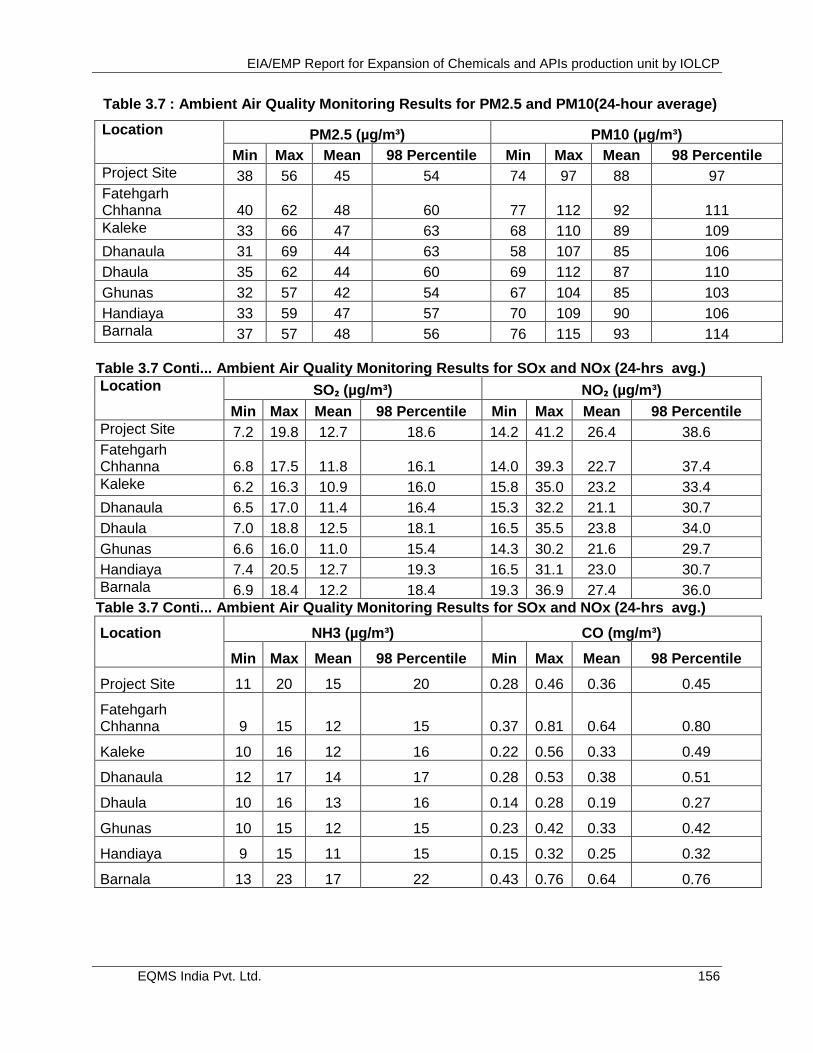
EIA/EMP Report for Expansion of Chemicals and APIs production unit by IOLCP
EQMS India Pvt. Ltd. 156
Table 3.7 : Ambient Air Quality Monitoring Results for PM2.5 and PM10(24-hour average)
Location PM2.5 (µg/m³) PM10 (µg/m³)
Min Max Mean 98 Percentile Min Max Mean 98 Percentile
Project Site 38 56 45 54 74 97 88 97
Fatehgarh Chhanna 40 62 48 60 77 112 92 111
Kaleke 33 66 47 63 68 110 89 109
Dhanaula 31 69 44 63 58 107 85 106
Dhaula 35 62 44 60 69 112 87 110
Ghunas 32 57 42 54 67 104 85 103
Handiaya 33 59 47 57 70 109 90 106
Barnala 37 57 48 56 76 115 93 114
Table 3.7 Conti... Ambient Air Quality Monitoring Results for SOx and NOx (24-hrs avg.)
Location SO₂ (µg/m³) NO₂ (µg/m³)
Min Max Mean 98 Percentile Min Max Mean 98 Percentile
Project Site 7.2 19.8 12.7 18.6 14.2 41.2 26.4 38.6
Fatehgarh Chhanna 6.8 17.5 11.8 16.1 14.0 39.3 22.7 37.4
Kaleke 6.2 16.3 10.9 16.0 15.8 35.0 23.2 33.4
Dhanaula 6.5 17.0 11.4 16.4 15.3 32.2 21.1 30.7
Dhaula 7.0 18.8 12.5 18.1 16.5 35.5 23.8 34.0
Ghunas 6.6 16.0 11.0 15.4 14.3 30.2 21.6 29.7
Handiaya 7.4 20.5 12.7 19.3 16.5 31.1 23.0 30.7
Barnala 6.9 18.4 12.2 18.4 19.3 36.9 27.4 36.0
Table 3.7 Conti... Ambient Air Quality Monitoring Results for SOx and NOx (24-hrs avg.)
Location NH3 (µg/m³) CO (mg/m³)
Min Max Mean 98 Percentile Min Max Mean 98 Percentile
Project Site 11 20 15 20 0.28 0.46 0.36 0.45
Fatehgarh Chhanna 9 15 12 15 0.37 0.81 0.64 0.80
Kaleke 10 16 12 16 0.22 0.56 0.33 0.49
Dhanaula 12 17 14 17 0.28 0.53 0.38 0.51
Dhaula 10 16 13 16 0.14 0.28 0.19 0.27
Ghunas 10 15 12 15 0.23 0.42 0.33 0.42
Handiaya 9 15 11 15 0.15 0.32 0.25 0.32
Barnala 13 23 17 22 0.43 0.76 0.64 0.76
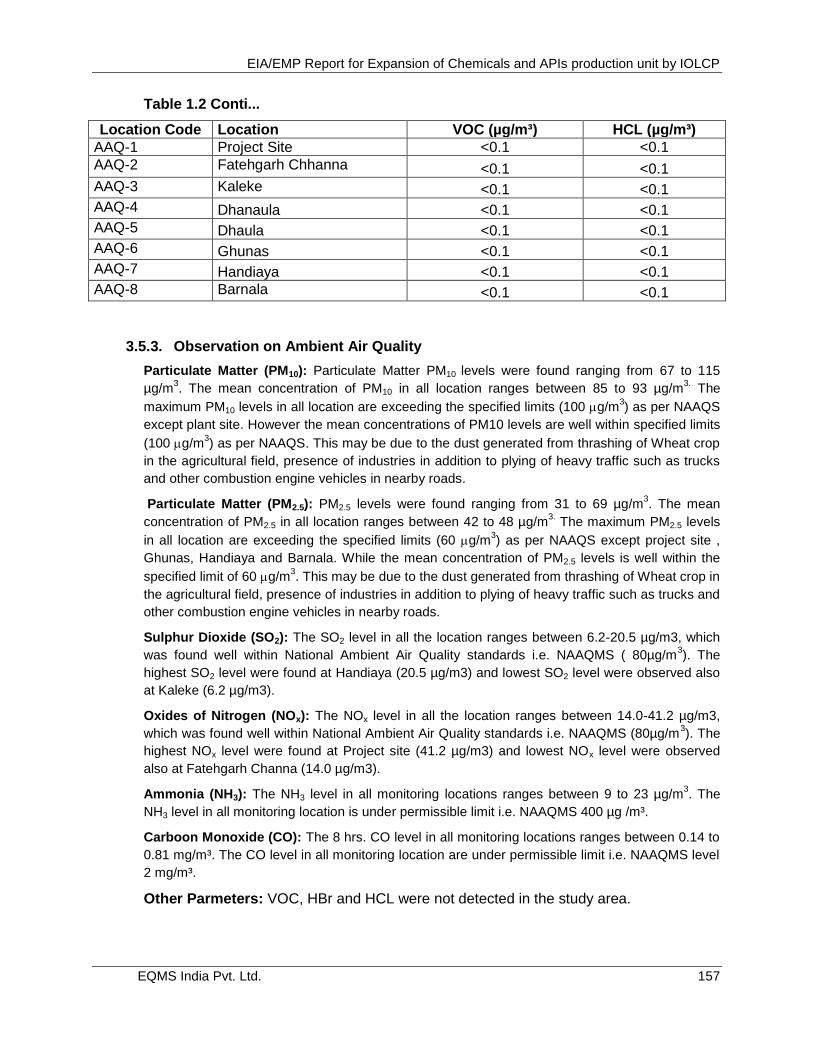
EIA/EMP Report for Expansion of Chemicals and APIs production unit by IOLCP
EQMS India Pvt. Ltd. 157
Table 1.2 Conti...
Location Code Location VOC (µg/m³) HCL (µg/m³)
AAQ-1 Project Site <0.1 <0.1 AAQ-2 Fatehgarh Chhanna <0.1 <0.1 AAQ-3 Kaleke <0.1 <0.1 AAQ-4 Dhanaula <0.1 <0.1 AAQ-5 Dhaula <0.1 <0.1 AAQ-6 Ghunas <0.1 <0.1 AAQ-7 Handiaya <0.1 <0.1 AAQ-8 Barnala <0.1 <0.1
3.5.3. Observation on Ambient Air Quality
Particulate Matter (PM10): Particulate Matter PM10 levels were found ranging from 67 to 115
µg/m3. The mean concentration of PM10 in all location ranges between 85 to 93 µg/m
3. The
maximum PM10 levels in all location are exceeding the specified limits (100 g/m3) as per NAAQS
except plant site. However the mean concentrations of PM10 levels are well within specified limits
(100 g/m3) as per NAAQS. This may be due to the dust generated from thrashing of Wheat crop
in the agricultural field, presence of industries in addition to plying of heavy traffic such as trucks
and other combustion engine vehicles in nearby roads.
Particulate Matter (PM2.5): PM2.5 levels were found ranging from 31 to 69 µg/m3. The mean
concentration of PM2.5 in all location ranges between 42 to 48 µg/m3. The maximum PM2.5 levels
in all location are exceeding the specified limits (60 g/m3) as per NAAQS except project site ,
Ghunas, Handiaya and Barnala. While the mean concentration of PM2.5 levels is well within the
specified limit of 60 g/m3. This may be due to the dust generated from thrashing of Wheat crop in
the agricultural field, presence of industries in addition to plying of heavy traffic such as trucks and
other combustion engine vehicles in nearby roads.
Sulphur Dioxide (SO2): The SO2 level in all the location ranges between 6.2-20.5 µg/m3, which
was found well within National Ambient Air Quality standards i.e. NAAQMS ( 80µg/m3). The
highest SO2 level were found at Handiaya (20.5 µg/m3) and lowest SO2 level were observed also
at Kaleke (6.2 µg/m3).
Oxides of Nitrogen (NOx): The NOx level in all the location ranges between 14.0-41.2 µg/m3,
which was found well within National Ambient Air Quality standards i.e. NAAQMS (80µg/m3). The
highest NOx level were found at Project site (41.2 µg/m3) and lowest NOx level were observed
also at Fatehgarh Channa (14.0 µg/m3).
Ammonia (NH3): The NH3 level in all monitoring locations ranges between 9 to 23 µg/m3. The
NH3 level in all monitoring location is under permissible limit i.e. NAAQMS 400 µg /m³.
Carboon Monoxide (CO): The 8 hrs. CO level in all monitoring locations ranges between 0.14 to
0.81 mg/m³. The CO level in all monitoring location are under permissible limit i.e. NAAQMS level
2 mg/m³.
Other Parmeters: VOC, HBr and HCL were not detected in the study area.
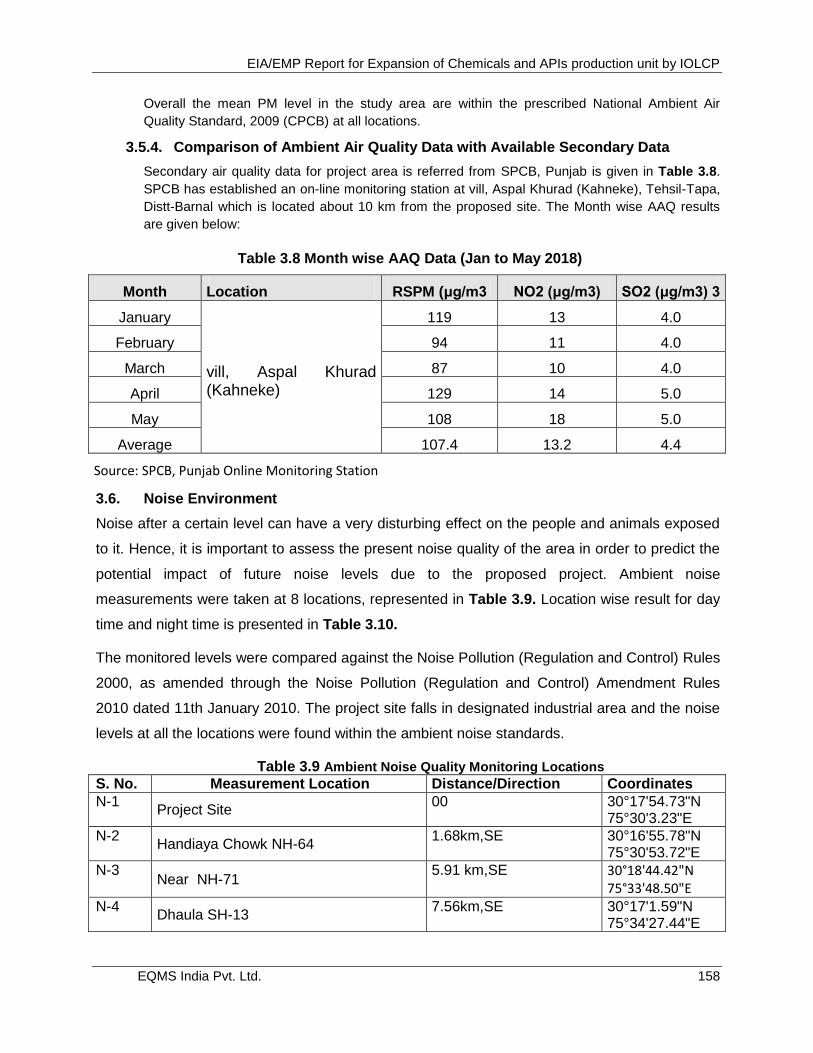
EIA/EMP Report for Expansion of Chemicals and APIs production unit by IOLCP
EQMS India Pvt. Ltd. 158
Overall the mean PM level in the study area are within the prescribed National Ambient Air
Quality Standard, 2009 (CPCB) at all locations.
3.5.4. Comparison of Ambient Air Quality Data with Available Secondary Data
Secondary air quality data for project area is referred from SPCB, Punjab is given in Table 3.8.
SPCB has established an on-line monitoring station at vill, Aspal Khurad (Kahneke), Tehsil-Tapa,
Distt-Barnal which is located about 10 km from the proposed site. The Month wise AAQ results
are given below:
Table 3.8 Month wise AAQ Data (Jan to May 2018)
Month Location RSPM (μg/m3 NO2 (μg/m3) SO2 (μg/m3) 3
January
vill, Aspal Khurad (Kahneke)
119 13 4.0
February 94 11 4.0
March 87 10 4.0
April 129 14 5.0
May 108 18 5.0
Average 107.4 13.2 4.4
Source: SPCB, Punjab Online Monitoring Station
3.6. Noise Environment
Noise after a certain level can have a very disturbing effect on the people and animals exposed
to it. Hence, it is important to assess the present noise quality of the area in order to predict the
potential impact of future noise levels due to the proposed project. Ambient noise
measurements were taken at 8 locations, represented in Table 3.9. Location wise result for day
time and night time is presented in Table 3.10.
The monitored levels were compared against the Noise Pollution (Regulation and Control) Rules
2000, as amended through the Noise Pollution (Regulation and Control) Amendment Rules
2010 dated 11th January 2010. The project site falls in designated industrial area and the noise
levels at all the locations were found within the ambient noise standards.
Table 3.9 Ambient Noise Quality Monitoring Locations
S. No. Measurement Location Distance/Direction Coordinates
N-1 Project Site
00 30°17'54.73"N 75°30'3.23"E
N-2 Handiaya Chowk NH-64
1.68km,SE 30°16'55.78"N 75°30'53.72"E
N-3 Near NH-71
5.91 km,SE 30°18'44.42"N 75°33'48.50"E
N-4 Dhaula SH-13
7.56km,SE 30°17'1.59"N 75°34'27.44"E
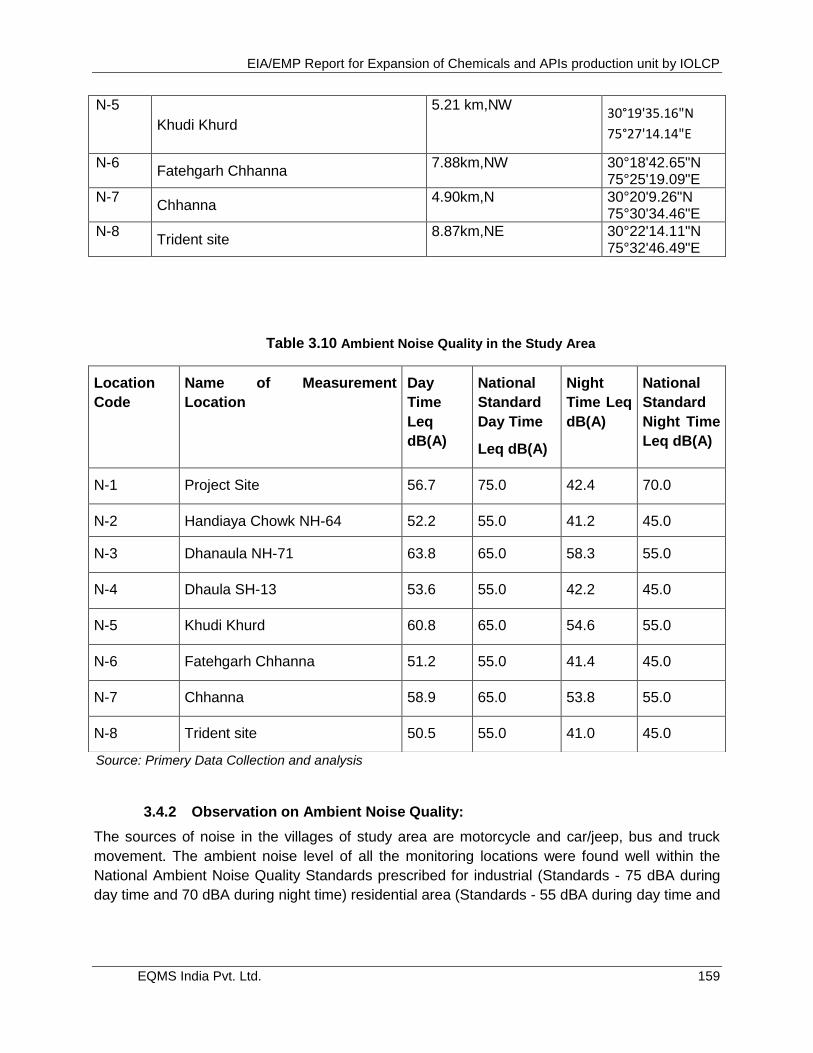
EIA/EMP Report for Expansion of Chemicals and APIs production unit by IOLCP
EQMS India Pvt. Ltd. 159
N-5
Khudi Khurd
5.21 km,NW 30°19'35.16"N
75°27'14.14"E
N-6 Fatehgarh Chhanna
7.88km,NW 30°18'42.65"N 75°25'19.09"E
N-7 Chhanna
4.90km,N 30°20'9.26"N 75°30'34.46"E
N-8 Trident site
8.87km,NE 30°22'14.11"N 75°32'46.49"E
Table 3.10 Ambient Noise Quality in the Study Area
Source: Primery Data Collection and analysis
3.4.2 Observation on Ambient Noise Quality:
The sources of noise in the villages of study area are motorcycle and car/jeep, bus and truck
movement. The ambient noise level of all the monitoring locations were found well within the
National Ambient Noise Quality Standards prescribed for industrial (Standards - 75 dBA during
day time and 70 dBA during night time) residential area (Standards - 55 dBA during day time and
Location
Code
Name of Measurement
Location
Day
Time
Leq
dB(A)
National
Standard
Day Time
Leq dB(A)
Night
Time Leq
dB(A)
National
Standard
Night Time
Leq dB(A)
N-1 Project Site 56.7 75.0 42.4 70.0
N-2 Handiaya Chowk NH-64 52.2 55.0 41.2 45.0
N-3 Dhanaula NH-71 63.8 65.0 58.3 55.0
N-4 Dhaula SH-13 53.6 55.0 42.2 45.0
N-5 Khudi Khurd 60.8 65.0 54.6 55.0
N-6 Fatehgarh Chhanna 51.2 55.0 41.4 45.0
N-7 Chhanna 58.9 65.0 53.8 55.0
N-8 Trident site 50.5 55.0 41.0 45.0
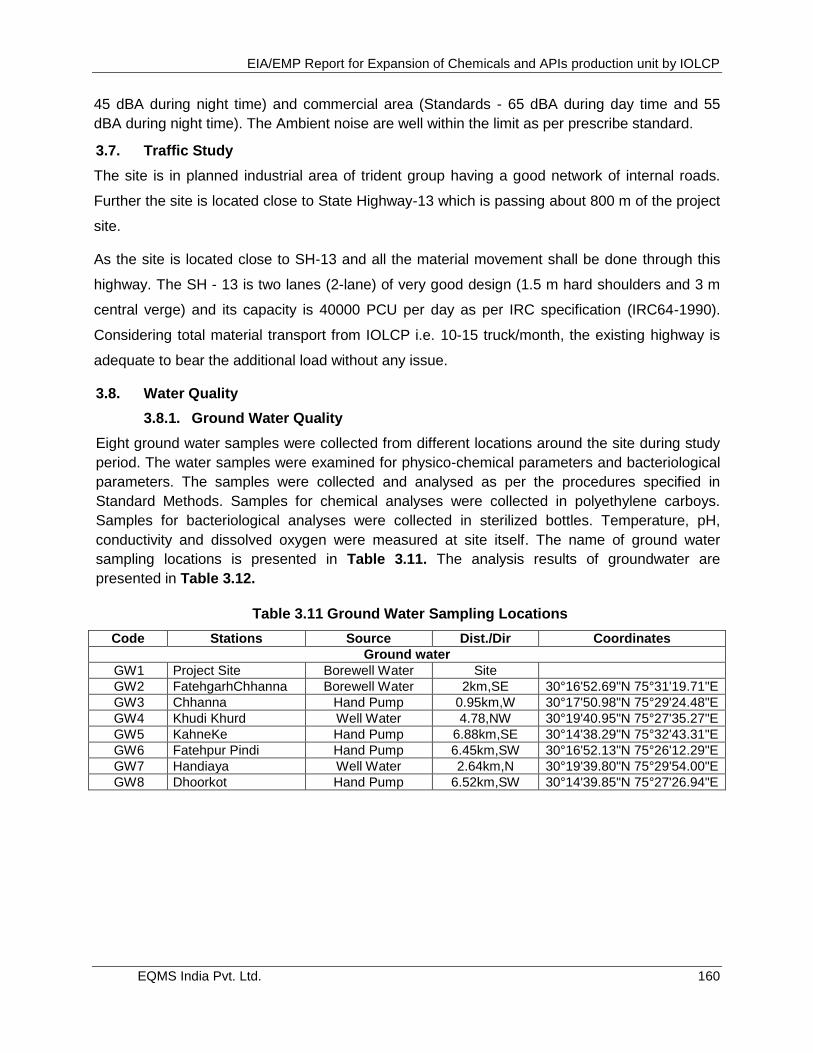
EIA/EMP Report for Expansion of Chemicals and APIs production unit by IOLCP
EQMS India Pvt. Ltd. 160
45 dBA during night time) and commercial area (Standards - 65 dBA during day time and 55
dBA during night time). The Ambient noise are well within the limit as per prescribe standard.
3.7. Traffic Study
The site is in planned industrial area of trident group having a good network of internal roads.
Further the site is located close to State Highway-13 which is passing about 800 m of the project
site.
As the site is located close to SH-13 and all the material movement shall be done through this
highway. The SH - 13 is two lanes (2-lane) of very good design (1.5 m hard shoulders and 3 m
central verge) and its capacity is 40000 PCU per day as per IRC specification (IRC64-1990).
Considering total material transport from IOLCP i.e. 10-15 truck/month, the existing highway is
adequate to bear the additional load without any issue.
3.8. Water Quality
3.8.1. Ground Water Quality
Eight ground water samples were collected from different locations around the site during study
period. The water samples were examined for physico-chemical parameters and bacteriological
parameters. The samples were collected and analysed as per the procedures specified in
Standard Methods. Samples for chemical analyses were collected in polyethylene carboys.
Samples for bacteriological analyses were collected in sterilized bottles. Temperature, pH,
conductivity and dissolved oxygen were measured at site itself. The name of ground water
sampling locations is presented in Table 3.11. The analysis results of groundwater are
presented in Table 3.12.
Table 3.11 Ground Water Sampling Locations
Code Stations Source Dist./Dir Coordinates
Ground water
GW1 Project Site Borewell Water Site
GW2 FatehgarhChhanna Borewell Water 2km,SE 30°16'52.69"N 75°31'19.71"E
GW3 Chhanna Hand Pump 0.95km,W 30°17'50.98"N 75°29'24.48"E
GW4 Khudi Khurd Well Water 4.78,NW 30°19'40.95"N 75°27'35.27"E
GW5 KahneKe Hand Pump 6.88km,SE 30°14'38.29"N 75°32'43.31"E
GW6 Fatehpur Pindi Hand Pump 6.45km,SW 30°16'52.13"N 75°26'12.29"E
GW7 Handiaya Well Water 2.64km,N 30°19'39.80"N 75°29'54.00"E
GW8 Dhoorkot Hand Pump 6.52km,SW 30°14'39.85"N 75°27'26.94"E
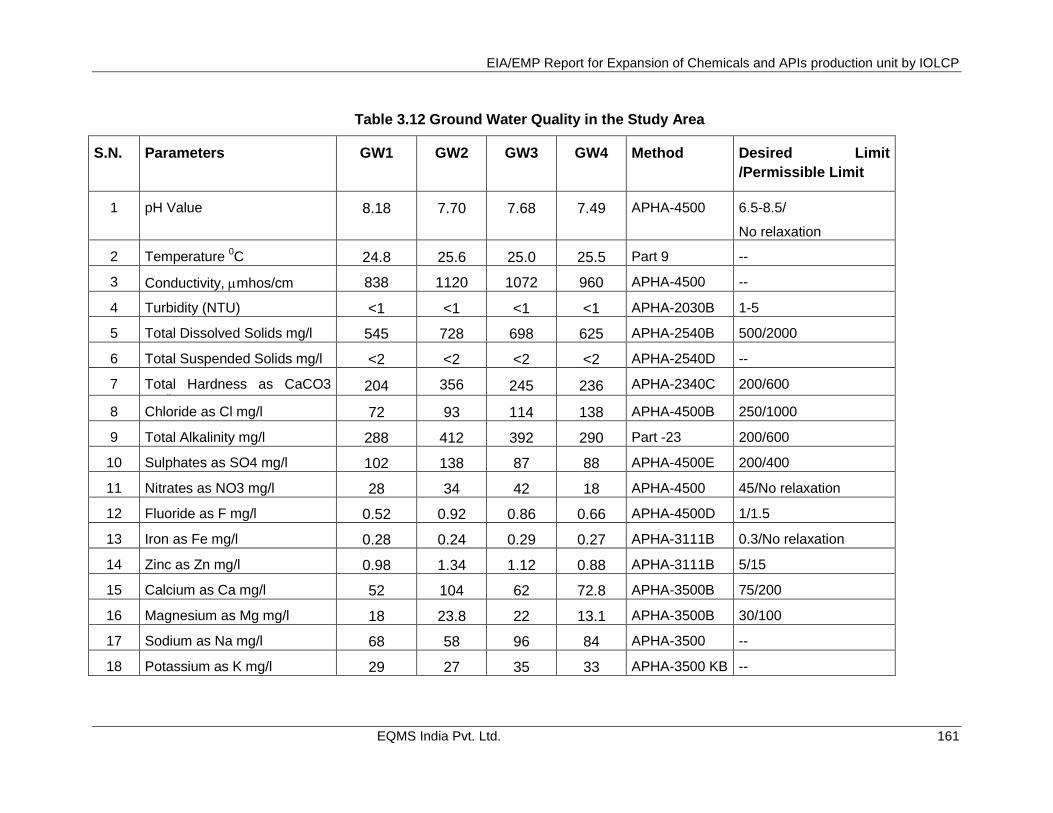
EIA/EMP Report for Expansion of Chemicals and APIs production unit by IOLCP
EQMS India Pvt. Ltd. 161
Table 3.12 Ground Water Quality in the Study Area
S.N. Parameters GW1
GW2
GW3
GW4
Method Desired Limit
/Permissible Limit
1 pH Value 8.18 7.70 7.68 7.49 APHA-4500 6.5-8.5/
No relaxation
2 Temperature 0C 24.8 25.6 25.0 25.5 Part 9 --
3 Conductivity, mhos/cm 838 1120 1072 960 APHA-4500 --
4 Turbidity (NTU) <1 <1 <1 <1 APHA-2030B 1-5
5 Total Dissolved Solids mg/l 545 728 698 625 APHA-2540B 500/2000
6 Total Suspended Solids mg/l <2 <2 <2 <2 APHA-2540D --
7 Total Hardness as CaCO3 mg/l
204 356 245 236 APHA-2340C 200/600
8 Chloride as Cl mg/l 72 93 114 138 APHA-4500B 250/1000
9 Total Alkalinity mg/l 288 412 392 290 Part -23 200/600
10 Sulphates as SO4 mg/l 102 138 87 88 APHA-4500E 200/400
11 Nitrates as NO3 mg/l 28 34 42 18 APHA-4500 45/No relaxation
12 Fluoride as F mg/l 0.52 0.92 0.86 0.66 APHA-4500D 1/1.5
13 Iron as Fe mg/l 0.28 0.24 0.29 0.27 APHA-3111B 0.3/No relaxation
14 Zinc as Zn mg/l 0.98 1.34 1.12 0.88 APHA-3111B 5/15
15 Calcium as Ca mg/l 52 104 62 72.8 APHA-3500B 75/200
16 Magnesium as Mg mg/l 18 23.8 22 13.1 APHA-3500B 30/100
17 Sodium as Na mg/l 68 58 96 84 APHA-3500 --
18 Potassium as K mg/l 29 27 35 33 APHA-3500 KB --

EIA/EMP Report for Expansion of Chemicals and APIs production unit by IOLCP
EQMS India Pvt. Ltd. 162
19 Cadmium as Cd mg/l <0.01 <0.01 <0.01 <0.01 APHA-3111B 0.003/No relaxation
20 Copper as Cu mg/l <0.01 <0.01 <0.01 <0.01 APHA-3111B 0.05/1.5
21 Nickel as Ni mg/l <0.01 <0.01 <0.01 <0.01 APHA-3111B 0.02/No relaxation
22 Lead as Pb mg/l <0.01 <0.01 <0.01 <0.01 APHA-3111B 0.01/No relaxation
23 Mercury as Hg mg/l <0.001 <0.001 <0.001 <0.001 APHA-3112 0.001/0.001
24 Chromium (Total as Cr) mg/l <0.05 <0.05 <0.05 <0.05 APHA-3111B 0.5/No relaxation
25 Arsenic as As mg/l <0.01 <0.01 <0.025 <0.025 APHA-3114 0.01/0.05
26 Phenolic compound mg/l <0.001 <0.001 <0.001 <0.001 Part 43 0.001/0.002
27 Total Coliform MPN/100ml Nil Nil Nil Nil APHA-9230B Nil
Source: Primary Data Collection and analysis during study period by Laboratory
Table 3.15 Continued..........Ground Water Quality in the Study Area
S.N. Parameters GW5 GW6 GW7 GW8 Method Desired Limit
/Permissible Limit
1 pH Value 7.59 7.05 7.42 7.32 APHA-4500 6.5-8.5/No relaxation
2 Temperature 0C 25.2 25.3 25.0 25.7 Part 9 --
3 Conductivity, mhos/cm 856 550 879 1060 APHA-4500 --
4 Turbidity (NTU) <1 <1 <1 <1 APHA-2030B 1-5
5 Total Dissolved solids mg/l 557 358 572 689 APHA-2540B 500/2000
6 Total Suspended solids mg/l <2 <2 <2 <2 APHA-2540D --
7 Total Hardness as CaCO3 mg/l 285 182 310 288 APHA-2340C 200/600
8 Chloride as Cl mg/l 122 56 68 132 APHA-4500B 250/1000
9 Total Alkalinity mg/l 312 204 310 412 Part -23 200/600
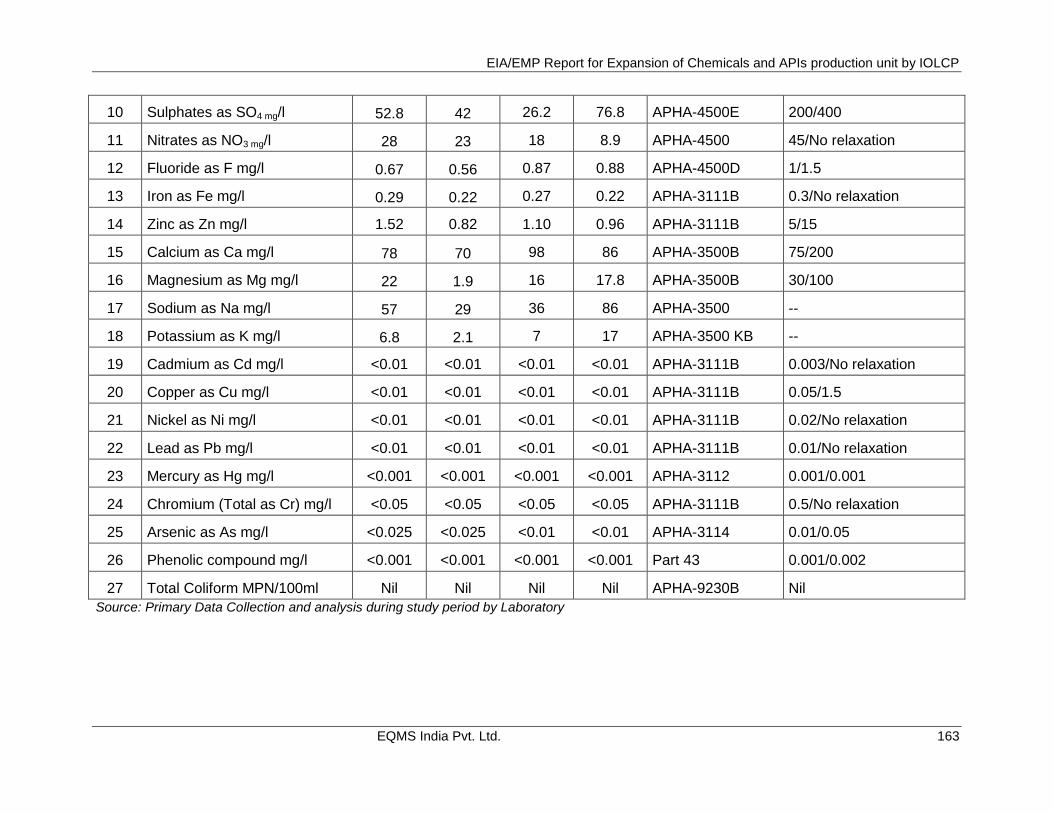
EIA/EMP Report for Expansion of Chemicals and APIs production unit by IOLCP
EQMS India Pvt. Ltd. 163
10 Sulphates as SO4 mg/l 52.8 42 26.2 76.8 APHA-4500E 200/400
11 Nitrates as NO3 mg/l 28 23 18 8.9 APHA-4500 45/No relaxation
12 Fluoride as F mg/l 0.67 0.56 0.87 0.88 APHA-4500D 1/1.5
13 Iron as Fe mg/l 0.29 0.22 0.27 0.22 APHA-3111B 0.3/No relaxation
14 Zinc as Zn mg/l 1.52 0.82 1.10 0.96 APHA-3111B 5/15
15 Calcium as Ca mg/l 78 70 98 86 APHA-3500B 75/200
16 Magnesium as Mg mg/l 22 1.9 16 17.8 APHA-3500B 30/100
17 Sodium as Na mg/l 57 29 36 86 APHA-3500 --
18 Potassium as K mg/l 6.8 2.1 7 17 APHA-3500 KB --
19 Cadmium as Cd mg/l <0.01 <0.01 <0.01 <0.01 APHA-3111B 0.003/No relaxation
20 Copper as Cu mg/l <0.01 <0.01 <0.01 <0.01 APHA-3111B 0.05/1.5
21 Nickel as Ni mg/l <0.01 <0.01 <0.01 <0.01 APHA-3111B 0.02/No relaxation
22 Lead as Pb mg/l <0.01 <0.01 <0.01 <0.01 APHA-3111B 0.01/No relaxation
23 Mercury as Hg mg/l <0.001 <0.001 <0.001 <0.001 APHA-3112 0.001/0.001
24 Chromium (Total as Cr) mg/l <0.05 <0.05 <0.05 <0.05 APHA-3111B 0.5/No relaxation
25 Arsenic as As mg/l <0.025 <0.025 <0.01 <0.01 APHA-3114 0.01/0.05
26 Phenolic compound mg/l <0.001 <0.001 <0.001 <0.001 Part 43 0.001/0.002
27 Total Coliform MPN/100ml Nil Nil Nil Nil APHA-9230B Nil
Source: Primary Data Collection and analysis during study period by Laboratory
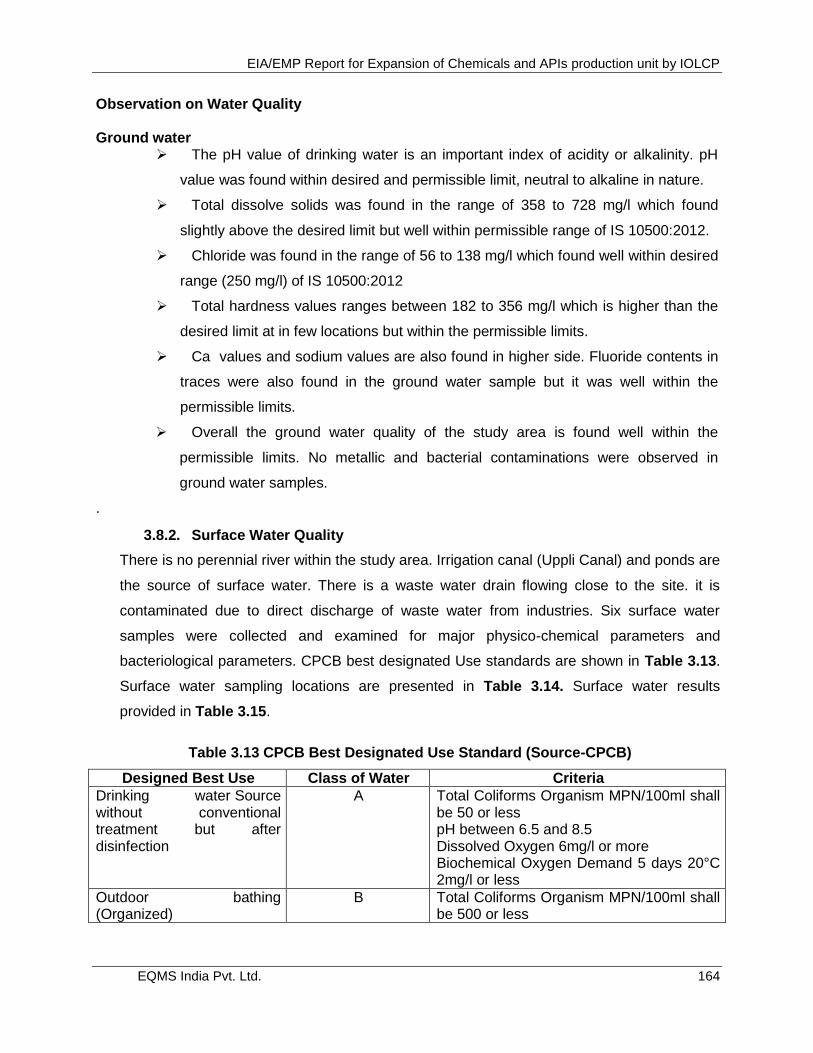
EIA/EMP Report for Expansion of Chemicals and APIs production unit by IOLCP
EQMS India Pvt. Ltd. 164
Observation on Water Quality Ground water
The pH value of drinking water is an important index of acidity or alkalinity. pH
value was found within desired and permissible limit, neutral to alkaline in nature.
Total dissolve solids was found in the range of 358 to 728 mg/l which found
slightly above the desired limit but well within permissible range of IS 10500:2012.
Chloride was found in the range of 56 to 138 mg/l which found well within desired
range (250 mg/l) of IS 10500:2012
Total hardness values ranges between 182 to 356 mg/l which is higher than the
desired limit at in few locations but within the permissible limits.
Ca values and sodium values are also found in higher side. Fluoride contents in
traces were also found in the ground water sample but it was well within the
permissible limits.
Overall the ground water quality of the study area is found well within the
permissible limits. No metallic and bacterial contaminations were observed in
ground water samples.
.
3.8.2. Surface Water Quality
There is no perennial river within the study area. Irrigation canal (Uppli Canal) and ponds are
the source of surface water. There is a waste water drain flowing close to the site. it is
contaminated due to direct discharge of waste water from industries. Six surface water
samples were collected and examined for major physico-chemical parameters and
bacteriological parameters. CPCB best designated Use standards are shown in Table 3.13.
Surface water sampling locations are presented in Table 3.14. Surface water results
provided in Table 3.15.
Table 3.13 CPCB Best Designated Use Standard (Source-CPCB)
Designed Best Use Class of Water Criteria
Drinking water Source without conventional treatment but after disinfection
A Total Coliforms Organism MPN/100ml shall be 50 or less pH between 6.5 and 8.5 Dissolved Oxygen 6mg/l or more Biochemical Oxygen Demand 5 days 20°C 2mg/l or less
Outdoor bathing (Organized)
B Total Coliforms Organism MPN/100ml shall be 500 or less
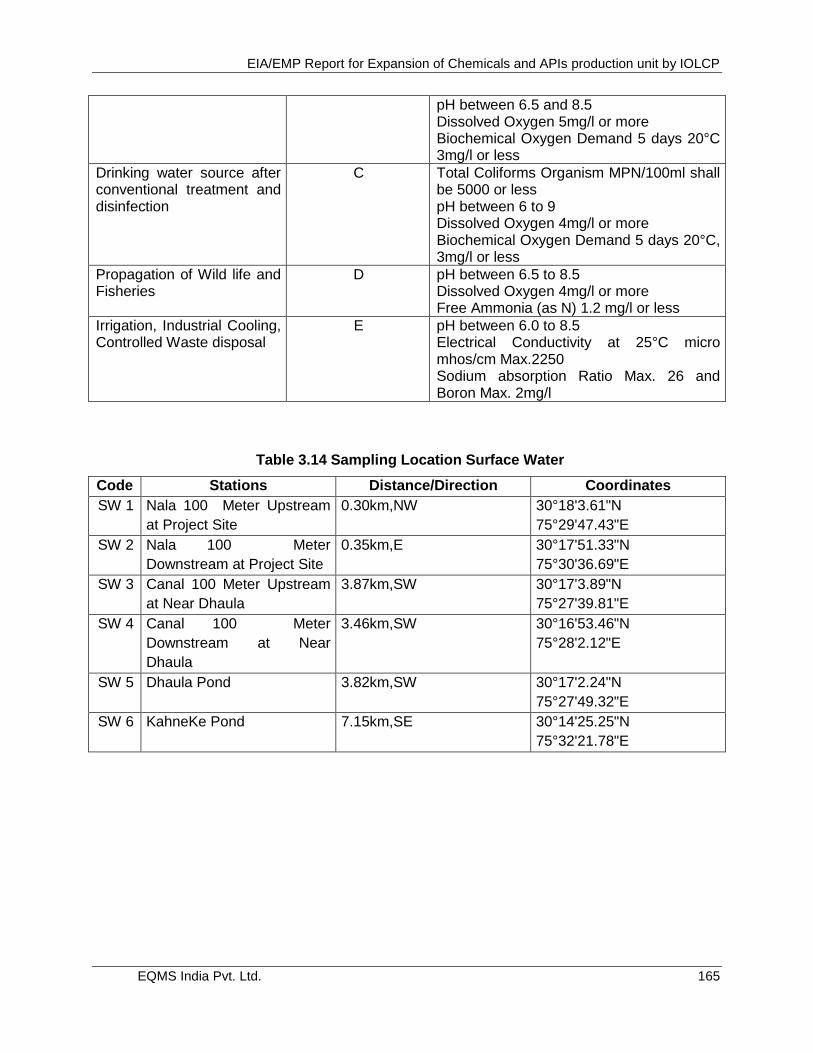
EIA/EMP Report for Expansion of Chemicals and APIs production unit by IOLCP
EQMS India Pvt. Ltd. 165
pH between 6.5 and 8.5 Dissolved Oxygen 5mg/l or more Biochemical Oxygen Demand 5 days 20°C 3mg/l or less
Drinking water source after conventional treatment and disinfection
C Total Coliforms Organism MPN/100ml shall be 5000 or less pH between 6 to 9 Dissolved Oxygen 4mg/l or more Biochemical Oxygen Demand 5 days 20°C, 3mg/l or less
Propagation of Wild life and Fisheries
D pH between 6.5 to 8.5 Dissolved Oxygen 4mg/l or more Free Ammonia (as N) 1.2 mg/l or less
Irrigation, Industrial Cooling, Controlled Waste disposal
E pH between 6.0 to 8.5 Electrical Conductivity at 25°C micro mhos/cm Max.2250 Sodium absorption Ratio Max. 26 and Boron Max. 2mg/l
Table 3.14 Sampling Location Surface Water
Code Stations Distance/Direction Coordinates
SW 1 Nala 100 Meter Upstream
at Project Site
0.30km,NW 30°18'3.61"N
75°29'47.43"E
SW 2 Nala 100 Meter
Downstream at Project Site
0.35km,E 30°17'51.33"N
75°30'36.69"E
SW 3 Canal 100 Meter Upstream
at Near Dhaula
3.87km,SW 30°17'3.89"N
75°27'39.81"E
SW 4 Canal 100 Meter
Downstream at Near
Dhaula
3.46km,SW 30°16'53.46"N
75°28'2.12"E
SW 5 Dhaula Pond 3.82km,SW 30°17'2.24"N
75°27'49.32"E
SW 6 KahneKe Pond 7.15km,SE 30°14'25.25"N
75°32'21.78"E
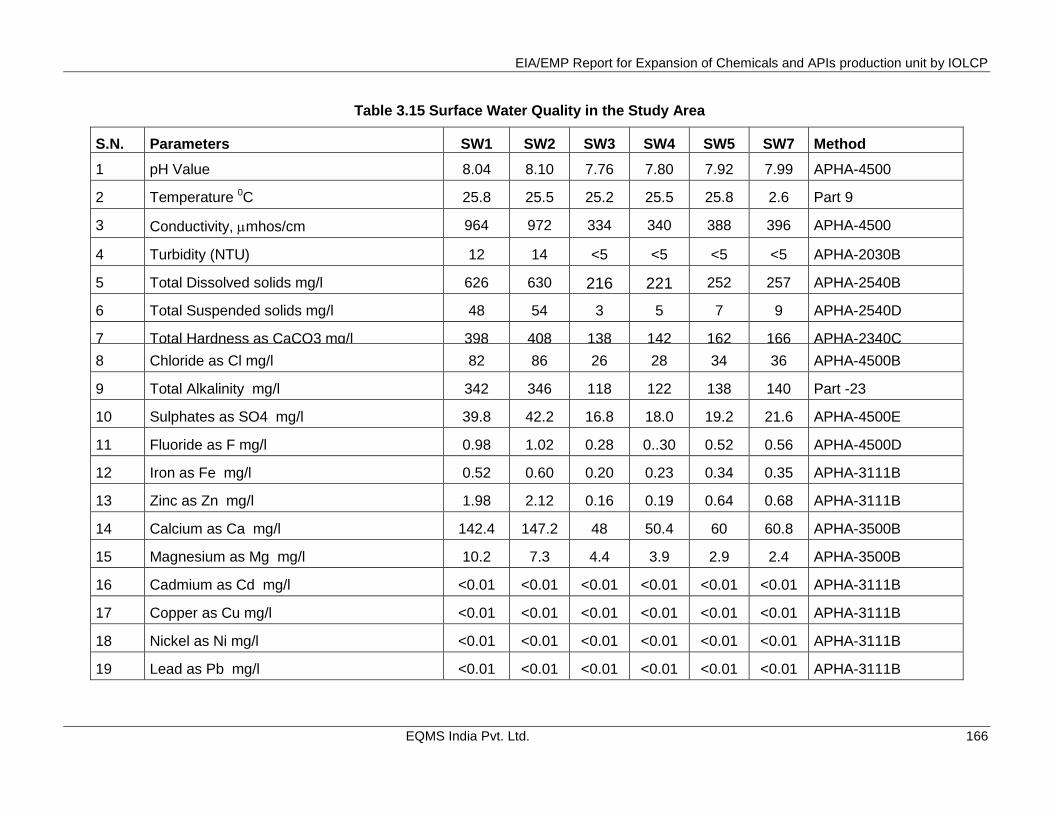
EIA/EMP Report for Expansion of Chemicals and APIs production unit by IOLCP
EQMS India Pvt. Ltd. 166
Table 3.15 Surface Water Quality in the Study Area
S.N. Parameters SW1
SW2
SW3
SW4
SW5
SW7
Method
1 pH Value 8.04 8.10 7.76 7.80 7.92 7.99 APHA-4500
2 Temperature 0C 25.8 25.5 25.2 25.5 25.8 2.6 Part 9
3 Conductivity, mhos/cm 964 972 334 340 388 396 APHA-4500
4 Turbidity (NTU) 12 14 <5 <5 <5 <5 APHA-2030B
5 Total Dissolved solids mg/l 626 630 216 221 252 257 APHA-2540B
6 Total Suspended solids mg/l 48 54 3 5 7 9 APHA-2540D
7 Total Hardness as CaCO3 mg/l 398 408 138 142 162 166 APHA-2340C
8 Chloride as Cl mg/l 82 86 26 28 34 36 APHA-4500B
9 Total Alkalinity mg/l 342 346 118 122 138 140 Part -23
10 Sulphates as SO4 mg/l 39.8 42.2 16.8 18.0 19.2 21.6 APHA-4500E
11 Fluoride as F mg/l 0.98 1.02 0.28 0..30 0.52 0.56 APHA-4500D
12 Iron as Fe mg/l 0.52 0.60 0.20 0.23 0.34 0.35 APHA-3111B
13 Zinc as Zn mg/l 1.98 2.12 0.16 0.19 0.64 0.68 APHA-3111B
14 Calcium as Ca mg/l 142.4 147.2 48 50.4 60 60.8 APHA-3500B
15 Magnesium as Mg mg/l 10.2 7.3 4.4 3.9 2.9 2.4 APHA-3500B
16 Cadmium as Cd mg/l <0.01 <0.01 <0.01 <0.01 <0.01 <0.01 APHA-3111B
17 Copper as Cu mg/l <0.01 <0.01 <0.01 <0.01 <0.01 <0.01 APHA-3111B
18 Nickel as Ni mg/l <0.01 <0.01 <0.01 <0.01 <0.01 <0.01 APHA-3111B
19 Lead as Pb mg/l <0.01 <0.01 <0.01 <0.01 <0.01 <0.01 APHA-3111B
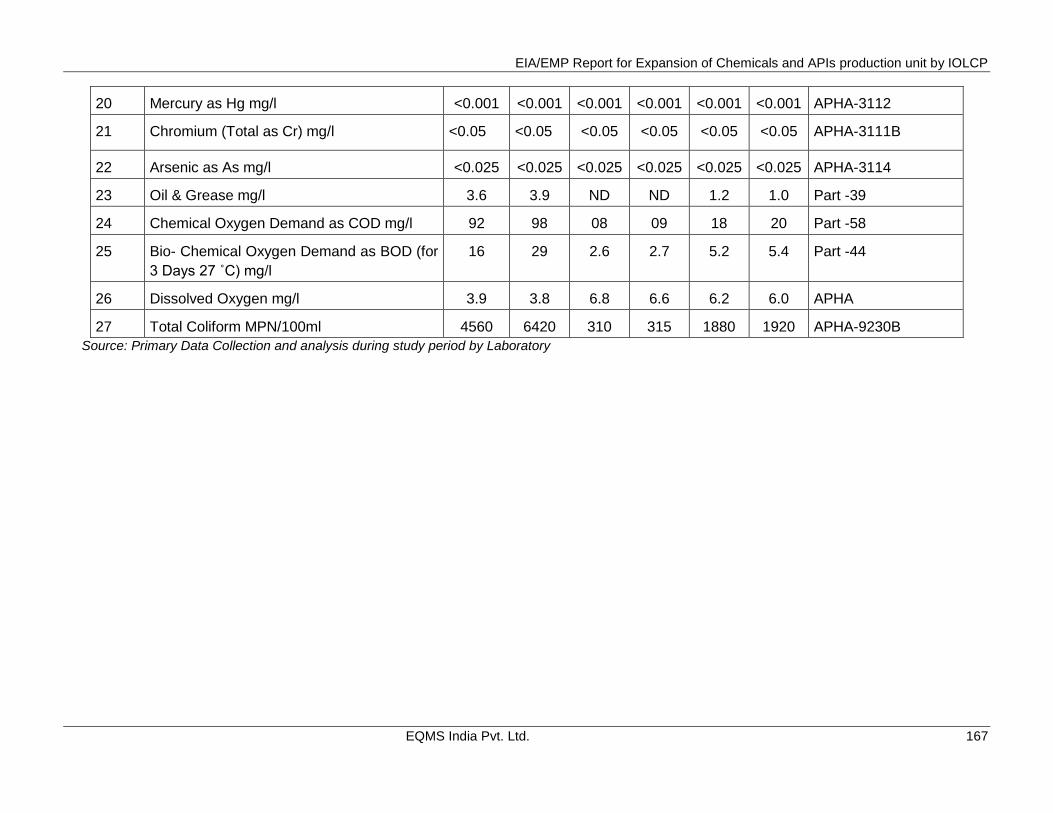
EIA/EMP Report for Expansion of Chemicals and APIs production unit by IOLCP
EQMS India Pvt. Ltd. 167
20 Mercury as Hg mg/l <0.001 <0.001 <0.001 <0.001 <0.001 <0.001 APHA-3112
21 Chromium (Total as Cr) mg/l <0.05 <0.05 <0.05 <0.05 <0.05 <0.05 APHA-3111B
22 Arsenic as As mg/l <0.025 <0.025 <0.025 <0.025 <0.025 <0.025 APHA-3114
23 Oil & Grease mg/l 3.6 3.9 ND ND 1.2 1.0 Part -39
24 Chemical Oxygen Demand as COD mg/l 92 98 08 09 18 20 Part -58
25 Bio- Chemical Oxygen Demand as BOD (for
3 Days 27 ˚C) mg/l
16 29 2.6 2.7 5.2 5.4 Part -44
26 Dissolved Oxygen mg/l 3.9 3.8 6.8 6.6 6.2 6.0 APHA
27 Total Coliform MPN/100ml 4560 6420 310 315 1880 1920 APHA-9230B
Source: Primary Data Collection and analysis during study period by Laboratory
EIA/EMP Report for Expansion of Chemicals and APIs production unit by IOLCP
EQMS India Pvt. Ltd. Page 168
Observation on Surface water Quality:
Surface water quality is determined by the help of water quality criteria defined in CPCB best
designated uses criteria. Surface water monitoring is performed for nalla near project site at 100
upstream and downstream point of the project site high bacterial contamination were observed in
Nala water quality meeting the BDU criteria Class D which is fit for propagation of wildlife and
fisheries.
Canal Water quality: The canal water quality is good for Drinking water source after conventional
treatment and disinfection and meeting the class C of Best designated uses of CPCB.
Pond Water Quality: Bacterial contamination were observed in pond water samples. Dissolve
oxygen is found within the range while BOD was found slightly on slightly high than the Class C of
Best designated uses. Hence the pond water is fit for Propagation of Wild life and Fisheries and
meeting the criteria D of Best designated uses of CPCB.
3.9. Soil Quality
Soils may be defined as a thin layer of earth's crust that serves as a natural medium for the growth
of plants. It is the unconsolidated mineral matter that has been subjected to and influenced by
genetic and environmental factors. Soils serve as a reservoir of nutrients for plants and crops and
also provide mechanical anchorage and favorable tilts. Soil is our most important natural resource
and a natural resource is anything that comes from the earth and is used by us. We depend on the
soil for food, clothing, shelter, minerals, clay & water. Soil is the seat of many macro & micro flora
like algae, fungi, earthworms, bacteria etc. These are very beneficial in promoting soil reactions
and decomposing the organic matter by which essential nutrients for plants are liberated. Most of
the soils are made-up of two main parts:
Tiny bits of mineral particles which come from larger rocks, and humus, which is dark brown in color and consists of decaying remains of plants and animals.
Soil also contains water, air and living organisms, such as fungi, bacteria, earthworms, roundworms, insects, etc. Actually, more living organisms live in the soil than above it.
For general characterization of soil a few random samples from the study area to the depth of
about 15-cm may be sufficient. Deeper soil samples may be needed only for the study of soil
profile.
3.8.1. Methodology
The soil samples were collected from Six (06) selected locations during the Pre-monsoon season (15th March-15th June 2018). The samples collected from all the locations were homogeneous representative of each sampling location. At random five sub-locations were identified at each location and soil samples were collected from 5 to15-cm below the surface of soil. It was uniformly mixed before homogenizing the soil sample. The samples about 500-gms were packed in polythene bags labelled in the field with the name of sampling location & number and sent to the laboratory for the analysis of physicochemical parameters. The samples were dried and passed through a 2.0 mm sieve to prepare them for testing.
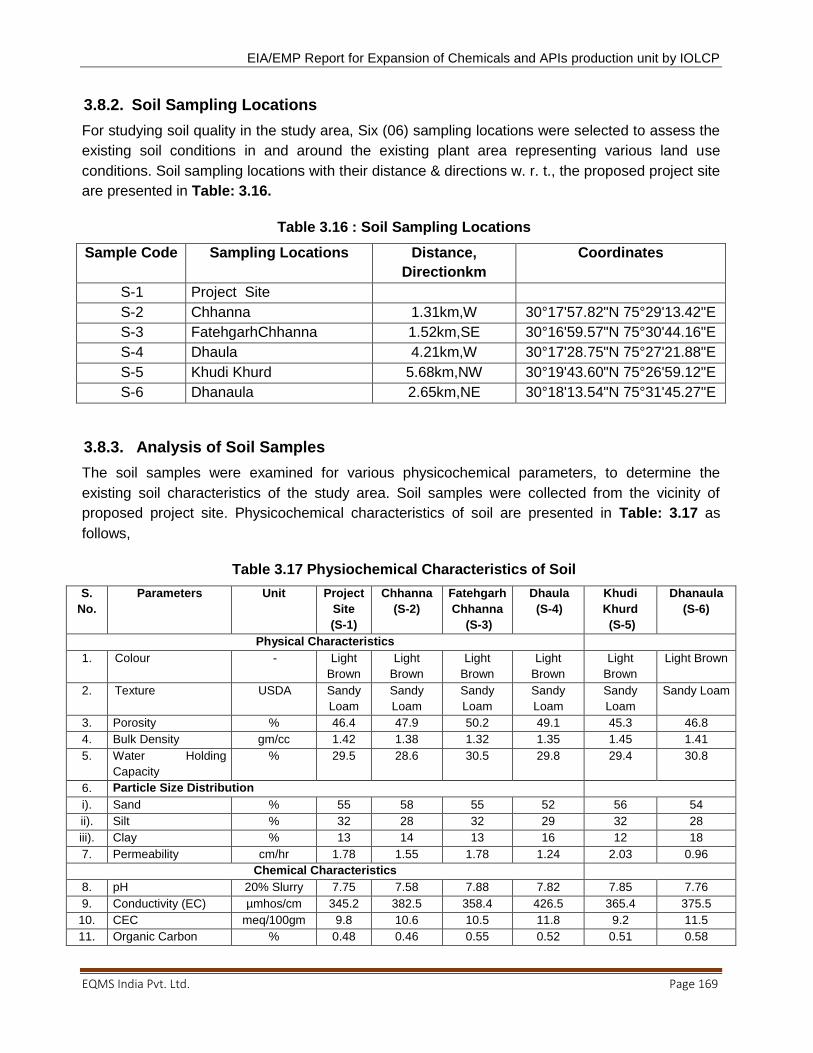
EIA/EMP Report for Expansion of Chemicals and APIs production unit by IOLCP
EQMS India Pvt. Ltd. Page 169
3.8.2. Soil Sampling Locations
For studying soil quality in the study area, Six (06) sampling locations were selected to assess the
existing soil conditions in and around the existing plant area representing various land use
conditions. Soil sampling locations with their distance & directions w. r. t., the proposed project site
are presented in Table: 3.16.
Table 3.16 : Soil Sampling Locations
Sample Code Sampling Locations Distance,
Directionkm
Coordinates
S-1 Project Site
S-2 Chhanna 1.31km,W 30°17'57.82"N 75°29'13.42"E
S-3 FatehgarhChhanna 1.52km,SE 30°16'59.57"N 75°30'44.16"E
S-4 Dhaula 4.21km,W 30°17'28.75"N 75°27'21.88"E
S-5 Khudi Khurd 5.68km,NW 30°19'43.60"N 75°26'59.12"E
S-6 Dhanaula 2.65km,NE 30°18'13.54"N 75°31'45.27"E
3.8.3. Analysis of Soil Samples
The soil samples were examined for various physicochemical parameters, to determine the
existing soil characteristics of the study area. Soil samples were collected from the vicinity of
proposed project site. Physicochemical characteristics of soil are presented in Table: 3.17 as
follows,
Table 3.17 Physiochemical Characteristics of Soil
S.
No.
Parameters Unit Project
Site
(S-1)
Chhanna
(S-2)
Fatehgarh
Chhanna
(S-3)
Dhaula
(S-4)
Khudi
Khurd
(S-5)
Dhanaula
(S-6)
Physical Characteristics
1. Colour - Light
Brown
Light
Brown
Light
Brown
Light
Brown
Light
Brown
Light Brown
2. Texture USDA Sandy
Loam
Sandy
Loam
Sandy
Loam
Sandy
Loam
Sandy
Loam
Sandy Loam
3. Porosity % 46.4 47.9 50.2 49.1 45.3 46.8
4. Bulk Density gm/cc 1.42 1.38 1.32 1.35 1.45 1.41
5. Water Holding
Capacity
% 29.5 28.6 30.5 29.8 29.4 30.8
6. Particle Size Distribution
i). Sand % 55 58 55 52 56 54
ii). Silt % 32 28 32 29 32 28
iii). Clay % 13 14 13 16 12 18
7. Permeability cm/hr 1.78 1.55 1.78 1.24 2.03 0.96
Chemical Characteristics
8. pH 20% Slurry 7.75 7.58 7.88 7.82 7.85 7.76
9. Conductivity (EC) µmhos/cm 345.2 382.5 358.4 426.5 365.4 375.5
10. CEC meq/100gm 9.8 10.6 10.5 11.8 9.2 11.5
11. Organic Carbon % 0.48 0.46 0.55 0.52 0.51 0.58
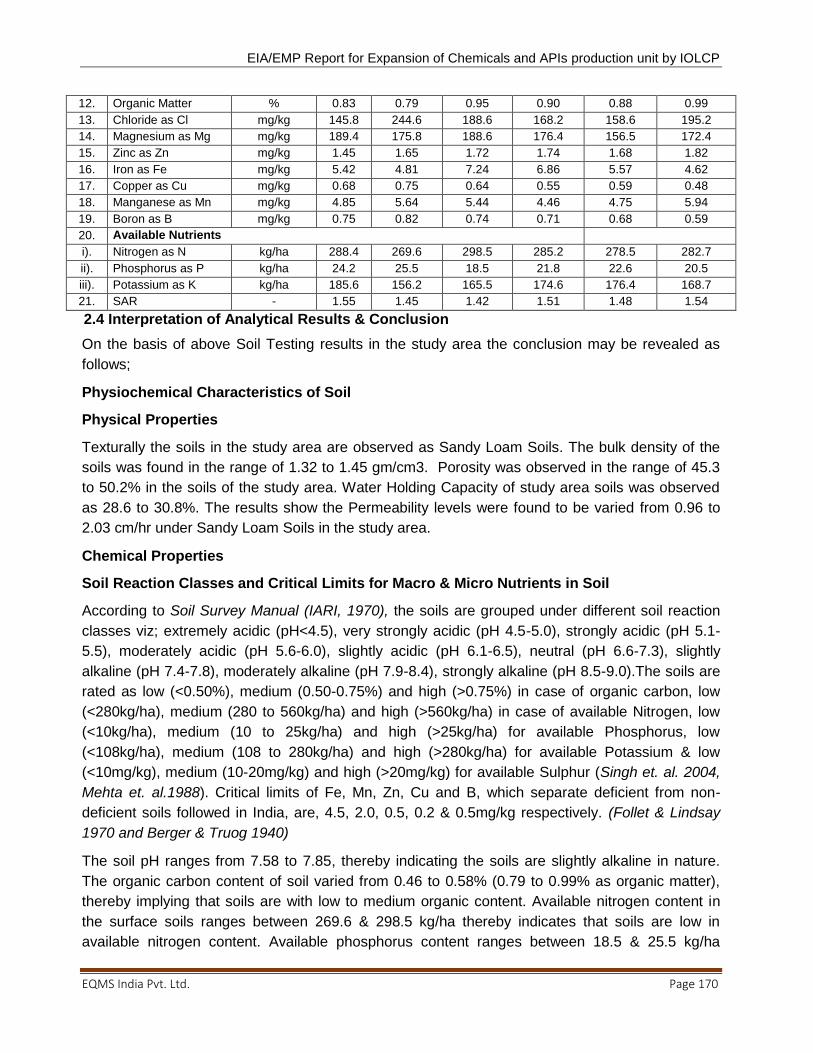
EIA/EMP Report for Expansion of Chemicals and APIs production unit by IOLCP
EQMS India Pvt. Ltd. Page 170
12. Organic Matter % 0.83 0.79 0.95 0.90 0.88 0.99
13. Chloride as Cl mg/kg 145.8 244.6 188.6 168.2 158.6 195.2
14. Magnesium as Mg mg/kg 189.4 175.8 188.6 176.4 156.5 172.4
15. Zinc as Zn mg/kg 1.45 1.65 1.72 1.74 1.68 1.82
16. Iron as Fe mg/kg 5.42 4.81 7.24 6.86 5.57 4.62
17. Copper as Cu mg/kg 0.68 0.75 0.64 0.55 0.59 0.48
18. Manganese as Mn mg/kg 4.85 5.64 5.44 4.46 4.75 5.94
19. Boron as B mg/kg 0.75 0.82 0.74 0.71 0.68 0.59
20. Available Nutrients
i). Nitrogen as N kg/ha 288.4 269.6 298.5 285.2 278.5 282.7
ii). Phosphorus as P kg/ha 24.2 25.5 18.5 21.8 22.6 20.5
iii). Potassium as K kg/ha 185.6 156.2 165.5 174.6 176.4 168.7
21. SAR - 1.55 1.45 1.42 1.51 1.48 1.54
2.4 Interpretation of Analytical Results & Conclusion
On the basis of above Soil Testing results in the study area the conclusion may be revealed as
follows;
Physiochemical Characteristics of Soil
Physical Properties
Texturally the soils in the study area are observed as Sandy Loam Soils. The bulk density of the
soils was found in the range of 1.32 to 1.45 gm/cm3. Porosity was observed in the range of 45.3
to 50.2% in the soils of the study area. Water Holding Capacity of study area soils was observed
as 28.6 to 30.8%. The results show the Permeability levels were found to be varied from 0.96 to
2.03 cm/hr under Sandy Loam Soils in the study area.
Chemical Properties
Soil Reaction Classes and Critical Limits for Macro & Micro Nutrients in Soil
According to Soil Survey Manual (IARI, 1970), the soils are grouped under different soil reaction
classes viz; extremely acidic (pH<4.5), very strongly acidic (pH 4.5-5.0), strongly acidic (pH 5.1-
5.5), moderately acidic (pH 5.6-6.0), slightly acidic (pH 6.1-6.5), neutral (pH 6.6-7.3), slightly
alkaline (pH 7.4-7.8), moderately alkaline (pH 7.9-8.4), strongly alkaline (pH 8.5-9.0).The soils are
rated as low (<0.50%), medium (0.50-0.75%) and high (>0.75%) in case of organic carbon, low
(<280kg/ha), medium (280 to 560kg/ha) and high (>560kg/ha) in case of available Nitrogen, low
(<10kg/ha), medium (10 to 25kg/ha) and high (>25kg/ha) for available Phosphorus, low
(<108kg/ha), medium (108 to 280kg/ha) and high (>280kg/ha) for available Potassium & low
(<10mg/kg), medium (10-20mg/kg) and high (>20mg/kg) for available Sulphur (Singh et. al. 2004,
Mehta et. al.1988). Critical limits of Fe, Mn, Zn, Cu and B, which separate deficient from non-
deficient soils followed in India, are, 4.5, 2.0, 0.5, 0.2 & 0.5mg/kg respectively. (Follet & Lindsay
1970 and Berger & Truog 1940)
The soil pH ranges from 7.58 to 7.85, thereby indicating the soils are slightly alkaline in nature.
The organic carbon content of soil varied from 0.46 to 0.58% (0.79 to 0.99% as organic matter),
thereby implying that soils are with low to medium organic content. Available nitrogen content in
the surface soils ranges between 269.6 & 298.5 kg/ha thereby indicates that soils are low in
available nitrogen content. Available phosphorus content ranges between 18.5 & 25.5 kg/ha
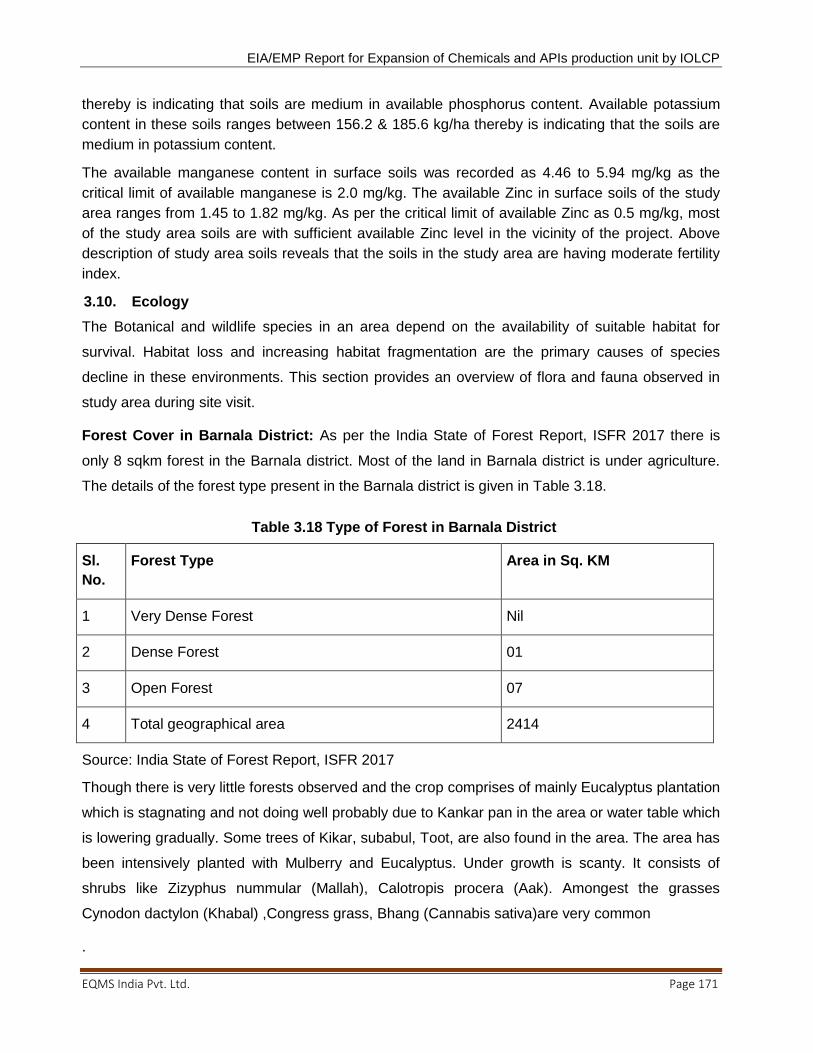
EIA/EMP Report for Expansion of Chemicals and APIs production unit by IOLCP
EQMS India Pvt. Ltd. Page 171
thereby is indicating that soils are medium in available phosphorus content. Available potassium
content in these soils ranges between 156.2 & 185.6 kg/ha thereby is indicating that the soils are
medium in potassium content.
The available manganese content in surface soils was recorded as 4.46 to 5.94 mg/kg as the
critical limit of available manganese is 2.0 mg/kg. The available Zinc in surface soils of the study
area ranges from 1.45 to 1.82 mg/kg. As per the critical limit of available Zinc as 0.5 mg/kg, most
of the study area soils are with sufficient available Zinc level in the vicinity of the project. Above
description of study area soils reveals that the soils in the study area are having moderate fertility
index.
3.10. Ecology
The Botanical and wildlife species in an area depend on the availability of suitable habitat for
survival. Habitat loss and increasing habitat fragmentation are the primary causes of species
decline in these environments. This section provides an overview of flora and fauna observed in
study area during site visit.
Forest Cover in Barnala District: As per the India State of Forest Report, ISFR 2017 there is
only 8 sqkm forest in the Barnala district. Most of the land in Barnala district is under agriculture.
The details of the forest type present in the Barnala district is given in Table 3.18.
Table 3.18 Type of Forest in Barnala District
Sl.
No.
Forest Type Area in Sq. KM
1 Very Dense Forest Nil
2 Dense Forest 01
3 Open Forest 07
4 Total geographical area 2414
Source: India State of Forest Report, ISFR 2017
Though there is very little forests observed and the crop comprises of mainly Eucalyptus plantation
which is stagnating and not doing well probably due to Kankar pan in the area or water table which
is lowering gradually. Some trees of Kikar, subabul, Toot, are also found in the area. The area has
been intensively planted with Mulberry and Eucalyptus. Under growth is scanty. It consists of
shrubs like Zizyphus nummular (Mallah), Calotropis procera (Aak). Amongest the grasses
Cynodon dactylon (Khabal) ,Congress grass, Bhang (Cannabis sativa)are very common
.
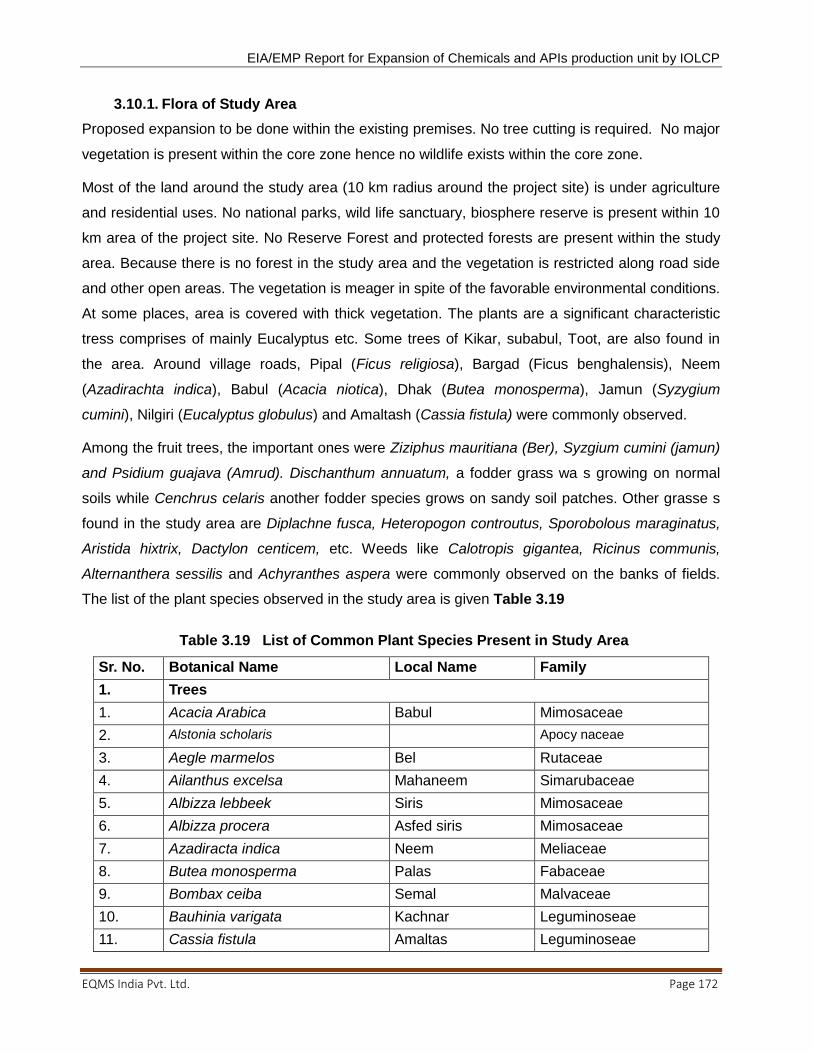
EIA/EMP Report for Expansion of Chemicals and APIs production unit by IOLCP
EQMS India Pvt. Ltd. Page 172
3.10.1. Flora of Study Area
Proposed expansion to be done within the existing premises. No tree cutting is required. No major
vegetation is present within the core zone hence no wildlife exists within the core zone.
Most of the land around the study area (10 km radius around the project site) is under agriculture
and residential uses. No national parks, wild life sanctuary, biosphere reserve is present within 10
km area of the project site. No Reserve Forest and protected forests are present within the study
area. Because there is no forest in the study area and the vegetation is restricted along road side
and other open areas. The vegetation is meager in spite of the favorable environmental conditions.
At some places, area is covered with thick vegetation. The plants are a significant characteristic
tress comprises of mainly Eucalyptus etc. Some trees of Kikar, subabul, Toot, are also found in
the area. Around village roads, Pipal (Ficus religiosa), Bargad (Ficus benghalensis), Neem
(Azadirachta indica), Babul (Acacia niotica), Dhak (Butea monosperma), Jamun (Syzygium
cumini), Nilgiri (Eucalyptus globulus) and Amaltash (Cassia fistula) were commonly observed.
Among the fruit trees, the important ones were Ziziphus mauritiana (Ber), Syzgium cumini (jamun)
and Psidium guajava (Amrud). Dischanthum annuatum, a fodder grass wa s growing on normal
soils while Cenchrus celaris another fodder species grows on sandy soil patches. Other grasse s
found in the study area are Diplachne fusca, Heteropogon controutus, Sporobolous maraginatus,
Aristida hixtrix, Dactylon centicem, etc. Weeds like Calotropis gigantea, Ricinus communis,
Alternanthera sessilis and Achyranthes aspera were commonly observed on the banks of fields.
The list of the plant species observed in the study area is given Table 3.19
Table 3.19 List of Common Plant Species Present in Study Area
Sr. No. Botanical Name Local Name Family
1. Trees
1. Acacia Arabica Babul Mimosaceae
2. Alstonia scholaris Apocy naceae
3. Aegle marmelos Bel Rutaceae
4. Ailanthus excelsa Mahaneem Simarubaceae
5. Albizza lebbeek Siris Mimosaceae
6. Albizza procera Asfed siris Mimosaceae
7. Azadiracta indica Neem Meliaceae
8. Butea monosperma Palas Fabaceae
9. Bombax ceiba Semal Malvaceae
10. Bauhinia varigata Kachnar Leguminoseae
11. Cassia fistula Amaltas Leguminoseae
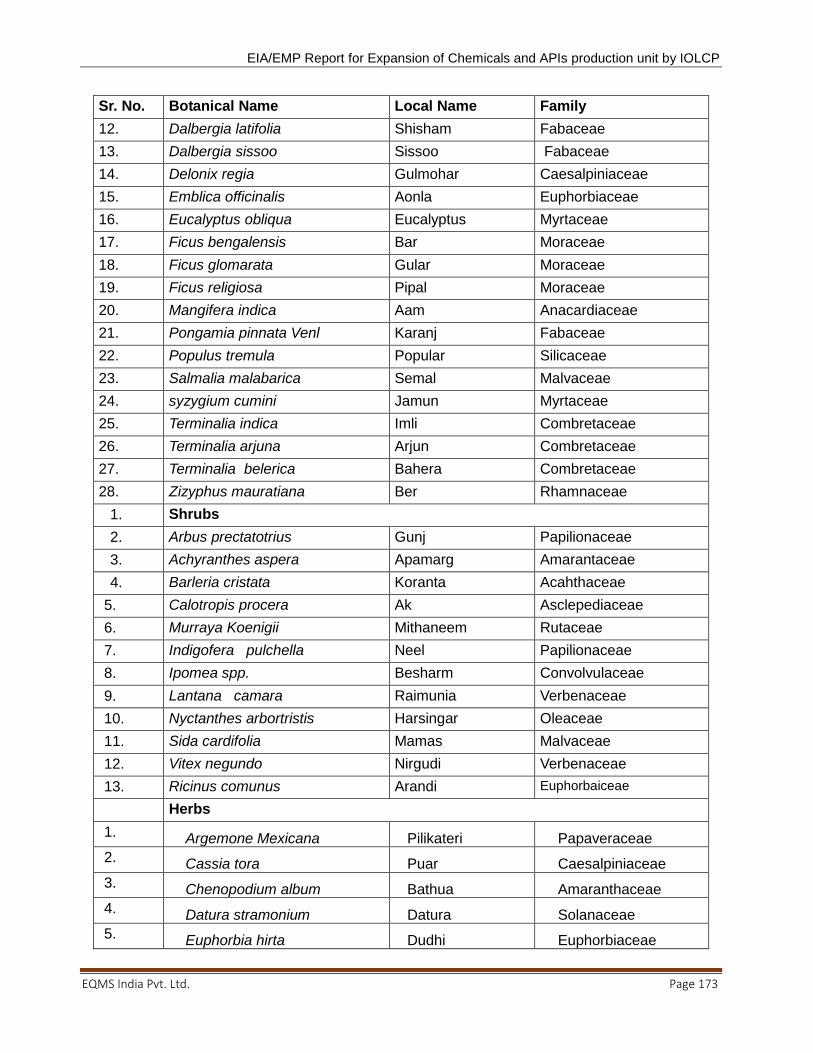
EIA/EMP Report for Expansion of Chemicals and APIs production unit by IOLCP
EQMS India Pvt. Ltd. Page 173
Sr. No. Botanical Name Local Name Family
12. Dalbergia latifolia Shisham Fabaceae
13. Dalbergia sissoo Sissoo Fabaceae
14. Delonix regia Gulmohar Caesalpiniaceae
15. Emblica officinalis Aonla Euphorbiaceae
16. Eucalyptus obliqua Eucalyptus Myrtaceae
17. Ficus bengalensis Bar Moraceae
18. Ficus glomarata Gular Moraceae
19. Ficus religiosa Pipal Moraceae
20. Mangifera indica Aam Anacardiaceae
21. Pongamia pinnata Venl Karanj Fabaceae
22. Populus tremula Popular Silicaceae
23. Salmalia malabarica Semal Malvaceae
24. syzygium cumini Jamun Myrtaceae
25. Terminalia indica Imli Combretaceae
26. Terminalia arjuna Arjun Combretaceae
27. Terminalia belerica Bahera Combretaceae
28. Zizyphus mauratiana Ber Rhamnaceae
1. Shrubs
2. Arbus prectatotrius Gunj Papilionaceae
3. Achyranthes aspera Apamarg Amarantaceae
4. Barleria cristata Koranta Acahthaceae
5. Calotropis procera Ak Asclepediaceae
6. Murraya Koenigii Mithaneem Rutaceae
7. Indigofera pulchella Neel Papilionaceae
8. Ipomea spp. Besharm Convolvulaceae
9. Lantana camara Raimunia Verbenaceae
10. Nyctanthes arbortristis Harsingar Oleaceae
11. Sida cardifolia Mamas Malvaceae
12. Vitex negundo Nirgudi Verbenaceae
13. Ricinus comunus Arandi Euphorbaiceae
Herbs
1. Argemone Mexicana Pilikateri Papaveraceae
2. Cassia tora Puar Caesalpiniaceae
3. Chenopodium album Bathua Amaranthaceae
4. Datura stramonium Datura Solanaceae
5. Euphorbia hirta Dudhi Euphorbiaceae
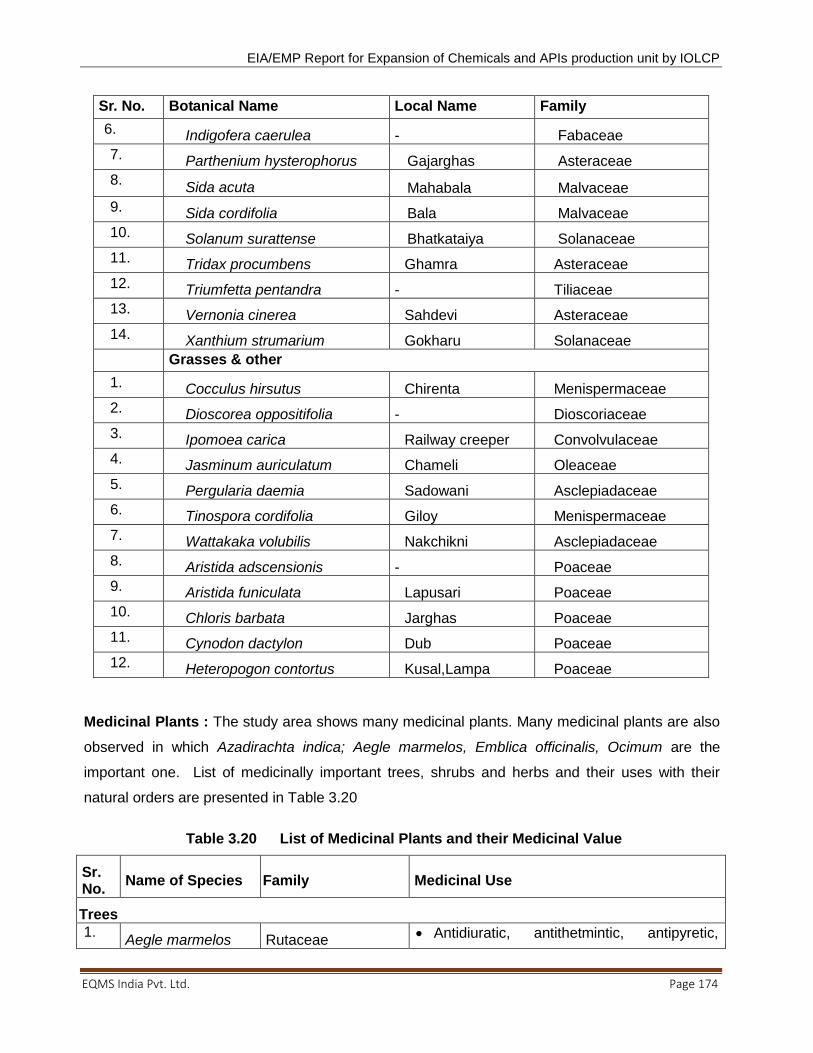
EIA/EMP Report for Expansion of Chemicals and APIs production unit by IOLCP
EQMS India Pvt. Ltd. Page 174
Sr. No. Botanical Name Local Name Family
6. Indigofera caerulea - Fabaceae
7. Parthenium hysterophorus Gajarghas Asteraceae
8. Sida acuta Mahabala Malvaceae
9. Sida cordifolia Bala Malvaceae
10. Solanum surattense Bhatkataiya Solanaceae
11. Tridax procumbens Ghamra Asteraceae
12. Triumfetta pentandra - Tiliaceae
13. Vernonia cinerea Sahdevi Asteraceae
14. Xanthium strumarium Gokharu Solanaceae
Grasses & other
1. Cocculus hirsutus Chirenta Menispermaceae
2. Dioscorea oppositifolia - Dioscoriaceae
3. Ipomoea carica Railway creeper Convolvulaceae
4. Jasminum auriculatum Chameli Oleaceae
5. Pergularia daemia Sadowani Asclepiadaceae
6. Tinospora cordifolia Giloy Menispermaceae
7. Wattakaka volubilis Nakchikni Asclepiadaceae
8. Aristida adscensionis - Poaceae
9. Aristida funiculata Lapusari Poaceae
10. Chloris barbata Jarghas Poaceae
11. Cynodon dactylon Dub Poaceae
12. Heteropogon contortus Kusal,Lampa Poaceae
Medicinal Plants : The study area shows many medicinal plants. Many medicinal plants are also
observed in which Azadirachta indica; Aegle marmelos, Emblica officinalis, Ocimum are the
important one. List of medicinally important trees, shrubs and herbs and their uses with their
natural orders are presented in Table 3.20
Table 3.20 List of Medicinal Plants and their Medicinal Value
Sr. No.
Name of Species Family Medicinal Use
Trees
1. Aegle marmelos Rutaceae
Antidiuratic, antithetmintic, antipyretic,
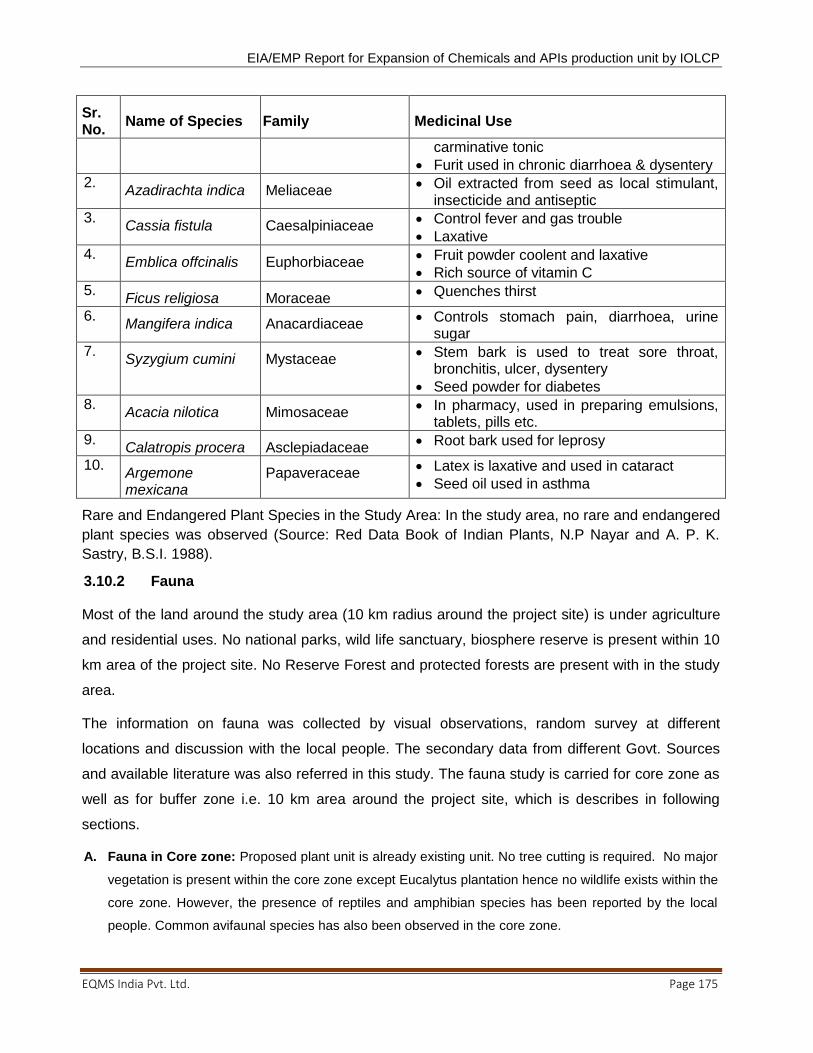
EIA/EMP Report for Expansion of Chemicals and APIs production unit by IOLCP
EQMS India Pvt. Ltd. Page 175
Sr. No.
Name of Species Family Medicinal Use
carminative tonic
Furit used in chronic diarrhoea & dysentery
2. Azadirachta indica Meliaceae
Oil extracted from seed as local stimulant, insecticide and antiseptic
3. Cassia fistula Caesalpiniaceae
Control fever and gas trouble
Laxative
4. Emblica offcinalis Euphorbiaceae
Fruit powder coolent and laxative
Rich source of vitamin C
5. Ficus religiosa Moraceae
Quenches thirst
6. Mangifera indica Anacardiaceae
Controls stomach pain, diarrhoea, urine sugar
7. Syzygium cumini Mystaceae
Stem bark is used to treat sore throat, bronchitis, ulcer, dysentery
Seed powder for diabetes
8. Acacia nilotica Mimosaceae
In pharmacy, used in preparing emulsions, tablets, pills etc.
9. Calatropis procera Asclepiadaceae
Root bark used for leprosy
10. Argemone mexicana
Papaveraceae Latex is laxative and used in cataract
Seed oil used in asthma
Rare and Endangered Plant Species in the Study Area: In the study area, no rare and endangered
plant species was observed (Source: Red Data Book of Indian Plants, N.P Nayar and A. P. K.
Sastry, B.S.I. 1988).
3.10.2 Fauna
Most of the land around the study area (10 km radius around the project site) is under agriculture
and residential uses. No national parks, wild life sanctuary, biosphere reserve is present within 10
km area of the project site. No Reserve Forest and protected forests are present with in the study
area.
The information on fauna was collected by visual observations, random survey at different
locations and discussion with the local people. The secondary data from different Govt. Sources
and available literature was also referred in this study. The fauna study is carried for core zone as
well as for buffer zone i.e. 10 km area around the project site, which is describes in following
sections.
A. Fauna in Core zone: Proposed plant unit is already existing unit. No tree cutting is required. No major
vegetation is present within the core zone except Eucalytus plantation hence no wildlife exists within the
core zone. However, the presence of reptiles and amphibian species has been reported by the local
people. Common avifaunal species has also been observed in the core zone.
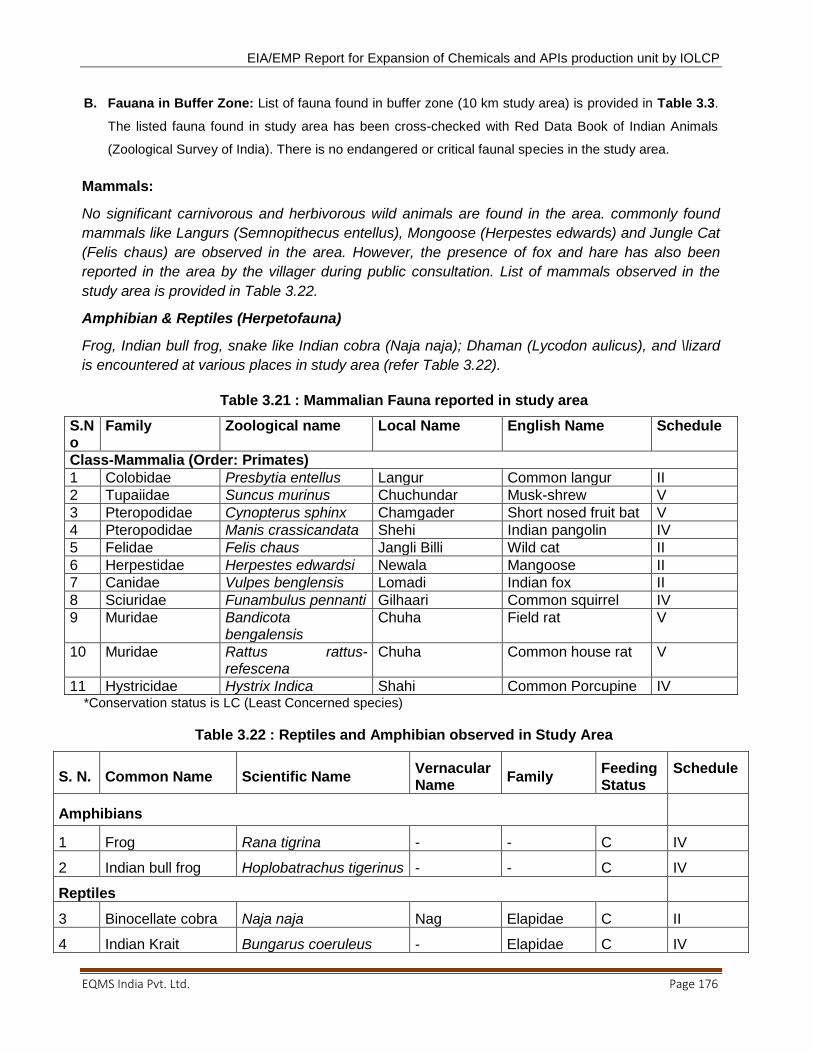
EIA/EMP Report for Expansion of Chemicals and APIs production unit by IOLCP
EQMS India Pvt. Ltd. Page 176
B. Fauana in Buffer Zone: List of fauna found in buffer zone (10 km study area) is provided in Table 3.3.
The listed fauna found in study area has been cross-checked with Red Data Book of Indian Animals
(Zoological Survey of India). There is no endangered or critical faunal species in the study area.
Mammals:
No significant carnivorous and herbivorous wild animals are found in the area. commonly found
mammals like Langurs (Semnopithecus entellus), Mongoose (Herpestes edwards) and Jungle Cat
(Felis chaus) are observed in the area. However, the presence of fox and hare has also been
reported in the area by the villager during public consultation. List of mammals observed in the
study area is provided in Table 3.22.
Amphibian & Reptiles (Herpetofauna)
Frog, Indian bull frog, snake like Indian cobra (Naja naja); Dhaman (Lycodon aulicus), and \lizard
is encountered at various places in study area (refer Table 3.22).
Table 3.21 : Mammalian Fauna reported in study area
S.No
Family Zoological name Local Name English Name Schedule
Class-Mammalia (Order: Primates)
1 Colobidae Presbytia entellus Langur Common langur II
2 Tupaiidae Suncus murinus Chuchundar Musk-shrew V
3 Pteropodidae Cynopterus sphinx Chamgader Short nosed fruit bat V
4 Pteropodidae Manis crassicandata Shehi Indian pangolin IV
5 Felidae Felis chaus Jangli Billi Wild cat II
6 Herpestidae Herpestes edwardsi Newala Mangoose II
7 Canidae Vulpes benglensis Lomadi Indian fox II
8 Sciuridae Funambulus pennanti Gilhaari Common squirrel IV
9 Muridae Bandicota bengalensis
Chuha Field rat V
10 Muridae Rattus rattus-refescena
Chuha Common house rat V
11 Hystricidae Hystrix Indica Shahi Common Porcupine IV *Conservation status is LC (Least Concerned species)
Table 3.22 : Reptiles and Amphibian observed in Study Area
S. N. Common Name Scientific Name Vernacular Name
Family Feeding Status
Schedule
Amphibians
1 Frog Rana tigrina - - C IV
2 Indian bull frog Hoplobatrachus tigerinus - - C IV
Reptiles
3 Binocellate cobra Naja naja Nag Elapidae C II
4 Indian Krait Bungarus coeruleus - Elapidae C IV
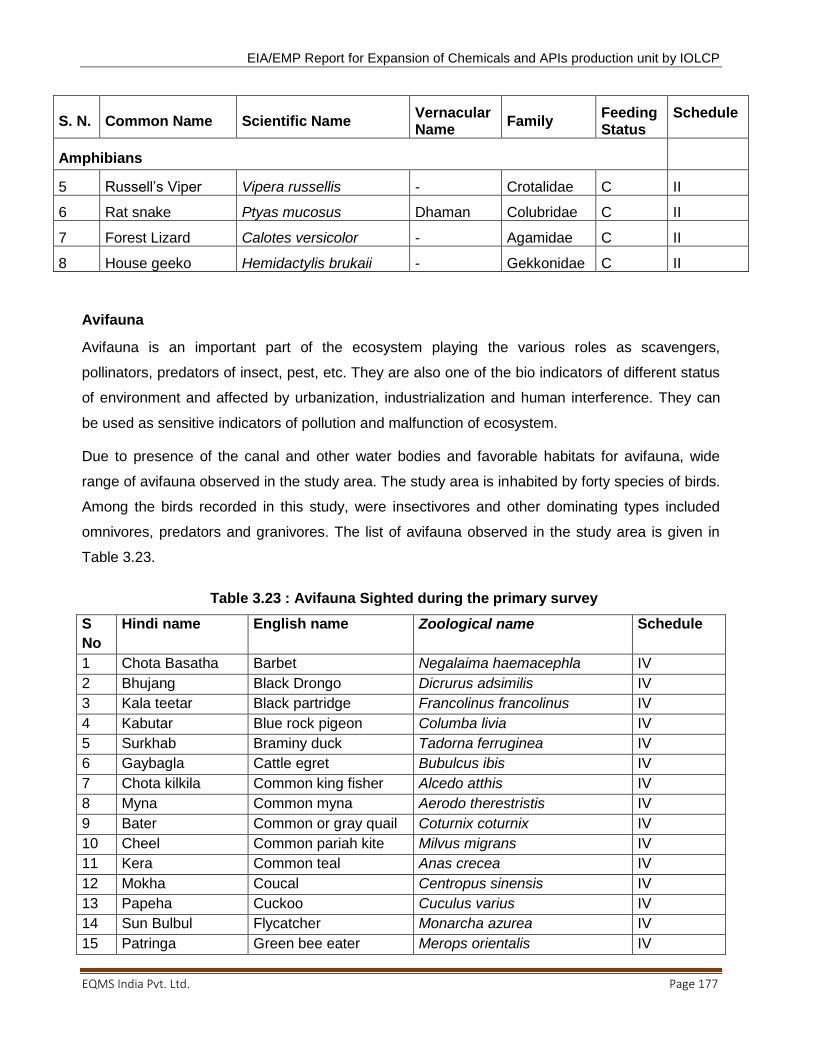
EIA/EMP Report for Expansion of Chemicals and APIs production unit by IOLCP
EQMS India Pvt. Ltd. Page 177
S. N. Common Name Scientific Name Vernacular Name
Family Feeding Status
Schedule
Amphibians
5 Russell‘s Viper Vipera russellis - Crotalidae C II
6 Rat snake Ptyas mucosus Dhaman Colubridae C II
7 Forest Lizard Calotes versicolor - Agamidae C II
8 House geeko Hemidactylis brukaii - Gekkonidae C II
Avifauna
Avifauna is an important part of the ecosystem playing the various roles as scavengers,
pollinators, predators of insect, pest, etc. They are also one of the bio indicators of different status
of environment and affected by urbanization, industrialization and human interference. They can
be used as sensitive indicators of pollution and malfunction of ecosystem.
Due to presence of the canal and other water bodies and favorable habitats for avifauna, wide
range of avifauna observed in the study area. The study area is inhabited by forty species of birds.
Among the birds recorded in this study, were insectivores and other dominating types included
omnivores, predators and granivores. The list of avifauna observed in the study area is given in
Table 3.23.
Table 3.23 : Avifauna Sighted during the primary survey
S
No
Hindi name English name Zoological name Schedule
1 Chota Basatha Barbet Negalaima haemacephla IV
2 Bhujang Black Drongo Dicrurus adsimilis IV
3 Kala teetar Black partridge Francolinus francolinus IV
4 Kabutar Blue rock pigeon Columba livia IV
5 Surkhab Braminy duck Tadorna ferruginea IV
6 Gaybagla Cattle egret Bubulcus ibis IV
7 Chota kilkila Common king fisher Alcedo atthis IV
8 Myna Common myna Aerodo therestristis IV
9 Bater Common or gray quail Coturnix coturnix IV
10 Cheel Common pariah kite Milvus migrans IV
11 Kera Common teal Anas crecea IV
12 Mokha Coucal Centropus sinensis IV
13 Papeha Cuckoo Cuculus varius IV
14 Sun Bulbul Flycatcher Monarcha azurea IV
15 Patringa Green bee eater Merops orientalis IV
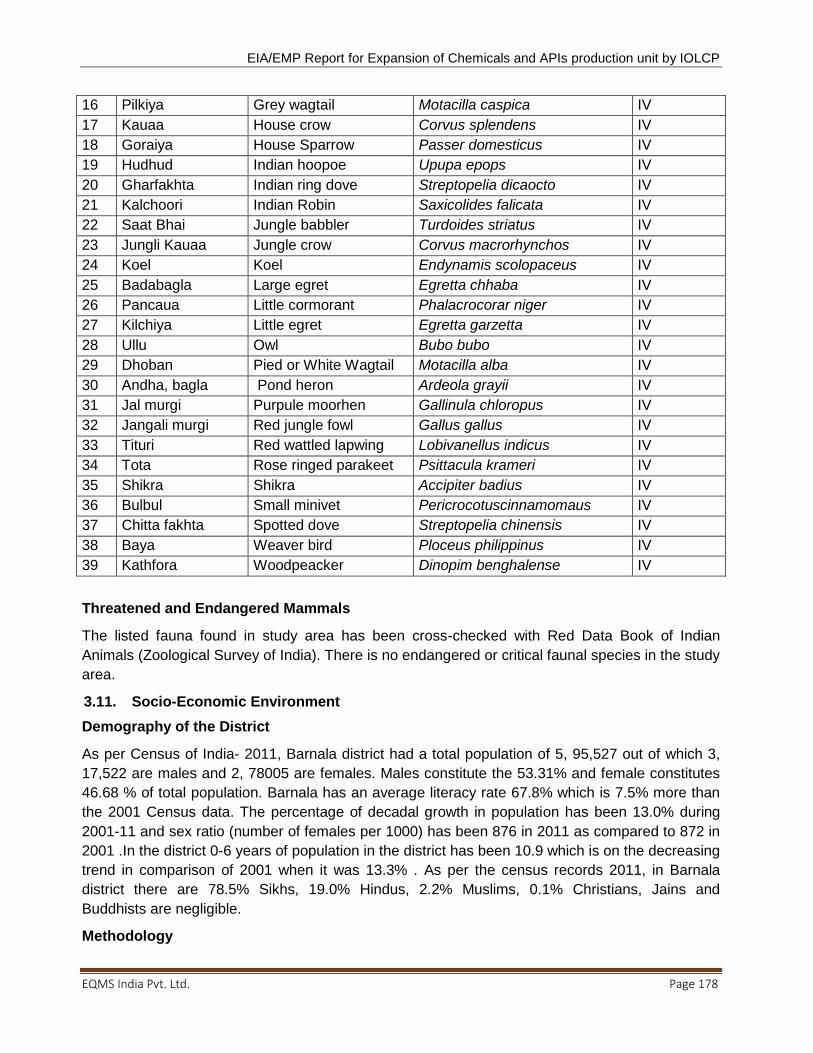
EIA/EMP Report for Expansion of Chemicals and APIs production unit by IOLCP
EQMS India Pvt. Ltd. Page 178
16 Pilkiya Grey wagtail Motacilla caspica IV
17 Kauaa House crow Corvus splendens IV
18 Goraiya House Sparrow Passer domesticus IV
19 Hudhud Indian hoopoe Upupa epops IV
20 Gharfakhta Indian ring dove Streptopelia dicaocto IV
21 Kalchoori Indian Robin Saxicolides falicata IV
22 Saat Bhai Jungle babbler Turdoides striatus IV
23 Jungli Kauaa Jungle crow Corvus macrorhynchos IV
24 Koel Koel Endynamis scolopaceus IV
25 Badabagla Large egret Egretta chhaba IV
26 Pancaua Little cormorant Phalacrocorar niger IV
27 Kilchiya Little egret Egretta garzetta IV
28 Ullu Owl Bubo bubo IV
29 Dhoban Pied or White Wagtail Motacilla alba IV
30 Andha, bagla Pond heron Ardeola grayii IV
31 Jal murgi Purpule moorhen Gallinula chloropus IV
32 Jangali murgi Red jungle fowl Gallus gallus IV
33 Tituri Red wattled lapwing Lobivanellus indicus IV
34 Tota Rose ringed parakeet Psittacula krameri IV
35 Shikra Shikra Accipiter badius IV
36 Bulbul Small minivet Pericrocotuscinnamomaus IV
37 Chitta fakhta Spotted dove Streptopelia chinensis IV
38 Baya Weaver bird Ploceus philippinus IV
39 Kathfora Woodpeacker Dinopim benghalense IV
Threatened and Endangered Mammals
The listed fauna found in study area has been cross-checked with Red Data Book of Indian
Animals (Zoological Survey of India). There is no endangered or critical faunal species in the study
area.
3.11. Socio-Economic Environment
Demography of the District
As per Census of India- 2011, Barnala district had a total population of 5, 95,527 out of which 3,
17,522 are males and 2, 78005 are females. Males constitute the 53.31% and female constitutes
46.68 % of total population. Barnala has an average literacy rate 67.8% which is 7.5% more than
the 2001 Census data. The percentage of decadal growth in population has been 13.0% during
2001-11 and sex ratio (number of females per 1000) has been 876 in 2011 as compared to 872 in
2001 .In the district 0-6 years of population in the district has been 10.9 which is on the decreasing
trend in comparison of 2001 when it was 13.3% . As per the census records 2011, in Barnala
district there are 78.5% Sikhs, 19.0% Hindus, 2.2% Muslims, 0.1% Christians, Jains and
Buddhists are negligible.
Methodology
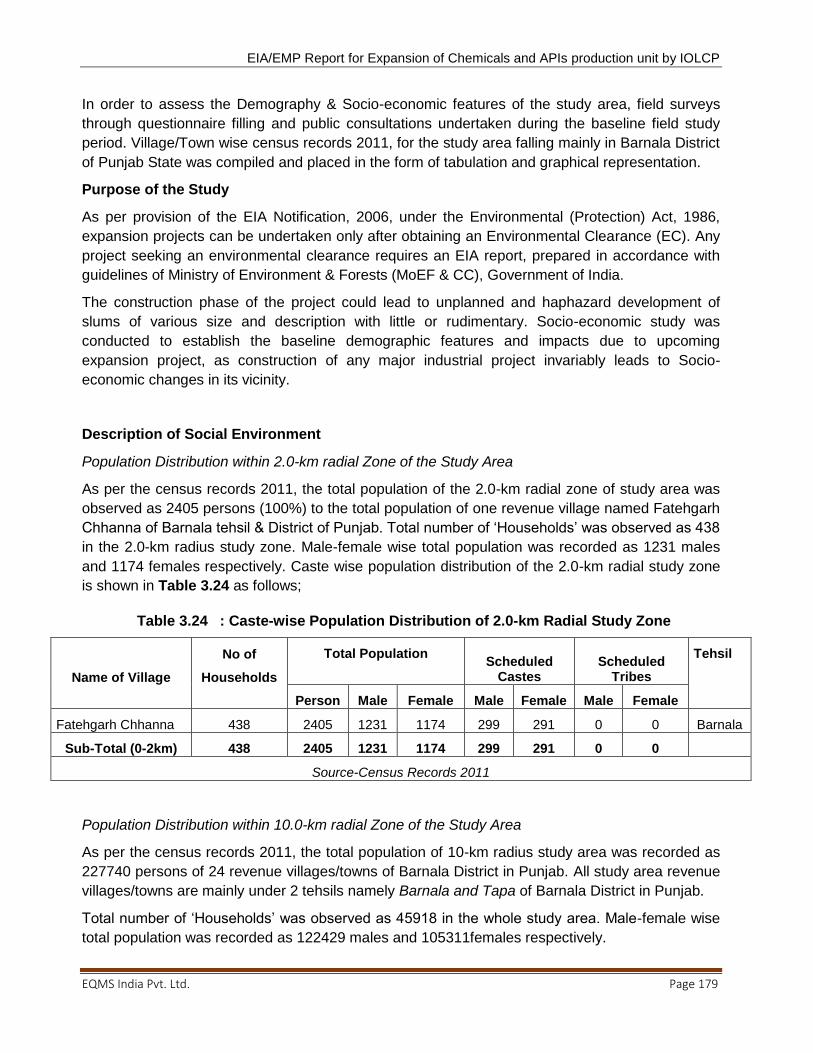
EIA/EMP Report for Expansion of Chemicals and APIs production unit by IOLCP
EQMS India Pvt. Ltd. Page 179
In order to assess the Demography & Socio-economic features of the study area, field surveys
through questionnaire filling and public consultations undertaken during the baseline field study
period. Village/Town wise census records 2011, for the study area falling mainly in Barnala District
of Punjab State was compiled and placed in the form of tabulation and graphical representation.
Purpose of the Study
As per provision of the EIA Notification, 2006, under the Environmental (Protection) Act, 1986,
expansion projects can be undertaken only after obtaining an Environmental Clearance (EC). Any
project seeking an environmental clearance requires an EIA report, prepared in accordance with
guidelines of Ministry of Environment & Forests (MoEF & CC), Government of India.
The construction phase of the project could lead to unplanned and haphazard development of
slums of various size and description with little or rudimentary. Socio-economic study was
conducted to establish the baseline demographic features and impacts due to upcoming
expansion project, as construction of any major industrial project invariably leads to Socio-
economic changes in its vicinity.
Description of Social Environment
Population Distribution within 2.0-km radial Zone of the Study Area
As per the census records 2011, the total population of the 2.0-km radial zone of study area was
observed as 2405 persons (100%) to the total population of one revenue village named Fatehgarh
Chhanna of Barnala tehsil & District of Punjab. Total number of ‗Households‘ was observed as 438
in the 2.0-km radius study zone. Male-female wise total population was recorded as 1231 males
and 1174 females respectively. Caste wise population distribution of the 2.0-km radial study zone
is shown in Table 3.24 as follows;
Table 3.24 : Caste-wise Population Distribution of 2.0-km Radial Study Zone
Name of Village
No of
Households
Total Population
Scheduled
Castes Scheduled
Tribes
Tehsil
Person Male Female Male Female Male Female
Fatehgarh Chhanna 438 2405 1231 1174 299 291 0 0 Barnala
Sub-Total (0-2km) 438 2405 1231 1174 299 291 0 0
Source-Census Records 2011
Population Distribution within 10.0-km radial Zone of the Study Area
As per the census records 2011, the total population of 10-km radius study area was recorded as
227740 persons of 24 revenue villages/towns of Barnala District in Punjab. All study area revenue
villages/towns are mainly under 2 tehsils namely Barnala and Tapa of Barnala District in Punjab.
Total number of ‗Households‘ was observed as 45918 in the whole study area. Male-female wise
total population was recorded as 122429 males and 105311females respectively.
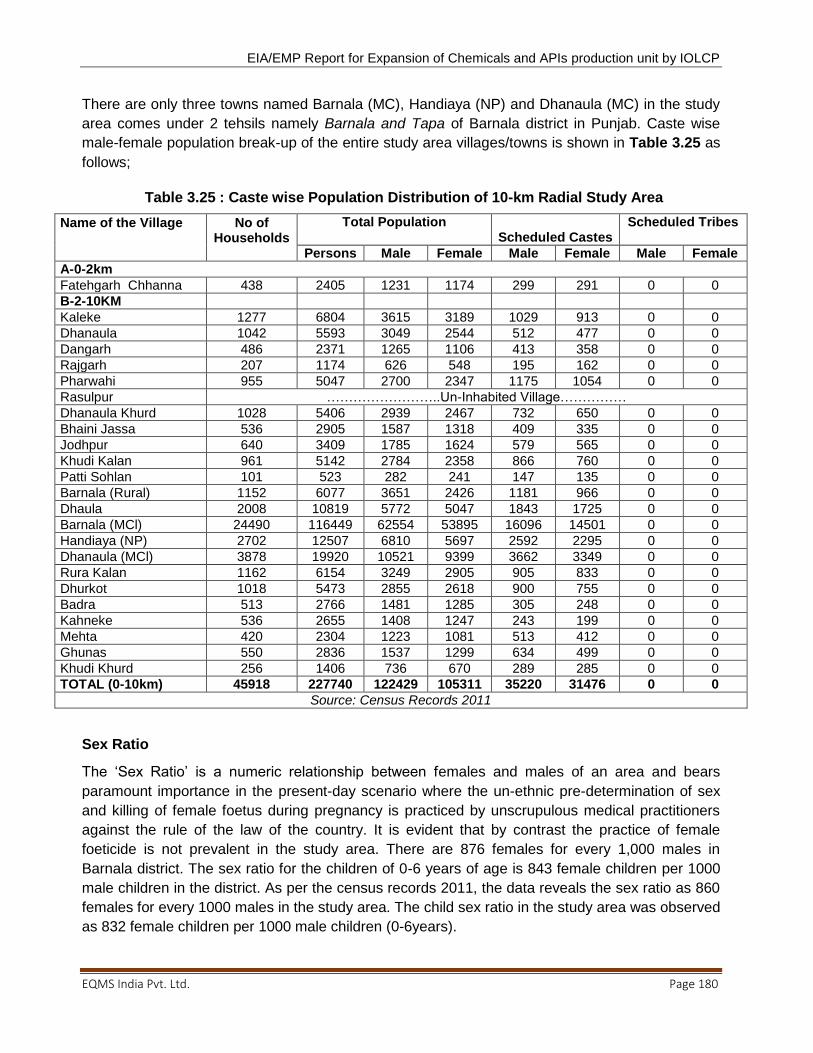
EIA/EMP Report for Expansion of Chemicals and APIs production unit by IOLCP
EQMS India Pvt. Ltd. Page 180
There are only three towns named Barnala (MC), Handiaya (NP) and Dhanaula (MC) in the study
area comes under 2 tehsils namely Barnala and Tapa of Barnala district in Punjab. Caste wise
male-female population break-up of the entire study area villages/towns is shown in Table 3.25 as
follows;
Table 3.25 : Caste wise Population Distribution of 10-km Radial Study Area
Name of the Village
No of Households
Total Population Scheduled Castes
Scheduled Tribes
Persons Male Female Male Female Male Female
A-0-2km
Fatehgarh Chhanna 438 2405 1231 1174 299 291 0 0
B-2-10KM
Kaleke 1277 6804 3615 3189 1029 913 0 0
Dhanaula 1042 5593 3049 2544 512 477 0 0
Dangarh 486 2371 1265 1106 413 358 0 0
Rajgarh 207 1174 626 548 195 162 0 0
Pharwahi 955 5047 2700 2347 1175 1054 0 0
Rasulpur ……………………..Un-Inhabited Village……………
Dhanaula Khurd 1028 5406 2939 2467 732 650 0 0
Bhaini Jassa 536 2905 1587 1318 409 335 0 0
Jodhpur 640 3409 1785 1624 579 565 0 0
Khudi Kalan 961 5142 2784 2358 866 760 0 0
Patti Sohlan 101 523 282 241 147 135 0 0
Barnala (Rural) 1152 6077 3651 2426 1181 966 0 0
Dhaula 2008 10819 5772 5047 1843 1725 0 0
Barnala (MCl) 24490 116449 62554 53895 16096 14501 0 0
Handiaya (NP) 2702 12507 6810 5697 2592 2295 0 0
Dhanaula (MCl) 3878 19920 10521 9399 3662 3349 0 0
Rura Kalan 1162 6154 3249 2905 905 833 0 0
Dhurkot 1018 5473 2855 2618 900 755 0 0
Badra 513 2766 1481 1285 305 248 0 0
Kahneke 536 2655 1408 1247 243 199 0 0
Mehta 420 2304 1223 1081 513 412 0 0
Ghunas 550 2836 1537 1299 634 499 0 0
Khudi Khurd 256 1406 736 670 289 285 0 0
TOTAL (0-10km) 45918 227740 122429 105311 35220 31476 0 0
Source: Census Records 2011
Sex Ratio
The ‗Sex Ratio‘ is a numeric relationship between females and males of an area and bears
paramount importance in the present-day scenario where the un-ethnic pre-determination of sex
and killing of female foetus during pregnancy is practiced by unscrupulous medical practitioners
against the rule of the law of the country. It is evident that by contrast the practice of female
foeticide is not prevalent in the study area. There are 876 females for every 1,000 males in
Barnala district. The sex ratio for the children of 0-6 years of age is 843 female children per 1000
male children in the district. As per the census records 2011, the data reveals the sex ratio as 860
females for every 1000 males in the study area. The child sex ratio in the study area was observed
as 832 female children per 1000 male children (0-6years).
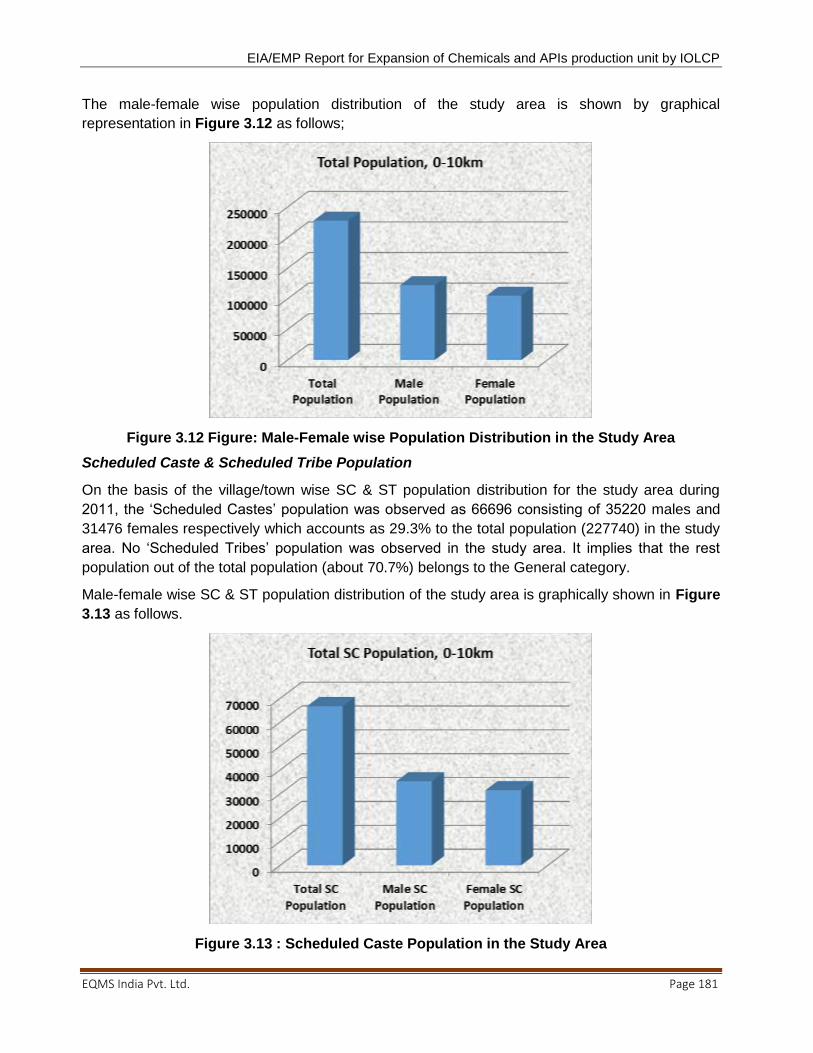
EIA/EMP Report for Expansion of Chemicals and APIs production unit by IOLCP
EQMS India Pvt. Ltd. Page 181
The male-female wise population distribution of the study area is shown by graphical
representation in Figure 3.12 as follows;
Figure 3.12 Figure: Male-Female wise Population Distribution in the Study Area
Scheduled Caste & Scheduled Tribe Population
On the basis of the village/town wise SC & ST population distribution for the study area during
2011, the ‗Scheduled Castes‘ population was observed as 66696 consisting of 35220 males and
31476 females respectively which accounts as 29.3% to the total population (227740) in the study
area. No ‗Scheduled Tribes‘ population was observed in the study area. It implies that the rest
population out of the total population (about 70.7%) belongs to the General category.
Male-female wise SC & ST population distribution of the study area is graphically shown in Figure
3.13 as follows.
Figure 3.13 : Scheduled Caste Population in the Study Area
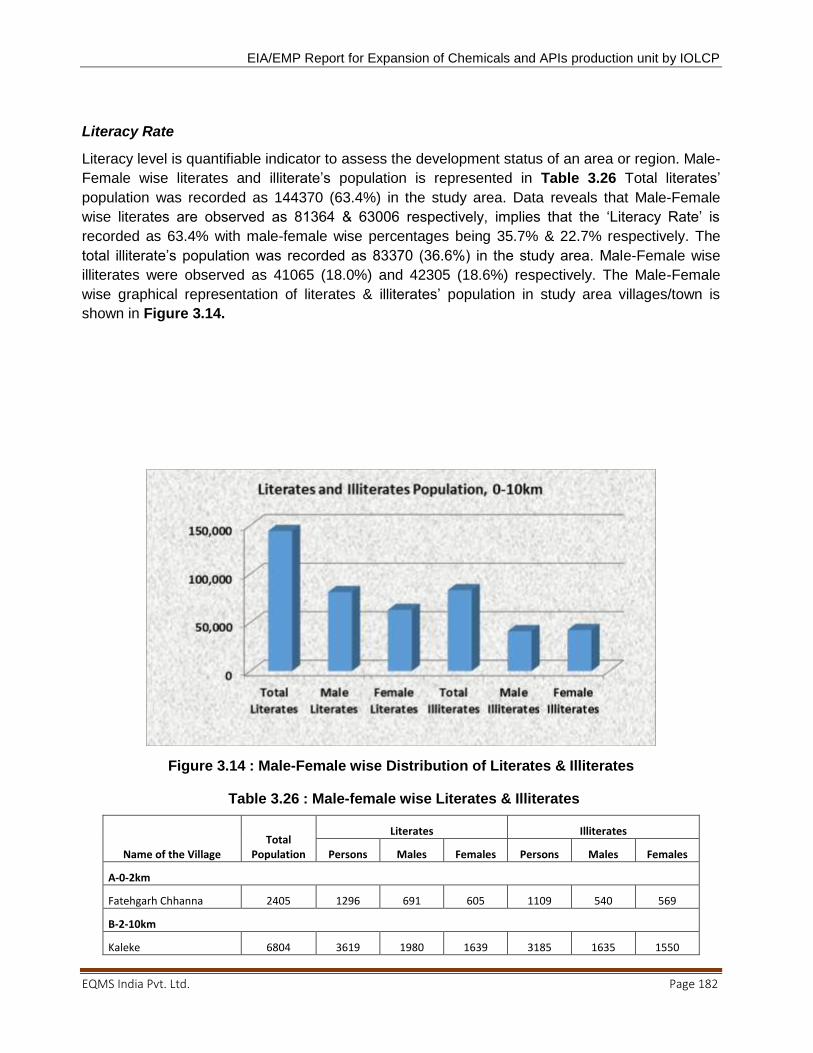
EIA/EMP Report for Expansion of Chemicals and APIs production unit by IOLCP
EQMS India Pvt. Ltd. Page 182
Literacy Rate
Literacy level is quantifiable indicator to assess the development status of an area or region. Male-
Female wise literates and illiterate‘s population is represented in Table 3.26 Total literates‘
population was recorded as 144370 (63.4%) in the study area. Data reveals that Male-Female
wise literates are observed as 81364 & 63006 respectively, implies that the ‗Literacy Rate‘ is
recorded as 63.4% with male-female wise percentages being 35.7% & 22.7% respectively. The
total illiterate‘s population was recorded as 83370 (36.6%) in the study area. Male-Female wise
illiterates were observed as 41065 (18.0%) and 42305 (18.6%) respectively. The Male-Female
wise graphical representation of literates & illiterates‘ population in study area villages/town is
shown in Figure 3.14.
Figure 3.14 : Male-Female wise Distribution of Literates & Illiterates
Table 3.26 : Male-female wise Literates & Illiterates
Name of the Village Total
Population
Literates Illiterates
Persons Males Females Persons Males Females
A-0-2km
Fatehgarh Chhanna 2405 1296 691 605 1109 540 569
B-2-10km
Kaleke 6804 3619 1980 1639 3185 1635 1550
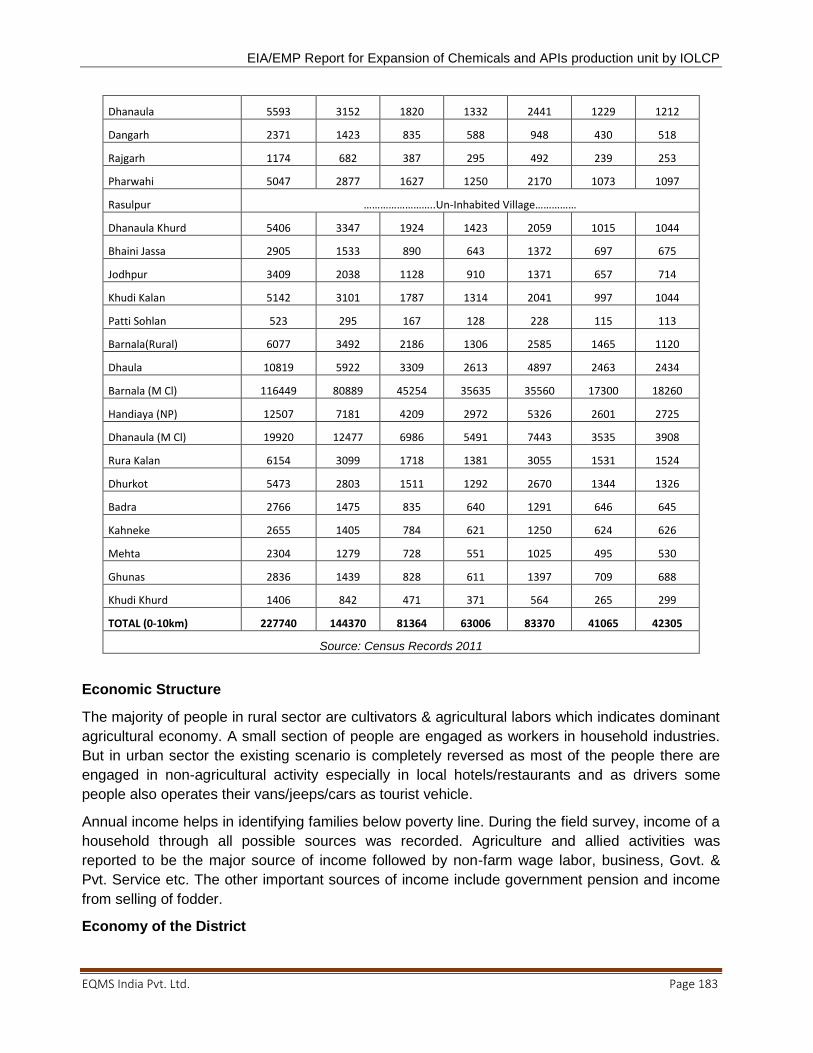
EIA/EMP Report for Expansion of Chemicals and APIs production unit by IOLCP
EQMS India Pvt. Ltd. Page 183
Dhanaula 5593 3152 1820 1332 2441 1229 1212
Dangarh 2371 1423 835 588 948 430 518
Rajgarh 1174 682 387 295 492 239 253
Pharwahi 5047 2877 1627 1250 2170 1073 1097
Rasulpur ……………………..Un-Inhabited Village……………
Dhanaula Khurd 5406 3347 1924 1423 2059 1015 1044
Bhaini Jassa 2905 1533 890 643 1372 697 675
Jodhpur 3409 2038 1128 910 1371 657 714
Khudi Kalan 5142 3101 1787 1314 2041 997 1044
Patti Sohlan 523 295 167 128 228 115 113
Barnala(Rural) 6077 3492 2186 1306 2585 1465 1120
Dhaula 10819 5922 3309 2613 4897 2463 2434
Barnala (M Cl) 116449 80889 45254 35635 35560 17300 18260
Handiaya (NP) 12507 7181 4209 2972 5326 2601 2725
Dhanaula (M Cl) 19920 12477 6986 5491 7443 3535 3908
Rura Kalan 6154 3099 1718 1381 3055 1531 1524
Dhurkot 5473 2803 1511 1292 2670 1344 1326
Badra 2766 1475 835 640 1291 646 645
Kahneke 2655 1405 784 621 1250 624 626
Mehta 2304 1279 728 551 1025 495 530
Ghunas 2836 1439 828 611 1397 709 688
Khudi Khurd 1406 842 471 371 564 265 299
TOTAL (0-10km) 227740 144370 81364 63006 83370 41065 42305
Source: Census Records 2011
Economic Structure
The majority of people in rural sector are cultivators & agricultural labors which indicates dominant
agricultural economy. A small section of people are engaged as workers in household industries.
But in urban sector the existing scenario is completely reversed as most of the people there are
engaged in non-agricultural activity especially in local hotels/restaurants and as drivers some
people also operates their vans/jeeps/cars as tourist vehicle.
Annual income helps in identifying families below poverty line. During the field survey, income of a
household through all possible sources was recorded. Agriculture and allied activities was
reported to be the major source of income followed by non-farm wage labor, business, Govt. &
Pvt. Service etc. The other important sources of income include government pension and income
from selling of fodder.
Economy of the District
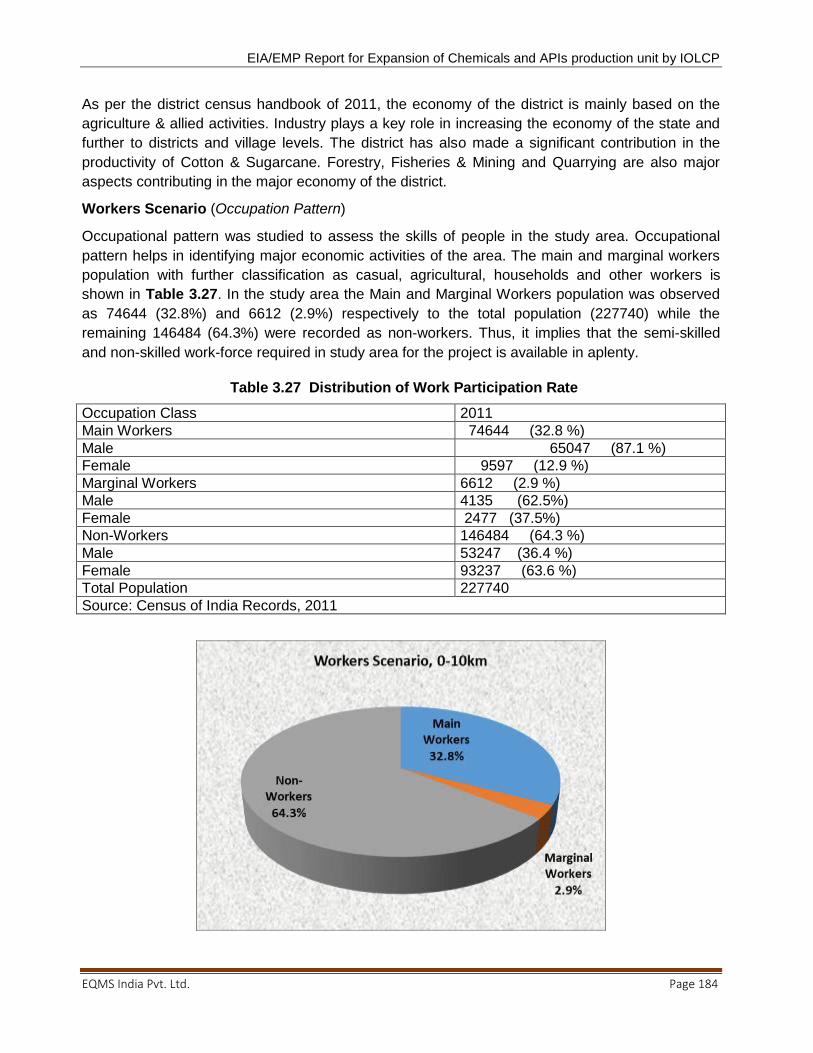
EIA/EMP Report for Expansion of Chemicals and APIs production unit by IOLCP
EQMS India Pvt. Ltd. Page 184
As per the district census handbook of 2011, the economy of the district is mainly based on the
agriculture & allied activities. Industry plays a key role in increasing the economy of the state and
further to districts and village levels. The district has also made a significant contribution in the
productivity of Cotton & Sugarcane. Forestry, Fisheries & Mining and Quarrying are also major
aspects contributing in the major economy of the district.
Workers Scenario (Occupation Pattern)
Occupational pattern was studied to assess the skills of people in the study area. Occupational
pattern helps in identifying major economic activities of the area. The main and marginal workers
population with further classification as casual, agricultural, households and other workers is
shown in Table 3.27. In the study area the Main and Marginal Workers population was observed
as 74644 (32.8%) and 6612 (2.9%) respectively to the total population (227740) while the
remaining 146484 (64.3%) were recorded as non-workers. Thus, it implies that the semi-skilled
and non-skilled work-force required in study area for the project is available in aplenty.
Table 3.27 Distribution of Work Participation Rate
Occupation Class 2011
Main Workers 74644 (32.8 %)
Male 65047 (87.1 %)
Female 9597 (12.9 %)
Marginal Workers 6612 (2.9 %)
Male 4135 (62.5%)
Female 2477 (37.5%)
Non-Workers 146484 (64.3 %)
Male 53247 (36.4 %)
Female 93237 (63.6 %)
Total Population 227740
Source: Census of India Records, 2011
9
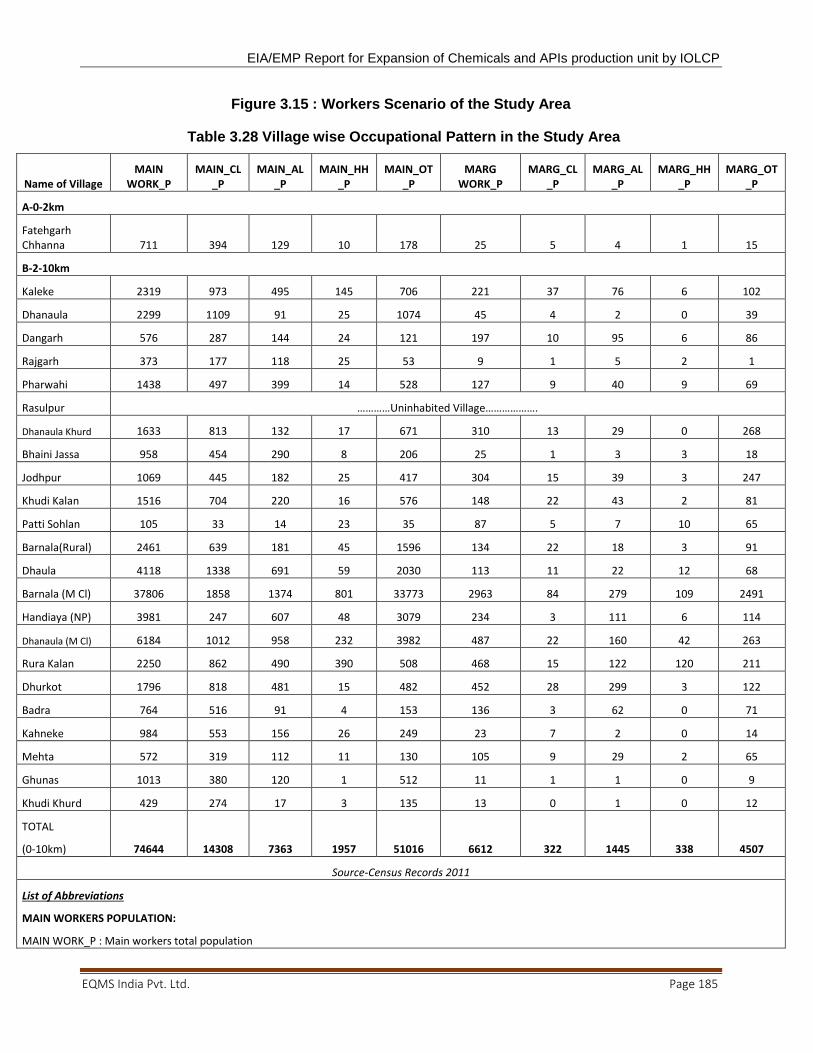
EIA/EMP Report for Expansion of Chemicals and APIs production unit by IOLCP
EQMS India Pvt. Ltd. Page 185
Figure 3.15 : Workers Scenario of the Study Area
Table 3.28 Village wise Occupational Pattern in the Study Area
Name of Village MAIN
WORK_P MAIN_CL
_P MAIN_AL
_P MAIN_HH
_P MAIN_OT
_P MARG
WORK_P MARG_CL
_P MARG_AL
_P MARG_HH
_P MARG_OT
_P
A-0-2km
Fatehgarh Chhanna 711 394 129 10 178 25 5 4 1 15
B-2-10km
Kaleke 2319 973 495 145 706 221 37 76 6 102
Dhanaula 2299 1109 91 25 1074 45 4 2 0 39
Dangarh 576 287 144 24 121 197 10 95 6 86
Rajgarh 373 177 118 25 53 9 1 5 2 1
Pharwahi 1438 497 399 14 528 127 9 40 9 69
Rasulpur …………Uninhabited Village……………….
Dhanaula Khurd 1633 813 132 17 671 310 13 29 0 268
Bhaini Jassa 958 454 290 8 206 25 1 3 3 18
Jodhpur 1069 445 182 25 417 304 15 39 3 247
Khudi Kalan 1516 704 220 16 576 148 22 43 2 81
Patti Sohlan 105 33 14 23 35 87 5 7 10 65
Barnala(Rural) 2461 639 181 45 1596 134 22 18 3 91
Dhaula 4118 1338 691 59 2030 113 11 22 12 68
Barnala (M Cl) 37806 1858 1374 801 33773 2963 84 279 109 2491
Handiaya (NP) 3981 247 607 48 3079 234 3 111 6 114
Dhanaula (M Cl) 6184 1012 958 232 3982 487 22 160 42 263
Rura Kalan 2250 862 490 390 508 468 15 122 120 211
Dhurkot 1796 818 481 15 482 452 28 299 3 122
Badra 764 516 91 4 153 136 3 62 0 71
Kahneke 984 553 156 26 249 23 7 2 0 14
Mehta 572 319 112 11 130 105 9 29 2 65
Ghunas 1013 380 120 1 512 11 1 1 0 9
Khudi Khurd 429 274 17 3 135 13 0 1 0 12
TOTAL
(0-10km) 74644 14308 7363 1957 51016 6612 322 1445 338 4507
Source-Census Records 2011
List of Abbreviations
MAIN WORKERS POPULATION:
MAIN WORK_P : Main workers total population

EIA/EMP Report for Expansion of Chemicals and APIs production unit by IOLCP
EQMS India Pvt. Ltd. Page 186
MAIN_CL_P : Main cultivated labour population
MAIN_AL_P : Main agricultural labour population
MAIN_HH_P : Main workers population involved in household industries
MAIN_OT_P : Main other workers population
MARGINAL WORKERS POPULATION:
MARG WORK_P : Marginal workers total population
MARG_CL_P : Marginal cultivated labors total population
MARG_AL_P : Marginal agricultural labors population
MARG_HH_P : Marginal workers involved in household industries
MARG_OT_P : Marginal other workers Population
Composition of Main Workers
The ‗Main Workers‘ were observed as 74644 persons (32.8%) to the total population of the study
area and its composition is made-up of Casual laborers as 14308 (19.2%), Agricultural laborers as
7363 (9.9%), Household workers 1957 (2.6%) and other workers as 51016 (68.3%) respectively.
Composition of Main workers is shown below as Figure 3.16
Figure 3.16 : Composition of Main Workers Population
Composition of Marginal Workers
The total marginal workers are observed as 6612 which constitute 2.9% of the total population
(227740) comprise of Marginal Casual Laborers as 322 (4.9%), Marginal Agricultural Laborers as
1445 (21.9%), Marginal Household laborers as 338 (5.1%) and marginal other workers were also
observed as 4507 (68.1%) of the total marginal workers respectively. Details about marginal
workers in the study area are tabulated in Table.3.28. Composition of Marginal workers is shown
in Figure 3.17 as follows;
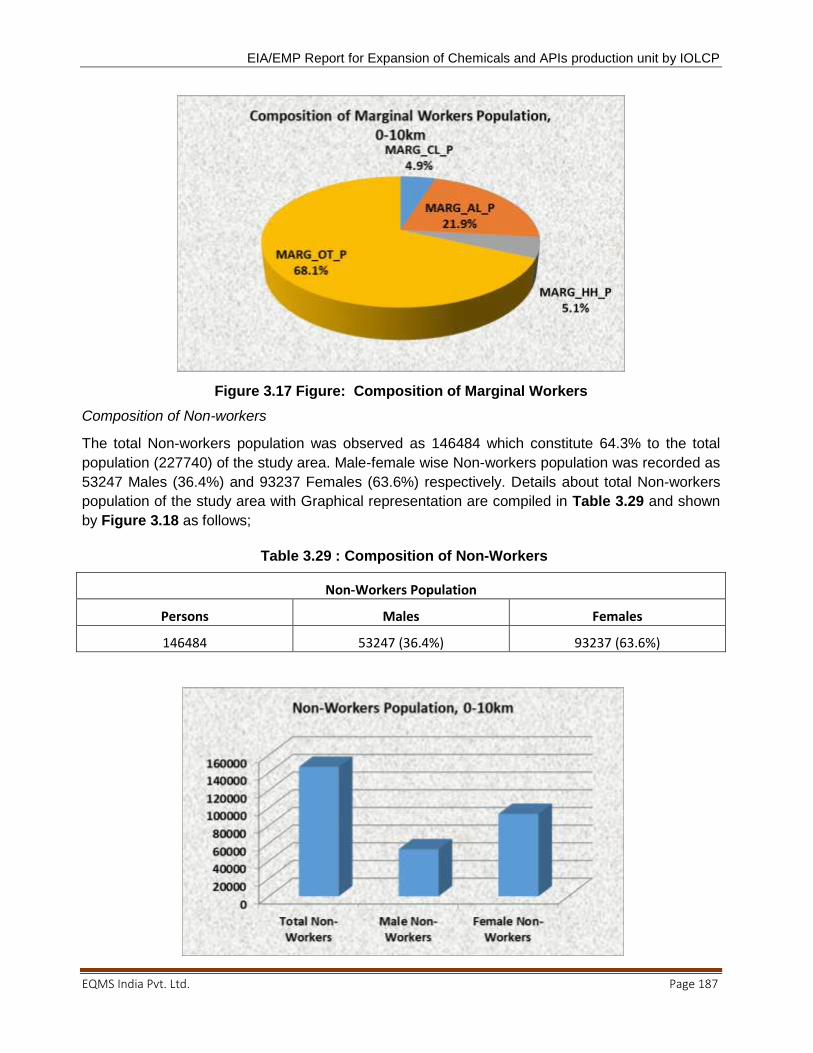
EIA/EMP Report for Expansion of Chemicals and APIs production unit by IOLCP
EQMS India Pvt. Ltd. Page 187
Figure 3.17 Figure: Composition of Marginal Workers
Composition of Non-workers
The total Non-workers population was observed as 146484 which constitute 64.3% to the total
population (227740) of the study area. Male-female wise Non-workers population was recorded as
53247 Males (36.4%) and 93237 Females (63.6%) respectively. Details about total Non-workers
population of the study area with Graphical representation are compiled in Table 3.29 and shown
by Figure 3.18 as follows;
Table 3.29 : Composition of Non-Workers
Non-Workers Population
Persons Males Females
146484 53247 (36.4%) 93237 (63.6%)
EIA/EMP Report for Expansion of Chemicals and APIs production unit by IOLCP
EQMS India Pvt. Ltd. Page 188
Figure 3.18 : Composition of Non-Workers
Availability of Basic Infrastructure Facilities & Amenities in the Study Area
A review of basic infrastructure facility and amenities available in the study area villages has been
done based on the field survey and Census Records 2011. As per the census records 2011, there
are a total of twenty-four (24) revenue villages/towns of Barnala District in Punjab state. All study
area revenue villages are mainly under two (02) tehsils namely Barnala and Tapa of Barnala
District respectively.
The study area has average level of basic infrastructure facilities (amenities) like educational,
medical, potable water, power supply, and transport & communication network etc; entire study
area is rural except three towns named Barnala (MC), Handiaya (NP) and Dhanaula (MC) of
Barnala district of Punjab State.
Education Facilities
There are about twenty-one (21) Primary Schools existing in the rural part of the study area.
Middle schools are found in 19 revenue villages of the rural part in the study area. Only thirteen
(13) Higher Secondary Schools were observed available in the rural part of the study area. Senior
Secondary School facility was observed available only in seven (07) revenue villages of the study
area. The educational facilities have been further strengthening now and several private public
schools and colleges are also functioning in the surroundings of the study area. Besides, there are
Engineering and Medical colleges available in Towns and District headquarters only. Higher
education facilities are available in Towns of the area. There is considerable improvement in
educational facility. The villages/towns of the study area have no such facilities can reach within
5.0 to 10.0-km range.
It is also mentioned that in the district there is one College of Engineering & Technology Viz. Arya
Bhatta College of Engineering & Tech. Village. Jodhpur Cheema, Teh. Barnala Baja Khanna
Road, (NH-71) in Barnala.
Medical Facilities
Medical facility is one of the most important facilities for people. Here we can see most of the
villages are far away from the hospital located. The medical facilities are provided by different
agencies like Govt. & Private individuals and voluntary organizations in the study area. As per the
census records 2011, only two (02) primary health center exists in rural part of the study area and
no community health center exists in the rural study area; most of the study area villages depend
upon the towns / district HQ of the study area having such facility. Seven (07) Primary health sub-
centers are exists in the rural part of the study area. Mother & child welfare center, Family welfare
center, Hospital and medical Dispensary facilities are observed in the four villages of rural part of
the study area; most of the villages are depending upon towns and district HQ having such type of
medical facility. Overall rural part of the study area is served by average medical facilities.
Specialized medical facilities are available in towns and District Headquarter (HQ) only.
From medical point of view in the district, there is 1 hospital in urban area, 1 CHC in rural and 3
CHC in urban area, 11 PHC in rural area, 35 Subsidiary Health Centers /Dispensaries in rural area
and 1 in urban area. Under the category of special medical institutions, there is 1 dispensary in
EIA/EMP Report for Expansion of Chemicals and APIs production unit by IOLCP
EQMS India Pvt. Ltd. Page 189
rural and 2 dispensaries in the urban area. In addition, there are also 12 Ayurvedic institutions in
the district.
Potable Water Facilities
Potable water facility is available in most of the villages/towns of the study area. Tube well water
facility was commonly observed in 15 (62.5%) villages of the study area. Hand pump facility for
drinking water was observed only in 8 villages of the study area. Out of the total twenty-four (24)
revenue villages/towns, no village was served with River/Canal water for drinking purpose in the
study area. As per the census records of 2011, no village was observed with Tank/Pond/Lake
water facility in the rural part of the study area. Adequate potable water facilities are available in
the study area.
Regarding, the position of villages covered under the rural drinking water supply scheme up to
3/2010 is concerned, in the district there are 124 inhabited villages, and all have been identified as
water scarcity villages, out of which in 117 village‘s water supply scheme have been
commissioned and in the remaining 7 villages scheme is still to be initiated. Thus, the percentage
of villages in this regard has been 94.4%.
Communication, Road, Transport and Banking Facilities
Apart from Post &Telegraph (P & T) services, transport is the main communication linkage in the
study area. As per the census records 2011, only one village named Dhanaula Khurd village of
Barnala district was observed with Post Office facility in the study area. Most of the villages are
depending upon those villages being served with such facility. The study area has good road
network, passes from the area.
Transport and Communication facilities are necessary for administrative purposes as well as
public convenience. Moreover; a well-knit public transportation system is a prerequisite for social
and economic development of the district. The linking of one place with other by road is very
essential to provide good transport system. Mainly four (04) towns named Dhanaula, Barnala,
Handiaya and Tapa are available within the distance range of 0 to 10kms from the villages of the
study area. More than >50% villages/towns are served with Pucca road facility in the study area.
As per the compiled information on basic infrastructure facility, about 33% villages in the study
area are being served with Public Bus services. Only two villages named Barnala (Rural) and
Ghunas were observed with railway station facility in the study area and remaining villages are
depending upon towns and concerned district HQ for such facility. Nearest State/National Highway
are as SH-13 (1.01km, West) & NH-64, 3.47km, North respectively from the project site. There is
no airport facility in this district. The nearest airport is Sahnewal Airport (LUH/VILD), located at
85km away from the district HQ in Punjab. The study area has almost all the schedule commercial
banks with ATM facility in urban areas and the district HQ.
Power Supply
It is revealed from the compiled information on amenities availability as per the census record of
2011; almost all villages and towns (about 92%) are electrified for all purpose in the study area.
Electricity is one of the chief importance necessities for the economic development of the district.

EIA/EMP Report for Expansion of Chemicals and APIs production unit by IOLCP
EQMS India Pvt. Ltd. Page 190
Village/town wise ‗Basic Infrastructure and Amenities’ availability data for the entire study area is
represented in Table 3.30 as follows;
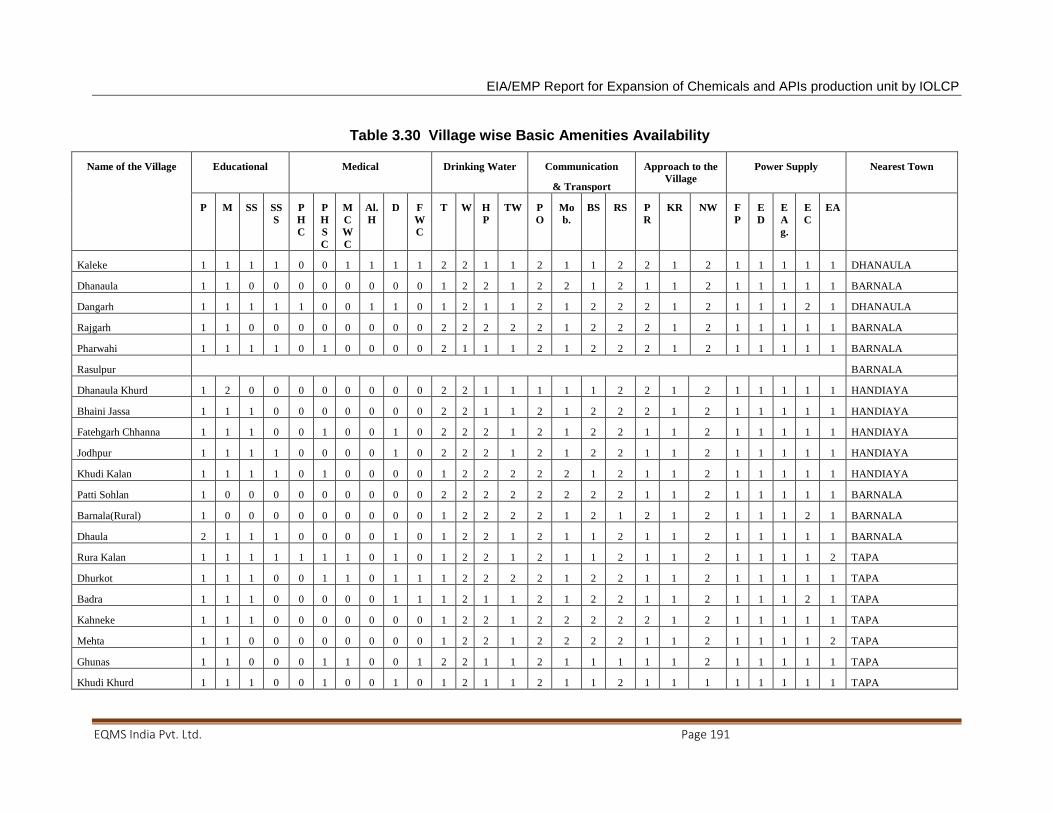
EIA/EMP Report for Expansion of Chemicals and APIs production unit by IOLCP
EQMS India Pvt. Ltd. Page 191
Table 3.30 Village wise Basic Amenities Availability
Name of the Village Educational Medical Drinking Water Communication
& Transport
Approach to the
Village
Power Supply Nearest Town
P M SS SS
S
P
H
C
P
H
S
C
M
C
W
C
Al.
H
D F
W
C
T W H
P
TW P
O
Mo
b.
BS RS P
R
KR NW F
P
E
D
E
A
g.
E
C
EA
Kaleke 1 1 1 1 0 0 1 1 1 1 2 2 1 1 2 1 1 2 2 1 2 1 1 1 1 1 DHANAULA
Dhanaula 1 1 0 0 0 0 0 0 0 0 1 2 2 1 2 2 1 2 1 1 2 1 1 1 1 1 BARNALA
Dangarh 1 1 1 1 1 0 0 1 1 0 1 2 1 1 2 1 2 2 2 1 2 1 1 1 2 1 DHANAULA
Rajgarh 1 1 0 0 0 0 0 0 0 0 2 2 2 2 2 1 2 2 2 1 2 1 1 1 1 1 BARNALA
Pharwahi 1 1 1 1 0 1 0 0 0 0 2 1 1 1 2 1 2 2 2 1 2 1 1 1 1 1 BARNALA
Rasulpur BARNALA
Dhanaula Khurd 1 2 0 0 0 0 0 0 0 0 2 2 1 1 1 1 1 2 2 1 2 1 1 1 1 1 HANDIAYA
Bhaini Jassa 1 1 1 0 0 0 0 0 0 0 2 2 1 1 2 1 2 2 2 1 2 1 1 1 1 1 HANDIAYA
Fatehgarh Chhanna 1 1 1 0 0 1 0 0 1 0 2 2 2 1 2 1 2 2 1 1 2 1 1 1 1 1 HANDIAYA
Jodhpur 1 1 1 1 0 0 0 0 1 0 2 2 2 1 2 1 2 2 1 1 2 1 1 1 1 1 HANDIAYA
Khudi Kalan 1 1 1 1 0 1 0 0 0 0 1 2 2 2 2 2 1 2 1 1 2 1 1 1 1 1 HANDIAYA
Patti Sohlan 1 0 0 0 0 0 0 0 0 0 2 2 2 2 2 2 2 2 1 1 2 1 1 1 1 1 BARNALA
Barnala(Rural) 1 0 0 0 0 0 0 0 0 0 1 2 2 2 2 1 2 1 2 1 2 1 1 1 2 1 BARNALA
Dhaula 2 1 1 1 0 0 0 0 1 0 1 2 2 1 2 1 1 2 1 1 2 1 1 1 1 1 BARNALA
Rura Kalan 1 1 1 1 1 1 1 0 1 0 1 2 2 1 2 1 1 2 1 1 2 1 1 1 1 2 TAPA
Dhurkot 1 1 1 0 0 1 1 0 1 1 1 2 2 2 2 1 2 2 1 1 2 1 1 1 1 1 TAPA
Badra 1 1 1 0 0 0 0 0 1 1 1 2 1 1 2 1 2 2 1 1 2 1 1 1 2 1 TAPA
Kahneke 1 1 1 0 0 0 0 0 0 0 1 2 2 1 2 2 2 2 2 1 2 1 1 1 1 1 TAPA
Mehta 1 1 0 0 0 0 0 0 0 0 1 2 2 1 2 2 2 2 1 1 2 1 1 1 1 2 TAPA
Ghunas 1 1 0 0 0 1 1 0 0 1 2 2 1 1 2 1 1 1 1 1 2 1 1 1 1 1 TAPA
Khudi Khurd 1 1 1 0 0 1 0 0 1 0 1 2 1 1 2 1 1 2 1 1 1 1 1 1 1 1 TAPA

EIA/EMP Report for Expansion of Chemicals and APIs production unit by IOLCP
EQMS India Pvt. Ltd. Page 192
Barnala (M Cl) …………………………….Town Area……………………………
Handiaya (NP) …………………………….Town Area……………………………
Dhanaula (M Cl) …………………………….Town Area……………………………
TOTAL 21 19 13 07 02 07 04 02 09 04 Status for Availability and Non-Availability is shown as A (1) & NA (2) respectively
Source-http://www.censusindia.gov.in/2011census/dchb/DCHB.html
Abbreviations:
Educational Facilities: P-Primary School, M-Middle School, SS-Higher Secondary Schools, SSS- Senior Secondary School
Medical Facilities: CHC-Community Health Centre, PHC-Primary Health Centre, PHSC-Primary Health Sub-Centre, MCWC-Maternity and Child Welfare Centre, H-Hospital, D- Dispensary, FWC-Family Welfare Centre
Drinking Water Facilities: T-Tap Water, W-Well Water, HP-Hand Pump, TW-Tube Well Water, R-River Water, Tk-Tank Water, O-Other Drinking Water Facility
Communication and Transport Facilities: PO-Post Office, SPO-Sub-Post Office, PTO- Post & Telegraph Office, Tel.-Telephone Connection, Mob.- Mobile Phone Coverage, BS-Bus Services, RS-
Railways Services
Approach to Village: PR- Paved Roads, KR-Kuchha Road, FP-Foot Path
Power Supply: ED-Power Supply for Domestic use, E Ag.- Power Supply for Agricultural use, EC-Power supply for Commercial use, EA-Electricity for All Purposes
EIA/EMP Report for Expansion of Chemicals and APIs production unit by IOLCP
EQMS India Pvt. Ltd. 193
Brief Description of Places of Religious, Historical or Archaeological Importance and
Tourist interest in the Villages & Towns of the District;
Barnala is the headquarters of the Barnala District and is an Indian city in Punjab. This place lies
in the middle of the state and is well known for its warm culture. This place is located on the
highway no 13, Sirsa-Ludhiana highways also pass through Barnala. This place is at 85 km from
Ludhiana and 65 km from Bhatinda.
Gurudwara Arisar Sahib Patshahi IX
The distance of this Gurudwara from Tapa Railway Station is 10 km. From Barnala city, it is 11
km and 3 km from Mansa-Barnala Road in Village Dhaula.
Gurudwara Gurusar Pakka Sahib Patshahi IX
This Gurudwara is at a distance of 7 km from the Bhatinda-Sangrur Road, Bhatinda City. It is
southwest, 6 km of Barnala city.
Gurudwara Patshahi IX, Dhilwan
The distance of this Gurudwara is 4 km from Tapa Railway Station, 25 km from Barnala City.
EIA/EMP Report for Expansion of Chemicals and APIs production unit by IOLCP
EQMS India Pvt. Ltd. 194
CHAPTER 4. ANTICIPATED ENVIRONMENTAL IMPACTS AND MITIGATION MEARSURES
4.1. General
In this chapter, we:
Identify project activities that could beneficially or adversely impact the environment
Predict and assess the environmental impacts of the such activities
Identify possible mitigation measures for these project activities and select the most
appropriate mitigation measure, based on the reduction in significance achieved and
practically in implementation
For proper assessment of significance and magnitude of environmental changes due to
construction and operational phases of the plant, the impacts are analyzed in the 10 km radius of
study area around the proposed plant site for each environmental parameter. Impact
assessment study for the existing unit is carried out by predicting net contribution of pollutants
(qualitative as well as quantitative) on overall qualitative assessment of various environmental
indicators. Prediction of impacts is an important component in environmental impact assessment
process. Several techniques and methodologies are in vogue for predicting the impacts due to
existing and proposed industrial development on physico -ecological and socio-economic
components of environment. Such predictions delineate contribution in existing baseline data for
the operational project and superimpose over the baseline (pre-project) status of environmental
quality to derive the ultimate (post-project) scenario of the environmental conditions due to the
proposed project. The quantitative prediction of impacts leads to delineation of suitable
environmental management plan needed for implementation during the construction and
operational phases of the proposed project to mitigate the adverse impacts on environmental
quality.
4.2. Construction Phase
The activities of proposed program will be confined to the project site within the boundary of
Plant complex. The proposed project will not cause any significant loss of any important flora.
4.2.1. Air Environment
The potential impact on air quality due to proposed expansion project will be temporary rise in
particulate emission level likely to result from
Fugitive dust emissions at the construction site
Use of unpaved roads and truck tracks by the construction activities
Operation of the concrete, asphalt and hot mix plants
These pollutants can affect the surrounding vegetation and nearby agricultural crops. It‘s an
expansion project within existing premises and construction activity is limited only to the project
site and hence unlikely to cause any change in the ambient air quality around the proposed
project. As the emission level is very low and intermittent, quantitative predictions are not
possible due to limitations of the dispersion model. Therefore, considering all the air pollutants, it
EIA/EMP Report for Expansion of Chemicals and APIs production unit by IOLCP
EQMS India Pvt. Ltd. 195
is not expected that air emissions due to construction will exceed air quality standards
(NAAQMS).
There might be some impact on air quality that may take place during construction, which would
be caused by emission of dust during excavation as well as from the earth material stored at the
site. The potential for dust in the form of particulate matter to be emitted during construction
strongly depends on the type of activities taking place, such as the movements of vehicles,
speed, soil stripping, excavation, back filling and reinstatement. Sprinkling water on the
deposited earth material shall minimize emissions of particulate. The rate of emission of dust, its
predicted rates of deposition and the temporary nature of the dust generating activities is
expected to be well within acceptable limits. Also, vehicles transporting earth and other
construction material to the site will be covered to ensure their dust particles do not escape into
the air. During construction all earth material will be kept covered to minimize impact on the
ambient air quality.
Traffic to the site during construction will be slightly more intensive than at present. However,
well connectivity State Highway 13 will not have any significant stress on the traffic. The present
road conditions are good for the proposed additional movement of vehicular traffic.
Hence the impacts on the ambient air quality during construction phase will be temporarily for
short duration and reversible in nature and restricted to small area.
4.2.2. Operation Phase
Prediction of ground level concentration (GLCs) due to proposed project has been made by
using air dispersion model as per CPCB Guideline.
1. The pre-project (baseline) ambient air quality status in the study area indicates that all the
criteria pollutants except PM (due to local phenomenon) are well within the prescribed
National Ambient Air Quality Standards (NAAQS) for industrial, residential, rural and other
areas.
2. The ambient air quality with respect to air pollutants will change during the operation phase of
the proposed project. However, adequate stack height will be provided for better dispersion of
flue gas as per the guidelines of CPCB. In addition to that, adequate greenbelt will be
developed for further control of air pollution.
3. To assess the impact of air emissions from various continuous point sources, air dispersion
modelling study has been conducted with the help of Industrial Source Complex Short Term
Model (ISCST3) View 6.2 model of Lakes Environmental. Detailed description has been given
in the following sub-sections:
4.2.3. Model Details
EIA/EMP Report for Expansion of Chemicals and APIs production unit by IOLCP
EQMS India Pvt. Ltd. 196
1. Air dispersion modelling can be used to predict atmospheric concentrations of pollutants at
specific locations (receptors) over specific averaging times (i.e. annual, daily, and hourly). An
atmospheric dispersion model accounts for the emissions from a source; estimates how high
into the atmosphere they will go, how widely they will spread and how far they will travel
based on temporal meteorological data; and outputs the pattern of concentrations that will
occur for various exposure periods, thereby providing the exposure risks for different
receptors.
2. In the proposed project, prediction of impacts on air environment has been carried out
employing mathematical model based on a Steady State Gaussian Plume Dispersion Model
designed for multiple point sources for short term. In the present case, Industrial Source
Complex Short-term [ISCST3] dispersion model based on steady state Gaussian Plume
Dispersion, designed for multiple point sources for short term and developed by United States
Environmental Protection Agency (USEPA) has been used for simulations from point sources.
3. The predictions for air quality during operation phase were carried out for particulate matter
less than 10 microns (PM10), particulate matter less than 2.5 microns (PM2.5) and Hydrogen
Bromide (HBr), Hydrochloric acid (HCl), Chlorine (Cl2) and many more concentrations using
ISCST3.
4. The options used for short-term computations are:
5. The plume rise is estimated by Briggs formulae, but the final rise is always limited to that of
the mixing layer
6. Stack tip down-wash is not considered
7. Buoyancy induced dispersion is used to describe the increase in plume dispersion during the
ascension phase
8. Calms processing routine is used by default
9. Wind profile exponents is used by default
10. Flat terrain is used for computation
11. Pollutants do not undergo any physico-chemical transformation
12. No pollutant removal by dry deposition
13. Universal Transverse Meter (UTM) coordinates have been used for computation
A uniform polar grid was used for the computation and extended to 10 km from the
center of the proposed project. In addition to that, receptors were also placed at the
sampling locations
4.2.4. Predicted GLC due to Proposed Project
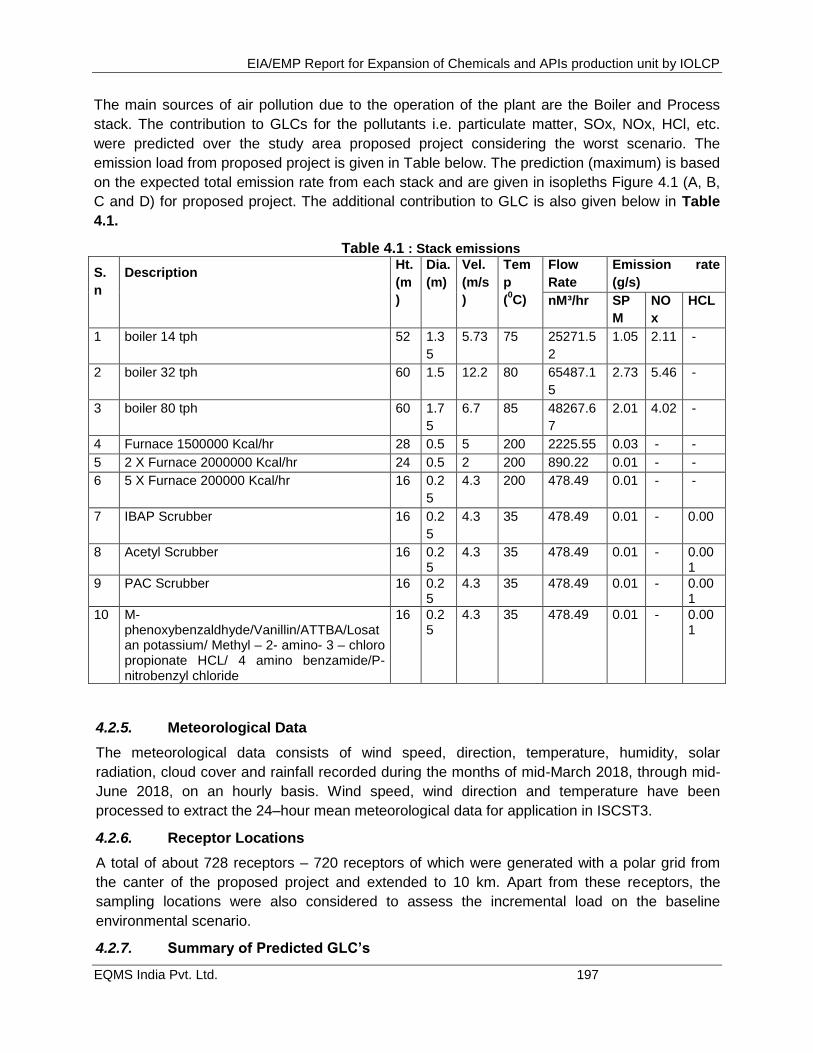
EIA/EMP Report for Expansion of Chemicals and APIs production unit by IOLCP
EQMS India Pvt. Ltd. 197
The main sources of air pollution due to the operation of the plant are the Boiler and Process
stack. The contribution to GLCs for the pollutants i.e. particulate matter, SOx, NOx, HCl, etc.
were predicted over the study area proposed project considering the worst scenario. The
emission load from proposed project is given in Table below. The prediction (maximum) is based
on the expected total emission rate from each stack and are given in isopleths Figure 4.1 (A, B,
C and D) for proposed project. The additional contribution to GLC is also given below in Table
4.1.
Table 4.1 : Stack emissions
S.
n
Description Ht.
(m
)
Dia.
(m)
Vel.
(m/s
)
Tem
p
(0C)
Flow
Rate
Emission rate
(g/s)
nM³/hr SP
M
NO
x
HCL
1 boiler 14 tph 52 1.3
5
5.73 75 25271.5
2
1.05 2.11 -
2 boiler 32 tph 60 1.5 12.2 80 65487.1
5
2.73 5.46 -
3 boiler 80 tph 60 1.7
5
6.7 85 48267.6
7
2.01 4.02 -
4 Furnace 1500000 Kcal/hr 28 0.5 5 200 2225.55 0.03 - -
5 2 X Furnace 2000000 Kcal/hr 24 0.5 2 200 890.22 0.01 - -
6 5 X Furnace 200000 Kcal/hr 16 0.2
5
4.3 200 478.49 0.01 - -
7 IBAP Scrubber 16 0.2
5
4.3 35 478.49 0.01 - 0.00
8 Acetyl Scrubber 16 0.25
4.3 35 478.49 0.01 - 0.001
9 PAC Scrubber 16 0.25
4.3 35 478.49 0.01 - 0.001
10 M-phenoxybenzaldhyde/Vanillin/ATTBA/Losatan potassium/ Methyl – 2- amino- 3 – chloro propionate HCL/ 4 amino benzamide/P-nitrobenzyl chloride
16 0.25
4.3 35 478.49 0.01 - 0.001
4.2.5. Meteorological Data
The meteorological data consists of wind speed, direction, temperature, humidity, solar
radiation, cloud cover and rainfall recorded during the months of mid-March 2018, through mid-
June 2018, on an hourly basis. Wind speed, wind direction and temperature have been
processed to extract the 24–hour mean meteorological data for application in ISCST3.
4.2.6. Receptor Locations
A total of about 728 receptors – 720 receptors of which were generated with a polar grid from
the canter of the proposed project and extended to 10 km. Apart from these receptors, the
sampling locations were also considered to assess the incremental load on the baseline
environmental scenario.
4.2.7. Summary of Predicted GLC’s
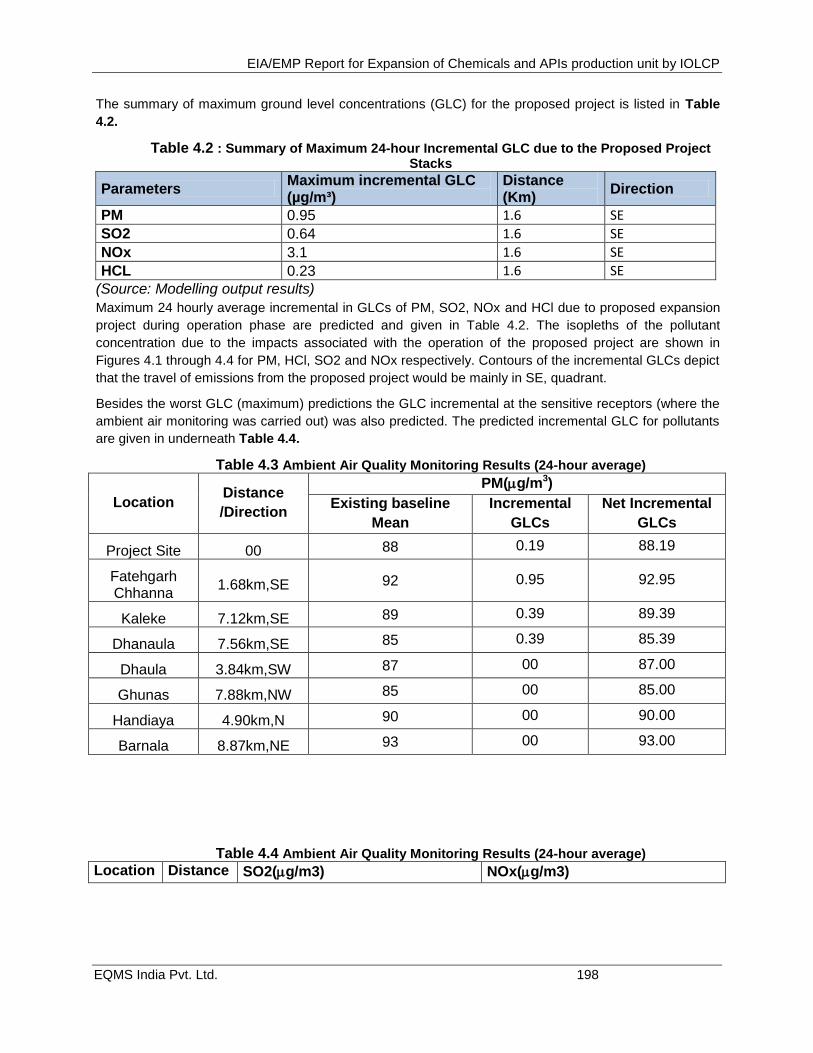
EIA/EMP Report for Expansion of Chemicals and APIs production unit by IOLCP
EQMS India Pvt. Ltd. 198
The summary of maximum ground level concentrations (GLC) for the proposed project is listed in Table
4.2.
Table 4.2 : Summary of Maximum 24-hour Incremental GLC due to the Proposed Project Stacks
Parameters Maximum incremental GLC (µg/m³)
Distance (Km)
Direction
PM 0.95 1.6 SE
SO2 0.64 1.6 SE
NOx 3.1 1.6 SE
HCL 0.23 1.6 SE (Source: Modelling output results)
Maximum 24 hourly average incremental in GLCs of PM, SO2, NOx and HCl due to proposed expansion
project during operation phase are predicted and given in Table 4.2. The isopleths of the pollutant
concentration due to the impacts associated with the operation of the proposed project are shown in
Figures 4.1 through 4.4 for PM, HCl, SO2 and NOx respectively. Contours of the incremental GLCs depict
that the travel of emissions from the proposed project would be mainly in SE, quadrant.
Besides the worst GLC (maximum) predictions the GLC incremental at the sensitive receptors (where the
ambient air monitoring was carried out) was also predicted. The predicted incremental GLC for pollutants
are given in underneath Table 4.4.
Table 4.3 Ambient Air Quality Monitoring Results (24-hour average)
Location Distance
/Direction
PM(g/m3)
Existing baseline
Mean
Incremental
GLCs
Net Incremental
GLCs
Project Site 00 88 0.19 88.19
Fatehgarh Chhanna
1.68km,SE 92 0.95 92.95
Kaleke 7.12km,SE 89 0.39 89.39
Dhanaula 7.56km,SE 85 0.39 85.39
Dhaula 3.84km,SW 87 00 87.00
Ghunas 7.88km,NW 85 00 85.00
Handiaya 4.90km,N 90 00 90.00
Barnala 8.87km,NE 93 00 93.00
Table 4.4 Ambient Air Quality Monitoring Results (24-hour average)
Location Distance SO2(g/m3) NOx(g/m3)

EIA/EMP Report for Expansion of Chemicals and APIs production unit by IOLCP
EQMS India Pvt. Ltd. 199
/Directio
n
Existin
g
baselin
e Mean
Incrementa
l GLCs
Net
Incrementa
l GLCs
Existin
g
baselin
e Mean
Incrementa
l GLCs
Net
Incrementa
l GLCs
Project
Site 00 12.7 0.13 12.83 26.4 0.63 27.03
Fatehgar
h
Chhanna
1.68km,
SE 11.8 0.61 12.41 22.7 3.1 25.8
Kaleke 7.12km,
SE 10.9 0.13 11.03 23.2 1.25 24.45
Dhanaula 7.56km,
SE 11.4 0.13 11.53 21.1 1.25 22.35
Dhaula 3.84km,
SW 12.5 00 12.5 23.8 00 23.8
Ghunas 7.88km,
NW 11.0 00 11.0 21.6 00 21.6
Handiaya 4.90km,
N 12.7 00 12.7 23.0 00 23.00
Barnala 8.87km,
NE 12.2 00 12.2 27.4 00 27.4
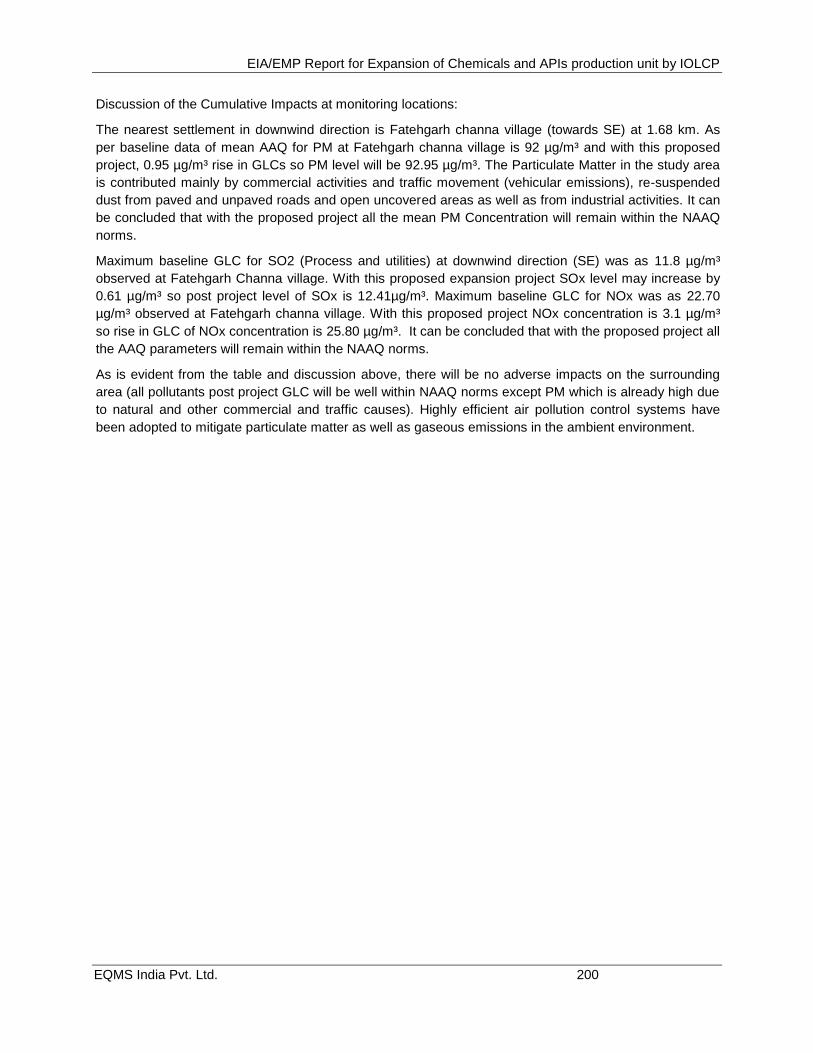
EIA/EMP Report for Expansion of Chemicals and APIs production unit by IOLCP
EQMS India Pvt. Ltd. 200
Discussion of the Cumulative Impacts at monitoring locations:
The nearest settlement in downwind direction is Fatehgarh channa village (towards SE) at 1.68 km. As
per baseline data of mean AAQ for PM at Fatehgarh channa village is 92 µg/m³ and with this proposed
project, 0.95 µg/m³ rise in GLCs so PM level will be 92.95 µg/m³. The Particulate Matter in the study area
is contributed mainly by commercial activities and traffic movement (vehicular emissions), re-suspended
dust from paved and unpaved roads and open uncovered areas as well as from industrial activities. It can
be concluded that with the proposed project all the mean PM Concentration will remain within the NAAQ
norms.
Maximum baseline GLC for SO2 (Process and utilities) at downwind direction (SE) was as 11.8 µg/m³
observed at Fatehgarh Channa village. With this proposed expansion project SOx level may increase by
0.61 µg/m³ so post project level of SOx is 12.41µg/m³. Maximum baseline GLC for NOx was as 22.70
µg/m³ observed at Fatehgarh channa village. With this proposed project NOx concentration is 3.1 µg/m³
so rise in GLC of NOx concentration is 25.80 µg/m³. It can be concluded that with the proposed project all
the AAQ parameters will remain within the NAAQ norms.
As is evident from the table and discussion above, there will be no adverse impacts on the surrounding
area (all pollutants post project GLC will be well within NAAQ norms except PM which is already high due
to natural and other commercial and traffic causes). Highly efficient air pollution control systems have
been adopted to mitigate particulate matter as well as gaseous emissions in the ambient environment.
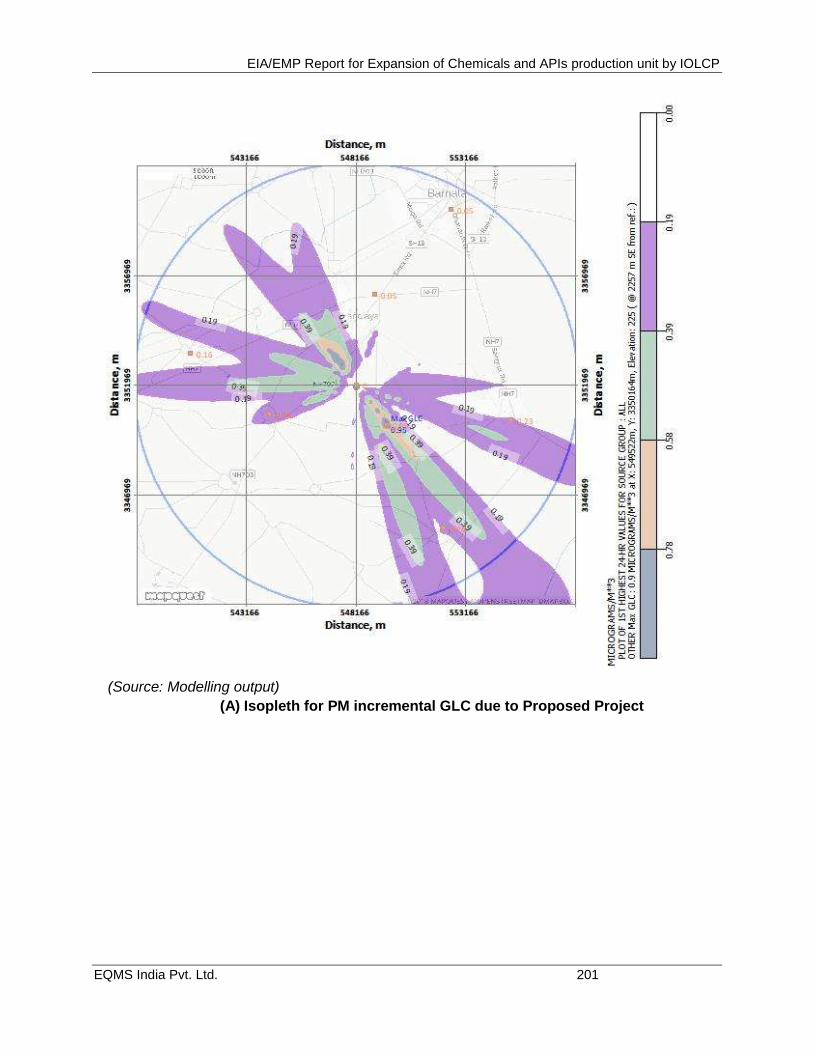
EIA/EMP Report for Expansion of Chemicals and APIs production unit by IOLCP
EQMS India Pvt. Ltd. 201
(Source: Modelling output)
(A) Isopleth for PM incremental GLC due to Proposed Project
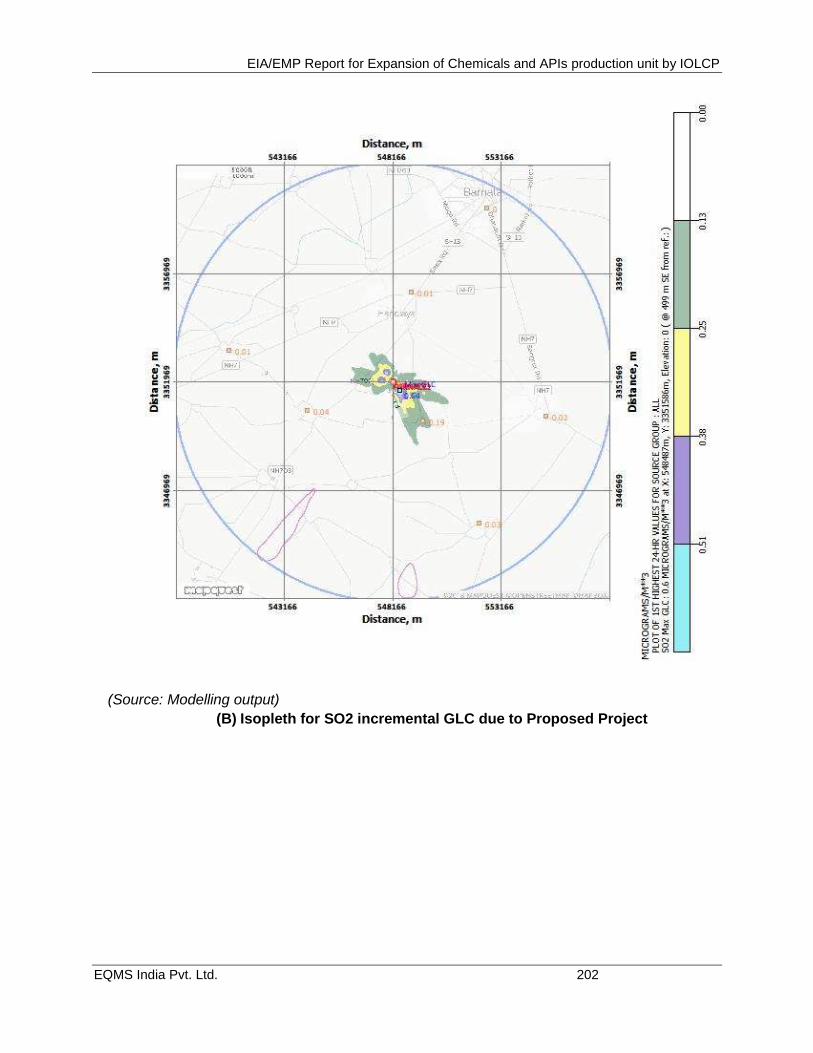
EIA/EMP Report for Expansion of Chemicals and APIs production unit by IOLCP
EQMS India Pvt. Ltd. 202
(Source: Modelling output)
(B) Isopleth for SO2 incremental GLC due to Proposed Project
EIA/EMP Report for Expansion of Chemicals and APIs production unit by IOLCP
EQMS India Pvt. Ltd. 203
(Source: Modelling output)
(C) Isopleth for HCl incremental GLC due to Proposed Project
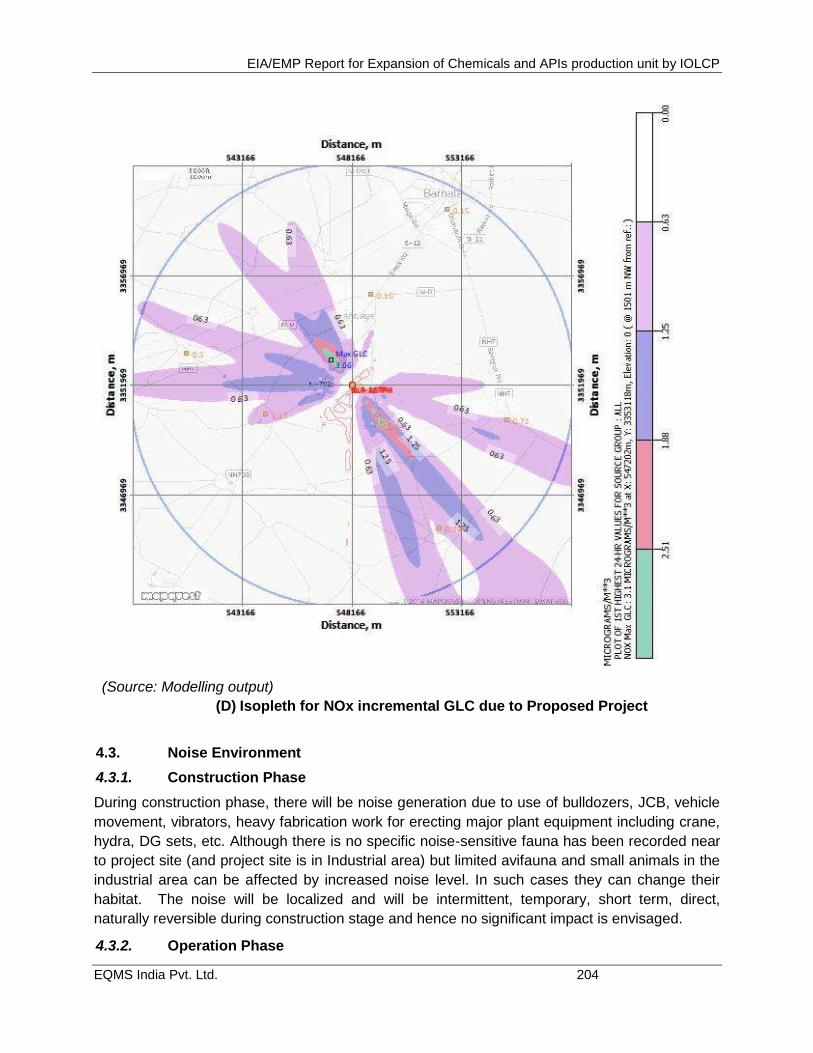
EIA/EMP Report for Expansion of Chemicals and APIs production unit by IOLCP
EQMS India Pvt. Ltd. 204
(Source: Modelling output)
(D) Isopleth for NOx incremental GLC due to Proposed Project
4.3. Noise Environment
4.3.1. Construction Phase
During construction phase, there will be noise generation due to use of bulldozers, JCB, vehicle
movement, vibrators, heavy fabrication work for erecting major plant equipment including crane,
hydra, DG sets, etc. Although there is no specific noise-sensitive fauna has been recorded near
to project site (and project site is in Industrial area) but limited avifauna and small animals in the
industrial area can be affected by increased noise level. In such cases they can change their
habitat. The noise will be localized and will be intermittent, temporary, short term, direct,
naturally reversible during construction stage and hence no significant impact is envisaged.
4.3.2. Operation Phase
EIA/EMP Report for Expansion of Chemicals and APIs production unit by IOLCP
EQMS India Pvt. Ltd. 205
The main source of noise generation during operation stages are mainly from pumps, blowers, compressors, DG sets, vehicle movement for transportation of raw materials, finished goods etc.
Noise level contributed from light medium and heavy vehicles on the roads can be considerable depending upon the traffic density. The heavy commercial vehicles traffic is limited depending upon the material receipt and dispatch of synthetic organics through road transport. But this noise will be intermittent and temporary. It is expected that noise level at the plant boundary and other 8 locations will be within the prescribed norms of CPCB due to operation of the proposed project and no significant impact on noise environment is expected. Also, the noise will not be audible beyond its boundary limit, particularly due to natural green belt and other attenuators.
4.4. Water Environment
4.4.1. Construction Phase
During construction, water will be needed mainly for construction and domestic purpose i.e. for drinking and sanitation. Drinking and sanitation facilities shall be provided to workers during construction. Water will also be needed for sprinkling to reduce dust emission, if any.
The water required in the above activities will be only a fraction of total water required. Moreover, this requirement will be irregular and limited to construction phase only and hence no impact is envisaged during construction phase. The domestic wastewater generated will be send to existing ETP and hence no impact is envisaged.
4.4.2. Operation Phase
Water requirement will be made available through Borewell/surface water. Wastewater will be segregated into two streams as High TDS / High COD (HTDS) and Low TDS / Low COD (LTDS). The HTDS Effluent stream after neutralization, filtration will be sent to Multi Effect Evaporator (MEE). The distillate water will be treated in ETP along with LTDS effluent. The concentrate will be sent to ATFD for drying. The dried salt will be sent to approved TSDF for final disposal. The ETP treated effluent will be send for plantation. The RO reject (from blow down of boiler and cooling tower) will be send to MEE. No process effluent will be discharged outside the plant premises. The provision of stripper for recovery of solvent (VOC) from HTDS effluent before MEE. The inorganic hazardous residues will be sent to TSDF.
There will not be any discharge of wastewater on the land. Besides, there will be separate storm water and industrial wastewater drains to eliminate chances of mixing of rainwater withwastewater. Hazardous wastes will be stored, managed and handles as per hazardous wastes rules. All bulk chemicals and fuel storage areas will be provided with dyke wall / bunds to eliminate chances of any spillages/ leakages entering into the storm water drain.
No significant adverse impact on the surface and ground water or soil quality is envisaged in viewof the proposed mitigative measures.
4.5. Land Environment
EIA/EMP Report for Expansion of Chemicals and APIs production unit by IOLCP
EQMS India Pvt. Ltd. 206
Site Preparation leading to Change in Land Use
During Construction phase
Change in Land use\Landcover. Present land use of the project site is industrial land.
Change in land use\Landcover outside the plant area.
Removal of Vegetation
Alteration of Topography
Construction material remain after completion of work
Surrounding area of the project site is agricultural land so generation of Dust can lead to the
degradation of agricultural land.
During Operation Phase
Generation of domestic, Solid (non-hazardous) and Hazardous Waste
Discharge of sewage or other effluents on nearby land.
Handling, storage, use or spillage of hazardous materials
Mitigation measures during construction and operation
The proposed expansion will be done within existing premises and lands are already under possession of IOLCP. So, there will not be any change in land-use due to proposed project. For this expansion project workers shall be hired locally hence there will be no labour colonies are proposed so there will be no landuse/ lancover change outside the plant area. During construction, top soil generated from various activities like excavation etc will be stored and preserved to use it during restoration period as far as possible. There will be neither removal of any vegetation & nor disposal of wastewater on land. The construction and demoliation waste will be disposed as per Construction and Management rules 2016. To avoid the dust emission, unit shall ensure that water sprinkling is regularly carried out during construction activities. Hazardous wastes will be stored at earmarked area with impervious flooring, shed and spillage/ leakage collection system to eliminate rainwater contamination, chances of overflow / spillages going on to the land and thus land/ soil contamination. Hazardous wastes will be disposed as per the Hazardous Waste Rules. Disposal mechanism of Hazardous wastes has been mentioned in the Section 2.10.
The storage and handling of raw materials shall be done properly to prevent any spillage. The hazardous waste generated during the operation phase, will properly disposed so that there is no spill and contamination of land. The hazardous waste will be disposed as per Hazardous waste rules 2016.
4.6. Biological Environment
Though the concentrations of the emitted pollutants will be kept within permissible levels through
the various engineering controls, it is essential to have eco-management in the Likely Impact
Zone for safeguard and enhanced of ecological environment of the project area. The likely
impacts and mitigation measures associated with different phases due to various project
activities area describes in following Table.
EIA/EMP Report for Expansion of Chemicals and APIs production unit by IOLCP
EQMS India Pvt. Ltd. 207
Project Aspect
Description
Likely Impacts
on Ecology and
Biodiversity (EB)
Impact
Consequence -
Probability
Description /
Justification
Mitigation
measures
Type
Pre-Construction Stage Impacts
Removal of site
vegetation like
herbs, shrubs and
grasses
site specific loss of common floral diversity
the site is already levelled
No vegetation is present
No threat of loss of faunal diversity as no faunal species reported at site.
IOLCP has
already developed
a dense greenbelt
/ all around the
project premises.
Short term
Construction Stage Impacts
Dust and Noise
Generation due to
movement
of JCBs, other
machinery, and
other construction
activities
Dust settlement on
vegetation
Disturbance to
faunal species is
surroundings
No endangered
fauna reported form
the site as well as
in study area.
The species
reported from
project site and
buffer zone are
common /
generalist species
and not very
sensitive to the
routine activities, so
there will be no
threat of facing
disturbance.
Subject to periodic
monitoring and
surveillance.
Water sprinkling
for Dust
suppression.
Construction
activities shall be
restricted in night
time.
Short term
Operation Stage Impact
Emission of PM,
SO2, NOx due to
operation (Indirect
impact on crops,
trees and shrubs
of vicinity
due to
contamination of
ambient air, dust
emission,
Impact on
surrounding
vegetation and
associated
biodiversity.
Though the
emission levels of
all pollutants will be
kept within
permissible limits.
APCD shall be
used to control dust
emissions from
various sections of
plant.
Operation subject
to management by
operational
controls. Emission
levels of all
pollutants will be
kept
within permissible
levels through
various
Long term
(insignificant)

EIA/EMP Report for Expansion of Chemicals and APIs production unit by IOLCP
EQMS India Pvt. Ltd. 208
vehicular exhaust) Modeling studies
proves that the
incremental air
pollution will not
violate the air
quality standards.
Proposed plant is
zero liquid
discharge basis so
no waste water will
be discharged.
greenbelt already
exits. Such
measures will be
adequate to protect
the noise and air
pollution impacts.
engineering
control measures.
However, green
belt development
with suitable
species will help to
mitigate likely
cumulative
impacts.
Noise Generation
(Disturbance to
sensitive terrestrial
fauna due to
noise pollution)
Construction Stage Impacts
Excavation and filling up operation may results in fugitive dust emission. The dust deposition on
pubescent leaves of the surrounding vegetation may leads to temporary reduction of
photosynthesis. Such impacts would however be confined mostly to the initial period of the
construction phase and would minimized through paving of roads, surface treatment, regular
water sprinkling in dust generating areas and greenbelt development. The impact on the ecology
of the surrounding area during the construction stage will be insignificant in nature. Greenbelt
development along the plant boundary, further development of gardens and lawns near admin
building will mitigate the residual impact on natural resources.
Operation stage Impacts
No national park, wildlife sanctuary, biosphere reserve exists within 10 km area of the project.
No endangered or rare or threatened plant or animal species was observed within 10 km area of
the project site.
The impact on the surrounding ecology during the operation of the project will mainly occur from
the deposition of air pollutants. Air pollution affects the biotic and abiotic components of the
ecosystem individually and synergistically with other pollutants. Chronic and acute effects on
plants and animals may be induced when the concentration of air pollutants exceeds threshold
limits. Particulate emission and other gaseous emissions from the proposed plant are the major
pollutant that may affect the ecology of the area. However, the AAQ modeling proves that in
worst condition the concentration of the PM and other gaseous emission will not exceeds the
AAQ standards. Further the mitigation measures have been suggested for the same. By
adopting the mitigation measures suggested the impact due to operation of the proposed
expansion will be negligible.
4.7. Socio – Economic Environment

EIA/EMP Report for Expansion of Chemicals and APIs production unit by IOLCP
EQMS India Pvt. Ltd. 209
Proposed expansion project will generate employment opportunities some through direct employment and
more so indirectly through services for the plant.
Positive Impacts due to Proposed Expansion Project
Construction Phase
Expansion will be done within the existing site occupied by industry. There is no
permanent or temporary change in land use.
The site has existing tree plantation on periphery of the plant and along the roads.
The local infrastructure and facilities in the area will be further developed and people
will be benefited directly or indirectly.
The unit is awarded with the ―National Energy Conservation Award‖ Consecutively for
the years 2005, 2006, 2007, 2008, 2009,2010,2011,2012,2013,2014,2016 by Ministry
of Power, Government of India.
The unit is awarded with National Level ―Green Chemistry Award‖ for Innovation to use
dual technology for the production of Mono Chloro Acetic Acid and Acetyl Chloride in a
single Plant by the Govt. of India.
Short term positive impacts will result in better quality of life. No labour camp will be
established at site as labours will be hired from local area.
Proposed project will generate the employment on various levels time to time and
gives the priority to local persons.
The living conditions of the people will not be affected. There will be employment
generation for nearby area people get positive impact.
The total employee after expansion will be 1850 persons and Local people will be given preference wherever found suitable for all the jobs in the plant, direct as well as indirect.
The greenbelt area development will help in enhancing the aesthetics of the proposed
Greenfield project.
The construction activities and development will make the area an attractive place for
people to move in or return to the area.
Economic status of the local people will improve due to the increased business
opportunities, thereby, making a positive impact.
Thus, the proposed project will have significant positive impact on the employment
pattern of the study area.
Expansion will be done within the existing site occupied by industry, and no R & R
issue observed for the proposed project.
Operational Phase
Educational, medical and housing facilities in the study area will considerably improve.
Adequate systems shall be provided to capture the emissions from process plants &
maintain the emission quality as per recommended guidelines with scrubber having
caustic solution, before venting it into the atmosphere.
The site is well connected by road and rail network and has advantage of good
infrastructure facilities like National & State Highway roads (SH-13, (1.01km, W) & NH-
64, 3.47km, N), water, power etc;
EIA/EMP Report for Expansion of Chemicals and APIs production unit by IOLCP
EQMS India Pvt. Ltd. 210
Infrastructure development i.e. road & commercial building construction in the area
due to proposed expansion activities.
The project will be beneficial to local people as the company progress and expands its
activity gradually.
More revenue will be generated to the Government.
Negative Impacts due to Proposed Expansion Project
During construction and operational phase noise will be generated due to traffic influx
in the company premises due to material and personal transport. But it will be minimal
and for a short term only.
Dust and other emissions are expected during construction phase and local people
may be affected.
Improper management of waste material from the proposed activities may affect the
local peoples.
Due to Noise generation during the operation phase of the proposed project, local
people may be adversely affected.
Mitigation Measures for Negative Impacts due to Proposed Expansion Project
Increase in population density in core zone study area due to workforce involvement
during construction phase is only for short term impact.
Adequate Pollution controlling equipments with higher efficiancy shall be attached with
proposed stacks.
The project proponent/contractors shall ensure that most of the workforce shall be
engaged from the nearby villages/town.
The transportation of raw materials will be done by trucks as per MSIHC rule.
Suitable dust suppression techniques will be adopted, such as water sprinkling will be
taken.
The inorganic hazardous residues will be sent to TSDF.
The impact is likely to be for short duration and confined locally to the construction site
itself.
The overall project will have a long term benefit and hence no mitigation measure is
required.
4.8. Infrastructure
The raw material (solid, liquid and also gaseous etc.) will be transported from suppliers
approximately 3 to 5 trucks/ day will come to the plant. The final product (APIs/intermediate) will
be dispatched from plant to various parts of the country through the State and National high way
and railways, for which nearly 14 to 15 small vehicles will be used for the same. Based on the
estimation, approximately 2-3 vehicles per day will remain at the project site. Hence, due to the
project activities the increase in the vehicular traffic density in the study area will be negligible.
However, adequate parking facility provided the project site along with rest room and canteen
facilities within the premises of the factory for drivers will be provided. The project site is only
about 0.81 km away from State Highway (SH – 13), Hence, this marginal increase in the traffic,
will not affect the road infrastructure of the study area.

EIA/EMP Report for Expansion of Chemicals and APIs production unit by IOLCP
EQMS India Pvt. Ltd. 211
EIA/EMP Report for Expansion of Chemicals and APIs production unit by IOLCP
EQMS India Pvt. Ltd. 212
CHAPTER 5. Environment Management Plan
5.1. Introduction
Prediction of the potential adverse environmental and social impacts arising from
development interventions is at the technical heart of EIA process. An equally
essential element of this process is to develop measures to eliminate, offset, or
reduce impacts to acceptable levels during implementation and operation of projects.
The integration of such measures into project implementation and operation is supported by clearly defining the environmental requirements within an Environmental
Management Plan (EMP).
Normally, potential impacts are identified early during the initiation of project, and measures to avoid or minimize impacts are incorporated into the alternatives being
considered. In this respect, some of the most important measures to protect the
environment and local communities become integral to the project design, and may
not be reflected in a formal EMP.
For the proposed expansion of IOCLP, by way of EIA study propose to identify all the likely potential impacts, collect data information and incorporate all the measures necessary to avoid or minimize impacts on surrounding environment due to proposed
expansion unit. Many of the mitigation measures are already taken up in the
engineering design itself.
5.2. Objectives of EMP
Overall objective of EMP:
Prevention: Measures aimed at impeding the occurrence of negative environmental
impacts and/or preventing such an occurrence having harmful environmental impacts.
Preservation: Preventing any future actions that might adversely affect an
environmental resource or attribute.
Minimization: Limiting or reducing the degree, extent, magnitude, or duration of
adverse impacts.
5.3. Components of EMP
EMP for IOLCP to set up manufacturing unit of APIs intermediates considers the
following aspects:
Description of mitigation measures
Description of monitoring program
Institutional arrangements
Implementation schedule and reporting procedures
Institutional framework includes the responsibilities for environmental management as
well as responsibilities for implementing environmental measures.
5.4. Air Environment
Construction Phase:
Excavators shall be used for construction. The excavated material shall be stacked at
safe places for backfill at a later stage of construction.
To control the fugitive emission during construction phase adequate water sprinkling system will be developed
EIA/EMP Report for Expansion of Chemicals and APIs production unit by IOLCP
EQMS India Pvt. Ltd. 213
Operation Phase (Fugitive Dust):
Handling & transportation of the raw material as per norms.
Sprinkling of water to control fugitive dust emission.
Speed of vehicles inside the factory premises will be controlled.
Greenbelt will be maintained to attenuate the air pollution.
Closed loop system will be adopted to reduce the workers exposure to hazardous
chemicals during manufacturing process.
Proper personal protective equipment will be provided to the workers.
All trucks will be transported after covering from the top.
Raw material unloading will be done by mechanized truck unloading system.
Dust collectors will be in line with unloading hoppers.
Material handling in the plant will be done in closed conveyors.
All the trucks being used for transportation of raw material and final product shall be
checked for "Pollution under Control" certificate prior to their entry to the plant
premises.
5.4.1. Air Pollution Control Measures
Measures for Reducing Stack Emissions
In the proposed project, DG set will be used only during the power failure and will
relate to a separate stack. ESP with stack height of 60 mtr shall be installed for
dispersion of particulate matter from Boiler. All process vents will be routed through
dedicated two stage scrubbing system.
The recovery and recycling of solvents in the process is a key issue in achieving
productivity and an edge in competitive world. Hence, all the solvent mixtures
generated from different stages of the products will be fractionated in a state-of-the-
art solvent recovery system to give 95-98% recovery depending upon composition of
solvent mixtures and their boiling point. Chilled brine will be used in condensers to
recover the solvents.
Similarly, all the reaction vessels (six streams) will be connected with the individual
scrubbing system so that any toxic fumes and vapors generated during reaction get
neutralized. The scrubber stack will meet existing norms emission. IOLCP also
ensure that for the expansion unit there is no leakage occurs from various stage of
process equipments (equipment flanges, pumps, drains, sample points etc.) to pollute
the working area.
Measures for Fugitive Emissions
The fugitive emissions of organic chemicals and VOCs may come from leakage
through valves, fittings, pumps, etc. Though this is not expected to be significant, it
may be reduced further by adopting the following measures:
LDAR system should be strictly followed.
All process drains/ equipment washing should be collected in closed pit (to avoid fouling of work area through odour etc.) and taken to ETP.
Regular maintenance of valves, pumps and other equipment to prevent leakage and
thus minimizing the fugitive emissions of VOCs.
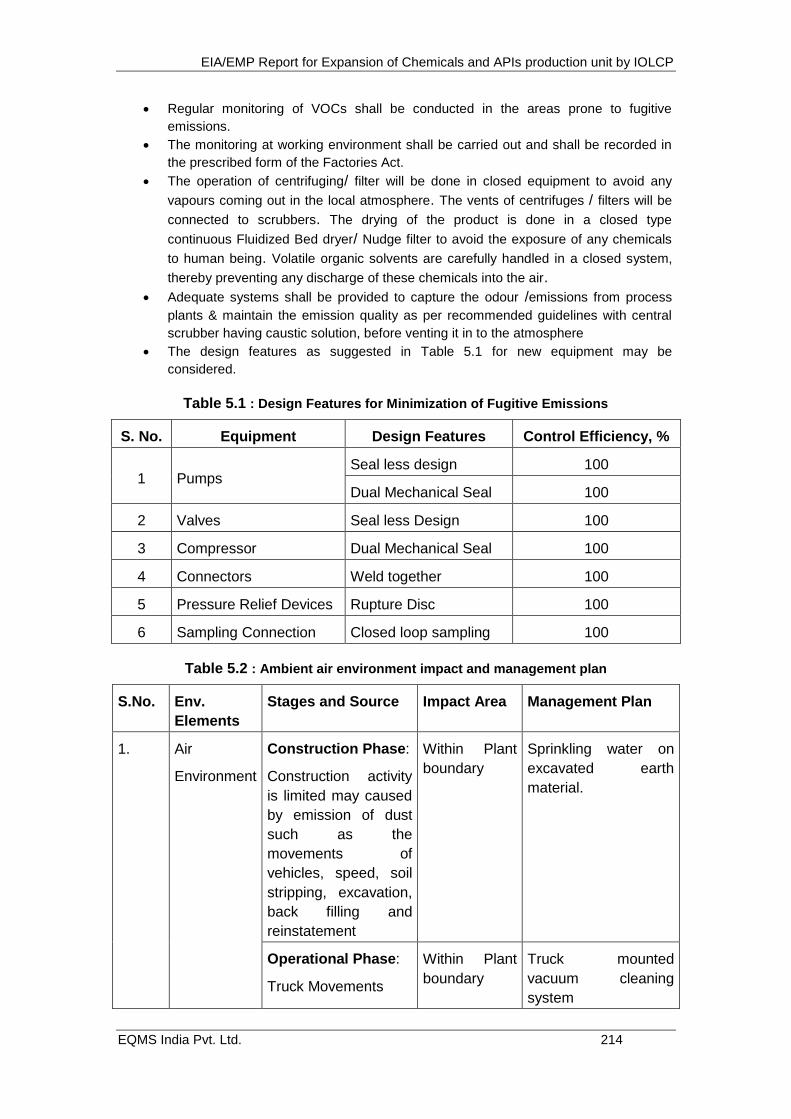
EIA/EMP Report for Expansion of Chemicals and APIs production unit by IOLCP
EQMS India Pvt. Ltd. 214
Regular monitoring of VOCs shall be conducted in the areas prone to fugitive
emissions.
The monitoring at working environment shall be carried out and shall be recorded in
the prescribed form of the Factories Act.
The operation of centrifuging/ filter will be done in closed equipment to avoid any
vapours coming out in the local atmosphere. The vents of centrifuges / filters will be
connected to scrubbers. The drying of the product is done in a closed type
continuous Fluidized Bed dryer/ Nudge filter to avoid the exposure of any chemicals
to human being. Volatile organic solvents are carefully handled in a closed system,
thereby preventing any discharge of these chemicals into the air.
Adequate systems shall be provided to capture the odour /emissions from process
plants & maintain the emission quality as per recommended guidelines with central
scrubber having caustic solution, before venting it in to the atmosphere
The design features as suggested in Table 5.1 for new equipment may be
considered.
Table 5.1 : Design Features for Minimization of Fugitive Emissions
S. No. Equipment Design Features Control Efficiency, %
1 Pumps Seal less design 100
Dual Mechanical Seal 100
2 Valves Seal less Design 100
3 Compressor Dual Mechanical Seal 100
4 Connectors Weld together 100
5 Pressure Relief Devices Rupture Disc 100
6 Sampling Connection Closed loop sampling 100
Table 5.2 : Ambient air environment impact and management plan
S.No. Env.
Elements
Stages and Source Impact Area Management Plan
1. Air
Environment
Construction Phase:
Construction activity
is limited may caused
by emission of dust
such as the
movements of
vehicles, speed, soil
stripping, excavation,
back filling and
reinstatement
Within Plant
boundary
Sprinkling water on
excavated earth
material.
Operational Phase:
Truck Movements
Within Plant
boundary
Truck mounted
vacuum cleaning
system
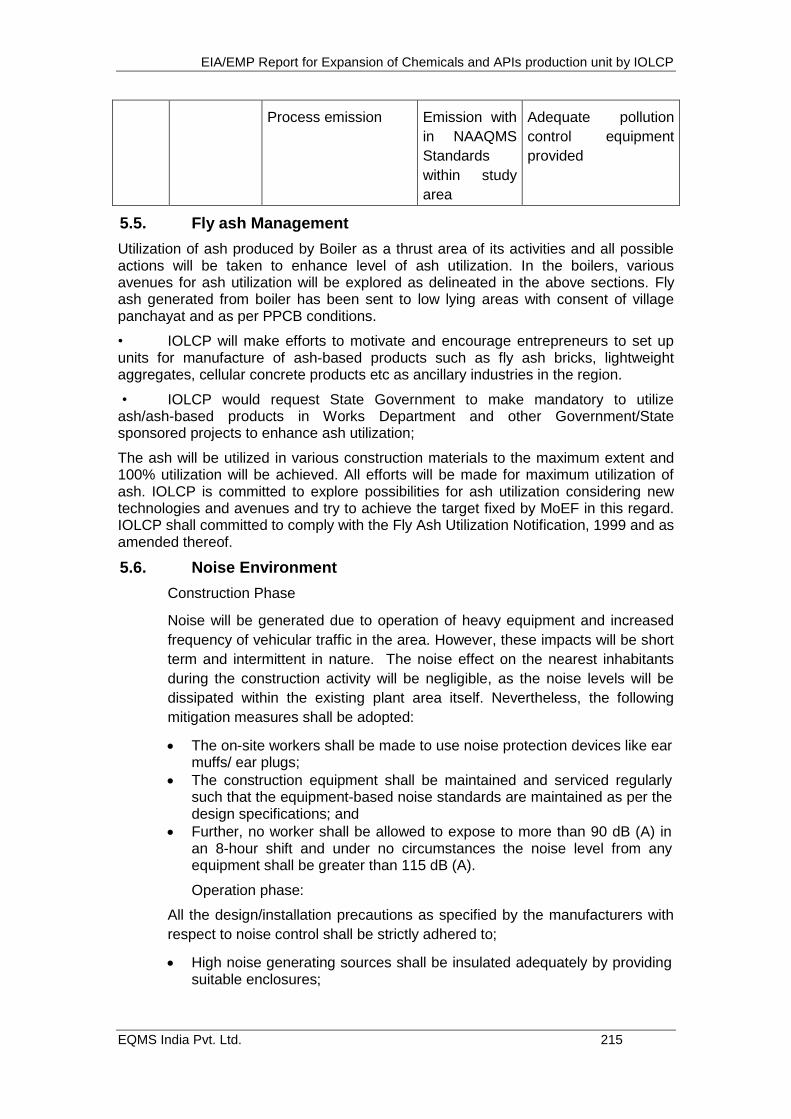
EIA/EMP Report for Expansion of Chemicals and APIs production unit by IOLCP
EQMS India Pvt. Ltd. 215
Process emission Emission with
in NAAQMS
Standards
within study
area
Adequate pollution
control equipment
provided
5.5. Fly ash Management
Utilization of ash produced by Boiler as a thrust area of its activities and all possible actions will be taken to enhance level of ash utilization. In the boilers, various avenues for ash utilization will be explored as delineated in the above sections. Fly ash generated from boiler has been sent to low lying areas with consent of village panchayat and as per PPCB conditions.
• IOLCP will make efforts to motivate and encourage entrepreneurs to set up units for manufacture of ash-based products such as fly ash bricks, lightweight aggregates, cellular concrete products etc as ancillary industries in the region.
• IOLCP would request State Government to make mandatory to utilize ash/ash-based products in Works Department and other Government/State sponsored projects to enhance ash utilization;
The ash will be utilized in various construction materials to the maximum extent and 100% utilization will be achieved. All efforts will be made for maximum utilization of ash. IOLCP is committed to explore possibilities for ash utilization considering new technologies and avenues and try to achieve the target fixed by MoEF in this regard. IOLCP shall committed to comply with the Fly Ash Utilization Notification, 1999 and as amended thereof.
5.6. Noise Environment
Construction Phase
Noise will be generated due to operation of heavy equipment and increased
frequency of vehicular traffic in the area. However, these impacts will be short
term and intermittent in nature. The noise effect on the nearest inhabitants
during the construction activity will be negligible, as the noise levels will be
dissipated within the existing plant area itself. Nevertheless, the following
mitigation measures shall be adopted:
The on-site workers shall be made to use noise protection devices like ear muffs/ ear plugs;
The construction equipment shall be maintained and serviced regularly such that the equipment-based noise standards are maintained as per the design specifications; and
Further, no worker shall be allowed to expose to more than 90 dB (A) in an 8-hour shift and under no circumstances the noise level from any equipment shall be greater than 115 dB (A).
Operation phase:
All the design/installation precautions as specified by the manufacturers with
respect to noise control shall be strictly adhered to;
High noise generating sources shall be insulated adequately by providing suitable enclosures;
EIA/EMP Report for Expansion of Chemicals and APIs production unit by IOLCP
EQMS India Pvt. Ltd. 216
Design and layout of building to minimize transmission of noise, segregation of particular items of plant and to avoid reverberant areas;
Acoustic design of building;
The noise control system will be designed to form an integral part of the plant;
Other than the regular maintenance of the various equipment, ear plugs/muffs are recommended for the personnel working close to the noise generating units;
All the openings like covers, partitions shall be designed properly; and
Inlet and outlet mufflers shall be provided which are easy to design and construct.
The green belt in and around the plant periphery will attenuate the noise level.
Table 5.3 : Ambient noise environment impact and management plan
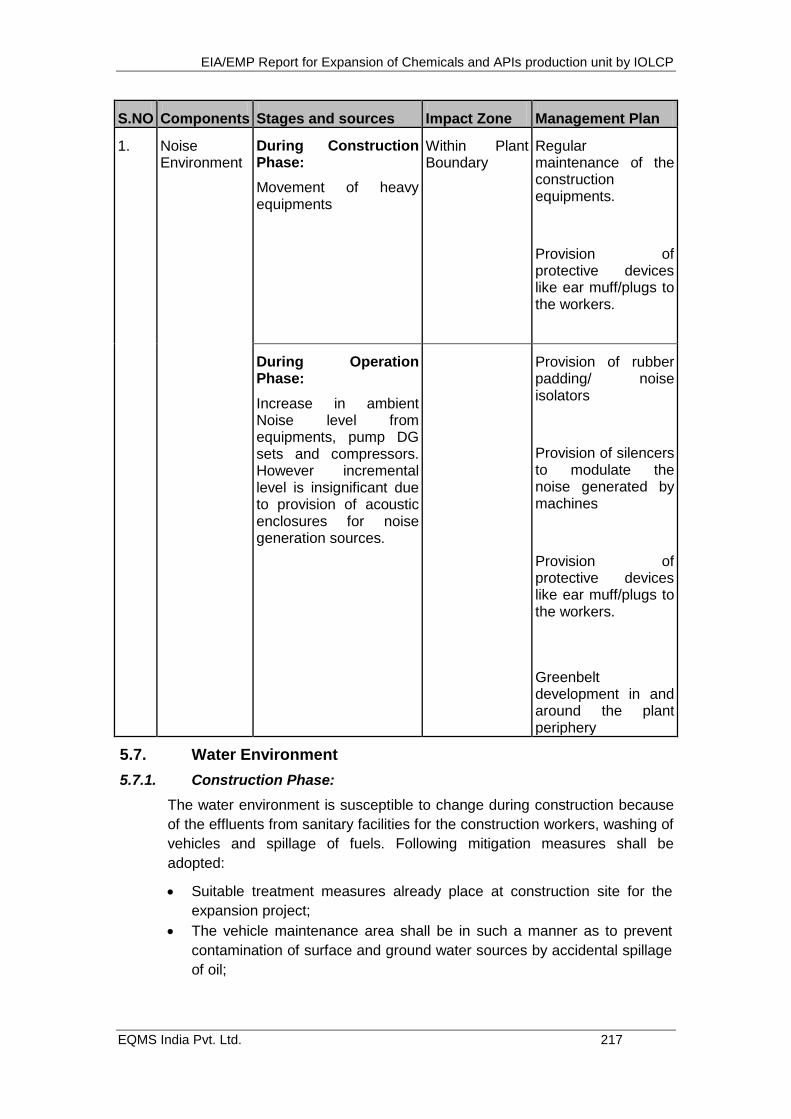
EIA/EMP Report for Expansion of Chemicals and APIs production unit by IOLCP
EQMS India Pvt. Ltd. 217
S.NO Components Stages and sources Impact Zone Management Plan
1. Noise Environment
During Construction Phase:
Movement of heavy equipments
Within Plant Boundary
Regular maintenance of the construction equipments.
Provision of protective devices like ear muff/plugs to the workers.
During Operation Phase:
Increase in ambient Noise level from equipments, pump DG sets and compressors. However incremental level is insignificant due to provision of acoustic enclosures for noise generation sources.
Provision of rubber padding/ noise isolators
Provision of silencers to modulate the noise generated by machines
Provision of protective devices like ear muff/plugs to the workers.
Greenbelt development in and around the plant periphery
5.7. Water Environment
5.7.1. Construction Phase:
The water environment is susceptible to change during construction because
of the effluents from sanitary facilities for the construction workers, washing of
vehicles and spillage of fuels. Following mitigation measures shall be
adopted:
Suitable treatment measures already place at construction site for the
expansion project;
The vehicle maintenance area shall be in such a manner as to prevent
contamination of surface and ground water sources by accidental spillage
of oil;
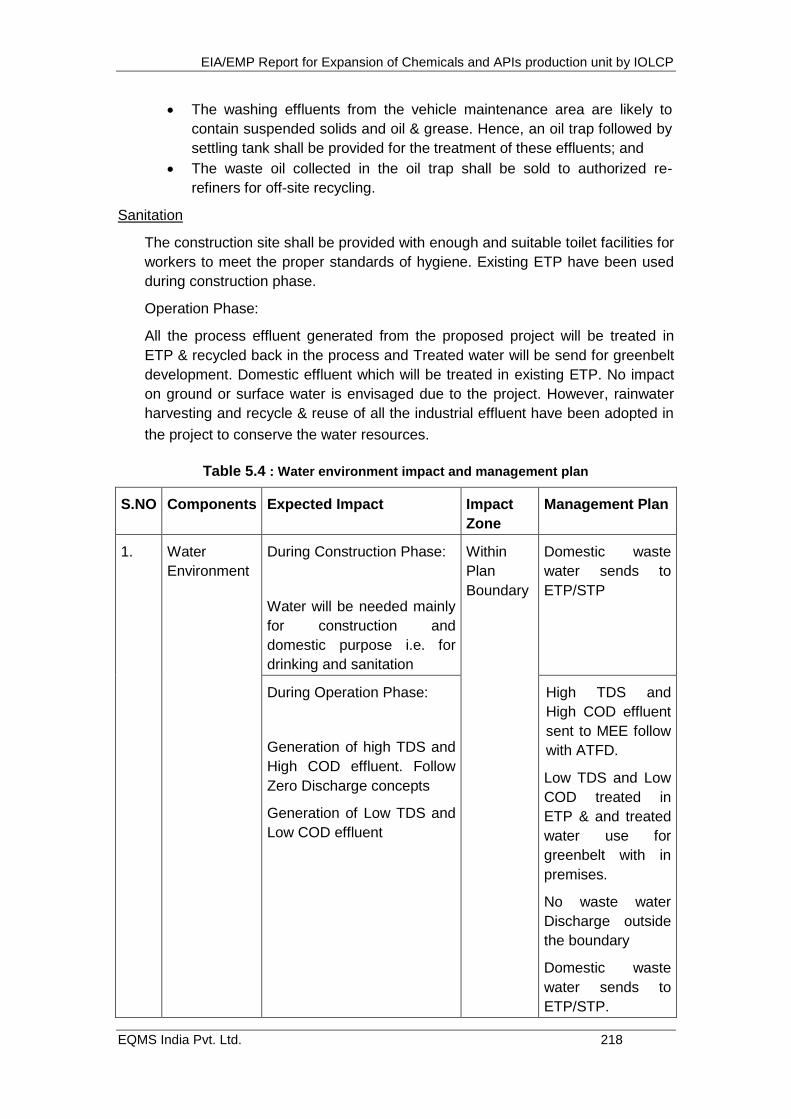
EIA/EMP Report for Expansion of Chemicals and APIs production unit by IOLCP
EQMS India Pvt. Ltd. 218
The washing effluents from the vehicle maintenance area are likely to
contain suspended solids and oil & grease. Hence, an oil trap followed by
settling tank shall be provided for the treatment of these effluents; and
The waste oil collected in the oil trap shall be sold to authorized re-
refiners for off-site recycling.
Sanitation
The construction site shall be provided with enough and suitable toilet facilities for
workers to meet the proper standards of hygiene. Existing ETP have been used
during construction phase.
Operation Phase:
All the process effluent generated from the proposed project will be treated in
ETP & recycled back in the process and Treated water will be send for greenbelt
development. Domestic effluent which will be treated in existing ETP. No impact
on ground or surface water is envisaged due to the project. However, rainwater
harvesting and recycle & reuse of all the industrial effluent have been adopted in
the project to conserve the water resources.
Table 5.4 : Water environment impact and management plan
S.NO Components Expected Impact Impact
Zone
Management Plan
1. Water
Environment
During Construction Phase:
Water will be needed mainly
for construction and
domestic purpose i.e. for
drinking and sanitation
Within
Plan
Boundary
Domestic waste
water sends to
ETP/STP
During Operation Phase:
Generation of high TDS and
High COD effluent. Follow
Zero Discharge concepts
Generation of Low TDS and
Low COD effluent
High TDS and
High COD effluent
sent to MEE follow
with ATFD.
Low TDS and Low
COD treated in
ETP & and treated
water use for
greenbelt with in
premises.
No waste water
Discharge outside
the boundary
Domestic waste
water sends to
ETP/STP.
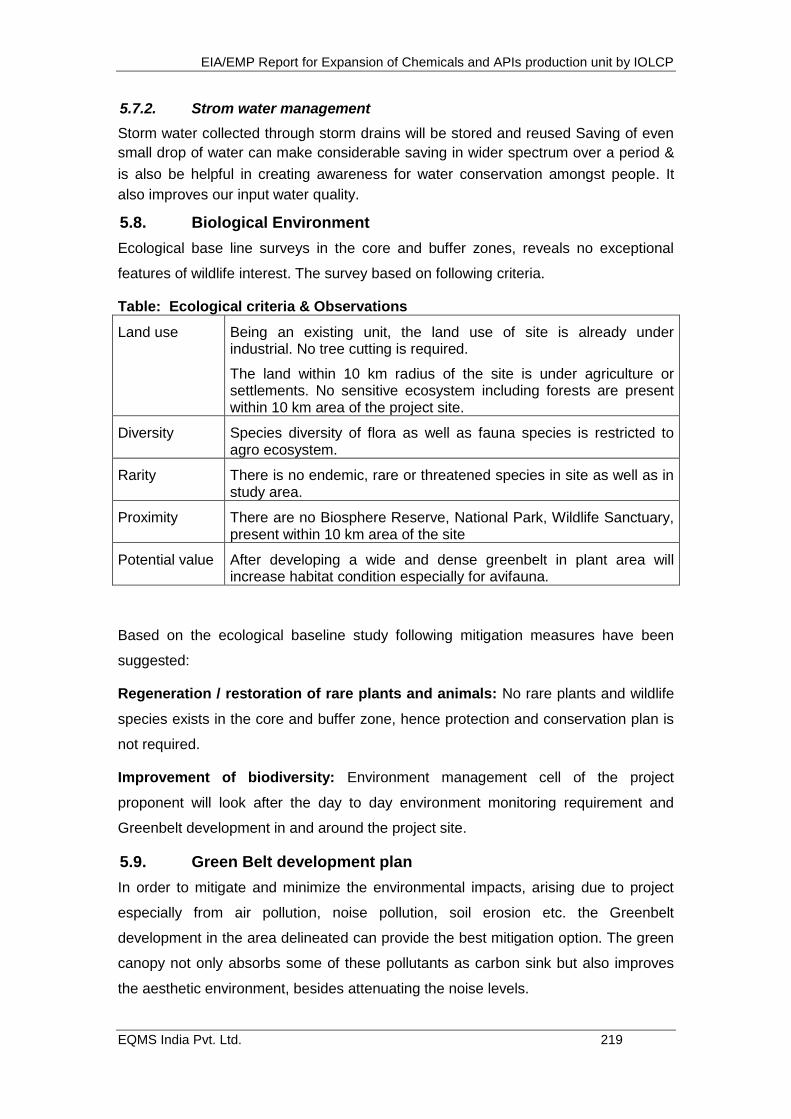
EIA/EMP Report for Expansion of Chemicals and APIs production unit by IOLCP
EQMS India Pvt. Ltd. 219
5.7.2. Strom water management
Storm water collected through storm drains will be stored and reused Saving of even
small drop of water can make considerable saving in wider spectrum over a period &
is also be helpful in creating awareness for water conservation amongst people. It
also improves our input water quality.
5.8. Biological Environment
Ecological base line surveys in the core and buffer zones, reveals no exceptional
features of wildlife interest. The survey based on following criteria.
Table: Ecological criteria & Observations
Land use Being an existing unit, the land use of site is already under industrial. No tree cutting is required.
The land within 10 km radius of the site is under agriculture or settlements. No sensitive ecosystem including forests are present within 10 km area of the project site.
Diversity Species diversity of flora as well as fauna species is restricted to agro ecosystem.
Rarity There is no endemic, rare or threatened species in site as well as in study area.
Proximity There are no Biosphere Reserve, National Park, Wildlife Sanctuary, present within 10 km area of the site
Potential value After developing a wide and dense greenbelt in plant area will increase habitat condition especially for avifauna.
Based on the ecological baseline study following mitigation measures have been
suggested:
Regeneration / restoration of rare plants and animals: No rare plants and wildlife
species exists in the core and buffer zone, hence protection and conservation plan is
not required.
Improvement of biodiversity: Environment management cell of the project
proponent will look after the day to day environment monitoring requirement and
Greenbelt development in and around the project site.
5.9. Green Belt development plan
In order to mitigate and minimize the environmental impacts, arising due to project
especially from air pollution, noise pollution, soil erosion etc. the Greenbelt
development in the area delineated can provide the best mitigation option. The green
canopy not only absorbs some of these pollutants as carbon sink but also improves
the aesthetic environment, besides attenuating the noise levels.
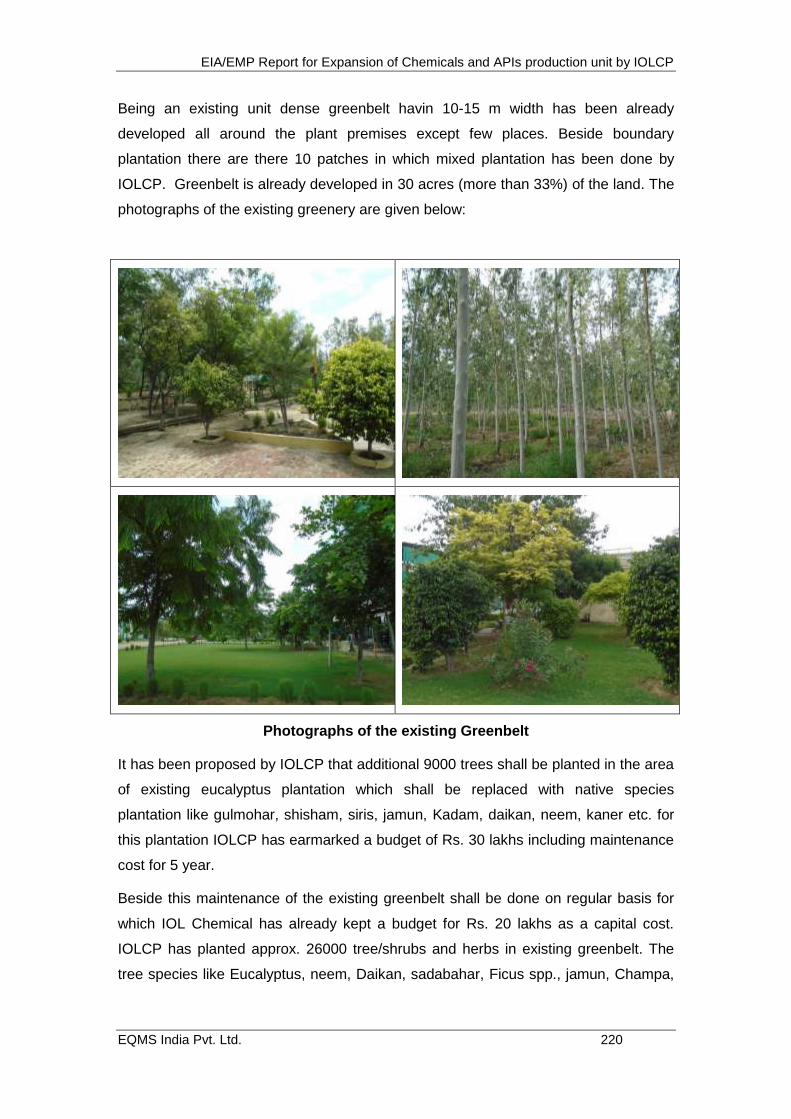
EIA/EMP Report for Expansion of Chemicals and APIs production unit by IOLCP
EQMS India Pvt. Ltd. 220
Being an existing unit dense greenbelt havin 10-15 m width has been already
developed all around the plant premises except few places. Beside boundary
plantation there are there 10 patches in which mixed plantation has been done by
IOLCP. Greenbelt is already developed in 30 acres (more than 33%) of the land. The
photographs of the existing greenery are given below:
Photographs of the existing Greenbelt
It has been proposed by IOLCP that additional 9000 trees shall be planted in the area
of existing eucalyptus plantation which shall be replaced with native species
plantation like gulmohar, shisham, siris, jamun, Kadam, daikan, neem, kaner etc. for
this plantation IOLCP has earmarked a budget of Rs. 30 lakhs including maintenance
cost for 5 year.
Beside this maintenance of the existing greenbelt shall be done on regular basis for
which IOL Chemical has already kept a budget for Rs. 20 lakhs as a capital cost.
IOLCP has planted approx. 26000 tree/shrubs and herbs in existing greenbelt. The
tree species like Eucalyptus, neem, Daikan, sadabahar, Ficus spp., jamun, Champa,
EIA/EMP Report for Expansion of Chemicals and APIs production unit by IOLCP
EQMS India Pvt. Ltd. 221
kadam gulmohar along with shrubs and herbs has been planted under existing
greenbelt.
5.10. Land Environment
Construction phase
Following materials shall be stored and handled carefully under applicable safety guidelines.
Some of the precautions of storage include the following:
Dyke enclosures shall be provided;
Diesel and other fuels shall be stored in separate storage tanks with dyke enclosures;
PPE and Fire extinguisher/tenders will be provided.
Site Security
Adequate security arrangement shall be made to ensure that the local inhabitants and the
stray cattle are not exposed to the potential hazards of construction activities. Availability of
boundary wall shall be helpful in meeting this objective.
Operation phase
Hazardous waste will be disposed as mentioned in the Chapter 2.
There will be no major source of hazardous waste generation due to the proposed
project that would be causing harm to the environment, as major solid waste is
gypsum which will be sold to cement industries and hazardous wastes are ETP
Sludge & used oil which will be disposed as per Hazardous Waste (Management,
Handling & Transboundary Movement) Rules, 2016 and its amendments.
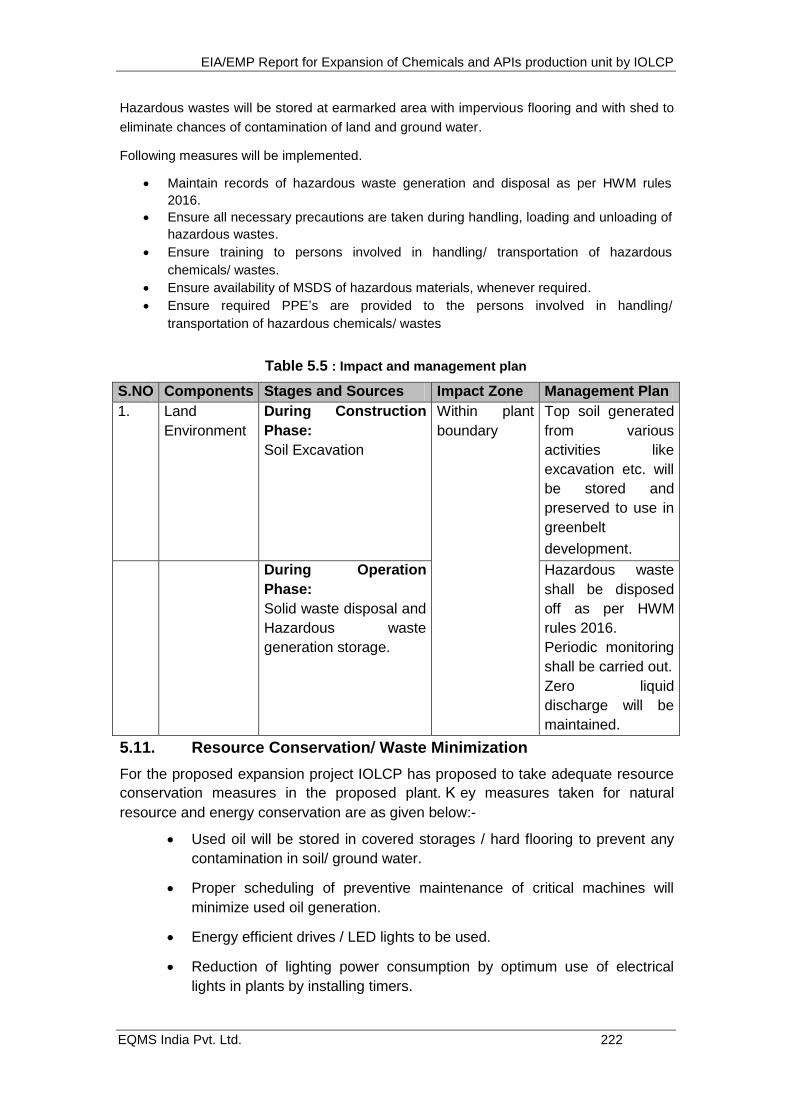
EIA/EMP Report for Expansion of Chemicals and APIs production unit by IOLCP
EQMS India Pvt. Ltd. 222
Hazardous wastes will be stored at earmarked area with impervious flooring and with shed to
eliminate chances of contamination of land and ground water.
Following measures will be implemented.
Maintain records of hazardous waste generation and disposal as per HWM rules
2016.
Ensure all necessary precautions are taken during handling, loading and unloading of
hazardous wastes.
Ensure training to persons involved in handling/ transportation of hazardous
chemicals/ wastes.
Ensure availability of MSDS of hazardous materials, whenever required.
Ensure required PPE’s are provided to the persons involved in handling/
transportation of hazardous chemicals/ wastes
Table 5.5 : Impact and management plan
S.NO Components Stages and Sources Impact Zone Management Plan
1. Land
Environment
During Construction
Phase:
Soil Excavation
Within plant
boundary
Top soil generated
from various
activities like
excavation etc. will
be stored and
preserved to use in
greenbelt
development.
During Operation
Phase:
Solid waste disposal and
Hazardous waste
generation storage.
Hazardous waste
shall be disposed
off as per HWM
rules 2016.
Periodic monitoring
shall be carried out.
Zero liquid
discharge will be
maintained.
5.11. Resource Conservation/ Waste Minimization
For the proposed expansion project IOLCP has proposed to take adequate resource
conservation measures in the proposed plant. K ey measures taken for natural
resource and energy conservation are as given below:-
Used oil will be stored in covered storages / hard flooring to prevent any
contamination in soil/ ground water.
Proper scheduling of preventive maintenance of critical machines will
minimize used oil generation.
Energy efficient drives / LED lights to be used.
Reduction of lighting power consumption by optimum use of electrical
lights in plants by installing timers.

EIA/EMP Report for Expansion of Chemicals and APIs production unit by IOLCP
EQMS India Pvt. Ltd. 223
Use of variable frequency drive in plant.
Enough care will be taken to prevent/minimize energy losses at each
stage.
Period Energy audit will be done.
Zero liquid discharge will be maintained for reduction in fresh water
consumption.
Also use of Energy Efficient Lighting, Transformers, HVAC system, Use of
Energy Efficient Motors, electrical appliances to minimize the energy
consumption in addition to Process Planning.
5.11.1. Strategy of Energy conservation in IOLCP
IOLCP have separate process engineering team of chemical engineers as Energy
conservation cell led by certified energy auditor from BEE (Team leader is a company
employee), they are identifying the scope for energy saving, if any of the area is
evaluated as potential source for energy saving, then the entire team, process the
thought in multi dimensions and verified by using software like CHEMCAD & ASPEN.
Once the thought is implemented successfully then the same thought is implemented
across the locations and systems to get full benefit of each idea generated.
IOLCP have strict monitoring of latent heat used and its recovery, which in-turn going
back to cooling tower may be directly or indirectly. In this process IOLCP gets three
dimensional benefits (1- Efficient use of energy generated, 2- Process productivity
improved without adding any new equipment, 3- Energy is re-circulated before
discard to reduce operating cost for treatment.
IOLCP have an eye on advanced techniques which can give benefits in product
quality with minimum resource utilization. Based on technical evaluation and
comparison of quality, productivity, energy, human and environment, this process of
evaluation and implementation gives immense confidence in proposed change which
can improve the contribution.
IOLCP have a focus to use continuous processing techniques instead of batch
processing and explore the possibility to convert batch processing to continuous
processing so that wastage of time and energy can be minimized, and end product
becomes cost effective to the end user.
IOLCP have stringent control on equipment and their MOC selection, priority given to
the most energy efficient / effective equipment / MOC to get optimal output.
IOLCP have stringent control on the usage of water which again gives three
dimensional benefits apart from EHS norms / quality, 1- Less energy consumption in
water generation, 2- Less load on ETP thus less energy is required to treat the
effluent generated, 3- Opportunity to enhance the productivity in the same set of
equipments by increasing the flow / batch sizes.
Utility system is all decentralized with minimum heat losses during transit and least
power consumption, this gives immense benefit to the optimal control on the process
and emergencies.
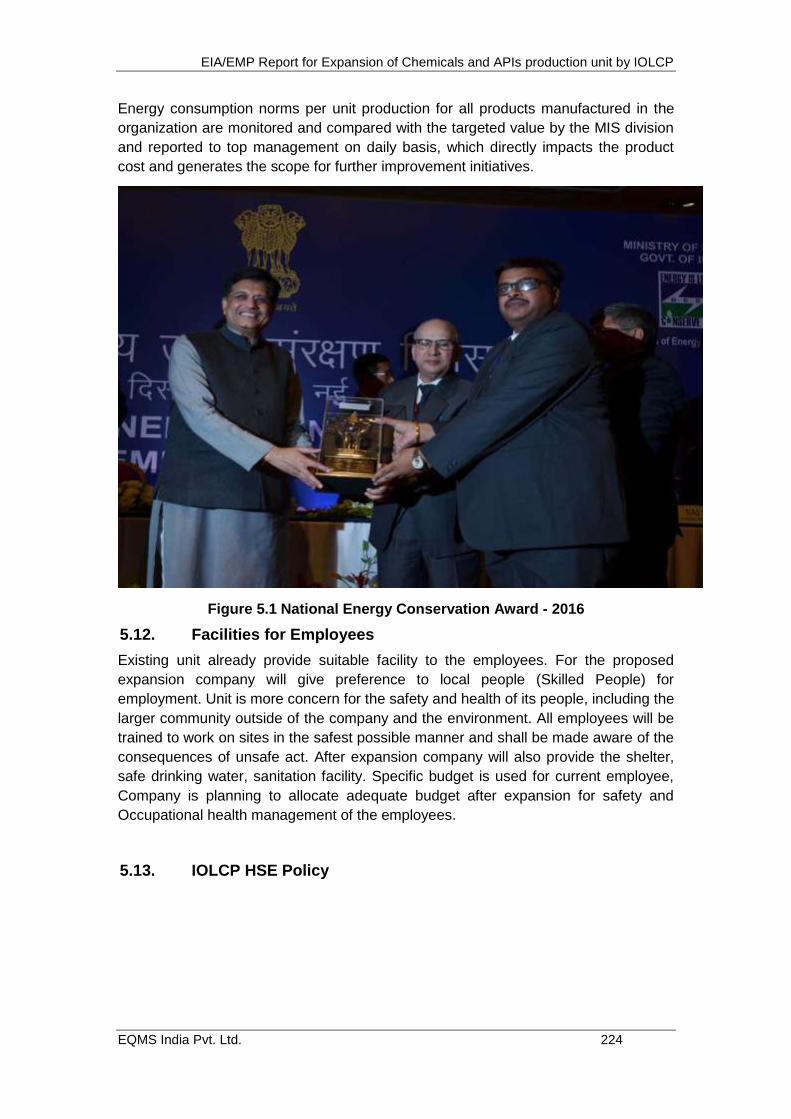
EIA/EMP Report for Expansion of Chemicals and APIs production unit by IOLCP
EQMS India Pvt. Ltd. 224
Energy consumption norms per unit production for all products manufactured in the
organization are monitored and compared with the targeted value by the MIS division
and reported to top management on daily basis, which directly impacts the product
cost and generates the scope for further improvement initiatives.
Figure 5.1 National Energy Conservation Award - 2016
5.12. Facilities for Employees
Existing unit already provide suitable facility to the employees. For the proposed
expansion company will give preference to local people (Skilled People) for
employment. Unit is more concern for the safety and health of its people, including the
larger community outside of the company and the environment. All employees will be
trained to work on sites in the safest possible manner and shall be made aware of the
consequences of unsafe act. After expansion company will also provide the shelter,
safe drinking water, sanitation facility. Specific budget is used for current employee,
Company is planning to allocate adequate budget after expansion for safety and
Occupational health management of the employees.
5.13. IOLCP HSE Policy
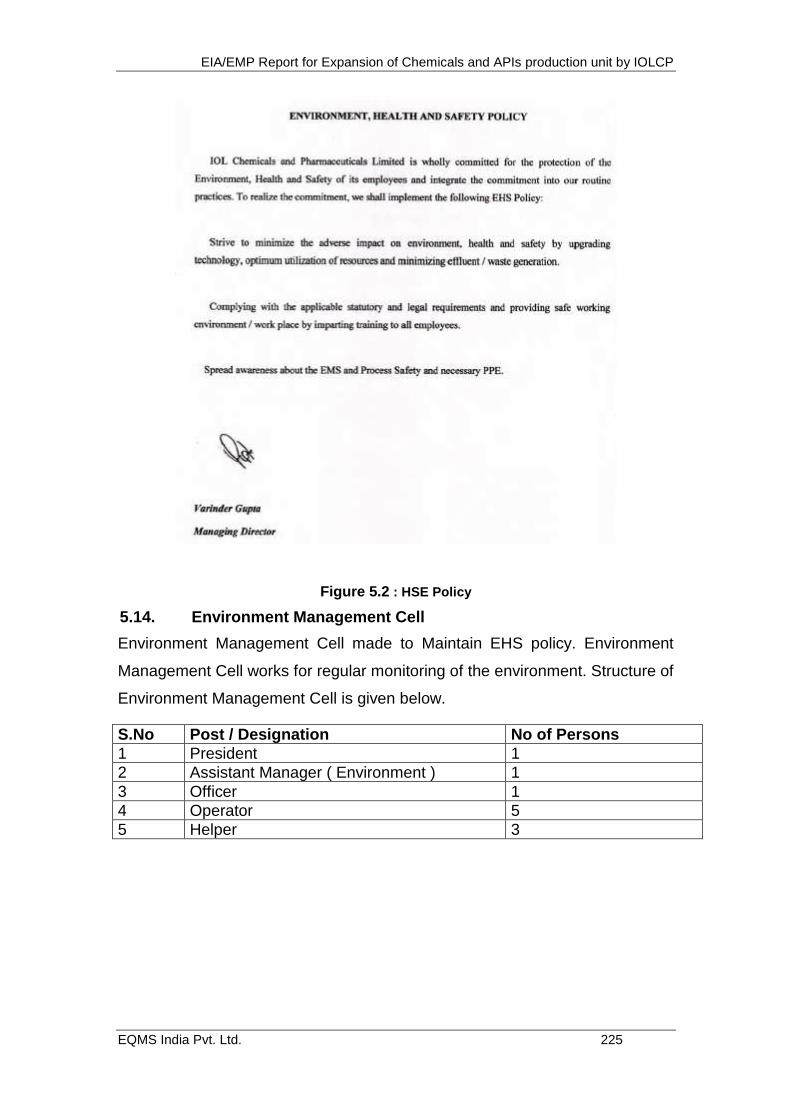
EIA/EMP Report for Expansion of Chemicals and APIs production unit by IOLCP
EQMS India Pvt. Ltd. 225
Figure 5.2 : HSE Policy
5.14. Environment Management Cell
Environment Management Cell made to Maintain EHS policy. Environment
Management Cell works for regular monitoring of the environment. Structure of
Environment Management Cell is given below.
S.No Post / Designation No of Persons
1 President 1
2 Assistant Manager ( Environment ) 1
3 Officer 1
4 Operator 5
5 Helper 3
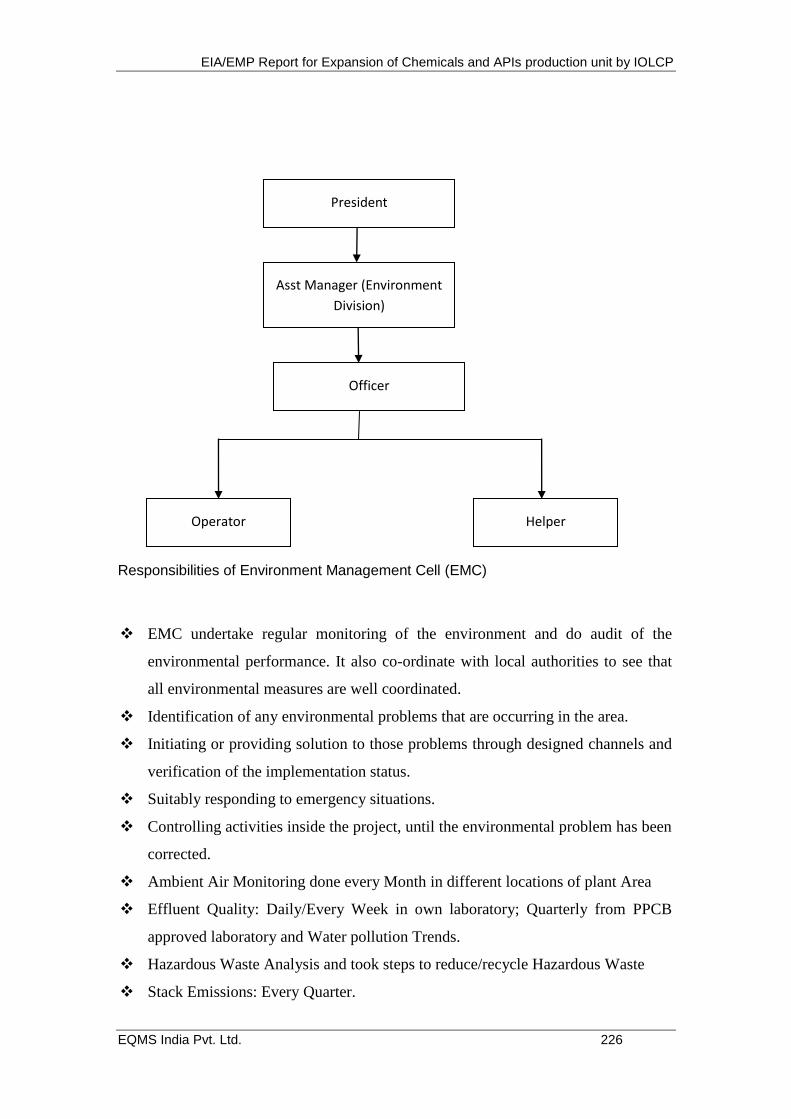
EIA/EMP Report for Expansion of Chemicals and APIs production unit by IOLCP
EQMS India Pvt. Ltd. 226
Responsibilities of Environment Management Cell (EMC)
EMC undertake regular monitoring of the environment and do audit of the
environmental performance. It also co-ordinate with local authorities to see that
all environmental measures are well coordinated.
Identification of any environmental problems that are occurring in the area.
Initiating or providing solution to those problems through designed channels and
verification of the implementation status.
Suitably responding to emergency situations.
Controlling activities inside the project, until the environmental problem has been
corrected.
Ambient Air Monitoring done every Month in different locations of plant Area
Effluent Quality: Daily/Every Week in own laboratory; Quarterly from PPCB
approved laboratory and Water pollution Trends.
Hazardous Waste Analysis and took steps to reduce/recycle Hazardous Waste
Stack Emissions: Every Quarter.
President
1 No
Asst Manager (Environment
Division)
1 No
Officer
1 No
Operator
5 Nos
Helper
3 Nos
EIA/EMP Report for Expansion of Chemicals and APIs production unit by IOLCP
EQMS India Pvt. Ltd. 227
Time to time soil testing
Internal audit to check environmental performance
To meet compliance of SPCB/CPCB/MoEF and other departments
Trainings to Employees to control Pollution.
Suitably responding to emergency situations.
To coordinate/Liaison with government authorities and regulatory bodies for
timely submission of compliances like Form-3, On line SPM Analyzer readings,
Hazardous Waste Stock, CCTV camera recording, Ground Water abstraction ,
Form –IV, Form-V and six monthly compliance to MoEF.
Monthly review meeting of the Environmental Management System and the
assessment of progress made to address pending issues from the previous review
meeting.
Setting of new Environmental objectives.
To detection of deficiencies in the applied system.
To find out problems in the Environmental Management System.
Changes / amendments in the legislation, which may affect and/or modify the
Plant’s Environmental Management System policy.
Responsible for follow up of the decisions taken and for keeping the relevant
records.
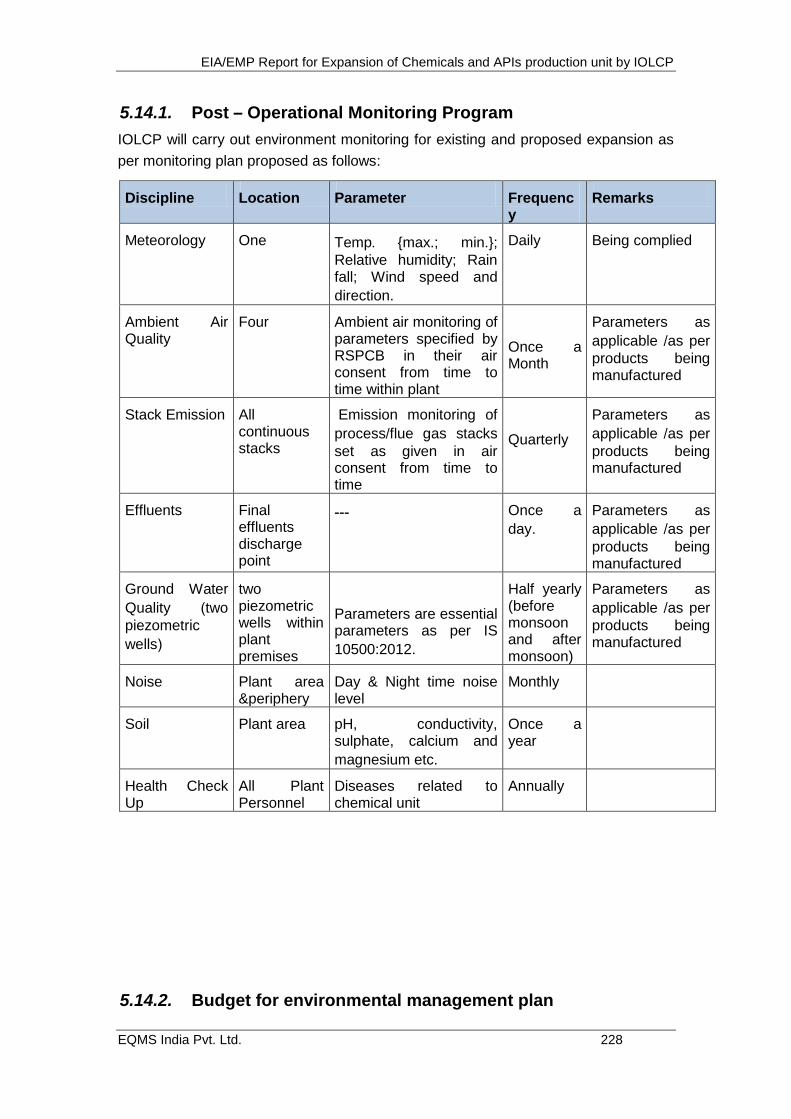
EIA/EMP Report for Expansion of Chemicals and APIs production unit by IOLCP
EQMS India Pvt. Ltd. 228
5.14.1. Post – Operational Monitoring Program
IOLCP will carry out environment monitoring for existing and proposed expansion as
per monitoring plan proposed as follows:
Discipline Location Parameter Frequency
Remarks
Meteorology One Temp. {max.; min.};
Relative humidity; Rain fall; Wind speed and
direction.
Daily Being complied
Ambient Air Quality
Four Ambient air monitoring of parameters specified by RSPCB in their air consent from time to time within plant
Once a Month
Parameters as
applicable /as per
products being manufactured
Stack Emission All continuous stacks
Emission monitoring of
process/flue gas stacks
set as given in air consent from time to time
Quarterly
Parameters as
applicable /as per
products being manufactured
Effluents Final effluents discharge point
--- Once a
day.
Parameters as
applicable /as per
products being manufactured
Ground Water
Quality (two
piezometric
wells)
two piezometric wells within plant premises
Parameters are essential parameters as per IS
10500:2012.
Half yearly (before monsoon and after monsoon)
Parameters as
applicable /as per
products being manufactured
Noise Plant area &periphery
Day & Night time noise level
Monthly
Soil Plant area pH, conductivity, sulphate, calcium and
magnesium etc.
Once a year
Health Check Up
All Plant Personnel
Diseases related to chemical unit
Annually
5.14.2. Budget for environmental management plan
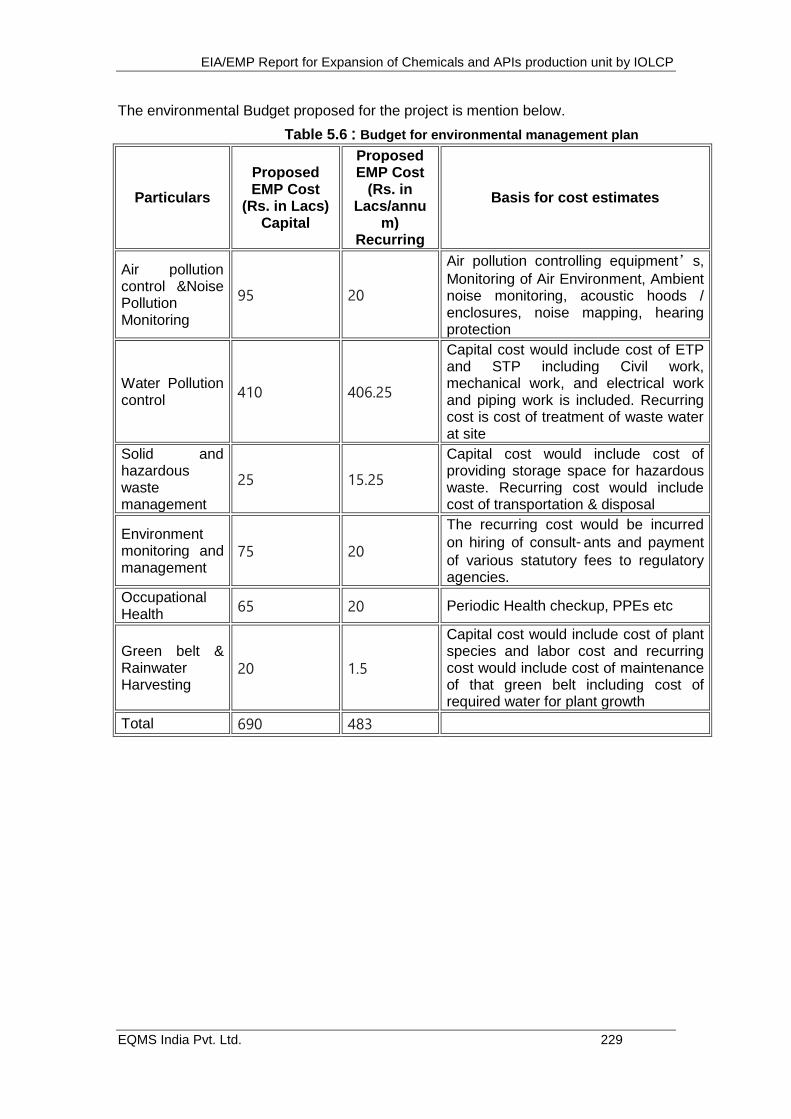
EIA/EMP Report for Expansion of Chemicals and APIs production unit by IOLCP
EQMS India Pvt. Ltd. 229
The environmental Budget proposed for the project is mention below.
Table 5.6 : Budget for environmental management plan
Particulars
Proposed EMP Cost
(Rs. in Lacs) Capital
Proposed EMP Cost
(Rs. in Lacs/annu
m) Recurring
Basis for cost estimates
Air pollution control &Noise Pollution Monitoring
95 20
Air pollution controlling equipment’s,
Monitoring of Air Environment, Ambient noise monitoring, acoustic hoods / enclosures, noise mapping, hearing protection
Water Pollution control
410 406.25
Capital cost would include cost of ETP and STP including Civil work, mechanical work, and electrical work and piping work is included. Recurring cost is cost of treatment of waste water at site
Solid and hazardous waste management
25 15.25
Capital cost would include cost of providing storage space for hazardous waste. Recurring cost would include cost of transportation & disposal
Environment monitoring and management
75 20
The recurring cost would be incurred
on hiring of consultants and payment
of various statutory fees to regulatory agencies.
Occupational Health
65 20 Periodic Health checkup, PPEs etc
Green belt & Rainwater Harvesting
20 1.5
Capital cost would include cost of plant species and labor cost and recurring cost would include cost of maintenance of that green belt including cost of required water for plant growth
Total 690 483
EIA/EMP Report for Expansion of Chemicals and APIs production unit by IOLCP
EQMS India Pvt. Ltd. 230
CHAPTER 6. RISK ASSESSMENT& DISASTER MANAGEMENT PLAN
6.1. Introduction
Industrial plants deal with materials, which are generally hazardous in nature by virtue of
their intrinsic chemical properties or their operating temperatures or pressures or a
combination of these. Fire, explosion, toxic release or combinations of these are the hazards
associated with industrial plants using hazardous chemicals. More comprehensive,
systematic and sophisticated methods of Safety Engineering, such as, Hazard Analysis and
Quantitative Risk Assessment have now been developed to improve upon the integrity,
reliability and safety of industrial plants.
The primary emphasis in safety engineering is to reduce risk to human life, property and
environment. Some of the more important methods used to achieve this are:
Quantitative Risk Analysis: Provides a relative measure of the
likelihood and severity of various possible hazardous events by
critically examining the plant process and design.
Work Safety Analysis: The technique discerns whether the plant
layout and operating procedures in practice have any inherent
infirmities.
Safety Audit: Takes a careful look at plant operating conditions, work
practices and work environments to detect unsafe conditions.
Together, these three broad tools attempt to minimize the chances of accidents occurring.
Yet, there always exists, no matter how remote, probability of occurrence of a major
accident. If the accident involves highly hazardous chemicals in sufficiently large quantities,
the consequences may be serious to the plant, to surrounding areas and the populations
residing therein.
6.2. Risk Assessment
A three ‗levels‘ risk assessment approach has been adopted for them/s IOL Chemicals &
Pharmaceuticals Limited (hence forth IOLCP) proposed expansion project to be set up at
Village Fatehgarh Channa on Mansa Road, Tehsil & District Barnala Punjab. The risk
assessment levels are generally consistent with the practices encountered through various
assignments for medium and large chemical complexes. The brief outline of the three-tier
approach is given below:
Level 1 – Risk Screening
This is top-down review of worst- case potential hazards/risks, aimed primarily at identifying
plant sites or areas within plant, which pose the highest risk. Various screening factors
considered include:
Inventory of hazardous materials;
Hazardous Materials properties;
Storage conditions (e.g. temperature and pressure);
Location sensitivity (distance to residential areas / populace).
The data / information is obtained from plant. The results provide a relative indication of the
extent of hazards and potential for risk exposure.
Level 2 – Major Risk Survey (Semi - Quantitative)
EIA/EMP Report for Expansion of Chemicals and APIs production unit by IOLCP
EQMS India Pvt. Ltd. 231
The survey approach combines the site inspection with established risk assessment
techniques applied both qualitative as well quantitative mode. The primary objective is to
identify and select major risks at a specific location in the plant considering possible soft
spots / weak links during operation / maintenance. Aspects covered in the risk usually
include:
Process Hazards;
Process Safety Management Systems;
Fire Protection and Emergency response equipment and
programs.
Security Vulnerability;
Impact of hazards consequences (equipment damage, business
interruption, injury, fatalities);
Qualitative risk identification of scenarios involving hazardous
materials;
Risk reduction measures.
Selection of critical scenarios and their potential of damage provide means of prioritising
mitigative measures and allocate the resources to the areas with highest risks.
Level 3 – Quantitative Risk Assessment (Deterministic)
This is the stage of assessment of risks associated with all credible hazards (scenarios) with
potential to cause an undesirable outcome such as human injury, fatality or destruction of
property. The four basic elements include:
i. Hazards identification utilizing formal approach (Level 2, HAZOP
etc.);
ii. Frequency Analysis. Based on past safety data (incidents /
accidents); Identifying likely pathway of failures and quantifying
the toxic / inflammable material release;
iii. Hazards analysis to quantify the consequences of various
hazards scenarios (fire, explosion, BLEVE, toxic vapor release
etc.). Establish minimum value for damage (e.g. IDLH, over
pressure, radiation flux) to assess the impact on environment.
iv. Risk Quantification: Quantitative techniques are used considering
effect / impact due to weather data, population data, and
frequency of occurrences and likely hood of ignition / toxic
release. Data are analyzed considering likely damage (in terms of
injury / fatality, property damage) each scenario is likely to cause.
QRA provides a means to determine the relative significance of several undesired events,
allowing analyst and the team to focus their risk reduction efforts where they will be beneficial
most.
IOLCP shall manufacture pharmaceutical chemicals at the proposed site.Table2.4 inChapter
2 gives the list of raw materials. Solid raw materials are stored in ware house while liquid and
gaseous raw materials are stored in tank farms and covered area. The list of bulk liquid
storages of raw materials is as given below:
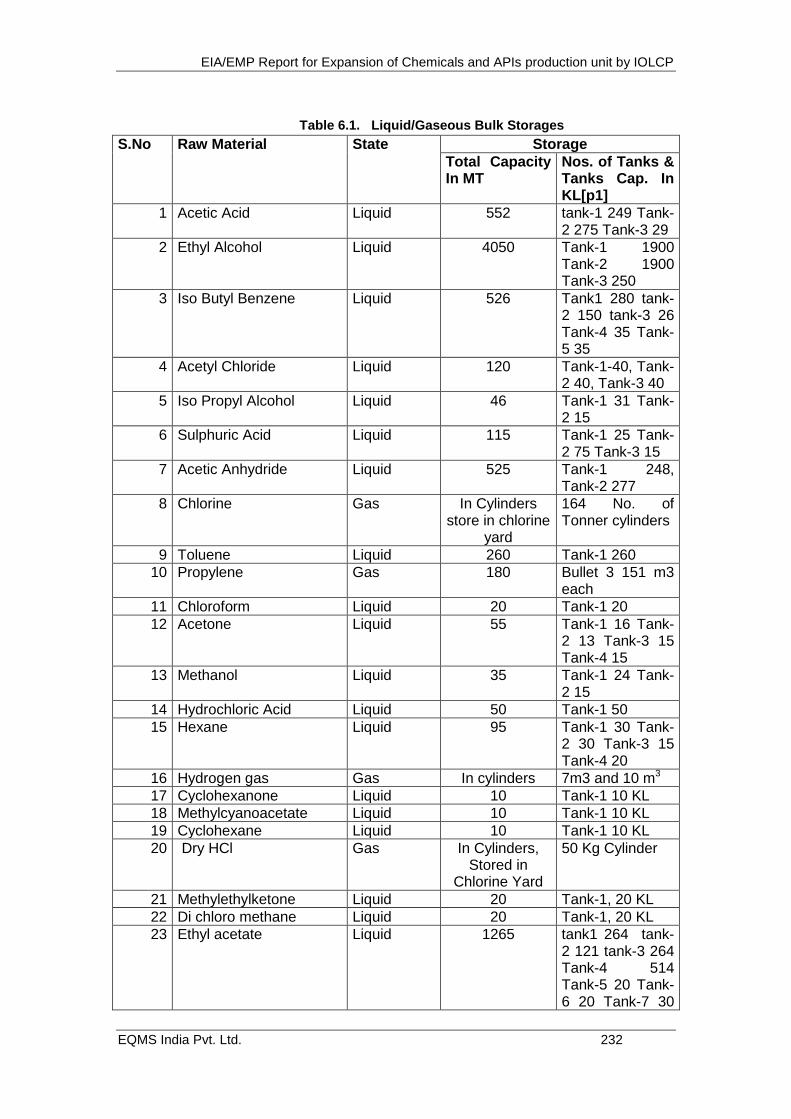
EIA/EMP Report for Expansion of Chemicals and APIs production unit by IOLCP
EQMS India Pvt. Ltd. 232
Table 6.1. Liquid/Gaseous Bulk Storages
S.No Raw Material State Storage
Total Capacity In MT
Nos. of Tanks & Tanks Cap. In KL[p1]
1 Acetic Acid Liquid 552 tank-1 249 Tank-2 275 Tank-3 29
2 Ethyl Alcohol Liquid 4050 Tank-1 1900 Tank-2 1900 Tank-3 250
3 Iso Butyl Benzene Liquid 526 Tank1 280 tank-2 150 tank-3 26 Tank-4 35 Tank-5 35
4 Acetyl Chloride Liquid 120 Tank-1-40, Tank-2 40, Tank-3 40
5 Iso Propyl Alcohol Liquid 46 Tank-1 31 Tank-2 15
6 Sulphuric Acid Liquid 115 Tank-1 25 Tank-2 75 Tank-3 15
7 Acetic Anhydride Liquid 525 Tank-1 248, Tank-2 277
8 Chlorine Gas In Cylinders store in chlorine
yard
164 No. of Tonner cylinders
9 Toluene Liquid 260 Tank-1 260
10 Propylene Gas 180 Bullet 3 151 m3 each
11 Chloroform Liquid 20 Tank-1 20
12 Acetone Liquid 55 Tank-1 16 Tank-2 13 Tank-3 15 Tank-4 15
13 Methanol Liquid 35 Tank-1 24 Tank-2 15
14 Hydrochloric Acid Liquid 50 Tank-1 50
15 Hexane Liquid 95 Tank-1 30 Tank-2 30 Tank-3 15 Tank-4 20
16 Hydrogen gas Gas In cylinders 7m3 and 10 m3
17 Cyclohexanone Liquid 10 Tank-1 10 KL
18 Methylcyanoacetate Liquid 10 Tank-1 10 KL
19 Cyclohexane Liquid 10 Tank-1 10 KL
20 Dry HCl Gas In Cylinders, Stored in
Chlorine Yard
50 Kg Cylinder
21 Methylethylketone Liquid 20 Tank-1, 20 KL
22 Di chloro methane Liquid 20 Tank-1, 20 KL
23 Ethyl acetate Liquid 1265 tank1 264 tank-2 121 tank-3 264 Tank-4 514 Tank-5 20 Tank-6 20 Tank-7 30
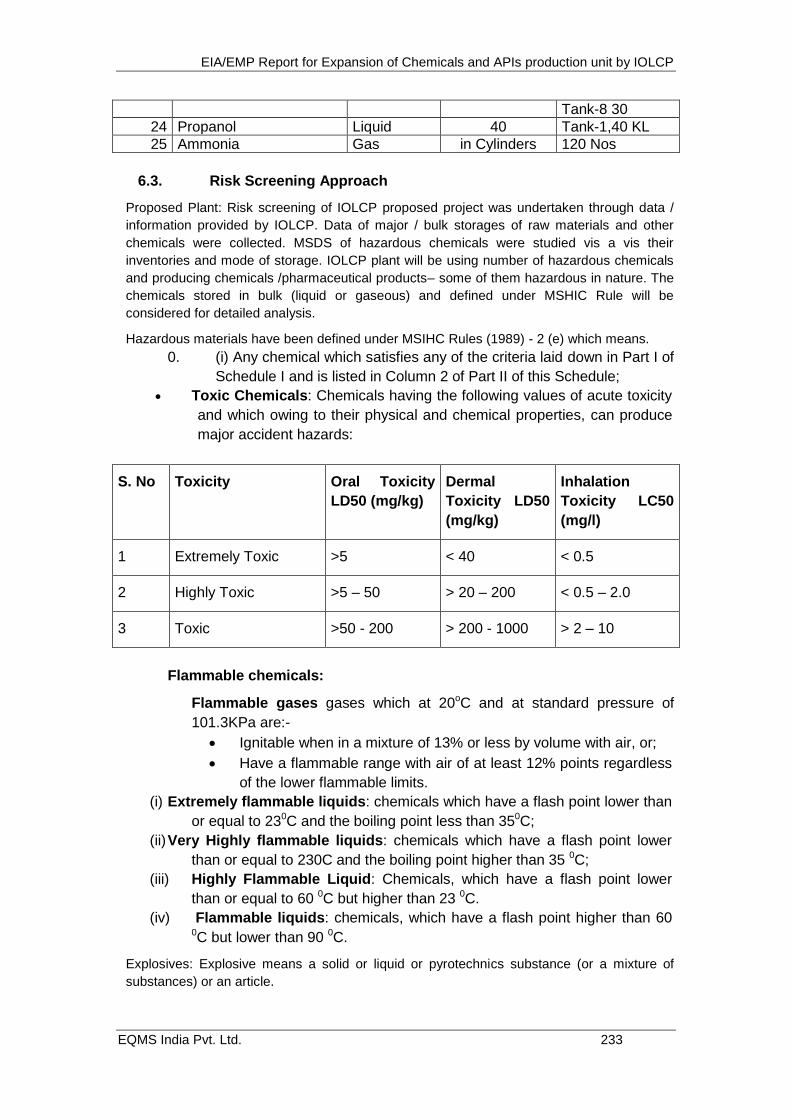
EIA/EMP Report for Expansion of Chemicals and APIs production unit by IOLCP
EQMS India Pvt. Ltd. 233
Tank-8 30
24 Propanol Liquid 40 Tank-1,40 KL
25 Ammonia Gas in Cylinders 120 Nos
6.3. Risk Screening Approach
Proposed Plant: Risk screening of IOLCP proposed project was undertaken through data /
information provided by IOLCP. Data of major / bulk storages of raw materials and other
chemicals were collected. MSDS of hazardous chemicals were studied vis a vis their
inventories and mode of storage. IOLCP plant will be using number of hazardous chemicals
and producing chemicals /pharmaceutical products– some of them hazardous in nature. The
chemicals stored in bulk (liquid or gaseous) and defined under MSHIC Rule will be
considered for detailed analysis.
Hazardous materials have been defined under MSIHC Rules (1989) - 2 (e) which means.
0. (i) Any chemical which satisfies any of the criteria laid down in Part I of
Schedule I and is listed in Column 2 of Part II of this Schedule;
Toxic Chemicals: Chemicals having the following values of acute toxicity
and which owing to their physical and chemical properties, can produce
major accident hazards:
S. No Toxicity Oral Toxicity
LD50 (mg/kg)
Dermal
Toxicity LD50
(mg/kg)
Inhalation
Toxicity LC50
(mg/l)
1 Extremely Toxic >5 < 40 < 0.5
2 Highly Toxic >5 – 50 > 20 – 200 < 0.5 – 2.0
3 Toxic >50 - 200 > 200 - 1000 > 2 – 10
Flammable chemicals:
Flammable gases gases which at 20oC and at standard pressure of
101.3KPa are:-
Ignitable when in a mixture of 13% or less by volume with air, or;
Have a flammable range with air of at least 12% points regardless
of the lower flammable limits.
(i) Extremely flammable liquids: chemicals which have a flash point lower than
or equal to 230C and the boiling point less than 350C;
(ii) Very Highly flammable liquids: chemicals which have a flash point lower
than or equal to 230C and the boiling point higher than 35 0C;
(iii) Highly Flammable Liquid: Chemicals, which have a flash point lower
than or equal to 60 0C but higher than 23 0C.
(iv) Flammable liquids: chemicals, which have a flash point higher than 60 0C but lower than 90 0C.
Explosives: Explosive means a solid or liquid or pyrotechnics substance (or a mixture of
substances) or an article.
EIA/EMP Report for Expansion of Chemicals and APIs production unit by IOLCP
EQMS India Pvt. Ltd. 234
a) Which is capable by chemical reaction of producing gas at such a temperature and
pressure and at such a speed as to cause damage to surroundings;
b) Which is designed to produce an effect by heat, light, sound, gas or smoke or a
combination of these as the result of non-detonative self-sustaining exothermic
chemical reaction.
I. any chemical listed in Column 2 of Schedule 2;
II. any chemical listed in Column 2 of Schedule 3;
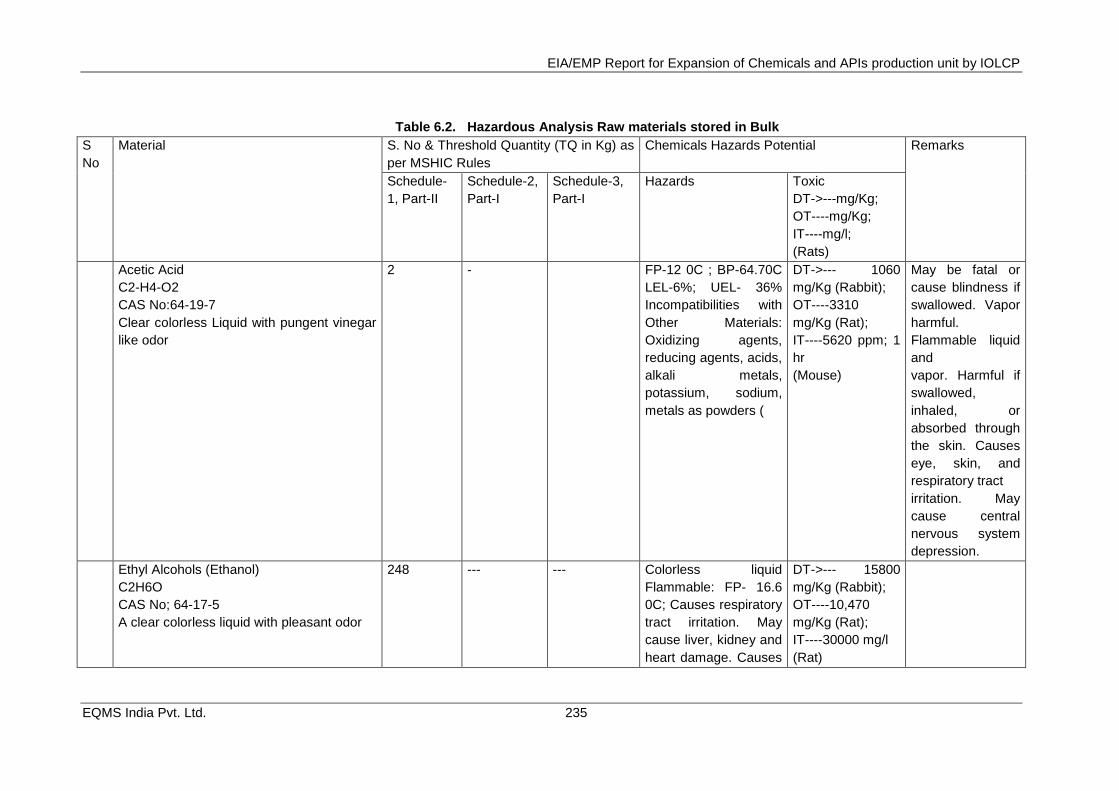
EIA/EMP Report for Expansion of Chemicals and APIs production unit by IOLCP
EQMS India Pvt. Ltd. 235
Table 6.2. Hazardous Analysis Raw materials stored in Bulk
S
No
Material S. No & Threshold Quantity (TQ in Kg) as
per MSHIC Rules
Chemicals Hazards Potential Remarks
Schedule-
1, Part-II
Schedule-2,
Part-I
Schedule-3,
Part-I
Hazards Toxic
DT->---mg/Kg;
OT----mg/Kg;
IT----mg/l;
(Rats)
Acetic Acid
C2-H4-O2
CAS No:64-19-7
Clear colorless Liquid with pungent vinegar
like odor
2 - FP-12 0C ; BP-64.70C
LEL-6%; UEL- 36%
Incompatibilities with
Other Materials:
Oxidizing agents,
reducing agents, acids,
alkali metals,
potassium, sodium,
metals as powders (
DT->--- 1060
mg/Kg (Rabbit);
OT----3310
mg/Kg (Rat);
IT----5620 ppm; 1
hr
(Mouse)
May be fatal or
cause blindness if
swallowed. Vapor
harmful.
Flammable liquid
and
vapor. Harmful if
swallowed,
inhaled, or
absorbed through
the skin. Causes
eye, skin, and
respiratory tract
irritation. May
cause central
nervous system
depression.
Ethyl Alcohols (Ethanol)
C2H6O
CAS No; 64-17-5
A clear colorless liquid with pleasant odor
248 --- --- Colorless liquid
Flammable: FP- 16.6
0C; Causes respiratory
tract irritation. May
cause liver, kidney and
heart damage. Causes
DT->--- 15800
mg/Kg (Rabbit);
OT----10,470
mg/Kg (Rat);
IT----30000 mg/l
(Rat)
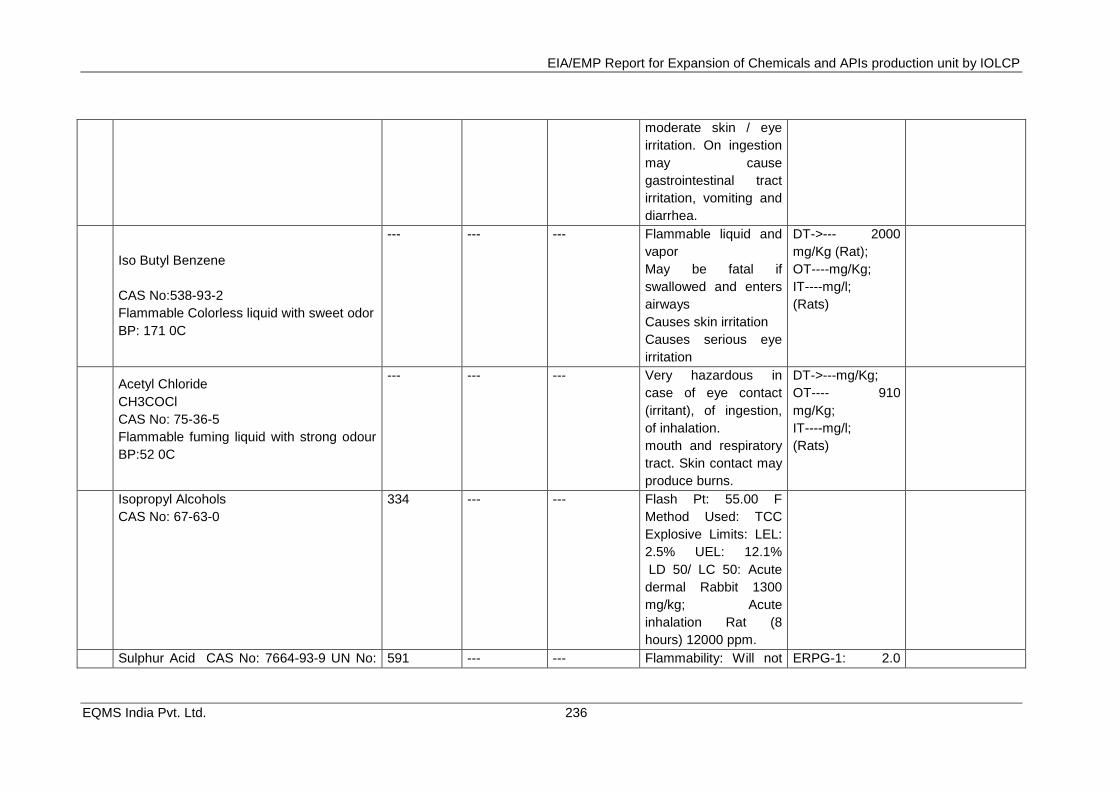
EIA/EMP Report for Expansion of Chemicals and APIs production unit by IOLCP
EQMS India Pvt. Ltd. 236
moderate skin / eye
irritation. On ingestion
may cause
gastrointestinal tract
irritation, vomiting and
diarrhea.
Iso Butyl Benzene
CAS No:538-93-2
Flammable Colorless liquid with sweet odor
BP: 171 0C
--- --- --- Flammable liquid and
vapor
May be fatal if
swallowed and enters
airways
Causes skin irritation
Causes serious eye
irritation
DT->--- 2000
mg/Kg (Rat);
OT----mg/Kg;
IT----mg/l;
(Rats)
Acetyl Chloride
CH3COCl
CAS No: 75-36-5
Flammable fuming liquid with strong odour
BP:52 0C
--- --- --- Very hazardous in
case of eye contact
(irritant), of ingestion,
of inhalation.
mouth and respiratory
tract. Skin contact may
produce burns.
DT->---mg/Kg;
OT---- 910
mg/Kg;
IT----mg/l;
(Rats)
Isopropyl Alcohols
CAS No: 67-63-0
334 --- --- Flash Pt: 55.00 F
Method Used: TCC
Explosive Limits: LEL:
2.5% UEL: 12.1%
LD 50/ LC 50: Acute
dermal Rabbit 1300
mg/kg; Acute
inhalation Rat (8
hours) 12000 ppm.
Sulphur Acid CAS No: 7664-93-9 UN No: 591 --- --- Flammability: Will not ERPG-1: 2.0
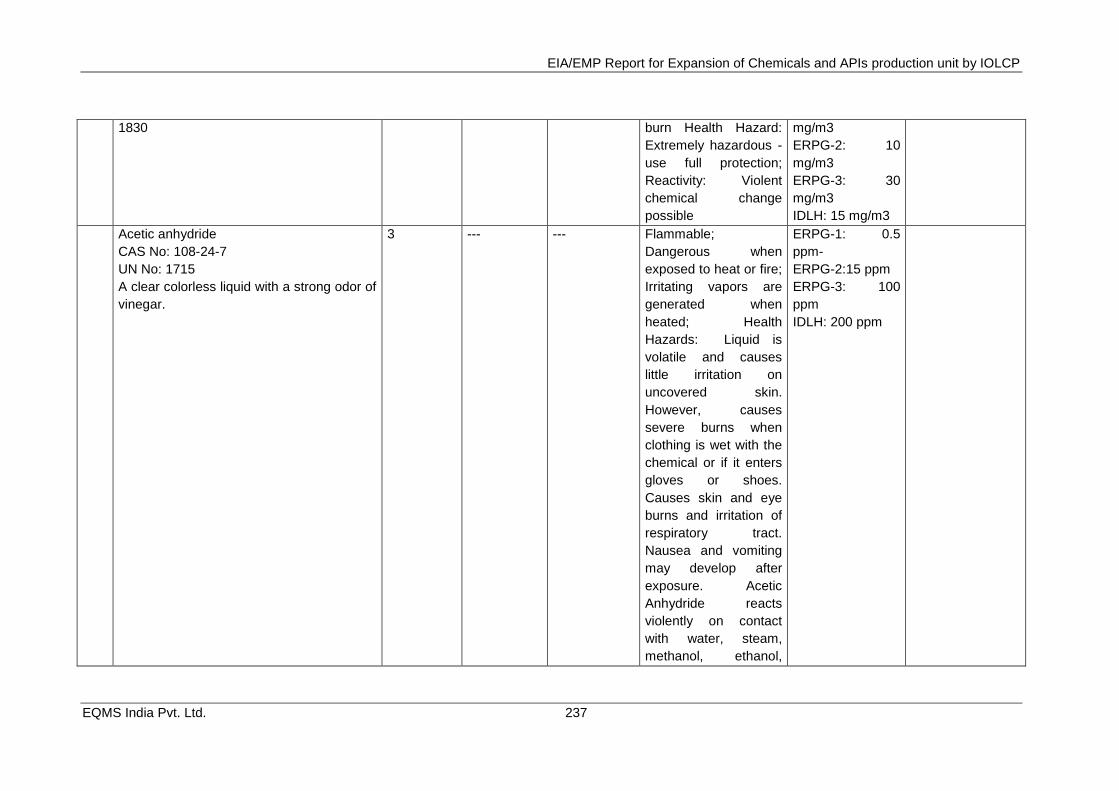
EIA/EMP Report for Expansion of Chemicals and APIs production unit by IOLCP
EQMS India Pvt. Ltd. 237
1830 burn Health Hazard:
Extremely hazardous -
use full protection;
Reactivity: Violent
chemical change
possible
mg/m3
ERPG-2: 10
mg/m3
ERPG-3: 30
mg/m3
IDLH: 15 mg/m3
Acetic anhydride
CAS No: 108-24-7
UN No: 1715
A clear colorless liquid with a strong odor of
vinegar.
3 --- --- Flammable;
Dangerous when
exposed to heat or fire;
Irritating vapors are
generated when
heated; Health
Hazards: Liquid is
volatile and causes
little irritation on
uncovered skin.
However, causes
severe burns when
clothing is wet with the
chemical or if it enters
gloves or shoes.
Causes skin and eye
burns and irritation of
respiratory tract.
Nausea and vomiting
may develop after
exposure. Acetic
Anhydride reacts
violently on contact
with water, steam,
methanol, ethanol,
ERPG-1: 0.5
ppm-
ERPG-2:15 ppm
ERPG-3: 100
ppm
IDLH: 200 ppm
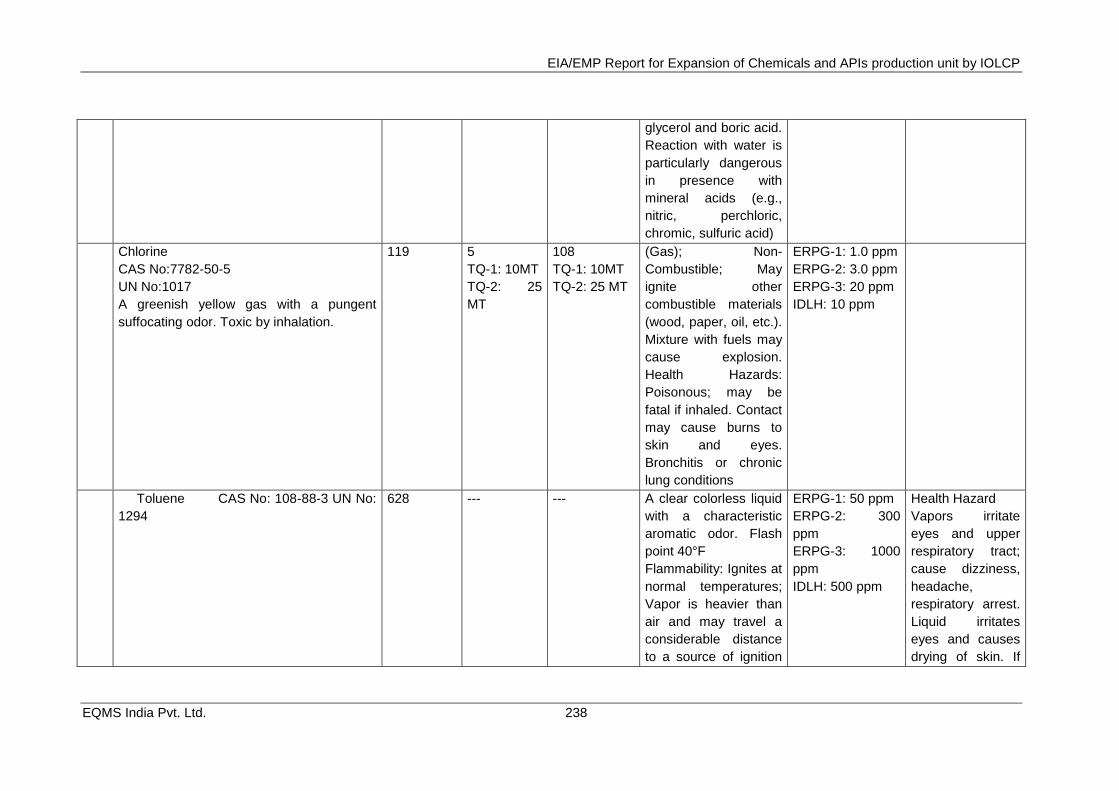
EIA/EMP Report for Expansion of Chemicals and APIs production unit by IOLCP
EQMS India Pvt. Ltd. 238
glycerol and boric acid.
Reaction with water is
particularly dangerous
in presence with
mineral acids (e.g.,
nitric, perchloric,
chromic, sulfuric acid)
Chlorine
CAS No:7782-50-5
UN No:1017
A greenish yellow gas with a pungent
suffocating odor. Toxic by inhalation.
119 5
TQ-1: 10MT
TQ-2: 25
MT
108
TQ-1: 10MT
TQ-2: 25 MT
(Gas); Non-
Combustible; May
ignite other
combustible materials
(wood, paper, oil, etc.).
Mixture with fuels may
cause explosion.
Health Hazards:
Poisonous; may be
fatal if inhaled. Contact
may cause burns to
skin and eyes.
Bronchitis or chronic
lung conditions
ERPG-1: 1.0 ppm
ERPG-2: 3.0 ppm
ERPG-3: 20 ppm
IDLH: 10 ppm
Toluene CAS No: 108-88-3 UN No:
1294
628 --- --- A clear colorless liquid
with a characteristic
aromatic odor. Flash
point 40°F
Flammability: Ignites at
normal temperatures;
Vapor is heavier than
air and may travel a
considerable distance
to a source of ignition
ERPG-1: 50 ppm
ERPG-2: 300
ppm
ERPG-3: 1000
ppm
IDLH: 500 ppm
Health Hazard
Vapors irritate
eyes and upper
respiratory tract;
cause dizziness,
headache,
respiratory arrest.
Liquid irritates
eyes and causes
drying of skin. If
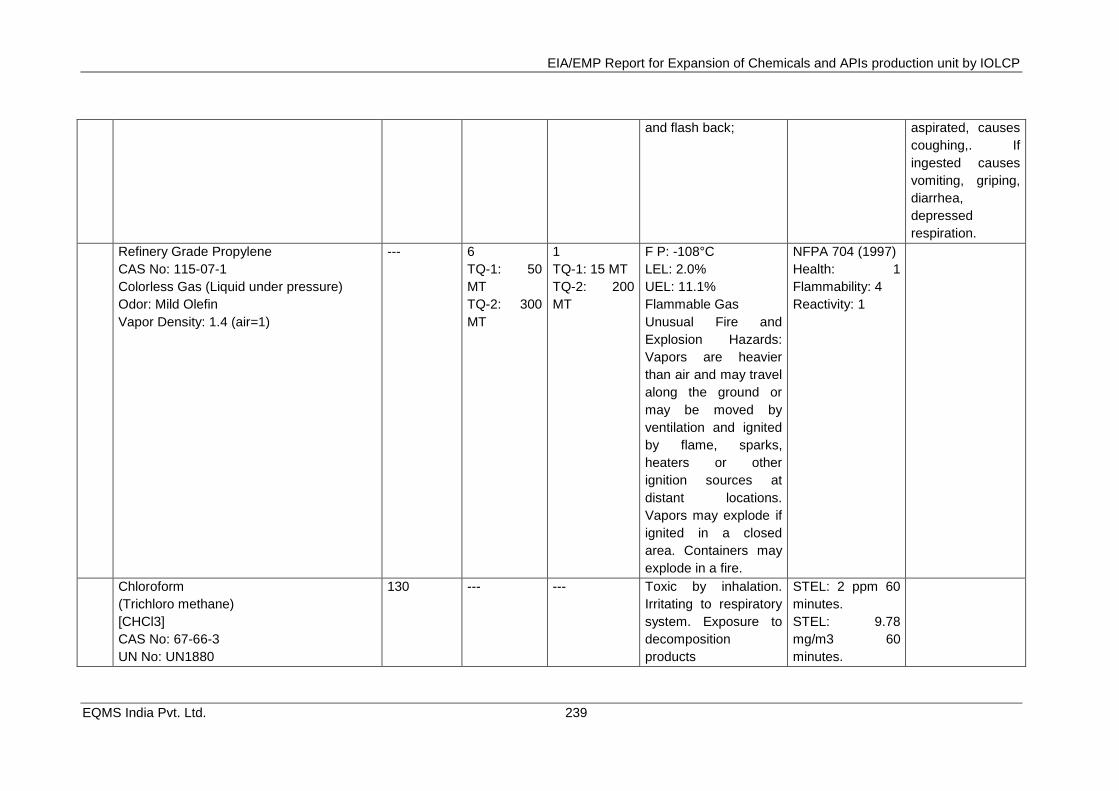
EIA/EMP Report for Expansion of Chemicals and APIs production unit by IOLCP
EQMS India Pvt. Ltd. 239
and flash back; aspirated, causes
coughing,. If
ingested causes
vomiting, griping,
diarrhea,
depressed
respiration.
Refinery Grade Propylene
CAS No: 115-07-1
Colorless Gas (Liquid under pressure)
Odor: Mild Olefin
Vapor Density: 1.4 (air=1)
--- 6
TQ-1: 50
MT
TQ-2: 300
MT
1
TQ-1: 15 MT
TQ-2: 200
MT
F P: -108°C
LEL: 2.0%
UEL: 11.1%
Flammable Gas
Unusual Fire and
Explosion Hazards:
Vapors are heavier
than air and may travel
along the ground or
may be moved by
ventilation and ignited
by flame, sparks,
heaters or other
ignition sources at
distant locations.
Vapors may explode if
ignited in a closed
area. Containers may
explode in a fire.
NFPA 704 (1997)
Health: 1
Flammability: 4
Reactivity: 1
Chloroform
(Trichloro methane)
[CHCl3]
CAS No: 67-66-3
UN No: UN1880
130 --- --- Toxic by inhalation.
Irritating to respiratory
system. Exposure to
decomposition
products
STEL: 2 ppm 60
minutes.
STEL: 9.78
mg/m3 60
minutes.
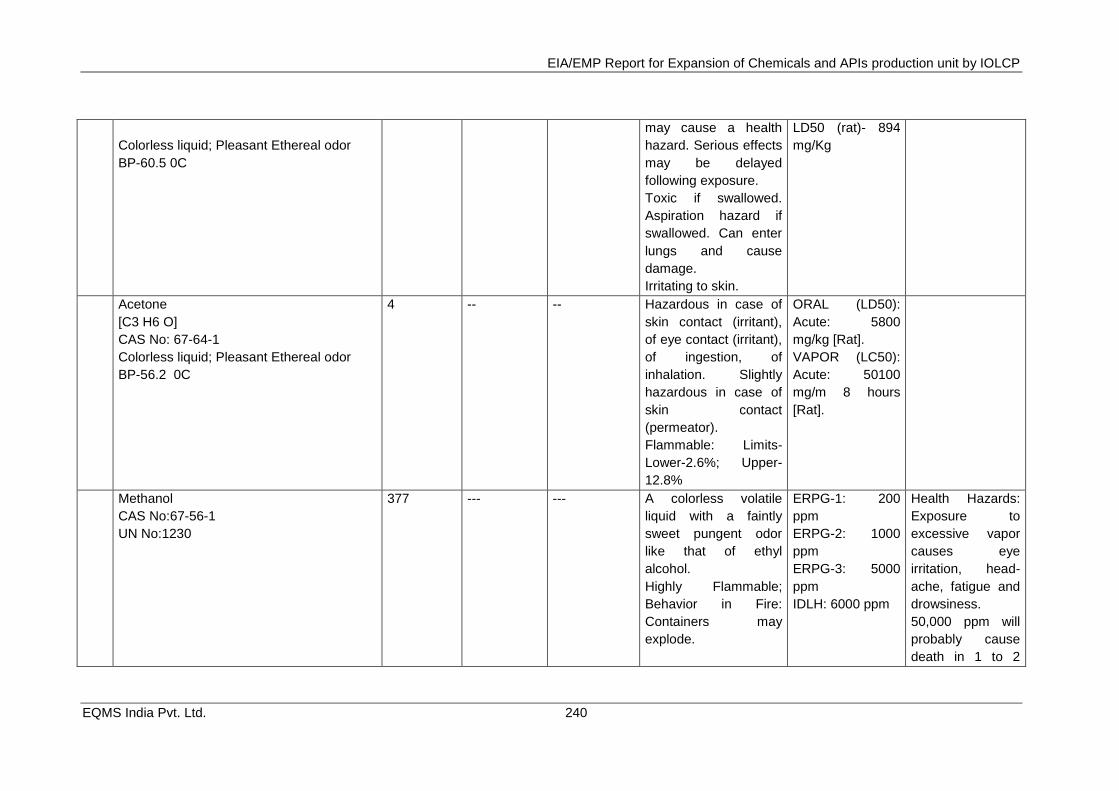
EIA/EMP Report for Expansion of Chemicals and APIs production unit by IOLCP
EQMS India Pvt. Ltd. 240
Colorless liquid; Pleasant Ethereal odor
BP-60.5 0C
may cause a health
hazard. Serious effects
may be delayed
following exposure.
Toxic if swallowed.
Aspiration hazard if
swallowed. Can enter
lungs and cause
damage.
Irritating to skin.
LD50 (rat)- 894
mg/Kg
Acetone
[C3 H6 O]
CAS No: 67-64-1
Colorless liquid; Pleasant Ethereal odor
BP-56.2 0C
4 -- -- Hazardous in case of
skin contact (irritant),
of eye contact (irritant),
of ingestion, of
inhalation. Slightly
hazardous in case of
skin contact
(permeator).
Flammable: Limits-
Lower-2.6%; Upper-
12.8%
ORAL (LD50):
Acute: 5800
mg/kg [Rat].
VAPOR (LC50):
Acute: 50100
mg/m 8 hours
[Rat].
Methanol
CAS No:67-56-1
UN No:1230
377 --- --- A colorless volatile
liquid with a faintly
sweet pungent odor
like that of ethyl
alcohol.
Highly Flammable;
Behavior in Fire:
Containers may
explode.
ERPG-1: 200
ppm
ERPG-2: 1000
ppm
ERPG-3: 5000
ppm
IDLH: 6000 ppm
Health Hazards:
Exposure to
excessive vapor
causes eye
irritation, head-
ache, fatigue and
drowsiness.
50,000 ppm will
probably cause
death in 1 to 2
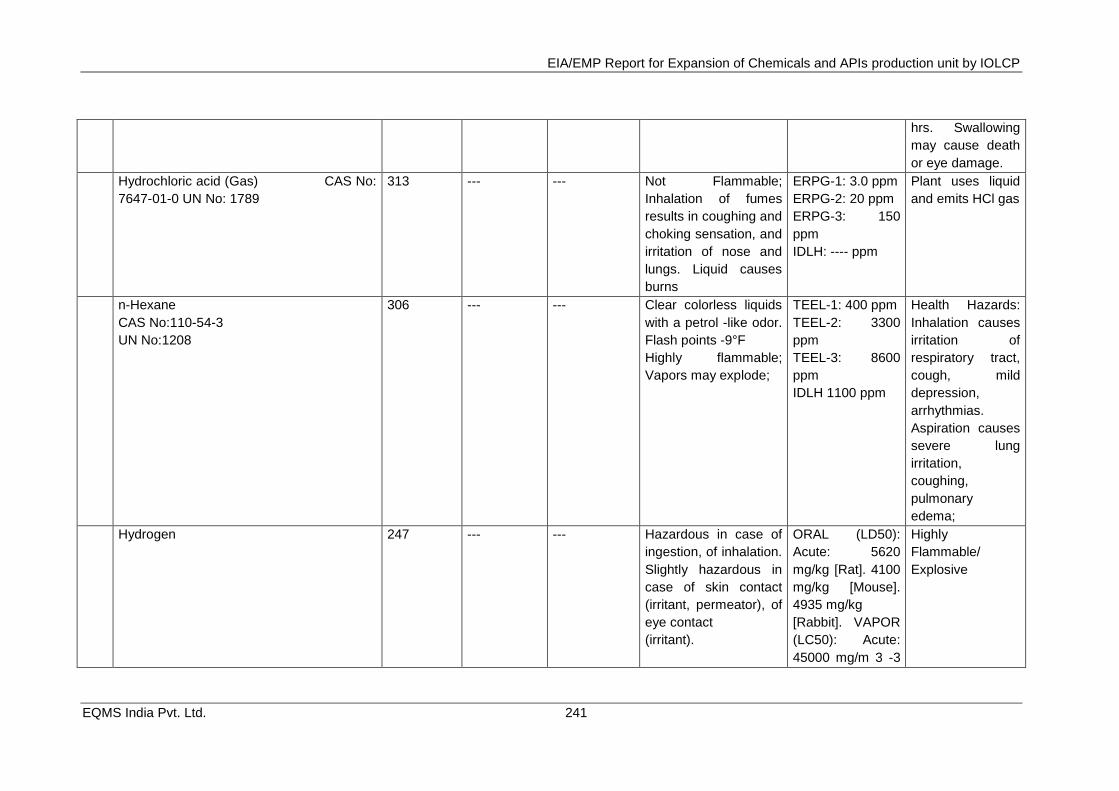
EIA/EMP Report for Expansion of Chemicals and APIs production unit by IOLCP
EQMS India Pvt. Ltd. 241
hrs. Swallowing
may cause death
or eye damage.
Hydrochloric acid (Gas) CAS No:
7647-01-0 UN No: 1789
313 --- --- Not Flammable;
Inhalation of fumes
results in coughing and
choking sensation, and
irritation of nose and
lungs. Liquid causes
burns
ERPG-1: 3.0 ppm
ERPG-2: 20 ppm
ERPG-3: 150
ppm
IDLH: ---- ppm
Plant uses liquid
and emits HCl gas
n-Hexane
CAS No:110-54-3
UN No:1208
306 --- --- Clear colorless liquids
with a petrol -like odor.
Flash points -9°F
Highly flammable;
Vapors may explode;
TEEL-1: 400 ppm
TEEL-2: 3300
ppm
TEEL-3: 8600
ppm
IDLH 1100 ppm
Health Hazards:
Inhalation causes
irritation of
respiratory tract,
cough, mild
depression,
arrhythmias.
Aspiration causes
severe lung
irritation,
coughing,
pulmonary
edema;
Hydrogen
247 --- --- Hazardous in case of
ingestion, of inhalation.
Slightly hazardous in
case of skin contact
(irritant, permeator), of
eye contact
(irritant).
ORAL (LD50):
Acute: 5620
mg/kg [Rat]. 4100
mg/kg [Mouse].
4935 mg/kg
[Rabbit]. VAPOR
(LC50): Acute:
45000 mg/m 3 -3
Highly
Flammable/
Explosive
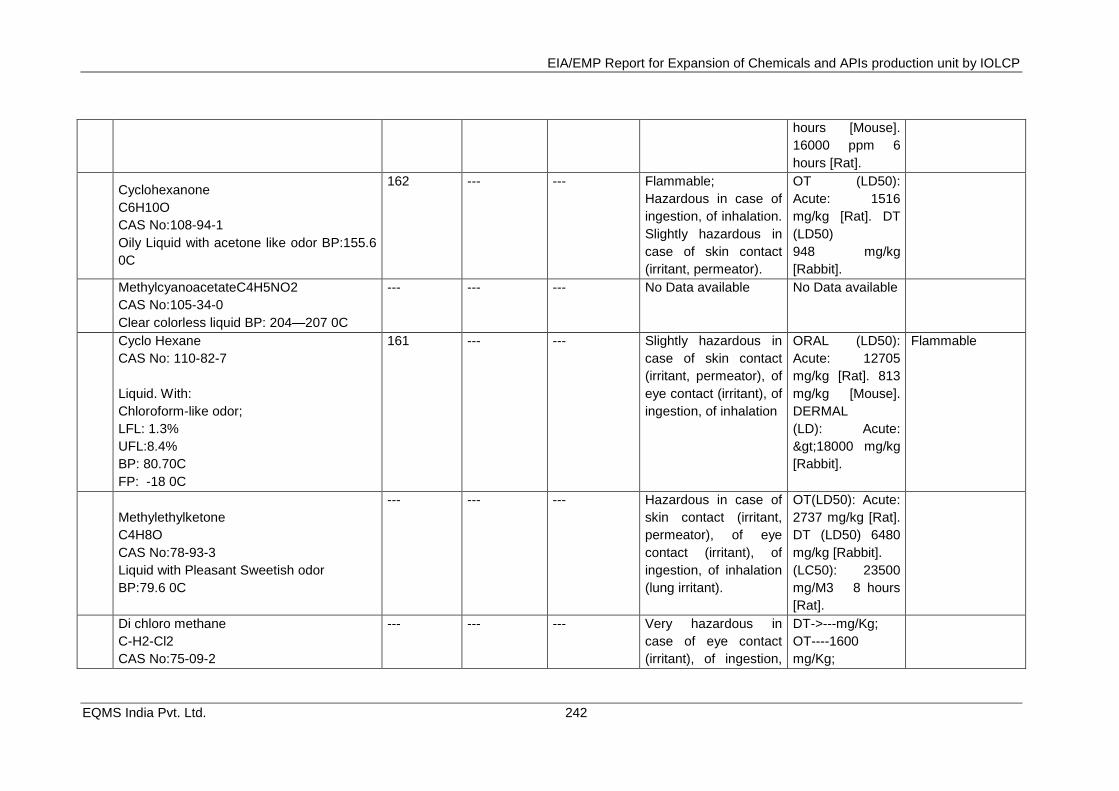
EIA/EMP Report for Expansion of Chemicals and APIs production unit by IOLCP
EQMS India Pvt. Ltd. 242
hours [Mouse].
16000 ppm 6
hours [Rat].
Cyclohexanone
C6H10O
CAS No:108-94-1
Oily Liquid with acetone like odor BP:155.6
0C
162 --- --- Flammable;
Hazardous in case of
ingestion, of inhalation.
Slightly hazardous in
case of skin contact
(irritant, permeator).
OT (LD50):
Acute: 1516
mg/kg [Rat]. DT
(LD50)
948 mg/kg
[Rabbit].
MethylcyanoacetateC4H5NO2
CAS No:105-34-0
Clear colorless liquid BP: 204—207 0C
--- --- --- No Data available No Data available
Cyclo Hexane
CAS No: 110-82-7
Liquid. With:
Chloroform-like odor;
LFL: 1.3%
UFL:8.4%
BP: 80.70C
FP: -18 0C
161 --- --- Slightly hazardous in
case of skin contact
(irritant, permeator), of
eye contact (irritant), of
ingestion, of inhalation
ORAL (LD50):
Acute: 12705
mg/kg [Rat]. 813
mg/kg [Mouse].
DERMAL
(LD): Acute:
>18000 mg/kg
[Rabbit].
Flammable
Methylethylketone
C4H8O
CAS No:78-93-3
Liquid with Pleasant Sweetish odor
BP:79.6 0C
--- --- --- Hazardous in case of
skin contact (irritant,
permeator), of eye
contact (irritant), of
ingestion, of inhalation
(lung irritant).
OT(LD50): Acute:
2737 mg/kg [Rat].
DT (LD50) 6480
mg/kg [Rabbit].
(LC50): 23500
mg/M3 8 hours
[Rat].
Di chloro methane
C-H2-Cl2
CAS No:75-09-2
--- --- --- Very hazardous in
case of eye contact
(irritant), of ingestion,
DT->---mg/Kg;
OT----1600
mg/Kg;
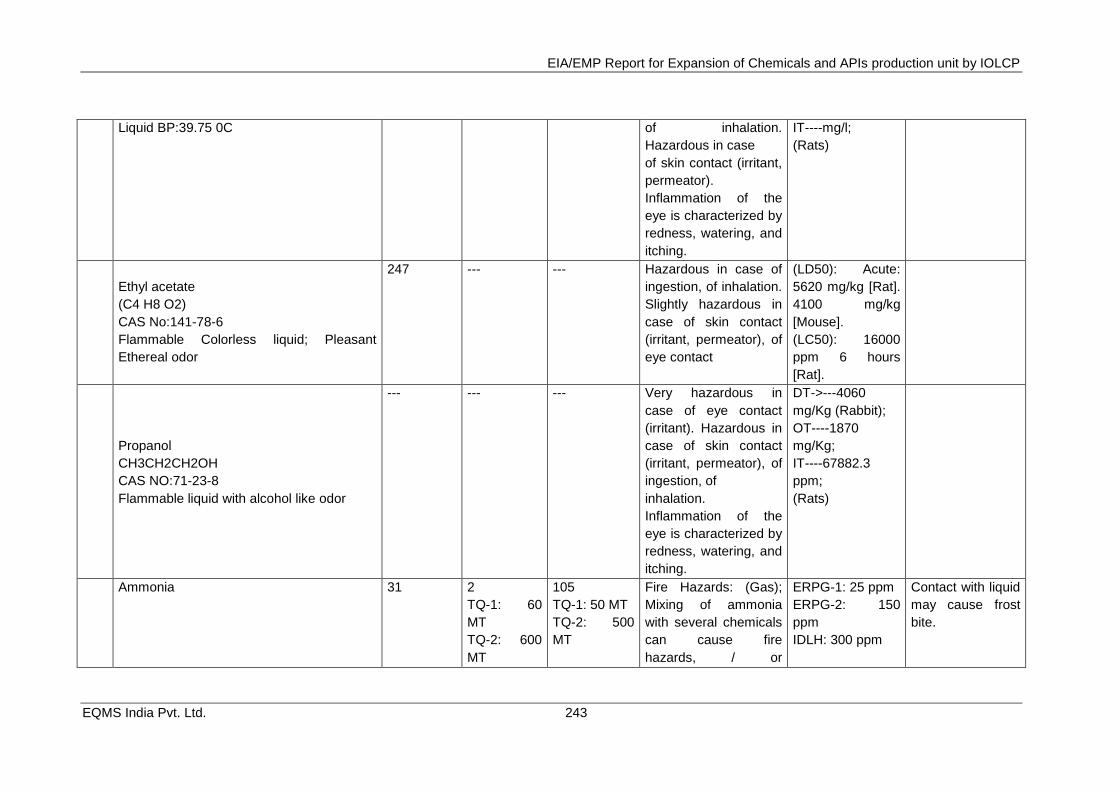
EIA/EMP Report for Expansion of Chemicals and APIs production unit by IOLCP
EQMS India Pvt. Ltd. 243
Liquid BP:39.75 0C of inhalation.
Hazardous in case
of skin contact (irritant,
permeator).
Inflammation of the
eye is characterized by
redness, watering, and
itching.
IT----mg/l;
(Rats)
Ethyl acetate
(C4 H8 O2)
CAS No:141-78-6
Flammable Colorless liquid; Pleasant
Ethereal odor
247 --- --- Hazardous in case of
ingestion, of inhalation.
Slightly hazardous in
case of skin contact
(irritant, permeator), of
eye contact
(LD50): Acute:
5620 mg/kg [Rat].
4100 mg/kg
[Mouse].
(LC50): 16000
ppm 6 hours
[Rat].
Propanol
CH3CH2CH2OH
CAS NO:71-23-8
Flammable liquid with alcohol like odor
--- --- --- Very hazardous in
case of eye contact
(irritant). Hazardous in
case of skin contact
(irritant, permeator), of
ingestion, of
inhalation.
Inflammation of the
eye is characterized by
redness, watering, and
itching.
DT->---4060
mg/Kg (Rabbit);
OT----1870
mg/Kg;
IT----67882.3
ppm;
(Rats)
Ammonia 31 2
TQ-1: 60
MT
TQ-2: 600
MT
105
TQ-1: 50 MT
TQ-2: 500
MT
Fire Hazards: (Gas);
Mixing of ammonia
with several chemicals
can cause fire
hazards, / or
ERPG-1: 25 ppm
ERPG-2: 150
ppm
IDLH: 300 ppm
Contact with liquid
may cause frost
bite.
EIA/EMP Report for Expansion of Chemicals and APIs production unit by IOLCP
EQMS India Pvt. Ltd. 244
explosions; vapors are
toxic- irritation to eyes
and respiratory tract.
TQ-I: Threshold quantity (for application of rules 4,5,7 to 9 and 13 to 15) TQ-II: Threshold quantity (for application of rules 10 to 12)
1. Note:
1. Oral Toxicity (OT) in LD50 (mg/kg)
2. Dermal Toxicity (DT) in LD50 (mg/kg)
3. Inhalation Toxicity in LC50 (mg/l) [4 hrs.]
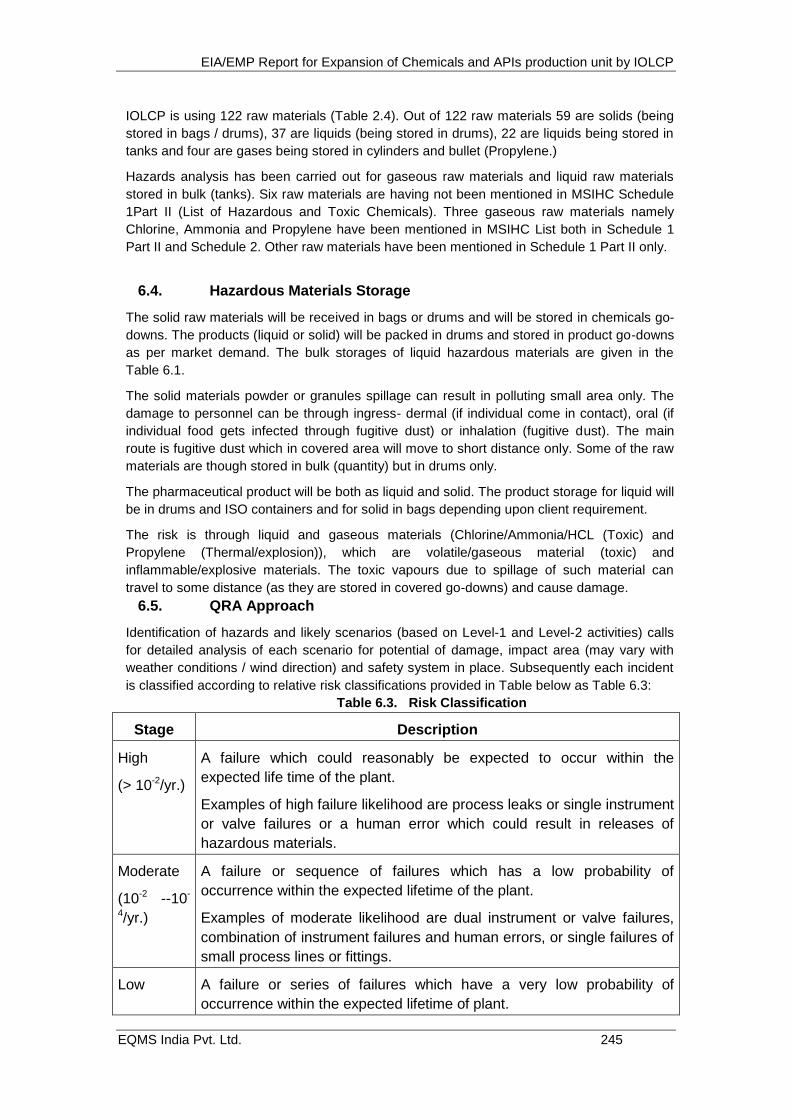
EIA/EMP Report for Expansion of Chemicals and APIs production unit by IOLCP
EQMS India Pvt. Ltd. 245
IOLCP is using 122 raw materials (Table 2.4). Out of 122 raw materials 59 are solids (being
stored in bags / drums), 37 are liquids (being stored in drums), 22 are liquids being stored in
tanks and four are gases being stored in cylinders and bullet (Propylene.)
Hazards analysis has been carried out for gaseous raw materials and liquid raw materials
stored in bulk (tanks). Six raw materials are having not been mentioned in MSIHC Schedule
1Part II (List of Hazardous and Toxic Chemicals). Three gaseous raw materials namely
Chlorine, Ammonia and Propylene have been mentioned in MSIHC List both in Schedule 1
Part II and Schedule 2. Other raw materials have been mentioned in Schedule 1 Part II only.
6.4. Hazardous Materials Storage
The solid raw materials will be received in bags or drums and will be stored in chemicals go-
downs. The products (liquid or solid) will be packed in drums and stored in product go-downs
as per market demand. The bulk storages of liquid hazardous materials are given in the
Table 6.1.
The solid materials powder or granules spillage can result in polluting small area only. The
damage to personnel can be through ingress- dermal (if individual come in contact), oral (if
individual food gets infected through fugitive dust) or inhalation (fugitive dust). The main
route is fugitive dust which in covered area will move to short distance only. Some of the raw
materials are though stored in bulk (quantity) but in drums only.
The pharmaceutical product will be both as liquid and solid. The product storage for liquid will
be in drums and ISO containers and for solid in bags depending upon client requirement.
The risk is through liquid and gaseous materials (Chlorine/Ammonia/HCL (Toxic) and
Propylene (Thermal/explosion)), which are volatile/gaseous material (toxic) and
inflammable/explosive materials. The toxic vapours due to spillage of such material can
travel to some distance (as they are stored in covered go-downs) and cause damage.
6.5. QRA Approach
Identification of hazards and likely scenarios (based on Level-1 and Level-2 activities) calls
for detailed analysis of each scenario for potential of damage, impact area (may vary with
weather conditions / wind direction) and safety system in place. Subsequently each incident
is classified according to relative risk classifications provided in Table below as Table 6.3:
Table 6.3. Risk Classification
Stage Description
High
(> 10-2/yr.)
A failure which could reasonably be expected to occur within the
expected life time of the plant.
Examples of high failure likelihood are process leaks or single instrument
or valve failures or a human error which could result in releases of
hazardous materials.
Moderate
(10-2 --10-
4/yr.)
A failure or sequence of failures which has a low probability of
occurrence within the expected lifetime of the plant.
Examples of moderate likelihood are dual instrument or valve failures,
combination of instrument failures and human errors, or single failures of
small process lines or fittings.
Low A failure or series of failures which have a very low probability of
occurrence within the expected lifetime of plant.
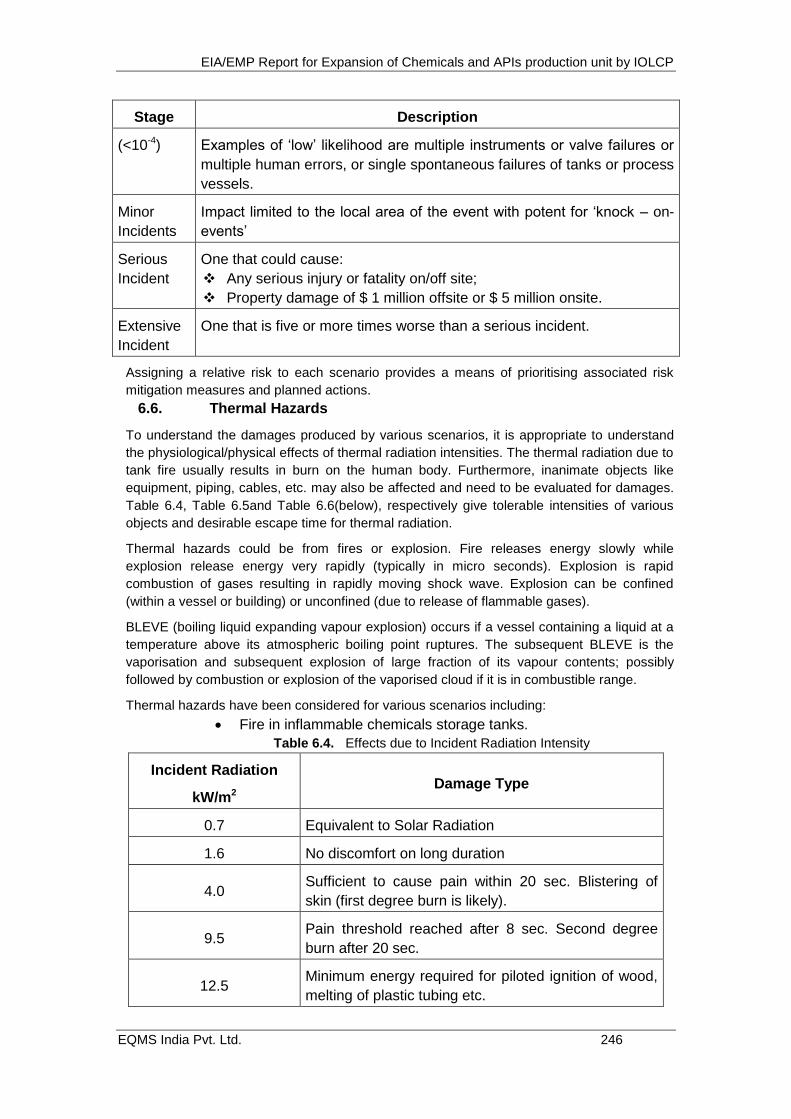
EIA/EMP Report for Expansion of Chemicals and APIs production unit by IOLCP
EQMS India Pvt. Ltd. 246
Stage Description
(<10-4) Examples of ‗low‘ likelihood are multiple instruments or valve failures or
multiple human errors, or single spontaneous failures of tanks or process
vessels.
Minor
Incidents
Impact limited to the local area of the event with potent for ‗knock – on-
events‘
Serious
Incident
One that could cause:
Any serious injury or fatality on/off site;
Property damage of $ 1 million offsite or $ 5 million onsite.
Extensive
Incident
One that is five or more times worse than a serious incident.
Assigning a relative risk to each scenario provides a means of prioritising associated risk
mitigation measures and planned actions.
6.6. Thermal Hazards
To understand the damages produced by various scenarios, it is appropriate to understand
the physiological/physical effects of thermal radiation intensities. The thermal radiation due to
tank fire usually results in burn on the human body. Furthermore, inanimate objects like
equipment, piping, cables, etc. may also be affected and need to be evaluated for damages.
Table 6.4, Table 6.5and Table 6.6(below), respectively give tolerable intensities of various
objects and desirable escape time for thermal radiation.
Thermal hazards could be from fires or explosion. Fire releases energy slowly while
explosion release energy very rapidly (typically in micro seconds). Explosion is rapid
combustion of gases resulting in rapidly moving shock wave. Explosion can be confined
(within a vessel or building) or unconfined (due to release of flammable gases).
BLEVE (boiling liquid expanding vapour explosion) occurs if a vessel containing a liquid at a
temperature above its atmospheric boiling point ruptures. The subsequent BLEVE is the
vaporisation and subsequent explosion of large fraction of its vapour contents; possibly
followed by combustion or explosion of the vaporised cloud if it is in combustible range.
Thermal hazards have been considered for various scenarios including:
Fire in inflammable chemicals storage tanks.
Table 6.4. Effects due to Incident Radiation Intensity
Incident Radiation
kW/m2 Damage Type
0.7 Equivalent to Solar Radiation
1.6 No discomfort on long duration
4.0 Sufficient to cause pain within 20 sec. Blistering of
skin (first degree burn is likely).
9.5 Pain threshold reached after 8 sec. Second degree
burn after 20 sec.
12.5 Minimum energy required for piloted ignition of wood,
melting of plastic tubing etc.
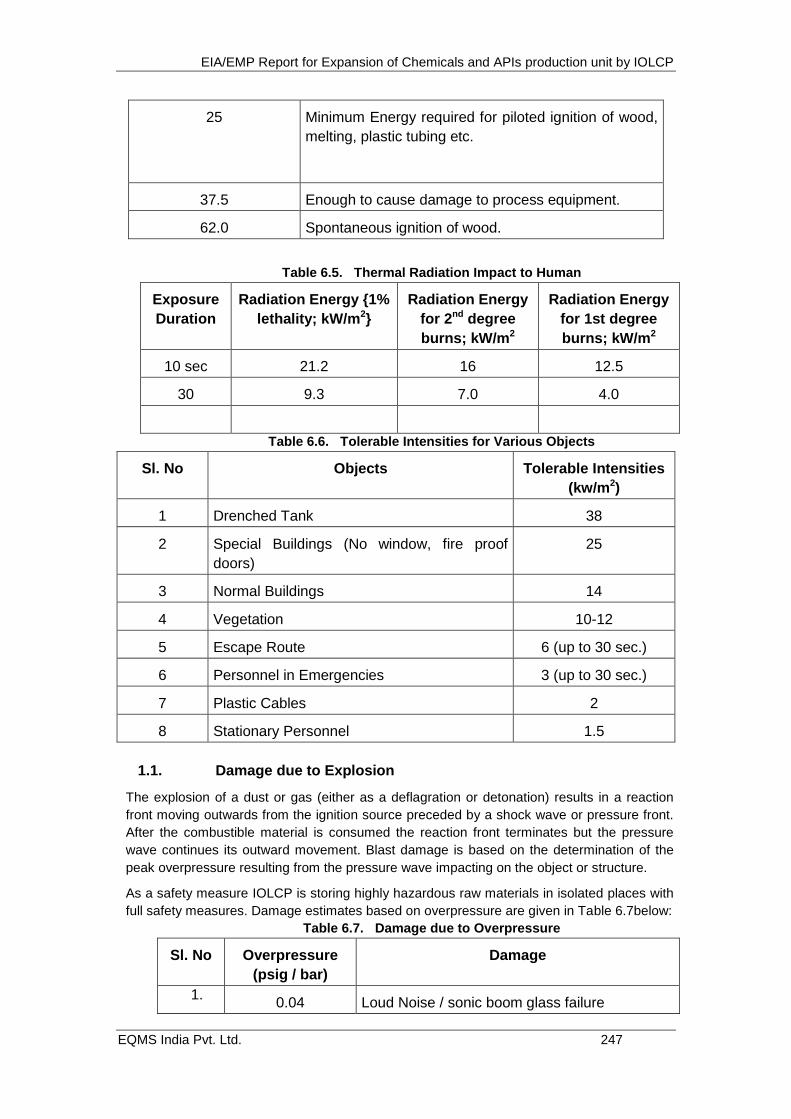
EIA/EMP Report for Expansion of Chemicals and APIs production unit by IOLCP
EQMS India Pvt. Ltd. 247
25
Minimum Energy required for piloted ignition of wood,
melting, plastic tubing etc.
37.5 Enough to cause damage to process equipment.
62.0 Spontaneous ignition of wood.
Table 6.5. Thermal Radiation Impact to Human
Exposure
Duration
Radiation Energy {1%
lethality; kW/m2}
Radiation Energy
for 2nd degree
burns; kW/m2
Radiation Energy
for 1st degree
burns; kW/m2
10 sec 21.2 16 12.5
30 9.3 7.0 4.0
Table 6.6. Tolerable Intensities for Various Objects
Sl. No Objects Tolerable Intensities
(kw/m2)
1 Drenched Tank 38
2 Special Buildings (No window, fire proof
doors)
25
3 Normal Buildings 14
4 Vegetation 10-12
5 Escape Route 6 (up to 30 sec.)
6 Personnel in Emergencies 3 (up to 30 sec.)
7 Plastic Cables 2
8 Stationary Personnel 1.5
1.1. Damage due to Explosion
The explosion of a dust or gas (either as a deflagration or detonation) results in a reaction
front moving outwards from the ignition source preceded by a shock wave or pressure front.
After the combustible material is consumed the reaction front terminates but the pressure
wave continues its outward movement. Blast damage is based on the determination of the
peak overpressure resulting from the pressure wave impacting on the object or structure.
As a safety measure IOLCP is storing highly hazardous raw materials in isolated places with
full safety measures. Damage estimates based on overpressure are given in Table 6.7below:
Table 6.7. Damage due to Overpressure
Sl. No Overpressure
(psig / bar)
Damage
1. 0.04 Loud Noise / sonic boom glass failure
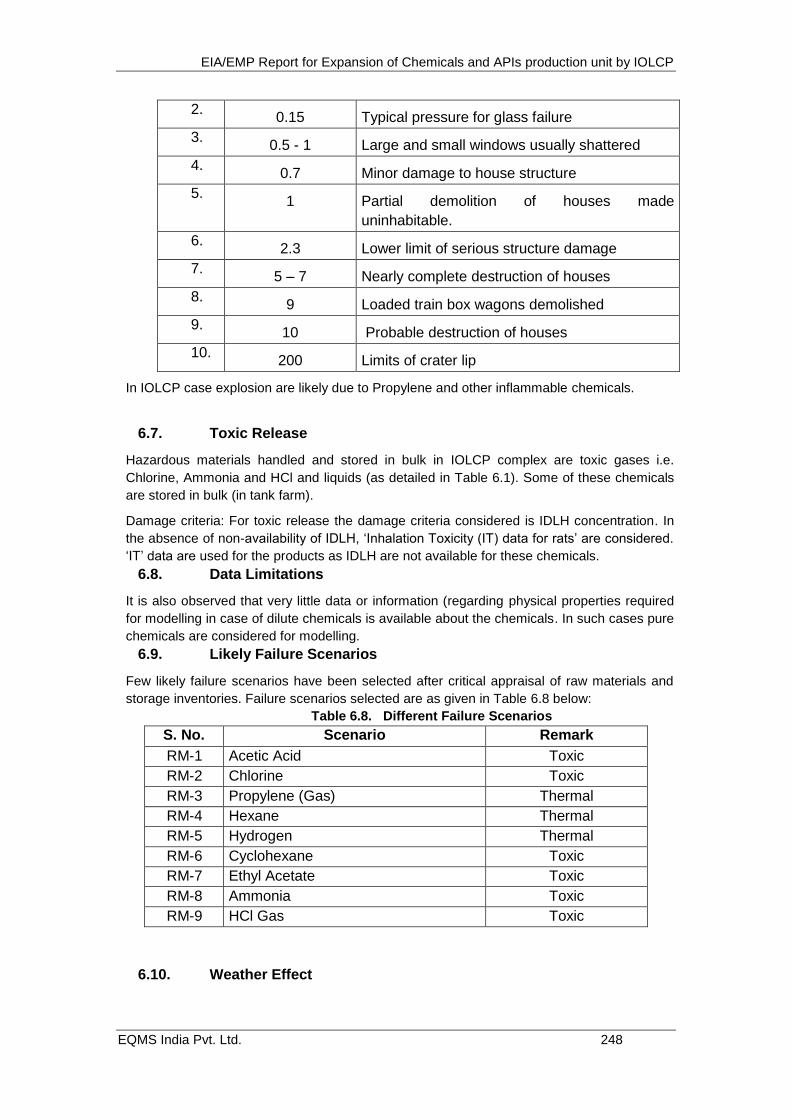
EIA/EMP Report for Expansion of Chemicals and APIs production unit by IOLCP
EQMS India Pvt. Ltd. 248
2. 0.15 Typical pressure for glass failure
3. 0.5 - 1 Large and small windows usually shattered
4. 0.7 Minor damage to house structure
5. 1 Partial demolition of houses made
uninhabitable.
6. 2.3 Lower limit of serious structure damage
7. 5 – 7 Nearly complete destruction of houses
8. 9 Loaded train box wagons demolished
9. 10 Probable destruction of houses
10. 200 Limits of crater lip
In IOLCP case explosion are likely due to Propylene and other inflammable chemicals.
6.7. Toxic Release
Hazardous materials handled and stored in bulk in IOLCP complex are toxic gases i.e.
Chlorine, Ammonia and HCl and liquids (as detailed in Table 6.1). Some of these chemicals
are stored in bulk (in tank farm).
Damage criteria: For toxic release the damage criteria considered is IDLH concentration. In
the absence of non-availability of IDLH, ‗Inhalation Toxicity (IT) data for rats‘ are considered.
‗IT‘ data are used for the products as IDLH are not available for these chemicals.
6.8. Data Limitations
It is also observed that very little data or information (regarding physical properties required
for modelling in case of dilute chemicals is available about the chemicals. In such cases pure
chemicals are considered for modelling.
6.9. Likely Failure Scenarios
Few likely failure scenarios have been selected after critical appraisal of raw materials and
storage inventories. Failure scenarios selected are as given in Table 6.8 below:
Table 6.8. Different Failure Scenarios
S. No. Scenario Remark
RM-1 Acetic Acid Toxic
RM-2 Chlorine Toxic
RM-3 Propylene (Gas) Thermal
RM-4 Hexane Thermal
RM-5 Hydrogen Thermal
RM-6 Cyclohexane Toxic
RM-7 Ethyl Acetate Toxic
RM-8 Ammonia Toxic
RM-9 HCl Gas Toxic
6.10. Weather Effect
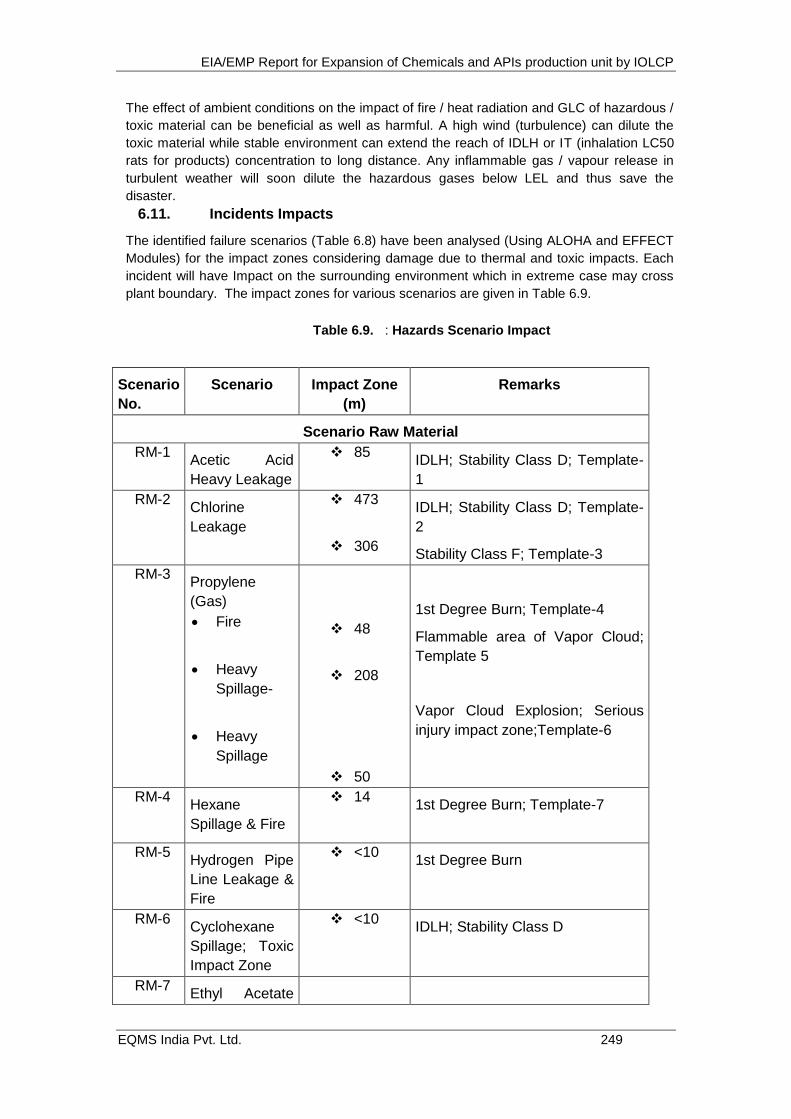
EIA/EMP Report for Expansion of Chemicals and APIs production unit by IOLCP
EQMS India Pvt. Ltd. 249
The effect of ambient conditions on the impact of fire / heat radiation and GLC of hazardous /
toxic material can be beneficial as well as harmful. A high wind (turbulence) can dilute the
toxic material while stable environment can extend the reach of IDLH or IT (inhalation LC50
rats for products) concentration to long distance. Any inflammable gas / vapour release in
turbulent weather will soon dilute the hazardous gases below LEL and thus save the
disaster.
6.11. Incidents Impacts
The identified failure scenarios (Table 6.8) have been analysed (Using ALOHA and EFFECT
Modules) for the impact zones considering damage due to thermal and toxic impacts. Each
incident will have Impact on the surrounding environment which in extreme case may cross
plant boundary. The impact zones for various scenarios are given in Table 6.9.
Table 6.9. : Hazards Scenario Impact
Scenario
No.
Scenario Impact Zone
(m)
Remarks
Scenario Raw Material
RM-1 Acetic Acid
Heavy Leakage
85 IDLH; Stability Class D; Template-
1
RM-2 Chlorine
Leakage
473
306
IDLH; Stability Class D; Template-
2
Stability Class F; Template-3
RM-3 Propylene
(Gas)
Fire
Heavy
Spillage-
Heavy
Spillage
48
208
50
1st Degree Burn; Template-4
Flammable area of Vapor Cloud;
Template 5
Vapor Cloud Explosion; Serious
injury impact zone;Template-6
RM-4 Hexane
Spillage & Fire
14 1st Degree Burn; Template-7
RM-5 Hydrogen Pipe
Line Leakage &
Fire
<10 1st Degree Burn
RM-6 Cyclohexane
Spillage; Toxic
Impact Zone
<10 IDLH; Stability Class D
RM-7 Ethyl Acetate
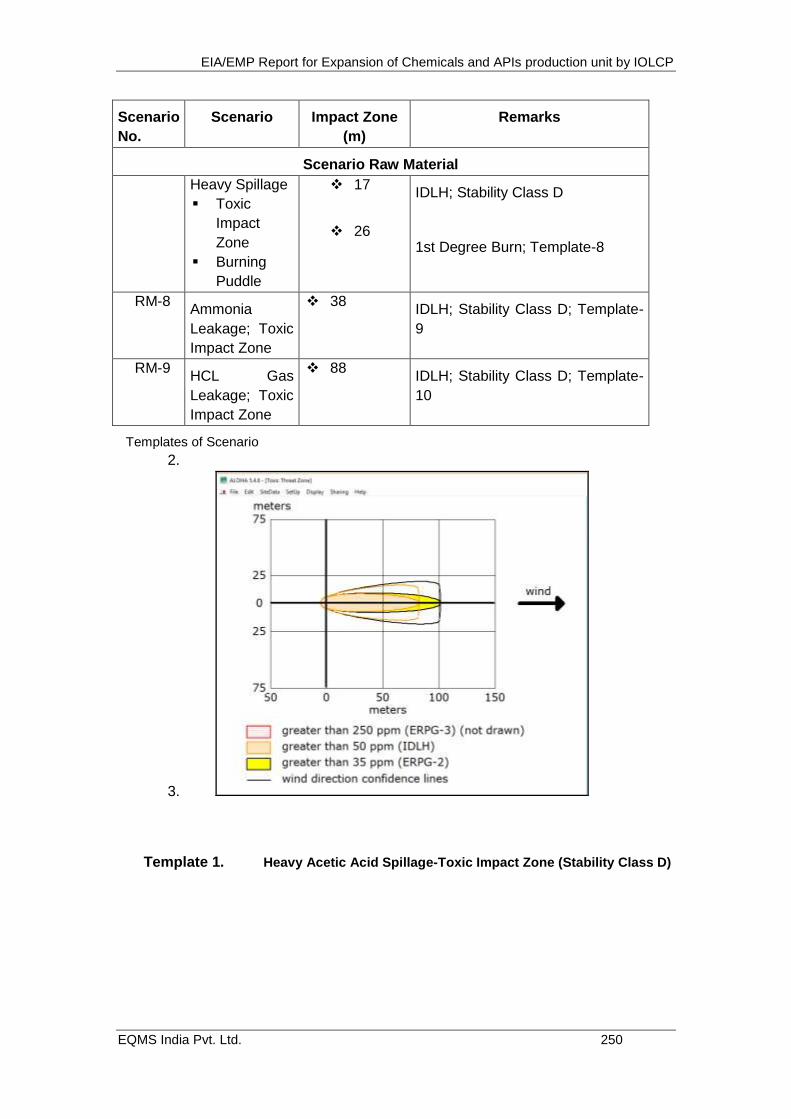
EIA/EMP Report for Expansion of Chemicals and APIs production unit by IOLCP
EQMS India Pvt. Ltd. 250
Scenario
No.
Scenario Impact Zone
(m)
Remarks
Scenario Raw Material
Heavy Spillage
Toxic
Impact
Zone
Burning
Puddle
17
26
IDLH; Stability Class D
1st Degree Burn; Template-8
RM-8 Ammonia
Leakage; Toxic
Impact Zone
38 IDLH; Stability Class D; Template-
9
RM-9 HCL Gas
Leakage; Toxic
Impact Zone
88 IDLH; Stability Class D; Template-
10
Templates of Scenario
2.
3.
Template 1. Heavy Acetic Acid Spillage-Toxic Impact Zone (Stability Class D)
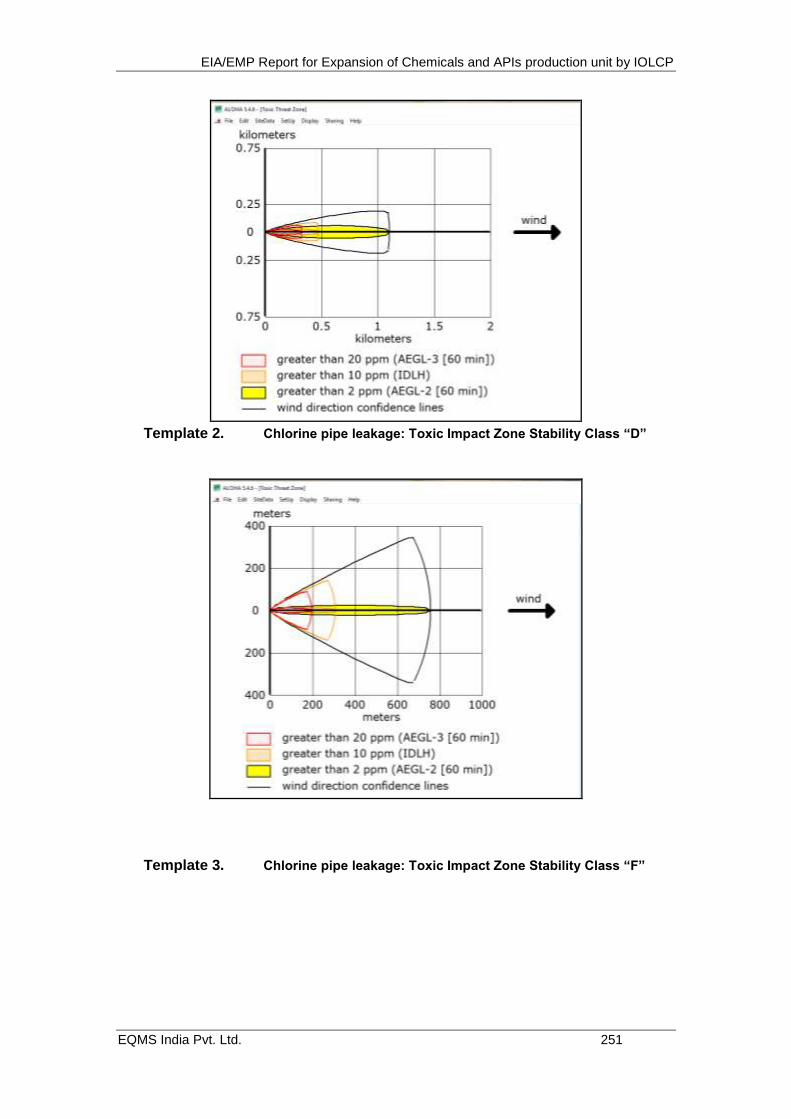
EIA/EMP Report for Expansion of Chemicals and APIs production unit by IOLCP
EQMS India Pvt. Ltd. 251
Template 2. Chlorine pipe leakage: Toxic Impact Zone Stability Class ―D‖
Template 3. Chlorine pipe leakage: Toxic Impact Zone Stability Class ―F‖
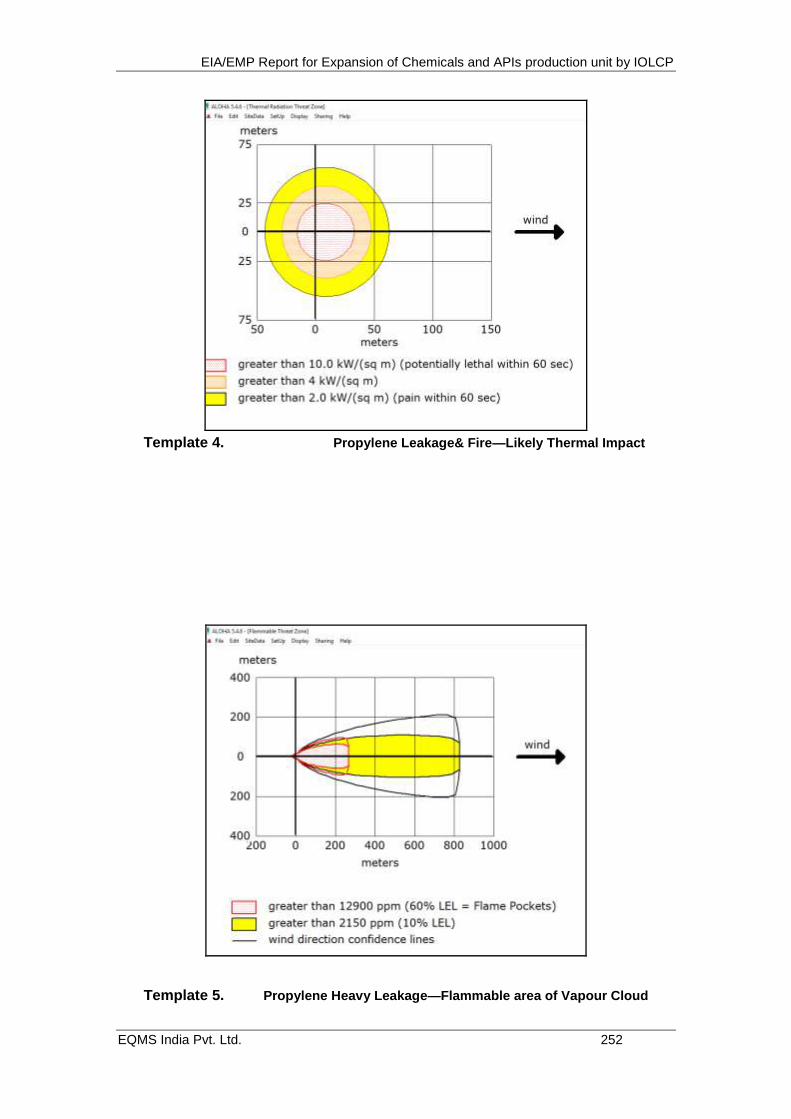
EIA/EMP Report for Expansion of Chemicals and APIs production unit by IOLCP
EQMS India Pvt. Ltd. 252
Template 4. Propylene Leakage& Fire—Likely Thermal Impact
Template 5. Propylene Heavy Leakage—Flammable area of Vapour Cloud
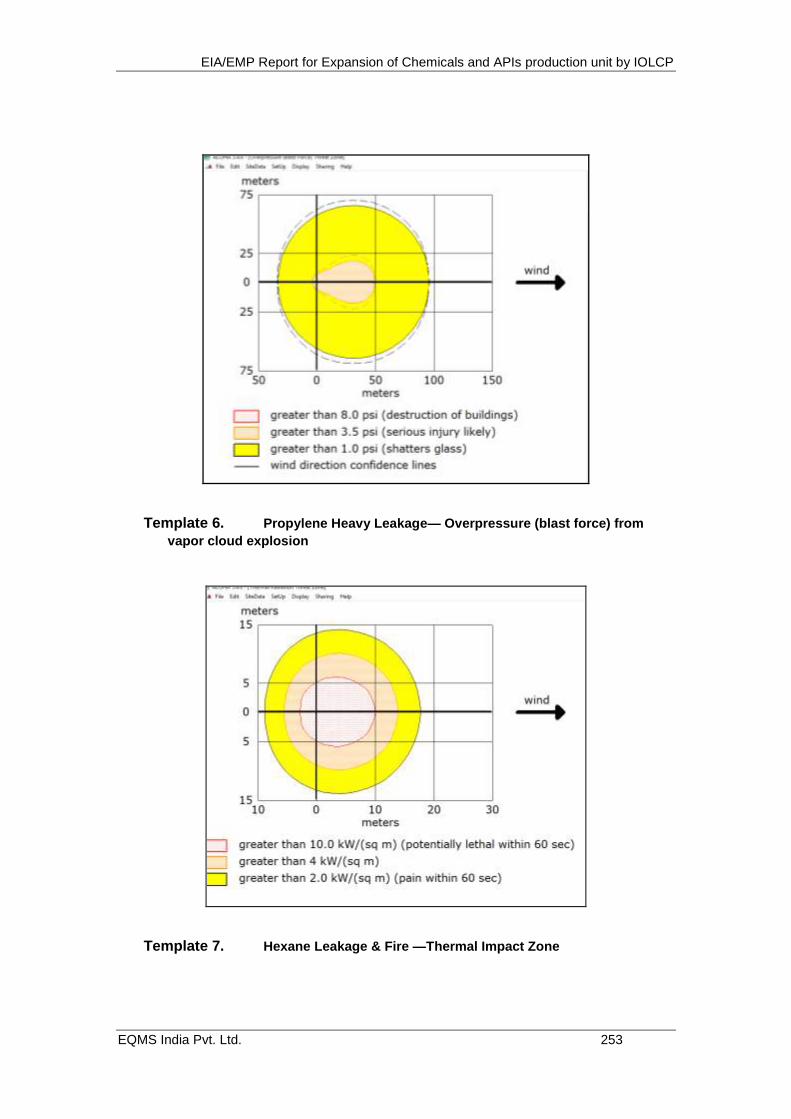
EIA/EMP Report for Expansion of Chemicals and APIs production unit by IOLCP
EQMS India Pvt. Ltd. 253
Template 6. Propylene Heavy Leakage— Overpressure (blast force) from
vapor cloud explosion
Template 7. Hexane Leakage & Fire —Thermal Impact Zone
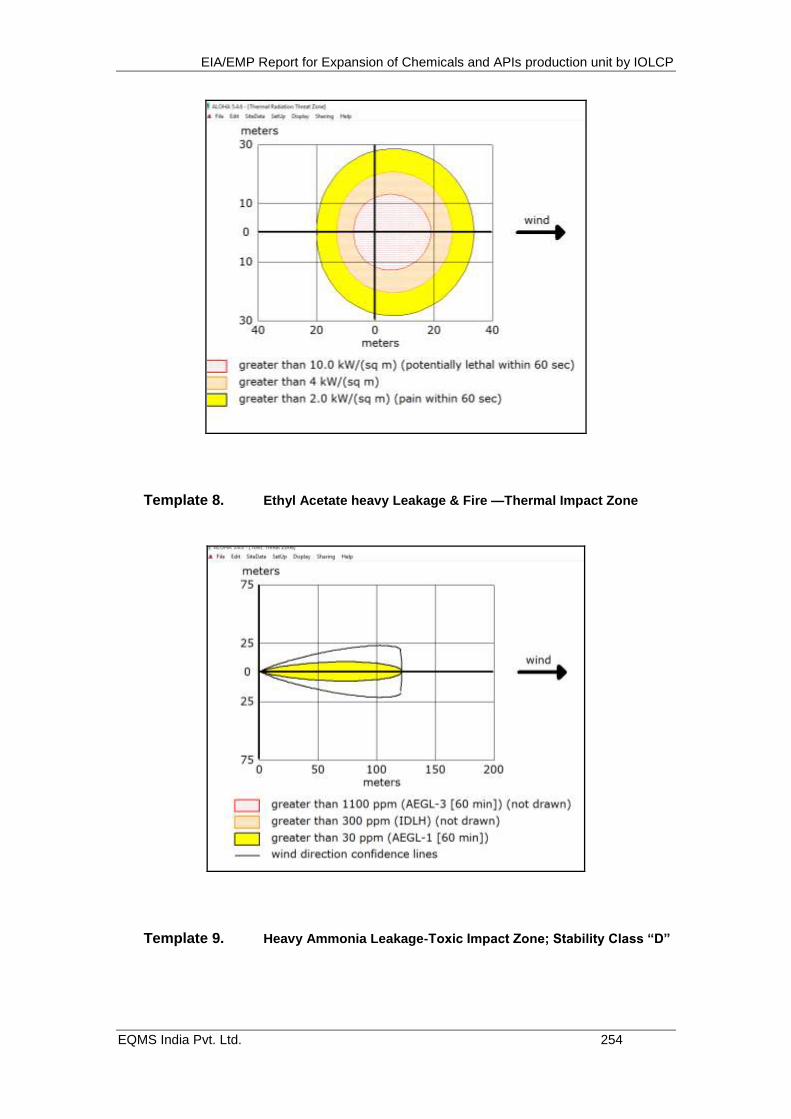
EIA/EMP Report for Expansion of Chemicals and APIs production unit by IOLCP
EQMS India Pvt. Ltd. 254
Template 8. Ethyl Acetate heavy Leakage & Fire —Thermal Impact Zone
Template 9. Heavy Ammonia Leakage-Toxic Impact Zone; Stability Class ―D‖
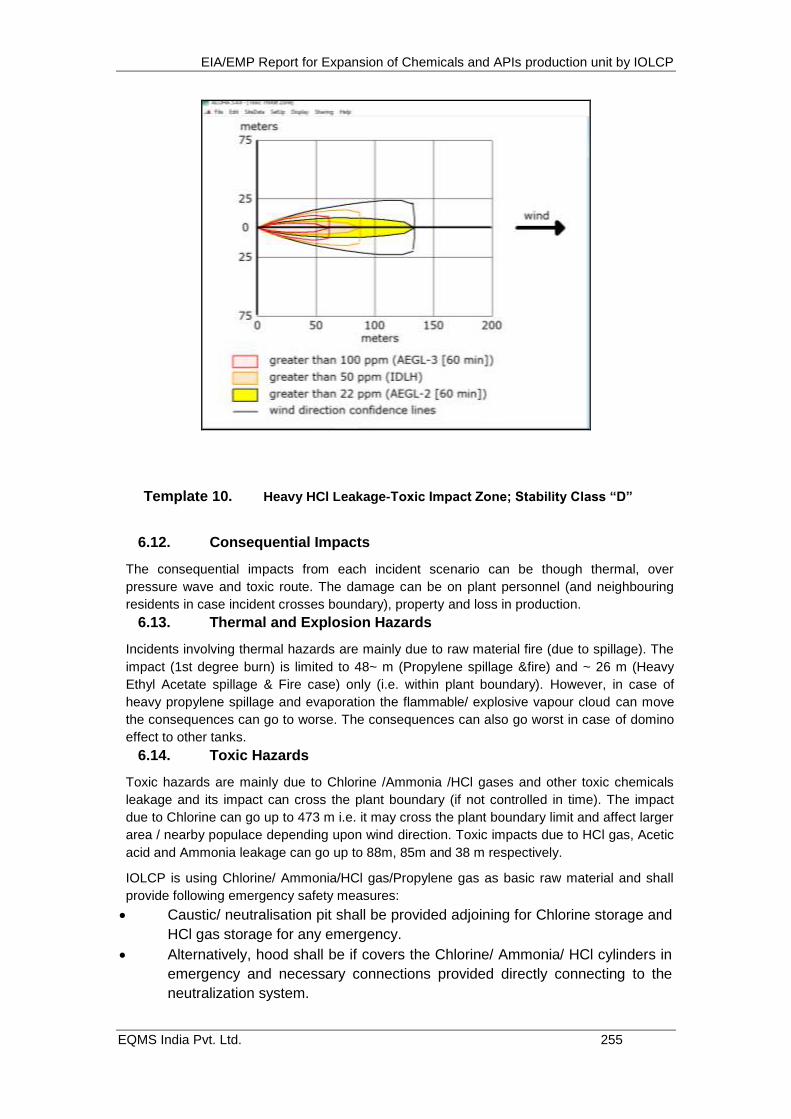
EIA/EMP Report for Expansion of Chemicals and APIs production unit by IOLCP
EQMS India Pvt. Ltd. 255
Template 10. Heavy HCl Leakage-Toxic Impact Zone; Stability Class ―D‖
6.12. Consequential Impacts
The consequential impacts from each incident scenario can be though thermal, over
pressure wave and toxic route. The damage can be on plant personnel (and neighbouring
residents in case incident crosses boundary), property and loss in production.
6.13. Thermal and Explosion Hazards
Incidents involving thermal hazards are mainly due to raw material fire (due to spillage). The
impact (1st degree burn) is limited to 48~ m (Propylene spillage &fire) and ~ 26 m (Heavy
Ethyl Acetate spillage & Fire case) only (i.e. within plant boundary). However, in case of
heavy propylene spillage and evaporation the flammable/ explosive vapour cloud can move
the consequences can go to worse. The consequences can also go worst in case of domino
effect to other tanks.
6.14. Toxic Hazards
Toxic hazards are mainly due to Chlorine /Ammonia /HCl gases and other toxic chemicals
leakage and its impact can cross the plant boundary (if not controlled in time). The impact
due to Chlorine can go up to 473 m i.e. it may cross the plant boundary limit and affect larger
area / nearby populace depending upon wind direction. Toxic impacts due to HCl gas, Acetic
acid and Ammonia leakage can go up to 88m, 85m and 38 m respectively.
IOLCP is using Chlorine/ Ammonia/HCl gas/Propylene gas as basic raw material and shall
provide following emergency safety measures:
Caustic/ neutralisation pit shall be provided adjoining for Chlorine storage and
HCl gas storage for any emergency.
Alternatively, hood shall be if covers the Chlorine/ Ammonia/ HCl cylinders in
emergency and necessary connections provided directly connecting to the
neutralization system.
EIA/EMP Report for Expansion of Chemicals and APIs production unit by IOLCP
EQMS India Pvt. Ltd. 256
Spray more quantity of water /fog to suppress the air born vapours or to avoid
the formation of vapor cloud of ammonia gas, because ammonia vapor cloud
may explode vigorously at its LEL and convert in to flash fire.
Emergency kit and two sets of breathing apparatus provided to meet any
emergency.
4. Water sprinkler system provided for propylene gas bullet to handle any
leakage.
6.15. Other Hazards
The other hazards in the plant include (but not limited to):
Other toxic hazards due to acids / other toxic spillages (mainly limited to
spillage area only.).
Mechanical hazards due to machines / equipment.
Hazards due to individual soft spots like walking casually and noticing a pit
and falling or colliding/ stumbling or slipping (not noticing a wet place etc.).
6.16. Other Toxic Hazards
Other hazardous chemicals including products their impact will be limited to spillage area.
The acid spillage if comes in contact with metal parts will produce hydrogen which is highly
flammable gas. Any person moving in area and getting splash will get the injury. In addition,
the spillage will cause pollution problem. The spillage is to be collected and neutralized for
toxic contents before disposal.
6.17. General Control Measures
Since some of the substances in use at IOLCP are hazardous with fire potential and also
toxic in nature, it is necessary to use appropriate control measures recommended for such
substances:
6.18. Flammable Gas Fires
Fire control generally consists of directing, diluting and dispersing the inflammable gas/vapor
to prevent contact with persons, to prevent it from infiltrating structures if the leak is out door,
and to avoid its contact with ignition sources while, if possible, simultaneously stopping the
flow of gas. Water in the form of spray, applied from hoses or monitor nozzles or by fixed
water spray system cools the burning vapours / gas.
6.19. Process Safety System to be Developed at IOLCP
Process & Plant Safety:
Conducting Preliminary Safety Analysis (A1), Basic Safety Review (A2), Detailed Safety
Review (A3), Pre-Start-Up Safety Review (A4) & Pre Start-Up Safety audit according to PPS
(Process & Plant Safety) directive (details mentioned in following flow diagram)
Every change in the process, procedure, equipment, etc. will be done through robust
management of change (MOC) procedure
Pre-Start up Safety Reviews for all modification
Pressure testing of pipelines and replacement of fragile pipelines and tanks by
prevention project
Hazardous area classification
Internal safety rounds for P&PS
Control P&IDs, and Lock opened (LO)/ Lock closed (LC) procedures are in place
TOPPS (Top Performance in Process & Plant Safety) training to all employees
Root Cause Analysis of all incidents
EIA/EMP Report for Expansion of Chemicals and APIs production unit by IOLCP
EQMS India Pvt. Ltd. 257
Pre-Start up Safety Reviews for all modification
Occupational Safety:
Permit to Work procedure and Monthly monitoring of all filled permit for continual
improvement
Mobilized Near- Miss Reporting and award scheme
HSE rounds: PMT (Plant Management Team) of one plant takes HSE round of
another plant. Exchange of best practices among plants
MSDS Management
Tool Box talk with contractors
Central Safety Committee
Departmental Safety Committees
HSE Coordinator and Monitor program: Shop floor employees‘ participation in Safety
activities
Celebration of theme-based Safety days/ weeks at site
Safety Induction program for new joiners (both company & contract employees)
Emergency Preparedness:
On-Site Emergency Plan for the site
Training on On-Site Emergency Action Plan
Regular Site level Mock drills and Plant specific Fire Drills and Leak, spill drills
Availability of First aiders, Fire Fighters and Rescue members in each shift
Maintenance of Fire hydrant system, sprinkler system and portable fire extinguishers
Periodic testing of fire hydrant and sprinkler systems
Three Fire Tenders and Two Ambulances
Occupational Health:
Pre-employment & Annual Medical Examination
Quarterly/Periodical Physical Examinations
Canteen Employees Examination
Fork lift operators Examination
Recall services & Follow-Up
Return to work assessment
Exit Examination
Training on Counselling, Hearing Conservation Program, Hazardous Chemical
Awareness Program, Shop floor training, First-aid (138Nos. Certified First Aiders),
etc.
Legal records: All medical records of employees to be maintained.
Emergency Medical services: Ambulance services, First-aid boxes, Decontamination
facility etc.
Health Promotional Activities: Awareness on Medical issues, Ergonomics awareness
programs, Stress management, De-addiction program, etc.
6.20. Safety System for Toxic Material Handling
Following precaution Taken while handling Toxic materials
Highly Toxic chemical is stored in storage room with lock and key.
Inventory records are maintained.
Toxic material is stored in well ventilation and out of sunlight
It is stored away from incompatible chemicals.
Keeping containers tightly & securely closed when not in use
Toxic chemical charging is done inside the closed room in presence of shift in-charge.
EIA/EMP Report for Expansion of Chemicals and APIs production unit by IOLCP
EQMS India Pvt. Ltd. 258
Local Ventilation system is provided to avoid exposure at work place.
Vent gas is passing through scrubber system for absorption & reduction of pollution.
Standby pump provision is available for LEV & scrubber system.
Decontamination facility is provided
Safety PPE‘s is providing during charging.
Breathing air provision is provided at toxic chemical handling area.
Training to employees is providing for manual handling of toxic chemicals.
First aid training also provided to concern employees.
Antitoxic kit is maintaining inside OHC.
First aid kit provision is available at work place area.
Eye wash/Safety shower stations are readily available nearby and are tested
regularly
To avoid fire and explosion nitrogen blanketing, earthing & bonding, electrical flame
proof equipment‘s, pressure rated equipment‘ are provided.
Suitable fire extinguisher and spill cleanup equipment are maintained.
Dyke provision is available where liquid toxic chemicals are stored.
Appropriate spill control equipment and procedures is available.
MSDS is maintained inside the concern plant / department.
Precautionary placard is displayed nearby the work place.
Toxic chemicals sign board is displayed on container.
Avoiding any welding, cutting, soldering or other hot work on an empty container of
toxic chemicals.
Good housekeeping is maintaining.
Toxic gas detector also provided at workplace.
Toxic chemical waste is collecting in separate pit and transferring to ETP for its
treatment.
Always ensuring that the waste container used is compatible with the waste material
Ensuring that the waste container is properly and accurately labelled.
Unauthorized person entry is restricted.
Restricted for eating, drinking & smoking at work place.
Employees are trained for emergency of toxic chemicals.
Toxic chemical spill, leak drills are conducting for awareness, preparedness &
response during an emergency.
Work place area monitoring is to be carried out for ensuring exposure at workplace.
Process is performed in closed conditions.
Regular pressure testing for pipelines and equipment to ensure tightness
6.21. WORKPLACE MONITORING PLAN
Work zone monitoring is carried out by HSE department every month for gaseous
pollutants and dusts. Records are to be kept in standard Form as per Factories Rules.
Location for samplings shall be identified. Samples are analyzed for Air borne
concentration of hazardous chemicals in ppm.
The analyzed results are compared with the threshold limit values (TLV) of
international organizations. The monitoring program is based on the Action level
Concentration (ALC) which is 50% of the TLV. If the analyzed concentration is < ALC,
no regular monitoring is required, only occasional checks (once in a year) to ensure
the acceptability of the system.
If the analyzed concentration is > ALC < TLV then the monitoring is carried out at
regular interval (once in two months). Incase analyzed concentration is > TLV then
EIA/EMP Report for Expansion of Chemicals and APIs production unit by IOLCP
EQMS India Pvt. Ltd. 259
corrective actions are decided by Plant Manager, General Manager - works and
Engineering Manager and they are implemented. After implementation again,
monitoring is carried out.
The sampling for gaseous pollutants and air pollutants are done by Air sampling
pump. A sample report of work area monitoring is attached as Annexure V.
6.22. Arrangement for ensuring health and safety of workers engaged
in handling of toxic materials
All persons working in manufacturing units are surveyed by regular medical
examinations.
Pre-employment Medical examination to be carried out for all employees prior to
employment at well-known multispecialty hospital.
Checkups & tests carried out as per Factory rules / SPCB guidelines.
6.23. Safety Recommendations
6.23.1. Commonly Recommended Control Measures
A number of preventive control measures for hazardous occurrences have been analysed
and discussed above. Some more salient points are enumerated below:
All storage tanks in the tank farm should be dyke. Other operation and
maintenance features shall be based on established best safety
practices.
Concentration detectors for hazardous chemical vapors (e.g.
Chlorine/Ammonia/HCl/VOC and other chemicals etc.) fire Smoke /
heat detectors and fire alarm should be installed at all strategic
locations in the plant.
A schedule for preventive maintenance including health survey of all
plant equipment should be adhered to as far as possible.
Ensure the absence of ignition sources in storage area.
Ensure placement of firefighting facilities, such as, carbon dioxide, dry
chemical powder and foam type fire extinguishers in addition to fire
hydrant system, at strategic locations. Spill control measures, such as,
removal of all ignition sources from the spill area and ventilating the
area as well as soaking the spilled material with paper, towel or mud
and letting the volatile substance evaporate slowly in a safe area.
Compulsory use of protective clothing, non-sparking tools and warning
signs during critical operations and maintenance.
Training / refresher courses on safety information‘s / norms.
Eyewash and showers should be put up at strategic places for use
during emergencies.
A group of plant personnel should be trained in first aid, rescue, firefighting and emergency
control measures (IOLCP has trained team of Fire fighters, Rescue Team, First Aid trained
team). These personnel will form core group/emergency squad who will fight the emergency
and act as rescue and first aid team.
EIA/EMP Report for Expansion of Chemicals and APIs production unit by IOLCP
EQMS India Pvt. Ltd. 260
To ensure communication from isolated places/locations Walkie-Talkie be made available to
persons working in these areas. This will considerably improve the effectiveness of
emergency management.
There is no substitute for training-mock drills and these must be held at regular interval
keeping the following objectives in mind:
Real time mock-drill should be carried out for probable/likely hazardous situation (after the
plant is successfully commissioned).
Target to be set up for various tasks and events during an emergency.
Weak links should be marked, and corrective action taken to improve effectiveness during
emergency.
IOLCP team already understand the implication and hazards in Chemical & Pharmaceutical
industry and has implemented most of the measures in the existing plant.
6.23.2. Occupational Health and Safety
Occupational Health and Safety (OHS) are of prime importance more so in hazardous
industries. Industries have various types of hazards and QRA is carried out to understand the
hazards potential from various incidents. Pre-emptive steps can be planned to safeguard
from likely causes. Some of the
Frequent causes of accidents
Fire and explosion: explosives, flammable material
Hazards from Toxic Materials
Mechanical Hazards such as:
Being struck by falling objects
Caught in between machine parts
Snapping of cables, ropes, chains, slings
Handling heavy objects
Electricity Hazards
o Electrocution
o Short circuits and consequential fire.
o Poor illumination etc.
Other Hazards:
Falls from height inside industrial units or on the ground
Struck by moving objects; Slipping on wet surfaces
Sharp objects
Oxygen deficiency in confined spaces; Lack of personal protective equipment (PPE),
housekeeping practices, safety signs
Consequential hazards due to extreme Temperatures;
Consequential hazards due to vibration
Consequential hazards due to radiation;
Many more hazards.
Hazardous substances and wastes
Heavy and toxic metals
Lack of hazard communication (storage, labeling, material safety data
sheets)
Batteries, fire-fighting liquids
Welding fumes
EIA/EMP Report for Expansion of Chemicals and APIs production unit by IOLCP
EQMS India Pvt. Ltd. 261
Volatile organic compounds (solvents)
Inhalation in confined and enclosed spaces
Ergonomic and psychosocial hazards
Many of the hazards are as result of working environment.
Repetitive strain injuries, awkward postures, repetitive and monotonous work,
excessive workload
Long working hours, shift work, night work, temporary employment (Long
working hours, shift work, night work, temporary employment, Mental stress,
human relations) which results in less attention at work place and
consequential incidents and accidents.
Lack of education and training / awareness is another prime cause of
accidents.
Considering above, QRA analysis and the nature of activities at IOLCP the following
steps for OHS activities have been suggested:
Response to Injuries: Based on a survey of possible injuries, a procedure for response to
injuries or exposure to hazardous substances should be established. All staff should have
minimum training to such response and the procedure ought to include the following:
Immediate first aid, such as eye splashing, cleansing of wounds and skin, and
Bandage etc.
Immediate reporting to a responsible designated person
If possible, retention of the item and details of its source for identification of possible
hazards.
Medical surveillance
Recording of the incident
Investigation, determination and implementation of remedial action
6.23.3. Transportation:
Class A petroleum products (equivalent raw materials) will be received through road
tanker and stored in underground storage tank as per petroleum Act & Rules.
Road tanker unloading procedure will be in place and will be implemented for safe
unloading of road tanker.
Static earthing provision will be made for tanker unloading.
Earthed Flexible Steel hose will be used for solvent unloading from the road tanker.
Fixed pipelines with pumps will be provided for solvent transfer up to Day
tanks/reactors.
Double mechanical seal type pumps will be installed.
NRV provision will be made on all pump discharge line.
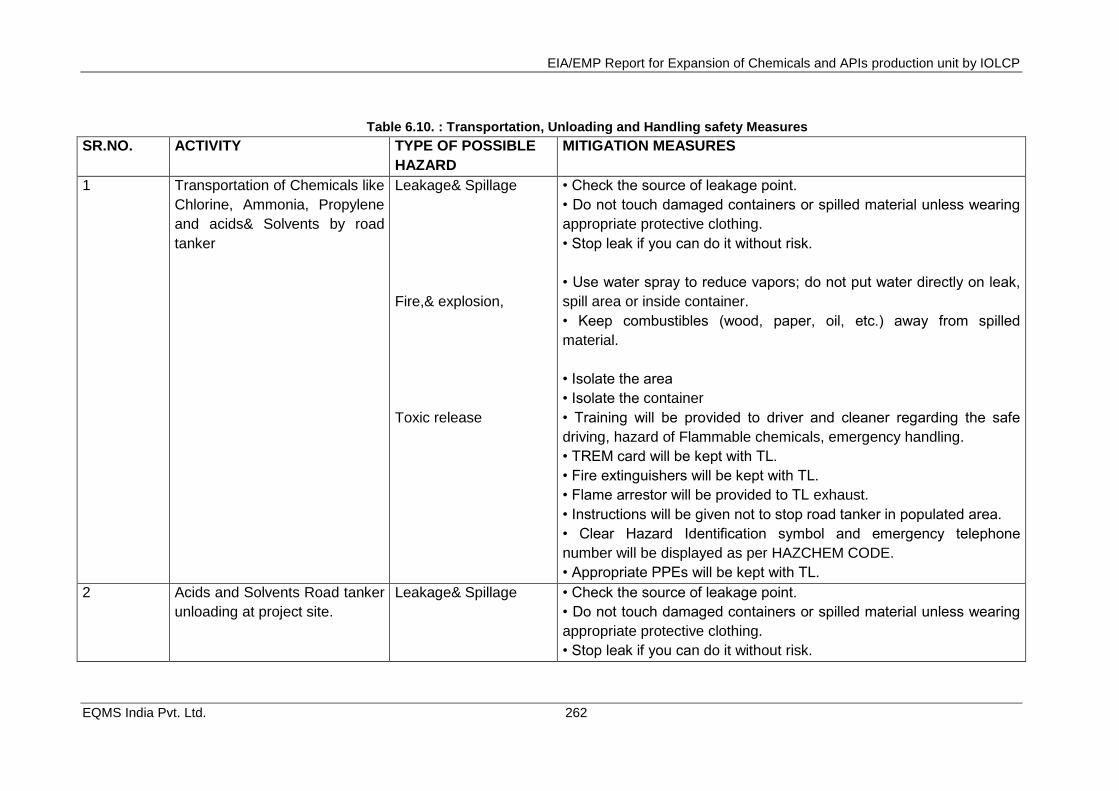
EIA/EMP Report for Expansion of Chemicals and APIs production unit by IOLCP
EQMS India Pvt. Ltd. 262
Table 6.10. : Transportation, Unloading and Handling safety Measures
SR.NO. ACTIVITY TYPE OF POSSIBLE
HAZARD
MITIGATION MEASURES
1 Transportation of Chemicals like
Chlorine, Ammonia, Propylene
and acids& Solvents by road
tanker
Leakage& Spillage
Fire,& explosion,
Toxic release
• Check the source of leakage point.
• Do not touch damaged containers or spilled material unless wearing
appropriate protective clothing.
• Stop leak if you can do it without risk.
• Use water spray to reduce vapors; do not put water directly on leak,
spill area or inside container.
• Keep combustibles (wood, paper, oil, etc.) away from spilled
material.
• Isolate the area
• Isolate the container
• Training will be provided to driver and cleaner regarding the safe
driving, hazard of Flammable chemicals, emergency handling.
• TREM card will be kept with TL.
• Fire extinguishers will be kept with TL.
• Flame arrestor will be provided to TL exhaust.
• Instructions will be given not to stop road tanker in populated area.
• Clear Hazard Identification symbol and emergency telephone
number will be displayed as per HAZCHEM CODE.
• Appropriate PPEs will be kept with TL.
2 Acids and Solvents Road tanker
unloading at project site.
Leakage& Spillage
• Check the source of leakage point.
• Do not touch damaged containers or spilled material unless wearing
appropriate protective clothing.
• Stop leak if you can do it without risk.
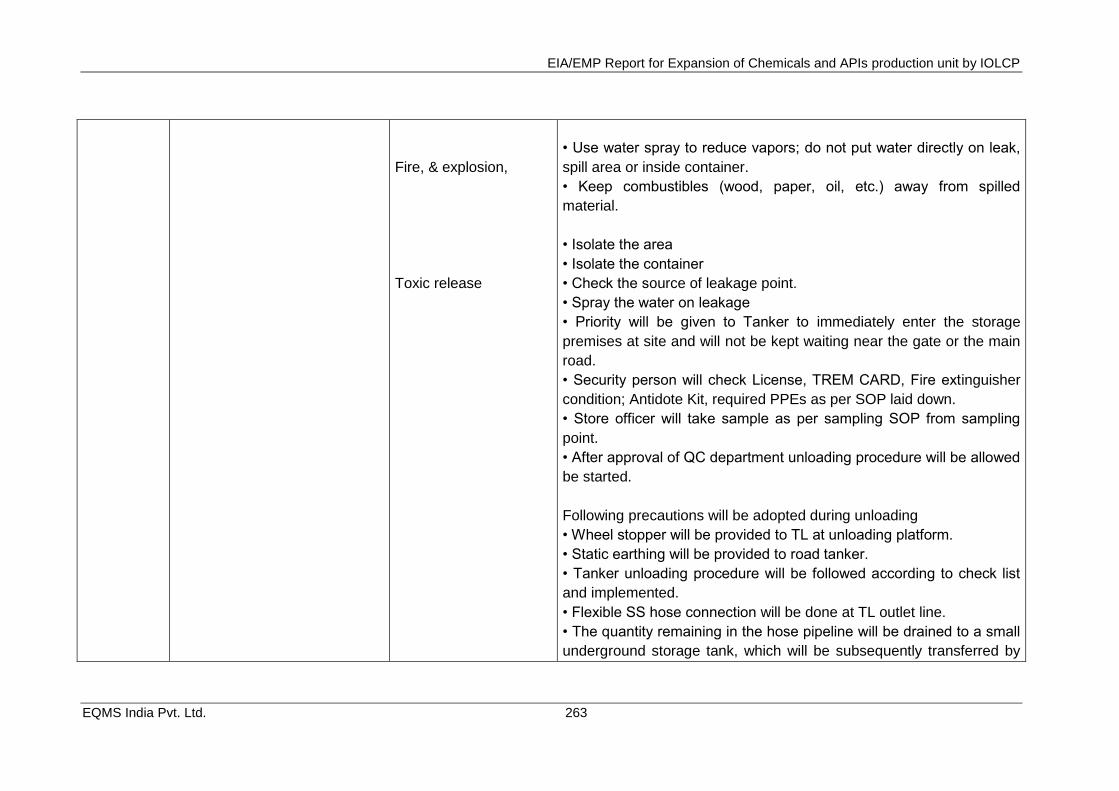
EIA/EMP Report for Expansion of Chemicals and APIs production unit by IOLCP
EQMS India Pvt. Ltd. 263
Fire, & explosion,
Toxic release
• Use water spray to reduce vapors; do not put water directly on leak,
spill area or inside container.
• Keep combustibles (wood, paper, oil, etc.) away from spilled
material.
• Isolate the area
• Isolate the container
• Check the source of leakage point.
• Spray the water on leakage
• Priority will be given to Tanker to immediately enter the storage
premises at site and will not be kept waiting near the gate or the main
road.
• Security person will check License, TREM CARD, Fire extinguisher
condition; Antidote Kit, required PPEs as per SOP laid down.
• Store officer will take sample as per sampling SOP from sampling
point.
• After approval of QC department unloading procedure will be allowed
be started.
Following precautions will be adopted during unloading
• Wheel stopper will be provided to TL at unloading platform.
• Static earthing will be provided to road tanker.
• Tanker unloading procedure will be followed according to check list
and implemented.
• Flexible SS hose connection will be done at TL outlet line.
• The quantity remaining in the hose pipeline will be drained to a small
underground storage tank, which will be subsequently transferred by
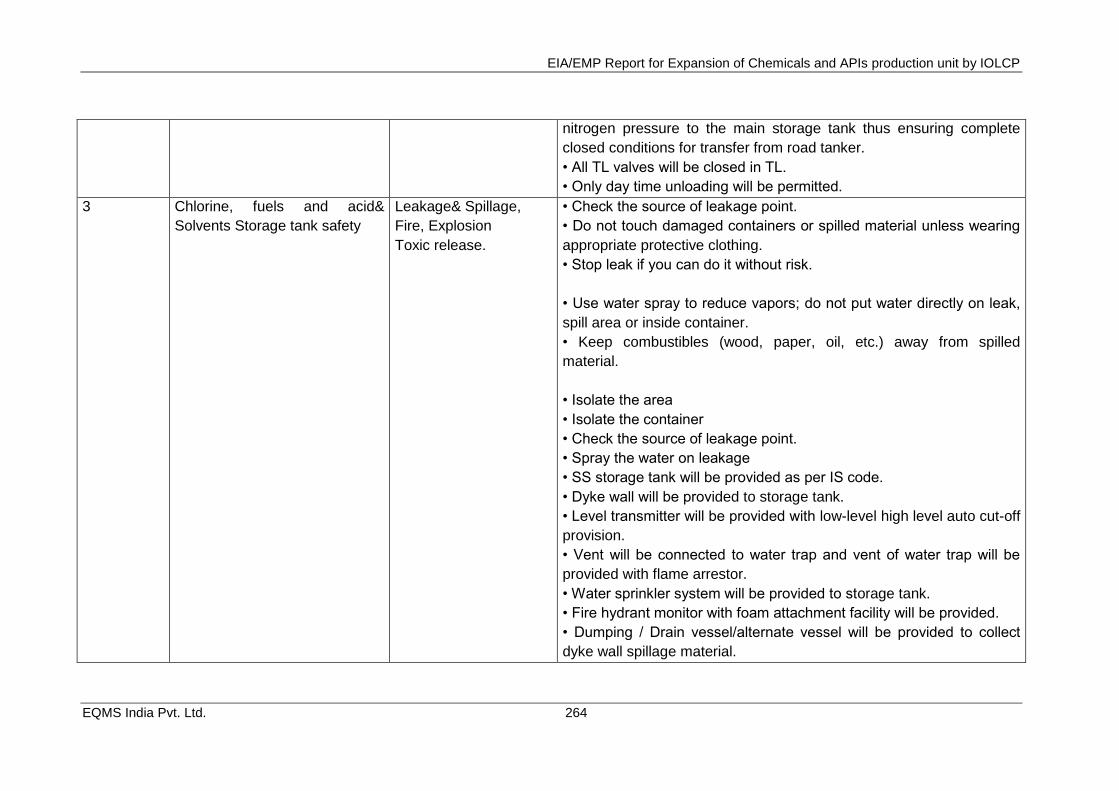
EIA/EMP Report for Expansion of Chemicals and APIs production unit by IOLCP
EQMS India Pvt. Ltd. 264
nitrogen pressure to the main storage tank thus ensuring complete
closed conditions for transfer from road tanker.
• All TL valves will be closed in TL.
• Only day time unloading will be permitted.
3 Chlorine, fuels and acid&
Solvents Storage tank safety
Leakage& Spillage,
Fire, Explosion
Toxic release.
• Check the source of leakage point.
• Do not touch damaged containers or spilled material unless wearing
appropriate protective clothing.
• Stop leak if you can do it without risk.
• Use water spray to reduce vapors; do not put water directly on leak,
spill area or inside container.
• Keep combustibles (wood, paper, oil, etc.) away from spilled
material.
• Isolate the area
• Isolate the container
• Check the source of leakage point.
• Spray the water on leakage
• SS storage tank will be provided as per IS code.
• Dyke wall will be provided to storage tank.
• Level transmitter will be provided with low-level high level auto cut-off
provision.
• Vent will be connected to water trap and vent of water trap will be
provided with flame arrestor.
• Water sprinkler system will be provided to storage tank.
• Fire hydrant monitor with foam attachment facility will be provided.
• Dumping / Drain vessel/alternate vessel will be provided to collect
dyke wall spillage material.
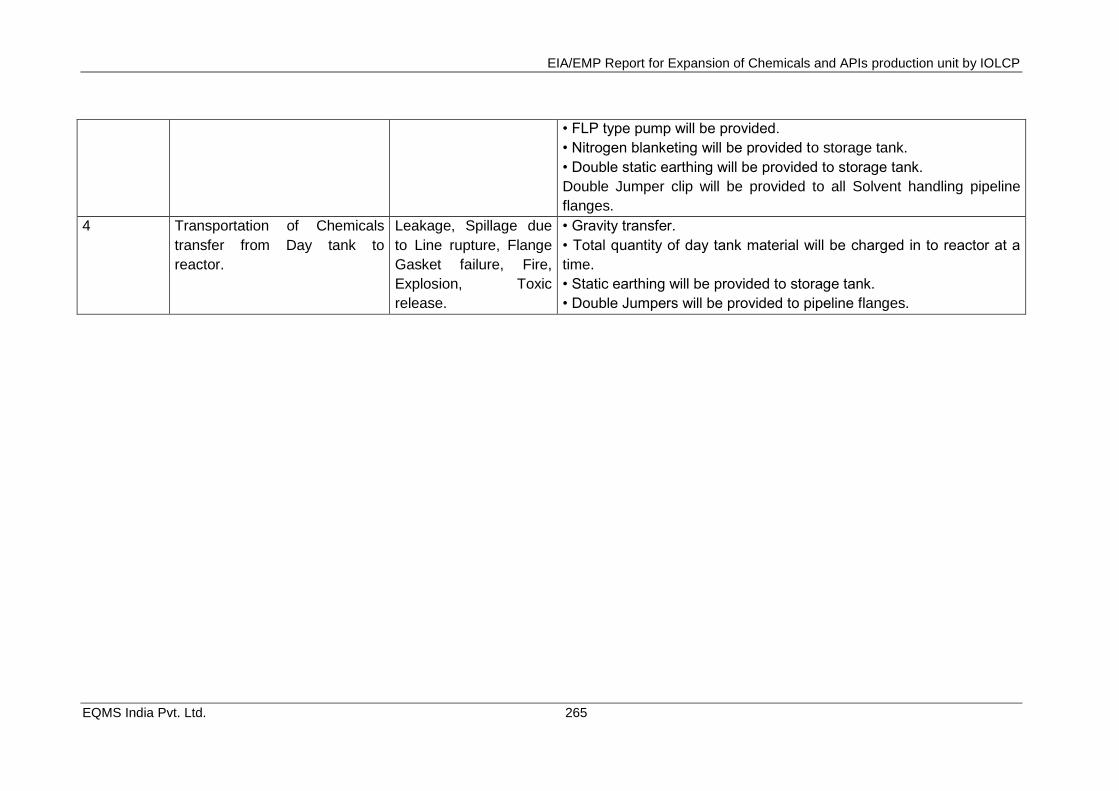
EIA/EMP Report for Expansion of Chemicals and APIs production unit by IOLCP
EQMS India Pvt. Ltd. 265
• FLP type pump will be provided.
• Nitrogen blanketing will be provided to storage tank.
• Double static earthing will be provided to storage tank.
Double Jumper clip will be provided to all Solvent handling pipeline
flanges.
4 Transportation of Chemicals
transfer from Day tank to
reactor.
Leakage, Spillage due
to Line rupture, Flange
Gasket failure, Fire,
Explosion, Toxic
release.
• Gravity transfer.
• Total quantity of day tank material will be charged in to reactor at a
time.
• Static earthing will be provided to storage tank.
• Double Jumpers will be provided to pipeline flanges.
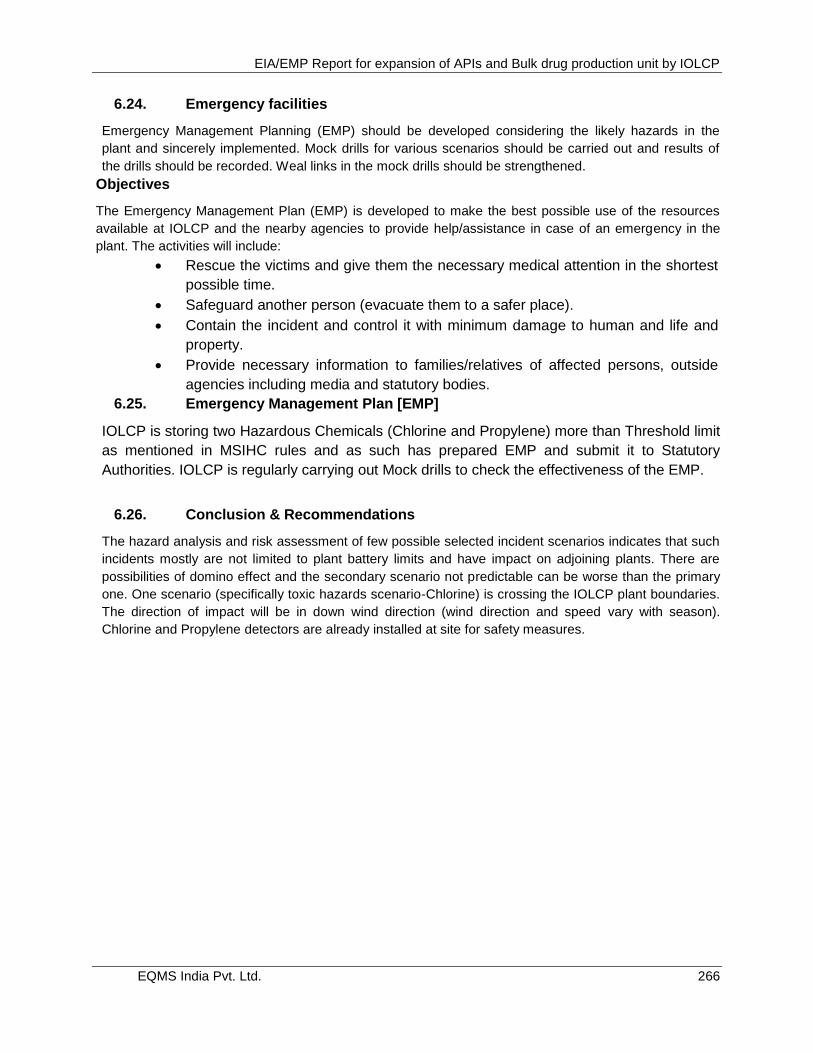
EIA/EMP Report for expansion of APIs and Bulk drug production unit by IOLCP
EQMS India Pvt. Ltd. 266
6.24. Emergency facilities
Emergency Management Planning (EMP) should be developed considering the likely hazards in the
plant and sincerely implemented. Mock drills for various scenarios should be carried out and results of
the drills should be recorded. Weal links in the mock drills should be strengthened.
Objectives
The Emergency Management Plan (EMP) is developed to make the best possible use of the resources
available at IOLCP and the nearby agencies to provide help/assistance in case of an emergency in the
plant. The activities will include:
Rescue the victims and give them the necessary medical attention in the shortest
possible time.
Safeguard another person (evacuate them to a safer place).
Contain the incident and control it with minimum damage to human and life and
property.
Provide necessary information to families/relatives of affected persons, outside
agencies including media and statutory bodies.
6.25. Emergency Management Plan [EMP]
IOLCP is storing two Hazardous Chemicals (Chlorine and Propylene) more than Threshold limit
as mentioned in MSIHC rules and as such has prepared EMP and submit it to Statutory
Authorities. IOLCP is regularly carrying out Mock drills to check the effectiveness of the EMP.
6.26. Conclusion & Recommendations
The hazard analysis and risk assessment of few possible selected incident scenarios indicates that such
incidents mostly are not limited to plant battery limits and have impact on adjoining plants. There are
possibilities of domino effect and the secondary scenario not predictable can be worse than the primary
one. One scenario (specifically toxic hazards scenario-Chlorine) is crossing the IOLCP plant boundaries.
The direction of impact will be in down wind direction (wind direction and speed vary with season).
Chlorine and Propylene detectors are already installed at site for safety measures.
EIA/EMP Report for expansion of APIs and Bulk drug production unit by IOLCP
EQMS India Pvt. Ltd. 267
CHAPTER 7. SUMMARY AND CONCLUSION
M/s IOL Chemicals & Pharmaceuticals Limited (IOLCP) is based at Village Fatehgarh Channa
on Mansa Road, Tehsil & District Barnala Punjab. It is spread over 62 acres.
IOLCP is proposing for expansion of existing unit by addition some new products and increasing
the capacity of existing product. Hence applied in MOEF&CC and received TOR on 1th June
2018 (Letter No. J-11011/976/2008-IA-II(I)) for proposes expansion of existing products and
addition of new products from the capacity of 543.45 TPD to 671.95 TPD at its existing location
(Village Fatehgarh Channa, Mansa Road District Barnala – 148101, Punjab) The total
investment is ~ Rs 205 crores. The capital investment towards environment management is
estimated to be Rs.690 lacs and recurring cost will be Rs. 483 lacs.
Connectivity:
The proposed site is at about 1.45km, SE from village Fatehgarh Channa, State Highway 13 is
at a distance of .81 km NW in Direction. Nearest Railway station is Barnala railway station 8.69
km from the project site and Chandigarh airport is approx. 130 km away in NE direction from
project site (aerial distance). No National Parks, Wildlife Sanctuaries, Tiger/ Elephant Reserves,
Wildlife Corridors etc. falls within 10 km radius from the plant site.
Project Description:
The present EIA study covers enhancement of existing capacity and addition of new products
hence the capacity increases from 543.45 TPD to 671.95TPD for the manufacturing of bulk drug
and API drugs production unit. IOLCP has applied for TOR in 19 April 2018 and Standard TOR
has been issued on 1st June 2018.
Description of Environment:
Primary baseline data has been collected as per the TOR prescribed by MOEF during 15th March 2018 to 15th June 2018 for one complete season Baseline Data was generated by following the standard procedures of the Ministry of Environment & Forests and the Central Pollution Control Board.
Air Environment: Ambient air quality was monitored at eight locations in the study area. The locations were selected as per CPCB guidelines The mean concentration of PM2.5 in all location ranges between 42 to 48 µg/m3.. The mean concentration of PM10 in all location ranges between 85 to 93 µg/m3 This may be due to the dust generated from thrashing of Wheat crop in the agricultural field, presence of industries in addition to plying of heavy traffic such as trucks and other combustion engine vehicles in nearby roads. SO2 level in all the location ranges between 6.2-20.5 µg/m3, NOx level in all the location ranges between 14.0-41.2 µg/m3, which was found well within National Ambient Air Quality standards i.e. NAAQMS (80µg/m3). The NH3 level in all monitoring locations ranges between 9 to 0.23 µg/m3. The NH3 level in all monitoring location is under permissible limit i.e. NAAQMS 400 µg /m³. The 8 hrs. CO level in all monitoring locations ranges between 0.14 to 0.81 mg/m³.
EIA/EMP Report for expansion of APIs and Bulk drug production unit by IOLCP
EQMS India Pvt. Ltd. 268
Noise Environment:The ambient noise level of all the monitoring locations were found well
within the National Ambient Noise Quality Standards prescribed for industrial (Standards - 75
dBA during day time and 70 dBA during night time) residential area (Standards - 55 dBA during
day time and 45 dBA during night time) and commercial area (Standards - 65 dBA during day
time and 55 dBA during night time) The Ambient noise are well within the limit as per prescribe
standard.
Water Quality: Six surface water samples and eight groundwater samples were collected from
the area for chemical and biological analysis. Overall the ground water quality of the study area
is found well within the permissible limits. No metallic and bacterial contaminations were
observed in ground water samples.
Surface water quality is determined by the help of water quality criteria defined in CPCB best
designated uses criteria. Surface water monitoring is performed for nalla near project site at 100
upstream and downstream point of the project site high bacterial contamination were observed in
Nala water quality meeting the BDU criteria Class D which is fit for propagation of wildlife and
fisheries.
Canal Water quality: The canal water quality is good for Drinking water source after conventional
treatment and disinfection and meeting the class C of Best designated uses of CPCB.
Pond Water Quality: Bacterial contamination were observed in pond water samples. Dissolve
oxygen is found within the range while BOD was found slightly on slightly high than the Class C
of Best designated uses. Hence the pond water is fit for Propagation of Wild life and Fisheries
and meeting the criteria D of Best designated uses of CPCB.
Soil Quality: The soil quality of study area is sandy loam. The pH and conductivity of the soil is
within acceptable range. The soil analysis describes that the soil of the study area is moderately
fertile.
Sensitive Ecosystem: There are no environmentally sensitive components such as National
Park, Wildlife Sanctuary, Elephant / Tiger Reserve, migratory routes of fauna and wet land
present within 10 Km radius of plant site.
Socio economic environment: As per Census of India- 2011, Barnala district had a total
population of 5, 95,527 out of which 3, 17,522 are males and 2, 78005 are females. Males
constitute the 53.31% and female constitutes 46.68 % of total population. Barnala has an
average literacy rate 67.8% which is 7.5% more than the 2001 Census data. The percentage of
decadal growth in population has been 13.0% during 2001-11 and sex ratio (number of females
per 1000) has been 876 in 2011 as compared to 872 in 2001. In the district 0-6 years of
population in the district has been 10.9 which is on the decreasing trend in comparison of 2001
when it was 13.3% . As per the census records 2011, in Barnala district there are 78.5% Sikhs,
19.0% Hindus, 2.2% Muslims, 0.1% Christians, Jains and Buddhists are negligible.
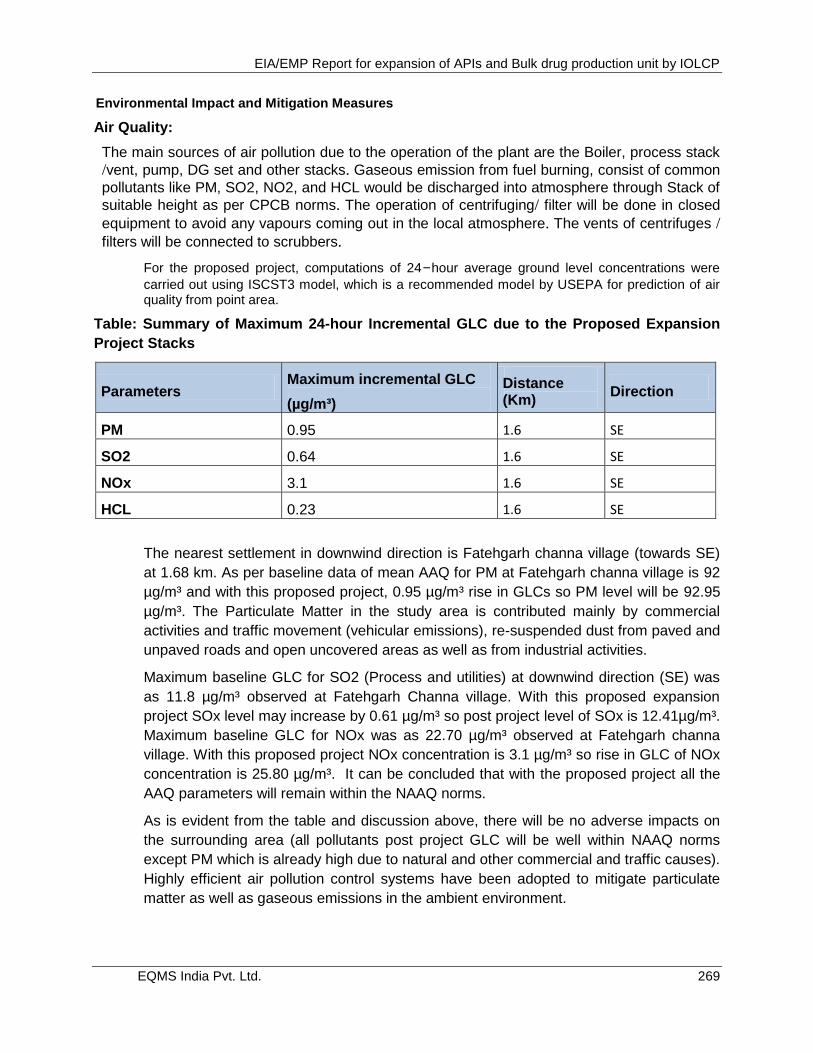
EIA/EMP Report for expansion of APIs and Bulk drug production unit by IOLCP
EQMS India Pvt. Ltd. 269
Environmental Impact and Mitigation Measures
Air Quality:
The main sources of air pollution due to the operation of the plant are the Boiler, process stack
/vent, pump, DG set and other stacks. Gaseous emission from fuel burning, consist of common
pollutants like PM, SO2, NO2, and HCL would be discharged into atmosphere through Stack of
suitable height as per CPCB norms. The operation of centrifuging/ filter will be done in closed
equipment to avoid any vapours coming out in the local atmosphere. The vents of centrifuges /
filters will be connected to scrubbers.
For the proposed project, computations of 24-hour average ground level concentrations were
carried out using ISCST3 model, which is a recommended model by USEPA for prediction of air quality from point area.
Table: Summary of Maximum 24-hour Incremental GLC due to the Proposed Expansion
Project Stacks
Parameters Maximum incremental GLC
(µg/m³)
Distance (Km)
Direction
PM 0.95 1.6 SE
SO2 0.64 1.6 SE
NOx 3.1 1.6 SE
HCL 0.23 1.6 SE
The nearest settlement in downwind direction is Fatehgarh channa village (towards SE)
at 1.68 km. As per baseline data of mean AAQ for PM at Fatehgarh channa village is 92
µg/m³ and with this proposed project, 0.95 µg/m³ rise in GLCs so PM level will be 92.95
µg/m³. The Particulate Matter in the study area is contributed mainly by commercial
activities and traffic movement (vehicular emissions), re-suspended dust from paved and
unpaved roads and open uncovered areas as well as from industrial activities.
Maximum baseline GLC for SO2 (Process and utilities) at downwind direction (SE) was
as 11.8 µg/m³ observed at Fatehgarh Channa village. With this proposed expansion
project SOx level may increase by 0.61 µg/m³ so post project level of SOx is 12.41µg/m³.
Maximum baseline GLC for NOx was as 22.70 µg/m³ observed at Fatehgarh channa
village. With this proposed project NOx concentration is 3.1 µg/m³ so rise in GLC of NOx
concentration is 25.80 µg/m³. It can be concluded that with the proposed project all the
AAQ parameters will remain within the NAAQ norms.
As is evident from the table and discussion above, there will be no adverse impacts on
the surrounding area (all pollutants post project GLC will be well within NAAQ norms
except PM which is already high due to natural and other commercial and traffic causes).
Highly efficient air pollution control systems have been adopted to mitigate particulate
matter as well as gaseous emissions in the ambient environment.
EIA/EMP Report for expansion of APIs and Bulk drug production unit by IOLCP
EQMS India Pvt. Ltd. 270
Noise Quality:
The main source of noise generation during operation stages are mainly from pumps, blowers, compressors, DG sets, vehicle movement for transportation of raw materials, finished goods etc. DG sets will be provided with acoustics enclosures. Mufflers, silencers, acoustics treatment of room will be done wherever required. Equipment will be maintained so that noise level does not increase due to improper maintenance. Material handling operations and movement of vehicles will be properly scheduled to minimize construction noise. Workers working in noisy areas will be given ear plugs. The noise level will be restricted within the plant boundary to meet the standards. Existing greenbelt developed within the plant premises will also act as a barrier to the propagation of noise from the factory premises. This shall further reduce the noise levels appreciably. Hence, no significant impact is envisaged.
Water Quality: Total water requirement–1800 KLD (Fresh water 1456 KLD and Recycle water 344 KLD).
Water requirement will be made available through ground water and surface water. Low TDS Effluent Treated in To ETP. ETP comprises of Four Stage, Two Stage Anaerobic, One Stage Aerobic and One Stage Tertiary. After treatment treated effluents discharge in to plantation area within premises. High TDS effluent Treated in to MEE. Condensate recovery will be reused in plant. Concentrated stream will be sent to ATFD for further treatment. MEE salt will be sold out to end users.
Solid and Hazardous Wastes Disposal:
All the solid and hazardous waste generated from the proposed unit shall be disposed as per the norm. Minor quantities of construction waste will be generated in the form of packaging material and construction waste. Proper care will be taken for handling and reduction of the solid waste generated during construction phase. ETP sludge/ process residue generated during operation phase shall be disposed as per the hazardous waste‘s management, handling and Trans-boundary movement Rule 2016 and amendment thereof.
Impact on Ecology: No national park, wildlife sanctuary, biosphere reserve exists within 10 km area of the project. No endangered or rare or threatened plant or animal species was observed within 10 km area of the project site. The impact on the surrounding ecology during the operation of the project will mainly occur from the deposition of air pollutants. Air pollution affects the biotic and abiotic components of the ecosystem individually and synergistically with other pollutants. Chronic and acute effects on plants and animals may be induced when the concentration of air pollutants exceeds threshold limits. Particulate emission and other gaseous emissions from the proposed plant are the major pollutant that may affect the ecology of the area. However, the AAQ modeling proves that in worst condition the concentration of the PM and other gaseous emission will not exceeds the AAQ standards. Further the mitigation measures have been suggested for the same. By adopting the mitigation measures suggested the impact due to operation of the proposed expansion will be negligible.
Risk Assessment and Disaster Management Plan: The hazard potential of chemicals and estimation of consequences in case of their accidental release during storage, transportation and handling has been identified and risk assessment has been carried out to quantify the extent of damage and suggest recommendations for safety improvement for the proposed facilities. Risk mitigation measures based on MCA analysis and engineering judgments are incorporated in order to improve overall system safety and mitigate the effects of major accidents.
An effective Disaster Management Plan (DMP) to mitigate the risks involved has been prepared. This plan defines the responsibilities and resources available to respond to the different types of emergencies envisaged. Training exercises will be held to ensure that all personnel are familiar with their responsibilities and that communication links are functioning effectively.
EIA/EMP Report for expansion of APIs and Bulk drug production unit by IOLCP
EQMS India Pvt. Ltd. 271
Green belt development:IOLCP has planted approx 26000 tree/shrubs and herbs in existing
greenbelt. The tree species like Eucalyptus, neem, Daikan, sadabahar, Ficus spp., jamun,
Champa, kadam gulmohar along with shrubs and herbs has been planted under existing
greenbelt. Further maintenance of the existing greenbelt shall be done on regular basis for which
IOL Chemical has already kept a budget for Rs. 20 lakhs as a capital cost.
CSR Plan: IOLCP has allocated 2.5% of the total project cost towards the Enterprise Social
Commitment (ESC) and item-wise details along with time bound action plan will be prepared and
incorporated after public hearing.
Project Benefits
Proposed expansion project will result in considerable growth of stimulating the industrial
and commercial activities in the state. Small and medium scale industries may be further
developed therefore.
The project will be beneficial in govt‘s target of increase the production capacity and yield
in the field of pharmaceuticals.
Increased revenue to the state by way of royalty, taxes and duties;
Overall Growth of the neighboring area viz. Health and family welfare; Watershed
development; Sustainable livelihood and strengthening of village Self Help Groups; and
Infrastructure development.
In operation phase, the proposed plant would require significant workforce of non-
technical and technical persons.
Migration of persons with better education and professional experience will result in
increase of population and literacy in the surrounding villages.
Civic amenities will be substantial after the commencement of project activities. The
basic requirement of the community needs will be strengthened by extending healthcare,
educational facilities to the community, building/strengthening of existing roads in the
area.
The local population will be given preference to employment on the basis of their
eligibility and company requirement. The employment potential will ameliorate economic
conditions of these families directly and provide employment to many other families
indirectly who are involved in business and service-oriented activities. The employment
of local people in primary and secondary sectors of project shall upgrade the prosperity
of the region. This in-turn will improve the socio-economic conditions of the area.
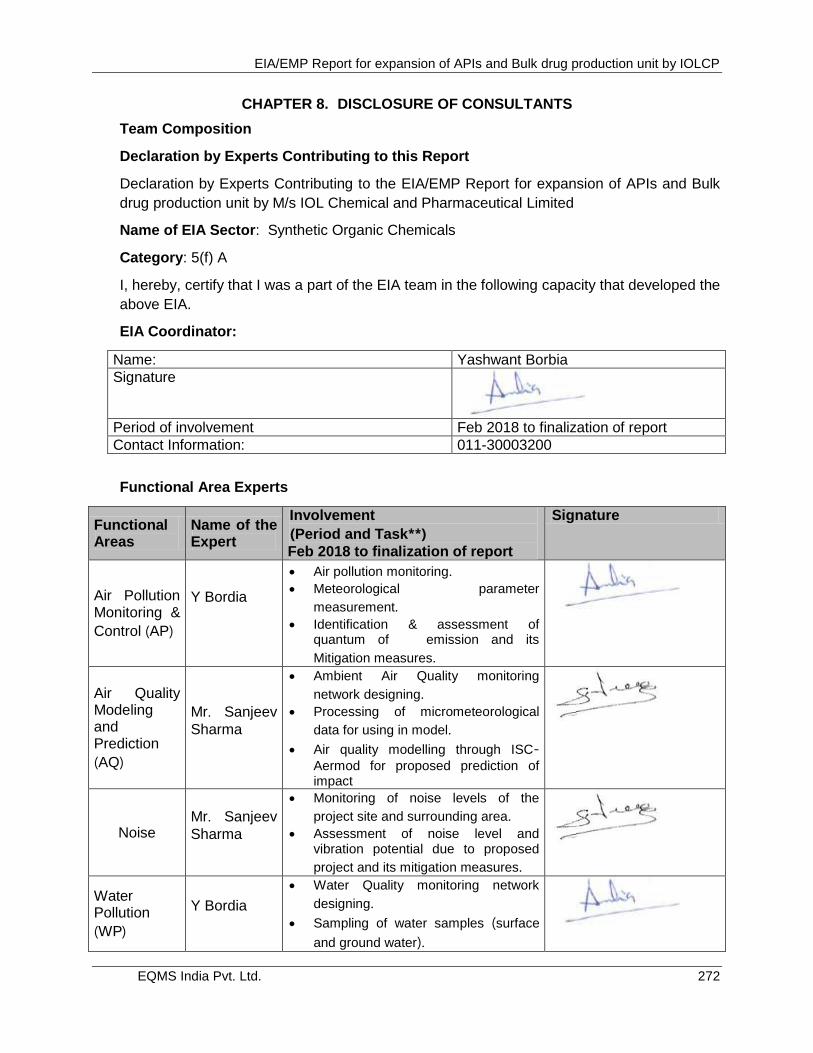
EIA/EMP Report for expansion of APIs and Bulk drug production unit by IOLCP
EQMS India Pvt. Ltd. 272
CHAPTER 8. DISCLOSURE OF CONSULTANTS
Team Composition
Declaration by Experts Contributing to this Report
Declaration by Experts Contributing to the EIA/EMP Report for expansion of APIs and Bulk
drug production unit by M/s IOL Chemical and Pharmaceutical Limited
Name of EIA Sector: Synthetic Organic Chemicals
Category: 5(f) A
I, hereby, certify that I was a part of the EIA team in the following capacity that developed the
above EIA.
EIA Coordinator:
Name: Yashwant Borbia
Signature
Period of involvement Feb 2018 to finalization of report
Contact Information: 011-30003200
Functional Area Experts
Functional Areas
Name of the Expert
Involvement
(Period and Task**)
Feb 2018 to finalization of report
Signature
Air Pollution Monitoring &
Control (AP)
Y Bordia
Air pollution monitoring.
Meteorological parameter
measurement.
Identification & assessment of quantum of emission and its
Mitigation measures.
Air Quality Modeling and Prediction
(AQ)
Mr. Sanjeev
Sharma
Ambient Air Quality monitoring
network designing.
Processing of micrometeorological
data for using in model.
Air quality modelling through ISC- Aermod for proposed prediction of impact
Noise Mr. Sanjeev
Sharma
Monitoring of noise levels of the
project site and surrounding area.
Assessment of noise level and vibration potential due to proposed
project and its mitigation measures.
Water Pollution
(WP)
Y Bordia
Water Quality monitoring network
designing.
Sampling of water samples (surface
and ground water).
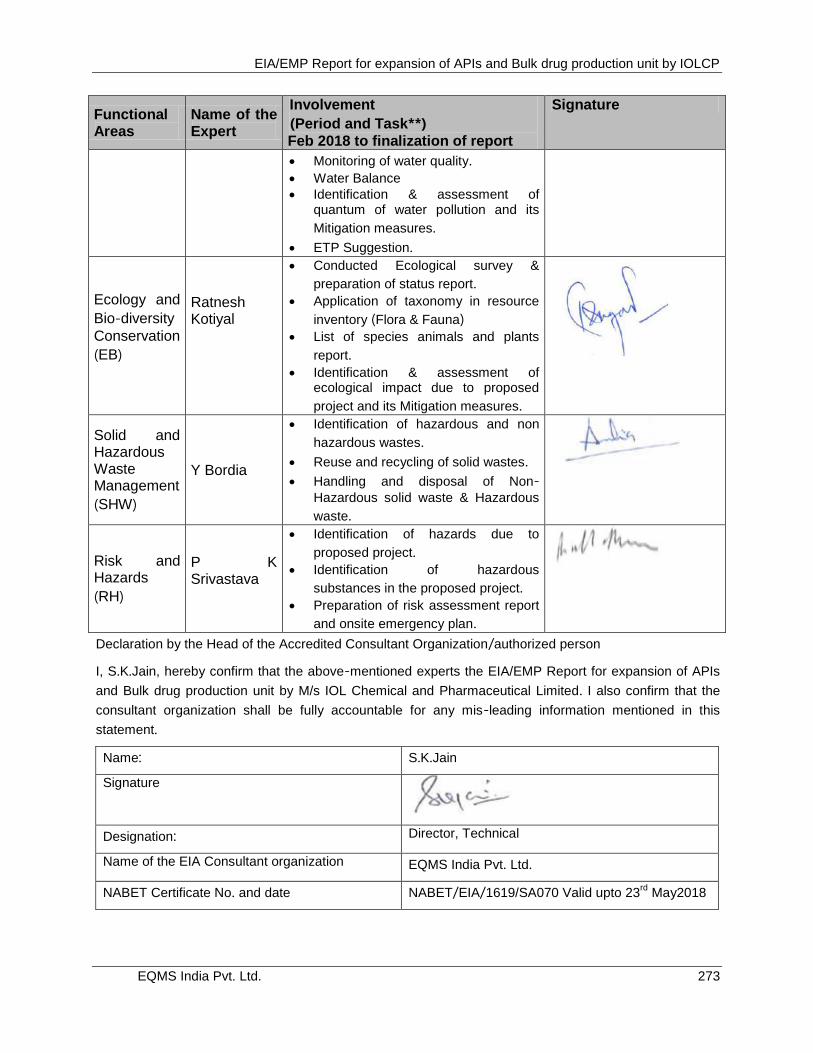
EIA/EMP Report for expansion of APIs and Bulk drug production unit by IOLCP
EQMS India Pvt. Ltd. 273
Functional Areas
Name of the Expert
Involvement
(Period and Task**)
Feb 2018 to finalization of report
Signature
Monitoring of water quality.
Water Balance
Identification & assessment of quantum of water pollution and its
Mitigation measures.
ETP Suggestion.
Ecology and
Bio-diversity
Conservation
(EB)
Ratnesh Kotiyal
Conducted Ecological survey &
preparation of status report.
Application of taxonomy in resource
inventory (Flora & Fauna) List of species animals and plants
report.
Identification & assessment of ecological impact due to proposed
project and its Mitigation measures.
Solid and Hazardous Waste Management
(SHW)
Y Bordia
Identification of hazardous and non
hazardous wastes.
Reuse and recycling of solid wastes.
Handling and disposal of Non- Hazardous solid waste & Hazardous
waste.
Risk and Hazards
(RH)
P K Srivastava
Identification of hazards due to
proposed project.
Identification of hazardous
substances in the proposed project.
Preparation of risk assessment report
and onsite emergency plan.
Declaration by the Head of the Accredited Consultant Organization/authorized person
I, S.K.Jain, hereby confirm that the above-mentioned experts the EIA/EMP Report for expansion of APIs
and Bulk drug production unit by M/s IOL Chemical and Pharmaceutical Limited. I also confirm that the
consultant organization shall be fully accountable for any mis-leading information mentioned in this
statement.
Name: S.K.Jain
Signature
Designation: Director, Technical
Name of the EIA Consultant organization EQMS India Pvt. Ltd.
NABET Certificate No. and date NABET/EIA/1619/SA070 Valid upto 23rd
May2018