Embed Size (px)
Citation preview
Putnam Equity Spectrum Fund
FUND SYMBOL CLASS A
PYSAX
Semiannual report 10 | 31 | 17
Blend funds invest opportunistically in a variety of stocks, such as growth stocks and value stocks.
Putnam Equity Spectrum FundSemiannual report 10 | 31 | 17
Message from the Trustees 1
About the fund 2
Interview with your fund’s portfolio manager 4
Your fund’s performance 9
Your fund’s expenses 11
Terms and definitions 13
Other information for shareholders 14
Trustee approval of management contract 15
Financial statements 20
Consider these risks before investing: The value of stocks in the fund’s portfolio may fall or fail to rise over extended periods of time for a variety of reasons, including general financial market conditions, changing market perceptions, changes in government interventions in the financial markets, and factors related to a specific issuer, industry, or sector. These and other factors may lead to increased volatility and reduced liquidity in the fund’s portfolio holdings. Growth stocks may be more susceptible to earnings disappointments, and value stocks may fail to rebound. These risks are generally greater for small and midsize companies. The fund will be more susceptible to these risks than other funds because it may concentrate its investments in a limited number of issuers and currently focuses its investments in partic-ular sectors. Because the fund currently invests significantly in certain companies in the health-care and consumer discretionary sectors, the fund may perform poorly as a result of adverse developments affecting those companies or sectors. The fund may focus its investments in other sectors in the future, in which case it would be exposed to risks relating to those sectors. The value of international investments traded in foreign currencies may be adversely impacted by fluctuations in exchange rates. International investments, particularly investments in emerging markets, may carry risks associated with potentially less stable economies or governments (such as the risk of seizure by a foreign government, the imposition of currency or other restrictions, or high levels of inflation or deflation), and may be or become illiquid. The fund’s investments in leveraged companies, the fund’s “non-diversified” status, which means the fund may invest a greater percentage of its assets in fewer issuers than a “diversified” fund, and the fund’s use of short selling can increase the risks of investing in the fund. You can lose money by investing in the fund.
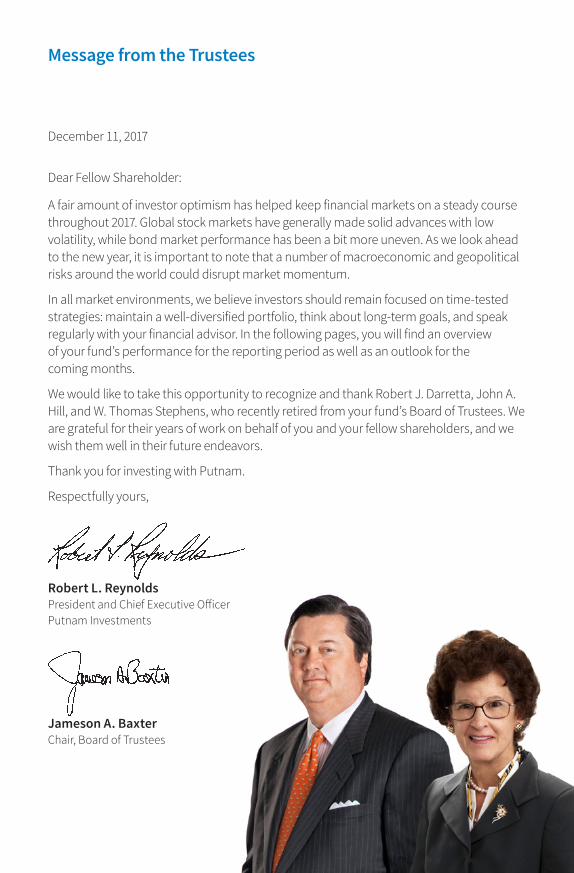
December 11, 2017
Dear Fellow Shareholder:
A fair amount of investor optimism has helped keep financial markets on a steady course throughout 2017. Global stock markets have generally made solid advances with low volatility, while bond market performance has been a bit more uneven. As we look ahead to the new year, it is important to note that a number of macroeconomic and geopolitical risks around the world could disrupt market momentum.
In all market environments, we believe investors should remain focused on time-tested strategies: maintain a well-diversified portfolio, think about long-term goals, and speak regularly with your financial advisor. In the following pages, you will find an overview of your fund’s performance for the reporting period as well as an outlook for the coming months.
We would like to take this opportunity to recognize and thank Robert J. Darretta, John A. Hill, and W. Thomas Stephens, who recently retired from your fund’s Board of Trustees. We are grateful for their years of work on behalf of you and your fellow shareholders, and we wish them well in their future endeavors.
Thank you for investing with Putnam.
Respectfully yours,
Robert L. ReynoldsPresident and Chief Executive OfficerPutnam Investments
Jameson A. BaxterChair, Board of Trustees
Message from the Trustees
c_GA7-38VX_AboutFund_3.indd Revised: 03:23 PM 11/12/17 EST Page Proof 1
2 Equity Spectrum Fund
About the fund
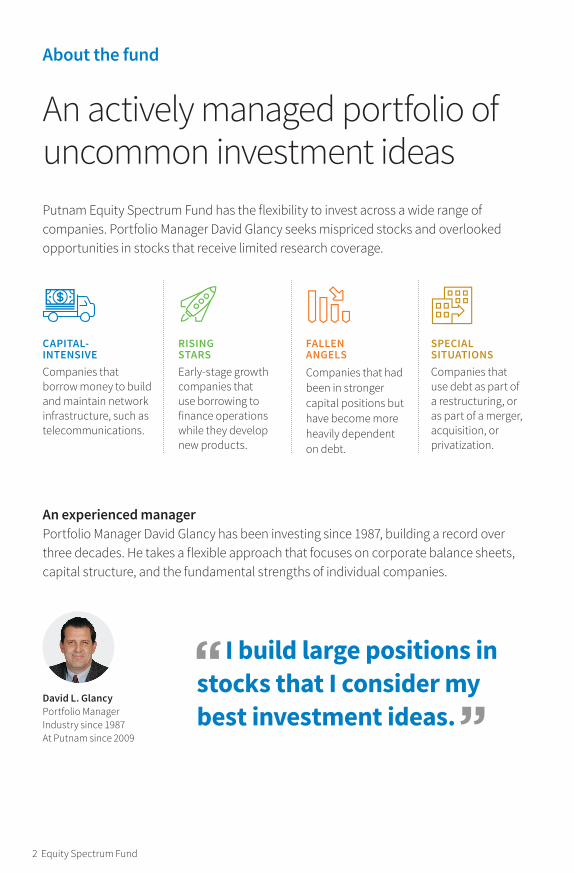
An actively managed portfolio of uncommon investment ideasPutnam Equity Spectrum Fund has the flexibility to invest across a wide range of companies. Portfolio Manager David Glancy seeks mispriced stocks and overlooked opportunities in stocks that receive limited research coverage.
CAPITAL- INTENSIVECompanies that borrow money to build and maintain network infrastructure, such as telecommunications.
RISING STARSEarly-stage growth companies that use borrowing to finance operations while they develop new products.
FALLEN ANGELSCompanies that had been in stronger capital positions but have become more heavily dependent on debt.
SPECIAL SITUATIONSCompanies that use debt as part of a restructuring, or as part of a merger, acquisition, or privatization.
An experienced managerPortfolio Manager David Glancy has been investing since 1987, building a record over three decades. He takes a flexible approach that focuses on corporate balance sheets, capital structure, and the fundamental strengths of individual companies.
David L. GlancyPortfolio ManagerIndustry since 1987At Putnam since 2009
I build large positions in stocks that I consider my best investment ideas.
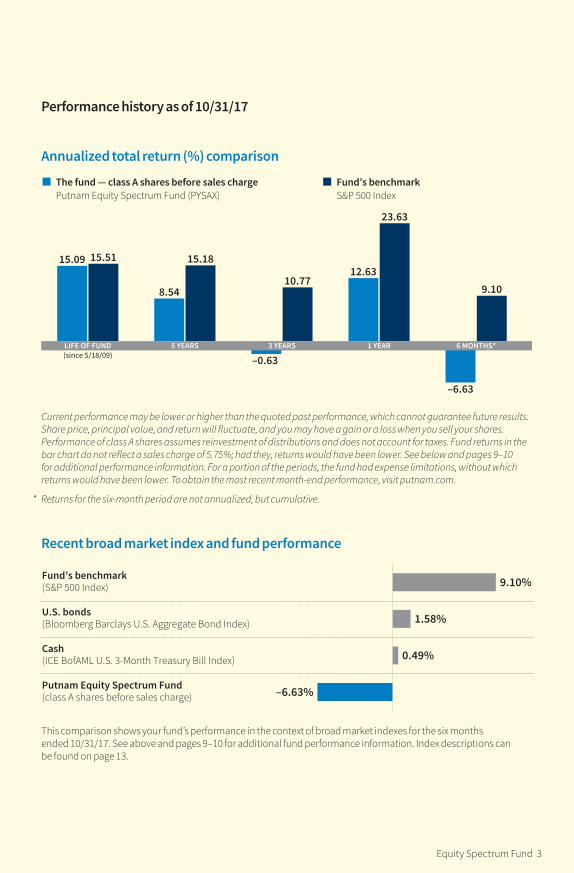
Performance history as of 10/31/17
Annualized total return (%) comparison
LIFE OF FUND(since 5/18/09)
5 YEARS 3 YEARS 1 YEAR 6 MONTHS*
15.09 15.51
8.54
15.18
–0.63
10.7712.63
23.63
–6.63
9.10
The fund — class A shares before sales chargePutnam Equity Spectrum Fund (PYSAX)
Fund’s benchmarkS&P 500 Index
Current performance may be lower or higher than the quoted past performance, which cannot guarantee future results. Share price, principal value, and return will fluctuate, and you may have a gain or a loss when you sell your shares. Performance of class A shares assumes reinvestment of distributions and does not account for taxes. Fund returns in the bar chart do not reflect a sales charge of 5.75%; had they, returns would have been lower. See below and pages 9–10 for additional performance information. For a portion of the periods, the fund had expense limitations, without which returns would have been lower. To obtain the most recent month-end performance, visit putnam.com.
* Returns for the six-month period are not annualized, but cumulative.
Recent broad market index and fund performance
9.10%
1.58%
0.49%
–6.63%
Fund’s benchmark (S&P 500 Index)
U.S. bonds (Bloomberg Barclays U.S. Aggregate Bond Index)
Cash (ICE BofAML U.S. 3-Month Treasury Bill Index)
Putnam Equity Spectrum Fund (class A shares before sales charge)
This comparison shows your fund’s performance in the context of broad market indexes for the six months ended 10/31/17. See above and pages 9–10 for additional fund performance information. Index descriptions can be found on page 13.
Equity Spectrum Fund 3
Interview with your fund’s portfolio manager
David L. GlancyPortfolio Manager
David has an M.B.A. from Goizueta Business School, Emory University, and a B.A. from Tulane University. He joined Putnam in 2009 and has been in the investment industry since 1987.
David, how was the investing environment during the reporting period?The U.S. stock market overall delivered gains during the six-month period, continuing a rally that began in late 2016. Despite a number of political and economic uncertainties that could have disrupted the market’s momentum, we continued to see relatively low volatility. In addition, major stock market indexes reached new record highs, with some of the strongest performance coming from a narrow group of large-cap growth stocks. Along with the positive trends, however, came a lower level of optimism from investors about progress from Washington in implementing pro-growth, business-friendly policies.
How did the fund perform in this environment?For the six-month period, the fund returned –6.63%, underperforming its benchmark, the S&P 500 Index, which returned 9.10%. Weakness in a number of key holdings contrib-uted to the fund’s underperformance for the period. In my view, these share price declines were due to short-term issues and do not reflect any fundamental weakness in the businesses.
David Glancy offers his perspective on the investing environment for U.S. stocks for the six-month period ended October 31, 2017, as well as his analysis and outlook for key portfolio holdings.
Interview with your fund’s portfolio manager
4 Equity Spectrum Fund
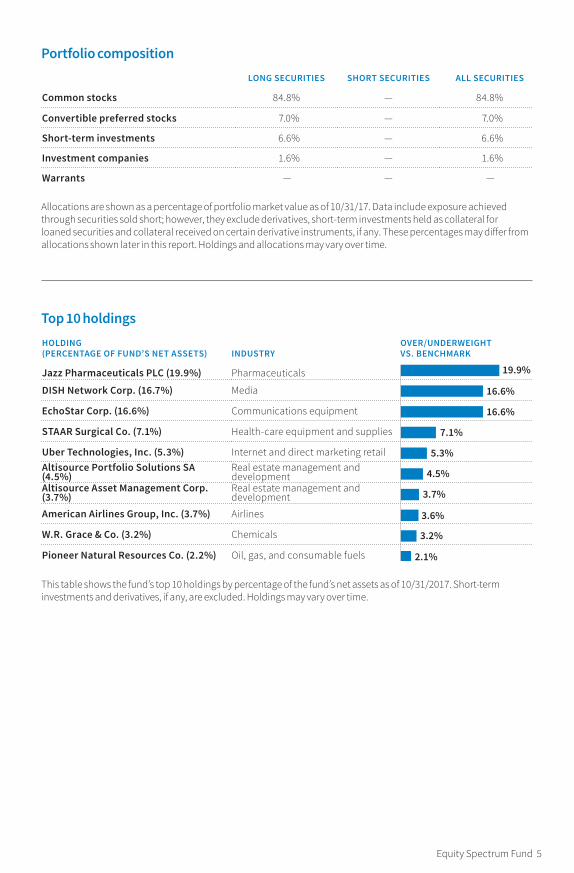
Top 10 holdingsHOLDING (PERCENTAGE OF FUND’S NET ASSETS)
INDUSTRY
OVER/UNDERWEIGHT VS. BENCHMARK
Jazz Pharmaceuticals PLC (19.9%) Pharmaceuticals
DISH Network Corp. (16.7%) Media
EchoStar Corp. (16.6%) Communications equipment
STAAR Surgical Co. (7.1%) Health-care equipment and supplies
Uber Technologies, Inc. (5.3%) Internet and direct marketing retailAltisource Portfolio Solutions SA (4.5%)
Real estate management and development
Altisource Asset Management Corp. (3.7%)
Real estate management and development
American Airlines Group, Inc. (3.7%) Airlines
W.R. Grace & Co. (3.2%) Chemicals
Pioneer Natural Resources Co. (2.2%) Oil, gas, and consumable fuels 2.1%
19.9%
16.6%
16.6%
7.1%
4.5%
3.7%
3.6%
3.2%
5.3%
This table shows the fund’s top 10 holdings by percentage of the fund’s net assets as of 10/31/2017. Short-term investments and derivatives, if any, are excluded. Holdings may vary over time.
Portfolio compositionLONG SECURITIES SHORT SECURITIES ALL SECURITIES
Common stocks 84.8% — 84.8%
Convertible preferred stocks 7.0% — 7.0%
Short-term investments 6.6% — 6.6%
Investment companies 1.6% — 1.6%
Warrants — — —
Allocations are shown as a percentage of portfolio market value as of 10/31/17. Data include exposure achieved through securities sold short; however, they exclude derivatives, short-term investments held as collateral for loaned securities and collateral received on certain derivative instruments, if any. These percentages may differ from allocations shown later in this report. Holdings and allocations may vary over time.
Equity Spectrum Fund 5
What were some challenges for the portfolio during the period?Although conditions for the U.S. stock market were positive during the period, I believe it has become increasingly difficult for many companies to keep investors satisfied because their stocks may be priced for perfection in today’s market. As a result, the slightest sign of weakness in revenue or earnings can cause the market to overreact and punish a stock harshly. In an environment like this, it is important to remain patient and to stay focused on the underlying fundamentals of each business and its long-term growth potential.
Could you discuss holdings that detracted from the fund’s performance?The fund’s investment in DISH Network was the top detractor from performance for the period. The decline over the period appeared to be related to investor concerns about continued weakness in subscriber growth across the cable TV industry. In addition, the company reported a write-down due to a fine for violating do-not-call restrictions. While the decline in DISH stock was disappointing, it does not change my conviction in the long-term value of this pay-TV, broadband, and wireless communications company.
I continue to believe that DISH offers attractive long-term capital appreciation potential, due in large part to its spectrum assets. “Spectrum” refers to wireless signals sent through the airwaves, and DISH recently won a $6 billion bid in a Federal Communications Commission auction for low-band wireless spectrum assets. As the demand for mobile networking has continued to rise, wireless spectrum has become a highly valuable asset for commu-nications companies. I believe DISH has the opportunity to monetize these assets, perhaps through a lease agreement or partnership with a company in need of wireless spectrum.
As with many companies in the portfolio, an investment in DISH requires patience and the ability to maintain conviction through periods
of short-term volatility. Not all investors have the patience to stick with a thesis that may take time to develop, as we have seen throughout 2017 when DISH stock encountered volatility. In many cases, declines occur when there is no news or notable developments for a company, and investors shift focus in search of shorter-term gains.
What other holdings held back performance for the period?A lack of news also seemed to have a negative effect on Jazz Pharmaceuticals — another poor performer for the fund. In its quarterly financial results, Jazz reported slightly weaker revenue for Xyrem, its narcolepsy drug, but main-tained its outlook for 2017 full-year earnings. From my perspective, nothing has changed fundamentally for Jazz.
Jazz has continued to deliver good news related to JZP 110, the company’s narcolepsy treatment currently in development. Positive results of clinical trials, conducted for patients with obstructive sleep apnea, have been well received by investors and, in my view, offer evidence that Jazz may be able to successfully expand its narcolepsy franchise beyond Xyrem.
Another detractor during the six-month period was the fund’s investment in EchoStar. The stock declined when the satellite services company reported weaker-than-expected quarterly earnings growth. I continue to believe that the company represents an attractive investment opportunity. EchoStar has a strong balance sheet and healthy cash-flow levels, in my view, and has been launching new satellites — providing expanded digital television and broadband data
I believe recent declines for fund holdings were due to short-term issues, and do not reflect fundamental weakness in the businesses. David Glancy
6 Equity Spectrum Fund
services — which I believe could boost the company’s subscriber growth.
Could you highlight some stocks that contributed to fund performance for the period?One highlight was the fund’s investment in STAAR Surgical, a maker of implantable contact lenses and the top contributor to fund perfor-mance for the period. STAAR shares advanced as investors seemed pleased with recent analyst upgrades of the stock and the company’s quarterly earnings results, which exceeded consensus estimates. STAAR’s implantable lenses are typically used for patients with vision issues that cannot be addressed through other surgical procedures, such as LASIK. STAAR is the market leader for implantable lenses, and recently received approval to market the latest generation of its lenses in European markets, which should continue to drive the company’s growth, in my view.
Another notable contributor for the period was Altisource Portfolio Solutions, a provider of services and technology for the mortgage and real estate industries. The company rebounded after a period of underperformance due in large part to its close relationship with Ocwen
Financial, which had been struggling with regulatory issues.
Can you provide an update on the portfolio’s cash position?As of period-end, cash levels in the fund were lower than they were at the start of the six-month period. Cash in the portfolio may assist the fund in meeting redemptions and can serve as a “dry powder” that enables me to add to positions when price dislocations occur.
What is your rationale for the fund’s concentrated strategy?I build large positions in stocks that I consider my best investment ideas. While this concen-trated portfolio could result in short-term volatility, I believe shareholders benefit over the long term when the best ideas are not diluted by less compelling opportunities. I take a bottom-up, fundamental approach to stock selection and generally do not make investment decisions based on macroeconomic factors. Instead, I focus on the fundamental strength of individual companies, seeking those that I believe are ripe for significant capital apprecia-tion because they have an internal catalyst that will eventually unlock value.
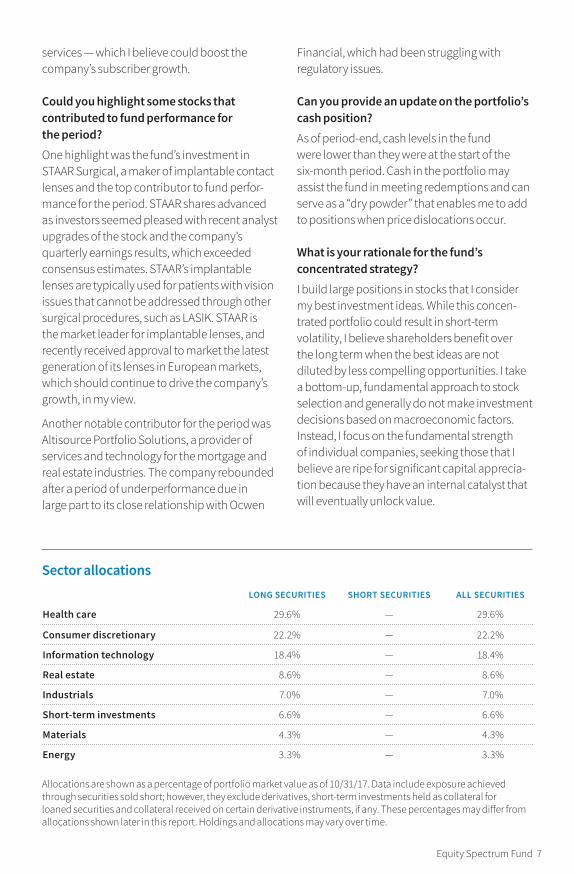
Sector allocationsLONG SECURITIES SHORT SECURITIES ALL SECURITIES
Health care 29.6% — 29.6%
Consumer discretionary 22.2% — 22.2%
Information technology 18.4% — 18.4%
Real estate 8.6% — 8.6%
Industrials 7.0% — 7.0%
Short-term investments 6.6% — 6.6%
Materials 4.3% — 4.3%
Energy 3.3% — 3.3%
Allocations are shown as a percentage of portfolio market value as of 10/31/17. Data include exposure achieved through securities sold short; however, they exclude derivatives, short-term investments held as collateral for loaned securities and collateral received on certain derivative instruments, if any. These percentages may differ from allocations shown later in this report. Holdings and allocations may vary over time.
Equity Spectrum Fund 7

Thanks, David, for your time and insights today.
The views expressed in this report are exclusively those of Putnam Management and are subject to change. They are not meant as investment advice.
Please note that the holdings discussed in this report may not have been held by the fund for the entire period. Portfolio composition is subject to review in accordance with the fund’s investment strategy and may vary in the future. Current and future portfolio holdings are subject to risk.
8 Equity Spectrum Fund
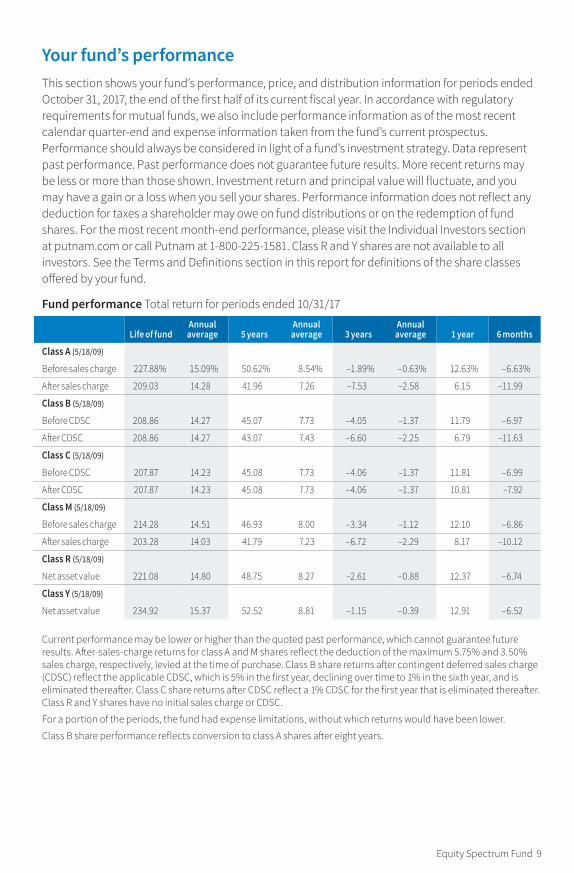
Your fund’s performanceThis section shows your fund’s performance, price, and distribution information for periods ended October 31, 2017, the end of the first half of its current fiscal year. In accordance with regulatory requirements for mutual funds, we also include performance information as of the most recent calendar quarter-end and expense information taken from the fund’s current prospectus. Performance should always be considered in light of a fund’s investment strategy. Data represent past performance. Past performance does not guarantee future results. More recent returns may be less or more than those shown. Investment return and principal value will fluctuate, and you may have a gain or a loss when you sell your shares. Performance information does not reflect any deduction for taxes a shareholder may owe on fund distributions or on the redemption of fund shares. For the most recent month-end performance, please visit the Individual Investors section at putnam.com or call Putnam at 1-800-225-1581. Class R and Y shares are not available to all investors. See the Terms and Definitions section in this report for definitions of the share classes offered by your fund.
Fund performance Total return for periods ended 10/31/17
Life of fundAnnual average 5 years
Annual average 3 years
Annual average 1 year 6 months
Class A (5/18/09)
Before sales charge 227.88% 15.09% 50.62% 8.54% –1.89% –0.63% 12.63% –6.63%
After sales charge 209.03 14.28 41.96 7.26 –7.53 –2.58 6.15 –11.99
Class B (5/18/09)
Before CDSC 208.86 14.27 45.07 7.73 –4.05 –1.37 11.79 –6.97
After CDSC 208.86 14.27 43.07 7.43 –6.60 –2.25 6.79 –11.63
Class C (5/18/09)
Before CDSC 207.87 14.23 45.08 7.73 –4.06 –1.37 11.81 –6.99
After CDSC 207.87 14.23 45.08 7.73 –4.06 –1.37 10.81 –7.92
Class M (5/18/09)
Before sales charge 214.28 14.51 46.93 8.00 –3.34 –1.12 12.10 –6.86
After sales charge 203.28 14.03 41.79 7.23 –6.72 –2.29 8.17 –10.12
Class R (5/18/09)
Net asset value 221.08 14.80 48.75 8.27 –2.61 –0.88 12.37 –6.74
Class Y (5/18/09)
Net asset value 234.92 15.37 52.52 8.81 –1.15 –0.39 12.91 –6.52
Current performance may be lower or higher than the quoted past performance, which cannot guarantee future results. After-sales-charge returns for class A and M shares reflect the deduction of the maximum 5.75% and 3.50% sales charge, respectively, levied at the time of purchase. Class B share returns after contingent deferred sales charge (CDSC) reflect the applicable CDSC, which is 5% in the first year, declining over time to 1% in the sixth year, and is eliminated thereafter. Class C share returns after CDSC reflect a 1% CDSC for the first year that is eliminated thereafter. Class R and Y shares have no initial sales charge or CDSC.
For a portion of the periods, the fund had expense limitations, without which returns would have been lower.
Class B share performance reflects conversion to class A shares after eight years.
Equity Spectrum Fund 9
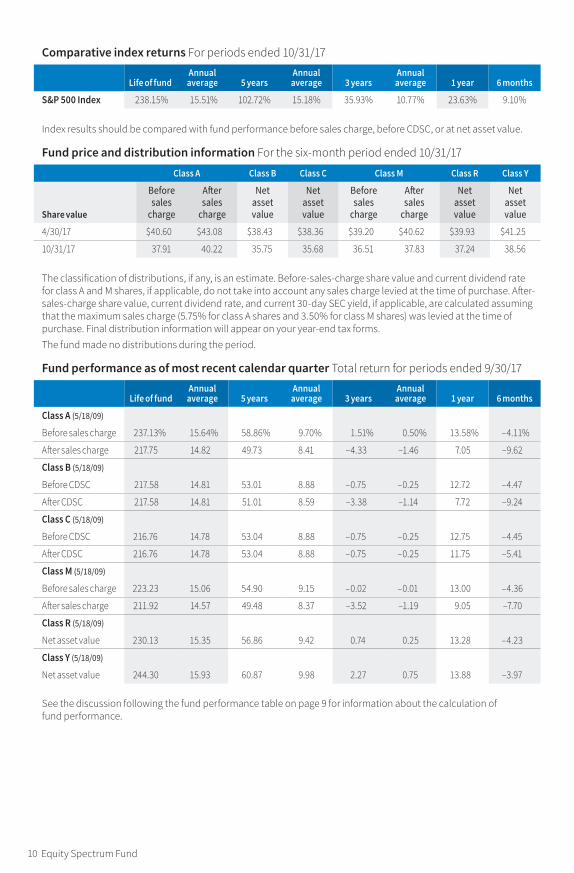
Comparative index returns For periods ended 10/31/17
Life of fundAnnual average 5 years
Annual average 3 years
Annual average 1 year 6 months
S&P 500 Index 238.15% 15.51% 102.72% 15.18% 35.93% 10.77% 23.63% 9.10%
Index results should be compared with fund performance before sales charge, before CDSC, or at net asset value.
Fund price and distribution information For the six-month period ended 10/31/17
Class A Class B Class C Class M Class R Class Y
Share value
Before sales
charge
After sales
charge
Net asset value
Net asset value
Before sales
charge
After sales
charge
Net asset value
Net asset value
4/30/17 $40.60 $43.08 $38.43 $38.36 $39.20 $40.62 $39.93 $41.25
10/31/17 37.91 40.22 35.75 35.68 36.51 37.83 37.24 38.56
The classification of distributions, if any, is an estimate. Before-sales-charge share value and current dividend rate for class A and M shares, if applicable, do not take into account any sales charge levied at the time of purchase. After-sales-charge share value, current dividend rate, and current 30-day SEC yield, if applicable, are calculated assuming that the maximum sales charge (5.75% for class A shares and 3.50% for class M shares) was levied at the time of purchase. Final distribution information will appear on your year-end tax forms.
The fund made no distributions during the period.
Fund performance as of most recent calendar quarter Total return for periods ended 9/30/17
Life of fundAnnual average 5 years
Annual average 3 years
Annual average 1 year 6 months
Class A (5/18/09)
Before sales charge 237.13% 15.64% 58.86% 9.70% 1.51% 0.50% 13.58% –4.11%
After sales charge 217.75 14.82 49.73 8.41 –4.33 –1.46 7.05 –9.62
Class B (5/18/09)
Before CDSC 217.58 14.81 53.01 8.88 –0.75 –0.25 12.72 –4.47
After CDSC 217.58 14.81 51.01 8.59 –3.38 –1.14 7.72 –9.24
Class C (5/18/09)
Before CDSC 216.76 14.78 53.04 8.88 –0.75 –0.25 12.75 –4.45
After CDSC 216.76 14.78 53.04 8.88 –0.75 –0.25 11.75 –5.41
Class M (5/18/09)
Before sales charge 223.23 15.06 54.90 9.15 –0.02 –0.01 13.00 –4.36
After sales charge 211.92 14.57 49.48 8.37 –3.52 –1.19 9.05 –7.70
Class R (5/18/09)
Net asset value 230.13 15.35 56.86 9.42 0.74 0.25 13.28 –4.23
Class Y (5/18/09)
Net asset value 244.30 15.93 60.87 9.98 2.27 0.75 13.88 –3.97
See the discussion following the fund performance table on page 9 for information about the calculation of fund performance.
10 Equity Spectrum Fund
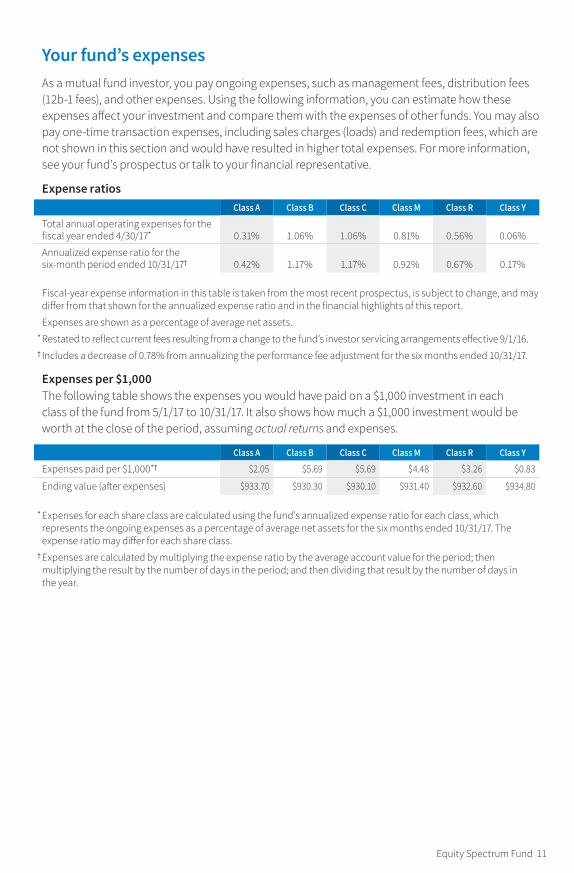
Your fund’s expensesAs a mutual fund investor, you pay ongoing expenses, such as management fees, distribution fees (12b-1 fees), and other expenses. Using the following information, you can estimate how these expenses affect your investment and compare them with the expenses of other funds. You may also pay one-time transaction expenses, including sales charges (loads) and redemption fees, which are not shown in this section and would have resulted in higher total expenses. For more information, see your fund’s prospectus or talk to your financial representative.
Expense ratiosClass A Class B Class C Class M Class R Class Y
Total annual operating expenses for the fiscal year ended 4/30/17* 0.31% 1.06% 1.06% 0.81% 0.56% 0.06%
Annualized expense ratio for the six-month period ended 10/31/17† 0.42% 1.17% 1.17% 0.92% 0.67% 0.17%
Fiscal-year expense information in this table is taken from the most recent prospectus, is subject to change, and may differ from that shown for the annualized expense ratio and in the financial highlights of this report.
Expenses are shown as a percentage of average net assets. * Restated to reflect current fees resulting from a change to the fund’s investor servicing arrangements effective 9/1/16. † Includes a decrease of 0.78% from annualizing the performance fee adjustment for the six months ended 10/31/17.
Expenses per $1,000The following table shows the expenses you would have paid on a $1,000 investment in each class of the fund from 5/1/17 to 10/31/17. It also shows how much a $1,000 investment would be worth at the close of the period, assuming actual returns and expenses.
Class A Class B Class C Class M Class R Class Y
Expenses paid per $1,000*† $2.05 $5.69 $5.69 $4.48 $3.26 $0.83
Ending value (after expenses) $933.70 $930.30 $930.10 $931.40 $932.60 $934.80
* Expenses for each share class are calculated using the fund’s annualized expense ratio for each class, which represents the ongoing expenses as a percentage of average net assets for the six months ended 10/31/17. The expense ratio may differ for each share class.
† Expenses are calculated by multiplying the expense ratio by the average account value for the period; then multiplying the result by the number of days in the period; and then dividing that result by the number of days in the year.
Equity Spectrum Fund 11
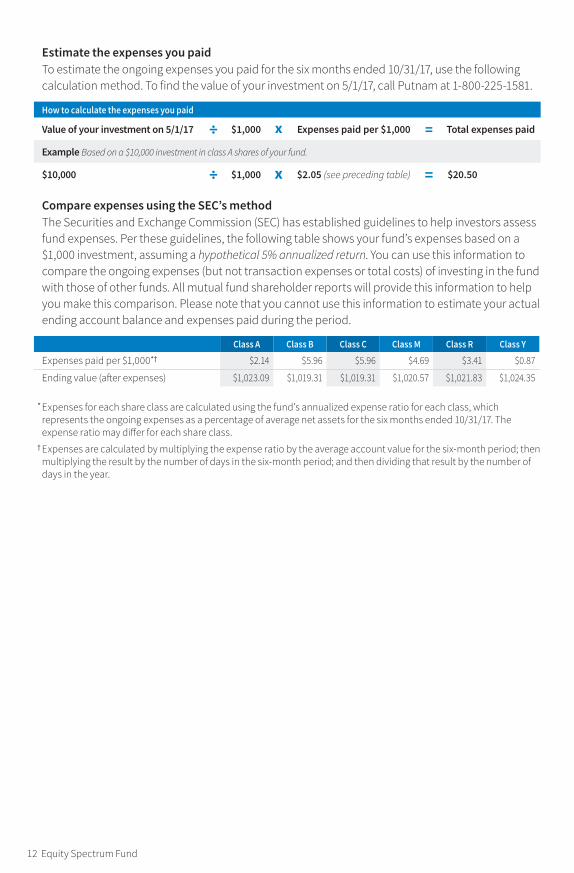
Estimate the expenses you paidTo estimate the ongoing expenses you paid for the six months ended 10/31/17, use the following calculation method. To find the value of your investment on 5/1/17, call Putnam at 1-800-225-1581.
How to calculate the expenses you paid
Value of your investment on 5/1/17 ÷ $1,000 x Expenses paid per $1,000 = Total expenses paid
Example Based on a $10,000 investment in class A shares of your fund.
$10,000 ÷ $1,000 x $2.05 (see preceding table) = $20.50
Compare expenses using the SEC’s methodThe Securities and Exchange Commission (SEC) has established guidelines to help investors assess fund expenses. Per these guidelines, the following table shows your fund’s expenses based on a $1,000 investment, assuming a hypothetical 5% annualized return. You can use this information to compare the ongoing expenses (but not transaction expenses or total costs) of investing in the fund with those of other funds. All mutual fund shareholder reports will provide this information to help you make this comparison. Please note that you cannot use this information to estimate your actual ending account balance and expenses paid during the period.
Class A Class B Class C Class M Class R Class Y
Expenses paid per $1,000*† $2.14 $5.96 $5.96 $4.69 $3.41 $0.87
Ending value (after expenses) $1,023.09 $1,019.31 $1,019.31 $1,020.57 $1,021.83 $1,024.35
* Expenses for each share class are calculated using the fund’s annualized expense ratio for each class, which represents the ongoing expenses as a percentage of average net assets for the six months ended 10/31/17. The expense ratio may differ for each share class.
† Expenses are calculated by multiplying the expense ratio by the average account value for the six-month period; then multiplying the result by the number of days in the six-month period; and then dividing that result by the number of days in the year.
12 Equity Spectrum Fund
Terms and definitions
Important termsTotal return shows how the value of the fund’s shares changed over time, assuming you held the shares through the entire period and reinvested all distributions in the fund.
Before sales charge, or net asset value, is the price, or value, of one share of a mutual fund, without a sales charge. Before-sales-charge figures fluctuate with market conditions, and are calculated by dividing the net assets of each class of shares by the number of outstanding shares in the class.
After sales charge is the price of a mutual fund share plus the maximum sales charge levied at the time of purchase. After-sales-charge perfor-mance figures shown here assume the 5.75% maximum sales charge for class A shares and 3.50% for class M shares.
Contingent deferred sales charge (CDSC) is generally a charge applied at the time of the redemption of class B or C shares and assumes redemption at the end of the period. Your fund’s class B CDSC declines over time from a 5% maximum during the first year to 1% during the sixth year. After the sixth year, the CDSC no longer applies. The CDSC for class C shares is 1% for one year after purchase.
Share classesClass A shares are generally subject to an initial sales charge and no CDSC (except on certain redemptions of shares bought without an initial sales charge).
Class B shares are closed to new investments and are only available by exchange from another Putnam fund or through dividend and/or capital gains reinvestment. They are not subject to an initial sales charge and may be subject to a CDSC.
Class C shares are not subject to an initial sales charge and are subject to a CDSC only if the shares are redeemed during the first year.
Class M shares have a lower initial sales charge and a higher 12b-1 fee than class A shares and no CDSC.
Class R shares are not subject to an initial sales charge or CDSC and are only available to employer-sponsored retirement plans.
Class Y shares are not subject to an initial sales charge or CDSC, and carry no 12b-1 fee. They are generally only available to corporate and institutional clients and clients in other approved programs.
Comparative indexesBloomberg Barclays U.S. Aggregate Bond Index is an unmanaged index of U.S. investment-grade fixed-income securities.
ICE BofAML U.S. 3-Month Treasury Bill Index is an unmanaged index that seeks to measure the performance of U.S. Treasury bills available in the marketplace.
S&P 500 Index is an unmanaged index of common stock performance.Indexes assume reinvestment of all distributions and do not account for fees. Securities and performance of a fund and an index will differ. You cannot invest directly in an index.
ICE Data Indices, LLC (“ICE BofAML”), used with permis-sion. ICE BofAML permits use of the ICE BofAML indices and related data on an “as is” basis; makes no warran-ties regarding same; does not guarantee the suitability, quality, accuracy, timeliness, and/or completeness of the ICE BofAML indices or any data included in, related to, or derived therefrom; assumes no liability in connec-tion with the use of the foregoing; and does not sponsor, endorse, or recommend Putnam Investments, or any of its products or services.
Equity Spectrum Fund 13
Other information for shareholders
Important notice regarding delivery of shareholder documentsIn accordance with Securities and Exchange Commission (SEC) regulations, Putnam sends a single copy of annual and semiannual shareholder reports, prospectuses, and proxy statements to Putnam shareholders who share the same address, unless a shareholder requests otherwise. If you prefer to receive your own copy of these documents, please call Putnam at 1-800-225-1581, and Putnam will begin sending individual copies within 30 days.
Proxy votingPutnam is committed to managing our mutual funds in the best interests of our shareholders. The Putnam funds’ proxy voting guidelines and procedures, as well as information regarding how your fund voted proxies relating to portfolio securities during the 12-month period ended June 30, 2017, are available in the Individual Investors section of putnam.com, and on the SEC’s website, www.sec.gov. If you have questions about finding forms on the SEC’s website, you may call the SEC at 1-800-SEC-0330. You may also obtain the Putnam funds’ proxy voting guidelines and
procedures at no charge by calling Putnam’s Shareholder Services at 1-800-225-1581.
Fund portfolio holdingsThe fund will file a complete schedule of its portfolio holdings with the SEC for the first and third quarters of each fiscal year on Form N-Q. Shareholders may obtain the fund’s Form N-Q on the SEC’s website at www.sec.gov. In addition, the fund’s Form N-Q may be reviewed and copied at the SEC’s Public Reference Room in Washington, D.C. You may call the SEC at 1-800-SEC-0330 for information about the SEC’s website or the operation of the Public Reference Room.
Trustee and employee fund ownershipPutnam employees and members of the Board of Trustees place their faith, confidence, and, most importantly, investment dollars in Putnam mutual funds. As of October 31, 2017, Putnam employees had approximately $515,000,000 and the Trustees had approxi-mately $91,000,000 invested in Putnam mutual funds. These amounts include investments by the Trustees’ and employees’ immediate family members as well as investments through retirement and deferred compensation plans.
14 Equity Spectrum Fund
Trustee approval of management contract
Trustee approval of management contract
General conclusionsThe Board of Trustees of The Putnam Funds oversees the management of each fund and, as required by law, determines annually whether to approve the continuance of your fund’s management contract with Putnam Investment Management, LLC (“Putnam Management”), the sub-management contract with respect to your fund between Putnam Management and its affiliate, Putnam Investments Limited (“PIL”), and the sub-advisory contract among Putnam Management, PIL, and another affiliate, The Putnam Advisory Company (“PAC”). The Board, with the assistance of its Contract Committee, requests and evaluates all information it deems reasonably necessary under the circumstances in connection with its annual contract review. The Contract Committee consists solely of Trustees who are not “interested persons” (as this term is defined in the Investment Company Act of 1940, as amended (the “1940 Act”)) of The Putnam Funds (“Independent Trustees”).
At the outset of the review process, members of the Board’s independent staff and independent legal counsel discussed with representatives of Putnam Management the annual contract review materials furnished to the Contract Committee during the course of the previous year’s review, identifying possible changes in these materi-als that might be necessary or desirable for the coming year. Following these discussions and in consultation with the Contract Committee, the Independent Trustees’ independent legal counsel requested that Putnam Management and its affiliates furnish specified information, together with any additional information that Putnam Management considered relevant, to the Contract Committee. Over the course of several months ending in June 2017, the Contract Committee met on a number of occasions with representatives of Putnam Management, and separately in executive session, to consider the information that Putnam Management provided. Throughout this process, the Contract Committee was assisted by the members of the Board’s independent staff and by independent legal counsel for The Putnam Funds and the Independent Trustees.
In May 2017, the Contract Committee met in executive session to discuss and consider its recommendations with respect to the continuance of the contracts. At the Trustees’
June 2017 meeting, the Contract Committee met in executive session with the other Independent Trustees to review a summary of the key financial, performance and other data that the Contract Committee considered in the course of its review. The Contract Committee then presented its written report, which summarized the key factors that the Committee had considered and set forth its recommendations. The Contract Committee recommended, and the Independent Trust-ees approved, the continuance of your fund’s management, sub-management and sub-advisory contracts, effective July 1, 2017. (Because PIL and PAC are affiliates of Putnam Management and Putnam Management remains fully responsible for all services provided by PIL and PAC, the Trust-ees have not attempted to evaluate PIL or PAC as separate entities, and all subsequent references to Putnam Management below should be deemed to include reference to PIL and PAC as necessary or appropriate in the context.)
The Independent Trustees’ approval was based on the following conclusions:
• That the fee schedule in effect for your fund repre-sented reasonable compensation in light of the nature and quality of the services being provided to the fund, the fees paid by competitive funds, the costs incurred by Putnam Management in providing services to the fund, and the continued application of certain reductions and waivers noted below; and
• That the fee schedule in effect for your fund represented an appropriate sharing between fund shareholders and Putnam Management of such economies of scale as may exist in the management of the fund at current asset levels.
These conclusions were based on a comprehen-sive consideration of all information provided to the Trustees and were not the result of any single factor. Some of the factors that figured particu-larly in the Trustees’ deliberations and how the Trustees considered these factors are described below, although individual Trustees may have evaluated the information presented differently, giving different weights to various factors. It is also important to recognize that the management arrangements for your fund and the other Putnam funds are the result of many years of review and discussion between the Independent Trustees and Putnam Management, that some aspects of
Equity Spectrum Fund 15
the arrangements may receive greater scrutiny in some years than others, and that the Trust-ees’ conclusions may be based, in part, on their consideration of fee arrangements in previous years. For example, with some minor exceptions, the funds’ current fee arrangements under the management contracts were first implemented at the beginning of 2010 following extensive review by the Contract Committee and discussions with representatives of Putnam Management, as well as approval by shareholders.
Management fee schedules and total expensesThe Trustees reviewed the management fee schedules in effect for all Putnam funds, includ-ing fee levels and breakpoints. The Trustees also reviewed the total expenses of each Putnam fund, recognizing that in most cases management fees represented the major, but not the sole, deter-minant of total costs to fund shareholders. (In a few instances, funds have implemented so-called “all-in” management fees covering substantially all routine fund operating costs.)
In reviewing fees and expenses, the Trustees generally focus their attention on material changes in circumstances — for example, changes in assets under management, changes in a fund’s investment strategy, changes in Putnam Management’s operating costs or profitability, or changes in competitive practices in the mutual fund industry — that suggest that consideration of fee changes might be warranted. The Trustees concluded that the circumstances did not indicate that changes to the management fee structure for your fund would be appropriate at this time.
Under its management contract, your fund has the benefit of breakpoints in its management fee schedule that provide shareholders with econo-mies of scale in the form of reduced fee rates as assets under management in the Putnam family of funds increase. The Trustees concluded that the fee schedule in effect for your fund represented an appropriate sharing of econo-mies of scale between fund shareholders and Putnam Management.
In addition, your fund’s management contract provides that its management fees will be adjusted up or down depending upon whether your fund’s performance is better or worse than the performance of an appropriate index of securities prices specified in the management contract. In the course of reviewing investment
performance, the Trustees examined the operation of your fund’s performance fees and concluded that these fees were operating effectively to align further Putnam Manage-ment’s economic interests with those of the fund’s shareholders.
As in the past, the Trustees also focused on the competitiveness of each fund’s total expense ratio. In order to support the effort to have fund expenses meet competitive standards, the Trust-ees and Putnam Management have implemented certain expense limitations that were in effect during your fund’s fiscal year ending in 2016. These expense limitations were: (i) a contractual expense limitation applicable to specified retail open-end funds, including your fund, of 32 basis points on investor servicing fees and expenses, reduced to 25 basis points effective September 1, 2016, and (ii) a contractual expense limitation applicable to specified open-end funds, including your fund, of 20 basis points on so-called “other expenses” (i.e., all expenses exclusive of manage-ment fees, distribution fees, investor servicing fees, investment-related expenses, interest, taxes, brokerage commissions, acquired fund fees and expenses and extraordinary expenses). These expense limitations attempt to maintain compet-itive expense levels for the funds. Most funds, including your fund, had sufficiently low expenses that these expense limitations were not operative during their fiscal years ending in 2016. Putnam Management has agreed to maintain the 25 basis points expense limitation until at least August 31, 2018 and to maintain the 20 basis points expense limitation until at least August 30, 2018. Putnam Management’s support for these expense limita-tion arrangements was an important factor in the Trustees’ decision to approve the continuance of your fund’s management, sub-management and sub-advisory contracts.
The Trustees reviewed comparative fee and expense information for a custom group of competitive funds selected by Broadridge Financial Solutions, Inc. (“Broadridge”). This comparative information included your fund’s percentile ranking for effective management fees and total expenses (excluding any applicable 12b-1 fee), which provides a general indication of your fund’s relative standing. In the custom peer group, your fund ranked in the second quintile in effective management fees (determined for your fund and the other funds in the custom peer group based on fund asset size and the applicable contractual management fee schedule) and in the
16 Equity Spectrum Fund
second quintile in total expenses (excluding any applicable 12b-1 fees) as of December 31, 2016. The first quintile represents the least expensive funds and the fifth quintile the most expensive funds. The fee and expense data reported by Broadridge as of December 31, 2016 reflected the most recent fiscal year-end data available in Broadridge’s database at that time.
In connection with their review of fund manage-ment fees and total expenses, the Trustees also reviewed the costs of the services provided and the profits realized by Putnam Management and its affiliates from their contractual relationships with the funds. This information included trends in revenues, expenses and profitability of Putnam Management and its affiliates relating to the investment management, investor servicing and distribution services provided to the funds. In this regard, the Trustees also reviewed an analysis of Putnam Management’s revenues, expenses and profitability, allocated on a fund-by-fund basis, with respect to the funds’ management, distribu-tion, and investor servicing contracts. For each fund, the analysis presented information about revenues, expenses and profitability for each of the agreements separately and for the agree-ments taken together on a combined basis. The Trustees concluded that, at current asset levels, the fee schedules in place represented reasonable compensation for the services being provided and represented an appropriate sharing between fund shareholders and Putnam Management of such economies of scale as may exist in the management of the Putnam funds at that time.
The information examined by the Trustees in connection with their annual contract review for the Putnam funds included information regard-ing fees charged by Putnam Management and its affiliates to institutional clients, including defined benefit pension and profit-sharing plans, charities, college endowments, foundations, sub-advised third-party mutual funds, state, local and non-U.S. government entities, and corpora-tions. This information included, in cases where an institutional product’s investment strategy corresponds with a fund’s strategy, comparisons of those fees with fees charged to the Putnam funds, as well as an assessment of the differences in the services provided to these different types of clients as compared to the services provided to the Putnam Funds. The Trustees observed that the differences in fee rates between these clients and the Putnam funds are by no means uniform when examined by individual asset sectors,
suggesting that differences in the pricing of invest-ment management services to these types of clients may reflect, among other things, historical competitive forces operating in separate markets. The Trustees considered the fact that in many cases fee rates across different asset classes are higher on average for mutual funds than for insti-tutional clients, as well as the differences between the services that Putnam Management provides to the Putnam funds and those that it provides to its other clients. The Trustees did not rely on these comparisons to any significant extent in conclud-ing that the management fees paid by your fund are reasonable.
Investment performanceThe quality of the investment process provided by Putnam Management represented a major factor in the Trustees’ evaluation of the quality of services provided by Putnam Management under your fund’s management contract. The Trust-ees were assisted in their review of the Putnam funds’ investment process and performance by the work of the investment oversight committees of the Trustees, which meet on a regular basis with the funds’ portfolio teams and with the Chief Investment Officers and other senior members of Putnam Management’s Investment Division throughout the year. In addition, in response to a request from the Independent Trustees, Putnam Management provided the Trustees with in-depth presentations regarding each of the equity and fixed income investment teams, including the operation of the teams and their investment approaches. The Trustees concluded that Putnam Management generally provides a high-quality investment process — based on the experience and skills of the individuals assigned to the management of fund portfolios, the resources made available to them, and in general Putnam Management’s ability to attract and retain high-quality personnel — but also recognized that this does not guarantee favorable investment results for every fund in every time period.
The Trustees considered that 2016 was a challeng-ing year for the performance of the Putnam funds, with generally disappointing results for the inter-national and global equity funds and taxable fixed income funds, mixed results for small-cap equity, Spectrum, global asset allocation, equity research and tax exempt fixed income funds, but generally strong results for U.S. equity funds. The Trustees noted, however, that they were encouraged by the positive performance trend since mid-year
Equity Spectrum Fund 17
2016 across most Putnam Funds. In particular, from May 1, 2016 through April 30, 2017, 51% of Putnam Fund assets were in the top quartile and 87% were above the median of the Putnam Funds’ competitive industry rankings. They noted that the longer-term performance of the Putnam funds generally continued to be strong, exemplified by the fact that the Putnam funds were ranked by the Barron’s/Lipper Fund Families survey as the 5th-best performing mutual fund complex out of 54 complexes for the five-year period ended December 31, 2016. In addition, while the survey ranked the Putnam Funds 52nd out of 61 mutual fund complexes for the one-year period ended 2016, the Putnam Funds have ranked 1st or 2nd in the survey for the one-year period three times since 2009 (most recently in 2013). They also noted, however, the disappointing investment performance of some funds for periods ended December 31, 2016 and considered information provided by Putnam Management regarding the factors contributing to the underperformance and actions being taken to improve the performance of these particular funds. The Trustees indicated their intention to continue to monitor closely the performance of those funds, including the effec-tiveness of any efforts Putnam Management has undertaken to address underperformance and whether additional actions to address areas of underperformance are warranted.
For purposes of the Trustees’ evaluation of the Putnam Funds’ investment performance, the Trustees generally focus on a competitive indus-try ranking of each fund’s total net return over a one-year, three-year and five-year period. For a number of Putnam funds with relatively unique investment mandates for which Putnam Manage-ment informed the Trustees that meaningful competitive performance rankings are not consid-ered to be available, the Trustees evaluated performance based on their total gross and net returns and, in most cases, comparisons of those returns with the returns of selected investment benchmarks. In the case of your fund, the Trustees considered information about your fund’s total return and its performance relative to its bench-mark over the one-year, three-year and five-year periods ended December 31, 2016. Your fund’s class A shares’ return net of fees and expenses was positive and trailed the return of its benchmark over the one-year and five-year periods and was negative and trailed the return of its benchmark over the three-year period. (When considering performance information, shareholders should be
mindful that past performance is not a guarantee of future results.)
The Trustees expressed concern in particular about your fund’s underperformance relative to its benchmark over the one-year and three-year periods ended December 31, 2016 and considered the circumstances that may have contributed to this disappointing performance. The Trustees considered Putnam Management’s view that the fund’s underperformance over these periods was largely attributable to the fund’s large holdings in certain companies, including a telecommunica-tions company and a pharmaceutical company, which had disappointing stock performance.
The Trustees considered that Putnam Manage-ment remained confident in the fund’s portfolio manager. The Trustees also considered Putnam Management’s continued efforts to support fund performance through initiatives including struc-turing compensation for portfolio managers and research analysts to enhance accountability for fund performance, emphasizing accountability in the portfolio management process, and affirm-ing its commitment to a fundamental-driven approach to investing. The Trustees noted further that Putnam Management continued to strengthen its fundamental research capabilities by adding new investment personnel.
As a general matter, the Trustees believe that cooperative efforts between the Trustees and Putnam Management represent the most effec-tive way to address investment performance concerns that may arise from time to time. The Trustees noted that investors in the Putnam funds have, in effect, placed their trust in the Putnam organization, under the oversight of the funds’ Trustees, to make appropriate decisions regarding the management of the funds. Based on Putnam Management’s willingness to take appropriate measures to address fund performance issues and Putnam Management’s responsiveness to Trustee concerns about investment performance, the Trustees concluded that it continues to be advis-able to seek change within Putnam Management to address performance shortcomings. In the Trustees’ view, the alternative of engaging a new investment adviser for an underperforming fund would entail significant disruptions and would not likely provide any greater assurance of improved investment performance.
18 Equity Spectrum Fund
Brokerage and soft-dollar allocations; investor servicingThe Trustees considered various potential benefits that Putnam Management may receive in connection with the services it provides under the management contract with your fund. These include benefits related to brokerage allocation and the use of soft dollars, whereby a portion of the commissions paid by a fund for brokerage may be used to acquire research services that are expected to be useful to Putnam Management in managing the assets of the fund and of other clients. Subject to policies established by the Trustees, soft dollars generated by these means are used predominantly to acquire brokerage and research services (including third-party research and market data) that enhance Putnam Manage-ment’s investment capabilities and supplement Putnam Management’s internal research efforts. However, the Trustees noted that a portion of available soft dollars continues to be used to pay fund expenses. The Trustees indicated their continued intent to monitor regulatory and industry developments in this area with the assis-tance of their Brokerage Committee, including any developments with respect to the European Union’s updated Markets in Financial Instruments Directive and its potential impact on PIL’s use of
client commissions to obtain investment research. The Trustees also indicated their continued intent to monitor the allocation of the Putnam funds’ brokerage in order to ensure that the principle of seeking best price and execution remains paramount in the portfolio trading process.
Putnam Management may also receive benefits from payments that the funds make to Putnam Management’s affiliates for investor or distribution services. In conjunction with the annual review of your fund’s management, sub-management and sub-advisory contracts, the Trustees reviewed your fund’s investor servicing agreement with Putnam Investor Services, Inc. (“PSERV”) and its distributor’s contracts and distribution plans with Putnam Retail Management Limited Partnership (“PRM”), both of which are affiliates of Putnam Management. The Trustees concluded that the fees payable by the funds to PSERV and PRM, as applicable, for such services are fair and reason-able in relation to the nature and quality of such services, the fees paid by competitive funds, and the costs incurred by PSERV and PRM, as appli-cable, in providing such services. Furthermore, the Trustees were of the view that the services provided were required for the operation of the funds, and that they were of a quality at least equal to those provided by other providers.
Equity Spectrum Fund 19
Financial statements
20 Equity Spectrum Fund
Financial statements
These sections of the report, as well as the accompanying Notes, constitute the fund’s financial statements.
The fund’s portfolio lists all the fund’s investments and their values as of the last day of the reporting period. Holdings are organized by asset type and industry sector, country, or state to show areas of concentration and diversification.
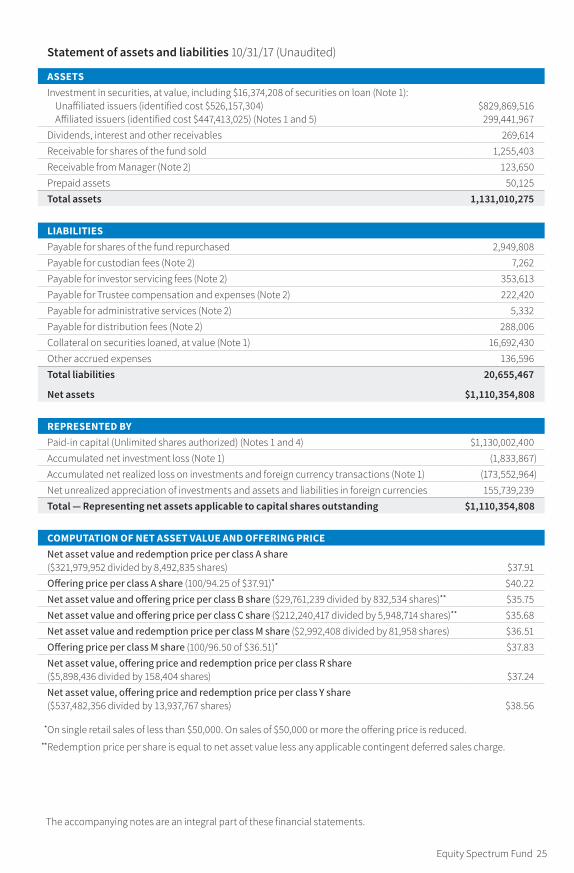
Statement of assets and liabilities shows how the fund’s net assets and share price are determined. All investment and non-investment assets are added together. Any unpaid expenses and other liabilities are subtracted from this total. The result is divided by the number of shares to determine the net asset value per share, which is calculated separately for each class of shares. (For funds with preferred shares, the amount subtracted from total assets includes the liquidation preference of preferred shares.)
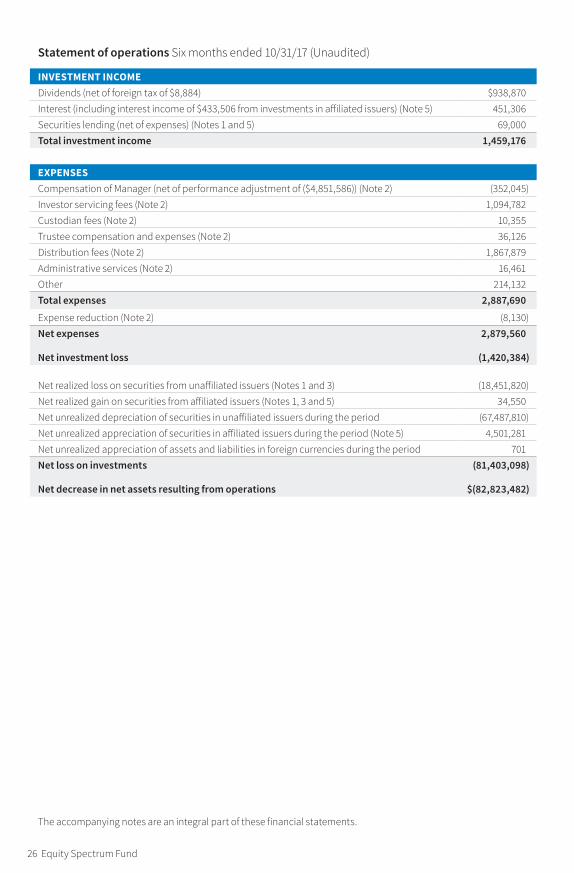
Statement of operations shows the fund’s net investment gain or loss. This is done by first adding up all the fund’s earnings — from dividends and interest income — and subtracting its operating expenses to determine net investment income (or loss). Then, any net gain or loss the fund realized on the sales of its holdings — as well as any unrealized gains or losses over the period — is added to
or subtracted from the net investment result to determine the fund’s net gain or loss for the fiscal period.
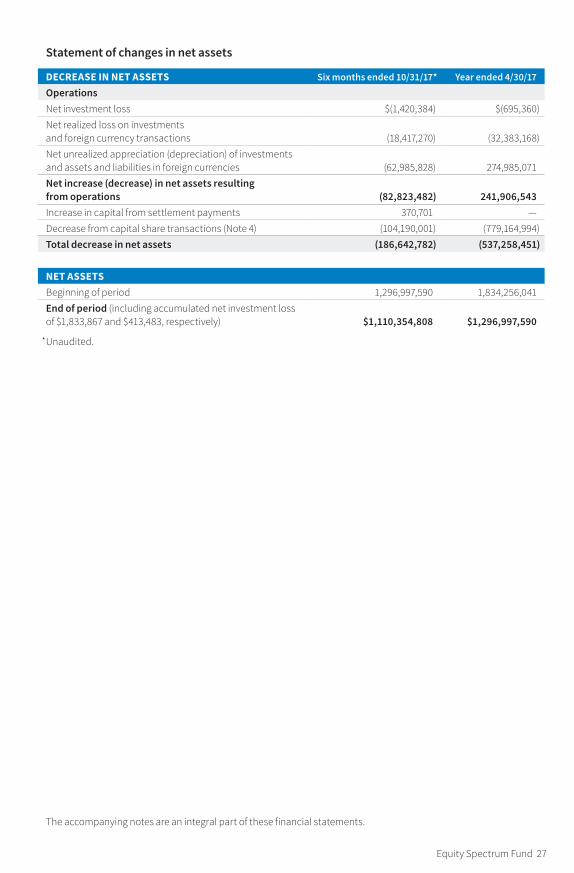
Statement of changes in net assets shows how the fund’s net assets were affected by the fund’s net investment gain or loss, by distributions to shareholders, and by changes in the number of the fund’s shares. It lists distributions and their sources (net investment income or realized capital gains) over the current reporting period and the most recent fiscal year-end. The distributions listed here may not match the sources listed in the Statement of operations because the distributions are determined on a tax basis and may be paid in a different period from the one in which they were earned. Dividend sources are estimated at the time of declaration. Actual results may vary. Any non-taxable return of capital cannot be determined until final tax calculations are completed after the end of the fund’s fiscal year.
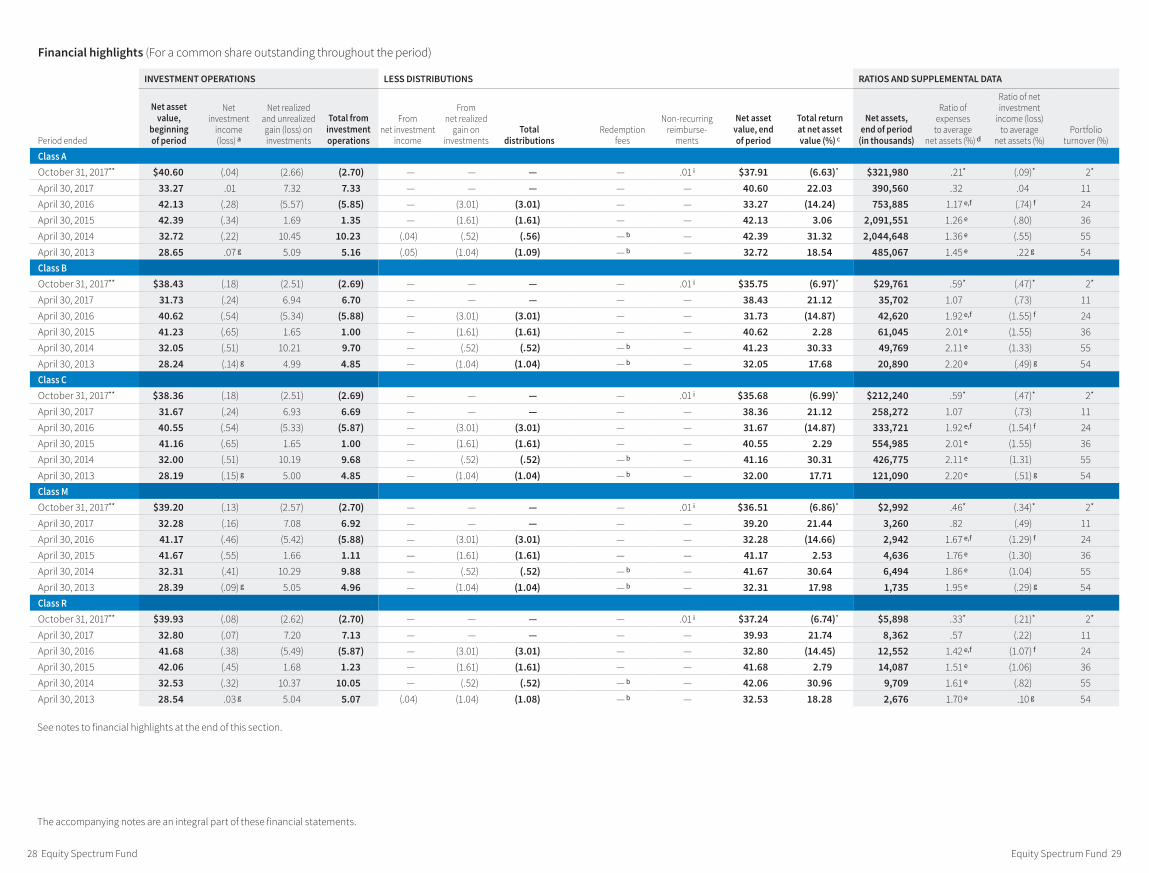
Financial highlights provide an overview of the fund’s investment results, per-share distributions, expense ratios, net investment income ratios, and portfolio turnover in one summary table, reflecting the five most recent reporting periods. In a semiannual report, the highlights table also includes the current reporting period.
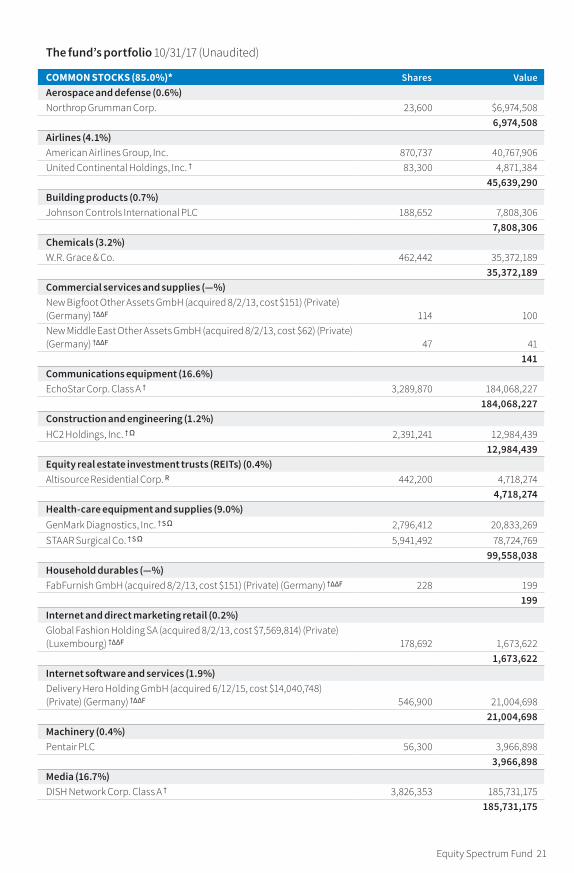
Equity Spectrum Fund 21
COMMON STOCKS (85.0%)* Shares ValueAerospace and defense (0.6%)Northrop Grumman Corp. 23,600 $6,974,508
6,974,508Airlines (4.1%)American Airlines Group, Inc. 870,737 40,767,906United Continental Holdings, Inc. † 83,300 4,871,384
45,639,290Building products (0.7%)Johnson Controls International PLC 188,652 7,808,306
7,808,306Chemicals (3.2%)W.R. Grace & Co. 462,442 35,372,189
35,372,189Commercial services and supplies (—%)New Bigfoot Other Assets GmbH (acquired 8/2/13, cost $151) (Private) (Germany) †∆∆ F 114 100New Middle East Other Assets GmbH (acquired 8/2/13, cost $62) (Private) (Germany) †∆∆ F 47 41
141Communications equipment (16.6%)EchoStar Corp. Class A † 3,289,870 184,068,227
184,068,227Construction and engineering (1.2%)HC2 Holdings, Inc. † Ω 2,391,241 12,984,439
12,984,439Equity real estate investment trusts (REITs) (0.4%)Altisource Residential Corp. R 442,200 4,718,274
4,718,274Health-care equipment and supplies (9.0%)GenMark Diagnostics, Inc. † S Ω 2,796,412 20,833,269STAAR Surgical Co. † S Ω 5,941,492 78,724,769
99,558,038Household durables (—%)FabFurnish GmbH (acquired 8/2/13, cost $151) (Private) (Germany) †∆∆ F 228 199
199Internet and direct marketing retail (0.2%)Global Fashion Holding SA (acquired 8/2/13, cost $7,569,814) (Private) (Luxembourg) †∆∆ F 178,692 1,673,622
1,673,622Internet software and services (1.9%)Delivery Hero Holding GmbH (acquired 6/12/15, cost $14,040,748) (Private) (Germany) †∆∆ F 546,900 21,004,698
21,004,698Machinery (0.4%)Pentair PLC 56,300 3,966,898
3,966,898Media (16.7%)DISH Network Corp. Class A † 3,826,353 185,731,175
185,731,175
The fund’s portfolio 10/31/17 (Unaudited)
22 Equity Spectrum Fund
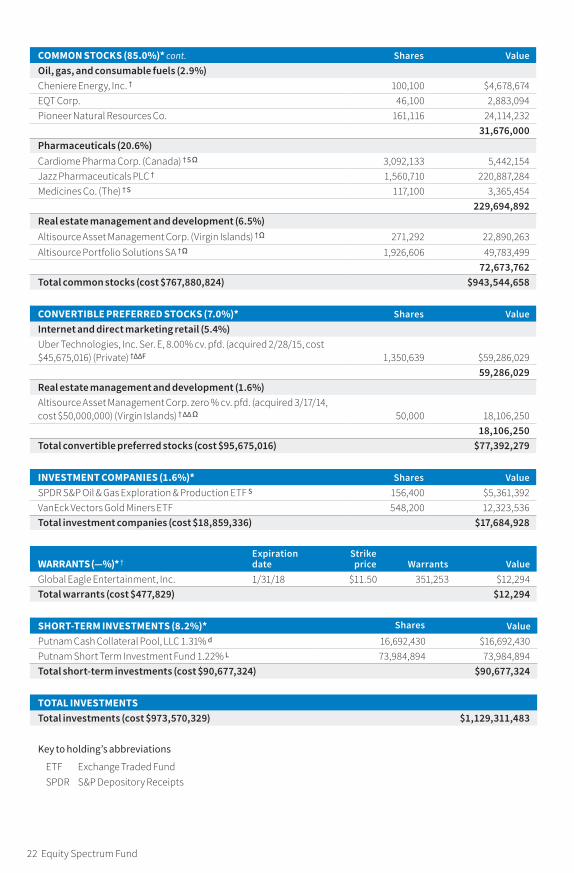
COMMON STOCKS (85.0%)* cont. Shares ValueOil, gas, and consumable fuels (2.9%)Cheniere Energy, Inc. † 100,100 $4,678,674EQT Corp. 46,100 2,883,094Pioneer Natural Resources Co. 161,116 24,114,232
31,676,000Pharmaceuticals (20.6%)Cardiome Pharma Corp. (Canada) † S Ω 3,092,133 5,442,154Jazz Pharmaceuticals PLC † 1,560,710 220,887,284Medicines Co. (The) † S 117,100 3,365,454
229,694,892Real estate management and development (6.5%)Altisource Asset Management Corp. (Virgin Islands) † Ω 271,292 22,890,263Altisource Portfolio Solutions SA † Ω 1,926,606 49,783,499
72,673,762Total common stocks (cost $767,880,824) $943,544,658
CONVERTIBLE PREFERRED STOCKS (7.0%)* Shares ValueInternet and direct marketing retail (5.4%)Uber Technologies, Inc. Ser. E, 8.00% cv. pfd. (acquired 2/28/15, cost $45,675,016) (Private) †∆∆ F 1,350,639 $59,286,029
59,286,029Real estate management and development (1.6%)Altisource Asset Management Corp. zero % cv. pfd. (acquired 3/17/14, cost $50,000,000) (Virgin Islands) † ∆∆ Ω 50,000 18,106,250
18,106,250Total convertible preferred stocks (cost $95,675,016) $77,392,279
INVESTMENT COMPANIES (1.6%)* Shares ValueSPDR S&P Oil & Gas Exploration & Production ETF S 156,400 $5,361,392VanEck Vectors Gold Miners ETF 548,200 12,323,536Total investment companies (cost $18,859,336) $17,684,928
WARRANTS (—%)* † Expiration date
Strike price Warrants Value
Global Eagle Entertainment, Inc. 1/31/18 $11.50 351,253 $12,294Total warrants (cost $477,829) $12,294
SHORT-TERM INVESTMENTS (8.2%)* Shares ValuePutnam Cash Collateral Pool, LLC 1.31% d 16,692,430 $16,692,430Putnam Short Term Investment Fund 1.22% L 73,984,894 73,984,894Total short-term investments (cost $90,677,324) $90,677,324
TOTAL INVESTMENTSTotal investments (cost $973,570,329) $1,129,311,483
Key to holding’s abbreviations
ETF Exchange Traded FundSPDR S&P Depository Receipts
Equity Spectrum Fund 23
Notes to the fund’s portfolio
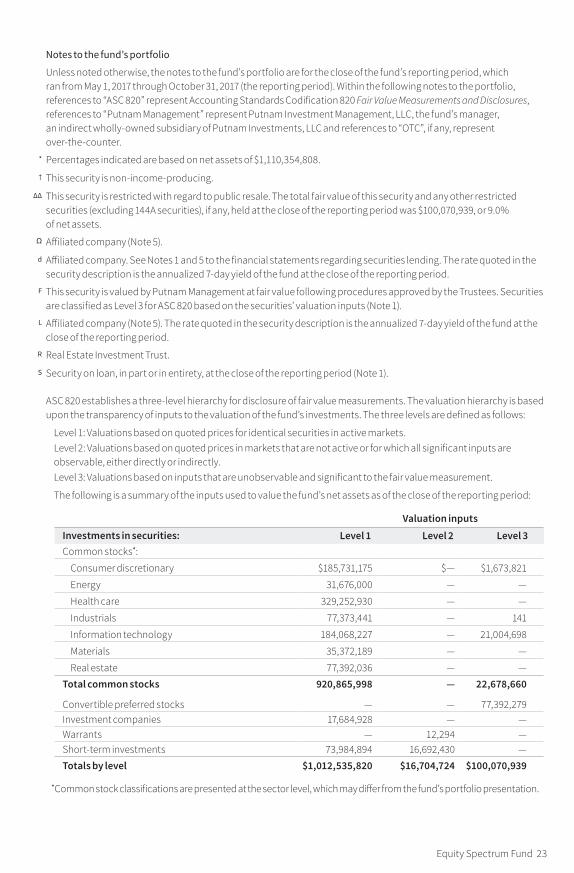
Unless noted otherwise, the notes to the fund’s portfolio are for the close of the fund’s reporting period, which ran from May 1, 2017 through October 31, 2017 (the reporting period). Within the following notes to the portfolio, references to “ASC 820” represent Accounting Standards Codification 820 Fair Value Measurements and Disclosures, references to “Putnam Management” represent Putnam Investment Management, LLC, the fund’s manager, an indirect wholly-owned subsidiary of Putnam Investments, LLC and references to “OTC”, if any, represent over-the-counter.
* Percentages indicated are based on net assets of $1,110,354,808.
† This security is non-income-producing.
∆∆ This security is restricted with regard to public resale. The total fair value of this security and any other restricted securities (excluding 144A securities), if any, held at the close of the reporting period was $100,070,939, or 9.0% of net assets.
Ω Affiliated company (Note 5).
d Affiliated company. See Notes 1 and 5 to the financial statements regarding securities lending. The rate quoted in the security description is the annualized 7-day yield of the fund at the close of the reporting period.
F This security is valued by Putnam Management at fair value following procedures approved by the Trustees. Securities are classified as Level 3 for ASC 820 based on the securities’ valuation inputs (Note 1).
L Affiliated company (Note 5). The rate quoted in the security description is the annualized 7-day yield of the fund at the close of the reporting period.
R Real Estate Investment Trust.
S Security on loan, in part or in entirety, at the close of the reporting period (Note 1).
ASC 820 establishes a three-level hierarchy for disclosure of fair value measurements. The valuation hierarchy is based upon the transparency of inputs to the valuation of the fund’s investments. The three levels are defined as follows:
Level 1: Valuations based on quoted prices for identical securities in active markets.Level 2: Valuations based on quoted prices in markets that are not active or for which all significant inputs are observable, either directly or indirectly.Level 3: Valuations based on inputs that are unobservable and significant to the fair value measurement.
The following is a summary of the inputs used to value the fund’s net assets as of the close of the reporting period:
Valuation inputsInvestments in securities: Level 1 Level 2 Level 3Common stocks * :
Consumer discretionary $185,731,175 $— $1,673,821
Energy 31,676,000 — —
Health care 329,252,930 — —
Industrials 77,373,441 — 141
Information technology 184,068,227 — 21,004,698
Materials 35,372,189 — —
Real estate 77,392,036 — — Total common stocks 920,865,998 — 22,678,660
Convertible preferred stocks — — 77,392,279Investment companies 17,684,928 — — Warrants — 12,294 — Short-term investments 73,984,894 16,692,430 — Totals by level $1,012,535,820 $16,704,724 $100,070,939
* Common stock classifications are presented at the sector level, which may differ from the fund’s portfolio presentation .
24 Equity Spectrum Fund
The accompanying notes are an integral part of these financial statements.
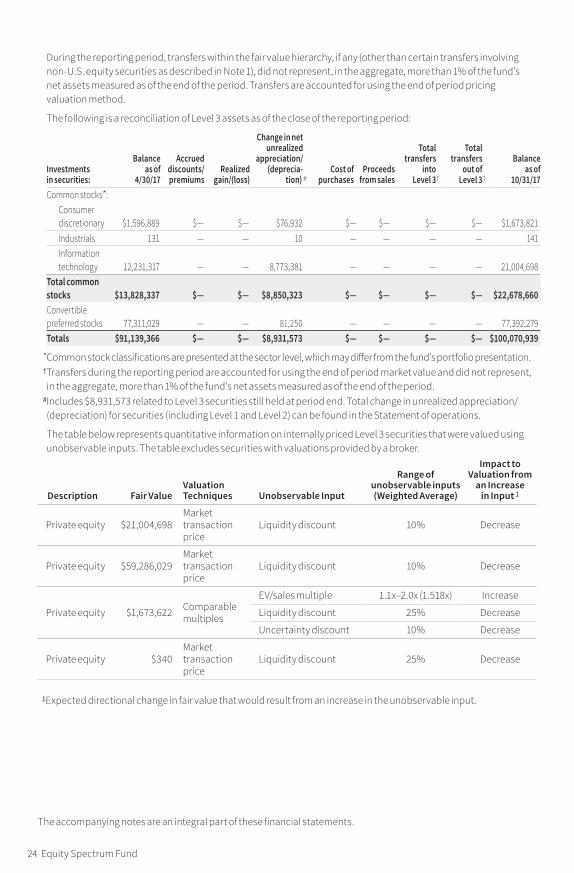
During the reporting period, transfers within the fair value hierarchy, if any (other than certain transfers involving non-U.S. equity securities as described in Note 1 ), did not represent, in the aggregate, more than 1% of the fund’s net assets measured as of the end of the period. Transfers are accounted for using the end of period pricing valuation method.
The following is a reconciliation of Level 3 assets as of the close of the reporting period:
Investments in securities:
Balance as of
4/30/17
Accrued discounts/premiums
Realized gain/(loss )
Change in net unrealized appreciation/ (deprecia- tion ) #
Cost of purchases
Proceeds from sales
Total transfers into Level 3 †
Total transfers out of Level 3 †
Balance as of
10/31/17Common stocks * :
Consumer discretionary $1,596,889 $— $— $76,932 $— $— $— $— $1,673,821Industrials 131 — — 10 — — — — 141Information technology 12,231,317 — — 8,773,381 — — — — 21,004,698
Total common stocks $13,828,337 $— $— $8,850,323 $— $— $— $— $22,678,660Convertible preferred stocks 77,311,029 — — 81,250 — — — — 77,392,279Totals $91,139,366 $— $— $8,931,573 $— $— $— $— $100,070,939
*Common stock classifications are presented at the sector level, which may differ from the fund’s portfolio presentation.† Transfers during the reporting period are accounted for using the end of period market value and did not represent, in the aggregate, more than 1% of the fund’s net assets measured as of the end of the period.
# Includes $8,931,573 related to Level 3 securities still held at period end. Total change in unrealized appreciation/(depreciation ) for securities (including Level 1 and Level 2 ) can be found in the Statement of operations.
The table below represents quantitative information on internally priced Level 3 securities that were valued using unobservable inputs. The table excludes securities with valuations provided by a broker.
Description Fair ValueValuation Techniques Unobservable Input
Range of unobservable inputs (Weighted Average )
Impact to Valuation from
an Increase in Input 1
Private equity $21,004,698Market transaction price
Liquidity discount 10% Decrease
Private equity $59,286,029Market transaction price
Liquidity discount 10% Decrease
Comparable multiples
EV/sales multiple 1.1x–2.0x (1.518x ) Increase
Private equity $1,673,622 Liquidity discount 25% Decrease
Uncertainty discount 10% Decrease
Private equity $340Market transaction price
Liquidity discount 25% Decrease
1Expected directional change in fair value that would result from an increase in the unobservable input.
The accompanying notes are an integral part of these financial statements.
Statement of assets and liabilities 10/31/17 (Unaudited)
ASSETSInvestment in securities, at value, including $16,374,208 of securities on loan (Note 1):
Unaffiliated issuers (identified cost $526,157,304) $829,869,516 Affiliated issuers (identified cost $447,413,025) (Notes 1 and 5) 299,441,967
Dividends, interest and other receivables 269,614 Receivable for shares of the fund sold 1,255,403 Receivable from Manager (Note 2) 123,650 Prepaid assets 50,125 Total assets 1,131,010,275
LIABILITIESPayable for shares of the fund repurchased 2,949,808 Payable for custodian fees (Note 2) 7,262 Payable for investor servicing fees (Note 2) 353,613 Payable for Trustee compensation and expenses (Note 2) 222,420 Payable for administrative services (Note 2) 5,332 Payable for distribution fees (Note 2) 288,006 Collateral on securities loaned, at value (Note 1) 16,692,430 Other accrued expenses 136,596 Total liabilities 20,655,467
Net assets $1,110,354,808
REPRESENTED BYPaid-in capital (Unlimited shares authorized) (Notes 1 and 4) $1,130,002,400 Accumulated net investment loss (Note 1) (1,833,867)Accumulated net realized loss on investments and foreign currency transactions (Note 1) (173,552,964)Net unrealized appreciation of investments and assets and liabilities in foreign currencies 155,739,239 Total — Representing net assets applicable to capital shares outstanding $1,110,354,808
COMPUTATION OF NET ASSET VALUE AND OFFERING PRICENet asset value and redemption price per class A share ($321,979,952 divided by 8,492,835 shares) $37.91 Offering price per class A share (100/94.25 of $37.91)* $40.22 Net asset value and offering price per class B share ($29,761,239 divided by 832,534 shares)** $35.75 Net asset value and offering price per class C share ($212,240,417 divided by 5,948,714 shares)** $35.68 Net asset value and redemption price per class M share ($2,992,408 divided by 81,958 shares) $36.51 Offering price per class M share (100/96.50 of $36.51)* $37.83 Net asset value, offering price and redemption price per class R share ($5,898,436 divided by 158,404 shares) $37.24 Net asset value, offering price and redemption price per class Y share ($537,482,356 divided by 13,937,767 shares) $38.56
*On single retail sales of less than $50,000. On sales of $50,000 or more the offering price is reduced.**Redemption price per share is equal to net asset value less any applicable contingent deferred sales charge.
Equity Spectrum Fund 25
The accompanying notes are an integral part of these financial statements.
Statement of operations Six months ended 10/31/17 (Unaudited)
INVESTMENT INCOMEDividends (net of foreign tax of $8,884) $938,870 Interest (including interest income of $433,506 from investments in affiliated issuers) (Note 5) 451,306Securities lending (net of expenses) (Notes 1 and 5) 69,000 Total investment income 1,459,176
EXPENSESCompensation of Manager (net of performance adjustment of ($4,851,586)) (Note 2) (352,045)Investor servicing fees (Note 2) 1,094,782 Custodian fees (Note 2) 10,355 Trustee compensation and expenses (Note 2) 36,126 Distribution fees (Note 2) 1,867,879 Administrative services (Note 2) 16,461 Other 214,132 Total expenses 2,887,690
Expense reduction (Note 2) (8,130)Net expenses 2,879,560
Net investment loss (1,420,384)
Net realized loss on securities from unaffiliated issuers (Notes 1 and 3) (18,451,820)Net realized gain on securities from affiliated issuers (Notes 1, 3 and 5) 34,550 Net unrealized depreciation of securities in unaffiliated issuers during the period (67,487,810)Net unrealized appreciation of securities in affiliated issuers during the period (Note 5) 4,501,281 Net unrealized appreciation of assets and liabilities in foreign currencies during the period 701 Net loss on investments (81,403,098)
Net decrease in net assets resulting from operations $(82,823,482)
26 Equity Spectrum Fund
The accompanying notes are an integral part of these financial statements.
Statement of changes in net assets
DECREASE IN NET ASSETS Six months ended 10/31/17* Year ended 4/30/17OperationsNet investment loss $(1,420,384) $(695,360)Net realized loss on investments and foreign currency transactions (18,417,270) (32,383,168)Net unrealized appreciation (depreciation) of investments and assets and liabilities in foreign currencies (62,985,828) 274,985,071 Net increase (decrease) in net assets resulting from operations (82,823,482) 241,906,543 Increase in capital from settlement payments 370,701 — Decrease from capital share transactions (Note 4) (104,190,001) (779,164,994)Total decrease in net assets (186,642,782) (537,258,451)
NET ASSETSBeginning of period 1,296,997,590 1,834,256,041End of period (including accumulated net investment loss of $1,833,867 and $413,483, respectively) $1,110,354,808 $1,296,997,590
*Unaudited.
Equity Spectrum Fund 27
Equity Spectrum Fund 29 28 Equity Spectrum Fund
The accompanying notes are an integral part of these financial statements.
See notes to financial highlights at the end of this section.
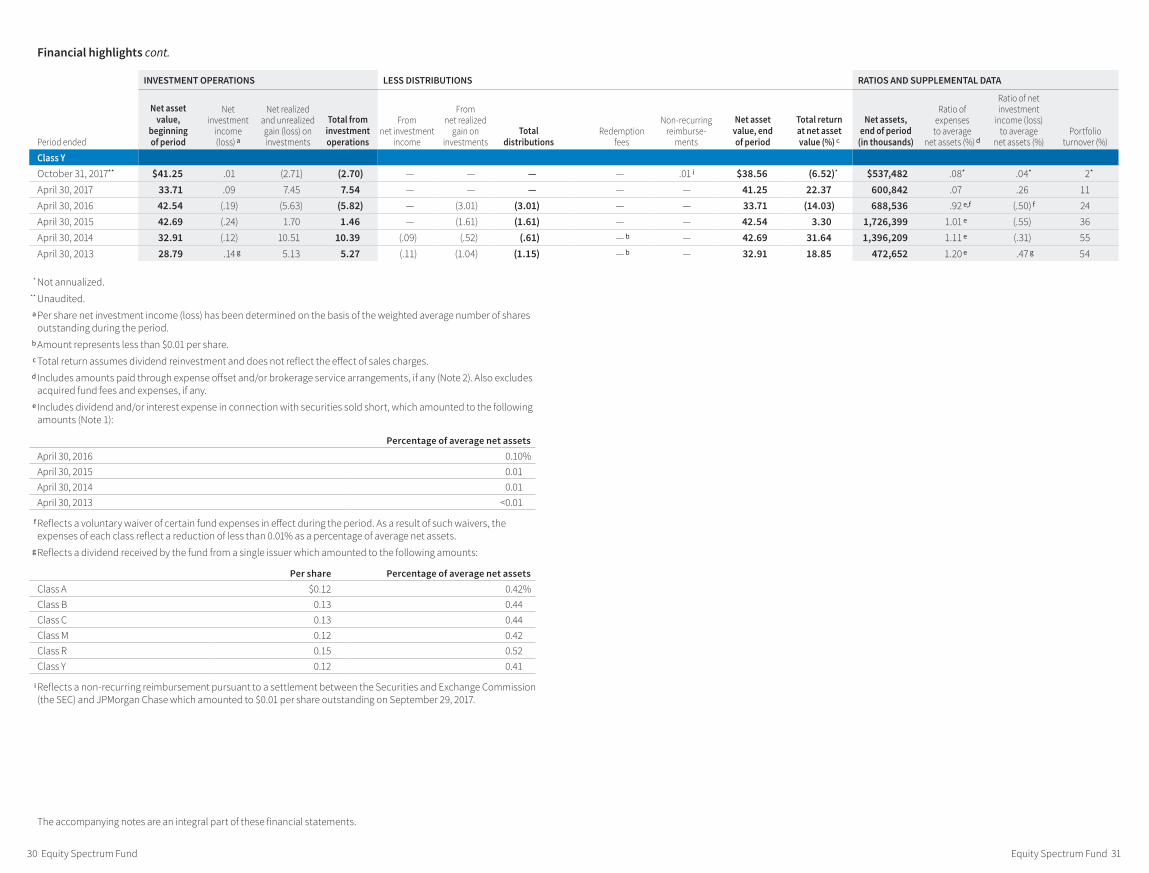
Financial highlights (For a common share outstanding throughout the period)
INVESTMENT OPERATIONS LESS DISTRIBUTIONS RATIOS AND SUPPLEMENTAL DATA
Period ended
Net asset value,
beginning of period
Net investment
income (loss ) a
Net realized and unrealized gain (loss) on investments
Total from investment operations
From net investment
income
From net realized
gain on investments
Total dis tri bu tions
Redemption fees
Non-recurring re im burse-
ments
Net asset value, end of period
Total return at net asset value (% ) c
Net assets, end of period
(in thousands )
Ratio of expenses
to average net assets (% ) d
Ratio of net investment
income (loss) to average
net assets (% )Portfolio
turnover (% )
Class A October 31, 2017 * * $40.60 (.04 ) (2.66 ) (2.70 ) — — — — .01 i $37.91 (6.63 )* $321,980 .21 * (.09 )* 2 * April 30, 2017 33.27 .01 7.32 7.33 — — — — — 40.60 22.03 390,560 .32 .04 11 April 30, 2016 42.13 (.28 ) (5.57 ) (5.85 ) — (3.01 ) (3.01 ) — — 33.27 (14.24 ) 753,885 1.17 e,f (.74 ) f 24 April 30, 2015 42.39 (.34 ) 1.69 1.35 — (1.61 ) (1.61 ) — — 42.13 3.06 2,091,551 1.26 e (.80 ) 36 April 30, 2014 32.72 (.22 ) 10.45 10.23 (.04 ) (.52 ) (.56 ) — b — 42.39 31.32 2,044,648 1.36 e (.55 ) 55 April 30, 2013 28.65 .07 g 5.09 5.16 (.05 ) (1.04 ) (1.09 ) — b — 32.72 18.54 485,067 1.45 e .22 g 54 Class B October 31, 2017 * * $38.43 (.18 ) (2.51 ) (2.69 ) — — — — .01 i $35.75 (6.97 )* $29,761 .59 * (.47 )* 2 * April 30, 2017 31.73 (.24 ) 6.94 6.70 — — — — — 38.43 21.12 35,702 1.07 (.73 ) 11 April 30, 2016 40.62 (.54 ) (5.34 ) (5.88 ) — (3.01 ) (3.01 ) — — 31.73 (14.87 ) 42,620 1.92 e,f (1.55 ) f 24 April 30, 2015 41.23 (.65 ) 1.65 1.00 — (1.61 ) (1.61 ) — — 40.62 2.28 61,045 2.01 e (1.55 ) 36 April 30, 2014 32.05 (.51 ) 10.21 9.70 — (.52 ) (.52 ) — b — 41.23 30.33 49,769 2.11 e (1.33 ) 55 April 30, 2013 28.24 (.14 ) g 4.99 4.85 — (1.04 ) (1.04 ) — b — 32.05 17.68 20,890 2.20 e (.49 ) g 54 Class C October 31, 2017 * * $38.36 (.18 ) (2.51 ) (2.69 ) — — — — .01 i $35.68 (6.99 )* $212,240 .59 * (.47 )* 2 * April 30, 2017 31.67 (.24 ) 6.93 6.69 — — — — — 38.36 21.12 258,272 1.07 (.73 ) 11 April 30, 2016 40.55 (.54 ) (5.33 ) (5.87 ) — (3.01 ) (3.01 ) — — 31.67 (14.87 ) 333,721 1.92 e,f (1.54 ) f 24 April 30, 2015 41.16 (.65 ) 1.65 1.00 — (1.61 ) (1.61 ) — — 40.55 2.29 554,985 2.01 e (1.55 ) 36 April 30, 2014 32.00 (.51 ) 10.19 9.68 — (.52 ) (.52 ) — b — 41.16 30.31 426,775 2.11 e (1.31 ) 55 April 30, 2013 28.19 (.15 ) g 5.00 4.85 — (1.04 ) (1.04 ) — b — 32.00 17.71 121,090 2.20 e (.51 ) g 54 Class M October 31, 2017 * * $39.20 (.13 ) (2.57 ) (2.70 ) — — — — .01 i $36.51 (6.86 )* $2,992 .46 * (.34 )* 2 * April 30, 2017 32.28 (.16 ) 7.08 6.92 — — — — — 39.20 21.44 3,260 .82 (.49 ) 11 April 30, 2016 41.17 (.46 ) (5.42 ) (5.88 ) — (3.01 ) (3.01 ) — — 32.28 (14.66 ) 2,942 1.67 e,f (1.29 ) f 24 April 30, 2015 41.67 (.55 ) 1.66 1.11 — (1.61 ) (1.61 ) — — 41.17 2.53 4,636 1.76 e (1.30 ) 36 April 30, 2014 32.31 (.41 ) 10.29 9.88 — (.52 ) (.52 ) — b — 41.67 30.64 6,494 1.86 e (1.04 ) 55 April 30, 2013 28.39 (.09 ) g 5.05 4.96 — (1.04 ) (1.04 ) — b — 32.31 17.98 1,735 1.95 e (.29 ) g 54 Class R October 31, 2017 * * $39.93 (.08 ) (2.62 ) (2.70 ) — — — — .01 i $37.24 (6.74 )* $5,898 .33 * (.21 )* 2 * April 30, 2017 32.80 (.07 ) 7.20 7.13 — — — — — 39.93 21.74 8,362 .57 (.22 ) 11 April 30, 2016 41.68 (.38 ) (5.49 ) (5.87 ) — (3.01 ) (3.01 ) — — 32.80 (14.45 ) 12,552 1.42 e,f (1.07 ) f 24 April 30, 2015 42.06 (.45 ) 1.68 1.23 — (1.61 ) (1.61 ) — — 41.68 2.79 14,087 1.51 e (1.06 ) 36 April 30, 2014 32.53 (.32 ) 10.37 10.05 — (.52 ) (.52 ) — b — 42.06 30.96 9,709 1.61 e (.82 ) 55 April 30, 2013 28.54 .03 g 5.04 5.07 (.04 ) (1.04 ) (1.08 ) — b — 32.53 18.28 2,676 1.70 e .10 g 54
Equity Spectrum Fund 31 30 Equity Spectrum Fund
Financial highlights cont.
The accompanying notes are an integral part of these financial statements.
* Not annualized. ** Unaudited. a Per share net investment income (loss) has been determined on the basis of the weighted average number of shares
outstanding during the period. b Amount represents less than $0.01 per share. c Total return assumes dividend reinvestment and does not reflect the effect of sales charges. d Includes amounts paid through expense offset and/or brokerage service arrangements, if any (Note 2). Also excludes
acquired fund fees and expenses, if any. e Includes dividend and/or interest expense in connection with securities sold short, which amounted to the following
amounts (Note 1):
Percentage of average net assetsApril 30, 2016 0.10%April 30, 2015 0.01April 30, 2014 0.01April 30, 2013 <0.01
f Reflects a voluntary waiver of certain fund expenses in effect during the period. As a result of such waivers, the expenses of each class reflect a reduction of less than 0.01% as a percentage of average net assets.
g Reflects a dividend received by the fund from a single issuer which amounted to the following amounts:
Per share Percentage of average net assetsClass A $0.12 0.42%Class B 0.13 0.44Class C 0.13 0.44Class M 0.12 0.42Class R 0.15 0.52Class Y 0.12 0.41
i Reflects a non-recurring reimbursement pursuant to a settlement between the Securities and Exchange Commission (the SEC) and JPMorgan Chase which amounted to $0.01 per share outstanding on September 29, 2017.
INVESTMENT OPERATIONS LESS DISTRIBUTIONS RATIOS AND SUPPLEMENTAL DATA
Period ended
Net asset value,
beginning of period
Net investment
income (loss ) a
Net realized and unrealized gain (loss) on investments
Total from investment operations
From net investment
income
From net realized
gain on investments
Total dis tri bu tions
Redemption fees
Non-recurring re im burse-
ments
Net asset value, end of period
Total return at net asset value (% ) c
Net assets, end of period
(in thousands )
Ratio of expenses
to average net assets (% ) d
Ratio of net investment
income (loss) to average
net assets (% )Portfolio
turnover (% )
Class Y October 31, 2017 * * $41.25 .01 (2.71 ) (2.70 ) — — — — .01 i $38.56 (6.52 )* $537,482 .08 * .04 * 2 * April 30, 2017 33.71 .09 7.45 7.54 — — — — — 41.25 22.37 600,842 .07 .26 11 April 30, 2016 42.54 (.19 ) (5.63 ) (5.82 ) — (3.01 ) (3.01 ) — — 33.71 (14.03 ) 688,536 .92 e,f (.50 ) f 24 April 30, 2015 42.69 (.24 ) 1.70 1.46 — (1.61 ) (1.61 ) — — 42.54 3.30 1,726,399 1.01 e (.55 ) 36 April 30, 2014 32.91 (.12 ) 10.51 10.39 (.09 ) (.52 ) (.61 ) — b — 42.69 31.64 1,396,209 1.11 e (.31 ) 55 April 30, 2013 28.79 .14 g 5.13 5.27 (.11 ) (1.04 ) (1.15 ) — b — 32.91 18.85 472,652 1.20 e .47 g 54
32 Equity Spectrum Fund
Notes to financial statements 10/31/17 (Unaudited)
Within the following Notes to financial statements, references to “State Street” represent State Street Bank and Trust Company, references to “the SEC” represent the Securities and Exchange Commission, references to “Putnam Management” represent Putnam Investment Management, LLC, the fund’s manager, an indirect wholly-owned subsidiary of Putnam Investments, LLC and references to “OTC”, if any, represent over-the-counter. Unless otherwise noted, the “reporting period” represents the period from May 1, 2017 through October 31, 2017.
Putnam Equity Spectrum Fund (the fund) is a non-diversified series of Putnam Funds Trust (the Trust), a Massa-chusetts business trust registered under the Investment Company Act of 1940, as amended, as an open-end management investment company. The goal of the fund is to seek capital appreciation. The fund invests in equity securities of companies of any size, including both growth and value stocks, that Putnam Management believes have favorable investment potential. Under normal circumstances, the fund invests at least 80% of its net assets in equity investments, including common stocks, preferred stocks, convertible securities and warrants. This policy may be changed only after 60 days’ notice to shareholders. For purposes of this policy, the fund treats short sales of equity securities as investments in the equity securities sold short. The fund is “non-diversified,” which means it may invest a greater percentage of its assets in fewer issuers than a “diversified” fund. The fund expects to invest in leveraged companies, which employ significant leverage in their capital structure through borrowing from banks or other lenders or through issuing fixed-income, convertible or preferred equity securities, and whose fixed income securities are often rated below-investment-grade (sometimes referred to as “junk bonds”). The fund may also invest in companies that are not leveraged. Putnam Management may consider, among other factors, a company’s valuation, financial strength, growth potential, competitive position in its industry, projected future earnings, cash flows and dividends when deciding whether to buy or sell investments. The fund may also engage in short sales of securities. The fund may invest in securities that are purchased in private placements, which are illiquid because they are subject to restrictions on resale.
The fund offers class A, class B, class C, class M, class R and class Y shares. The fund registered class T shares in February 2017, however, as of the date of this report, class T shares had not commenced operations and are not available for purchase. Purchases of class B shares are closed to new and existing investors except by exchange from class B shares of another Putnam fund or through dividend and/or capital gains reinvestment. Class A and class M shares are sold with a maximum front-end sales charge of 5.75% and 3.50%, respectively. Class A shares generally are not subject to a contingent deferred sales charge, and class M, class R and class Y shares are not subject to a contingent deferred sales charge. Class B shares, which convert to class A shares after approximately eight years, are not subject to a front-end sales charge and are subject to a contingent deferred sales charge if those shares are redeemed within six years of purchase. Class C shares are subject to a one-year 1.00% contingent deferred sales charge and do not convert to class A shares. Class R shares, which are not available to all investors, are sold at net asset value. The expenses for class A, class B, class C, class M and class R shares may differ based on the distribution fee of each class, which is identified in Note 2. Class Y shares, which are sold at net asset value, are generally subject to the same expenses as class A, class B, class C, class M and class R shares, but do not bear a distribution fee. Class Y shares are not available to all investors.
In the normal course of business, the fund enters into contracts that may include agreements to indemnify another party under given circumstances. The fund’s maximum exposure under these arrangements is unknown as this would involve future claims that may be, but have not yet been, made against the fund. However, the fund’s management team expects the risk of material loss to be remote.
The fund has entered into contractual arrangements with an investment adviser, administrator, distributor, share-holder servicing agent and custodian, who each provide services to the fund. Unless expressly stated otherwise, shareholders are not parties to, or intended beneficiaries of these contractual arrangements, and these contrac-tual arrangements are not intended to create any shareholder right to enforce them against the service providers or to seek any remedy under them against the service providers, either directly or on behalf of the fund.
Under the fund’s Declaration of Trust, any claims asserted against or on behalf of the Putnam Funds, including claims against Trustees and Officers, must be brought in state and federal courts located within the Commonwealth of Massachusetts.
Note 1: Significant accounting policiesThe following is a summary of significant accounting policies consistently followed by the fund in the prepa-ration of its financial statements. The preparation of financial statements is in conformity with accounting principles generally accepted in the United States of America and requires management to make estimates and assumptions that affect the reported amounts of assets and liabilities in the financial statements and the
Equity Spectrum Fund 33
reported amounts of increases and decreases in net assets from operations. Actual results could differ from those estimates. Subsequent events after the Statement of assets and liabilities date through the date that the financial statements were issued have been evaluated in the preparation of the financial statements.
Investment income, realized and unrealized gains and losses and expenses of the fund are borne pro-rata based on the relative net assets of each class to the total net assets of the fund, except that each class bears expenses unique to that class (including the distribution fees applicable to such classes). Each class votes as a class only with respect to its own distribution plan or other matters on which a class vote is required by law or determined by the Trustees. If the fund were liquidated, shares of each class would receive their pro-rata share of the net assets of the fund. In addition, the Trustees declare separate dividends on each class of shares.
Security valuation Portfolio securities and other investments are valued using policies and procedures adopted by the Board of Trustees. The Trustees have formed a Pricing Committee to oversee the implementation of these procedures and have delegated responsibility for valuing the fund’s assets in accordance with these procedures to Putnam Management. Putnam Management has established an internal Valuation Committee that is respon-sible for making fair value determinations, evaluating the effectiveness of the pricing policies of the fund and reporting to the Pricing Committee.
Investments (including securities sold short, if any) for which market quotations are readily available are valued at the last reported sales price on their principal exchange, or official closing price for certain markets, and are clas-sified as Level 1 securities under Accounting Standards Codification 820 Fair Value Measurements and Disclosures (ASC 820). If no sales are reported, as in the case of some securities that are traded OTC, a security is valued at its last reported bid price (ask price for securities sold short, if any) and is generally categorized as a Level 2 security.
Investments in open-end investment companies (excluding exchange-traded funds), if any, which can be classi-fied as Level 1 or Level 2 securities, are valued based on their net asset value. The net asset value of such invest-ment companies equals the total value of their assets less their liabilities and divided by the number of their outstanding shares.
Many securities markets and exchanges outside the U.S. close prior to the scheduled close of the New York Stock Exchange and therefore the closing prices for securities in such markets or on such exchanges may not fully reflect events that occur after such close but before the scheduled close of the New York Stock Exchange. Accord-ingly, on certain days, the fund will fair value certain foreign equity securities taking into account multiple factors including movements in the U.S. securities markets, currency valuations and comparisons to the valuation of American Depository Receipts, exchange-traded funds and futures contracts. The foreign equity securities, which would generally be classified as Level 1 securities, will be transferred to Level 2 of the fair value hierarchy when they are valued at fair value. The number of days on which fair value prices will be used will depend on market activity and it is possible that fair value prices will be used by the fund to a significant extent. Securities quoted in foreign currencies, if any, are translated into U.S. dollars at the current exchange rate.
To the extent a pricing service or dealer is unable to value a security or provides a valuation that Putnam Manage-ment does not believe accurately reflects the security’s fair value, the security will be valued at fair value by Putnam Management in accordance with policies and procedures approved by the Trustees. Certain invest-ments, including certain restricted and illiquid securities and derivatives, are also valued at fair value following procedures approved by the Trustees. These valuations consider such factors as significant market or specific security events such as interest rate or credit quality changes, various relationships with other securities, discount rates, U.S. Treasury, U.S. swap and credit yields, index levels, convexity exposures, recovery rates, sales and other multiples and resale restrictions. These securities are classified as Level 2 or as Level 3 depending on the priority of the significant inputs.
To assess the continuing appropriateness of fair valuations, the Valuation Committee reviews and affirms the reasonableness of such valuations on a regular basis after considering all relevant information that is reasonably available. Such valuations and procedures are reviewed periodically by the Trustees. The fair value of securities is generally determined as the amount that the fund could reasonably expect to realize from an orderly disposi-tion of such securities over a reasonable period of time. By its nature, a fair value price is a good faith estimate of the value of a security in a current sale and does not reflect an actual market price, which may be different by a material amount.
Security transactions and related investment income Security transactions are recorded on the trade date (the date the order to buy or sell is executed). Gains or losses on securities sold are determined on the identified cost basis.
34 Equity Spectrum Fund
Interest income, net of any applicable withholding taxes, is recorded on the accrual basis. Dividend income, net of any applicable withholding taxes, is recognized on the ex-dividend date except that certain dividends from foreign securities, if any, are recognized as soon as the fund is informed of the ex-dividend date. Non-cash divi-dends, if any, are recorded at the fair value of the securities received. Dividends representing a return of capital or capital gains, if any, are reflected as a reduction of cost and/or as a realized gain.
All premiums/discounts are amortized/accreted on a yield-to-maturity basis.
Foreign currency translation The accounting records of the fund are maintained in U.S. dollars. The fair value of foreign securities, currency holdings, and other assets and liabilities is recorded in the books and records of the fund after translation to U.S. dollars based on the exchange rates on that day. The cost of each security is deter-mined using historical exchange rates. Income and withholding taxes are translated at prevailing exchange rates when earned or incurred. The fund does not isolate that portion of realized or unrealized gains or losses resulting from changes in the foreign exchange rate on investments from fluctuations arising from changes in the market prices of the securities. Such gains and losses are included with the net realized and unrealized gain or loss on investments. Net realized gains and losses on foreign currency transactions represent net realized exchange gains or losses on disposition of foreign currencies, currency gains and losses realized between the trade and settlement dates on securities transactions and the difference between the amount of investment income and foreign withholding taxes recorded on the fund’s books and the U.S. dollar equivalent amounts actually received or paid. Net unrealized appreciation and depreciation of assets and liabilities in foreign currencies arise from changes in the value of assets and liabilities other than investments at the period end, resulting from changes in the exchange rate.
Short sales of securities The fund may engage in short sales of securities to realize appreciation when a security that the fund does not own declines in value. A short sale is a transaction in which the fund sells a security it does not own to a third party by borrowing the security in anticipation of purchasing the same security at the market price on a later date to close out the borrow and thus the short position. The price the fund pays at the later date may be more or less than the price at which the fund sold the security. If the price of the security sold short increases between the short sale and when the fund closes out the short sale, the fund will incur a loss, which is theoretically unlimited. The fund will realize a gain, which is limited to the price at which the fund sold the security short, if the security declines in value between those dates. Dividends on securities sold short are recorded as dividend expense for short sales in the Statement of operations. While the short position is open, the fund will post cash or liquid assets at least equal in value to the fair value of the securities sold short. The fund will also post collateral representing an additional 2%–5% of the fair value of the securities sold short. This addi-tional collateral may be in the form of a loan from the custodian. Interest related to the loan is included in interest expense for short sales in the Statement of operations. All collateral is marked to market daily. The fund may also be required to pledge on the books of the fund additional assets for the benefit of the security and cash lender. Risk of loss may exceed amounts recognized on the Statement of assets and liabilities. Short positions, if any, are reported at value and listed after the fund’s portfolio.
Securities lending The fund may lend securities, through its agent, to qualified borrowers in order to earn addi-tional income. The loans are collateralized by cash in an amount at least equal to the fair value of the securities loaned. The fair value of securities loaned is determined daily and any additional required collateral is allocated to the fund on the next business day. The remaining maturities of the securities lending transactions are consid-ered overnight and continuous. The risk of borrower default will be borne by the fund’s agent; the fund will bear the risk of loss with respect to the investment of the cash collateral. Income from securities lending, net of expenses, is included in investment income on the Statement of operations. Cash collateral is invested in Putnam Cash Collateral Pool, LLC, a limited liability company managed by an affiliate of Putnam Management. Invest-ments in Putnam Cash Collateral Pool, LLC are valued at its closing net asset value each business day. There are no management fees charged to Putnam Cash Collateral Pool, LLC. At the close of the reporting period, the fund received cash collateral of $16,692,430 and the value of securities loaned amounted to $16,374,208.
Interfund lending The fund, along with other Putnam funds, may participate in an interfund lending program pursuant to an exemptive order issued by the SEC. This program allows the fund to borrow from or lend to other Putnam funds that permit such transactions. Interfund lending transactions are subject to each fund’s investment policies and borrowing and lending limits. Interest earned or paid on the interfund lending transac-tion will be based on the average of certain current market rates. During the reporting period, the fund did not utilize the program.
Lines of credit The fund participates, along with other Putnam funds, in a $317.5 million unsecured committed line of credit and a $235.5 million unsecured uncommitted line of credit, both provided by State Street.
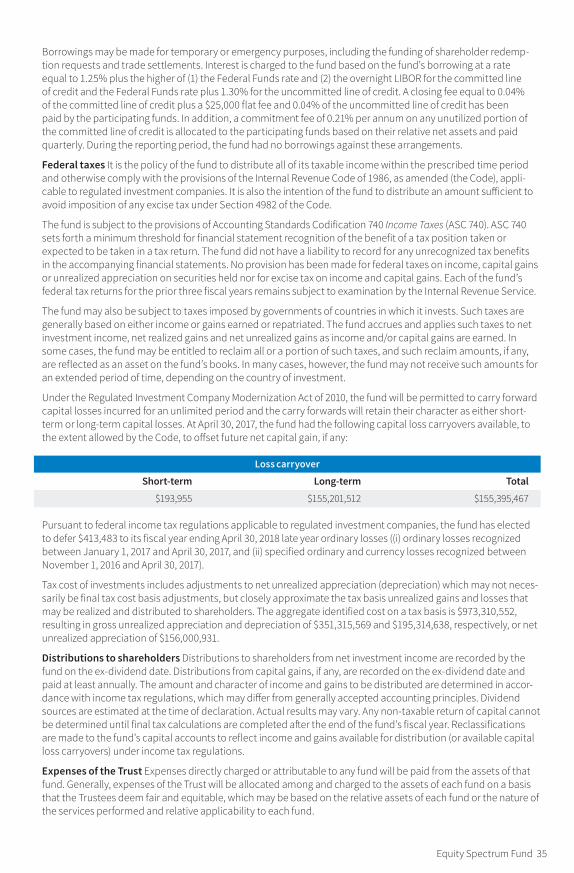
Equity Spectrum Fund 35
Borrowings may be made for temporary or emergency purposes, including the funding of shareholder redemp-tion requests and trade settlements. Interest is charged to the fund based on the fund’s borrowing at a rate equal to 1.25% plus the higher of (1) the Federal Funds rate and (2) the overnight LIBOR for the committed line of credit and the Federal Funds rate plus 1.30% for the uncommitted line of credit. A closing fee equal to 0.04% of the committed line of credit plus a $25,000 flat fee and 0.04% of the uncommitted line of credit has been paid by the participating funds. In addition, a commitment fee of 0.21% per annum on any unutilized portion of the committed line of credit is allocated to the participating funds based on their relative net assets and paid quarterly. During the reporting period, the fund had no borrowings against these arrangements.
Federal taxes It is the policy of the fund to distribute all of its taxable income within the prescribed time period and otherwise comply with the provisions of the Internal Revenue Code of 1986, as amended (the Code), appli-cable to regulated investment companies. It is also the intention of the fund to distribute an amount sufficient to avoid imposition of any excise tax under Section 4982 of the Code.
The fund is subject to the provisions of Accounting Standards Codification 740 Income Taxes (ASC 740). ASC 740 sets forth a minimum threshold for financial statement recognition of the benefit of a tax position taken or expected to be taken in a tax return. The fund did not have a liability to record for any unrecognized tax benefits in the accompanying financial statements. No provision has been made for federal taxes on income, capital gains or unrealized appreciation on securities held nor for excise tax on income and capital gains. Each of the fund’s federal tax returns for the prior three fiscal years remains subject to examination by the Internal Revenue Service.
The fund may also be subject to taxes imposed by governments of countries in which it invests. Such taxes are generally based on either income or gains earned or repatriated. The fund accrues and applies such taxes to net investment income, net realized gains and net unrealized gains as income and/or capital gains are earned. In some cases, the fund may be entitled to reclaim all or a portion of such taxes, and such reclaim amounts, if any, are reflected as an asset on the fund’s books. In many cases, however, the fund may not receive such amounts for an extended period of time, depending on the country of investment.
Under the Regulated Investment Company Modernization Act of 2010, the fund will be permitted to carry forward capital losses incurred for an unlimited period and the carry forwards will retain their character as either short-term or long-term capital losses. At April 30, 2017, the fund had the following capital loss carryovers available, to the extent allowed by the Code, to offset future net capital gain, if any:
Loss carryover
Short-term Long-term Total
$193,955 $155,201,512 $155,395,467
Pursuant to federal income tax regulations applicable to regulated investment companies, the fund has elected to defer $413,483 to its fiscal year ending April 30, 2018 late year ordinary losses ((i) ordinary losses recognized between January 1, 2017 and April 30, 2017, and (ii) specified ordinary and currency losses recognized between November 1, 2016 and April 30, 2017).
Tax cost of investments includes adjustments to net unrealized appreciation (depreciation) which may not neces-sarily be final tax cost basis adjustments, but closely approximate the tax basis unrealized gains and losses that may be realized and distributed to shareholders. The aggregate identified cost on a tax basis is $973,310,552, resulting in gross unrealized appreciation and depreciation of $351,315,569 and $195,314,638, respectively, or net unrealized appreciation of $156,000,931.
Distributions to shareholders Distributions to shareholders from net investment income are recorded by the fund on the ex-dividend date. Distributions from capital gains, if any, are recorded on the ex-dividend date and paid at least annually. The amount and character of income and gains to be distributed are determined in accor-dance with income tax regulations, which may differ from generally accepted accounting principles. Dividend sources are estimated at the time of declaration. Actual results may vary. Any non-taxable return of capital cannot be determined until final tax calculations are completed after the end of the fund’s fiscal year. Reclassifications are made to the fund’s capital accounts to reflect income and gains available for distribution (or available capital loss carryovers) under income tax regulations.
Expenses of the Trust Expenses directly charged or attributable to any fund will be paid from the assets of that fund. Generally, expenses of the Trust will be allocated among and charged to the assets of each fund on a basis that the Trustees deem fair and equitable, which may be based on the relative assets of each fund or the nature of the services performed and relative applicability to each fund.
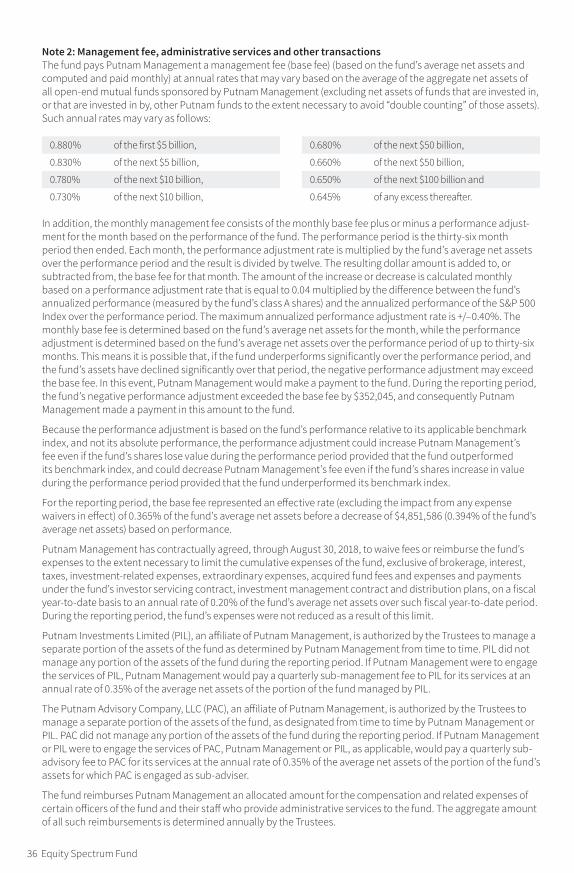
36 Equity Spectrum Fund
Note 2: Management fee, administrative services and other transactionsThe fund pays Putnam Management a management fee (base fee) (based on the fund’s average net assets and computed and paid monthly) at annual rates that may vary based on the average of the aggregate net assets of all open-end mutual funds sponsored by Putnam Management (excluding net assets of funds that are invested in, or that are invested in by, other Putnam funds to the extent necessary to avoid “double counting” of those assets). Such annual rates may vary as follows:
0.880 % of the first $5 billion,
0.830 % of the next $5 billion,
0.780 % of the next $10 billion,
0.730 % of the next $10 billion,
0.680 % of the next $50 billion,
0.660 % of the next $50 billion,
0.650 % of the next $100 billion and
0.645 % of any excess thereafter.
In addition, the monthly management fee consists of the monthly base fee plus or minus a performance adjust-ment for the month based on the performance of the fund. The performance period is the thirty-six month period then ended. Each month, the performance adjustment rate is multiplied by the fund’s average net assets over the performance period and the result is divided by twelve. The resulting dollar amount is added to, or subtracted from, the base fee for that month. The amount of the increase or decrease is calculated monthly based on a performance adjustment rate that is equal to 0.04 multiplied by the difference between the fund’s annualized performance (measured by the fund’s class A shares) and the annualized performance of the S&P 500 Index over the performance period. The maximum annualized performance adjustment rate is +/–0.40%. The monthly base fee is determined based on the fund’s average net assets for the month, while the performance adjustment is determined based on the fund’s average net assets over the performance period of up to thirty-six months. This means it is possible that, if the fund underperforms significantly over the performance period, and the fund’s assets have declined significantly over that period, the negative performance adjustment may exceed the base fee. In this event, Putnam Management would make a payment to the fund. During the reporting period, the fund’s negative performance adjustment exceeded the base fee by $352,045, and consequently Putnam Management made a payment in this amount to the fund.
Because the performance adjustment is based on the fund’s performance relative to its applicable benchmark index, and not its absolute performance, the performance adjustment could increase Putnam Management’s fee even if the fund’s shares lose value during the performance period provided that the fund outperformed its benchmark index, and could decrease Putnam Management’s fee even if the fund’s shares increase in value during the performance period provided that the fund underperformed its benchmark index.
For the reporting period, the base fee represented an effective rate (excluding the impact from any expense waivers in effect) of 0.365% of the fund’s average net assets before a decrease of $4,851,586 (0.394% of the fund’s average net assets) based on performance.
Putnam Management has contractually agreed, through August 30, 2018, to waive fees or reimburse the fund’s expenses to the extent necessary to limit the cumulative expenses of the fund, exclusive of brokerage, interest, taxes, investment-related expenses, extraordinary expenses, acquired fund fees and expenses and payments under the fund’s investor servicing contract, investment management contract and distribution plans, on a fiscal year-to-date basis to an annual rate of 0.20% of the fund’s average net assets over such fiscal year-to-date period. During the reporting period, the fund’s expenses were not reduced as a result of this limit.
Putnam Investments Limited (PIL), an affiliate of Putnam Management, is authorized by the Trustees to manage a separate portion of the assets of the fund as determined by Putnam Management from time to time. PIL did not manage any portion of the assets of the fund during the reporting period. If Putnam Management were to engage the services of PIL, Putnam Management would pay a quarterly sub-management fee to PIL for its services at an annual rate of 0.35% of the average net assets of the portion of the fund managed by PIL.
The Putnam Advisory Company, LLC (PAC), an affiliate of Putnam Management, is authorized by the Trustees to manage a separate portion of the assets of the fund, as designated from time to time by Putnam Management or PIL. PAC did not manage any portion of the assets of the fund during the reporting period. If Putnam Management or PIL were to engage the services of PAC, Putnam Management or PIL, as applicable, would pay a quarterly sub-advisory fee to PAC for its services at the annual rate of 0.35% of the average net assets of the portion of the fund’s assets for which PAC is engaged as sub-adviser.
The fund reimburses Putnam Management an allocated amount for the compensation and related expenses of certain officers of the fund and their staff who provide administrative services to the fund. The aggregate amount of all such reimbursements is determined annually by the Trustees.
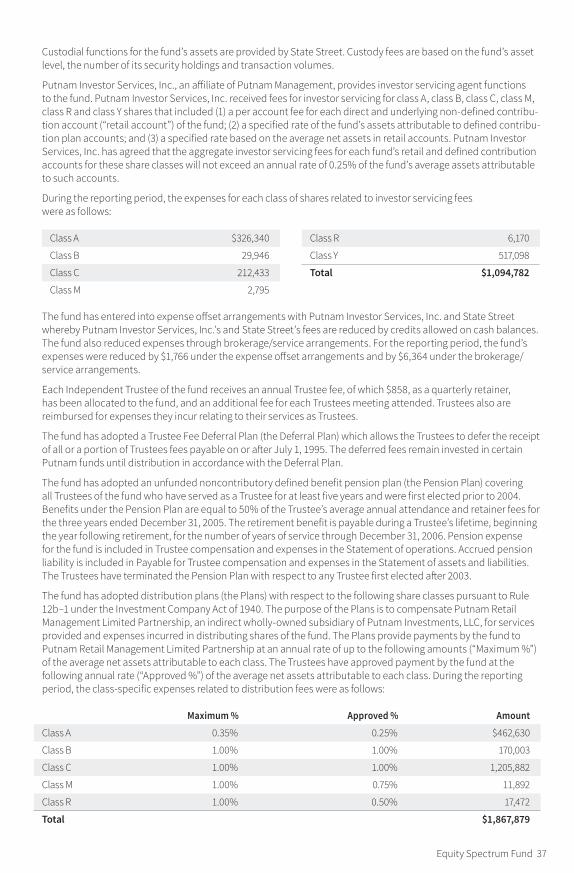
Equity Spectrum Fund 37
Custodial functions for the fund’s assets are provided by State Street. Custody fees are based on the fund’s asset level, the number of its security holdings and transaction volumes.
Putnam Investor Services, Inc., an affiliate of Putnam Management, provides investor servicing agent functions to the fund. Putnam Investor Services, Inc. received fees for investor servicing for class A, class B, class C, class M, class R and class Y shares that included (1) a per account fee for each direct and underlying non-defined contribu-tion account (“retail account”) of the fund; (2) a specified rate of the fund’s assets attributable to defined contribu-tion plan accounts; and (3) a specified rate based on the average net assets in retail accounts. Putnam Investor Services, Inc. has agreed that the aggregate investor servicing fees for each fund’s retail and defined contribution accounts for these share classes will not exceed an annual rate of 0.25% of the fund’s average assets attributable to such accounts.
During the reporting period, the expenses for each class of shares related to investor servicing fees were as follows:
Class A $326,340
Class B 29,946
Class C 212,433
Class M 2,795
Class R 6,170
Class Y 517,098
Total $1,094,782
The fund has entered into expense offset arrangements with Putnam Investor Services, Inc. and State Street whereby Putnam Investor Services, Inc.’s and State Street’s fees are reduced by credits allowed on cash balances. The fund also reduced expenses through brokerage/service arrangements. For the reporting period, the fund’s expenses were reduced by $1,766 under the expense offset arrangements and by $6,364 under the brokerage/service arrangements.
Each Independent Trustee of the fund receives an annual Trustee fee, of which $858, as a quarterly retainer, has been allocated to the fund, and an additional fee for each Trustees meeting attended. Trustees also are reimbursed for expenses they incur relating to their services as Trustees.
The fund has adopted a Trustee Fee Deferral Plan (the Deferral Plan) which allows the Trustees to defer the receipt of all or a portion of Trustees fees payable on or after July 1, 1995. The deferred fees remain invested in certain Putnam funds until distribution in accordance with the Deferral Plan.
The fund has adopted an unfunded noncontributory defined benefit pension plan (the Pension Plan) covering all Trustees of the fund who have served as a Trustee for at least five years and were first elected prior to 2004. Benefits under the Pension Plan are equal to 50% of the Trustee’s average annual attendance and retainer fees for the three years ended December 31, 2005. The retirement benefit is payable during a Trustee’s lifetime, beginning the year following retirement, for the number of years of service through December 31, 2006. Pension expense for the fund is included in Trustee compensation and expenses in the Statement of operations. Accrued pension liability is included in Payable for Trustee compensation and expenses in the Statement of assets and liabilities. The Trustees have terminated the Pension Plan with respect to any Trustee first elected after 2003.
The fund has adopted distribution plans (the Plans) with respect to the following share classes pursuant to Rule 12b–1 under the Investment Company Act of 1940. The purpose of the Plans is to compensate Putnam Retail Management Limited Partnership, an indirect wholly-owned subsidiary of Putnam Investments, LLC, for services provided and expenses incurred in distributing shares of the fund. The Plans provide payments by the fund to Putnam Retail Management Limited Partnership at an annual rate of up to the following amounts (“Maximum %”) of the average net assets attributable to each class. The Trustees have approved payment by the fund at the following annual rate (“Approved %”) of the average net assets attributable to each class. During the reporting period, the class-specific expenses related to distribution fees were as follows:
Maximum % Approved % Amount
Class A 0.35 % 0.25 % $462,630
Class B 1.00 % 1.00 % 170,003
Class C 1.00 % 1.00 % 1,205,882
Class M 1.00 % 0.75 % 11,892
Class R 1.00 % 0.50 % 17,472
Total $1,867,879
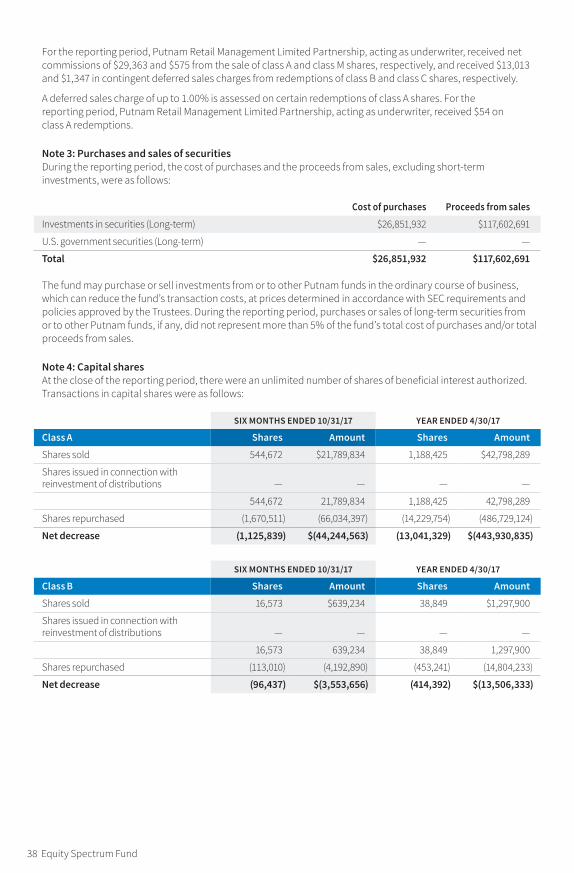
38 Equity Spectrum Fund
For the reporting period, Putnam Retail Management Limited Partnership, acting as underwriter, received net commissions of $29,363 and $575 from the sale of class A and class M shares, respectively, and received $13,013 and $1,347 in contingent deferred sales charges from redemptions of class B and class C shares, respectively.
A deferred sales charge of up to 1.00% is assessed on certain redemptions of class A shares. For the reporting period, Putnam Retail Management Limited Partnership, acting as underwriter, received $54 on class A redemptions.
Note 3: Purchases and sales of securitiesDuring the reporting period, the cost of purchases and the proceeds from sales, excluding short-term investments, were as follows:
Cost of purchases Proceeds from sales
Investments in securities (Long-term ) $26,851,932 $117,602,691
U.S. government securities (Long-term ) — —
Total $26,851,932 $117,602,691
The fund may purchase or sell investments from or to other Putnam funds in the ordinary course of business, which can reduce the fund’s transaction costs, at prices determined in accordance with SEC requirements and policies approved by the Trustees. During the reporting period, purchases or sales of long-term securities from or to other Putnam funds, if any, did not represent more than 5% of the fund’s total cost of purchases and/or total proceeds from sales.
Note 4: Capital sharesAt the close of the reporting period, there were an unlimited number of shares of beneficial interest authorized. Transactions in capital shares were as follows:
SIX MONTHS ENDED 10/31/17 YEAR ENDED 4/30/17
Class A Shares Amount Shares Amount
Shares sold 544,672 $21,789,834 1,188,425 $42,798,289
Shares issued in connection with reinvestment of distributions — — — —
544,672 21,789,834 1,188,425 42,798,289
Shares repurchased (1,670,511 ) (66,034,397 ) (14,229,754 ) (486,729,124 )
Net decrease (1,125,839 ) $(44,244,563 ) (13,041,329 ) $(443,930,835 )
SIX MONTHS ENDED 10/31/17 YEAR ENDED 4/30/17
Class B Shares Amount Shares Amount
Shares sold 16,573 $639,234 38,849 $1,297,900
Shares issued in connection with reinvestment of distributions — — — —
16,573 639,234 38,849 1,297,900
Shares repurchased (113,010 ) (4,192,890 ) (453,241 ) (14,804,233 )
Net decrease (96,437 ) $(3,553,656 ) (414,392 ) $(13,506,333 )
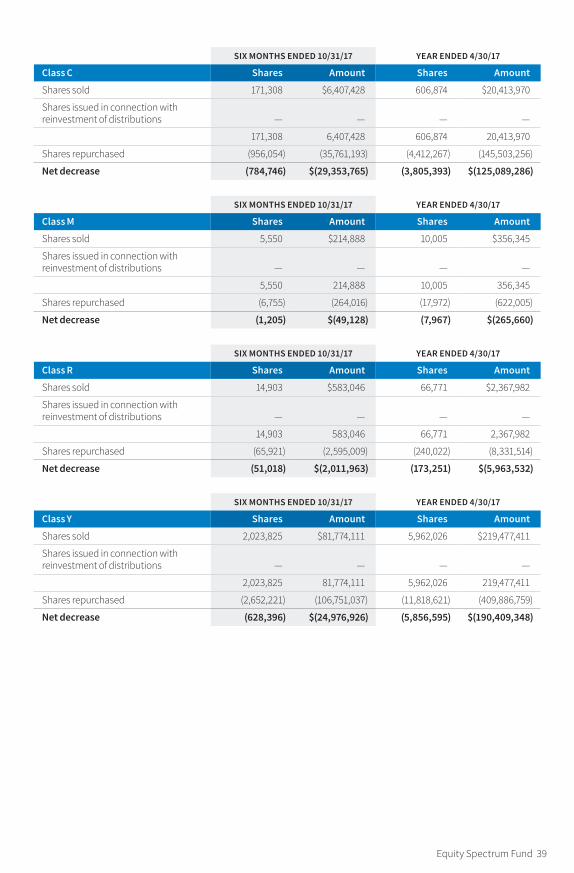
Equity Spectrum Fund 39
SIX MONTHS ENDED 10/31/17 YEAR ENDED 4/30/17
Class C Shares Amount Shares Amount
Shares sold 171,308 $6,407,428 606,874 $20,413,970
Shares issued in connection with reinvestment of distributions — — — —
171,308 6,407,428 606,874 20,413,970
Shares repurchased (956,054 ) (35,761,193 ) (4,412,267 ) (145,503,256 )
Net decrease (784,746 ) $(29,353,765 ) (3,805,393 ) $(125,089,286 )
SIX MONTHS ENDED 10/31/17 YEAR ENDED 4/30/17
Class M Shares Amount Shares Amount
Shares sold 5,550 $214,888 10,005 $356,345
Shares issued in connection with reinvestment of distributions — — — —
5,550 214,888 10,005 356,345
Shares repurchased (6,755 ) (264,016 ) (17,972 ) (622,005 )
Net decrease (1,205 ) $(49,128 ) (7,967 ) $(265,660 )
SIX MONTHS ENDED 10/31/17 YEAR ENDED 4/30/17
Class R Shares Amount Shares Amount
Shares sold 14,903 $583,046 66,771 $2,367,982
Shares issued in connection with reinvestment of distributions — — — —
14,903 583,046 66,771 2,367,982
Shares repurchased (65,921 ) (2,595,009 ) (240,022 ) (8,331,514 )
Net decrease (51,018 ) $(2,011,963 ) (173,251 ) $(5,963,532 )
SIX MONTHS ENDED 10/31/17 YEAR ENDED 4/30/17
Class Y Shares Amount Shares Amount
Shares sold 2,023,825 $81,774,111 5,962,026 $219,477,411
Shares issued in connection with reinvestment of distributions — — — —
2,023,825 81,774,111 5,962,026 219,477,411
Shares repurchased (2,652,221 ) (106,751,037 ) (11,818,621 ) (409,886,759 )
Net decrease (628,396 ) $(24,976,926 ) (5,856,595 ) $(190,409,348 )
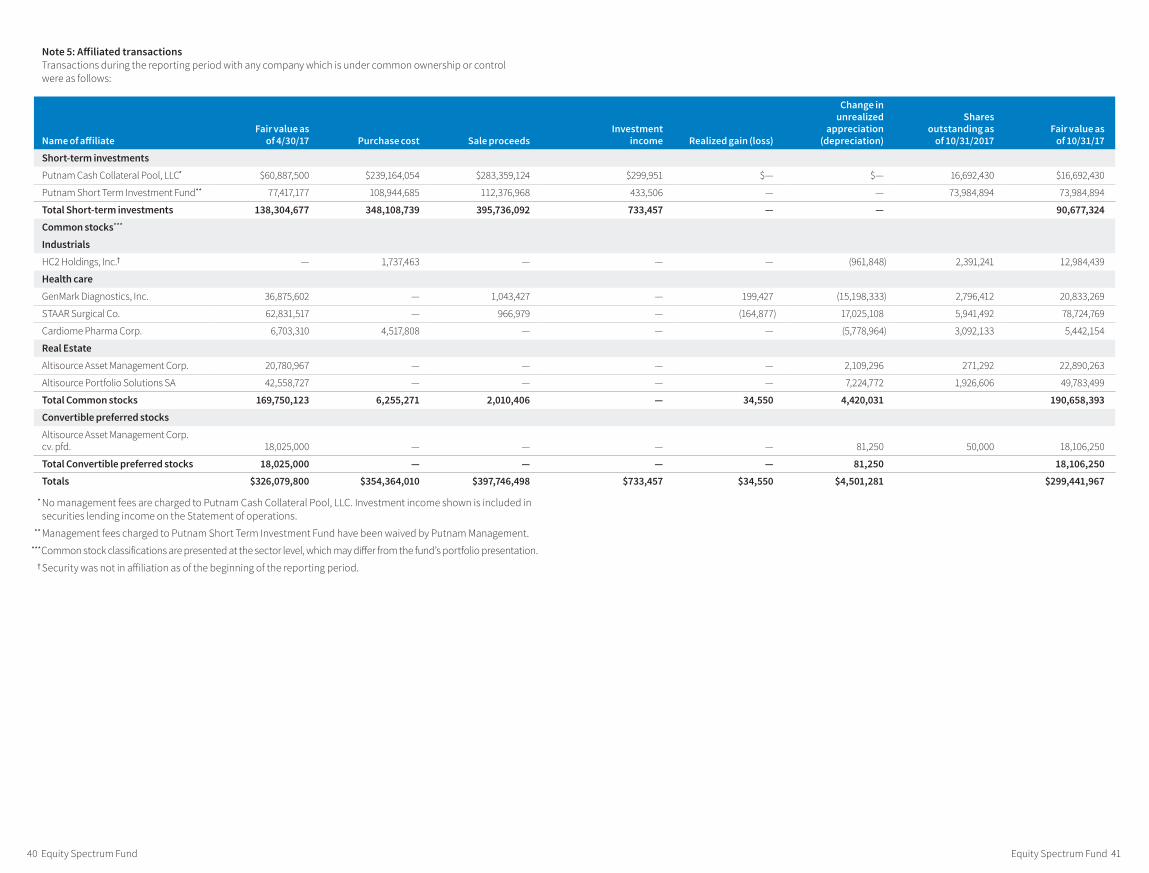
Equity Spectrum Fund 41 40 Equity Spectrum Fund
Note 5: Affiliated transactionsTransactions during the reporting period with any company which is under common ownership or control were as follows:
Name of affiliateFair value as
of 4/30/17 Purchase cost Sale proceedsInvestment
income Realized gain (loss )
Change in unrealized
appreciation (depreciation )
Shares outstanding as
of 10/31/2017Fair value as
of 10/31/17
Short-term investments
Putnam Cash Collateral Pool, LLC * $60,887,500 $239,164,054 $283,359,124 $299,951 $— $— 16,692,430 $16,692,430
Putnam Short Term Investment Fund * * 77,417,177 108,944,685 112,376,968 433,506 — — 73,984,894 73,984,894
Total Short-term investments 138,304,677 348,108,739 395,736,092 733,457 — — 90,677,324
Common stocks ** *
Industrials
HC2 Holdings, Inc. † — 1,737,463 — — — (961,848 ) 2,391,241 12,984,439
Health care
GenMark Diagnostics, Inc. 36,875,602 — 1,043,427 — 199,427 (15,198,333 ) 2,796,412 20,833,269
STAAR Surgical Co. 62,831,517 — 966,979 — (164,877 ) 17,025,108 5,941,492 78,724,769
Cardiome Pharma Corp. 6,703,310 4,517,808 — — — (5,778,964 ) 3,092,133 5,442,154
Real Estate
Altisource Asset Management Corp. 20,780,967 — — — — 2,109,296 271,292 22,890,263
Altisource Portfolio Solutions SA 42,558,727 — — — — 7,224,772 1,926,606 49,783,499
Total Common stocks 169,750,123 6,255,271 2,010,406 — 34,550 4,420,031 190,658,393
Convertible preferred stocks
Altisource Asset Management Corp. cv. pfd. 18,025,000 — — — — 81,250 50,000 18,106,250
Total Convertible preferred stocks 18,025,000 — — — — 81,250 18,106,250
Totals $326,079,800 $354,364,010 $397,746,498 $733,457 $34,550 $4,501,281 $299,441,967
* No management fees are charged to Putnam Cash Collateral Pool, LLC. Investment income shown is included in securities lending income on the Statement of operations.
** Management fees charged to Putnam Short Term Investment Fund have been waived by Putnam Management.
***Common stock classifications are presented at the sector level, which may differ from the fund’s portfolio presentation. † Security was not in affiliation as of the beginning of the reporting period.
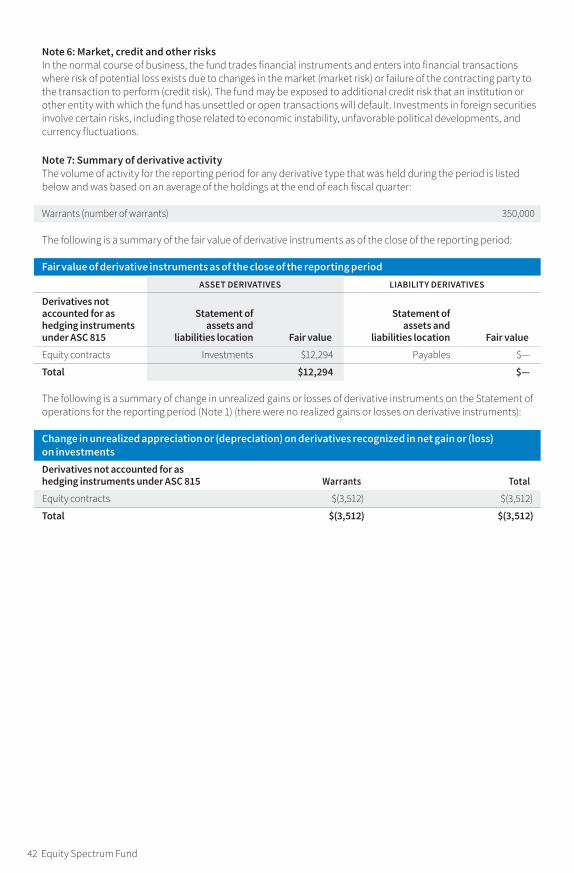
42 Equity Spectrum Fund
Note 6: Market, credit and other risksIn the normal course of business, the fund trades financial instruments and enters into financial transactions where risk of potential loss exists due to changes in the market (market risk) or failure of the contracting party to the transaction to perform (credit risk). The fund may be exposed to additional credit risk that an institution or other entity with which the fund has unsettled or open transactions will default. Investments in foreign securities involve certain risks, including those related to economic instability, unfavorable political developments, and currency fluctuations.
Note 7: Summary of derivative activityThe volume of activity for the reporting period for any derivative type that was held during the period is listed below and was based on an average of the holdings at the end of each fiscal quarter:
Warrants (number of warrants ) 350,000
The following is a summary of the fair value of derivative instruments as of the close of the reporting period:
Fair value of derivative instruments as of the close of the reporting periodASSET DERIVATIVES LIABILITY DERIVATIVES
Derivatives not accounted for as hedging instruments under ASC 815
Statement of assets and
liabilities location Fair value
Statement of assets and
liabilities location Fair value
Equity contracts Investments $12,294 Payables $—
Total $12,294 $—
The following is a summary of change in unrealized gains or losses of derivative instruments on the Statement of operations for the reporting period (Note 1) (there were no realized gains or losses on derivative instruments):
Change in unrealized appreciation or (depreciation ) on derivatives recognized in net gain or (loss ) on investmentsDerivatives not accounted for as hedging instruments under ASC 815 Warrants Total
Equity contracts $(3,512 ) $(3,512 )
Total $(3,512 ) $(3,512 )
Equity Spectrum Fund 43
Putnam family of fundsThe following is a list of Putnam’s open-end mutual funds offered to the public. Investors should carefully consider the investment objective, risks, charges, and expenses of a fund before investing. For a prospectus, or a summary prospectus if available, containing this and other information for any Putnam fund or product, contact your financial advisor or call Putnam Investor Services at 1-800-225-1581. Please read the prospectus carefully before investing.
BlendCapital Opportunities FundCapital Spectrum FundEmerging Markets Equity FundEquity Spectrum FundEurope Equity FundGlobal Equity FundInternational Capital Opportunities FundInternational Equity FundInvestors FundLow Volatility Equity FundMulti-Cap Core FundResearch Fund
Global SectorGlobal Consumer FundGlobal Financials FundGlobal Health Care FundGlobal Industrials FundGlobal Natural Resources FundGlobal Sector FundGlobal Technology FundGlobal Telecommunications FundGlobal Utilities Fund
GrowthGrowth Opportunities FundInternational Growth FundMulti-Cap Growth FundSmall Cap Growth Fund
ValueConvertible Securities FundEquity Income FundInternational Value Fund Multi-Cap Value FundSmall Cap Value Fund
IncomeAmerican Government Income FundDiversified Income TrustEmerging Markets Income FundFloating Rate Income FundGlobal Income TrustGovernment Money Market Fund*
High Yield FundIncome FundMoney Market Fund†
Short Duration Income FundU.S. Government Income Trust
Tax-free IncomeAMT-Free Municipal FundIntermediate-Term Municipal Income FundShort-Term Municipal Income FundTax Exempt Income FundTax-Free High Yield Fund
State tax-free income funds‡: California, Massachusetts, Minnesota, New Jersey, New York, Ohio, and Pennsylvania.
44 Equity Spectrum Fund
Absolute ReturnAbsolute Return 100 Fund®Absolute Return 300 Fund®Absolute Return 500 Fund®Absolute Return 700 Fund®
Putnam PanAgora**Putnam PanAgora Managed Futures StrategyPutnam PanAgora Market Neutral FundPutnam PanAgora Risk Parity Fund
Asset AllocationGeorge Putnam Balanced Fund
Dynamic Asset Allocation Balanced FundDynamic Asset Allocation Conservative FundDynamic Asset Allocation Growth FundDynamic Risk Allocation Fund
Retirement Income Fund Lifestyle 1
RetirementReady® 2060 Fund RetirementReady® 2055 FundRetirementReady® 2050 FundRetirementReady® 2045 FundRetirementReady® 2040 FundRetirementReady® 2035 FundRetirementReady® 2030 FundRetirementReady® 2025 FundRetirementReady® 2020 Fund
* You could lose money by investing in the fund. Although the fund seeks to preserve the value of your investment at $1.00 per share, it cannot guarantee it will do so. An investment in the fund is not insured or guaranteed by the Federal Deposit Insurance Corporation or any other government agency. The fund’s sponsor has no legal obligation to provide financial support to the fund, and you should not expect that the sponsor will provide financial support to the fund at any time.
† You could lose money by investing in the fund. Although the fund seeks to preserve the value of your investment at $1.00 per share, it cannot guarantee it will do so. The fund may impose a fee upon sale of your shares or may temporarily suspend your ability to sell shares if the fund’s liquidity falls below required minimums because of market conditions or other factors. An investment in the fund is not insured or guaranteed by the Federal Deposit Insurance Corporation or any other government agency. The fund’s sponsor has no legal obligation to provide financial support to the fund, and you should not expect that the sponsor will provide financial support to the fund at any time.
‡ Not available in all states.
** Sub-advised by PanAgora Asset Management.Check your account balances and the most recent month-end performance in the Individual Investors section at putnam.com.
Fund informationFounded over 80 years ago, Putnam Investments was built around the concept that a balance between risk and reward is the hallmark of a well-rounded financial program. We manage over 100 funds across income, value, blend, growth, asset allocation, absolute return, and global sector categories.
Investment ManagerPutnam Investment Management, LLC One Post Office Square Boston, MA 02109
Investment Sub-AdvisorsPutnam Investments Limited 16 St James’s Street London, England SW1A 1ER
The Putnam Advisory Company, LLC One Post Office Square Boston, MA 02109
Marketing ServicesPutnam Retail Management One Post Office Square Boston, MA 02109
CustodianState Street Bank and Trust Company
Legal CounselRopes & Gray LLP
TrusteesJameson A. Baxter, Chair Kenneth R. Leibler, Vice Chair Liaquat Ahamed Ravi Akhoury Barbara M. Baumann Katinka Domotorffy Catharine Bond Hill Paul L. Joskow Robert E. Patterson George Putnam, III Robert L. Reynolds Manoj P. Singh
OfficersRobert L. Reynolds President
Jonathan S. Horwitz Executive Vice President, Principal Executive Officer, and Compliance Liaison
Robert T. Burns Vice President and Chief Legal Officer
James F. Clark Vice President and Chief Compliance Officer
Michael J. Higgins Vice President, Treasurer, and Clerk
Janet C. Smith Vice President, Principal Financial Officer, Principal Accounting Officer, and Assistant Treasurer
Susan G. Malloy Vice President and Assistant Treasurer
Mark C. Trenchard Vice President and BSA Compliance Officer
Nancy E. Florek Vice President, Director of Proxy Voting and Corporate Governance, Assistant Clerk, and Assistant Treasurer
Denere P. Poulack Assistant Vice President, Assistant Clerk, and Assistant Treasurer
This report is for the information of shareholders of Putnam Equity Spectrum Fund. It may also be used as sales literature when preceded or accompanied by the current prospectus, the most recent copy of Putnam’s Quarterly Performance Summary, and Putnam’s Quarterly Ranking Summary. For more recent performance, please visit putnam.com. Investors should carefully consider the investment objec-tives, risks, charges, and expenses of a fund, which are described in its prospectus. For this and other information or to request a prospectus or summary prospectus, call 1-800-225-1581 toll free. Please read the prospectus carefully before investing. The fund’s Statement of Additional Information contains additional information about the fund’s Trustees and is available without charge upon request by calling 1-800-225-1581.

Elec
tron
ic se
rvic
e re
ques
ted
Go p
aper
less
: Log
on
to p
utna
m.c
om o
r sca
n th
is c
ode
to u
pdat
e yo
ur m
ailin
g op
tions
.
One
Pos
t Offi
ce S
quar
e
Bost
on, M
A 02
109
1-80
0-22
5-15
81pu
tnam
.com
PRSR
T ST
D
U.S
. PO
STAG
E PA
ID
BRO
CKTO
N, M
A
PERM
IT N
O. 6
00
SA10
6 30
8580
12
/17