Embed Size (px)
Citation preview
Note: ats is not responsible for content or accuracy of charts provided.
Plumbing Specification Information ENGINEERING DATA
Drawing No.19- 1Copyright © ats inc. 2008
EQUIVALENTS & CONVERSION FACTORSB
BYC
TO OBTAINA
MULTIPLYB
BYC
TO OBTAINA
MULTIPLYPounds per sq. in.
Kilograms per sq. cm
Inches of mercury
Millimeters of mercury
Inches of water
Feet of water
Gallons
Gallons per minute
Pounds per sq. in
Inches
Feet
Meters
Yards
Cubic inches
Gallons
Barrels
Meters
Gallons per minute
Cubic centimeters
Gallons
Gallons
Gallons per minute
Meters
Yards
Centimeters
Inches of mercury
Pounds per sq. in.
Cubic centimeters
Cubic feet
Cubic inches
Cubic inches
Gallons (Imperial)
Liters
Pounds (at 70ºF)
Pounds per hr. liquid (at 70ºF)
Cubic feet per second
Pounds water per hr. evaporation
Btu per hour
Centimeters
Feet
Meters
Yards
Feet of water
14.697
1.033
29.92
760
407
33.90
42
0.0292
14.5
0.3937
0.03281
0.01
0.01094
0.06102
7.48055
0.17812
0.02832
448.833
16.39
0.004329
264.17
4.4
0.3048
0.3333
30.48
0.882
0.433
3785
0.13368
231
277.4
0.833
3.785
8.328
500 x Sp. GR
0.002228
34.5
33479
2.54
0.0833
0.0254
0.02778
1.133
Atmospheres
Atmospheres
Atmospheres
Atmospheres
Atmospheres
Atmospheres
Barrels (petroleum)
Barrels per day
Bars-G
Centimeters
Centimeters
Centimeters
Centimeters
Cubic Centimeters
Cubic feet
Cubic feet
Cubic feet
Cubic feet per second
Cubic inches
Cubic inches
Cubic meters
Cubic meters per hour
Feet
Feet
Feet
Feet of water
Feet of water
Gallons (U.S.)
Gallons (U.S.)
Gallons (U.S.)
Gallons (Imperial)
Gallons (U.S.)
Gallons (U.S.)
Gallons of water
Gallons of liquid per minute
Gallons per minute
Horsepower (boiler)
Horsepower (boiler)
Inches
Inches
Inches
Inches
Inches of mercury
Inches of mercury
Inches of mercury
Inches of water
Inches of water
Kilograms
Kilograms
Kilograms per minute
Kilograms per sq. cm.
Kilograms per sq. cm.
Kilograms per sq. cm.
Kilopascals
Liters
Liters
Liters per hour
Meters
Meters
Meters
Meters
Megapascals
Pounds
Pounds
Pounds
Pounds
Pounds per hour
Pounds per hour liquid
Pounds per sq. in.
Pounds per sq. in.
Pounds per sq. in.
Pounds per sq. in.
Pounds per sq. in.
Pounds per sq. in.
Specific Gravity
(of gas or vapors)
Square centimeters
Square inches
Tons (short ton. 2000 lbs.)
Tons (short ton. 2000 lbs.)
Tons (metric) per day
Water (cubic feet)
Yards
Yards
0.4912
0.0345
0.03613
0.07355
2.205
0.001102
132.3
14.22
0.9678
28.96
.145
1000
0.2642
0.0044
3.281
1.0936
100
39.37
.000145
0.0005
0.4536
0.000454
16
6.32/M.W.
0.002/Sp. Gr.
27.684
2.307
2.036
0.0703
51.71
0.7037
28.97
0.1550
6.452
907.2
1.102
91.8
62.3
0.9144
91.44
This table may be used in two ways:(1) Multiply the unit under column A by the figure under column B; the result is the unit under column C.(2) Divide the unit under column C by the figure under column B; the result is the unit under column A.
Pounds per sq. in.
Kilograms per sq. cm.
Pounds per sq. in.
Inches of mercury
Pounds
Short tons (2000 lbs.)
Pounds per hour
Pounds per sq. in.
Atmospheres
Inches of mercury
Pounds per sq. in.
Cubic centimeters
Gallons (U.S.)
Gallons per minute (U.S.)
Feet
Yards
Centimeters
Inches
Pounds per sq. in.
Short tons (2000 lbs.)
Kilograms
Metric tons
Ounces
Cubic feet per minute
Gallons per minute liquid (at 70ºF)
Inches of water
Feet of water
Inches of mercury
Kilograms per sq. cm.
Millimeters of mercury
Meters of water
Molecular wt.
(of gas or vapors)
Square inches
Square centimeters
Kilograms
Metric tons
Pounds per hour
Pounds (at 70ºF)
Meters
Centimeters
Drawing No.19- 2
Note: ats is not responsible for content or accuracy of charts provided.
Plumbing Specification Information ENGINEERING DATA
Copyright © ats inc. 2008
rdmmmm²m²m²mmmmmkgkgkgPaPakPaPaPaJJWKKºCºRKK or ºC
degreeinftydin²ft²yd²inftU.S. gallonImperial gallonliterlb (avoir.)ton (metric)ton (short 2000 lbm)kgf/m²lbf/ft²lbf/in² (psi)kips/in²barBtu (IT) **ft x lbfhp (550 ft x lbf/s)ºCºFºFºFºCºF
0.017453290.0254*0.3048*0.9144*0.00064516*0.0929034*0.83612740.000016387060.028316850.000037854120.0045460900.001*0.45359241000*907.18479.80665*0.47880266894.75768947570.00001*1055.0561.355818745.6999K = ºC + 273.15K = (ºF +459.67)1/1.8ºC = (ºF -32)1/1.8ºR = ºF + 459.671.0*0.5555555
place anglelength
area
volume
mass
pressure, stress
energy, work
powertemperature
temperature interval
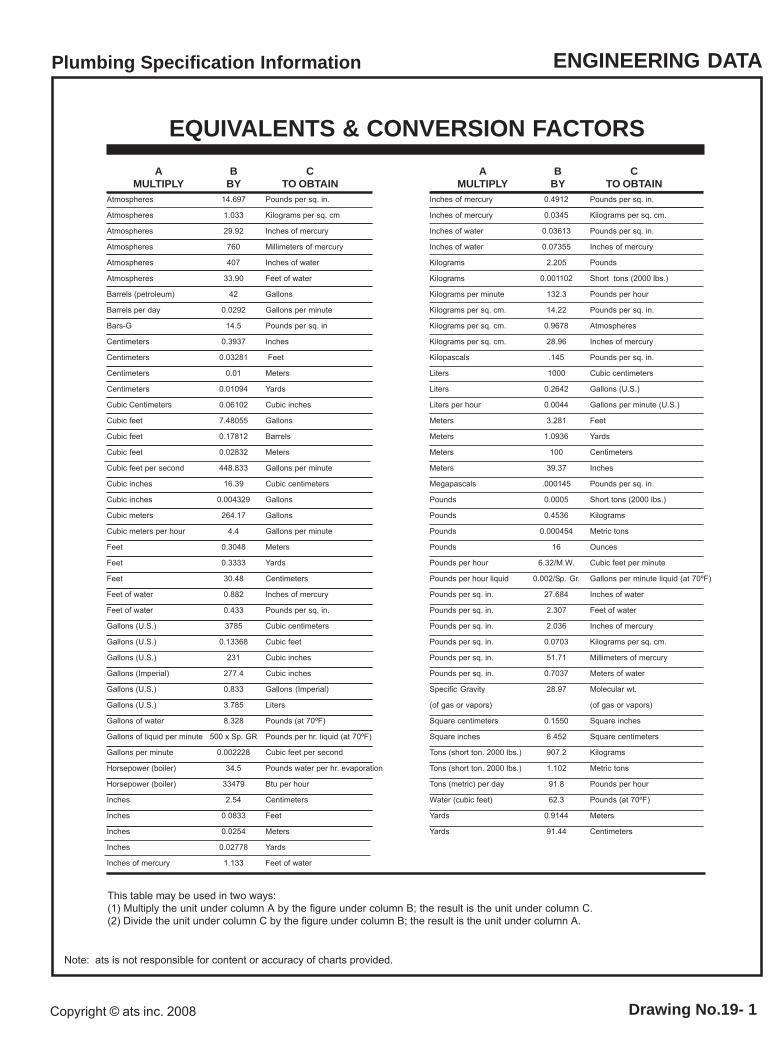
METRIC CONVERSIONSQUANTITY MULTIPLY BYTOTO CONVERT FROM
3
3
3
3
3
3
QUANTITY OTHER UNITS ORLIMITATIONS
UNIT
temperature-thermo **
temperature-other thanthermodynamic
lin. expansion coeff
quantity of heat
heat flow rate
thermal conductivity
thermal diffusivity
specific heat capacity
degree Celsius (ºC)
kelvin (K)
ºC-1
W / (m x C)
J / (kg x C)
K
ºC
K-1
J
W
W / (m x K)
J / (kg x K)
kelvin
degree
joule
watt
m2 / s
3
* Relationships that are exact in terms of the base units are followed by a single asterisk. ** International Table
K = Absolute Temperature
* Conversion factors between SI units and US customary are given in "ASME Orientation and Guide for Use of Metric Units" and "ASTM E-308."
** Perferred use for temperature interval is degrees Celsius (ºC), except for thermodynamic and cyogenic work where kelvins may be more suitable. For temperature interval 1K = 1C exactly.
SYMBOL

Note: ats is not responsible for content or accuracy of charts provided.
Plumbing Specification Information ENGINEERING DATA
Drawing No.19- 3Copyright © ats inc. 2008
CONVENTIONAL FLOW ROOF DRAIN SIZING
HOW TO SELECT A ROOF DRAIN
To select the proper roof drain, the following information must bedetermined by the specifier.
SECTION OF ROOF DRAIN BODY
Lightrainfall region
use 12" diameter type forsmall roof areas
Heavyrainfall region
use 16" diameter type forlarge or small roof areas
*Type of roof construction*Roof pitch*Volume of expected rainfall*Desired rate of drainage*Roof load and safety overflow requirements*Location of drains*Size*Vandal-proofing*Local Code requirements
ROOF DRAIN VERTICAL LEADER REQUIREMENTS FOR HORIZONTALROOF AREAS AT VARIOUS RAINFALL RATES
TABLE 1NOTE: Above table is for leader sizes. Select drains withadequate open free area in proportion to the leader size andconsistent with code requirements.
BASED ON NATIONAL PLUMBING CODE(Always consult your local code for these roofareas)
LEADERS
Pipe sizeInches
020304050608
SizeOpenArea
Sq. In.3.147.0612.5619.6028.3050.25
1
2 8808 88018 40034 60054 000116 000
1 1/2
1 9205 86012 70023 05036 00077 400
2
1 4404 4009 20017 30027 00058 000
2 1/2
1 1503 5207 36013 84021 60046 400
3
9602 9306 13011 53018 00038 680
4
7202 2004 6008 65013 50029 000
5
5751 7603 6806 92010 80023 200
6
4801 4703 0705 7659 00019 315
7
4101 2602 6304 9457 71516 570
8
3601 1002 3004 3256 75014 500
Hourly Rainfall In Inches
ALLOWABLE FLOW IN G.P.M.
ALLOWABLE FLOW FOR VERTICAL LEADERSAND HORIZONTAL STORM DRAINS
STEPS FOR CALCULATING DRAINAGEREQUIREMENTS FOR ABOVE EXAMPLE
USING G.P.M.1. Use the following formula to determine G.P.M.
GPM = .0104 x P x AGPM = Gallons per minuteR = Rainfall intensity - inches/hourA = Roof area - square feet.0104 = Conversion factor - G.P.M. /sq. ft. for one (1) inch/hr. rainfall
2. Example:A. 4" rainfall in./hr.B. 135,000 sq. ft. roof areaC. GPM = .0104 x 4" x 135,000 sq. ft. = 5616 GPM (Use 5620)
3. Refer to table 2: a 4" leader will handle 192 G.P.M. 5616 divided by 192 equals 29.25or (30) 4" vertical leaders required.A 6" leader will handle 566 G.P.M. 5616 divided by 566 equals 9.9 or (10) 6" leadersrequired.
HORIZONTAL STORM DRIANSLOPE PER FOOT
1/8"123678
14223149890214672666
PIPESIZE
020304050608101215
1/4"1751111201327705127520763774
1/2"2472157284462996180429345332
VERTICALLEADER
3090
19234856612202200
TABLE 2
STEPS DOR SELECTING PROPER ROOF DRAIN LEADER SIZES ANDNUMBER REQUIRED FOR A GIVEN ROOF
Example:
1. Total roof area - 500" by 270" equals 135,000sq. ft.
2. Determine rate of rainfall - for this example use 4".
3. After studying plan and physical arrangement, assume that 6"leaders are requires for this job.
4. From Table 1. - one 6" leader at 4" rate of rainfall will take care of13,500 sq. ft. of roof area.
5. Number of roof leaders required is 10 (135,000 sq. ft. divided by13,500 sq. ft.), thus 10 roof drains would be required.
1. Calculate the total roof area.
2. Determine the maximum hourly rainfall in inches. (The figurecan be acquired from your local weather bureau and/or localcode authority.)
3. Select leader size.
4. From Table 1, determine the number of square feet that can bedrained by one roof leader at the local maximum rainfall rate.
5. Divide the total roof area by the area that one leader will handle.The above result is the number of roof drains required for thebuilding. If the result is a fraction less, use the next highernumber.
NOTE: It can readily be seen that if 4" leaders were used, the number of roof drains required would increase to 30 drains. (29.348 rounded off to thenext highest number.) If a smaller number of roof drains are required, then larger leaders would have to be chosen. Several small drains and leadersrather than one or two large drains will ensure even safer yet adequate roof drainage. Drains should be spaced for uniform drainage.
Drawing No.19- 4
Note: ats is not responsible for content or accuracy of charts provided.
Plumbing Specification Information ENGINEERING DATA
Copyright © ats inc. 2008
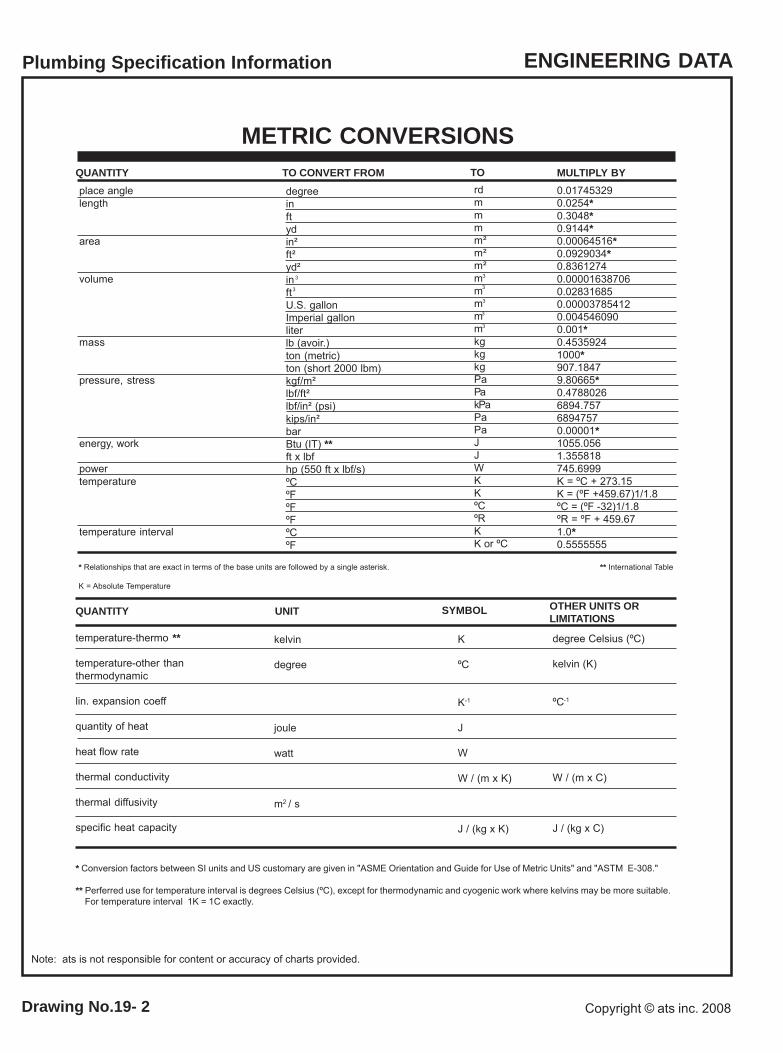
CFS DISCHARGE - SEWERS FLOWING FULL(BASED ON KUTTERS FORMULA N = .013)
GRADEOF
SEWER.1
.05
.04
.03
.02
.01.009.008.007.006.005.004.003
V5.754.063.633.152.571.821.711.611.501.38
Q.5
.355
.317
.275.21
.158
.149
.139.13.12
V7.995.645.054.353.562.522.392.252.101.951.771.59
Q1.571.11.99.85.70
.495.45.44
.416
.383.35.311
V10.047.096.345.494.483.173.0
2.832.642.452.222.0
1.70
Q3.5
2.452.2
1.921.561.1
1.051.0.92.85.78.70.60
V10.997.766.946.014.903.473.283.102.892.692.442.191.86
Q5.0
3.523.172.751.951.581.501.421.321.31.111.0.85
V11.948.437.546.535.333.773.573.373.142.922.652.382.03
Q6.54.6
4.123.582.922.061.951.831.711.581.431.301.11
V13.739.708.657.516.134.334.103.873.613.353.042.742.33
Q10.87.66.85.9
4.813.43.2
3.052.842.642.402.151.83
V16.2411.4810.268.897.255.134.864.594.283.973.603.242.75
Q20.014.012.610.98.856.3
5.985.625.304.874.434.03.4
V18.5913.1311.7410.178.305.875.565.254.904.554.123.703.15
Q33
23.220.818.214.7
10.049.89.3
8.678.07.3
6.545.6
4 INCH. 18 INCH.15 INCH.12 INCH.10 INCH.9 INCH.8 INCH.6 INCH.
To c
onve
rt C
.F.S
. to
G.P.
M. m
ultip
ly b
y 44
8.83
1
= C
.F.S
.Q
= S
Q. F
OO
TAG
E O
F R
OO
F X
RA
INFA
LL X
AB
SO
RP
TIO
N F
AC
TOR
43,2
00 (
SQ
.FT.
IN A
CR
E)
CONVERSION FACTORS
WHERE 'N' EQUALS 0.011 0.012 0.013 0.014 0.015MULTIPLY BY 1.20 1.09 1.00 0.92 0.84
GRADEOF
SEWER.1
.05
.04
.03
.02
.01.009.008.007.006.005.004.003
V20.8014.6913.1411.389.296.566.225.875.475.094.624.143.53
Q
25017514510095908378716355
V
21.218.5015.0
10.7010.09.508.908.307.506.805.85
Q
1751531208580787168615447
V
20.5017.9014.5010.209.709.108.607.957.206.505.60
Q21615213511896.868.46561
56.652.648.243
36.7
V30.4621.5419.2616.6813.629.639.128.618.047.466.776.085.18
Q17012010893.276.35451
48.345
41.737.93429
V28.6920.2718.1315.7012.829.068.598.117.567.026.375.724.87
Q13493837259
41.739.53735
32.229.226.322.4
V26.8418.9716.9614.6911.998.488.037.587.076.575.965.354.56
Q101.8
726456
45.532.230.228.726.925
22.620.3
17.25
V24.8717.5815.7113.6111.117.867.447.036.566.085.524.964.0
Q72
50.745.539.432.0
22.7521.520.019.017.616.0
14.3512.3
Q50
35.531.527.622.515.915.014.213.512.311.1510.08.5
V22.9116.1914.4712.5310.237.246.856.476.045.6
5.084.563.89
24 INCH. 27 INCH. 30 INCH. 33 INCH. 36 INCH. 39 INCH. 42 INCH.21 INCH.
To c
onve
rt G
.P.M
. (G
al. P
er M
in.)
to C
.F.S
(Cu.
Ft.
per s
ec.)
mul
tiply
G.P
.M. b
y 2.
228
x 10
(-3)
Note: ats is not responsible for content or accuracy of charts provided.
Plumbing Specification Information ENGINEERING DATA
Drawing No.19- 5Copyright © ats inc. 2008
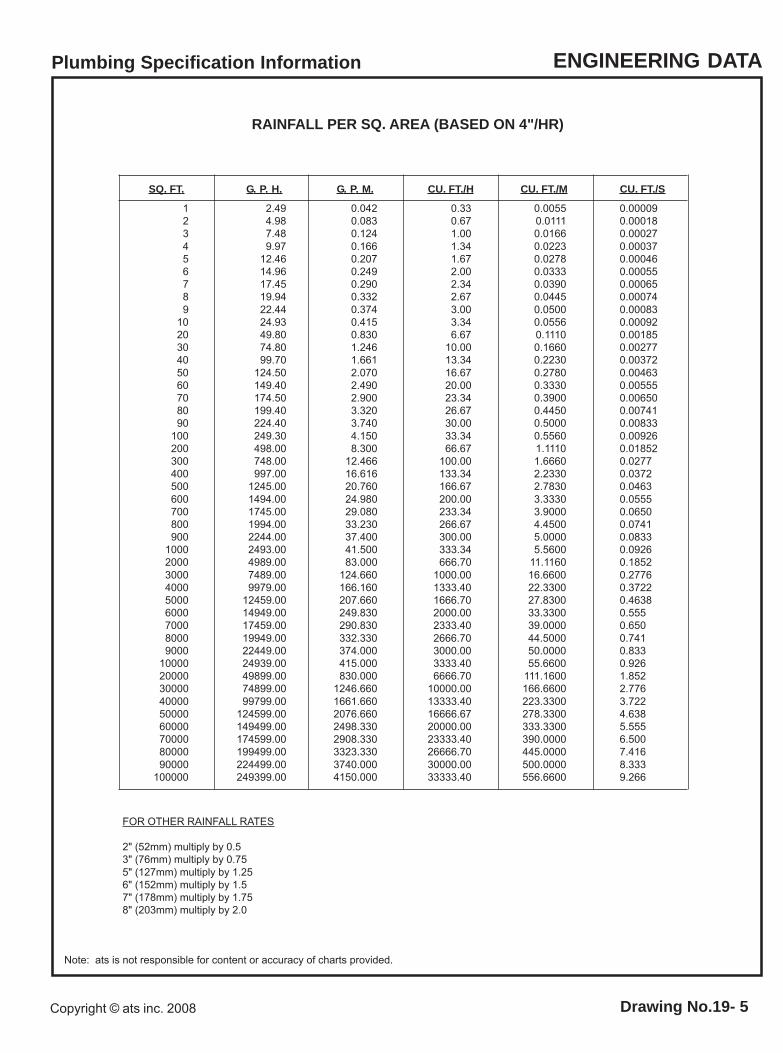
RAINFALL PER SQ. AREA (BASED ON 4"/HR)
CU. FT./S
0.330.671.001.341.672.002.342.673.003.346.67
10.0013.3416.6720.0023.3426.6730.0033.3466.67
100.00133.34166.67200.00233.34266.67300.00333.34666.70
1000.001333.401666.702000.002333.402666.703000.003333.406666.70
10000.0013333.4016666.6720000.0023333.4026666.7030000.0033333.40
123456789
102030405060708090
100200300400500600700800900
100020003000400050006000700080009000
100002000030000400005000060000700008000090000
100000
2.494.987.489.97
12.4614.9617.4519.9422.4424.9349.8074.8099.70
124.50149.40174.50199.40224.40249.30498.00748.00997.00
1245.001494.001745.001994.002244.002493.004989.007489.009979.00
12459.0014949.0017459.0019949.0022449.0024939.0049899.0074899.0099799.00
124599.00149499.00174599.00199499.00224499.00249399.00
0.0420.0830.1240.1660.2070.2490.2900.3320.3740.4150.8301.2461.6612.0702.4902.9003.3203.7404.1508.300
12.46616.61620.76024.98029.08033.23037.40041.50083.000
124.660166.160207.660249.830290.830332.330374.000415.000830.000
1246.6601661.6602076.6602498.3302908.3303323.3303740.0004150.000
0.00550.01110.01660.02230.02780.03330.03900.04450.05000.05560.11100.16600.22300.27800.33300.39000.44500.50000.55601.11101.66602.23302.78303.33303.90004.45005.00005.5600
11.116016.660022.330027.830033.330039.000044.500050.000055.6600
111.1600166.6600223.3300278.3300333.3300390.0000445.0000500.0000556.6600
0.000090.000180.000270.000370.000460.000550.000650.000740.000830.000920.001850.002770.003720.004630.005550.006500.007410.008330.009260.018520.02770.03720.04630.05550.06500.07410.08330.09260.18520.27760.37220.46380.5550.6500.7410.8330.9261.8522.7763.7224.6385.5556.5007.4168.3339.266
SQ. FT. G. P. H. G. P. M. CU. FT./H CU. FT./M
FOR OTHER RAINFALL RATES
2" (52mm) multiply by 0.53" (76mm) multiply by 0.755" (127mm) multiply by 1.256" (152mm) multiply by 1.57" (178mm) multiply by 1.758" (203mm) multiply by 2.0
Drawing No.19- 6
Note: ats is not responsible for content or accuracy of charts provided.
Plumbing Specification Information ENGINEERING DATA
Copyright © ats inc. 2008
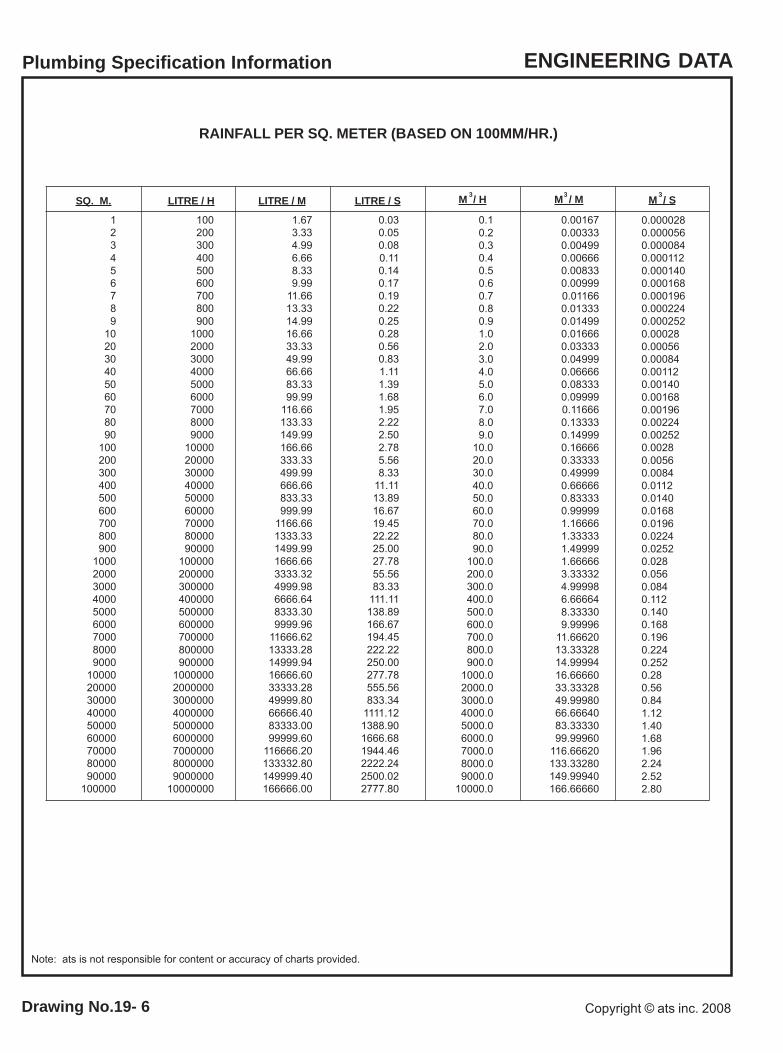
RAINFALL PER SQ. METER (BASED ON 100MM/HR.)
0.10.20.30.40.50.60.70.80.91.02.03.04.05.06.07.08.09.0
10.020.030.040.050.060.070.080.090.0
100.0200.0300.0400.0500.0600.0700.0800.0900.0
1000.02000.03000.04000.05000.06000.07000.08000.09000.0
10000.0
0.001670.003330.004990.006660.008330.009990.011660.013330.014990.016660.033330.049990.066660.083330.099990.116660.133330.149990.166660.333330.499990.666660.833330.999991.166661.333331.499991.666663.333324.999986.666648.333309.99996
11.6662013.3332814.9999416.6666033.3332849.9998066.6664083.3333099.99960
116.66620133.33280149.99940166.66660
SQ. M. LITRE / H LITRE / M LITRE / S M / H
123456789
102030405060708090
100200300400500600700800900
100020003000400050006000700080009000
100002000030000400005000060000700008000090000
100000
100200300400500600700800900
100020003000400050006000700080009000
100002000030000400005000060000700008000090000
100000200000300000400000500000600000700000800000900000
100000020000003000000400000050000006000000700000080000009000000
10000000
1.673.334.996.668.339.99
11.6613.3314.9916.6633.3349.9966.6683.3399.99
116.66133.33149.99166.66333.33499.99666.66833.33999.99
1166.661333.331499.991666.663333.324999.986666.648333.309999.96
11666.6213333.2814999.9416666.6033333.2849999.8066666.4083333.0099999.60
116666.20133332.80149999.40166666.00
0.030.050.080.110.140.170.190.220.250.280.560.831.111.391.681.952.222.502.785.568.33
11.1113.8916.6719.4522.2225.0027.7855.5683.33
111.11138.89166.67194.45222.22250.00277.78555.56833.34
1111.121388.901666.681944.462222.242500.022777.80
0.0000280.0000560.0000840.0001120.0001400.0001680.0001960.0002240.0002520.000280.000560.000840.001120.001400.001680.001960.002240.002520.00280.00560.00840.01120.01400.01680.01960.02240.02520.0280.0560.0840.1120.1400.1680.1960.2240.2520.280.560.841.121.401.681.962.242.522.80
M / S3 3M / M3
Note: ats is not responsible for content or accuracy of charts provided.
Plumbing Specification Information ENGINEERING DATA
Drawing No.19- 7Copyright © ats inc. 2008
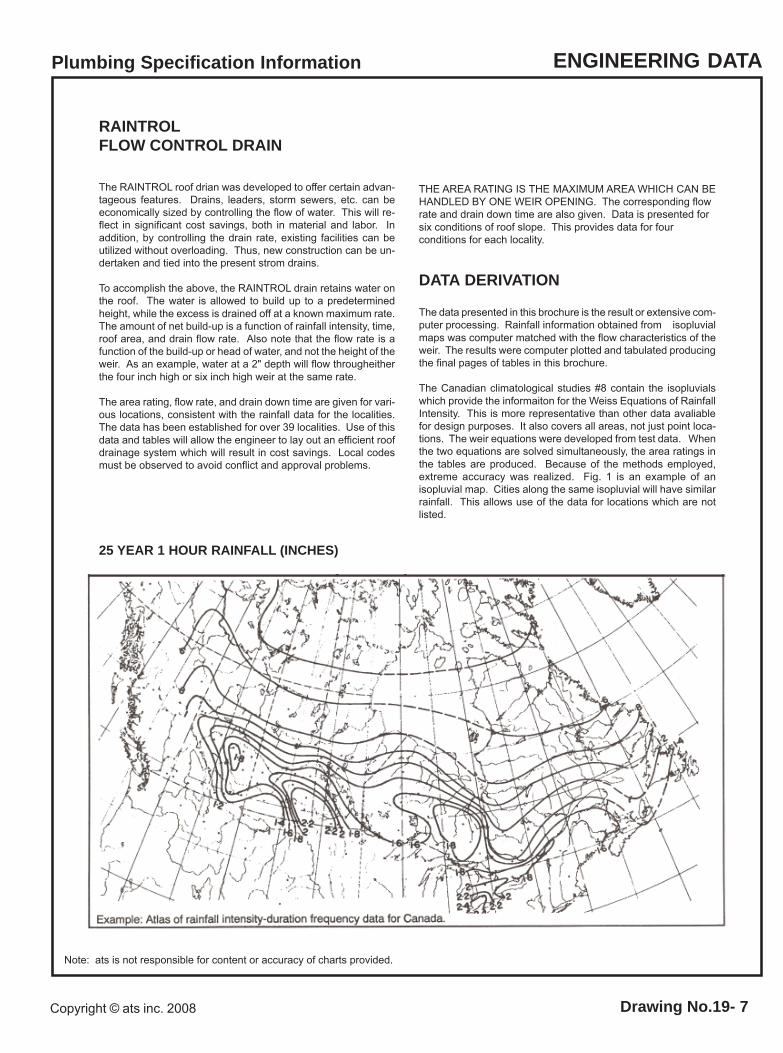
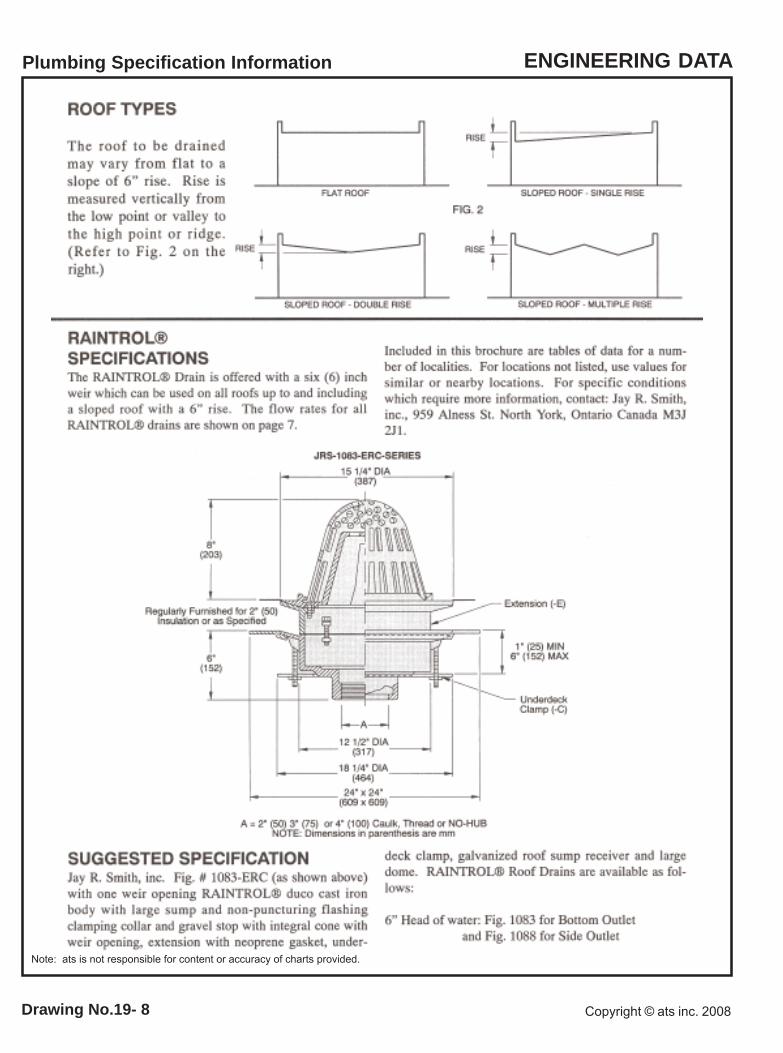
RAINTROLFLOW CONTROL DRAIN
The RAINTROL roof drian was developed to offer certain advan-tageous features. Drains, leaders, storm sewers, etc. can beeconomically sized by controlling the flow of water. This will re-flect in significant cost savings, both in material and labor. Inaddition, by controlling the drain rate, existing facilities can beutilized without overloading. Thus, new construction can be un-dertaken and tied into the present strom drains.
To accomplish the above, the RAINTROL drain retains water onthe roof. The water is allowed to build up to a predeterminedheight, while the excess is drained off at a known maximum rate.The amount of net build-up is a function of rainfall intensity, time,roof area, and drain flow rate. Also note that the flow rate is afunction of the build-up or head of water, and not the height of theweir. As an example, water at a 2" depth will flow througheitherthe four inch high or six inch high weir at the same rate.
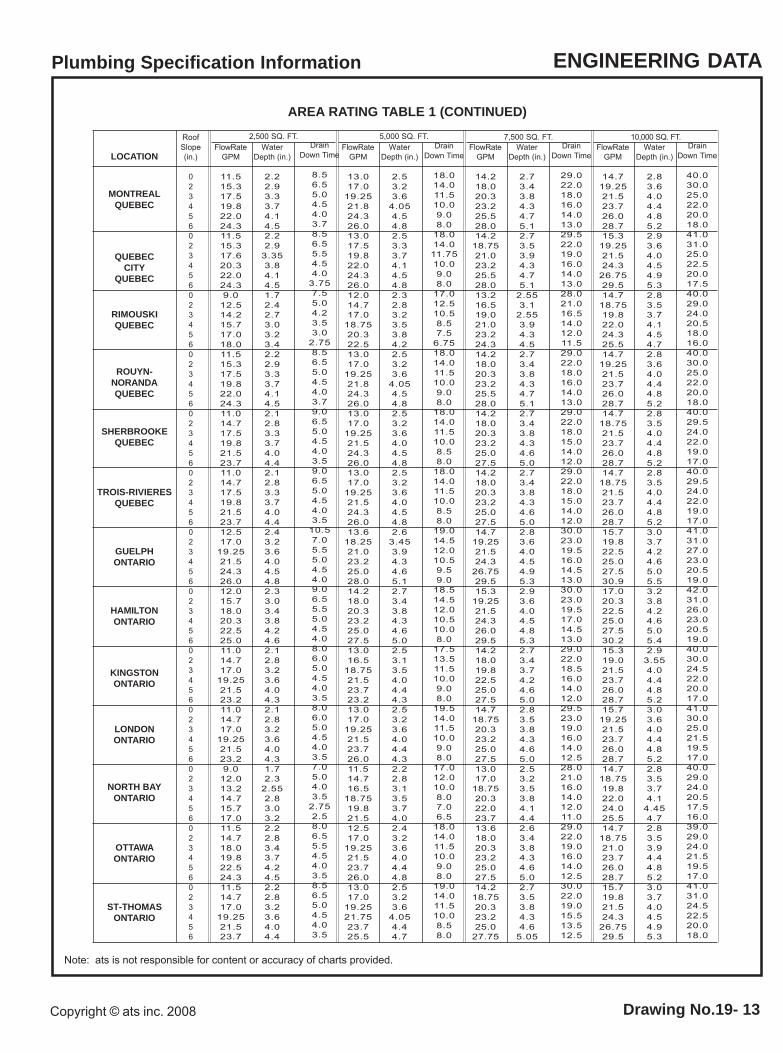
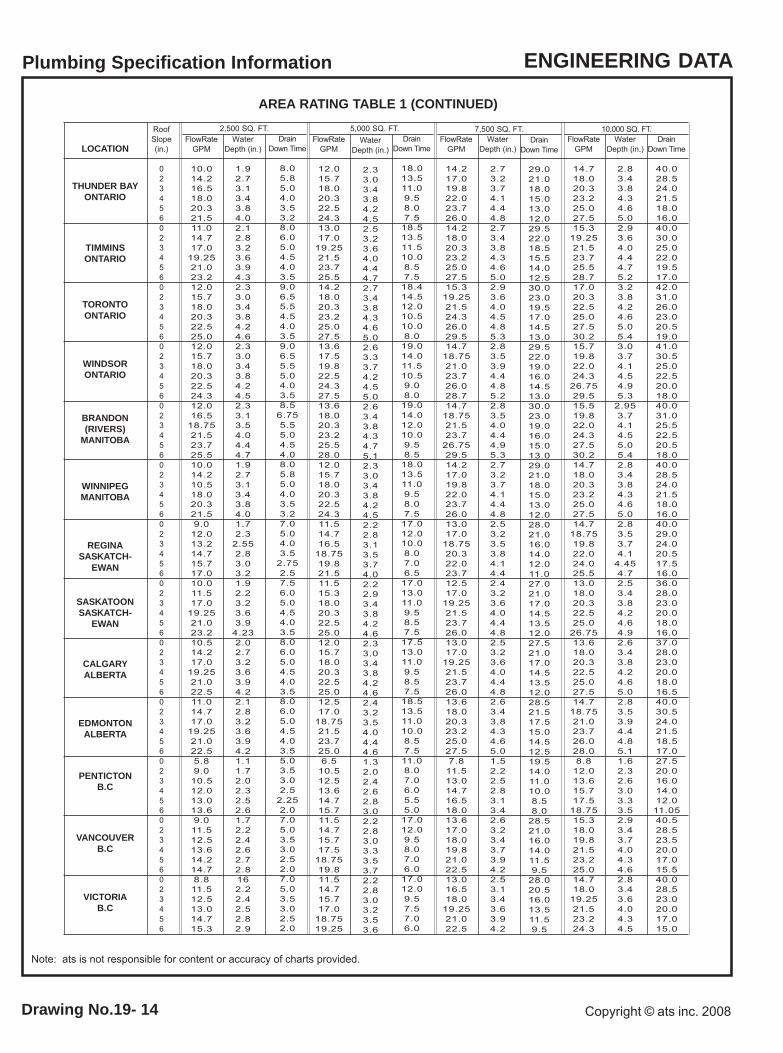
The area rating, flow rate, and drain down time are given for vari-ous locations, consistent with the rainfall data for the localities.The data has been established for over 39 localities. Use of thisdata and tables will allow the engineer to lay out an efficient roofdrainage system which will result in cost savings. Local codesmust be observed to avoid conflict and approval problems.
THE AREA RATING IS THE MAXIMUM AREA WHICH CAN BEHANDLED BY ONE WEIR OPENING. The corresponding flowrate and drain down time are also given. Data is presented forsix conditions of roof slope. This provides data for fourconditions for each locality.
DATA DERIVATION
The data presented in this brochure is the result or extensive com-puter processing. Rainfall information obtained from isopluvialmaps was computer matched with the flow characteristics of theweir. The results were computer plotted and tabulated producingthe final pages of tables in this brochure.
The Canadian climatological studies #8 contain the isopluvialswhich provide the informaiton for the Weiss Equations of RainfallIntensity. This is more representative than other data avaliablefor design purposes. It also covers all areas, not just point loca-tions. The weir equations were developed from test data. Whenthe two equations are solved simultaneously, the area ratings inthe tables are produced. Because of the methods employed,extreme accuracy was realized. Fig. 1 is an example of anisopluvial map. Cities along the same isopluvial will have similarrainfall. This allows use of the data for locations which are notlisted.
25 YEAR 1 HOUR RAINFALL (INCHES)
Drawing No.19- 8
Note: ats is not responsible for content or accuracy of charts provided.
Plumbing Specification Information ENGINEERING DATA
Copyright © ats inc. 2008
Note: ats is not responsible for content or accuracy of charts provided.
Plumbing Specification Information ENGINEERING DATA
Drawing No.19- 9Copyright © ats inc. 2008
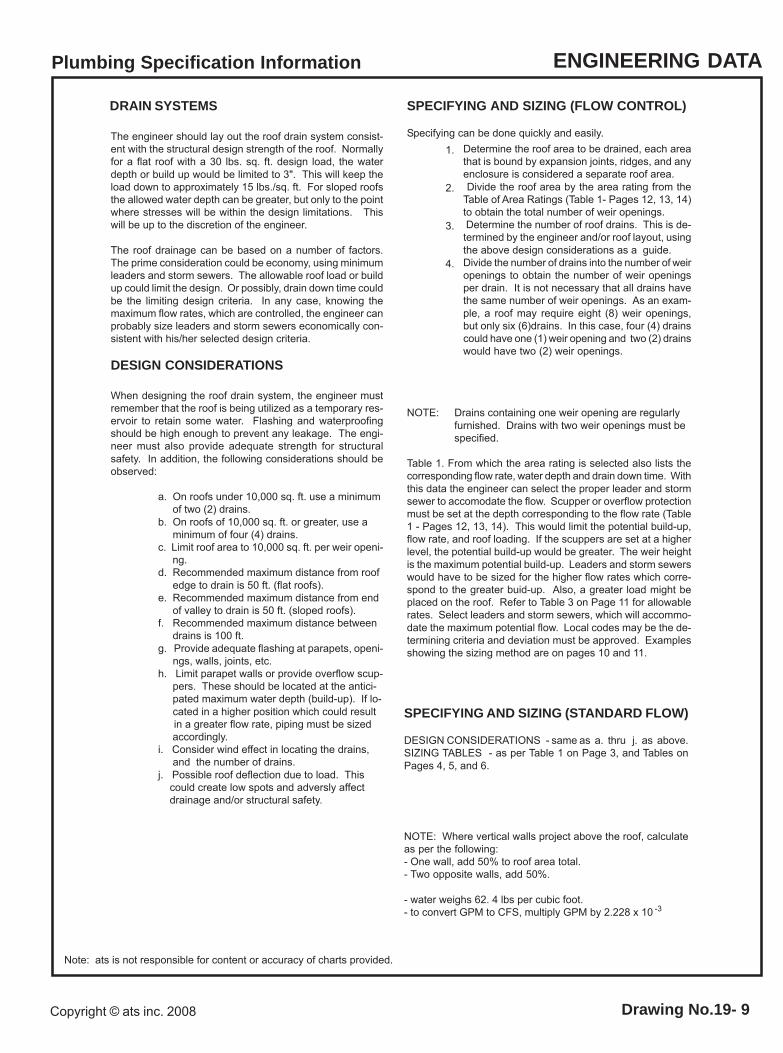
DRAIN SYSTEMS
The engineer should lay out the roof drain system consist-ent with the structural design strength of the roof. Normallyfor a flat roof with a 30 lbs. sq. ft. design load, the waterdepth or build up would be limited to 3". This will keep theload down to approximately 15 lbs./sq. ft. For sloped roofsthe allowed water depth can be greater, but only to the pointwhere stresses will be within the design limitations. Thiswill be up to the discretion of the engineer.
The roof drainage can be based on a number of factors.The prime consideration could be economy, using minimumleaders and storm sewers. The allowable roof load or buildup could limit the design. Or possibly, drain down time couldbe the limiting design criteria. In any case, knowing themaximum flow rates, which are controlled, the engineer canprobably size leaders and storm sewers economically con-sistent with his/her selected design criteria.
DESIGN CONSIDERATIONS
When designing the roof drain system, the engineer mustremember that the roof is being utilized as a temporary res-ervoir to retain some water. Flashing and waterproofingshould be high enough to prevent any leakage. The engi-neer must also provide adequate strength for structuralsafety. In addition, the following considerations should beobserved:
a. On roofs under 10,000 sq. ft. use a minimum of two (2) drains.b. On roofs of 10,000 sq. ft. or greater, use a minimum of four (4) drains.c. Limit roof area to 10,000 sq. ft. per weir openi- ng.d. Recommended maximum distance from roof edge to drain is 50 ft. (flat roofs).e. Recommended maximum distance from end of valley to drain is 50 ft. (sloped roofs).f. Recommended maximum distance between drains is 100 ft.g. Provide adequate flashing at parapets, openi- ngs, walls, joints, etc.h. Limit parapet walls or provide overflow scup- pers. These should be located at the antici- pated maximum water depth (build-up). If lo- cated in a higher position which could result in a greater flow rate, piping must be sized accordingly.i. Consider wind effect in locating the drains, and the number of drains.j. Possible roof deflection due to load. This could create low spots and adversly affect drainage and/or structural safety.
SPECIFYING AND SIZING (FLOW CONTROL)
Specifying can be done quickly and easily.Determine the roof area to be drained, each areathat is bound by expansion joints, ridges, and anyenclosure is considered a separate roof area. Divide the roof area by the area rating from theTable of Area Ratings (Table 1- Pages 12, 13, 14)to obtain the total number of weir openings. Determine the number of roof drains. This is de-termined by the engineer and/or roof layout, usingthe above design considerations as a guide.Divide the number of drains into the number of weiropenings to obtain the number of weir openingsper drain. It is not necessary that all drains havethe same number of weir openings. As an exam-ple, a roof may require eight (8) weir openings,but only six (6)drains. In this case, four (4) drainscould have one (1) weir opening and two (2) drainswould have two (2) weir openings.
NOTE: Drains containing one weir opening are regularlyfurnished. Drains with two weir openings must bespecified.
Table 1. From which the area rating is selected also lists thecorresponding flow rate, water depth and drain down time. Withthis data the engineer can select the proper leader and stormsewer to accomodate the flow. Scupper or overflow protectionmust be set at the depth corresponding to the flow rate (Table1 - Pages 12, 13, 14). This would limit the potential build-up,flow rate, and roof loading. If the scuppers are set at a higherlevel, the potential build-up would be greater. The weir heightis the maximum potential build-up. Leaders and storm sewerswould have to be sized for the higher flow rates which corre-spond to the greater buid-up. Also, a greater load might beplaced on the roof. Refer to Table 3 on Page 11 for allowablerates. Select leaders and storm sewers, which will accommo-date the maximum potential flow. Local codes may be the de-termining criteria and deviation must be approved. Examplesshowing the sizing method are on pages 10 and 11.
1.
2.
3.
4.
NOTE: Where vertical walls project above the roof, calculateas per the following:- One wall, add 50% to roof area total.- Two opposite walls, add 50%.
- water weighs 62. 4 lbs per cubic foot.- to convert GPM to CFS, multiply GPM by 2.228 x 10 -3
SPECIFYING AND SIZING (STANDARD FLOW)
DESIGN CONSIDERATIONS - same as a. thru j. as above.SIZING TABLES - as per Table 1 on Page 3, and Tables onPages 4, 5, and 6.
Drawing No.19- 10
Note: ats is not responsible for content or accuracy of charts provided
Plumbing Specification Informaiton ENGINEERING DATA
Copyright © ats inc. 2008
300'
50'
90'
90'
90'
50'
50' 50'
400'
90' 50'
6"
6"
6"
6" 6"
6" 6"
6"6"
6"
6"6"
8"
10"
10"
8"
10"
10"
10"
10"
8"
12"12"
18"
300'
50'
90'
90'
90'
50'
50' 50'
400'
90' 90'
2"
2"
2"
2" 2"
2" 2"
2"2"
2"
2"2"
132.2 GPM(5")
3"
3"
3" 3"
3"
3"
3"3"
88.2 GPM (4")
44.1 GPM (3")
176.4 GPM (5")
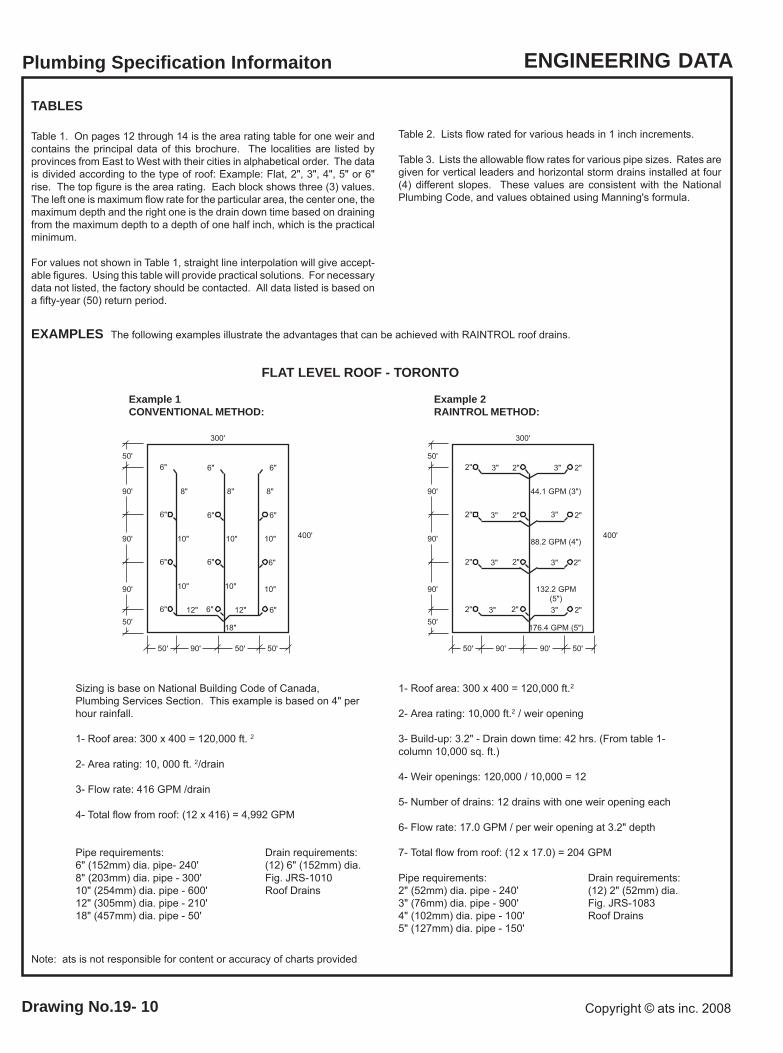
FLAT LEVEL ROOF - TORONTO
Example 2RAINTROL METHOD:
Example 1CONVENTIONAL METHOD:
1- Roof area: 300 x 400 = 120,000 ft.2
2- Area rating: 10,000 ft.2 / weir opening
3- Build-up: 3.2" - Drain down time: 42 hrs. (From table 1-column 10,000 sq. ft.)
4- Weir openings: 120,000 / 10,000 = 12
5- Number of drains: 12 drains with one weir opening each
6- Flow rate: 17.0 GPM / per weir opening at 3.2" depth
7- Total flow from roof: (12 x 17.0) = 204 GPM
Pipe requirements: Drain requirements:2" (52mm) dia. pipe - 240' (12) 2" (52mm) dia.3" (76mm) dia. pipe - 900' Fig. JRS-10834" (102mm) dia. pipe - 100' Roof Drains5" (127mm) dia. pipe - 150'
Sizing is base on National Building Code of Canada,Plumbing Services Section. This example is based on 4" perhour rainfall.
1- Roof area: 300 x 400 = 120,000 ft. 2
2- Area rating: 10, 000 ft. 2/drain
3- Flow rate: 416 GPM /drain
4- Total flow from roof: (12 x 416) = 4,992 GPM
Pipe requirements: Drain requirements:6" (152mm) dia. pipe- 240' (12) 6" (152mm) dia.8" (203mm) dia. pipe - 300' Fig. JRS-101010" (254mm) dia. pipe - 600' Roof Drains12" (305mm) dia. pipe - 210'18" (457mm) dia. pipe - 50'
TABLES
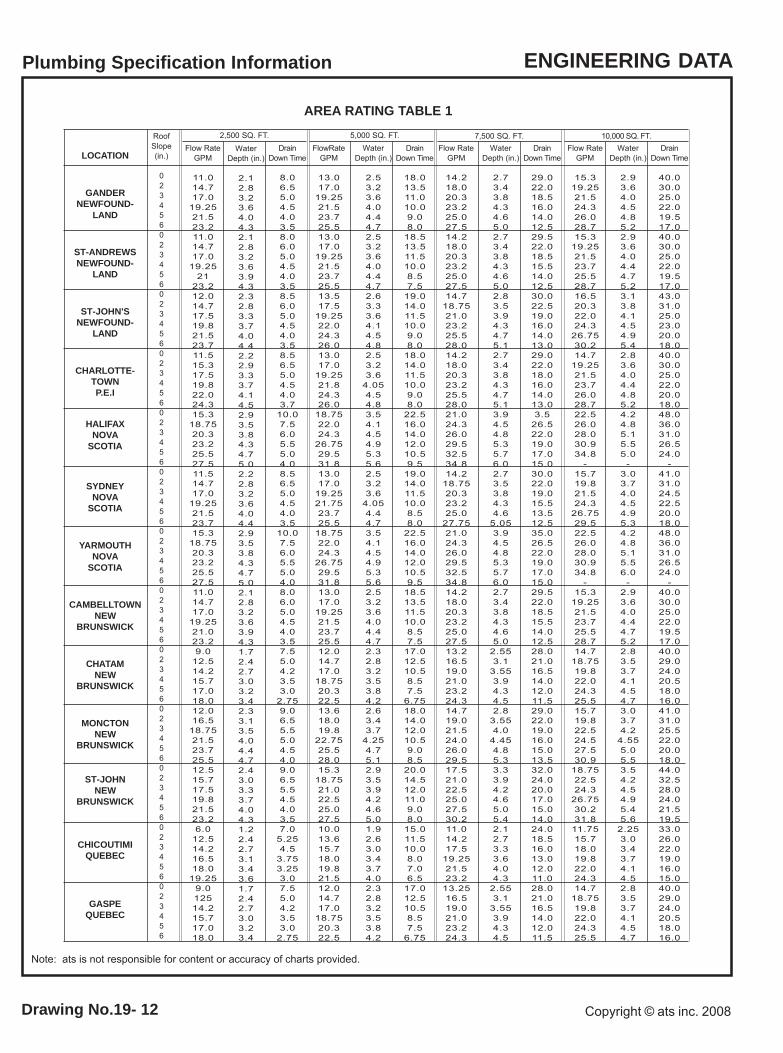
Table 1. On pages 12 through 14 is the area rating table for one weir andcontains the principal data of this brochure. The localities are listed byprovinces from East to West with their cities in alphabetical order. The datais divided according to the type of roof: Example: Flat, 2", 3", 4", 5" or 6"rise. The top figure is the area rating. Each block shows three (3) values.The left one is maximum flow rate for the particular area, the center one, themaximum depth and the right one is the drain down time based on drainingfrom the maximum depth to a depth of one half inch, which is the practicalminimum.
For values not shown in Table 1, straight line interpolation will give accept-able figures. Using this table will provide practical solutions. For necessarydata not listed, the factory should be contacted. All data listed is based ona fifty-year (50) return period.
Table 2. Lists flow rated for various heads in 1 inch increments.
Table 3. Lists the allowable flow rates for various pipe sizes. Rates aregiven for vertical leaders and horizontal storm drains installed at four(4) different slopes. These values are consistent with the NationalPlumbing Code, and values obtained using Manning's formula.
EXAMPLES The following examples illustrate the advantages that can be achieved with RAINTROL roof drains.
Note: ats is not responsible for content or accuracyof charts provided
Plumbing Specification Information ENGINEERING DATA
Drawing No.19- 11Copyright © ats inc. 2008
270'
45'
90'
90'
90'
45'
45' 45'
360'
v R V R V
90' 90'
5"
5"
5"
5" 5"
5" 5"
5"5"
5"
5"5"
8"
8"
10"
8"
10"
8"
10"
8"
8"
12"12"
18"
270'
45'
90'
90'
90'
45'
45' 45'
360'
90' 90'
3"
3"
3"
3" 3"
3" 3"
3"3"
3"
3"3"
265.5 GPM(6")
3"
3"
3" 3"
3"
3"
3"3"
177 GPM (5")
88.5 GPM (4")
354 GPM (6")
V = ValleyR = Ridge
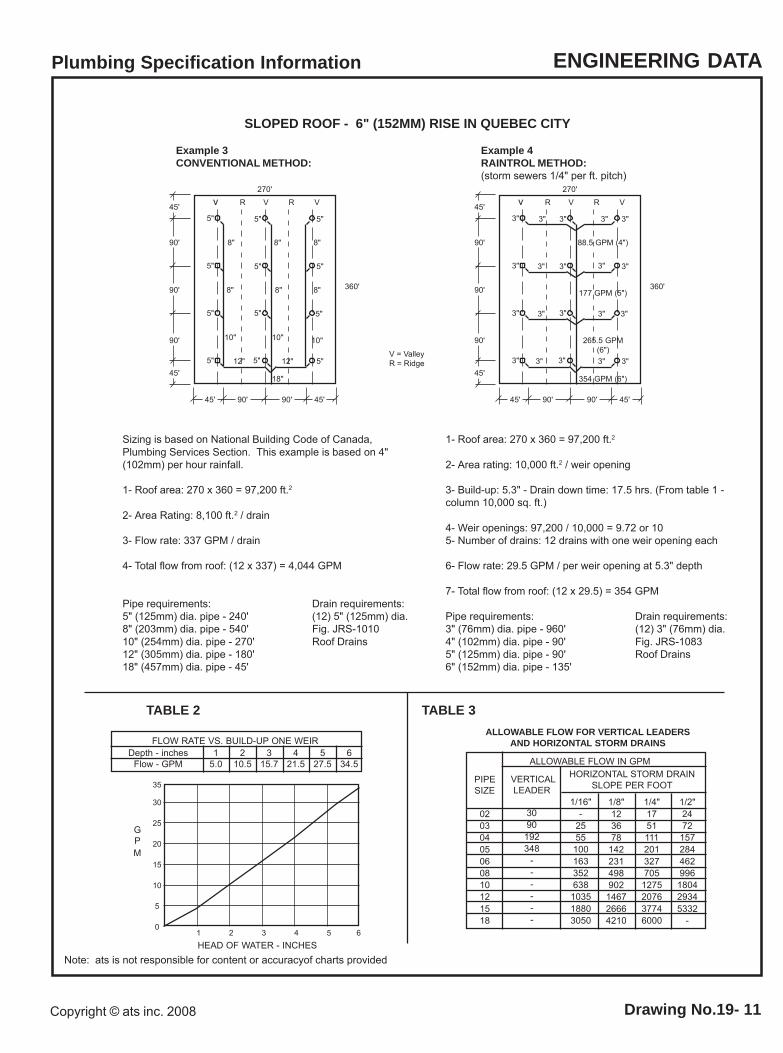
SLOPED ROOF - 6" (152MM) RISE IN QUEBEC CITY
Example 4RAINTROL METHOD:(storm sewers 1/4" per ft. pitch)
Example 3CONVENTIONAL METHOD:
1- Roof area: 270 x 360 = 97,200 ft.2
2- Area rating: 10,000 ft.2 / weir opening
3- Build-up: 5.3" - Drain down time: 17.5 hrs. (From table 1 -column 10,000 sq. ft.)
4- Weir openings: 97,200 / 10,000 = 9.72 or 105- Number of drains: 12 drains with one weir opening each
6- Flow rate: 29.5 GPM / per weir opening at 5.3" depth
7- Total flow from roof: (12 x 29.5) = 354 GPM
Pipe requirements: Drain requirements:3" (76mm) dia. pipe - 960' (12) 3" (76mm) dia.4" (102mm) dia. pipe - 90' Fig. JRS-10835" (125mm) dia. pipe - 90' Roof Drains6" (152mm) dia. pipe - 135'
Sizing is based on National Building Code of Canada,Plumbing Services Section. This example is based on 4"(102mm) per hour rainfall.
1- Roof area: 270 x 360 = 97,200 ft.2
2- Area Rating: 8,100 ft.2 / drain
3- Flow rate: 337 GPM / drain
4- Total flow from roof: (12 x 337) = 4,044 GPM
Pipe requirements: Drain requirements:5" (125mm) dia. pipe - 240' (12) 5" (125mm) dia.8" (203mm) dia. pipe - 540' Fig. JRS-101010" (254mm) dia. pipe - 270' Roof Drains12" (305mm) dia. pipe - 180'18" (457mm) dia. pipe - 45'
FLOW RATE VS. BUILD-UP ONE WEIR1
5.02
10.53
15.74
21.55
27.56
34.5Depth - inches
Flow - GPM
35
15
20
30
25
5
10
01 432 5 6
GPM
HEAD OF WATER - INCHES
TABLE 2 TABLE 3
ALLOWABLE FLOW IN GPM
ALLOWABLE FLOW FOR VERTICAL LEADERSAND HORIZONTAL STORM DRAINS
HORIZONTAL STORM DRAINSLOPE PER FOOT
1/8"123678
142231498902146726664210
PIPESIZE
02030405060810121518
1/4"17511112013277051275207637746000
1/2"2472157284462996180429345332
-
VERTICALLEADER
3090192348
------
1/16"-
2555100163352638103518803050
v R V R V
Drawing No.19- 12
Note: ats is not responsible for content or accuracy of charts provided.
Plumbing Specification Information ENGINEERING DATA
Copyright © ats inc. 2008
RoofSlope(in.)
023456023456023456023456023456023456023456023456023456023456023456023456023456
DrainDown Time
8.06.55.04.54.03.58.06.05.04.54.03.58.56.05.04.54.03.58.56.55.04.54.03.7
10.07.56.05.55.04.08.56.55.04.54.03.5
10.07.56.05.55.04.08.06.05.04.54.03.57.55.04.23.53.0
2.759.06.55.55.04.54.09.06.55.54.54.03.57.0
5.254.5
3.753.253.07.55.04.23.53.0
2.75
2,500 SQ. FT.Water
Depth (in.)
2.12.83.23.64.04.32.12.83.23.63.94.32.32.83.33.74.04.42.22.93.33.74.14.52.93.53.84.34.75.02.22.83.23.64.04.42.93.53.84.34.75.02.12.83.23.63.94.31.72.42.73.03.23.42.33.13.54.04.44.72.43.03.33.74.04.31.22.42.73.13.43.61.72.42.73.03.23.4
Flow RateGPM
11.014.717.0
19.2521.523.211.014.717.0
19.2521
23.212.014.717.519.821.523.711.515.317.519.822.024.315.3
18.7520.323.225.527.511.514.717.0
19.2521.523.715.3
18.7520.323.225.527.511.014.717.0
19.2521.023.29.0
12.514.215.717.018.012.016.5
18.7521.523.725.512.515.717.519.821.523.26.0
12.514.216.518.0
19.259.012514.215.717.018.0
FlowRateGPM
13.017.0
19.2521.523.725.513.017.0
19.2521.523.725.513.517.5
19.2522.024.326.013.017.0
19.2521.824.326.0
18.7522.024.3
26.7529.531.813.017.0
19.2521.7523.725.5
18.7522.024.3
26.7529.531.813.017.0
19.2521.523.725.512.014.717.0
18.7520.322.513.618.019.8
22.7525.528.015.3
18.7521.022.525.027.510.013.615.718.019.821.512.014.717.0
18.7520.322.5
WaterDepth (in.)
2.53.23.64.04.44.72.53.23.64.04.44.72.63.33.64.14.54.82.53.23.6
4.054.54.83.54.14.54.95.35.62.53.23.6
4.054.44.73.54.14.54.95.35.62.53.23.64.04.44.72.32.83.23.53.84.22.63.43.7
4.254.75.12.93.53.94.24.65.01.92.63.03.43.74.02.32.83.23.53.84.2
DrainDown Time
18.013.511.010.09.08.0
18.513.511.510.08.57.5
19.014.011.510.09.08.0
18.014.011.510.09.08.0
22.516.014.012.010.59.5
19.014.011.510.08.58.0
22.516.014.012.010.59.5
18.513.511.510.08.57.5
17.012.510.58.57.5
6.7518.014.012.010.59.08.5
20.014.512.011.09.08.0
15.011.510.08.07.06.5
17.012.510.58.57.5
6.75
DrainDown Time
40.030.025.022.019.517.040.030.025.022.019.517.043.031.025.023.020.018.040.030.025.022.020.018.048.036.031.026.524.0
-41.031.024.522.520.018.048.036.031.026.524.0
-40.030.025.022.019.517.040.029.024.020.518.016.041.031.025.522.020.018.044.032.528.024.021.519.533.026.022.019.016.015.040.029.024.020.518.016.0
WaterDepth (in.)
2.93.64.04.54.85.22.93.64.04.44.75.23.13.84.14.54.95.42.83.64.04.44.85.24.24.85.15.55.0
-3.03.74.04.54.95.34.24.85.15.56.0
-2.93.64.04.44.75.22.83.53.74.14.54.73.03.74.2
4.555.05.53.54.24.54.95.45.6
2.253.03.43.74.14.52.83.53.74.14.54.7
Flow RateGPM
15.319.2521.524.326.028.715.3
19.2521.523.725.528.716.520.322.024.3
26.7530.214.7
19.2521.523.726.028.722.526.028.030.934.8
-15.719.821.524.3
26.7529.522.526.028.030.934.8
-15.3
19.2521.523.725.528.714.7
18.7519.822.024.325.515.719.822.524.527.530.9
18.7522.524.3
26.7530.231.8
11.7515.718.019.822.024.314.7
18.7519.822.024.325.5
DrainDown Time
29.022.018.516.014.012.529.522.018.515.514.012.530.022.519.016.014.013.029.022.018.016.014.013.03.5
26.522.019.017.015.030.022.019.015.513.512.535.026.522.019.017.015.029.522.018.515.514.012.528.021.016.514.012.011.529.022.019.016.015.013.532.024.020.017.015.014.024.018.516.013.012.011.028.021.016.514.012.011.5
WaterDepth (in.)
2.73.43.84.34.65.02.73.43.84.34.65.02.83.53.94.34.75.12.73.43.84.34.75.13.94.54.85.35.76.02.73.53.84.34.6
5.053.94.54.85.35.76.02.73.43.84.34.65.0
2.553.1
3.553.94.34.52.8
3.554.0
4.454.85.33.33.94.24.65.05.42.12.73.33.64.04.3
2.553.1
3.553.94.34.5
Flow RateGPM
14.218.020.323.225.027.514.218.020.323.225.027.514.7
18.7521.023.225.528.014.218.020.323.225.528.021.024.326.029.532.534.814.2
18.7520.323.225.0
27.7521.024.326.029.532.534.814.218.020.323.225.027.513.216.519.021.023.224.314.719.021.524.026.029.517.521.022.525.027.530.211.014.217.5
19.2521.523.2
13.2516.519.021.023.224.3
5,000 SQ. FT. 7,500 SQ. FT. 10,000 SQ. FT.
LOCATION
GASPEQUEBEC
CHICOUTIMIQUEBEC
ST-JOHNNEW
BRUNSWICK
MONCTONNEW
BRUNSWICK
CHATAMNEW
BRUNSWICK
CAMBELLTOWNNEW
BRUNSWICK
YARMOUTHNOVA
SCOTIA
SYDNEYNOVA
SCOTIA
HALIFAXNOVA
SCOTIA
CHARLOTTE-TOWNP.E.I
ST-JOHN'SNEWFOUND-
LAND
ST-ANDREWSNEWFOUND-
LAND
GANDERNEWFOUND-
LAND
AREA RATING TABLE 1
Note: ats is not responsible for content or accuracy of charts provided.
Plumbing Specification Information ENGINEERING DATA
Drawing No.19- 13Copyright © ats inc. 2008
RoofSlope(in.)
023456023456023456023456023456023456023456023456023456023456023456023456023456
DrainDown Time
8.56.55.04.54.03.78.56.55.54.54.0
3.757.55.04.23.53.0
2.758.56.55.04.54.03.79.06.55.04.54.03.59.06.55.04.54.03.5
10.57.05.55.04.54.09.06.55.55.04.54.08.06.05.04.54.03.58.06.05.04.54.03.57.05.04.03.5
2.752.58.06.55.54.54.03.58.56.55.04.54.03.5
2,500 SQ. FT.Water
Depth (in.)
2.22.93.33.74.14.52.22.9
3.353.84.14.51.72.42.73.03.23.42.22.93.33.74.14.52.12.83.33.74.04.42.12.83.33.74.04.42.43.23.64.04.54.82.33.03.43.84.24.62.12.83.23.64.04.32.12.83.23.64.04.31.72.3
2.552.83.03.22.22.83.43.74.24.52.22.83.23.64.04.4
FlowRateGPM
11.515.317.519.822.024.311.515.317.620.322.024.39.0
12.514.215.717.018.011.515.317.519.822.024.311.014.717.519.821.523.711.014.717.519.821.523.712.517.0
19.2521.524.326.012.015.718.020.322.525.011.014.717.0
19.2521.523.211.014.717.0
19.2521.523.29.0
12.013.214.715.717.011.514.718.019.822.524.311.514.717.0
19.2521.523.7
FlowRateGPM
13.017.0
19.2521.824.326.013.017.519.822.024.326.012.014.717.0
18.7520.322.513.017.0
19.2521.824.326.013.017.0
19.2521.524.326.013.017.0
19.2521.524.326.013.6
18.2521.023.225.028.014.218.020.323.225.027.513.016.5
18.7521.523.723.213.017.0
19.2521.523.726.011.514.716.5
18.7519.821.512.517.0
19.2521.523.726.013.017.0
19.2521.7523.725.5
WaterDepth (in.)
2.53.23.6
4.054.54.82.53.33.74.14.54.82.32.83.23.53.84.22.53.23.6
4.054.54.82.53.23.64.04.54.82.53.23.64.04.54.82.6
3.453.94.34.65.12.73.43.84.34.65.02.53.13.54.04.44.32.53.23.64.04.44.32.22.83.13.53.74.02.43.23.64.04.44.82.53.23.6
4.054.44.7
DrainDown Time
18.014.011.510.09.08.0
18.014.011.7510.09.08.0
17.012.510.58.57.5
6.7518.014.011.510.09.08.0
18.014.011.510.08.58.0
18.014.011.510.08.58.0
19.014.512.010.59.59.0
18.514.512.010.510.08.0
17.513.511.510.09.08.0
19.514.011.510.09.08.0
17.012.010.08.07.06.5
18.014.011.510.09.08.0
19.014.011.510.08.58.0
DrainDown Time
40.030.025.022.020.018.041.031.025.022.520.017.540.029.024.020.518.016.040.030.025.022.020.018.040.029.524.022.019.017.040.029.524.022.019.017.041.031.027.023.020.519.042.031.026.023.020.519.040.030.024.522.020.017.041.030.025.021.519.517.040.029.024.020.517.516.039.029.024.021.519.517.041.031.024.522.520.018.0
WaterDepth (in.)
2.83.64.04.44.85.22.93.64.04.54.95.32.83.53.74.14.54.72.83.64.04.44.85.22.83.54.04.44.85.22.83.54.04.44.85.23.03.74.24.65.05.53.23.84.24.65.05.42.9
3.554.04.44.85.23.03.64.04.44.85.22.83.53.74.1
4.454.72.83.53.94.44.85.23.03.74.04.54.95.3
FlowRateGPM
14.719.2521.523.726.028.715.3
19.2521.524.3
26.7529.514.7
18.7519.822.024.325.514.7
19.2521.523.726.028.714.7
18.7521.523.726.028.714.7
18.7521.523.726.028.715.719.822.525.027.530.917.020.322.525.027.530.215.319.021.523.726.028.715.7
19.2521.523.726.028.714.7
18.7519.822.024.025.514.7
18.7521.023.726.028.715.719.821.524.3
26.7529.5
DrainDown Time
29.022.018.016.014.013.029.522.019.016.014.013.028.021.016.514.012.011.529.022.018.016.014.013.029.022.018.015.014.012.029.022.018.015.014.012.030.023.019.516.014.513.030.023.019.517.014.513.029.022.018.516.014.012.029.523.019.016.014.012.528.021.016.014.012.011.029.022.019.016.014.012.530.022.019.015.513.512.5
WaterDepth (in.)
2.73.43.84.34.75.12.73.53.94.34.75.1
2.553.1
2.553.94.34.52.73.43.84.34.75.12.73.43.84.34.65.02.73.43.84.34.65.02.83.64.04.54.95.32.93.64.04.54.85.32.73.43.74.24.65.02.83.53.84.34.65.02.53.23.53.84.14.42.63.43.84.34.65.02.73.53.84.34.6
5.05
FlowRateGPM
14.218.020.323.225.528.014.2
18.7521.023.225.528.013.216.519.021.023.224.314.218.020.323.225.528.014.218.020.323.225.027.514.218.020.323.225.027.514.7
19.2521.524.3
26.7529.515.3
19.2521.524.326.029.514.218.019.822.525.027.514.7
18.7520.323.225.027.513.017.0
18.7520.322.023.713.618.020.323.225.027.514.2
18.7520.323.225.0
27.75
5,000 SQ. FT. 7,500 SQ. FT. 10,000 SQ. FT.
LOCATION
ROUYN-NORANDAQUEBEC
MONTREALQUEBEC
AREA RATING TABLE 1 (CONTINUED)
OTTAWAONTARIO
ST-THOMASONTARIO
NORTH BAYONTARIO
LONDONONTARIO
KINGSTONONTARIO
HAMILTONONTARIO
GUELPHONTARIO
TROIS-RIVIERESQUEBEC
SHERBROOKEQUEBEC
RIMOUSKIQUEBEC
QUEBECCITY
QUEBEC
Drawing No.19- 14
Note: ats is not responsible for content or accuracy of charts provided.
Plumbing Specification Information ENGINEERING DATA
Copyright © ats inc. 2008
RoofSlope(in.)
023456023456023456023456023456023456023456023456023456023456023456023456023456
DrainDown Time
8.05.85.04.03.53.28.06.05.04.54.03.59.06.55.54.54.03.59.06.55.55.04.03.58.5
6.755.55.04.54.08.05.85.04.03.53.27.05.04.03.5
2.752.57.56.05.04.54.03.58.06.05.04.54.03.58.06.05.04.54.03.55.03.53.02.5
2.252.07.05.03.53.02.52.07.05.03.53.02.52.0
2,500 SQ. FT.Water
Depth (in.)
1.92.73.13.43.84.02.12.83.23.63.94.32.33.03.43.84.24.62.33.03.43.84.24.52.33.13.54.04.44.71.92.73.13.43.84.01.72.3
2.552.83.03.21.92.23.23.63.9
4.232.02.73.23.63.94.22.12.83.23.63.94.21.11.72.02.32.52.61.72.22.42.62.72.8162.22.42.52.82.9
FlowRateGPM
10.014.216.518.020.321.511.014.717.0
19.2521.023.212.015.718.020.322.525.012.015.718.020.322.524.312.016.5
18.7521.523.725.510.014.210.518.020.321.59.0
12.013.214.715.717.010.011.517.0
19.2521.023.210.514.217.0
19.2521.022.511.014.717.0
19.2521.022.55.89.0
10.512.013.013.69.011.512.513.614.214.78.811.512.513.014.715.3
FlowRateGPM
12.015.718.020.322.524.313.017.0
19.2521.523.725.514.218.020.323.225.027.513.617.519.822.524.327.513.618.020.323.225.528.012.015.718.020.322.524.311.514.716.5
18.7519.821.511.515.318.020.322.525.012.015.718.020.322.525.012.517.0
18.7521.523.725.06.5
10.512.513.614.715.711.514.715.717.5
18.7519.811.514.715.717.0
18.7519.25
DrainDown Time
18.013.511.09.58.07.5
18.513.511.510.08.57.5
18.414.512.010.510.08.0
19.014.011.510.59.08.0
19.014.012.010.09.58.5
18.013.511.09.58.07.5
17.012.010.08.07.06.5
17.013.011.09.58.57.5
17.513.011.09.58.57.5
18.513.511.010.08.57.511.08.07.06.05.55.0
17.012.09.58.07.06.0
17.012.09.57.57.06.0
DrainDown Time
40.028.524.021.518.016.040.030.025.022.019.517.042.031.026.023.020.519.041.030.525.022.520.018.040.031.025.522.520.518.040.028.524.021.518.016.040.029.024.020.517.516.036.028.023.020.018.016.037.028.023.020.018.016.540.030.524.021.518.517.027.520.016.014.012.011.0540.528.523.520.017.015.540.028.523.020.017.015.0
WaterDepth (in.)
2.83.43.84.34.65.02.93.64.04.44.75.23.23.84.24.65.05.43.03.74.14.54.95.3
2.953.74.14.55.05.42.83.43.84.34.65.02.83.53.74.1
4.454.72.53.43.84.24.64.92.63.43.84.24.65.02.83.53.94.44.85.11.62.32.63.03.33.52.93.43.74.04.34.62.83.43.64.04.34.5
FlowRateGPM
14.718.020.323.225.027.515.3
19.2521.523.725.528.717.020.322.525.027.530.215.719.822.024.3
26.7529.515.519.822.024.327.530.214.718.020.323.225.027.514.7
18.7519.822.024.025.513.018.020.322.525.0
26.7513.618.020.322.525.027.514.7
18.7521.023.726.028.08.8
12.013.615.717.5
18.7515.318.019.821.523.225.014.718.0
19.2521.523.224.3
WaterDepth (in.)
2.73.23.74.14.44.82.73.43.84.34.65.02.93.64.04.54.85.32.83.53.94.44.85.22.83.54.04.44.95.32.73.23.74.14.44.82.53.23.53.84.14.42.43.23.64.04.44.82.53.23.64.04.44.82.63.43.84.34.65.01.52.22.52.83.13.42.63.23.43.73.94.22.53.13.43.63.94.2
FlowRateGPM
14.217.019.822.023.726.014.218.020.323.225.027.515.3
19.2521.524.326.029.514.7
18.7521.023.726.028.714.7
18.7521.523.7
26.7529.514.217.019.822.023.726.013.017.0
18.7520.322.023.712.517.0
19.2521.523.726.013.017.0
19.2521.523.726.013.618.020.323.225.027.57.8
11.513.014.716.518.013.617.018.019.821.022.513.016.518.0
19.2521.022.5
5,000 SQ. FT. 7,500 SQ. FT. 10,000 SQ. FT.
LOCATION
VICTORIAB.C
VANCOUVERB.C
WINDSORONTARIO
TORONTOONTARIO
THUNDER BAYONTARIO
AREA RATING TABLE 1 (CONTINUED)
EDMONTONALBERTA
PENTICTONB.C
CALGARYALBERTA
SASKATOONSASKATCH-
EWAN
REGINASASKATCH-
EWAN
WINNIPEGMANITOBA
BRANDON(RIVERS)
MANITOBA
TIMMINSONTARIO
DrainDown Time
29.021.018.015.013.012.029.522.018.515.514.012.530.023.019.517.014.513.029.522.019.016.014.513.030.023.019.016.015.013.029.021.018.015.013.012.028.021.016.014.012.011.027.021.017.014.513.512.027.521.017.014.513.512.028.521.517.515.014.512.519.514.011.010.08.58.0
28.521.016.014.011.59.5
28.020.516.013.511.59.5
WaterDepth (in.)
2.33.03.43.84.24.52.53.23.64.04.44.72.73.43.84.34.65.02.63.33.74.24.55.02.63.43.84.34.75.12.33.03.43.84.24.52.22.83.13.53.74.02.22.93.43.84.24.62.33.03.43.84.24.62.43.23.54.04.44.61.32.02.42.62.83.02.22.83.03.33.53.72.22.83.03.23.53.6
Note: ats is not responsible for content or accuracy of charts provided.
Plumbing Specification Information ENGINEERING DATA
Drawing No.19- 15Copyright © ats inc. 2003
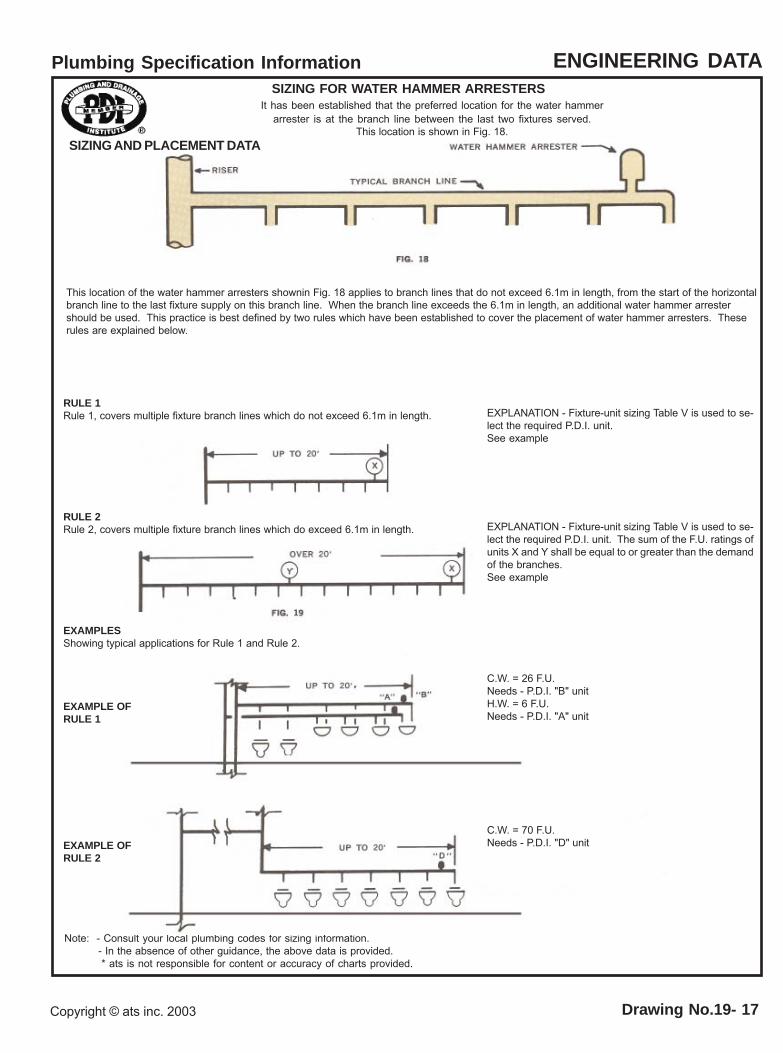
SIZING AND PLACEMENT DATA
STANDARIZATION
The menbers of the Plumbing and Drainage Institute were aware of thedifficulties encountered in the application of the different sizing methods.Therefore, they engaged in a research and testing program with intentionof producing one standard method of sizing and placement - a methodwhich would be of benefit to the entire plumbing industry. The final resultsare listed in this manual.
SYMBOLS
Before the subject of a proposed sizing method can be explained it is firstnecessary to devise a code of symbols for the 6 different sized units re-quired for average plumbing systems. Each unit must have a differentsize and capacity to control shock in piping systems of varied size andscope. The following symbol listing has been devised to denote the rangein sizes for water hammer arresters. "A", is the smallest sized unit - "F"represents the largest unit.
P.D.I. SYMBOLS: A - B - C - D -E - F
COMMENT
The P.D.I. symbols established above correspond to those units coveredby the certification testing program and shall be employed with all data onsizing and placement presented in this manual.
SIZING AND PLACEMENT DATA
Single and Multiple Fixture Branch LinesA method of sizing, based upon fixture-units has been established as mostappropriate because it is quick, accurate and well known. Most engineersemploy fixture-units for sizing water distribution systems.
DEFINITION OF FIXTURE UNIT
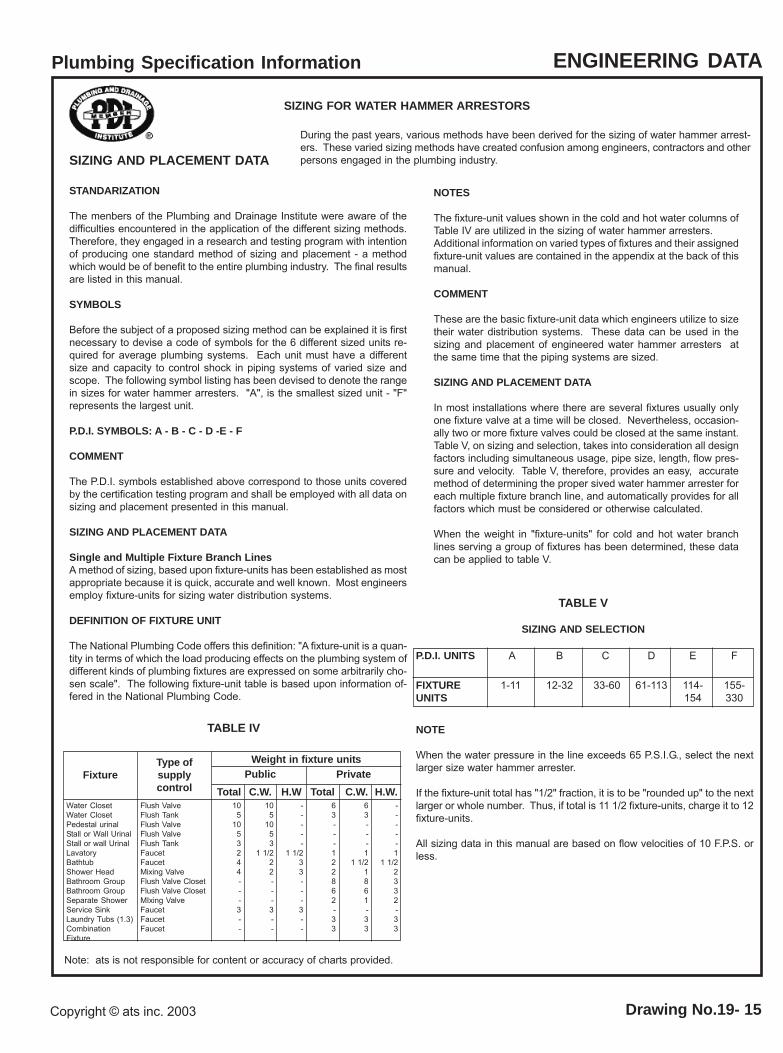
The National Plumbing Code offers this definition: "A fixture-unit is a quan-tity in terms of which the load producing effects on the plumbing system ofdifferent kinds of plumbing fixtures are expressed on some arbitrarily cho-sen scale". The following fixture-unit table is based upon information of-fered in the National Plumbing Code.
SIZING FOR WATER HAMMER ARRESTORS
During the past years, various methods have been derived for the sizing of water hammer arrest-ers. These varied sizing methods have created confusion among engineers, contractors and otherpersons engaged in the plumbing industry.
FixtureType ofsupplycontrol
Weight in fixture unitsPublic Private
Total C.W. H.W Total C.W. H.W.Water ClosetWater ClosetPedestal urinalStall or Wall UrinalStall or wall UrinalLavatoryBathtubShower HeadBathroom GroupBathroom GroupSeparate ShowerService SinkLaundry Tubs (1.3)CombinationFixture
Flush ValveFlush TankFlush ValveFlush ValveFlush TankFaucetFaucetMixing ValveFlush Valve ClosetFlush Valve ClosetMIxing ValveFaucetFaucetFaucet
105
1053244---3--
105
1053
1 1/222---3--
-----
1 1/233---3--
63---122862-33
63---1
1 1/21861-33
-----1
1 1/22332-33
NOTES
The fixture-unit values shown in the cold and hot water columns ofTable IV are utilized in the sizing of water hammer arresters.Additional information on varied types of fixtures and their assignedfixture-unit values are contained in the appendix at the back of thismanual.
COMMENT
These are the basic fixture-unit data which engineers utilize to sizetheir water distribution systems. These data can be used in thesizing and placement of engineered water hammer arresters atthe same time that the piping systems are sized.
SIZING AND PLACEMENT DATA
In most installations where there are several fixtures usually onlyone fixture valve at a time will be closed. Nevertheless, occasion-ally two or more fixture valves could be closed at the same instant.Table V, on sizing and selection, takes into consideration all designfactors including simultaneous usage, pipe size, length, flow pres-sure and velocity. Table V, therefore, provides an easy, accuratemethod of determining the proper sived water hammer arrester foreach multiple fixture branch line, and automatically provides for allfactors which must be considered or otherwise calculated.
When the weight in "fixture-units" for cold and hot water branchlines serving a group of fixtures has been determined, these datacan be applied to table V.
TABLE V
SIZING AND SELECTION
P.D.I. UNITS
FIXTUREUNITS
A B C D E F
1-11 12-32 33-60 61-113 114-154
155-330
NOTE
When the water pressure in the line exceeds 65 P.S.I.G., select the nextlarger size water hammer arrester.
If the fixture-unit total has "1/2" fraction, it is to be "rounded up" to the nextlarger or whole number. Thus, if total is 11 1/2 fixture-units, charge it to 12fixture-units.
All sizing data in this manual are based on flow velocities of 10 F.P.S. orless.
TABLE IV
Drawing No.19- 16
Note: ats is not responsible for content or accuracy of charts provided.
Plumbing Specification Information ENGINEERING DATA
Copyright © ats inc. 2003
SIZING FOR WATER HAMMER ARRESTERS
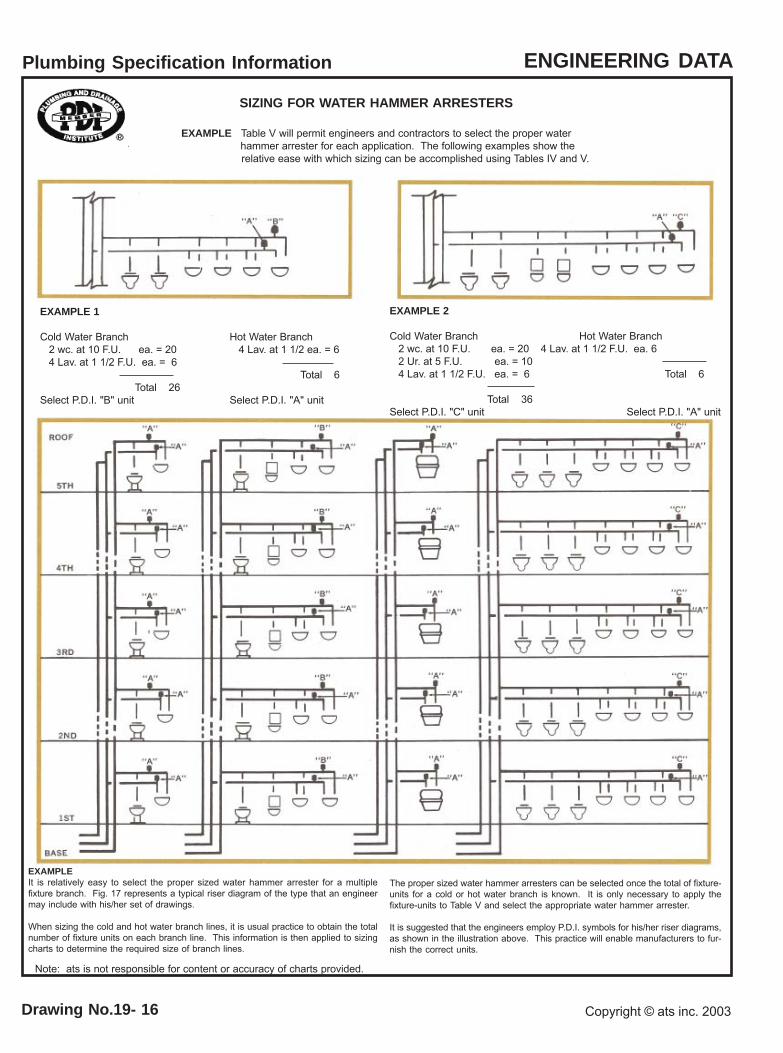
EXAMPLE Table V will permit engineers and contractors to select the proper water hammer arrester for each application. The following examples show the
relative ease with which sizing can be accomplished using Tables IV and V.
EXAMPLE 1
Cold Water Branch Hot Water Branch 2 wc. at 10 F.U. ea. = 20 4 Lav. at 1 1/2 ea. = 6 4 Lav. at 1 1/2 F.U. ea. = 6
Total 6Total 26
Select P.D.I. "B" unit Select P.D.I. "A" unit
EXAMPLE 2
Cold Water Branch Hot Water Branch 2 wc. at 10 F.U. ea. = 20 4 Lav. at 1 1/2 F.U. ea. 6 2 Ur. at 5 F.U. ea. = 10 4 Lav. at 1 1/2 F.U. ea. = 6 Total 6
Total 36Select P.D.I. "C" unit Select P.D.I. "A" unit
EXAMPLEIt is relatively easy to select the proper sized water hammer arrester for a multiplefixture branch. Fig. 17 represents a typical riser diagram of the type that an engineermay include with his/her set of drawings.
When sizing the cold and hot water branch lines, it is usual practice to obtain the totalnumber of fixture units on each branch line. This information is then applied to sizingcharts to determine the required size of branch lines.
The proper sized water hammer arresters can be selected once the total of fixture-units for a cold or hot water branch is known. It is only necessary to apply thefixture-units to Table V and select the appropriate water hammer arrester.
It is suggested that the engineers employ P.D.I. symbols for his/her riser diagrams,as shown in the illustration above. This practice will enable manufacturers to fur-nish the correct units.
Note: - Consult your local plumbing codes for sizing information. - In the absence of other guidance, the above data is provided. * ats is not responsible for content or accuracy of charts provided.
Plumbing Specification Information ENGINEERING DATA
Drawing No.19- 17Copyright © ats inc. 2003
SIZING FOR WATER HAMMER ARRESTERSIt has been established that the preferred location for the water hammer
arrester is at the branch line between the last two fixtures served. This location is shown in Fig. 18.
This location of the water hammer arresters shownin Fig. 18 applies to branch lines that do not exceed 6.1m in length, from the start of the horizontalbranch line to the last fixture supply on this branch line. When the branch line exceeds the 6.1m in length, an additional water hammer arrestershould be used. This practice is best defined by two rules which have been established to cover the placement of water hammer arresters. Theserules are explained below.
RULE 1Rule 1, covers multiple fixture branch lines which do not exceed 6.1m in length.
RULE 2Rule 2, covers multiple fixture branch lines which do exceed 6.1m in length.
EXAMPLESShowing typical applications for Rule 1 and Rule 2.
EXAMPLE OFRULE 1
EXAMPLE OFRULE 2
EXPLANATION - Fixture-unit sizing Table V is used to se-lect the required P.D.I. unit.See example
EXPLANATION - Fixture-unit sizing Table V is used to se-lect the required P.D.I. unit. The sum of the F.U. ratings ofunits X and Y shall be equal to or greater than the demandof the branches.See example
C.W. = 26 F.U.Needs - P.D.I. "B" unitH.W. = 6 F.U.Needs - P.D.I. "A" unit
C.W. = 70 F.U.Needs - P.D.I. "D" unit
SIZING AND PLACEMENT DATA
Plumbing Specification Information ENGINEERING DATA
Note:-Consult your local plumbing codes for sizing information- In the absence of other guidance, the above date is provided* ats is not responsible for content or accuracy of charts provided
Drawing No. 19-18 Copyright © ats inc. 2011
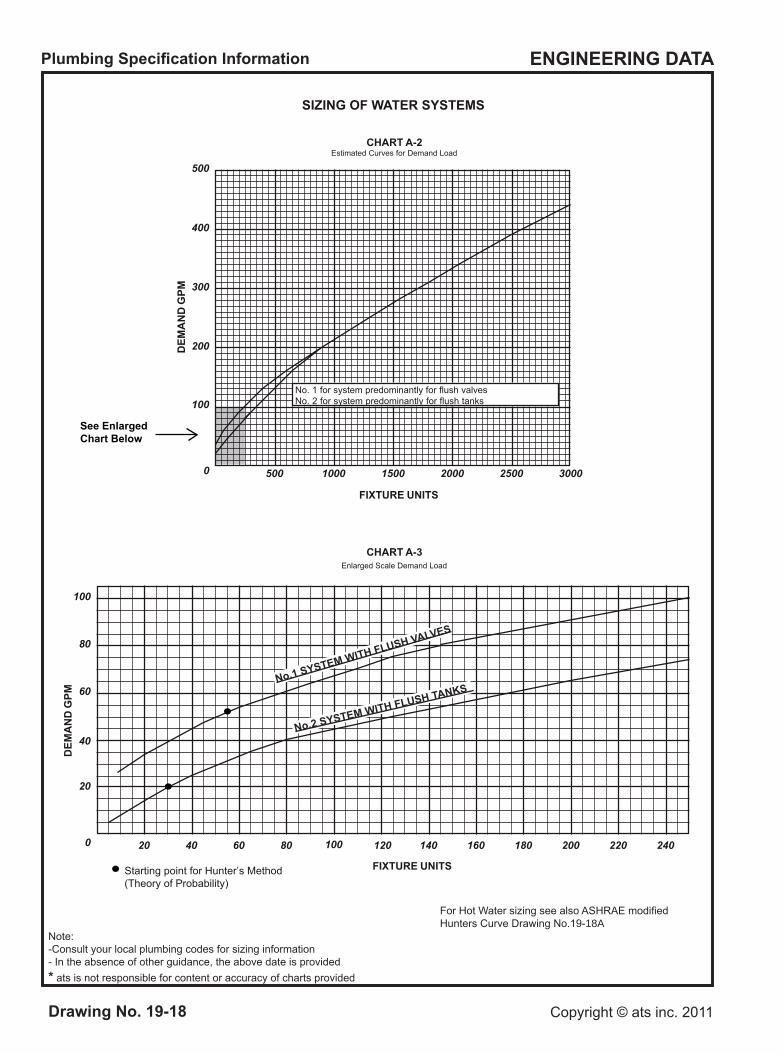
SIZING OF WATER SYSTEMS
20
0
40
60
80
100
20 240220200180160140120100806040
DEM
AN
D G
PM
CHART A-3Enlarged Scale Demand Load
FIXTURE UNITS
0
100
200
300
400
500
0003005 250020001500
No. 1 for system predominantly for flush valvesNo. 2 for system predominantly for flush tanks
1000
DEM
AN
D G
PM
CHART A-2Estimated Curves for Demand Load
FIXTURE UNITS
See Enlarged Chart Below
Starting point for Hunter’s Method(Theory of Probability)
No.1 SYSTEM WITH FLUSH VALVES
No.2 SYSTEM WITH FLUSH TANKS
For Hot Water sizing see also ASHRAE modified Hunters Curve Drawing No.19-18A
Plumbing Specification Information ENGINEERING DATA
Note:-Consult your local plumbing codes for sizing information and acceptance of revised data for low-flow fixtures- In the absence of other guidance, the above date is provided* ats is not responsible for content or accuracy of charts provided
Drawing No. 19-18ACopyright © ats inc. 2011
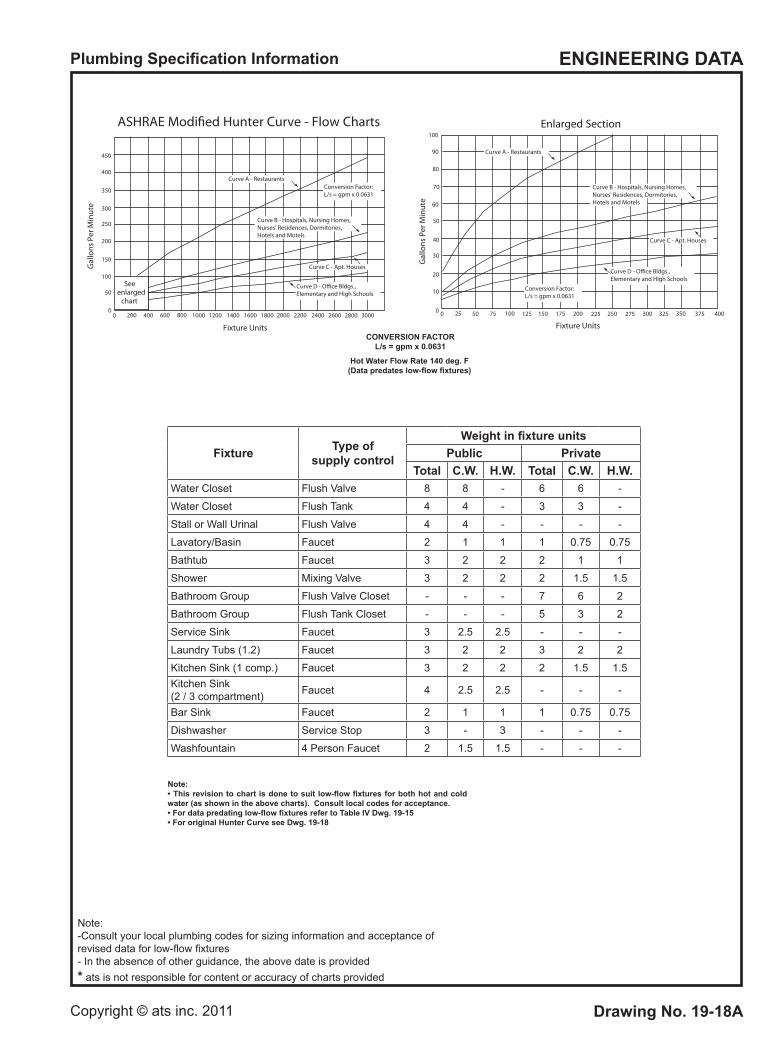
ASHRAE Modi�ed Hunter Curve - Flow Charts
Seeenlarged
chart
450
400
350
300
250
200
200 400 600 800 1000 1200 1400 1600 1800 2000 2200 2400 2600 2800 3000
150
100
50
00
Curve A - Restaurants
Gal
lons
Per
Min
ute
Fixture Units
Curve B - Hospitals, Nursing Homes,Nurses' Residences, Dormitories,Hotels and Motels
Curve C - Apt. Houses
Curve D - O�ce Bldgs.,Elementary and High Schools
Conversion Factor:L/s = gpm x 0.0631
Gal
lons
Per
Min
ute
Fixture Units
Curve A - Restaurants
Curve B - Hospitals, Nursing Homes,Nurses' Residences, Dormitories,Hotels and Motels
Curve C - Apt. Houses
100
90
80
60
40
30
20
25 50 75 100 125 150 175 200 225 250 275 300 325 350 375 400
10
0 0
50
70
Conversion Factor:L/s = gpm x 0.0631
Curve D - O�ce Bldgs.,Elementary and High Schools
Enlarged Section
Fixture Type of supply control
Weight in fixture unitsPublic Private
Total C.W. H.W. Total C.W. H.W.Water Closet Flush Valve 8 8 - 6 6 -
Water Closet Flush Tank 4 4 - 3 3 -
Stall or Wall Urinal Flush Valve 4 4 - - - -
Lavatory/Basin Faucet 2 1 1 1 0.75 0.75
Bathtub Faucet 3 2 2 2 1 1
Shower Mixing Valve 3 2 2 2 1.5 1.5
Bathroom Group Flush Valve Closet - - - 7 6 2
Bathroom Group Flush Tank Closet - - - 5 3 2
Service Sink Faucet 3 2.5 2.5 - - -
Laundry Tubs (1.2) Faucet 3 2 2 3 2 2
Kitchen Sink (1 comp.) Faucet 3 2 2 2 1.5 1.5Kitchen Sink (2 / 3 compartment) Faucet 4 2.5 2.5 - - -
Bar Sink Faucet 2 1 1 1 0.75 0.75
Dishwasher Service Stop 3 - 3 - - -
Washfountain 4 Person Faucet 2 1.5 1.5 - - -
Note: • This revision to chart is done to suit low-flow fixtures for both hot and cold water (as shown in the above charts). Consult local codes for acceptance.• For data predating low-flow fixtures refer to Table IV Dwg. 19-15• For original Hunter Curve see Dwg. 19-18
CONVERSION FACTORL/s = gpm x 0.0631
Hot Water Flow Rate 140 deg. F(Data predates low-flow fixtures)
Plumbing Specification Information ENGINEERING DATA
Note:-Consult your local plumbing codes for sizing information and acceptance of revised data for low-flow fixtures- In the absence of other guidance, the above date is provided* ats is not responsible for content or accuracy of charts provided
Drawing No. 19-18B Copyright © ats inc. 2011
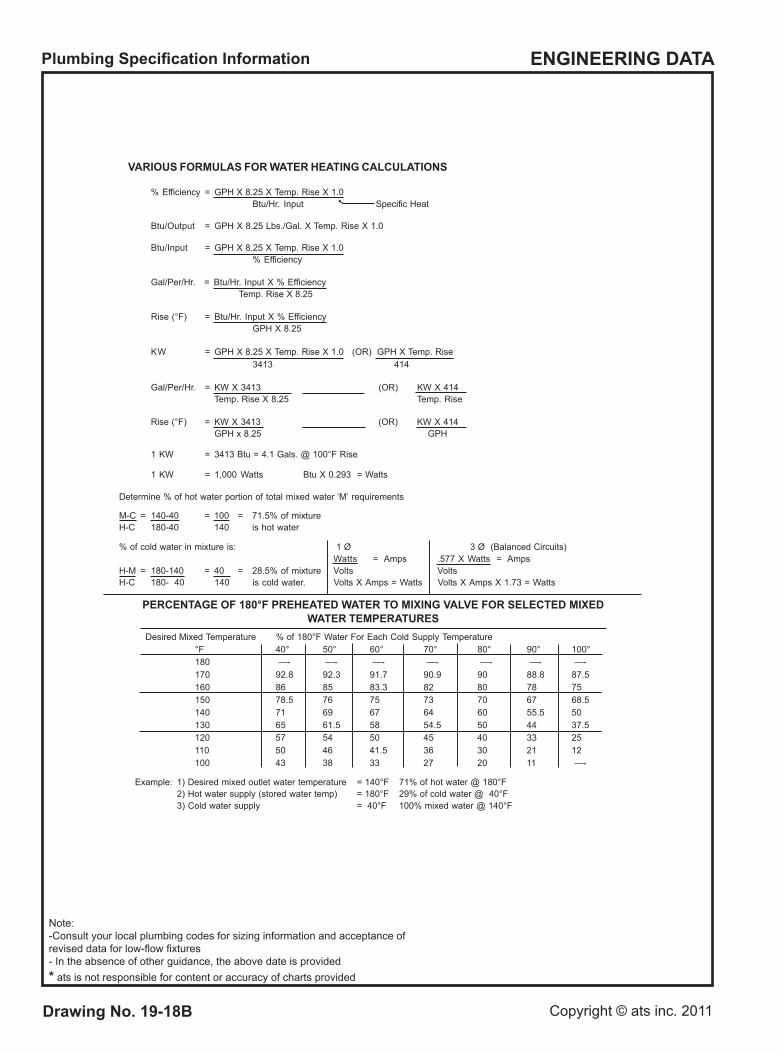
VARIOUS FORMULAS FOR WATER HEATING CALCULATIONS
% Efficiency = GPH X 8.25 X Temp. Rise X 1.0Btu/Hr. Input Specific Heat
Btu/Output = GPH X 8.25 Lbs./Gal. X Temp. Rise X 1.0
Btu/Input = GPH X 8.25 X Temp. Rise X 1.0% Efficiency
Gal/Per/Hr. = Btu/Hr. Input X % Efficiency Temp. Rise X 8.25
Rise (°F) = Btu/Hr. Input X % EfficiencyGPH X 8.25
KW = GPH X 8.25 X Temp. Rise X 1.0 (OR) GPH X Temp. Rise414 3143
414 X WK)RO( 3143 X WK=.rH/reP/laGesiR .pmeT52.8 X esiR .pmeT
414 X WK)RO( 3143 X WK=)F°( esiRHPG 52.8 x HPG
1 KW = 3413 Btu = 4.1 Gals. @ 100°F Rise
1 KW = 1,000 Watts Btu X 0.293 = Watts
Determine % of hot water portion of total mixed water ‘M’ requirements
M-C = 140-40 = 100 = 71.5% of mixtureH-C 180-40 140 is hot water
1 :si erutxim ni retaw dloc fo % Ø 3 Ø (Balanced Circuits)Watts = Amps .577 X Watts = Amps
H-M = 180-140 = 40 = 28.5% of mixture Volts VoltsH-C 180- 40 140 is cold water. Volts X Amps = Watts Volts X Amps X 1.73 = Watts
PERCENTAGE OF 180°F PREHEATED WATER TO MIXING VALVE FOR SELECTED MIXEDWATER TEMPERATURES
Desired Mixed Temperature % of 180°F Water For Each Cold Supply Temperature°F 40° 50° 60° 70° 80° 90° 100°180 —- —- —- —- —- —- —-170 92.8 92.3 91.7 90.9 90 88.8 87.5160 86 85 83.3 82 80 78 75150 78.5 76 75 73 70 67 68.5140 71 69 67 64 60 55.5 50130 65 61.5 58 54.5 50 44 37.5120 57 54 50 45 40 33 25110 50 46 41.5 36 30 21 12100 43 38 33 27 20 11 —-
Example: 1) Desired mixed outlet water temperature = 140°F 71% of hot water @ 180°F2) Hot water supply (stored water temp) = 180°F 29% of cold water @ 40°F
F°041 @ retaw dexim %001F°04 = ylppus retaw dloC )3
®
Plumbing Specification Information ENGINEERING DATA
Note:-Consult your local plumbing codes for sizing information- In the absence of other guidance, the above date is provided* ats is not responsible for content or accuracy of charts provided
Drawing No. 19-19Copyright © ats inc. 2011
2” to 6”C.W.
Diameter: 6 inches
2
3
6
4
8
5
10
20
3040
1
506080
100
200
300
600
400500
1000800
2000
3000400050006000
10000
2
3
6
4
8
5
10
20
3040
1
506080100
200
300
600
400500
1000800
2000
3000400050006000
100008000 8000
0.1 .2 .3 .6 .8 1.5.4 2 3 4 5 6 8 10 20 30 40 50 60 80 100Pressure loss in head in lbs per sq. in. per 100 ft. of length
Flow
in G
allo
ns p
er M
inut
e
Flow
in G
allo
ns p
er M
inut
e
0.1 .2 .3 .6 .8 1.5.4 2 3 4 5 6 8 10 20 30 40 50 60 80 100
Pressure loss in head in lbs per sq. in. per 100 ft. of length
5
4
3
2
1 1/2
1
3/4
1/2
1/4
Velocity: 10 ft. per second
8
6
4
5
3
2
15
20
30
40
Copper Tubing Smooth PipeType MType LType K
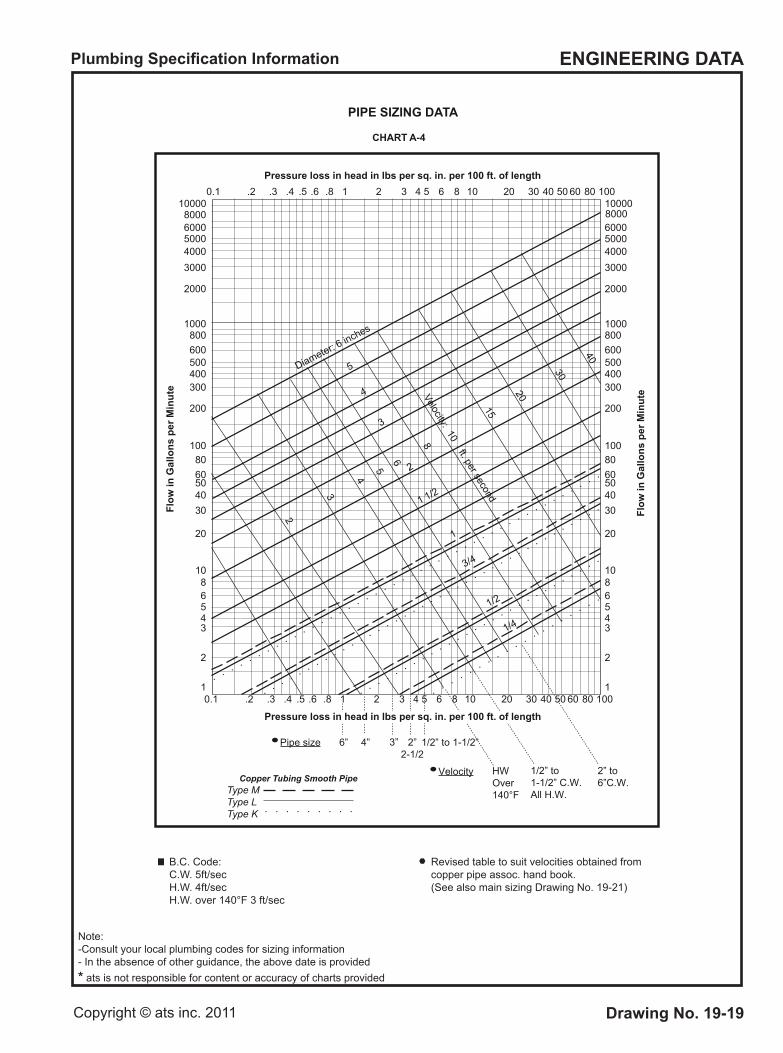
CHART A-4
PIPE SIZING DATA
6” 3” 2”2-1/2
HWOver 140°F
1/2” to 1-1/2” C.W.All H.W.
Pipe size 4” 1/2” to 1-1/2”
Velocity
Revised table to suit velocities obtained from copper pipe assoc. hand book. (See also main sizing Drawing No. 19-21)
B.C. Code:C.W. 5ft/secH.W. 4ft/secH.W. over 140°F 3 ft/sec
Plumbing Specification Information ENGINEERING DATA
Note:-Consult your local plumbing codes for sizing information- In the absence of other guidance, the above date is provided* ats is not responsible for content or accuracy of charts provided
Drawing No. 19-20 Copyright © ats inc. 2011
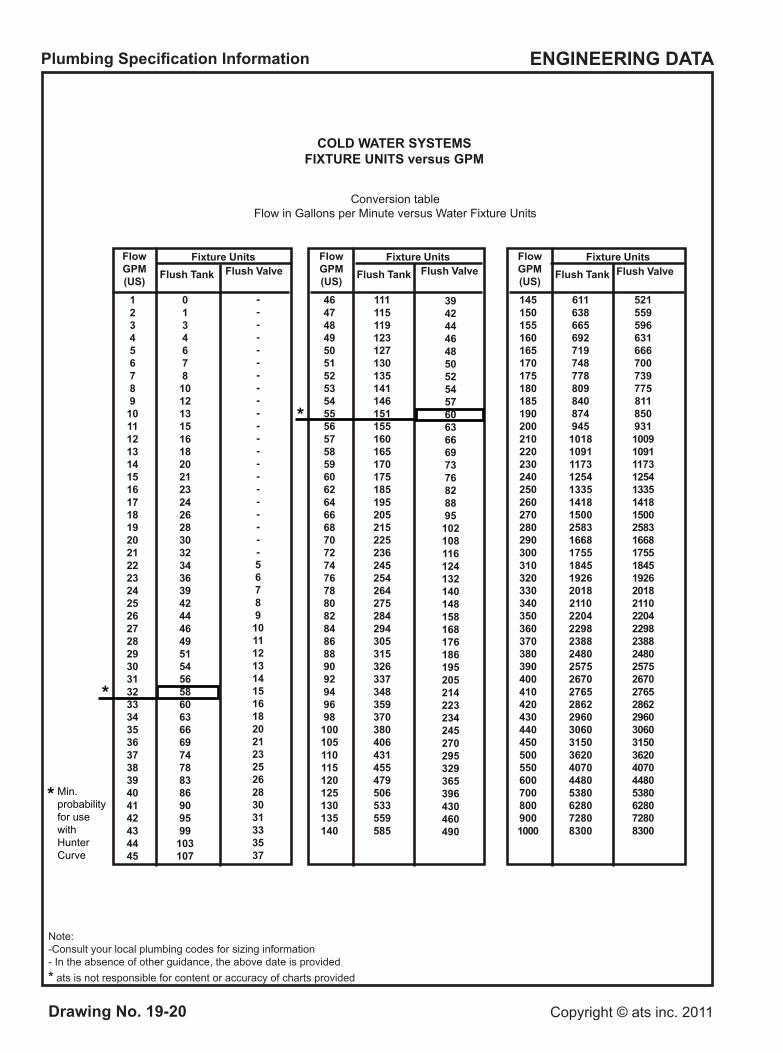
Conversion tableFlow in Gallons per Minute versus Water Fixture Units
COLD WATER SYSTEMSFIXTURE UNITS versus GPM
Fixture UnitsFlush Tank Flush Valve
FlowGPM(US)46474849505152535455565758596062646668707274767880828486889092949698100105110115120125130135140
111115119123127130135141146151155160165170175185195205215225236245254264275284294305315326337348359370380406431455479506533559585
394244464850525457606366697376828895102108116124132140148158168176186195205214223234245270295329365396430460490
Fixture UnitsFlush Tank Flush Valve
FlowGPM(US)1451501551601651701751801851902002102202302402502602702802903003103203303403503603703803904004104204304404505005506007008009001000
61163866569271974877880984087494510181091117312541335141815002583166817551845192620182110220422982388248025752670276528622960306031503620407044805380628072808300
52155959663166670073977581185093110091091117312541335141815002583166817551845192620182110220422982388248025752670276528622960306031503620407044805380628072808300
Fixture UnitsFlush Tank Flush Valve
FlowGPM(US)
123456789
101112131415161718192021222324252627282930313233343536373839404142434445
0134678101213151618202123242628303234363942444649515456586063666974788386909599
103107
---------------------5678910111213141516182021232526283031333537
Min. probability for use with Hunter Curve
*
*
*
Plumbing Specification Information ENGINEERING DATA
Note:-Consult your local plumbing codes for sizing information- In the absence of other guidance, the above date is provided* ats is not responsible for content or accuracy of charts provided
Drawing No. 19-21Copyright © ats inc. 2011
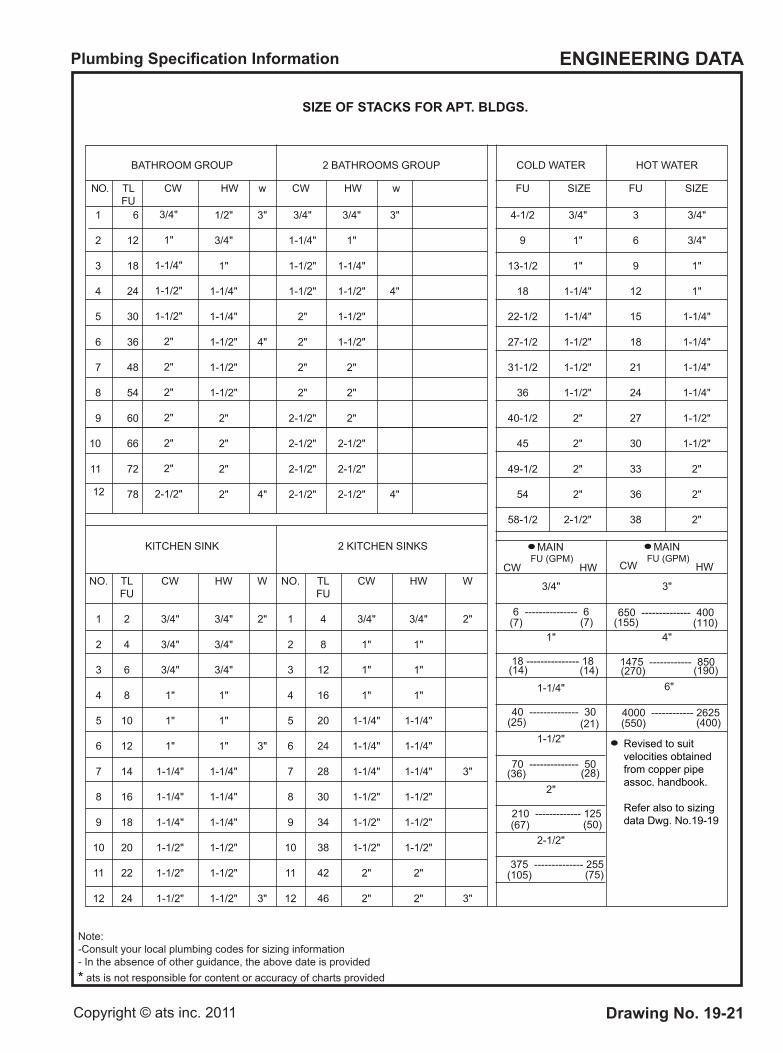
SIZE OF STACKS FOR APT. BLDGS.
BATHROOM GROUP
NO. TLFU
CW HW
3/4"
1"
1-1/4"
1-1/2"
1-1/2"
2"
2"
2"
2"
2"
2"
2-1/2"
1
2
3
4
5
6
7
8
9
10
11
6
12
18
24
30
36
48
54
60
66
72
78
1/2"
3/4"
1"
1-1/4"
1-1/4"
1-1/2"
1-1/2"
1-1/2"
2"
2"
2"
2"
w
3"
4"
4"
2 BATHROOMS GROUP
CW HW w
3/4"
1-1/4"
1-1/2"
1-1/2"
2"
2"
2"
2"
2-1/2"
2-1/2"
2-1/2"
2-1/2"12
3/4"
1"
1-1/4"
1-1/2"
1-1/2"
1-1/2"
2"
2"
2"
2-1/2"
2-1/2"
2-1/2"
3"
4"
4"
COLD WATER HOT WATER
FU SIZE FU SIZE
4-1/2
9
13-1/2
18
22-1/2
27-1/2
31-1/2
36
40-1/2
45
49-1/2
54
58-1/2
3/4"
1"
1"
1-1/4"
1-1/4"
1-1/2"
1-1/2"
1-1/2"
2"
2"
2"
2"
2-1/2"
3
6
9
12
15
18
21
24
27
30
33
36
38
3/4"
3/4"
1"
1"
1-1/4"
1-1/4"
1-1/4"
1-1/4"
1-1/2"
1-1/2"
2"
2"
2"
NO.
1
2
3
4
5
6
7
8
9
10
11
12
TLFU
2
4
6
8
10
12
14
16
18
20
22
24
CW
3/4"
3/4"
3/4"
1"
1"
1"
1-1/4"
1-1/4"
1-1/4"
1-1/2"
1-1/2"
1-1/2"
HW
3/4"
3/4"
3/4"
1"
1"
1"
1-1/4"
1-1/4"
1-1/4"
1-1/2"
1-1/2"
1-1/2"
W
2"
3"
3"
NO.
1
2
3
4
5
6
7
8
9
10
11
12
TLFU
4
8
12
16
20
24
28
30
34
38
42
46
CW
3/4"
1"
1"
1"
1-1/4"
1-1/4"
1-1/4"
1-1/2"
1-1/2"
1-1/2"
2"
2"
HW
3/4"
1"
1"
1"
1-1/4"
1-1/4"
1-1/4"
1-1/2"
1-1/2"
1-1/2"
2"
2"
W
2"
3"
3"
MAIN FU (GPM)
3/4"
6 --------------- 6
1"
18 --------------- 18
1-1/4"
40 -------------- 30
1-1/2"
70 -------------- 50
2"
210 ------------- 125
2-1/2"
375 -------------- 255
3"
4"
SKNIS NEHCTIK 2KNIS NEHCTIK
CW HW CW HW
650 -------------- 400
1475 ------------ 850
6"
4000 ------------ 2625
Revised to suit velocities obtained from copper pipe assoc. handbook.
Refer also to sizing data Dwg. No.19-19
(7) (7)
(14) (14)
(25) (21)
(36) (28)
(67) (50)
(105) (75)
(155) (110)
(270) (190)
(550) (400)
MAIN FU (GPM)
Plumbing Specification Information ENGINEERING DATA
Note:-Consult your local plumbing codes for sizing information and acceptance of revised data for low-flow fixtures- In the absence of other guidance, the above date is provided* ats is not responsible for content or accuracy of charts provided
Drawing No. 19-22 Copyright © ats inc. 2011
GPHLPHF.U.
(140 ° F water)
PRIVATE RES.
APT. HOUSE
CLUB GYM HOSPITAL HOTEL IND. PLANT
OFFICE PUBLIC BATH
SCHOOL YMCA
FIXTURE
BASIN (Private Lav.)
27.6-
27.60.75
27.60.75
27.6
0.75
27.6
0.75
27.6
0.75
27.6
0.75
27.6
0.75
27.6-
27.6
0.75
27.60.75
BASIN (Public Lav.)
---
415-
6231
8301
6231
8301
12461
6231
12461
15571
8301
BATH TUBS2076-
20761.5
20761.5
30114
-
20761.5
20761.5
30114
-
---
451711.5
---
30114
-
DISH WASHER1557-
15571.5
50-150190-570
--
50-150190-570
50-200190-760
20-10076-380
--
--
20-10076-380
20-10076-380
FOOT BATH (Res.)311-
311-
311-
1246-
311-
311-
1246-
---
---
311-
1246-
KITCHEN SINK1038-
1038
0.75
20761.5
---
20763
20761.5
20763
---
---
1038
0.75
20763
LAUNDRY TUB20761.5
20761.5
28106
-
---
28106
-
28106
-
---
---
---
20762.5
28106
-
PANTRY SINK519-
519-
10382.5
---
10382.5
10382.5
---
---
---
10382.5
10382.5
SHOWER30114
-
301141.5
1055681.5
2238501.5
752841.5
752841.5
2238503.5
30114
-
223850
-
2238501.5
2238501.5
SLOP SINK1557-
20761.5
20762.5
---
20762.5
301142.5
20762.5
15572.5
15572.5
20762.5
20762.5
HOURLY HEATING CAPACITY FACTOR
30% 30% 30% 40% 25% 25% 40% 30% 50% 40% 40%
STORAGE CAPACITY FACTOR
70% 125% 90% 100% 60% 80% 100% 200% 120% 100% 100%
Five fixture units per 250 seating capacity
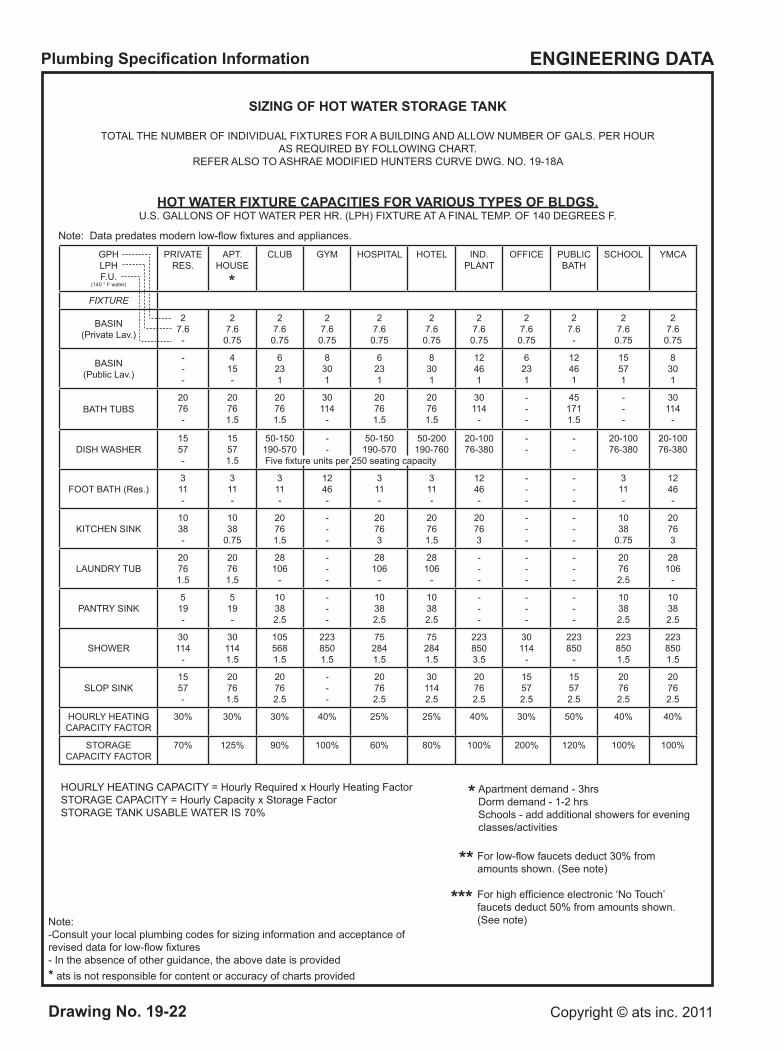
HOURLY HEATING CAPACITY = Hourly Required x Hourly Heating FactorSTORAGE CAPACITY = Hourly Capacity x Storage FactorSTORAGE TANK USABLE WATER IS 70%
Apartment demand - 3hrsDorm demand - 1-2 hrsSchools - add additional showers for evening classes/activities
For low-flow faucets deduct 30% from amounts shown. (See note)
For high efficience electronic ‘No Touch’ faucets deduct 50% from amounts shown. (See note)
*
**
***
SIZING OF HOT WATER STORAGE TANK
TOTAL THE NUMBER OF INDIVIDUAL FIXTURES FOR A BUILDING AND ALLOW NUMBER OF GALS. PER HOUR AS REQUIRED BY FOLLOWING CHART.
REFER ALSO TO ASHRAE MODIFIED HUNTERS CURVE DWG. NO. 19-18A
HOT WATER FIXTURE CAPACITIES FOR VARIOUS TYPES OF BLDGS.U.S. GALLONS OF HOT WATER PER HR. (LPH) FIXTURE AT A FINAL TEMP. OF 140 DEGREES F.
Note: Data predates modern low-flow fixtures and appliances.
*
Plumbing Specification Information ENGINEERING DATA
Drawing No. 19-23Copyright © ats inc. 2012
Note:-Consult your local plumbing codes for sizing information and acceptance of revised data for low-flow fixtures- In the absence of other guidance, the above date is provided* ats is not responsible for content or accuracy of charts provided
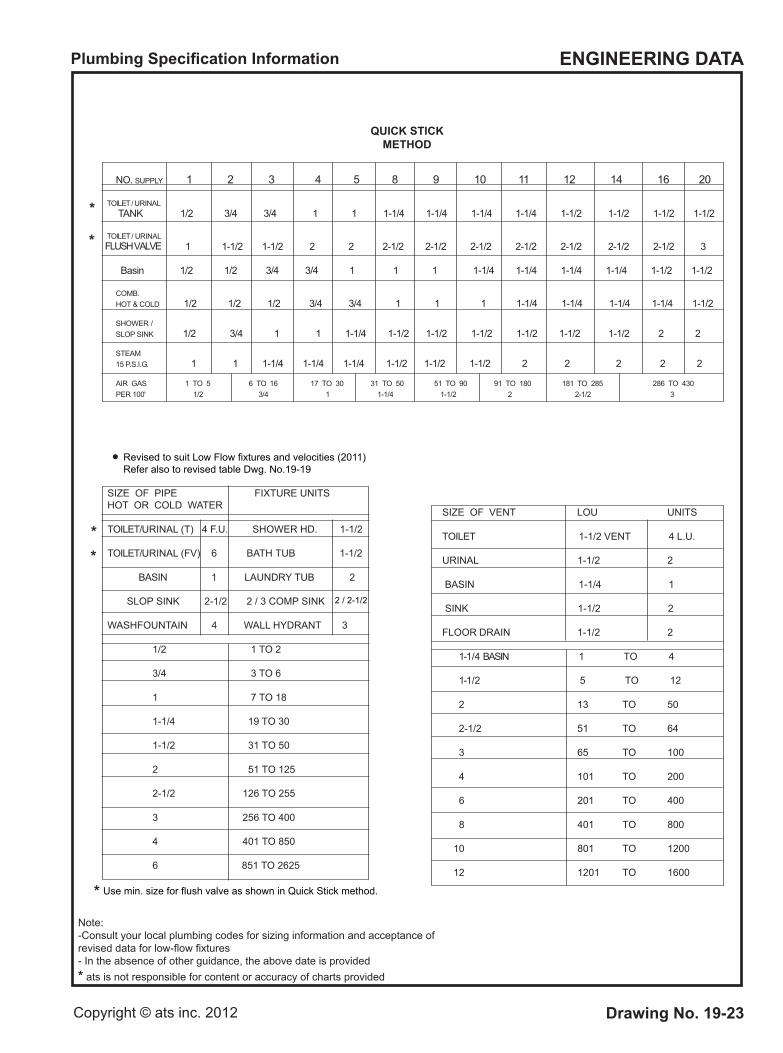
QUICK STICKMETHOD
SIZE OF VENT LOU UNITS
TOILET 1-1/2 VENT 4 L.U.
URINAL 1-1/2 2
BASIN 1-1/4 1
SINK 1-1/2 2
FLOOR DRAIN 1-1/2 2
1-1/4 BASIN 1 TO 4
1-1/2 5 TO 12
05OT312
2-1/2 51 TO 64
001OT563
002OT1014
004OT1026
008OT1048
0021OT10801
0061OT102121
SIZE OF PIPE FIXTURE UNITSHOT OR COLD WATER
TOILET/URINAL (T) 4 F.U. SHOWER HD. 1-1/2
TOILET/URINAL (FV) 6 BATH TUB 1-1/2
BASIN 1 LAUNDRY TUB 2
SLOP SINK 2-1/2 2 / 3 COMP SINK
WASHFOUNTAIN 4 WALL HYDRANT 3
1/2 1 TO 2
3/4 3 TO 6
1 7 TO 18
1-1/4 19 TO 30
1-1/2 31 TO 50
2 51 TO 125
2-1/2 126 TO 255
3 256 TO 400
4 401 TO 850
6 851 TO 2625
NO. SUPPLY 1 2 3 4 5 8 9 10 11 12 14 16 20
TOILET / URINAL TANK 1/2 3/4 3/4 1 1 1-1/4 1-1/4 1-1/4 1-1/4 1-1/2 1-1/2 1-1/2 1-1/2
TOILET / URINAL 1 1-1/2 1-1/2 2 2 2-1/2 2-1/2 2-1/2 2-1/2 2-1/2 2-1/2 2-1/2 3
Basin 1/2 1/2 3/4 3/4 1 1 1 1-1/4 1-1/4 1-1/4 1-1/4 1-1/2 1-1/2
COMB.HOT & COLD 1/2 1/2 1/2 3/4 3/4 1 1 1 1-1/4 1-1/4 1-1/4 1-1/4 1-1/2
SHOWER /SLOP SINK 1/2 3/4 1 1 1-1/4 1-1/2 1-1/2 1-1/2 1-1/2 1-1/2 1-1/2 2 2
STEAM15 P.S.I.G. 1 1 1-1/4 1-1/4 1-1/4 1-1/2 1-1/2 1-1/2 2 2 2 2 2
AIR GAS 1 TO 5 6 TO 16 17 TO 30 31 TO 50 51 TO 90 91 TO 180 181 TO 285 286 TO 430PER 100' 1/2 3/4 1 1-1/4 1-1/2 2 2-1/2 3
*
*
Revised to suit Low Flow fixtures and velocities (2011)Refer also to revised table Dwg. No.19-19
**
2 / 2-1/2
* Use min. size for flush valve as shown in Quick Stick method.
FLUSH VALVE
Plumbing Specification Information ENGINEERING DATA
Drawing No. 19-24 Copyright © ats inc. 2003
Note: - Consult your local plumbing codes for sizing information. - In the absence of other guidance, the above data is provided. * ats is not responsible for content or accuracy of charts provided.
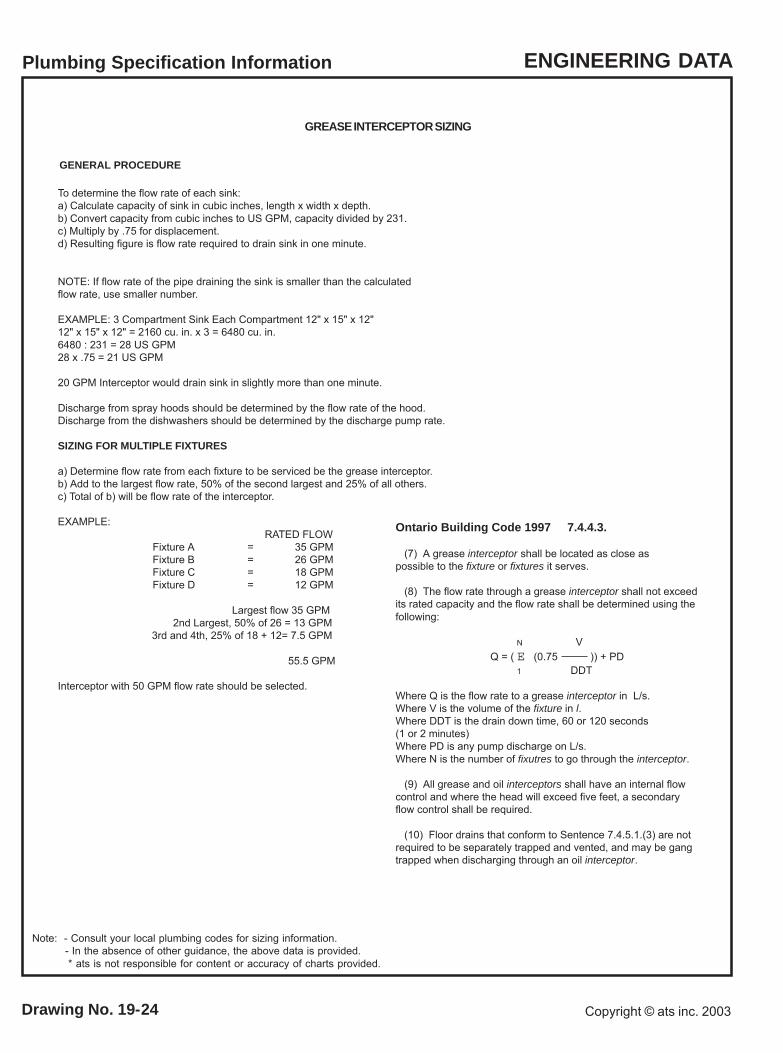
GREASE INTERCEPTOR SIZING
To determine the flow rate of each sink:a) Calculate capacity of sink in cubic inches, length x width x depth.b) Convert capacity from cubic inches to US GPM, capacity divided by 231.c) Multiply by .75 for displacement.d) Resulting figure is flow rate required to drain sink in one minute.
NOTE: If flow rate of the pipe draining the sink is smaller than the calculatedflow rate, use smaller number.
EXAMPLE: 3 Compartment Sink Each Compartment 12" x 15" x 12"12" x 15" x 12" = 2160 cu. in. x 3 = 6480 cu. in.6480 : 231 = 28 US GPM28 x .75 = 21 US GPM
20 GPM Interceptor would drain sink in slightly more than one minute.
Discharge from spray hoods should be determined by the flow rate of the hood.Discharge from the dishwashers should be determined by the discharge pump rate.
SIZING FOR MULTIPLE FIXTURES
a) Determine flow rate from each fixture to be serviced be the grease interceptor.b) Add to the largest flow rate, 50% of the second largest and 25% of all others.c) Total of b) will be flow rate of the interceptor.
EXAMPLE: RATED FLOW
Fixture A = 35 GPMFixture B = 26 GPMFixture C = 18 GPMFixture D = 12 GPM
Largest flow 35 GPM 2nd Largest, 50% of 26 = 13 GPM
3rd and 4th, 25% of 18 + 12= 7.5 GPM
55.5 GPM
Interceptor with 50 GPM flow rate should be selected.
Ontario Building Code 1997 7.4.4.3.
(7) A grease interceptor shall be located as close aspossible to the fixture or fixtures it serves.
(8) The flow rate through a grease interceptor shall not exceedits rated capacity and the flow rate shall be determined using thefollowing:
N VQ = ( E (0.75 )) + PD 1 DDT
Where Q is the flow rate to a grease interceptor in L/s.Where V is the volume of the fixture in l.Where DDT is the drain down time, 60 or 120 seconds(1 or 2 minutes)Where PD is any pump discharge on L/s.Where N is the number of fixutres to go through the interceptor.
(9) All grease and oil interceptors shall have an internal flowcontrol and where the head will exceed five feet, a secondaryflow control shall be required.
(10) Floor drains that conform to Sentence 7.4.5.1.(3) are notrequired to be separately trapped and vented, and may be gangtrapped when discharging through an oil interceptor.
GENERAL PROCEDURE
Plumbing Specification Information ENGINEERING DATA
Drawing No. 19-25Copyright © ats inc. 2003
Note: - Consult your local plumbing codes for sizing information. - In the absence of other guidance, the above data is provided. * ats is not responsible for content or accuracy of charts provided.
Column 1 Column 2
Minimum trade size
Fixture of trap and fixture-outlet connection, in inches Bath tub with or without overhead shower.......................... Beer Cabinet................................. Bedpan Washer............................. Bidet.............................................. Combination of sink and laundry tray................................... Cuspidor or dental unit.................. Dental lavatory............................... Dish washer, domestic type.......... Drinking fountain............................ Floor drain..................................... Two or three compartment laundry tray................................... Refrigerator................................... Shower stall.................................. Sinks (a) flushing rim with valve........ (b) kitchen, domestic type......... (c) pot, scullery......................... (d) service, with P-trap............. (e) service, with trap-standard (f) surgeon's............................. Urinals (a) blow out, pedestal, or siphon jet type..................... (b) stall...................................... (c) wall...................................... Wash basin................................... Wash sink, circular or multiple....... Water-closet.................................. Beer Dispenser.............................. Dead fish tank............................... Domestic washing machine.......... Dish washer commercial...............
FU. / DRAIN SIZE / WATER SIZE FOR PLUMBING FIXTURES
LOAD FACTORS OF FIXTURES
No. of Fixture fixture- units
Bath room group, consisting of 1water closet, 1 wash basin and1 bath tub or shower stall........... Bath tub with or without overheadshower....................... Bed Pan Washer........................... Bidet..............................................Combination of sink and laundry tray.............................................. Combination of sink and tray with food disposal unit........................Cuspidor or dental unit.................. Dental lavatory.............................. Dish washer, domestic type..........Drinking fountain............................ Floor drain..................................... Household ice box......................... Kitchen sink,.................................. (a) two-compartment................. (b) Three-compartment.............. Two or three compartment Laundry tray.................................. Shower stall.................................. Showers in a group, each head... Sinks (a) flushing rim, with valve.......... (b) pot, scullery........................... (c) service, trap standard type (d) service, P-trap type............... (e) surgeon's............................... Urinals (a) pedestal, siphon-jet or blow out type................................. (b) stall, wash-out type............... (c) wall, lip type........................... Wash basin (a) 1-1/4 inch trap....................... (b) 1-1/2 inch trap.......................Wash sink, circular or multiple type, each set of faucets............. Water-closet (a) tank operated......................... (b) valve operated....................... Beer dispenser.............................. Dead fish tank............................... Domestic washing machine.......... Dish washer commercial............... Potato and vegetable washers and peeler......................................Glass washer commercial............Cocktail mixing unit........................ Small labratory sinks.....................
Column 1 Column 2
MINIMUM SIZES OF TRAPS AND OUTLET-CONNECTIONS FOR FIXTURES
MINIMUM SIZES OF WATER SUPPLY PIPESTO FIXTURES
Column 1 Column 2 Pipe, Fixture trade size, in inches Bath tub................................................... Combination of sink and laundry tray....... Dish washer, domestic type..................... Drinking fountain....................................... Hose connection....................................... Hot water boiler........................................ Laundry tub 1,2, or 3, compartments....... Shower, single head................................ Sink.......................................................... Urinal....................................................... Wash basin............................................. Water-closet, tank type............................ Water-closet, flush-valve type.................
8
1-1/26
1-1/2
2
411
1-1/213113
4-1/2
1-1/21-1/21-1/2
64323
42
1-1/2
11-1/2
2
68
1-1/21-1/21-1/2
4
44
1-1/21
1-1/21-1/2
31-1/4
1-1/21-1/41-1/41-1/21-1/4
2
1-1/21-1/41-1/2
31-1/21-1/2
23
1-1/2
32
1-1/21-1/41-1/2
31-1/21-1/21-1/2
2
1/21/51/23/81/21/21/21/21/21/23/83/81
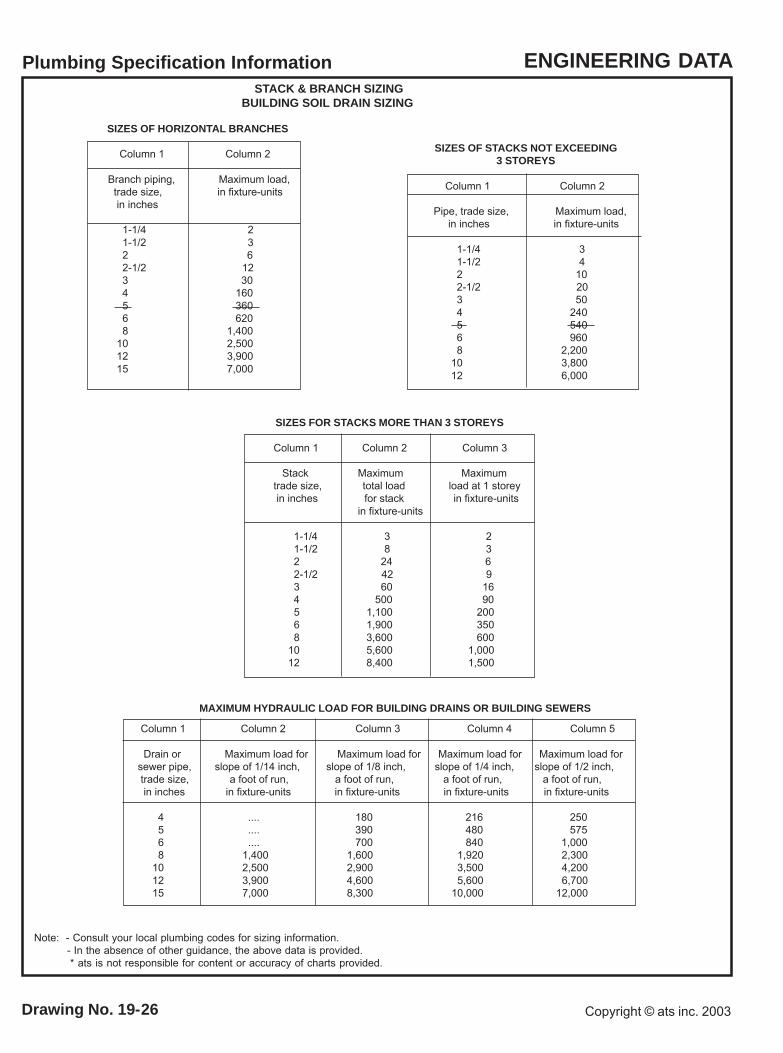
Plumbing Specification Information ENGINEERING DATA
Drawing No. 19-26 Copyright © ats inc. 2003
Note: - Consult your local plumbing codes for sizing information. - In the absence of other guidance, the above data is provided. * ats is not responsible for content or accuracy of charts provided.
SIZES FOR STACKS MORE THAN 3 STOREYS
Column 1 Column 2 Column 3
Stack Maximum Maximum trade size, total load load at 1 storey in inches for stack in fixture-units in fixture-units
1-1/4 3 2 1-1/2 8 3 2 24 6 2-1/2 42 9 3 60 16 4 500 90 5 1,100 200 6 1,900 350 8 3,600 600 10 5,600 1,000 12 8,400 1,500
SIZES OF HORIZONTAL BRANCHES
Column 1 Column 2
Branch piping, Maximum load, trade size, in fixture-units in inches
1-1/4 2 1-1/2 3 2 6 2-1/2 12 3 30 4 160 5 360 6 620 8 1,400 10 2,500 12 3,900 15 7,000
SIZES OF STACKS NOT EXCEEDING3 STOREYS
Column 1 Column 2
Pipe, trade size, Maximum load, in inches in fixture-units
1-1/4 3 1-1/2 4 2 10 2-1/2 20 3 50 4 240 5 540 6 960 8 2,200 10 3,800 12 6,000
Column 1 Column 2 Column 3 Column 4 Column 5
Drain or Maximum load for Maximum load for Maximum load for Maximum load forsewer pipe, slope of 1/14 inch, slope of 1/8 inch, slope of 1/4 inch, slope of 1/2 inch, trade size, a foot of run, a foot of run, a foot of run, a foot of run, in inches in fixture-units in fixture-units in fixture-units in fixture-units
4 .... 180 216 250 5 .... 390 480 575 6 .... 700 840 1,000 8 1,400 1,600 1,920 2,300 10 2,500 2,900 3,500 4,200 12 3,900 4,600 5,600 6,700 15 7,000 8,300 10,000 12,000
MAXIMUM HYDRAULIC LOAD FOR BUILDING DRAINS OR BUILDING SEWERS
STACK & BRANCH SIZINGBUILDING SOIL DRAIN SIZING
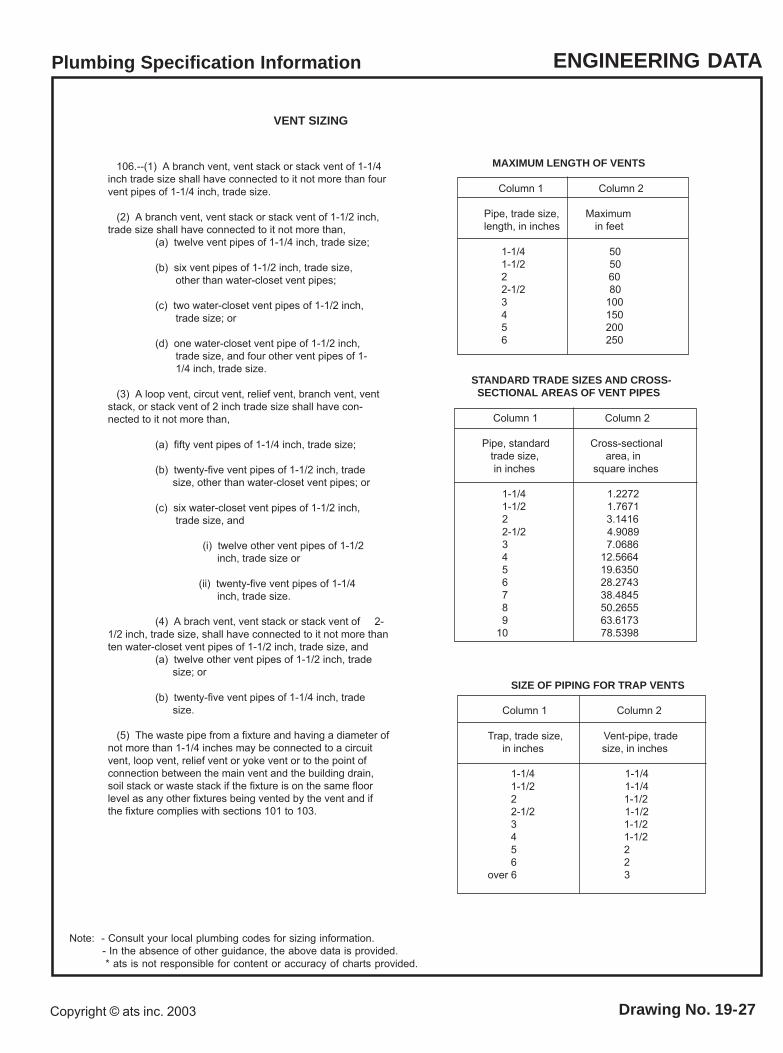
Plumbing Specification Information ENGINEERING DATA
Drawing No. 19-27Copyright © ats inc. 2003
Note: - Consult your local plumbing codes for sizing information. - In the absence of other guidance, the above data is provided. * ats is not responsible for content or accuracy of charts provided.
106.--(1) A branch vent, vent stack or stack vent of 1-1/4inch trade size shall have connected to it not more than fourvent pipes of 1-1/4 inch, trade size.
(2) A branch vent, vent stack or stack vent of 1-1/2 inch,trade size shall have connected to it not more than,
(a) twelve vent pipes of 1-1/4 inch, trade size;
(b) six vent pipes of 1-1/2 inch, trade size, other than water-closet vent pipes;
(c) two water-closet vent pipes of 1-1/2 inch, trade size; or
(d) one water-closet vent pipe of 1-1/2 inch, trade size, and four other vent pipes of 1- 1/4 inch, trade size.
(3) A loop vent, circut vent, relief vent, branch vent, ventstack, or stack vent of 2 inch trade size shall have con-nected to it not more than,
(a) fifty vent pipes of 1-1/4 inch, trade size;
(b) twenty-five vent pipes of 1-1/2 inch, trade size, other than water-closet vent pipes; or
(c) six water-closet vent pipes of 1-1/2 inch, trade size, and
(i) twelve other vent pipes of 1-1/2 inch, trade size or
(ii) twenty-five vent pipes of 1-1/4 inch, trade size.
(4) A brach vent, vent stack or stack vent of 2-1/2 inch, trade size, shall have connected to it not more thanten water-closet vent pipes of 1-1/2 inch, trade size, and
(a) twelve other vent pipes of 1-1/2 inch, trade size; or
(b) twenty-five vent pipes of 1-1/4 inch, trade size.
(5) The waste pipe from a fixture and having a diameter ofnot more than 1-1/4 inches may be connected to a circuitvent, loop vent, relief vent or yoke vent or to the point ofconnection between the main vent and the building drain,soil stack or waste stack if the fixture is on the same floorlevel as any other fixtures being vented by the vent and ifthe fixture complies with sections 101 to 103.
MAXIMUM LENGTH OF VENTS
Column 1 Column 2
Pipe, trade size, Maximumlength, in inches in feet
1-1/4 50 1-1/2 50 2 60 2-1/2 80 3 100 4 150 5 200 6 250
VENT SIZING
STANDARD TRADE SIZES AND CROSS- SECTIONAL AREAS OF VENT PIPES
Column 1 Column 2
Pipe, standard Cross-sectional trade size, area, in in inches square inches
1-1/4 1.2272 1-1/2 1.7671 2 3.1416 2-1/2 4.9089 3 7.0686 4 12.5664 5 19.6350 6 28.2743 7 38.4845 8 50.2655 9 63.6173 10 78.5398
SIZE OF PIPING FOR TRAP VENTS
Column 1 Column 2
Trap, trade size, Vent-pipe, trade in inches size, in inches
1-1/4 1-1/4 1-1/2 1-1/4 2 1-1/2 2-1/2 1-1/2 3 1-1/2 4 1-1/2 5 2 6 2 over 6 3
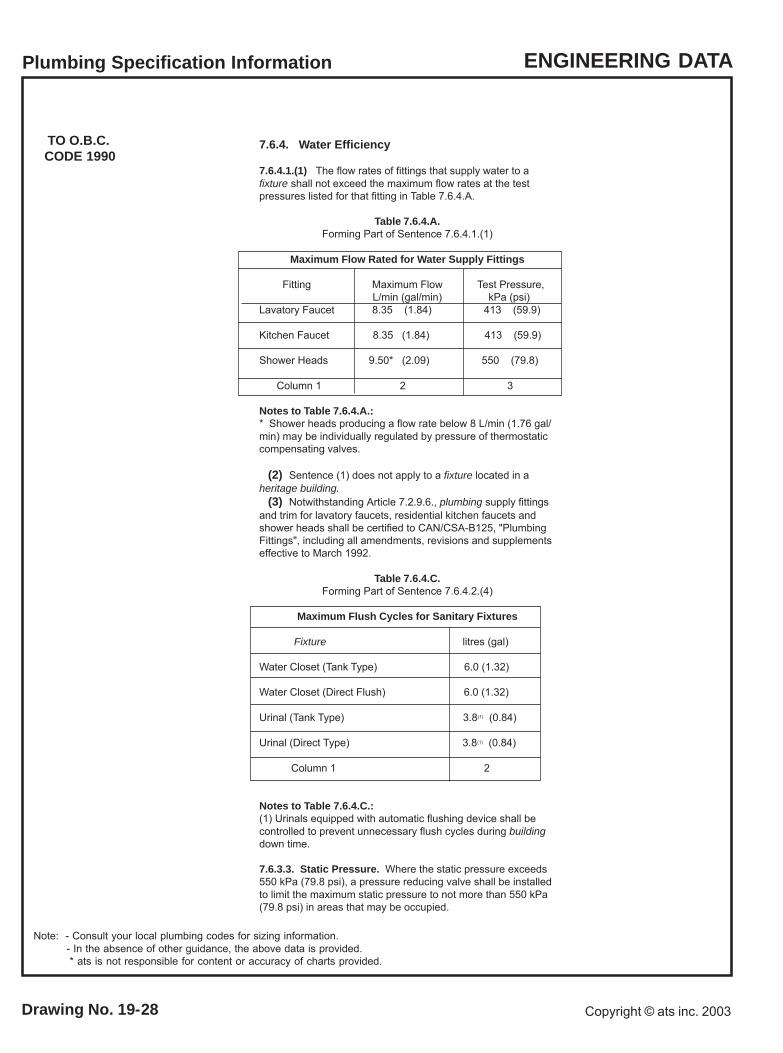
Plumbing Specification Information ENGINEERING DATA
Drawing No. 19-28 Copyright © ats inc. 2003
Note: - Consult your local plumbing codes for sizing information. - In the absence of other guidance, the above data is provided. * ats is not responsible for content or accuracy of charts provided.
TO O.B.C.CODE 1990
7.6.4. Water Efficiency
7.6.4.1.(1) The flow rates of fittings that supply water to afixture shall not exceed the maximum flow rates at the testpressures listed for that fitting in Table 7.6.4.A.
Table 7.6.4.A.Forming Part of Sentence 7.6.4.1.(1)
Maximum Flow Rated for Water Supply Fittings
Fitting Maximum Flow Test Pressure, L/min (gal/min) kPa (psi)Lavatory Faucet 8.35 (1.84) 413 (59.9)
Kitchen Faucet 8.35 (1.84) 413 (59.9)
Shower Heads 9.50* (2.09) 550 (79.8)
Column 1 2 3
Notes to Table 7.6.4.A.:* Shower heads producing a flow rate below 8 L/min (1.76 gal/min) may be individually regulated by pressure of thermostaticcompensating valves.
(2) Sentence (1) does not apply to a fixture located in aheritage building. (3) Notwithstanding Article 7.2.9.6., plumbing supply fittingsand trim for lavatory faucets, residential kitchen faucets andshower heads shall be certified to CAN/CSA-B125, "PlumbingFittings", including all amendments, revisions and supplementseffective to March 1992.
Table 7.6.4.C.Forming Part of Sentence 7.6.4.2.(4)
Maximum Flush Cycles for Sanitary Fixtures
Fixture litres (gal)
Water Closet (Tank Type) 6.0 (1.32)
Water Closet (Direct Flush) 6.0 (1.32)
Urinal (Tank Type) 3.8(1) (0.84)
Urinal (Direct Type) 3.8(1) (0.84)
Column 1 2
Notes to Table 7.6.4.C.:(1) Urinals equipped with automatic flushing device shall becontrolled to prevent unnecessary flush cycles during buildingdown time.
7.6.3.3. Static Pressure. Where the static pressure exceeds550 kPa (79.8 psi), a pressure reducing valve shall be installedto limit the maximum static pressure to not more than 550 kPa(79.8 psi) in areas that may be occupied.
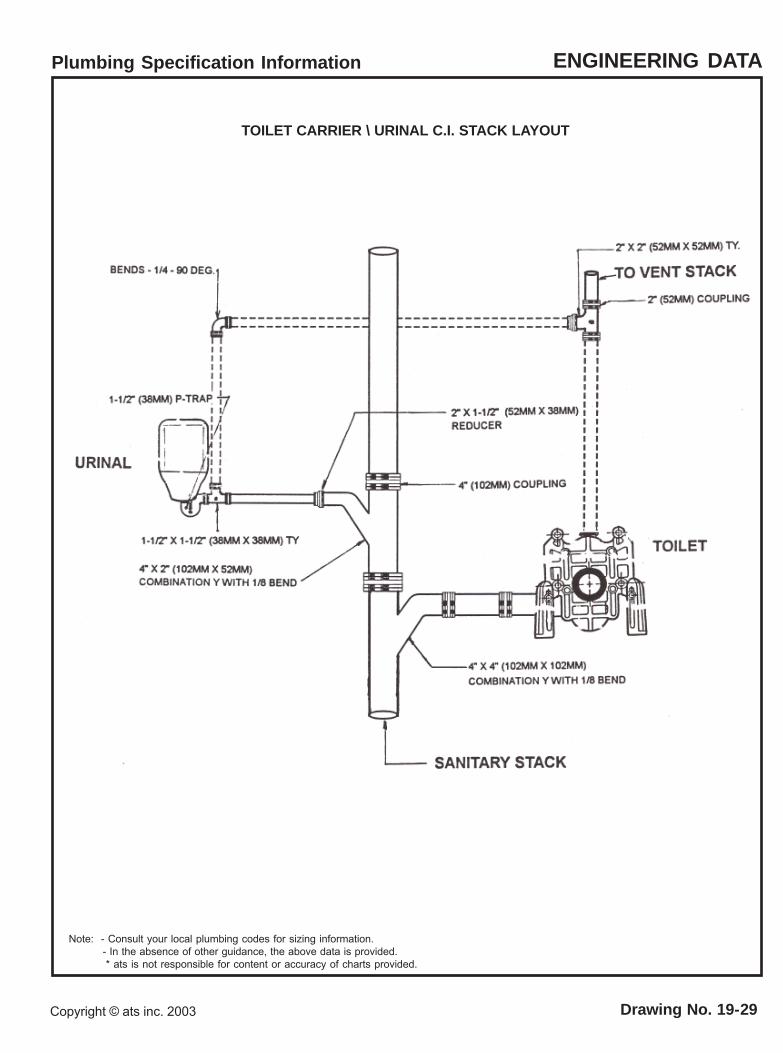
Plumbing Specification Information ENGINEERING DATA
Drawing No. 19-29Copyright © ats inc. 2003
Note: - Consult your local plumbing codes for sizing information. - In the absence of other guidance, the above data is provided. * ats is not responsible for content or accuracy of charts provided.
TOILET CARRIER \ URINAL C.I. STACK LAYOUT
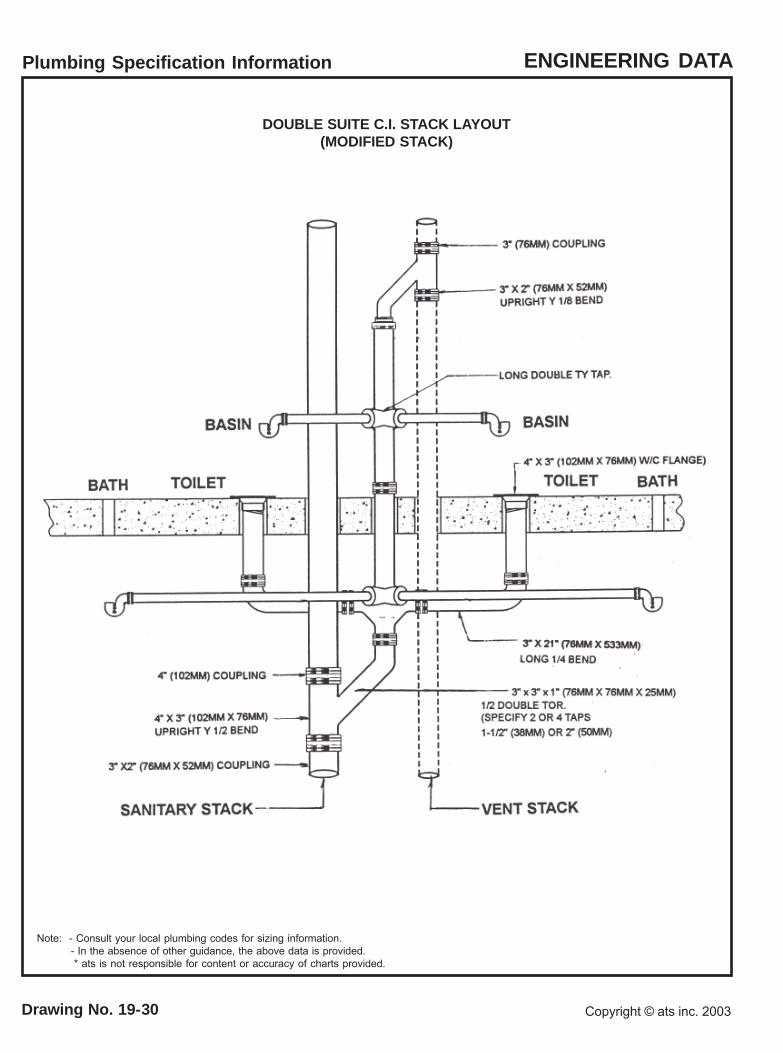
Plumbing Specification Information ENGINEERING DATA
Drawing No. 19-30 Copyright © ats inc. 2003
Note: - Consult your local plumbing codes for sizing information. - In the absence of other guidance, the above data is provided. * ats is not responsible for content or accuracy of charts provided.
DOUBLE SUITE C.I. STACK LAYOUT(MODIFIED STACK)
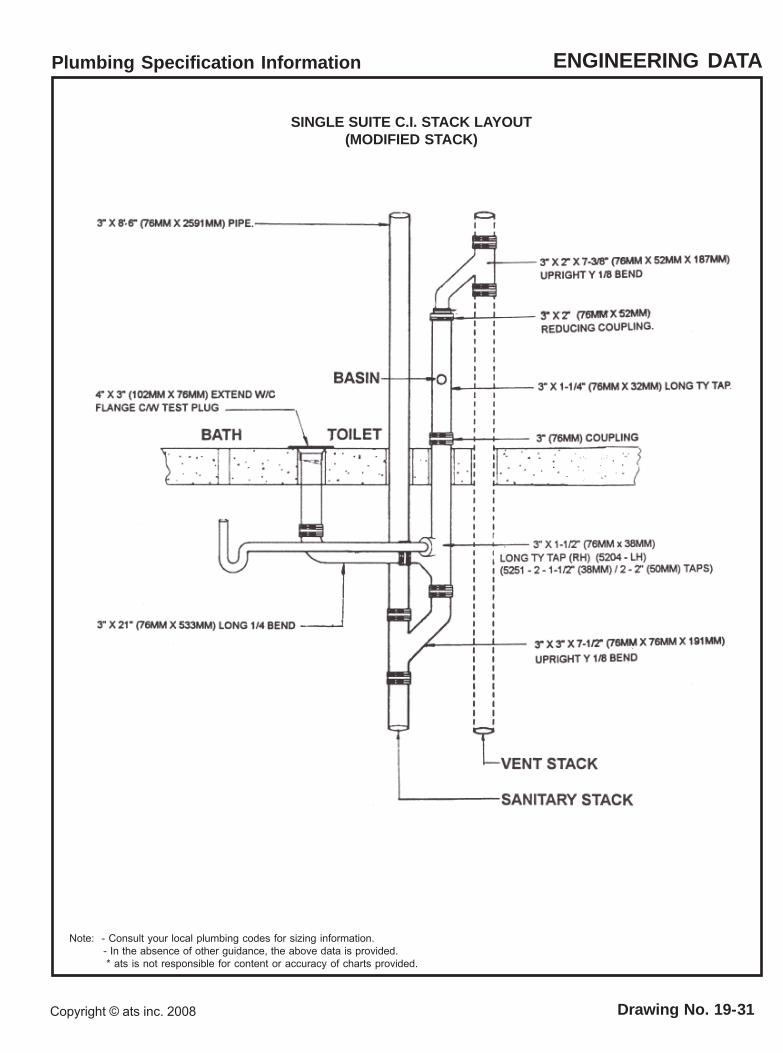
Plumbing Specification Information ENGINEERING DATA
Drawing No. 19-31Copyright © ats inc. 2008
Note: - Consult your local plumbing codes for sizing information. - In the absence of other guidance, the above data is provided. * ats is not responsible for content or accuracy of charts provided.
SINGLE SUITE C.I. STACK LAYOUT(MODIFIED STACK)

Plumbing Specification Information ENGINEERING DATA
Note:-Consult your local plumbing codes for sizing information- In the absence of other guidance, the above date is provided* ats is not responsible for content or accuracy of charts provided
Drawing No. 19-32Copyright © ats inc. 2011
Flushing Rim Floor Drain
SLOAN
WB-1-A ACCESS PANEL,12" (305mm) Square with 13-1/2" (343mm) Sqare stainlesssteel V.P. cover. (Space re-quired - minimum 6” (152mm)finished wall to back of pipespace.)
195-1-XL ‘REGAL’ CONCEALED DIAPHRAGMTYPE FLUSH VALVE, NON-HOLD OPEN FEATURE,BACK-CHECK ANGLE STOP, V.P. TRIM, VACUUMBREAKER, ADA OSCILLATING LEVER HANDLE,6LPF LOW CONSUMPTION.195-1 ‘ROYAL’ As above except with Dual FilteredBy-Pass, Permex Diaphragm, Diaphragm Type Han-dle, High Pressure V.B. (No Alternate Acceptable.)195-1-L (‘REGAL XL’ or ‘ ROYAL’) As above ex-cept with Push Button, 5/8" (16mm) Diameter.
2505TC2506TC
195-1-XL
WB-1-A2507TC
X
X
SLOAN
SUGGESTEDPIPING
LAYOUT(Piping Shown By Others)
PUSH BUTTONFLUSH VALVE WITH VACUUM BREAKER
FLOOR TILE
COLD WATERSUPPLY
CEMENT BED
STRUCTURALSLAB
ADAPTOR
CHECK LOCAL CODES FOR USAGE OF FLUSH VALVE AND VACUUM BREAKER
*
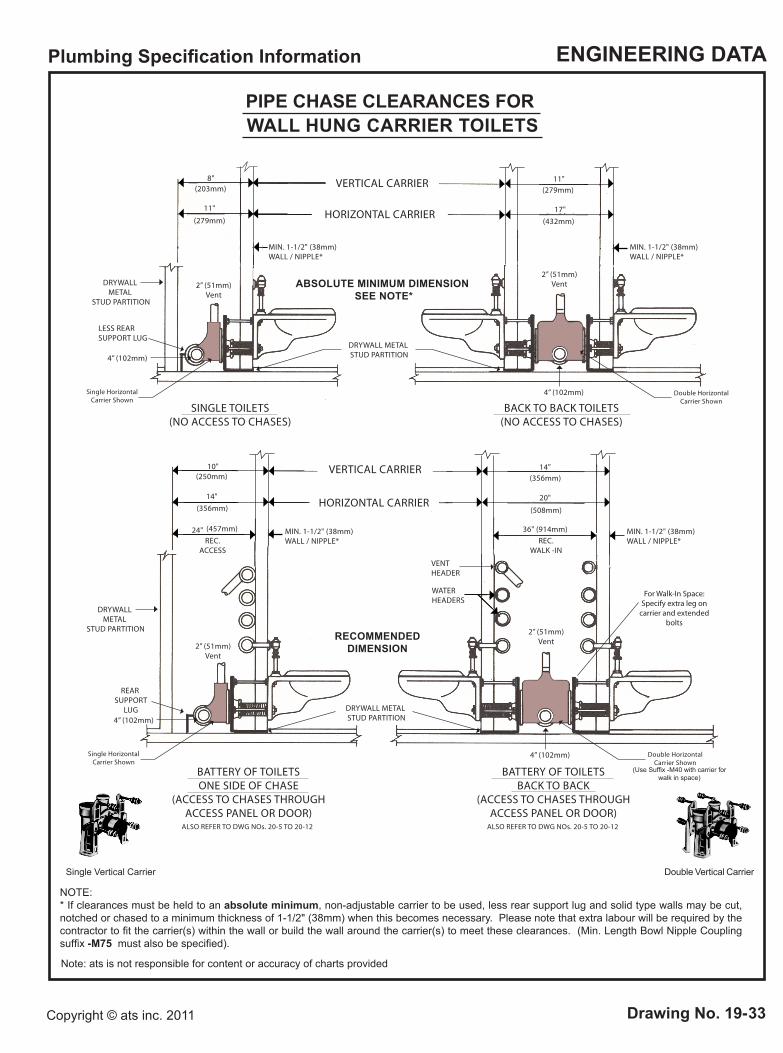
Note: ats is not responsible for content or accuracy of charts provided
Plumbing Specification Information ENGINEERING DATA
Drawing No. 19-33Copyright © ats inc. 2011
PIPE CHASE CLEARANCES FOR WALL HUNG CARRIER TOILETS
VERTICAL CARRIER
HORIZONTAL CARRIER
VERTICAL CARRIER
SINGLE TOILETS(NO ACCESS TO CHASES)
BATTERY OF TOILETSONE SIDE OF CHASE
(ACCESS TO CHASES THROUGHACCESS PANEL OR DOOR)
BATTERY OF TOILETSBACK TO BACK
(ACCESS TO CHASES THROUGHACCESS PANEL OR DOOR)
BACK TO BACK TOILETS(NO ACCESS TO CHASES)
HORIZONTAL CARRIER
Single HorizontalCarrier Shown
Double HorizontalCarrier Shown
Double HorizontalCarrier Shown
DRYWALL METAL STUD PARTITION
WATER HEADERS
VENTHEADER
(203mm)
(279mm)
LESS REARSUPPORT LUG
11"
8"
(250mm)
(356mm)
(457mm)REC.
ACCESSREC.
WALK -IN
14"
14"
20"
24"
10"
DRYWALL METAL STUD PARTITION
ABSOLUTE MINIMUM DIMENSION SEE NOTE*
(279mm)
(432mm)
MIN. 1-1/2" (38mm)WALL / NIPPLE*
MIN. 1-1/2" (38mm)WALL / NIPPLE*
MIN. 1-1/2" (38mm)WALL / NIPPLE*
MIN. 1-1/2" (38mm)WALL / NIPPLE*
11"
17"
(356mm)
(508mm)
36" (914mm)
REAR SUPPORT
LUG
Single HorizontalCarrier Shown
RECOMMENDEDDIMENSION
ALSO REFER TO DWG NOs. 20-5 TO 20-12 ALSO REFER TO DWG NOs. 20-5 TO 20-12
4” (102mm)
4” (102mm)
DRYWALL METAL
STUD PARTITION
DRYWALL METAL
STUD PARTITION
2” (51mm)Vent
2” (51mm)Vent
2” (51mm)Vent
2” (51mm)Vent
For Walk-In Space:Specify extra leg on
carrier and extended bolts
4” (102mm)
4” (102mm)
NOTE:* If clearances must be held to an absolute minimum, non-adjustable carrier to be used, less rear support lug and solid type walls may be cut, notched or chased to a minimum thickness of 1-1/2" (38mm) when this becomes necessary. Please note that extra labour will be required by the contractor to fit the carrier(s) within the wall or build the wall around the carrier(s) to meet these clearances. (Min. Length Bowl Nipple Coupling suffix -M75 must also be specified).
Single Vertical Carrier Double Vertical Carrier
(Use Suffix -M40 with carrier for walk in space)

Note: ats is not responsible for content or accuracy of charts provided
Plumbing Specification Information ENGINEERING DATA
Copyright © ats inc. 2010Drawing No.19-34
FRONT VIEW SIDE VIEW
Vandal-Resistant Electronic 'No'Touch' Recessed Faucet Box(Suffix 'VPB')
24 VACSolenoid Valve
From TransformerEL-154
(120 VAC / 24 AC)(Remote Location)(15 VA required for
each faucet.)
* *
12" x 12" (305 x 305mm)
Four Vandal-ResistantScrews FlushWith Cover
Metal Box
McGuire #ST18
Service Stop
McGuire #ST18
Service Stop
Thermostatic Mixing Valve with ChecksLawler #570-86821
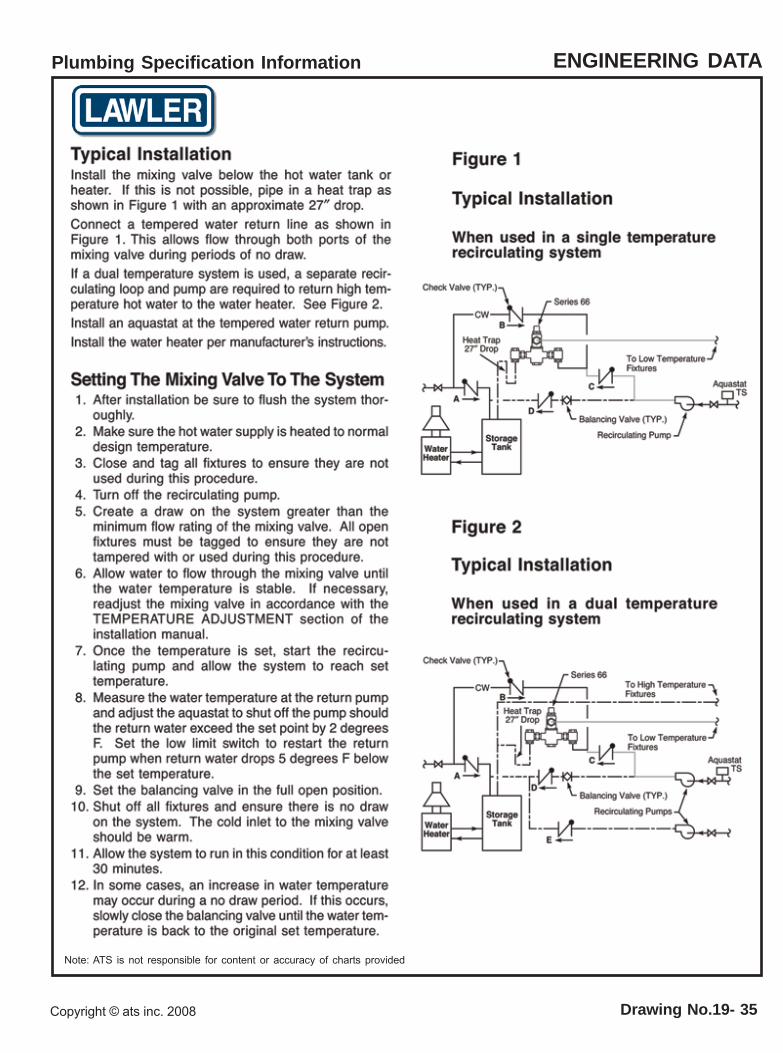
Note: ATS is not responsible for content or accuracy of charts provided
Plumbing Specification Information ENGINEERING DATA
Copyright © ats inc. 2008 Drawing No.19- 35
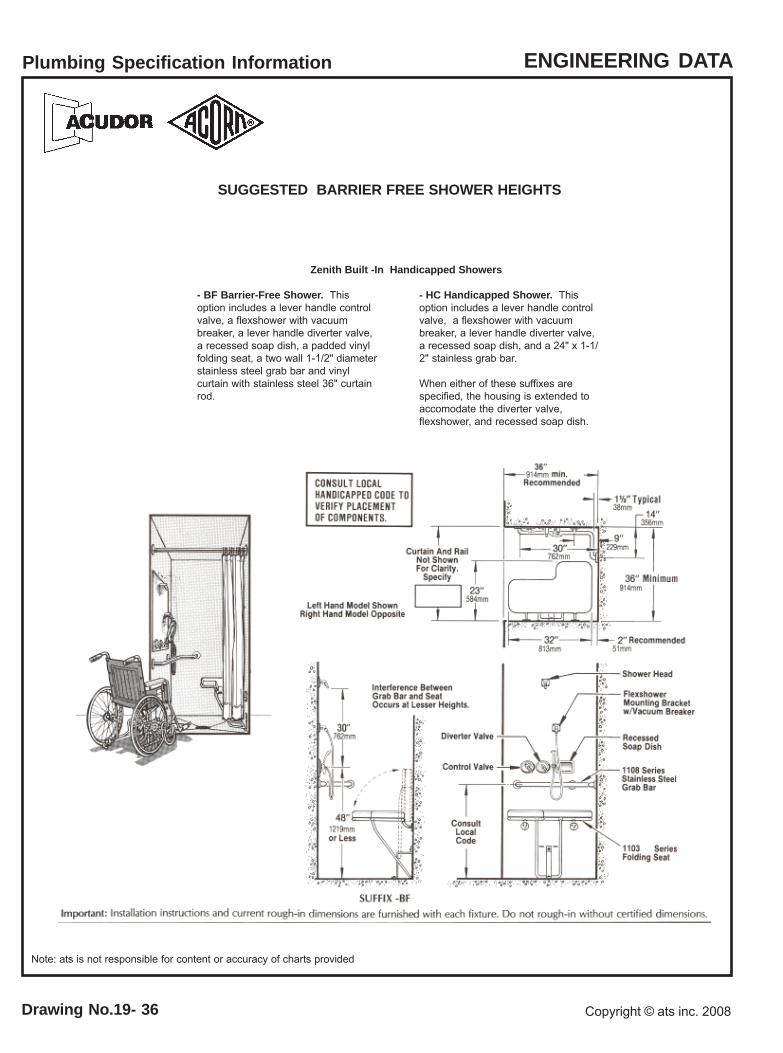
Note: ats is not responsible for content or accuracy of charts provided
Plumbing Specification Information ENGINEERING DATA
Copyright © ats inc. 2008Drawing No.19- 36
SUGGESTED BARRIER FREE SHOWER HEIGHTS
- BF Barrier-Free Shower. Thisoption includes a lever handle controlvalve, a flexshower with vacuumbreaker, a lever handle diverter valve,a recessed soap dish, a padded vinylfolding seat, a two wall 1-1/2" diameterstainless steel grab bar and vinylcurtain with stainless steel 36" curtainrod.
Zenith Built -In Handicapped Showers
- HC Handicapped Shower. Thisoption includes a lever handle controlvalve, a flexshower with vacuumbreaker, a lever handle diverter valve,a recessed soap dish, and a 24" x 1-1/2" stainless grab bar.
When either of these suffixes arespecified, the housing is extended toaccomodate the diverter valve,flexshower, and recessed soap dish.
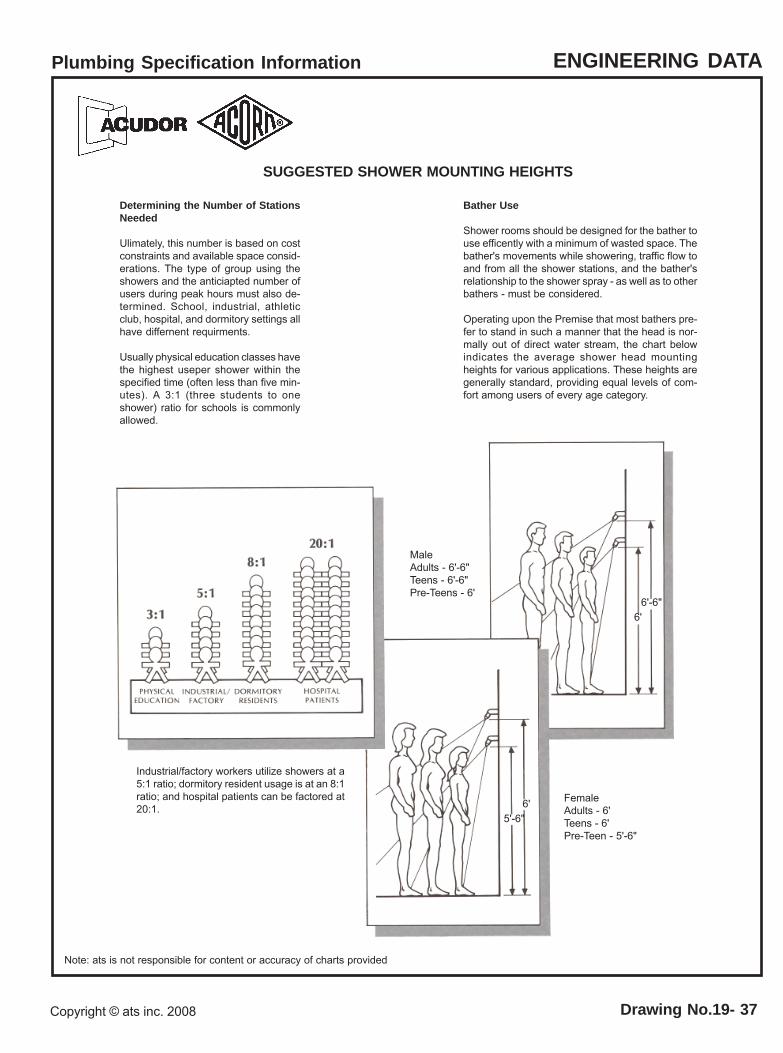
Note: ats is not responsible for content or accuracy of charts provided
Plumbing Specification Information ENGINEERING DATA
Drawing No.19- 37Copyright © ats inc. 2008
Determining the Number of StationsNeeded
Ulimately, this number is based on costconstraints and available space consid-erations. The type of group using theshowers and the anticiapted number ofusers during peak hours must also de-termined. School, industrial, athleticclub, hospital, and dormitory settings allhave differnent requirments.
Usually physical education classes havethe highest useper shower within thespecified time (often less than five min-utes). A 3:1 (three students to oneshower) ratio for schools is commonlyallowed.
SUGGESTED SHOWER MOUNTING HEIGHTS
Bather Use
Shower rooms should be designed for the bather touse efficently with a minimum of wasted space. Thebather's movements while showering, traffic flow toand from all the shower stations, and the bather'srelationship to the shower spray - as well as to otherbathers - must be considered.
Operating upon the Premise that most bathers pre-fer to stand in such a manner that the head is nor-mally out of direct water stream, the chart belowindicates the average shower head mountingheights for various applications. These heights aregenerally standard, providing equal levels of com-fort among users of every age category.
Industrial/factory workers utilize showers at a5:1 ratio; dormitory resident usage is at an 8:1ratio; and hospital patients can be factored at20:1.
MaleAdults - 6'-6"Teens - 6'-6"Pre-Teens - 6'
FemaleAdults - 6'Teens - 6'Pre-Teen - 5'-6"
5'-6" 6'
6'-6" 6'
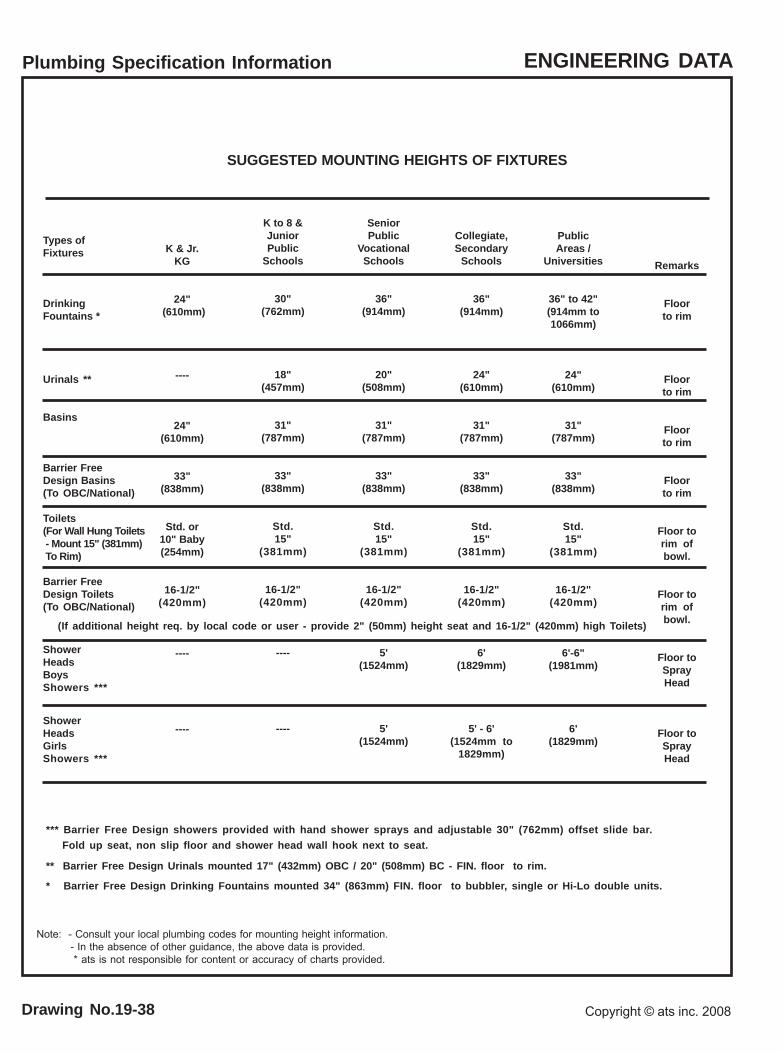
Plumbing Specification Information ENGINEERING DATA
Copyright © ats inc. 2008Drawing No.19-38
Note: - Consult your local plumbing codes for mounting height information. - In the absence of other guidance, the above data is provided. * ats is not responsible for content or accuracy of charts provided.
K & Jr.KG
24" (610mm)
----
24"(610mm)
33"(838mm)
Std. or10" Baby(254mm)
16-1/2"(420mm)
----
----
K to 8 &JuniorPublic
Schools
30"(762mm)
18"(457mm)
31"(787mm)
33"(838mm)
Std.15"
(381mm)
16-1/2"(420mm)
----
----
SeniorPublic
VocationalSchools
36"(914mm)
20"(508mm)
31"(787mm)
33"(838mm)
Std.15"
(381mm)
16-1/2"(420mm)
5'(1524mm)
5'(1524mm)
Collegiate,Secondary
Schools
36"(914mm)
24"(610mm)
31"(787mm)
33"(838mm)
Std.15"
(381mm)
16-1/2"(420mm)
6'(1829mm)
5' - 6'(1524mm to
1829mm)
PublicAreas /
Universities
36" to 42"(914mm to1066mm)
24"(610mm)
31"(787mm)
33"(838mm)
Std.15"
(381mm)
16-1/2"(420mm)
6'-6"(1981mm)
6'(1829mm)
*** Barrier Free Design showers provided with hand shower sprays and adjustable 30" (762mm) offset slide bar.
Types ofFixtures
DrinkingFountains *
Urinals **
Basins
Barrier FreeDesign Basins(To OBC/National)
Toilets(For Wall Hung Toilets - Mount 15" (381mm) To Rim)
Barrier FreeDesign Toilets(To OBC/National)
ShowerHeadsBoysShowers ***
ShowerHeadsGirlsShowers ***
Remarks
Floorto rim
Floorto rim
Floorto rim
Floorto rim
Floor torim ofbowl.
Floor torim ofbowl.
Floor toSprayHead
Floor toSprayHead
SUGGESTED MOUNTING HEIGHTS OF FIXTURES
(If additional height req. by local code or user - provide 2" (50mm) height seat and 16-1/2" (420mm) high Toilets)
* Barrier Free Design Drinking Fountains mounted 34" (863mm) FIN. floor to bubbler, single or Hi-Lo double units.
Fold up seat, non slip floor and shower head wall hook next to seat.
** Barrier Free Design Urinals mounted 17" (432mm) OBC / 20" (508mm) BC - FIN. floor to rim.