Embed Size (px)
Citation preview

ERA-EDTA RegistryAcademic Medical CenterDepartment of Medical InformaticsPO Box 227001100 DE Amsterdamthe Netherlands
ISBN 978-90-817480-8-7
August 2017
Annual Report 2015
ERA-ED
TA Registry
AnnualReport
2015
ERA-EDTA Registry
www.era-edta-reg.org
The ERA-EDTA Registry is an o� cial body of the ERA-EDTA

ISBN 978-90-817480-8-7Suggested Citation ERA-EDTA Registry: ERA-EDTA Registry Annual Report 2015. Academic Medical Center, Department of Medical Informatics, Amsterdam, the Netherlands, 2017Disclaimer ERA-EDTA, its Registry Committee, AMC and its department of Medical Informatics
disclaim any express or implied warranty of fi tness for the use of ERA-EDTA Registry products and shall not be liable for any direct, indirect or consequential loss; per-sonal injury; special or punitive damages; loss of profi ts, loss of savings and loss of revenue; loss of business, loss of reputation and loss of goodwill; and loss of data arising from the use of ERA-EDTA Registry products.
ERA-EDTA RegistryAnnual Report 2015

ERA-EDTA Registry
Academic Medical CenterDepartment of Medical InformaticsPO Box 227001100 DE Amsterdamthe Netherlands
Telephone +31 20 566 7637Fax +31 20 566 9014E-mail [email protected] www.era-edta-reg.org
ERA-EDTA Registry Committee
A Więcek, Poland (ERA-EDTA President)
Z Massy, France (Chairman)
FJ Caskey, United KingdomC Couchoud, FranceM Evans, SwedenP Finne, FinlandJW Groothoff, the NetherlandsJ Harambat, FranceJG Heaf, DenmarkF Jarraya, TunisiaM Nordio, ItalyI Rychlik, Czech Republic
ERA-EDTA Registry Office Staff
KJ Jager, epidemiologist (Managing Director)
M Bonthuis, epidemiologist (for paediatric section)R Cornet, medical informaticianG Guggenheim, secretaryA Kramer, medical informaticianM Noordzij, epidemiologistM Pippias, medical doctorVS Stel, epidemiologistAJ Weerstra, data manager

III
Acknowledgements
The ERA-EDTA Registry would like to thank the patients and staff of all the dialysis and transplant units who have contributed data via their national and regional renal registries. In addition, we would like to thank the following persons and organizations for their contribution to the work of the ERA-EDTA Registry.
For the provision of individual patient dataRegistry Contributors
For the provision of aggregated dataRegistry Contributors
The ERA-EDTA Registry is funded by the European Renal Association - European Dialysis and Trans-plant Association (ERA-EDTA).
Austria R KramarBelgium, Dutch-speaking B De Moor, F Schroven, and J De MeesterBelgium, French-speaking JM des Grottes and F CollartBosnia and Herzegovina H Resić, M Grujicić, and S CorićDenmark JG HeafEstonia Ü Pechter, M Rosenberg, and K LilienthalFinland P Finne, A Pylsy, and PH GroopFrance M Lassalle and C CouchoudGreece N AfentakisIceland R PálssonNorway T Leivestad, AV Reisæter, and A ÅsbergRomania G Mircescu, L Garneata, and E PodgoreanuSerbia N Maksimovic, all of the Serbian renal units, and Serbian Society of NephrologySpain, Andalusia P Castro de la Nuez (on behalf of all users of SICATA)Spain, Aragon JI Sanchez Miret and JM Abad DiezSpain, Asturias R Alonso de la Torre, JR Quirós, and RERCA Working GroupSpain, Basque country Á Magaz, J Aranzabal, M Rodrigo, and I MoinaSpain, Cantabria ALM de Francisco, O Garcia Ruiz, and C Piñera HacesSpain, Castile and León R González and C Fernández-RenedoSpain, Castile-La Mancha G Gutiérrez Ávila and I Moreno AlíaSpain, Catalonia E Arcos, J Comas, and J TortSpain, Extremadura JM Ramos Aceitero and MA García BazagaSpain, Galicia E Bouzas-Caamaño and J Sánchez-IbáñezSpain, Community of Madrid MI Aparicio MadreSpain, Region of Murcia C Santiuste de Pablos and I Marín SánchezSpain, Navarre MF Slon Roblero, J Manrique Escola, and J Arteaga ColomaSpain, Valencian region M Ferrer Alamar, N Fuster Camarena, and J Pérez PenadésSweden KG Prütz, M Stendahl, M Evans, S Schön, T Lundgren, and M SegelmarkSwitzerland P Ambühl and R Winzelerthe Netherlands L Heuveling, S Vogelaar, and M Hemmelder United Kingdom, England/Northern Ireland/Wales All the staff of the UK Renal Registry and of the renal units submitting dataUnited Kingdom, Scotland All of the Scottish renal units
Albania M Barbullushi, A Idrizi, and E Bolleku LikajBelarus KS Komissarov, AV Kalachyk, and OV KraskoBulgaria ES Vazelov, I Velinova, and M GitchevaCroatia I Bubić, S Rački, and N JankovićCyprus K Ioannou and all of the renal units for providing dataCzech Republic I Rychlik, J Potucek, and F LopotGeorgia N Kantaria and Dialysis, Nephrology and Transplantation Union of GeorgiaIsrael R Dichtiar, T Shohat, and E GolanItaly (5 of 20 regions) A Limido, M Nordio, and M PostorinoLatvia H Cernevskis, V Kuzema, and A SildaLithuania V Kuzminskis, IA Bumblyte, and E ZiginskieneMacedonia L Trpenovski, J Masin Spasovska, and O Stojceva TanevaPoland M Klinger, B Rutkowski, and A Dębska-ŚlizieńPortugal F Macario and A FerreiraRussia N Tomilina, A Andrusev, and H ZakharovaSlovakia V Spustova, I Lajdova, and M KarolyovaSpain Spanish RRT National Registry at ONT, Spanish Regional Registries, and Spanish Society of Nephrology (SEN)Tunisia, Sfax region D Zalila, H Mahfoud, and F JarrayaTurkey G Süleymanlar, N Seyahi, and K AteşUkraine M Kolesnyk, S Nikolaenko, and O Razvazhaieva

IV
List of abbreviations
Abbreviation Term
APD Automated peritoneal dialysisCAKUT Congenital anomalies of the kidney and urinary tractCAPD Continuous ambulatory peritoneal dialysisCI Confidence intervalDM Diabetes mellitusERA-EDTA European Renal Association - European Dialysis and Transplant AssociationESPN European Society for Paediatric NephrologyESRD End-stage renal diseaseESRF End-stage renal failureGN Glomerulonephritis / sclerosisHD HaemodialysisHDF HaemodiafiltrationHF HaemofiltrationHT HypertensionHUS Haemolytic uraemic syndromeMisc MiscellaneousN CountPD Peritoneal dialysisPKD Polycystic kidneys, adult typePmarp Per million age-related populationPmp Per million populationPN PyelonephritisPRD Primary renal diseaseRRT Renal replacement therapyRVD Renal vascular diseaseSD Standard deviationTx TransplantUnkn Unknown

V
Glossary
EU27: refers to the 27 countries of which until 30th June 2013 the European Union was comprised of. These countries are: Austria, Belgium, Bulgaria, Cyprus, Czech Republic, Denmark, Estonia, Finland, France, Germany, Greece, Hungary, Ireland, Italy, Latvia, Lithuania, Luxembourg, Malta, the Netherlands, Poland, Portugal, Romania, Slovakia, Slovenia, Spain, Sweden, and the United Kingdom.
Eurostat: the statistical office of the European Union whose task is to provide the European Union with statistics at the European level that enable comparisons between countries and regions.
Expected remaining lifetime: is defined as the average number of years of life remaining for those who have reached a given age.
Incidence: the number of new cases during a specific time period. In this annual report this equates to the number of patients commencing renal replacement therapy for end-stage renal disease during the calendar year on which this annual report is based (2015).
Modality: the method of renal replacement therapy. Renal replacement therapy is comprised of the following modalities: haemodialysis (HD), haemofiltration (HF), haemodiafiltration (HDF), automated peritoneal dialysis (ADP), continuous ambulatory peritoneal dialysis (CAPD), and kidney transplantation (Tx). Kidney transplantation can be performed with a kidney from a living donor (LD) or from a deceased donor (DD).
Per million age-related population (pmarp): the incidence or prevalence pmarp is the observed incident or prevalent count for a specific age group divided by the general population of that age group and multiplied by one million.
Per million population (pmp): the incidence or prevalence pmp is the observed incident or prevalent count divided by the general population in that year and multiplied by one million.
Prevalence: the number of people in a given population with a particular disease at a given time. In this annual report this equates to the number of patients receiving renal replacement therapy for end-stage renal disease at 31st December 2015.
Renal Replacement Therapy (RRT): therapy used to replace the normal blood-filtering function of the kidneys. In this annual report renal replacement therapy refers to the various dialysis modalities and to kidney transplantation (see Modality).
Survival probability: the probability that a person or a kidney transplant has survived up to a specified time point.


VII
Brief content
Introduction 13
Section A: Summary data 17A1 INCIDENT PATIENTS ACCEPTED FOR RRT IN 2015, AT DAY 1 18A2 INCIDENT PATIENTS ACCEPTED FOR RRT IN 2015, AT DAY 91 23A3 PREVALENT PATIENTS ON RRT IN 2015 24A4 KIDNEY TRANSPLANTS IN 2015 29A5 SURVIVAL PROBABILITY 32A6 EXPECTED REMAINING LIFETIMES 34
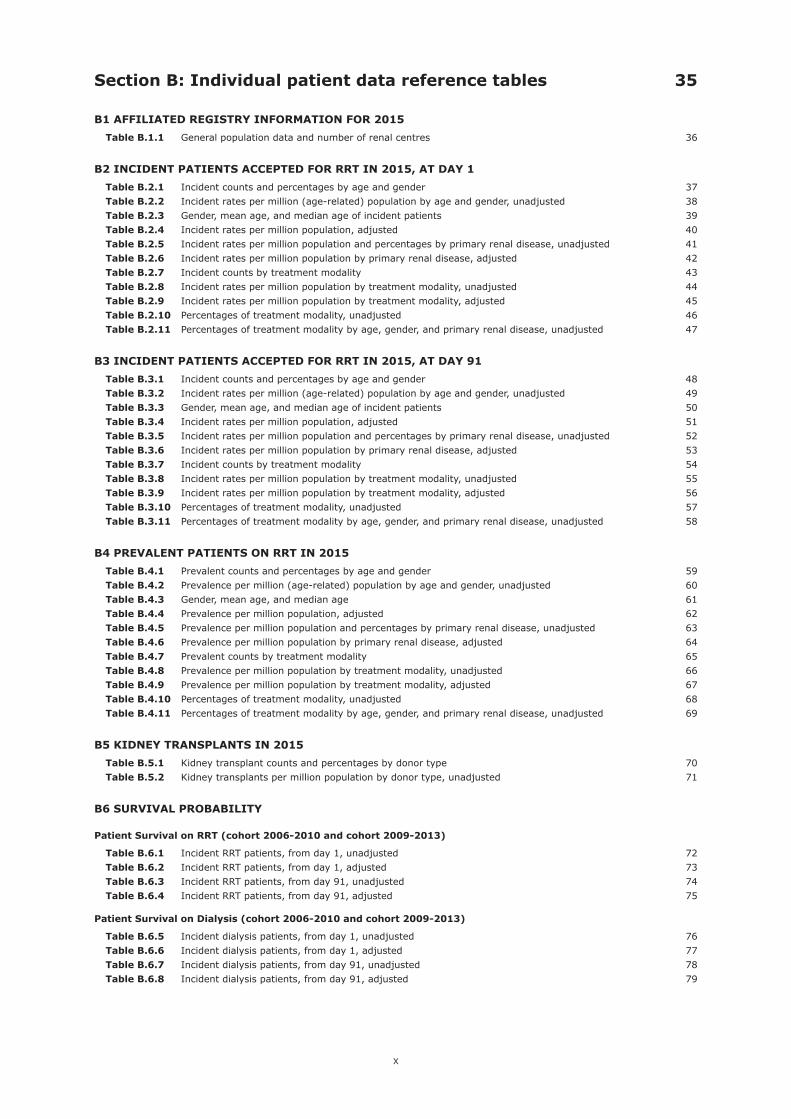
Section B: Individual patient data reference tables 35B1 AFFILIATED REGISTRY INFORMATION FOR 2015 36B2 INCIDENT PATIENTS ACCEPTED FOR RRT IN 2015, AT DAY 1 37B3 INCIDENT PATIENTS ACCEPTED FOR RRT IN 2015, AT DAY 91 48B4 PREVALENT PATIENTS ON RRT IN 2015 59B5 KIDNEY TRANSPLANTS IN 2015 70B6 SURVIVAL PROBABILITY 72B7 EXPECTED REMAINING LIFETIMES 90
Section C: Aggregated data reference tables 91C1 AFFILIATED REGISTRY INFORMATION FOR 2015 92C2 INCIDENT PATIENTS ACCEPTED FOR RRT IN 2015, AT DAY 1 93C3 INCIDENT PATIENTS ACCEPTED FOR RRT IN 2015, AT DAY 91 101C4 PREVALENT PATIENTS ON RRT IN 2015 109C5 KIDNEY TRANSPLANTS IN 2015 117
Section D: Paediatric data reference tables 119D1 GENERAL POPULATION AGE DISTRIBUTION 121D2 INCIDENT PATIENTS ACCEPTED FOR RRT, AT DAY 1 122D3 PREVALENT PATIENTS ON RRT 124
Methods 127
Appendices 137


IX
Table of Contents
Introduction 13Section overview 15New to this edition 15ERA-EDTA Registry website 15ESPN/ERA-EDTA Registry website 15
Section A: Summary data 17
A1 INCIDENT PATIENTS ACCEPTED FOR RRT IN 2015, AT DAY 1Table A.1.1 Summary data on the incidence of RRT in 2015, unadjusted 18Figure A.1.1 Incident rates per million population by country / region, unadjusted 19Figure A.1.2 Incident rates per million population by country / region, unadjusted and adjusted 20Figure A.1.3 Incident percentages by gender, age, and primary renal disease, unadjusted 21Figure A.1.4 Incident percentages of treatment modality by age, gender and primary renal disease, unadjusted 22
A2 INCIDENT PATIENTS ACCEPTED FOR RRT IN 2015, AT DAY 91Figure A.2.1 Incident percentages of treatment modality by age, gender and primary renal disease, unadjusted 23
A3 PREVALENT PATIENTS ON RRT IN 2015Table A.3.1 Summary data on the prevalence of RRT at 31 December 2015, unadjusted 24Figure A.3.1 Prevalence per million population by country / region, unadjusted 25Figure A.3.2 Prevalence per million population by country / region, unadjusted and adjusted 26Figure A.3.3 Prevalent percentages by gender, age, and primary renal disease, unadjusted 27Figure A.3.4 Prevalent percentages of treatment modality by age, gender and primary renal disease, unadjusted 28
A4 KIDNEY TRANSPLANTS IN 2015Figure A.4.1 Kidney transplant counts and per million population by country / region, unadjusted 29Figure A.4.2 Kidney transplants per million population by donor type and by country / region, unadjusted 30Figure A.4.3 Kidney transplant percentages by donor type, unadjusted 31
A5 SURVIVAL PROBABILITYTable A.5.1 One-, two- and five-year survival probabilities by treatment modality and cohort 32Figure A.5.1 Adjusted patient survival by modality: Incident dialysis patients 33Figure A.5.2 Adjusted patient survival by donor type: Patients receiving a first kidney transplant 33
A6 EXPECTED REMAINING LIFETIMESFigure A.6.1 Expected remaining lifetimes (years) of the general population (cohort 2011-2015) and of prevalent dialysis and transplant patients (cohort 2011-2015) 34
X
Section B: Individual patient data reference tables 35
B1 AFFILIATED REGISTRY INFORMATION FOR 2015Table B.1.1 General population data and number of renal centres 36
B2 INCIDENT PATIENTS ACCEPTED FOR RRT IN 2015, AT DAY 1Table B.2.1 Incident counts and percentages by age and gender 37Table B.2.2 Incident rates per million (age-related) population by age and gender, unadjusted 38Table B.2.3 Gender, mean age, and median age of incident patients 39Table B.2.4 Incident rates per million population, adjusted 40Table B.2.5 Incident rates per million population and percentages by primary renal disease, unadjusted 41Table B.2.6 Incident rates per million population by primary renal disease, adjusted 42Table B.2.7 Incident counts by treatment modality 43Table B.2.8 Incident rates per million population by treatment modality, unadjusted 44Table B.2.9 Incident rates per million population by treatment modality, adjusted 45Table B.2.10 Percentages of treatment modality, unadjusted 46Table B.2.11 Percentages of treatment modality by age, gender, and primary renal disease, unadjusted 47
B3 INCIDENT PATIENTS ACCEPTED FOR RRT IN 2015, AT DAY 91Table B.3.1 Incident counts and percentages by age and gender 48Table B.3.2 Incident rates per million (age-related) population by age and gender, unadjusted 49Table B.3.3 Gender, mean age, and median age of incident patients 50Table B.3.4 Incident rates per million population, adjusted 51Table B.3.5 Incident rates per million population and percentages by primary renal disease, unadjusted 52Table B.3.6 Incident rates per million population by primary renal disease, adjusted 53Table B.3.7 Incident counts by treatment modality 54Table B.3.8 Incident rates per million population by treatment modality, unadjusted 55Table B.3.9 Incident rates per million population by treatment modality, adjusted 56Table B.3.10 Percentages of treatment modality, unadjusted 57Table B.3.11 Percentages of treatment modality by age, gender, and primary renal disease, unadjusted 58
B4 PREVALENT PATIENTS ON RRT IN 2015Table B.4.1 Prevalent counts and percentages by age and gender 59Table B.4.2 Prevalence per million (age-related) population by age and gender, unadjusted 60Table B.4.3 Gender, mean age, and median age 61Table B.4.4 Prevalence per million population, adjusted 62Table B.4.5 Prevalence per million population and percentages by primary renal disease, unadjusted 63Table B.4.6 Prevalence per million population by primary renal disease, adjusted 64Table B.4.7 Prevalent counts by treatment modality 65Table B.4.8 Prevalence per million population by treatment modality, unadjusted 66Table B.4.9 Prevalence per million population by treatment modality, adjusted 67Table B.4.10 Percentages of treatment modality, unadjusted 68Table B.4.11 Percentages of treatment modality by age, gender, and primary renal disease, unadjusted 69
B5 KIDNEY TRANSPLANTS IN 2015Table B.5.1 Kidney transplant counts and percentages by donor type 70Table B.5.2 Kidney transplants per million population by donor type, unadjusted 71
B6 SURVIVAL PROBABILITY
Patient Survival on RRT (cohort 2006-2010 and cohort 2009-2013)
Table B.6.1 Incident RRT patients, from day 1, unadjusted 72Table B.6.2 Incident RRT patients, from day 1, adjusted 73Table B.6.3 Incident RRT patients, from day 91, unadjusted 74Table B.6.4 Incident RRT patients, from day 91, adjusted 75
Patient Survival on Dialysis (cohort 2006-2010 and cohort 2009-2013)
Table B.6.5 Incident dialysis patients, from day 1, unadjusted 76Table B.6.6 Incident dialysis patients, from day 1, adjusted 77Table B.6.7 Incident dialysis patients, from day 91, unadjusted 78Table B.6.8 Incident dialysis patients, from day 91, adjusted 79

XI
Patient Survival after First Transplant (cohort 2006-2010 and cohort 2009-2013)
Table B.6.9 First transplant patients (deceased donor), from day of transplant, unadjusted 80Table B.6.10 First transplant patients (deceased donor), from day of transplant, adjusted 81Table B.6.11 First transplant patients (living donor), from day of transplant, unadjusted 82Table B.6.12 First transplant patients (living donor), from day of transplant, adjusted 83
Graft Survival after First Transplant (cohort 2006-2010 and cohort 2009-2013)
Table B.6.13 First graft (deceased donor), from day of transplant, unadjusted 84Table B.6.14 First graft (deceased donor), from day of transplant, adjusted 85Table B.6.15 First graft (living donor), from day of transplant, unadjusted 86Table B.6.16 First graft (living donor), from day of transplant, adjusted 87
Patient survival by Primary Renal Disease and Treatment Modality (cohort 2006-2010)
Figure B.6.1 Adjusted patient survival by primary renal disease: Incident RRT patients 88Figure B.6.2 Adjusted patient survival by modality: Incident dialysis patients 88Figure B.6.3 Adjusted patient survival by donor type: Patients receiving a first kidney transplant 88Figure B.6.4 Adjusted cumulative incidence of death and receiving a kidney transplant: Incident dialysis patients 89
B7 EXPECTED REMAINING LIFETIMESTable B.7.1 Expected remaining lifetimes (years) of the general population (cohort 2011-2015) and of prevalent dialysis and transplant patients (cohort 2011-2015) 90
Section C: Aggregated data reference tables 91
C1 AFFILIATED REGISTRY INFORMATION FOR 2015Table C.1.1 General population data and number of renal centres 92
C2 INCIDENT PATIENTS ACCEPTED FOR RRT IN 2015, AT DAY 1Table C.2.1 Incident counts and percentages by age and gender 93Table C.2.2 Incident rates per million (age-related) population by age and gender, unadjusted 94Table C.2.3 Gender, mean age, and median age of incident patients 95Table C.2.4 Incident rates per million population, adjusted 96Table C.2.5 Incident rates per million population and percentages by primary renal disease, unadjusted 97Table C.2.6 Incident counts by treatment modality 98Table C.2.7 Incident rates per million population by treatment modality, unadjusted 99Table C.2.8 Percentages of treatment modality, unadjusted 100
C3 INCIDENT PATIENTS ACCEPTED FOR RRT IN 2015, AT DAY 91Table C.3.1 Incident counts and percentages by age and gender 101Table C.3.2 Incident rates per million (age-related) population by age and gender, unadjusted 102Table C.3.3 Gender, mean age, and median age of incident patients 103Table C.3.4 Incident rates per million population, adjusted 104Table C.3.5 Incident rates per million population and percentages by primary renal disease, unadjusted 105Table C.3.6 Incident counts by treatment modality 106Table C.3.7 Incident rates per million population by treatment modality, unadjusted 107Table C.3.8 Percentages of treatment modality, unadjusted 108
C4 PREVALENT PATIENTS ON RRT IN 2015Table C.4.1 Prevalent counts and percentages by age and gender 109Table C.4.2 Prevalence per million (age-related) population by age and gender, unadjusted 110Table C.4.3 Gender, mean age, and median age 111Table C.4.4 Prevalence per million population, adjusted 112Table C.4.5 Prevalence per million population and percentages by primary renal disease, unadjusted 113Table C.4.6 Prevalent counts by treatment modality 114Table C.4.7 Prevalence per million population by treatment modality, unadjusted 115Table C.4.8 Percentages of treatment modality, unadjusted 116
C5 KIDNEY TRANSPLANTS IN 2015Table C.5.1 Kidney transplant counts and percentages by donor type 117Table C.5.2 Kidney transplants per million population by donor type, unadjusted 118

XII
Section D: Paediatric data reference tables 119
D1 GENERAL POPULATION AGE DISTRIBUTIONTable D.1.1 Population covered (in thousands) 121
D2 INCIDENT PATIENTS ACCEPTED FOR RRT, AT DAY 1Table D.2.1 Incident counts by age and cohort 122Table D.2.2 Incident counts by age, treatment modality, and cohort 122Table D.2.3 Incident counts by age and primary renal disease 122Table D.2.4 Incident rates per million age-related population by age and cohort 123Table D.2.5 Incident rates per million age-related population by age, treatment modality, and cohort 123Table D.2.6 Incident rates per million age-related population by age and primary renal disease 123
D3 PREVALENT PATIENTS ON RRTTable D.3.1 Prevalent counts by age and cohort 124Table D.3.2 Prevalent counts by age, treatment modality, and cohort 124Table D.3.3 Prevalent counts by age and primary renal disease 124Table D.3.4 Prevalence per million age-related population by age and cohort 125Table D.3.5 Prevalence per million age-related population by age, treatment modality, and cohort 125Table D.3.6 Prevalence per million age-related population by age and primary renal disease 125
Methods 127Data collection and preparation 129Coding systems 132Statistical analyses 132Bibliography 136
Appendices 137Appendix 1 - Grouping of primary renal diseases 138Appendix 2 - Grouping of primary renal disease codes 2012 139Appendix 3 - Grouping of causes of death 144Appendix 4 - Event type codes 145Appendix 5 - Renal registries contributing data for the different types of analyses 146

Introduction

14
AL Albania IS Iceland
AT Austria IT Italy
BA Bosnia and Herzegovina LT Lithuania
BE Belgium LV Latvia
BG Bulgaria MK Macedonia
BY Belarus NL the Netherlands
CH Switzerland NO Norway
CY Cyprus PL Poland
CZ Czech Republic PT Portugal
DK Denmark RO Romania
EE Estonia RS Serbia
ES Spain RU Russia
FI Finland SE Sweden
FR France SK Slovakia
GE Georgia TN Tunisia
GR Greece TR Turkey
HR Croatia UA Ukraine
IL Israel UK United Kingdom
Figure 1: National and regional renal registries that contributed data to this annual report
registries contributing individual patient data registries contributing aggregated data
ES
AT
BA
BE CZ
DK EE
FI
FR
GR
UA
IL
IS
GE
LV
NL
NO
PL
RO
SE
SK
TR
UK
RS PT HR
AL
LT
CH
BG
CY TN
MK IT
BY
RU

15
I Introduction
The ERA-EDTA Registry collects data on renal replacement therapy (RRT) via the national and regional renal registries in Europe and countries bordering the Mediterranean Sea. For this 2015 Annual Report data sets from 52 national or regional renal registries in 36 countries were used. The reference tables are presented in two parts: Section B relates to individual patient data from 32 national and regional registries from 17 countries (shown in red in Figure 1), whereas Section C relates to 20 national or regional registries from 20 countries providing aggregated data (shown in orange in Figure 1).
Section overview
In Section A, figures summarizing the data from all participating registries are presented. Section B contains data on the incidence and prevalence of RRT and on the transplant activity, the survival and expected remaining lifetimes from registries providing individual patient data, while Section C covers data on the incidence and prevalence and transplant activity from the countries and regions providing aggregated data. The incidence and prevalence of RRT in paediatric patients are described in Section D, and are based on data from registries providing individual paediatric patient data. The Methods section describes the procedures used, including data collection and preparation, definitions, the coding systems, and the statistical methods.
New to this edition
This year for the first time, Switzerland provided individual patient data for Section B and Belarus provided aggregated data for section C of this report. In addition, we now also report on the treatment modality used at the first day of RRT in both section B and section C of the report.
ERA-EDTA Registry website
The ERA-EDTA annual reports and other information about the Registry can be downloaded from the ERA-EDTA Registry website: www.era-edta-reg.org. Slides based on the information in this annual report will be presented on the website. In addition, the website includes a repository of educational publications and the 2012 version of the ERA-EDTA Registry Primary Renal Disease Codes.
ESPN/ERA-EDTA Registry website
Information on the activities of the European Society for Paediatric Nephrology (ESPN)/ERA-EDTA Registry and on paediatric registries in general can be found on the ESPN/ERA-EDTA Registry website: www.espn-reg.org. In addition, the ESPN/ERA-EDTA Registry annual reports can be downloaded from this website.


Section A: Summary data

18
General population Incidence in 2015, at day 1 covered by the registry in thousands All N All Pmp Mean Age DM N DM Pmp
A1 INCIDENT PATIENTS ACCEPTED FOR RRT IN 2015, AT DAY 1
Table A.1.1Summary data on the incidence of RRT in 2015, unadjusted
Albania 2851 251 88 52.5 30 11Austria 8585 1204 140 65.0 316 37Belarus 9299 747 80 167 18Belgium, Dutch-speaking * 6473 1158 179 70.6 234 36Belgium, French-speaking * 4802 902 188 67.8 197 41Bosnia and Herzegovina 3531 404 114 61.4 122 35Bulgaria † 7154 1093 153 278 39Croatia 3427 540 158 65.3 168 49Cyprus 855 164 192 66.3 61 71Czech Republic † 10293 2393 233 Denmark 5740 621 108 62.3 179 31Estonia 1315 114 87 58.6 23 18Finland 5480 520 95 59.6 177 32France 66624 11084 166 67.9 2513 38Georgia 3714 694 187 61.9 158 43Greece 10821 2455 227 69.6 646 60Iceland 331 24 73 57.4 5 15Israel 8380 1606 192 65.3 723 86Italy (5 of 20 regions) 16986 2232 131 68.2 402 24Latvia 1574 152 97 62.2 23 15Lithuania 2921 308 105 64.7 44 15Macedonia 2022 307 152 63.5 71 35Norway 5189 514 99 63.0 90 17Poland 37967 6617 174 Portugal 10375 2352 227 771 74Romania 19617 3125 159 61.7 355 18Russia 145080 7413 51 52.3 1297 9Serbia 7095 818 115 62.4 185 26Slovakia 5426 916 169 62.8 334 62Spain (All) 46624 6277 135 64.8 1454 31Spain, Andalusia 8402 1037 123 62.6 263 31Spain, Aragon 1323 155 117 66.2 6 5Spain, Asturias 1050 176 168 66.6 45 43Spain, Basque country 2165 265 122 64.8 58 27Spain, Cantabria * 584 61 105 65.6 16 27Spain, Castile and León * 2466 287 116 67.4 71 29Spain, Castile-La Mancha * 2056 220 107 64.0 47 23Spain, Catalonia 7508 1247 166 66.9 213 28Spain, Extremadura 1093 152 139 66.2 34 31Spain, Galicia 2728 393 144 65.6 104 38Spain, Community of Madrid 6437 807 125 65.2 217 34Spain, Region of Murcia 1467 184 125 62.3 37 25Spain, Navarre * 637 92 144 63.6 16 25Spain, Valencian region 4981 734 147 64.8 147 30Sweden 9799 1166 119 63.7 306 31Switzerland 8282 848 102 64.6 155 19the Netherlands 16940 1996 118 63.7 375 22Tunisia, Sfax region 1186 193 163 59.4 62 52Turkey ‡ 78736 11597 147 636 8Ukraine 42759 1024 24 48.1 248 6United Kingdom, England * ¶ 54786 6323 115 62.3 1546 28United Kingdom, Northern Ireland * 1852 220 119 63.5 51 28United Kingdom, Scotland 5373 619 115 59.6 173 32United Kingdom, Wales * 3099 382 123 63.3 104 34 All countries 683363 81373 119 63.1 14679 26
When cells are left empty, the data are unavailable and therefore could not be used for the calculation of the summary dataDM = diabetes mellitus as primary renal disease* Patients younger than 20 years of age are not reported. The true incidence counts are therefore slightly higher than the counts reported here† Data on incidence include dialysis patients only‡ Data on incidence of primary renal disease (DM) is based on 1707 dialysis patients (14.7% of total)¶ The incidence is underestimated by approximately 4% due to a small number of centres not submitting complete data for 2015

19
No data available
≥200 pmp
150-199 pmp
100-149 pmp
<100 pmp
AL Albania IS Iceland
AT Austria IT Italy
BA Bosnia and Herzegovina LT Lithuania
BE Belgium LV Latvia
BG Bulgaria MK Macedonia
BY Belarus NL the Netherlands
CH Switzerland NO Norway
CY Cyprus PL Poland
CZ Czech Republic PT Portugal
DK Denmark RO Romania
EE Estonia RS Serbia
ES Spain RU Russia
FI Finland SE Sweden
FR France SK Slovakia
GE Georgia TN Tunisia
GR Greece TR Turkey
HR Croatia UA Ukraine
IL Israel UK United Kingdom
ES
AT
BA
BE CZ
DK EE
FI
FR
GR
UA
IL
IS
GE
LV
NL
NO
PL
RO
SE
SK
TR
UK
RS PT HR
AL
LT
CH
BG
CY TN
MK IT
BY
RU
Detailed information on the contents of this figure can be found in table B.2.2 for registries providing individual patient data, and in table C.2.2 for registries providing aggregated data.
A1 INCIDENT PATIENTS ACCEPTED FOR RRT IN 2015, AT DAY 1
Figure A.1.1Incident rates per million population by country / region, unadjustedat day 1
20
119
232227227
192192188187
179174
169168166166163159158
153152
147147144144140139
135131
125125123123122119119118117116115115115114
108107105104102999795
8887
8073
5124
0 50 100 150 200 250
All countries
Czech RepublicGreece
PortugalCyprus
IsraelBelgium, French-speaking
GeorgiaBelgium, Dutch-speaking
PolandSlovakia
Spain, AsturiasFrance
Spain, CataloniaTunisia, Sfax region
RomaniaCroatia
BulgariaMacedonia
Spain, Valencian regionTurkey
Spain, NavarreSpain, Galicia
AustriaSpain, Extremadura
SpainItaly (5 of 20 regions)
Spain, Region of MurciaSpain, Community of Madrid
Spain, AndalusiaUK, Wales
Spain, Basque countrySweden
UK, Northern Irelandthe Netherlands
Spain, AragonSpain, Castile and León
UK, EnglandSerbia
UK, ScotlandBosnia and Herzegovina
DenmarkSpain, Castile-La Mancha
LithuaniaSpain, Cantabria
SwitzerlandNorway
LatviaFinlandAlbaniaEstoniaBelarusIcelandRussia
Ukraine
113
285241
234224
202197194
181162162160157
152141138137134133131130129127125
120119118117114114112112
107106105105105103100100
959490898786
8152
0 50 100 150 200 250 300 350
All countries
IsraelCyprus
Tunisia, Sfax regionMacedonia
GeorgiaBelgium, French-speaking
GreeceSlovakia
Spain, CataloniaBelgium, Dutch-speaking
FranceRomania
CroatiaSpain, Valencian region
Spain, NavarreSpain, Region of Murcia
AustriaSpain, Asturias
Spain, Community of MadridSpain, Extremadura
UK, Northern IrelandSpain, Andalusia
SpainSpain, Galicia
Bosnia and HerzegovinaUK, Wales
UK, Englandthe Netherlands
SwedenUK, Scotland
Italy (5 of 20 regions)Spain, Basque country
DenmarkSpain, Aragon
NorwaySpain, Castile-La Mancha
SerbiaLithuania
SwitzerlandSpain, Cantabria
Spain, Castile and LeónLatvia
FinlandAlbaniaEstoniaIcelandRussia
Incidence (per million population) Incidence (per million population)
Unadjusted incident rate
Adjusted incident rate
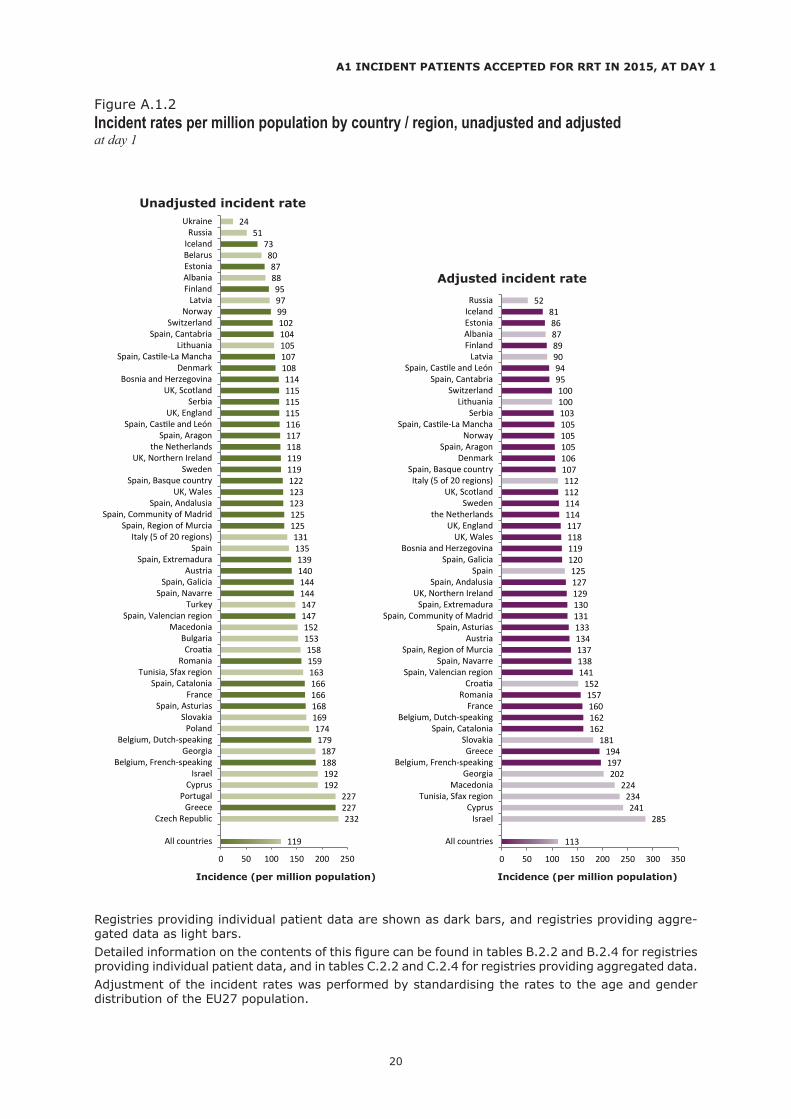
Registries providing individual patient data are shown as dark bars, and registries providing aggre-gated data as light bars. Detailed information on the contents of this figure can be found in tables B.2.2 and B.2.4 for registries providing individual patient data, and in tables C.2.2 and C.2.4 for registries providing aggregated data. Adjustment of the incident rates was performed by standardising the rates to the age and gender distribution of the EU27 population.
A1 INCIDENT PATIENTS ACCEPTED FOR RRT IN 2015, AT DAY 1
Figure A.1.2Incident rates per million population by country / region, unadjusted and adjustedat day 1

21
62 64 60
38 36 40
0%10%20%30%40%50%60%70%80%90%
100%
All countries Individualdata
Aggregateddata
Women
Men
1 1 212 11 15
34 3138
2526
24
27 3121
0%10%20%30%40%50%60%70%80%90%
100%
All countries Individualdata
Aggregateddata
75+
65-74
45-64
20-44
0-19
15 12 186 5
76 57
2322
23
14 15112 22
15 1712
20 21 19
0%10%20%30%40%50%60%70%80%90%
100%
All countries Individualdata
Aggregateddata
Unknown/missing
Miscellaneous
Renal vascular disease
Hypertension
Diabetes mellitus
Polycystic kidneys, adult type
Pyelonephritis
Glomerulonephritis/sclerosis
This figure summarizes the data presented in tables B.2.3 and C.2.3.
This figure summarizes the data presented in tables B.2.1 and C.2.1.
This figure summarizes the data presented in tables B.2.5 and C.2.5.
By gender
By age
By primary renal disease
A1 INCIDENT PATIENTS ACCEPTED FOR RRT IN 2015, AT DAY 1
Figure A.1.3Incident percentages by gender, age, and primary renal disease, unadjustedat day 1

22
85 82 87
11 14 104 5 3
0%10%20%30%40%50%60%70%80%90%
100%
All countries Individualdata
Aggregateddata
Tx
PD
HD
82 81
14 144 5
0%10%20%30%40%50%60%70%80%90%
100%
Men Women
Tx
PD
HD
85 80
13 14
2 6
0%10%20%30%40%50%60%70%80%90%
100%
DM non DM
Tx
PD
HD
5370 77 85 88
25
1815
12 1123
13 7 3
0%10%20%30%40%50%60%70%80%90%
100%
0-19 20-44 45-64 65-74 75+
Tx
PD
HD
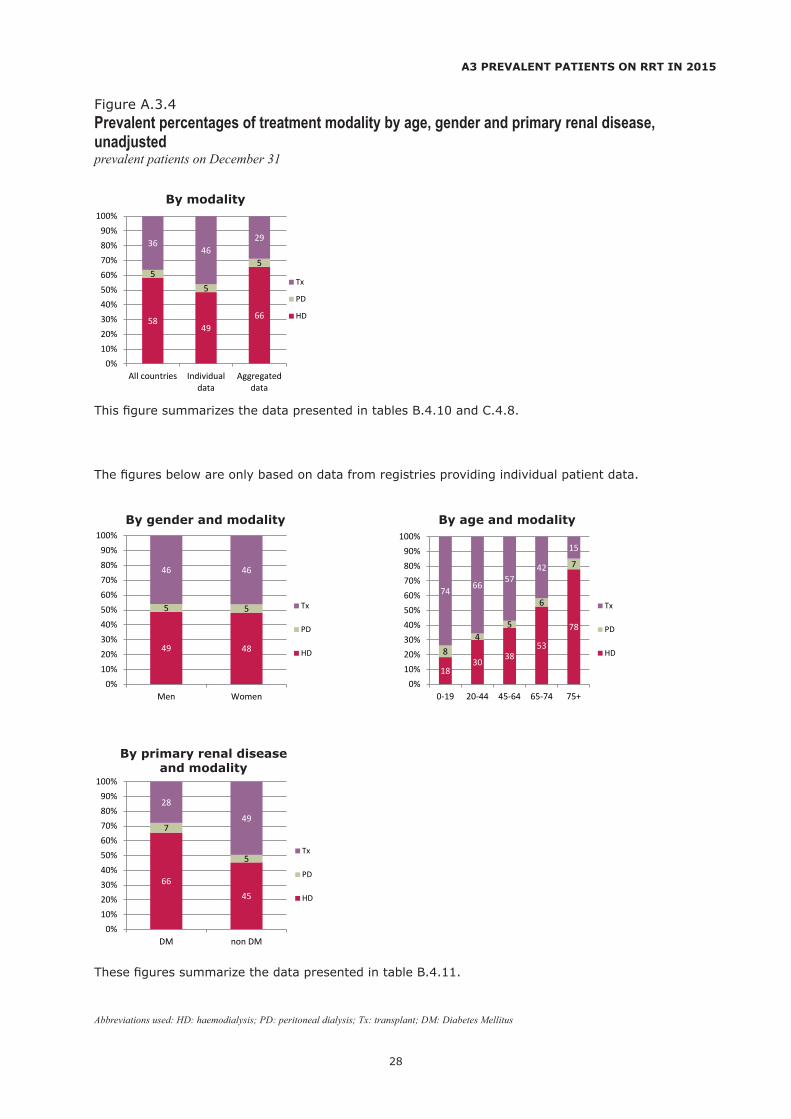
This figure summarizes the data presented in tables B.2.10 and C.2.8.
These figures summarize the data presented in table B.2.11.
The figures below are only based on data from registries providing individual patient data
By modality
By primary renal disease and modality
By gender and modality By age and modality
Abbreviations used: HD: haemodialysis; PD: peritoneal dialysis; Tx: transplant; DM: Diabetes Mellitus
A1 INCIDENT PATIENTS ACCEPTED FOR RRT IN 2015, AT DAY 1
Figure A.1.4Incident percentages of treatment modality by age, gender and primary renal disease, unadjustedat day 1

23
82 7989
13 1595 6 1
0%10%20%30%40%50%60%70%80%90%
100%
All countries Individualdata
Aggregateddata
Tx
PD
HD
80 79
14 15
6 6
0%10%20%30%40%50%60%70%80%90%
100%
Men Women
Tx
PD
HD
84 78
1415
3 7
0%10%20%30%40%50%60%70%80%90%
100%
DM non DM
Tx
PD
HD
4665
7584 88
27
1916
13 1227
15 9 3
0%10%20%30%40%50%60%70%80%90%
100%
0-19 20-44 45-64 65-74 75+
Tx
PD
HD
This figure summarizes the data presented in tables B.3.10 and C.3.8.
These figures summarize the data presented in table B.3.11.
The figures below are only based on data from registries providing individual patient data
By modality
By primary renal disease and modality
By gender and modality By age and modality
Abbreviations used: HD: haemodialysis; PD: peritoneal dialysis; Tx: transplant; DM: Diabetes Mellitus
A2 INCIDENT PATIENTS ACCEPTED FOR RRT IN 2015, AT DAY 91
Figure A.2.1Incident percentages of treatment modality by age, gender and primary renal disease, unadjustedat day 91

24
General population Prevalent patients on RRT in 2015 covered by the registry in thousands All N All Pmp Mean Age DM N DM Pmp
A3 PREVALENT PATIENTS ON RRT IN 2015
Table A.3.1Summary data on the prevalence of RRT at 31 December 2015, unadjusted
Albania 2851 1214 426 50.3 144 51Austria 8585 9259 1079 61.0 1828 213Belarus 9299 3204 345 444 48Belgium, Dutch-speaking * 6473 8142 1258 65.8 1400 216Belgium, French-speaking * 4802 6143 1279 64.8 1071 223Bosnia and Herzegovina 3531 2653 751 59.4 512 145Bulgaria 7154 4241 593 Croatia 3427 2553 745 65.6 656 191Cyprus 855 Czech Republic 10293 11444 1112 Denmark 5740 5190 904 58.4 878 153Estonia 1315 869 661 57.8 163 124Finland 5480 4679 854 58.8 1189 217France 66624 83042 1246 63.0 13217 198Georgia 3714 2327 627 56.5 483 130Greece 10821 13359 1235 64.0 2485 230Iceland 331 218 659 54.6 23 70Israel & 8380 6442 769 65.6 2954 353Italy (5 of 20 regions) 16986 17832 1050 62.2 2061 121Latvia 1574 1007 640 55.9 95 60Lithuania 2921 2203 754 Macedonia 2022 1598 790 57.8 245 121Norway 5189 4836 932 59.3 644 124Poland 37967 30400 801 Portugal + 10375 18928 1824 66.8 3392 327Romania || 19617 18977 967 60.5 1996 102Russia 145080 43955 303 54.4 5318 37Serbia 7095 5673 800 59.2 935 132Slovakia & 5426 3337 615 63.3 1145 211Spain (All) 46624 56354 1209 63.2 8863 190Spain, Andalusia 8402 9640 1147 60.2 1476 176Spain, Aragon 1323 1539 1164 62.7 238 180Spain, Asturias 1050 1256 1196 62.8 206 196Spain, Basque country 2165 2656 1227 61.8 286 132Spain, Cantabria * 584 662 1134 62.2 89 152Spain, Castile and León * 2466 2761 1119 64.3 476 193Spain, Castile-La Mancha * 2056 2241 1090 62.0 341 166Spain, Catalonia 7508 10171 1355 62.7 1414 188Spain, Extremadura 1093 1256 1149 61.4 191 175Spain, Galicia 2728 3559 1305 62.2 608 223Spain, Community of Madrid 6437 7008 1089 61.5 1247 194Spain, Region of Murcia 1467 1888 1287 61.8 257 175Spain, Navarre * 637 799 1254 62.0 112 176Spain, Valencian region 4981 6638 1333 62.8 883 177Sweden 9799 9421 961 59.6 1668 170Switzerland † 8282 7714 931 62.5 1166 141the Netherlands 16940 16764 990 60.1 2122 125Tunisia, Sfax region & 1186 923 778 58.3 184 155Turkey ‡ 78736 73660 936 2048 26Ukraine 42759 7610 178 48.6 1137 27United Kingdom, England * ¶ 54786 50999 931 58.6 8483 155United Kingdom, Northern Ireland * 1852 1693 914 58.4 258 139United Kingdom, Scotland 5373 4923 916 56.6 781 145United Kingdom, Wales * 3099 2997 967 59.4 509 164 All countries 683363 546783 801 60.8 70497 128
When cells are left empty, the data are unavailable and therefore could not be used for the calculation of the summary dataDM = diabetes mellitus as primary renal disease* Patients younger than 20 years of age are not reported. The true prevalent counts are therefore slightly higher than the counts reported here& Data on prevalence include dialysis patients only+ Data on prevalence of primary renal disease (DM) include dialysis patients only|| The prevalence is underestimated by approximately 3% due to an estimated 30% underreporting of patients living on a functioning graft† The prevalence is underestimated by approximately 6% due to an estimated 11% underreporting of patients living on a functioning graft‡ Data on the prevalence of primary renal disease (DM) is based on 6400 dialysis patients (8.7% of total)¶ The prevalence is underestimated by approximately 1% due to a small number of centres not submitting complete data for 2015

25
No data available
≥1500 pmp
1000-1499 pmp
750-999 pmp
<750 pmp
ES
AT
BA
BE CZ
DK EE
FI
FR
GR
UA
IL
IS
GE
LV
NL
NO
PL
RO
SE
SK
TR
UK
RS PT HR
AL
LT
CH
BG
CY TN
MK IT
BY
RU
AL Albania IS Iceland
AT Austria IT Italy
BA Bosnia and Herzegovina LT Lithuania
BE Belgium LV Latvia
BG Bulgaria MK Macedonia
BY Belarus NL the Netherlands
CH Switzerland NO Norway
CY Cyprus PL Poland
CZ Czech Republic PT Portugal
DK Denmark RO Romania
EE Estonia RS Serbia
ES Spain RU Russia
FI Finland SE Sweden
FR France SK Slovakia
GE Georgia TN Tunisia
GR Greece TR Turkey
HR Croatia UA Ukraine
IL Israel UK United Kingdom
Detailed information on the contents of this figure can be found in table B.4.2 for registries providing individual patient data, and in table C.4.2 for registries providing aggregated data.
A3 PREVALENT PATIENTS ON RRT IN 2015
Figure A.3.1Prevalence per million population by country / region, unadjustedprevalent patients on December 31

26
801
182413551333
1305128712791258125412461235122712091196
116411491147113411191112109010891079
1050990967967961
936932931931916914904
854801800790778769754751745
661659640627615593
426345
303178
0 250 500 750 1000 1250 1500 1750 2000
All countries
PortugalSpain, Catalonia
Spain, Valencian regionSpain, Galicia
Spain, Region of MurciaBelgium, French-speakingBelgium, Dutch-speaking
Spain, NavarreFranceGreece
Spain, Basque countrySpain
Spain, AsturiasSpain, Aragon
Spain, ExtremaduraSpain, AndalusiaSpain, Cantabria
Spain, Castile and LeónCzech Republic
Spain, Castile-La ManchaSpain, Community of Madrid
AustriaItaly (5 of 20 regions)
the NetherlandsRomania
UK, WalesSweden
TurkeyNorway
SwitzerlandUK, England
UK, ScotlandUK, Northern Ireland
DenmarkFinlandPolandSerbia
MacedoniaTunisia, Sfax region
IsraelLithuania
Bosnia and HerzegovinaCroatiaEstoniaIceland
LatviaGeorgiaSlovakiaBulgariaAlbaniaBelarus
RussiaUkraine
810
140513401326
12781235
1197116911621152114511331116111311101093107710761055103810351020
988982969965954953944939933925903888
845810
783734726
680669663661
612434
307
0 250 500 750 1000 1250 1500
All countries
Spain, Region of MurciaBelgium, French-speaking
Spain, CataloniaSpain, Valencian region
FranceSpain, Navarre
Spain, AndalusiaBelgium, Dutch-speaking
IsraelSpain
Tunisia, Sfax regionSpain, Galicia
Spain, Community of MadridGreece
Spain, Basque countrySpain, Extremadura
Spain, Castile-La ManchaSpain, Aragon
MacedoniaAustria
Spain, CantabriaSpain, Asturias
UK, Northern IrelandNorway
the NetherlandsRomania
UK, EnglandUK, Wales
SwedenItaly (5 of 20 regions)
Spain, Castile and LeónUK, Scotland
DenmarkSwitzerland
FinlandBosnia and Herzegovina
SerbiaIcelandCroatia
GeorgiaEstonia
SlovakiaLatvia
AlbaniaRussia
Prevalence (per million population) Prevalence (per million population)
Unadjusted prevalence
Adjusted prevalence
Registries providing individual patient data are shown as dark bars, and registries providing aggre-gated data as light bars.Detailed information on the contents of this figure can be found in tables B.4.2 and B.4.4 for registries providing individual patient data, and in tables C.4.2 and C.4.4 for registries providing aggregated data.Adjustment of the prevalence was performed by standardising the prevalence to the age and gender distribution of the EU27 population.
A3 PREVALENT PATIENTS ON RRT IN 2015
Figure A.3.2Prevalence per million population by country / region, unadjusted and adjustedprevalent patients on December 31

27
60 62 59
40 38 41
0%10%20%30%40%50%60%70%80%90%
100%
All countries Individualdata
Aggregateddata
Women
Men
1 1 116 15 18
40 3942
23 2322
19 21 17
0%10%20%30%40%50%60%70%80%90%
100%
All countries Individualdata
Aggregateddata
75+
65-74
45-64
20-44
0-19
22 20 25
8 88
9 99
16 1617
10 1192 2 1
16 17 12
17 17 19
0%10%20%30%40%50%60%70%80%90%
100%
All countries Individualdata
Aggregateddata
Unknown/missing
Miscellaneous
Renal vascular disease
Hypertension
Diabetes mellitus
Polycystic kidneys, adult type
Pyelonephritis
Glomerulonephritis/sclerosis
This figure summarizes the data presented in tables B.4.3 and C.4.3.
This figure summarizes the data presented in tables B.4.1 and C.4.1.
This figure summarizes the data presented in tables B.4.5 and C.4.5.
By gender
By age
By primary renal disease
A3 PREVALENT PATIENTS ON RRT IN 2015
Figure A.3.3Prevalent percentages by gender, age, and primary renal disease, unadjustedprevalent patients on December 31
28
5849
66
55
5
3646
29
0%10%20%30%40%50%60%70%80%90%
100%
All countries Individualdata
Aggregateddata
Tx
PD
HD
49 48
5 5
46 46
0%10%20%30%40%50%60%70%80%90%
100%
Men Women
Tx
PD
HD
1830
3853
78
84
5
6
7
74 6657
42
15
0%10%20%30%40%50%60%70%80%90%
100%
0-19 20-44 45-64 65-74 75+
Tx
PD
HD
6645
7
5
28
49
0%10%20%30%40%50%60%70%80%90%
100%
DM non DM
Tx
PD
HD
This figure summarizes the data presented in tables B.4.10 and C.4.8.
These figures summarize the data presented in table B.4.11.
The figures below are only based on data from registries providing individual patient data.
By modality
By gender and modality By age and modality
By primary renal disease and modality
Abbreviations used: HD: haemodialysis; PD: peritoneal dialysis; Tx: transplant; DM: Diabetes Mellitus
A3 PREVALENT PATIENTS ON RRT IN 2015
Figure A.3.4Prevalent percentages of treatment modality by age, gender and primary renal disease, unadjustedprevalent patients on December 31

29
31
9486
7874
636262
6060
585554545352
5050
494847474747
4544444443424141414039
3734
3129282727
2321
151110998
7776
2
0 20 40 60 80 100
All countries
Spain, CantabriaSpain, Catalonia
Spain, NavarreSpain, Basque country
Spain, Community of MadridSpain
Spain, GaliciaUK, Northern Ireland
Spain, Aragonthe Netherlands
Spain, Valencian regionSpain, Andalusia
Spain, Castile-La ManchaSpain, Asturias
FranceSpain, Extremadura
Spain, Castile and LeónNorway
Spain, Region of MurciaUK, Scotland
DenmarkPortugal
CroatiaFinland
Czech RepublicAustria
UK, EnglandSweden
IsraelBelgium, Dutch-speaking
TurkeyLatvia
Belgium, French-speakingLithuania
SwitzerlandSlovakiaBelarusEstoniaPoland
UK, WalesItaly (5 of 20 regions)
CyprusIceland
GeorgiaGreece
Bosnia and HerzegovinaAlbania
RomaniaSerbia
BulgariaTunisia, Sfax region
RussiaMacedonia
Ukraine
All % Deceased % Living % Unknown N donor donor donor typeUnadjusted transplant rate
Transplant rate (per million population)
Registries providing individual patient data are shown as red bars, and registries providing aggregated data as orange bars. Detailed information on the contents of this figure can be found in tables B.5.1 and B.5.2 for registries providing individual patient data, and in tables C.5.1 and C.5.2 for registries providing aggregated data.
102 - - 100 12 25 75 0 945 80 20 0 8 0 100 0 51 75 25 0 60 43 55 2 169 60 22 17 27 22 78 0 35 29 71 0 114 67 33 0 57 0 100 0 7 0 100 0 20 5 95 0 452 93 7 0 85 67 33 0 1077 94 6 0 38 92 8 0 285 95 5 0 184 90 10 0 303 68 31 1 115 92 8 0 190 86 14 0 64 83 17 0 3204 21 79 0 267 94 6 0 348 - - 100 418 69 31 0 2398 69 29 2 413 85 15 0 453 88 12 0 245 93 6 0 160 97 3 0 485 87 13 0 270 57 43 0 255 69 31 0 70 94 6 0 254 75 25 0 124 100 0 0 55 87 7 5 3490 84 16 0 56 95 5 0 111 - - 100 455 87 13 0 276 90 9 1 980 47 53 0 79 96 4 0 111 45 55 0 168 77 23 0 2905 87 13 0 407 93 7 0 160 84 16 0 50 88 12 0 647 75 25 0 55 95 5 0 21056 68 29 3
A4 KIDNEY TRANSPLANTS IN 2015
Figure A.4.1Kidney transplant counts and per million population by country / region, unadjusted

30
23
8969
6562
5957
54505050
4847
45454444
4241
3939
373736
343433
30302929
2727272727
2525
189
7555
43211
000
0 10 20 30 40 50 60 70 80 90
All countries
Spain, CantabriaSpain, Navarre
Spain, CataloniaSpain, Basque country
Spain, Community of MadridSpain, Aragon
SpainSpain, Asturias
Spain, Castile and LeónSpain, Valencian region
Spain, GaliciaSpain, Andalusia
CroatiaSpain, Region of Murcia
FranceSpain, Extremadura
FinlandPortugal
Czech RepublicBelgium, Dutch-speaking
AustriaNorway
LithuaniaBelgium, French-speaking
LatviaUK, Scotland
SlovakiaUK, England
SwedenBelarus
the NetherlandsUK, Northern Ireland
DenmarkPolandEstonia
SwitzerlandItaly (5 of 20 regions)
UK, WalesTurkeyGreece
BulgariaRussia
RomaniaSerbia
Bosnia and HerzegovinaAlbania
MacedoniaCyprus
GeorgiaIceland
Tunisia, Sfax region
10
3332
3022212120
1515141313121211
99887777776655555444433333222222211
0
0 10 20 30 40
All countries
UK, Northern IrelandTurkey
the NetherlandsCyprus
Spain, CataloniaIceland
DenmarkGeorgia
UK, ScotlandSpain, Galicia
SwedenUK, England
NorwaySpain, Basque country
SwitzerlandSpain, Navarre
UK, WalesSpain
FranceAlbania
Spain, AndalusiaBosnia and Herzegovina
LatviaAustria
Tunisia, Sfax regionPortugal
Belgium, French-speakingCzech Republic
Spain, CantabriaSpain, Valencian region
SerbiaSpain, Community of Madrid
MacedoniaSpain, Extremadura
GreeceSlovakia
LithuaniaSpain, Asturias
FinlandSpain, Region of Murcia
Belgium, Dutch-speakingEstonia
Spain, AragonRomania
Italy (5 of 20 regions)BulgariaBelarusPolandCroatiaRussia
Spain, Castile and León
Unadjusted deceased donor transplant rate Unadjusted living donor transplant rate
Transplant rate (per million population) Transplant rate (per million population)
Registries providing individual patient data are shown as dark bars, and registries providing aggre-gated data as light bars. Detailed information on the contents of this figure can be found in table B.5.2 for registries providing individual patient data, and in table C.5.2 for registries providing aggregated data.
A4 KIDNEY TRANSPLANTS IN 2015
Figure A.4.2Kidney transplants per million population by donor type and by country / region, unadjusted

31
29 2332
68 75 64
3 2 4
0%10%20%30%40%50%60%70%80%90%
100%
All countries Individualdata
Aggregateddata
Unknown
Deceased
Living
By donor type
This figure summarizes the data presented in table B.5.1 for registries providing individual patient data, and in table C.5.1 for registries providing aggregated data.
A4 KIDNEY TRANSPLANTS IN 2015
Figure A.4.3Kidney transplant percentages by donor type, unadjusted

32
Survival probabilities as % (95% CI)
cohort 2006 - 2010 cohort 2009 - 2013
1 year 2 year 5 year 1 year 2 year
Patient survival on RRT
Patient survival on dialysis
Graft survival after first kidney transplantation (deceased donor)
Patient survival after first kidney transplantation (deceased donor)
Patient survival after first kidney transplantation (living donor)
Graft survival after first kidney transplantation (living donor)
This table summarizes the survival data presented in the tables B.6.1 to B.6.16, and is based on data from the following registries providing individual patient data: Austria, Belgium (Dutch-speaking), Belgium (French-speaking), Denmark, Finland, France, Greece, Iceland, Norway, Spain (Andalusia), Spain (Aragon), Spain (Asturias), Spain (Basque country), Spain (Cantabria), Spain (Castile and León), Spain (Castile-La Mancha), Spain (Catalonia), Spain (Extremadura), Spain (Galicia), Spain (Community of Madrid), Spain (Valencian region), Sweden, the Netherlands, United Kingdom (England/Northern Ireland/Wales) and United Kingdom (Scotland).
A5 SURVIVAL PROBABILITY
Table A.5.1One-, two- and five-year survival probabilities by treatment modality and cohortfrom day 1 of RRT / dialysis, or from day of transplant
Unadjusted 83.2 (83.1-83.4) 72.7 (72.6-72.9) 50.0 (49.9-50.1) 84.4 (84.2-84.5) 74.3 (74.2-74.5)Adjusted † 85.9 (85.8-86.1) 76.1 (75.9-76.3) 51.1 (50.8-51.4) 86.9 (86.7-87.1) 77.6 (77.4-77.9)
Unadjusted 82.2 (82.1-82.4) 70.4 (70.2-70.6) 41.8 (41.7-41.9) 83.3 (83.1-83.4) 71.9 (71.7-72.0)Adjusted † 84.4 (84.2-84.6) 73.5 (73.3-73.7) 45.0 (44.7-45.4) 85.7 (85.5-85.9) 75.4 (75.2-75.6)
Unadjusted 96.1 (95.9-96.4) 94.3 (94.1-94.6) 88.0 (87.6-88.3) 96.3 (96.1-96.5) 94.3 (94.0-94.5)Adjusted †† 97.5 (97.3-97.6) 96.2 (96.0-96.4) 91.7 (91.3-92.1) 97.8 (97.7-98.0) 96.5 (96.3-96.7)
Unadjusted 90.9 (90.5-91.2) 88.1 (87.8-88.5) 78.9 (78.5-79.3) 91.1 (90.8-91.3) 88.1 (87.7-88.4)Adjusted †† 91.8 (91.4-92.1) 89.3 (88.9-89.7) 80.7 (80.2-81.2) 92.4 (92.1-92.7) 89.8 (89.4-90.1)
Unadjusted 98.6 (98.3-98.8) 97.7 (97.4-98.0) 94.1 (93.6-94.6) 98.9 (98.7-99.1) 97.9 (97.6-98.2)Adjusted †† 98.7 (98.5-99.0) 98.0 (97.7-98.3) 94.5 (94.0-95.0) 99.1 (98.9-99.2) 98.2 (98.0-98.5)
Unadjusted 95.9 (95.4-96.3) 94.1 (93.6-94.5) 87.4 (86.7-88.0) 96.5 (96.2-96.8) 94.7 (94.3-95.1)Adjusted †† 95.6 (95.2-96.1) 93.8 (93.2-94.3) 86.6 (85.8-87.4) 96.3 (95.9-96.7) 94.4 (93.9-94.9)
† Analyses were adjusted using fixed values: age (67 years), gender (63% men) and PRD (24% diabetes mellitus, 19% hypertension/renal vascular disease, 11% glomerulonephritis and 46% other causes).†† Analyses were adjusted using fixed values: age (50 years), gender (63% men) and PRD (14% diabetes mellitus, 10% hypertension/renal vascular disease, 23% glomerulonephritis and 53% other causes).

33
Survival on dialysis was adjusted using fixed values: age (67 years), gender (63% men) and PRD (24% diabetes mellitus, 19% hypertension/renal vascular disease, 11% glomerulonephritis and 46% other causes). Survival after transplantation was adjusted using fixed values: age (50 years), gender (63% men) and PRD (14% diabetes mellitus, 10% hypertension/renal vascular disease, 23% glome-rulonephritis and 53% other causes).
These figures are based on patients starting dialysis or receiving a kidney transplant between 2006 and 2010 from the following registries providing individual patient data: Austria, Belgium (Dutch-speaking), Belgium (French-speaking), Denmark, Finland, France, Greece, Iceland, Norway, Spain (Andalusia), Spain (Aragon), Spain (Asturias), Spain (Basque country), Spain (Cantabria), Spain (Cas-tile and León), Spain (Castile-La Mancha), Spain (Catalonia), Spain (Extremadura), Spain (Galicia), Spain (Community of Madrid), Spain (Valencian region), Sweden, the Netherlands, United Kingdom (England/Northern Ireland/Wales) and United Kingdom (Scotland).
Figure A.5.1Adjusted patient survival by modality: Incident dialysis patientsfrom day 91, adjusted for age, gender, and primary renal disease
Figure A.5.2Adjusted patient survival by donor type: Patients receiving a first kidney transplantfrom day of transplant, adjusted for age, gender, and primary renal disease
0
10
20
30
40
50
60
70
80
90
100
0 1 2 3 4 5
Sur
viva
l pro
babi
lity
(%)
Years
Haemodialysis
Peritoneal dialysis
0
10
20
30
40
50
60
70
80
90
100
0 1 2 3 4 5
Sur
viva
l pro
babi
lity
(%)
Years
Living donor
Deceased donor
A5 SURVIVAL PROBABILITY

34
051015202530354045505560657075808590
0 10 20 30 40 50 60 70 80 90
0-19
20-2425-2930-3435-3940-4445-4950-5455-5960-6465-6970-7475-7980-8485-89
Expected remaining lifetimes (years)
Transplant
Dialysis
General population
Age
of d
ialy
sis a
nd t
rans
plan
t pati
ents
Age
of th
e ge
nera
l pop
ulati
on
This figure summarizes the data presented in table B.7.1, and is based on data from the following registries providing individual patient data: Austria, Belgium (Dutch-speaking), Belgium (French-speaking), Denmark, Finland, France, Greece, Iceland, Norway, Spain (Andalusia), Spain (Aragon), Spain (Asturias), Spain (Basque country), Spain (Cantabria), Spain (Castille and León), Spain (Castille-La Mancha), Spain (Catalonia), Spain (Extremadura), Spain (Galicia), Spain (Community of Madrid), Spain (Valencian region), Sweden, the Netherlands, United Kingdom (England/Northern Ireland/Wales) and United Kingdom (Scotland).
Expected remaining lifetimes of the general population and of prevalent dialysis and transplant patients
A6 EXPECTED REMAINING LIFETIMES
Figure A.6.1Expected remaining lifetimes (years) of the general population (cohort 2011-2015) and of prevalent dialysis and transplant patients (cohort 2011-2015)by age and gender

Section B: Individual patient data reference tables

General population % Coverage of general Total number of Number of renal centres of whole country/region population by the registry renal centres collaborating with the registry in thousands for individual patient data of whole country/region for individual patient data
36
Austria 8585 100 80 80Belgium, Dutch-speaking 6473 100 27 27Belgium, French-speaking 4802 100 24 24Bosnia and Herzegovina 3531 100 27 27Denmark 5740 100 15 15Estonia 1315 100 3 3Finland 5480 100 30 30France 66624 100 1255 1255Greece 10821 100 172 172Iceland 331 100 1 1Norway 5189 100 25 25Romania 19815 99.0 140 137Serbia 7095 100 63 63Spain, Andalusia 8402 100 61 61Spain, Aragon 1323 100 10 10Spain, Asturias 1050 100 10 10Spain, Basque country 2165 100 10 10Spain, Cantabria 584 100 2 2Spain, Castile and León 2466 100 23 23Spain, Castile-La Mancha 2056 100 12 12Spain, Catalonia 7508 100 47 47Spain, Extremadura 1093 100 12 12Spain, Galicia 2728 100 25 25Spain, Community of Madrid 6437 100 38 38Spain, Region of Murcia 1467 100 13 13Spain, Navarre 637 100 3 3Spain, Valencian region 4981 100 48 48Sweden 9799 100 66 66Switzerland 8282 100 88 89the Netherlands 16940 100 72 72United Kingdom, All countries * 65110 100 72 72United Kingdom, England * 54786 100 52 52United Kingdom, Northern Ireland 1852 100 5 5United Kingdom, Scotland 5373 100 10 10United Kingdom, Wales 3099 100 5 5
B1 AFFILIATED REGISTRY INFORMATION FOR 2015
Table B.1.1General population data and number of renal centres
* Due to delays in a small number of centres submitting individual patient-level data for some new patients in 2015, the percentage coverage might be different for the incidence, prevalence and transplant activity calculations (please see footnotes in the concerned tables)

All 0-19 20-44 45-64 65-74 75+
All Men Women All Men Women All Men Women All Men Women All Men Women All Men Women
N (100%) N (100%) N (100%) N % N % N % N % N % N % N % N % N % N % N % N % N % N % N %
37
Austria 1204 783 421 6 0 3 0 3 1 111 9 79 10 32 8 387 32 252 32 135 32 382 32 258 33 124 29 318 26 191 24 127 30Belgium, Dutch-speaking * 1158 714 444 79 7 52 7 27 6 247 21 165 23 82 18 297 26 196 27 101 23 535 46 301 42 234 53Belgium, French-speaking * 902 552 350 73 8 43 8 30 9 261 29 169 31 92 26 241 27 169 31 72 21 327 36 171 31 156 45Bosnia and Herzegovina 404 243 161 2 0 1 0 1 1 46 11 29 12 17 11 177 44 106 44 71 44 116 29 67 28 49 30 63 16 40 16 23 14Denmark 621 389 232 11 2 9 2 2 1 96 15 55 14 41 18 188 30 110 28 78 34 185 30 127 33 58 25 141 23 88 23 53 23Estonia 114 49 65 2 2 0 0 2 3 24 21 8 16 16 25 42 37 21 43 21 32 24 21 9 18 15 23 22 19 11 22 11 17Finland 520 343 177 17 3 9 3 8 5 76 15 46 13 30 17 192 37 124 36 68 38 151 29 111 32 40 23 84 16 53 15 31 18France 11084 7071 4013 133 1 70 1 63 2 964 9 596 8 368 9 2823 25 1763 25 1060 26 2743 25 1851 26 892 22 4421 40 2791 39 1630 41Greece 2455 1621 834 18 1 8 0 10 1 149 6 102 6 47 6 596 24 424 26 172 21 592 24 431 27 161 19 1100 45 656 40 444 53Iceland 24 17 7 0 0 0 0 0 0 7 29 5 29 2 29 7 29 5 29 2 29 6 25 4 24 2 29 4 17 3 18 1 14Norway 514 341 173 12 2 8 2 4 2 67 13 44 13 23 13 158 31 104 30 54 31 139 27 91 27 48 28 138 27 94 28 44 25Romania 3125 1848 1277 22 1 10 1 12 1 385 12 243 13 142 11 1323 42 815 44 508 40 830 27 456 25 374 29 565 18 324 18 241 19Serbia 818 512 297 10 1 8 2 0 0 82 10 58 11 24 8 346 42 213 42 130 44 215 26 134 26 78 26 165 20 99 19 65 22Spain, Andalusia 1037 673 364 22 2 11 2 11 3 124 12 78 12 46 13 361 35 241 36 120 33 268 26 180 27 88 24 262 25 163 24 99 27Spain, Aragon 155 115 40 0 0 0 0 0 0 15 10 11 10 4 10 42 27 32 28 10 25 50 32 41 36 9 23 48 31 31 27 17 43Spain, Asturias 176 121 55 0 0 0 0 0 0 18 10 13 11 5 9 61 35 43 36 18 33 39 22 28 23 11 20 58 33 37 31 21 38Spain, Basque country 265 188 77 3 1 1 1 2 3 22 8 12 6 10 13 89 34 64 34 25 32 90 34 65 35 25 32 61 23 46 24 15 19Spain, Cantabria * 61 48 13 5 8 3 6 2 15 21 34 16 33 5 38 22 36 17 35 5 38 13 21 12 25 1 8Spain, Castile and León * 287 202 85 17 6 8 4 9 11 90 31 71 35 19 22 85 30 66 33 19 22 95 33 57 28 38 45Spain, Castile-La Mancha * 220 144 76 23 10 14 10 9 12 83 38 57 40 26 34 50 23 29 20 21 28 64 29 44 31 20 26Spain, Catalonia 1247 827 420 9 1 8 1 1 0 112 9 72 9 40 10 344 28 220 27 124 30 353 28 248 30 105 25 429 34 279 34 150 36Spain, Extremadura 152 91 61 1 1 0 0 1 2 9 6 6 7 3 5 55 36 37 41 18 30 42 28 22 24 20 33 45 30 26 29 19 31Spain, Galicia 393 271 122 0 0 0 0 0 0 35 9 20 7 15 12 129 33 95 35 34 28 119 30 92 34 27 22 110 28 64 24 46 38Spain, Community of Madrid 807 543 264 16 2 9 2 7 3 73 9 48 9 25 9 240 30 163 30 77 29 231 29 152 28 79 30 247 31 171 31 76 29Spain, Region of Murcia 184 119 65 1 1 0 0 1 2 21 11 15 13 6 9 72 39 40 34 32 49 58 32 41 34 17 26 32 17 23 19 9 14Spain, Navarre * 92 65 27 15 16 11 17 4 15 27 29 20 31 7 26 22 24 14 22 8 30 28 30 20 31 8 30Spain, Valencian region 734 495 239 6 1 3 1 3 1 87 12 56 11 31 13 228 31 152 31 76 32 186 25 127 26 59 25 227 31 157 32 70 29Sweden 1166 774 392 23 2 10 1 13 3 143 12 97 13 46 12 329 28 213 28 116 30 340 29 229 30 111 28 331 28 225 29 106 27Switzerland 848 549 299 17 2 9 2 8 3 81 10 48 9 33 11 249 29 162 30 87 29 248 29 166 30 82 27 253 30 164 30 89 30the Netherlands 1996 1282 714 38 2 18 1 20 3 203 10 131 10 72 10 653 33 408 32 245 34 588 29 371 29 217 30 514 26 354 28 160 22United Kingdom, All countries * ¶ 7534 4696 2838 1115 15 642 14 473 17 2727 36 1664 35 1063 37 1887 25 1180 25 707 25 1805 24 1210 26 595 21United Kingdom, England * ¶ 6323 3978 2345 944 15 549 14 395 17 2256 36 1379 35 877 37 1581 25 1000 25 581 25 1542 24 1050 26 492 21United Kingdom, Northern Ireland * 220 114 106 32 15 10 9 22 21 69 31 35 31 34 32 51 23 26 23 25 24 68 31 43 38 25 24United Kingdom, Scotland 619 366 253 10 2 5 1 5 2 87 14 51 14 36 14 268 43 164 45 104 41 163 26 94 26 69 27 91 15 52 14 39 15United Kingdom, Wales * 382 243 139 52 14 32 13 20 14 134 35 86 35 48 35 92 24 60 25 32 23 104 27 65 27 39 28
Categories may not add up because of missing values or rounding off* Patients younger than 20 years of age are not reported¶ The incidence is underestimated by approximately 4% due to a small number of centres not submitting complete data for 2015
B2 INCIDENT PATIENTS ACCEPTED FOR RRT IN 2015, AT DAY 1
Table B.2.1Incident counts and percentages by age and genderat day 1

All 0-19 20-44 45-64 65-74 75+
All Men Women All Men Women All Men Women All Men Women All Men Women All Men Women
Pmp Pmp Pmp Pmarp Pmarp Pmarp Pmarp Pmarp Pmarp Pmarp Pmarp Pmarp Pmarp Pmarp Pmarp Pmarp Pmarp Pmarp
38
Austria 140.2 186.4 96.0 3.6 3.5 3.7 38.8 54.8 22.5 157.7 206.9 109.3 448.5 652.5 271.7 434.3 682.0 280.9Belgium, Dutch-speaking * 178.9 223.1 135.7 39.2 51.1 27.0 137.2 181.7 92.0 471.5 642.1 311.1 854.9 1192.4 626.7Belgium, French-speaking * 187.9 235.2 142.6 44.9 52.6 37.2 210.6 275.4 147.1 592.0 895.9 329.6 851.3 1215.2 640.9Bosnia and Herzegovina 114.4 140.3 89.5 2.5 2.5 2.6 37.6 46.6 28.3 173.7 213.4 135.9 394.5 519.7 296.8 302.9 498.6 180.0Denmark 108.2 136.3 80.4 8.3 13.2 3.1 52.7 59.6 45.5 123.7 144.2 103.0 291.7 412.0 177.9 325.7 492.0 208.6Estonia 86.7 79.6 92.9 7.4 0 15.2 53.2 34.5 72.8 121.8 130.4 114.2 188.3 180.9 192.9 181.8 321.4 126.8Finland 94.9 127.2 63.6 14.2 14.7 13.6 44.7 52.8 36.2 130.4 169.1 92.0 240.1 372.8 120.8 175.6 293.5 104.1France 166.4 219.1 116.8 8.1 8.3 7.9 47.0 58.6 35.6 163.0 208.9 119.3 434.7 624.4 266.6 726.3 1203.1 432.7Greece 226.9 309.0 149.6 8.6 7.4 9.7 42.3 57.8 26.7 204.7 304.0 113.4 537.4 838.0 274.2 932.6 1323.8 649.2Iceland 72.5 102.3 42.5 0 0 0 60.6 84.7 35.4 86.4 123.6 49.3 235.0 313.8 156.5 202.3 348.1 89.6Norway 99.1 130.6 67.1 9.5 12.4 6.5 38.0 48.5 26.8 119.6 154.2 83.5 288.2 383.0 196.1 380.9 641.6 203.9Romania 159.3 192.9 127.2 5.3 4.7 6.0 56.5 69.3 42.9 248.7 312.7 187.2 456.4 580.0 362.3 363.8 566.1 245.7Serbia 115.3 148.2 81.6 7.2 11.2 0 35.0 48.7 20.8 169.9 215.9 123.8 287.3 399.7 188.9 284.2 432.8 184.7Spain, Andalusia 123.4 162.0 85.7 12.1 11.8 12.5 41.8 51.8 31.5 160.3 215.3 105.9 373.5 532.2 232.0 400.9 632.4 250.1Spain, Aragon 117.2 175.4 60.0 0 0 0 34.8 49.6 19.1 114.6 172.6 55.3 388.8 670.1 133.5 321.3 517.9 189.9Spain, Asturias 167.6 240.9 100.5 0 0 0 55.3 79.2 31.0 190.9 276.1 109.9 330.0 514.4 172.6 432.8 746.0 248.8Spain, Basque country 122.4 179.0 69.1 7.5 4.9 10.3 32.9 35.6 30.2 140.9 205.9 77.9 388.9 600.1 203.1 259.7 516.0 102.9Spain, Cantabria * 104.5 168.2 43.5 26.4 31.2 21.4 122.5 187.9 57.9 380.1 623.9 163.2 210.2 511.5 26.0Spain, Castile and León * 116.4 165.6 68.2 22.7 20.8 24.7 125.0 193.5 53.8 322.3 514.7 140.2 285.6 427.5 190.7Spain, Castile-La Mancha * 107.0 139.3 74.4 32.3 37.9 26.2 152.7 204.2 98.4 293.6 354.4 237.4 307.9 511.4 164.2Spain, Catalonia 166.1 224.0 110.1 5.9 10.2 1.4 42.3 53.5 30.8 174.2 224.9 124.4 512.8 771.9 286.1 637.2 1076.9 362.2Spain, Extremadura 139.1 167.9 110.7 4.8 0 9.8 24.6 32.0 16.8 182.5 240.4 122.1 419.2 463.3 379.4 385.6 564.6 268.9Spain, Galicia 144.1 205.6 86.6 0 0 0 40.2 45.5 34.8 168.1 252.2 87.0 382.8 632.1 163.3 316.4 477.0 215.5Spain, Community of Madrid 125.4 175.9 78.8 12.3 13.5 11.0 31.0 41.3 21.0 140.8 200.6 86.4 413.3 603.2 257.4 474.1 882.4 232.2Spain, Region of Murcia 125.4 161.8 88.8 3.0 0 6.1 38.7 53.3 23.0 196.6 217.5 175.5 516.0 778.1 284.7 298.4 532.5 140.5Spain, Navarre * 144.4 205.8 84.1 71.7 103.3 39.0 154.9 226.4 81.5 365.6 480.8 257.7 450.8 815.9 212.7Spain, Valencian region 147.4 201.2 94.8 6.1 5.9 6.3 50.2 63.2 36.6 169.2 227.6 111.9 384.2 558.2 229.9 527.1 912.4 270.7Sweden 119.0 157.9 80.0 10.3 8.7 12.1 44.6 59.2 29.4 134.8 173.0 96.0 312.1 427.2 200.7 393.7 642.5 216.1Switzerland 102.4 134.0 71.5 10.2 10.5 9.9 28.9 33.8 23.8 107.0 138.4 75.3 311.5 436.2 197.3 369.8 604.9 215.4the Netherlands 117.8 152.7 83.6 9.9 9.2 10.7 38.3 49.2 27.3 136.8 170.5 102.9 335.4 430.8 243.3 397.4 676.6 207.8United Kingdom, All countries * ¶ 115.7 146.4 85.9 51.9 59.7 44.0 163.8 202.9 125.8 297.6 386.7 215.0 342.4 549.8 193.8United Kingdom, England * ¶ 115.4 147.2 84.5 51.9 60.2 43.5 162.5 201.3 124.7 299.1 392.8 212.1 348.4 566.0 191.4United Kingdom, Northern Ireland * 118.8 125.4 112.5 52.6 33.3 71.4 147.3 151.5 143.3 313.6 334.4 294.5 526.3 822.7 324.9United Kingdom, Scotland 115.2 140.2 91.6 8.6 8.4 8.8 49.7 59.2 40.5 181.0 227.7 136.7 298.9 362.4 241.4 207.9 295.0 149.2United Kingdom, Wales * 123.3 159.3 88.3 54.6 66.9 42.2 164.2 215.6 115.1 265.8 356.8 179.8 373.2 554.4 241.6
* Patients younger than 20 years of age are not reported¶ The incidence is underestimated by approximately 4% due to a small number of centres not submitting complete data for 2015
B2 INCIDENT PATIENTS ACCEPTED FOR RRT IN 2015, AT DAY 1
Table B.2.2Incident rates per million (age-related) population by age and gender, unadjustedat day 1

All Men Women
% Mean SD Median % Mean SD Median % Mean SD Median (years) (years) (years) (years) (years) (years)
39
Austria 100 65.0 14.7 67.5 65.0 64.6 14.6 67.1 35.0 65.7 15.0 68.2Belgium, Dutch-speaking * 100 70.6 14.0 74.0 61.7 69.7 14.1 72.0 38.3 72.0 13.8 76.0Belgium, French-speaking * 100 67.8 14.7 69.8 61.2 67.2 13.9 68.9 38.8 68.8 15.8 72.3Bosnia and Herzegovina 100 61.4 13.7 63.2 60.1 61.0 14.1 62.9 39.9 61.9 13.0 63.2Denmark 100 62.3 16.2 66.3 62.6 62.4 16.5 67.0 37.4 62.3 15.8 64.6Estonia 100 58.6 17.3 62.1 43.0 60.8 15.1 61.7 57.0 57.0 18.7 62.5Finland 100 59.6 16.9 62.9 66.0 60.3 16.3 63.7 34.0 58.3 18.0 60.6France 100 67.9 16.4 70.8 63.8 68.2 16.0 70.9 36.2 67.5 17.2 70.8Greece 100 69.6 14.8 72.9 66.0 68.7 14.4 71.3 34.0 71.3 15.4 76.2Iceland 100 57.4 17.1 60.1 70.8 58.0 16.6 62.1 29.2 55.7 19.4 54.2Norway 100 63.0 17.6 67.0 66.3 63.1 17.5 67.2 33.7 62.7 17.8 66.8Romania 100 61.7 14.3 63.3 59.1 61.1 14.3 62.5 40.9 62.4 14.3 64.6Serbia 100 62.4 14.1 64.2 62.6 61.8 14.3 63.9 36.3 63.6 12.8 64.5Spain, Andalusia 100 62.6 15.9 65.5 64.9 62.9 15.4 65.4 35.1 62.1 16.9 66.2Spain, Aragon 100 66.2 13.9 68.7 74.2 65.6 14.0 67.9 25.8 67.9 13.8 73.2Spain, Asturias 100 66.6 14.0 67.8 68.8 66.4 14.0 66.6 31.3 67.1 14.0 69.2Spain, Basque country 100 64.8 14.1 67.6 70.9 65.8 13.4 68.1 29.1 62.6 15.5 66.4Spain, Cantabria * 100 65.6 12.1 68.0 78.7 66.3 12.4 68.1 21.3 62.8 10.8 63.6Spain, Castile and León * 100 67.4 13.2 69.5 70.4 67.1 11.7 68.5 29.6 68.2 16.1 72.4Spain, Castile-La Mancha * 100 64.0 14.4 66.3 65.5 64.4 13.9 65.7 34.5 63.2 15.4 66.6Spain, Catalonia 100 66.9 15.0 69.9 66.3 66.9 14.9 69.6 33.7 67.0 15.0 70.7Spain, Extremadura 100 66.2 12.9 67.5 59.9 66.3 12.2 66.3 40.1 66.1 14.0 69.7Spain, Galicia 100 65.6 14.0 68.4 69.0 65.2 13.2 67.8 31.0 66.6 15.5 69.4Spain, Community of Madrid 100 65.2 16.0 68.2 67.3 65.6 15.6 68.5 32.7 64.2 16.7 67.4Spain, Region of Murcia 100 62.3 13.5 64.8 64.7 63.5 13.6 67.0 35.3 60.1 13.3 60.5Spain, Navarre * 100 63.6 16.3 66.2 70.7 63.3 16.3 66.3 29.3 64.4 16.6 66.1Spain, Valencian region 100 64.8 15.5 68.2 67.4 65.3 15.3 68.7 32.6 64.0 15.9 67.2Sweden 100 63.7 16.6 68.1 66.4 64.1 16.4 68.3 33.6 63.0 17.2 67.1Switzerland 100 64.6 16.8 68.5 64.7 65.0 16.2 68.5 35.3 63.8 17.9 68.8the Netherlands 100 63.7 15.9 66.6 64.2 64.4 15.6 67.2 35.8 62.5 16.4 66.2United Kingdom, All countries * 100 62.3 15.5 64.5 62.3 63.1 15.3 65.3 37.7 60.9 15.7 62.9United Kingdom, England * 100 62.3 15.6 64.7 62.9 63.2 15.4 65.7 37.1 60.9 15.8 62.9United Kingdom, Northern Ireland * 100 63.5 16.5 67.7 51.8 66.2 15.7 70.3 48.2 60.5 16.8 62.3United Kingdom, Scotland 100 59.6 15.5 61.3 59.1 59.6 15.3 61.1 40.9 59.6 15.8 62.6United Kingdom, Wales * 100 63.3 15.3 65.4 63.6 63.6 15.3 65.9 36.4 62.8 15.4 65.1
Categories may not add up because of missing values or rounding off* Patients younger than 20 years of age are not reported
B2 INCIDENT PATIENTS ACCEPTED FOR RRT IN 2015, AT DAY 1
Table B.2.3Gender, mean age, and median age of incident patientsat day 1

Pmp Pmp Pmp
All Men Women
40
Austria 134.5 177.0 94.0Belgium, Dutch-speaking * 161.8 197.8 127.5Belgium, French-speaking * 196.9 246.8 149.2Bosnia and Herzegovina 119.4 147.9 92.1Denmark 105.7 130.2 82.2Estonia 85.7 82.4 88.9Finland 89.5 118.2 62.1France 160.2 207.4 115.2Greece 194.0 258.8 132.2Iceland 81.4 114.6 49.8Norway 104.7 136.9 73.9Romania 156.7 193.8 121.4Serbia 103.0 134.5 73.0Spain, Andalusia 127.3 166.9 89.5Spain, Aragon 105.4 158.1 55.2Spain, Asturias 133.0 187.7 80.9Spain, Basque country 107.0 153.9 62.3Spain, Cantabria * 94.7 151.6 40.4Spain, Castile and León * 94.1 133.8 56.3Spain, Castile-La Mancha * 104.6 134.4 76.2Spain, Catalonia 161.9 217.1 109.3Spain, Extremadura 130.3 155.0 106.8Spain, Galicia 119.7 170.1 71.6Spain, Community of Madrid 130.6 182.3 81.3Spain, Region of Murcia 137.1 178.4 97.8Spain, Navarre * 138.2 193.3 85.6Spain, Valencian region 140.9 190.7 93.4Sweden 113.6 147.9 80.8Switzerland 99.6 128.5 72.1the Netherlands 114.0 145.4 84.1United Kingdom, All countries * ¶ 116.9 145.5 89.7United Kingdom, England * ¶ 117.1 146.9 88.8United Kingdom, Northern Ireland * 128.9 133.4 124.7United Kingdom, Scotland 112.1 135.0 90.2United Kingdom, Wales * 118.1 149.6 88.0
* Patients younger than 20 years of age are not reported¶ The incidence is underestimated by approximately 4% due to a small number of centres not submitting complete data for 2015
B2 INCIDENT PATIENTS ACCEPTED FOR RRT IN 2015, AT DAY 1
Table B.2.4Incident rates per million population, adjustedat day 1, adjusted for age and gender

All GN PN PKD DM HT RVD Misc Unkn Missing
Type I Type II Both
Pmp % Pmp % Pmp % Pmp % Pmp % Pmp % Pmp % Pmp % Pmp % Pmp % Pmp % Pmp %
41
Austria 140.2 100 15.1 10.8 5.5 3.9 7.2 5.1 2.9 2.1 33.9 24.2 36.8 26.2 17.4 12.4 15.4 11.0 26.4 18.9 16.4 11.7 0 0Belgium, Dutch-speaking * 178.9 100 18.1 10.1 7.0 3.9 8.8 4.9 4.3 2.4 31.8 17.8 36.2 20.2 19.3 10.8 11.0 6.1 64.0 35.8 14.7 8.2 0 0Belgium, French-speaking * 187.9 100 17.3 9.2 9.2 4.9 6.5 3.4 4.0 2.1 37.1 19.7 41.0 21.8 33.7 18.0 1.2 0.7 59.4 31.6 19.6 10.4 0 0Bosnia and Herzegovina 114.4 100 12.5 10.9 12.5 10.9 3.4 3.0 10.2 8.9 24.4 21.3 34.5 30.2 14.2 12.4 2.0 1.7 21.5 18.8 13.9 12.1 0 0Denmark 108.2 100 11.8 11.0 5.4 5.0 7.5 6.9 8.2 7.6 23.0 21.3 31.2 28.8 14.5 13.4 0.9 0.8 16.7 15.5 20.2 18.7 0 0Estonia 86.7 100 16.7 19.3 6.8 7.9 1.5 1.8 17.5 20.2 0 0 17.5 20.2 22.8 26.3 1.5 1.8 19.8 22.8 0 0 0 0Finland 94.9 100 11.1 11.7 4.7 5.0 10.8 11.3 15.0 15.8 17.3 18.3 32.3 34.0 4.7 5.0 0.9 1.0 18.8 19.8 11.5 12.1 0 0France 166.4 100 20.4 12.3 7.9 4.8 9.1 5.4 37.7 22.7 42.3 25.4 1.7 1.0 23.8 14.3 22.9 13.8 0.6 0.3Greece 226.9 100 17.7 7.8 9.4 4.2 7.4 3.3 5.1 2.2 54.6 24.1 59.7 26.3 21.9 9.7 3.0 1.3 22.3 9.8 85.6 37.7 0 0Iceland 72.5 100 12.1 16.7 0 0 15.1 20.8 6.0 8.3 9.1 12.5 15.1 20.8 9.1 12.5 3.0 4.2 18.1 25.0 0 0 0 0Norway 99.1 100 11.9 12.1 4.8 4.9 9.3 9.3 4.6 4.7 12.7 12.8 17.3 17.5 29.3 29.6 1.2 1.2 23.1 23.3 2.1 2.1 0 0Romania 159.3 100 19.3 12.1 6.3 3.9 3.4 2.1 18.1 11.4 10.4 6.5 1.0 0.6 27.9 17.5 71.9 45.1 1.0 0.6Serbia 115.3 100 9.2 7.9 11.6 10.0 4.5 3.9 9.9 8.6 16.2 14.1 26.1 22.6 33.3 28.9 2.7 2.3 14.1 12.2 13.8 12.0 0.1 0.1Spain, Andalusia 123.4 100 15.7 12.7 7.5 6.1 7.5 6.1 31.3 25.4 12.1 9.8 0.5 0.4 20.8 16.9 28.0 22.7 0 0Spain, Aragon 117.2 100 3.0 2.6 3.0 2.6 0.8 0.6 0 0 4.5 3.9 4.5 3.9 2.3 1.9 0.8 0.6 2.3 1.9 100.6 85.8 0 0Spain, Asturias 167.6 100 21.0 12.5 1.9 1.1 9.5 5.7 5.7 3.4 37.1 22.2 42.9 25.6 28.6 17.0 3.8 2.3 23.8 14.2 30.5 18.2 5.7 3.4Spain, Basque country 122.4 100 17.1 14.0 2.8 2.3 9.7 7.9 2.8 2.3 24.0 19.6 26.8 21.9 23.6 19.2 2.8 2.3 18.0 14.7 21.7 17.7 0 0Spain, Cantabria * 104.5 100 18.8 18.0 3.4 3.3 6.8 6.6 0 0 27.4 26.2 27.4 26.2 3.4 3.3 13.7 13.1 15.4 14.8 8.6 8.2 6.8 6.6Spain, Castile and León * ‡ 116.4 100 19.5 16.7 6.1 5.2 6.1 5.2 2.4 2.1 26.4 22.6 28.8 24.7 22.3 19.2 0 0 15.0 12.9 18.7 16.0 0 0Spain, Castile-La Mancha * 107.0 100 19.9 18.6 13.1 12.3 8.8 8.2 22.9 21.4 7.3 6.8 4.4 4.1 11.7 10.9 19.0 17.7 0 0Spain, Catalonia 166.1 100 16.5 9.9 8.9 5.4 10.0 6.0 3.5 2.1 24.6 14.8 28.4 17.1 13.3 8.0 4.8 2.9 18.6 11.2 65.5 39.5 0 0Spain, Extremadura 139.1 100 19.2 13.8 6.4 4.6 11.9 8.6 31.1 22.4 18.3 13.2 3.7 2.6 13.7 9.9 33.9 24.3 0.9 0.7Spain, Galicia 144.1 100 18.7 13.0 5.1 3.6 12.8 8.9 5.9 4.1 32.3 22.4 38.1 26.5 18.3 12.7 7.0 4.8 16.9 11.7 27.1 18.8 0 0Spain, Community of Madrid 125.4 100 13.8 11.0 4.7 3.7 9.2 7.3 2.8 2.2 30.9 24.7 33.7 26.9 18.3 14.6 1.6 1.2 23.0 18.3 21.1 16.9 0 0Spain, Region of Murcia 125.4 100 27.3 21.7 8.9 7.1 10.9 8.7 25.2 20.1 9.5 7.6 3.4 2.7 19.1 15.2 21.1 16.8 0 0Spain, Navarre * 144.4 100 12.6 8.7 4.7 3.3 9.4 6.5 3.1 2.2 22.0 15.2 25.1 17.4 22.0 15.2 4.7 3.3 39.2 27.2 26.7 18.5 0 0Spain, Valencian region 147.4 100 20.5 13.9 7.4 5.0 9.4 6.4 29.5 20.0 25.3 17.2 8.8 6.0 17.9 12.1 28.5 19.3 0 0Sweden ‡ 119.0 100 17.0 14.3 3.6 3.0 7.6 6.3 8.7 7.3 22.6 19.0 31.2 26.2 18.7 15.7 0.7 0.6 26.8 22.6 13.4 11.2 0 0Switzerland 102.4 100 14.7 14.4 1.6 1.5 6.9 6.7 2.5 2.5 16.2 15.8 18.7 18.3 17.9 17.5 3.1 3.1 24.8 24.2 8.7 8.5 6.0 5.9the Netherlands 117.8 100 10.4 8.9 4.0 3.4 4.7 4.0 3.8 3.2 18.4 15.6 22.1 18.8 13.8 11.7 13.4 11.4 20.0 16.9 10.7 9.1 18.6 15.8United Kingdom, All countries * ¶ 115.7 100 14.7 12.7 7.3 6.3 7.4 6.4 28.8 24.9 7.1 6.1 2.3 2.0 21.8 18.8 15.1 13.0 11.2 9.7United Kingdom, England * ¶ 115.4 100 13.9 12.0 7.2 6.2 7.1 6.2 28.2 24.5 7.6 6.6 2.4 2.1 20.9 18.1 15.3 13.3 12.9 11.2United Kingdom, Northern Ireland * 118.8 100 17.8 15.0 10.3 8.6 7.0 5.9 27.5 23.2 5.9 5.0 0.5 0.5 21.6 18.2 16.7 14.1 11.3 9.5United Kingdom, Scotland 115.2 100 17.7 15.3 6.7 5.8 10.2 8.9 32.2 27.9 4.8 4.2 2.0 1.8 28.5 24.7 13.0 11.3 0 0United Kingdom, Wales * 123.3 100 24.2 19.6 9.4 7.6 7.4 6.0 33.6 27.2 3.5 2.9 2.3 1.8 28.1 22.8 14.2 11.5 0.6 0.5
Abbreviations used: GN: glomerulonephritis/sclerosis; PN: pyelonephritis; PKD: polycystic kidneys, adult type; DM: diabetes mellitus; HT: hypertension; RVD: renal vascular disease; Misc: miscellaneous; Unkn: unknownCategories may not add up because of rounding off or a limited number of cases (<10%) with diabetes mellitus type unknown; When cells are left empty, (complete) data are unavailable* Patients younger than 20 years of age are not reported‡ Mapping the 2012 Primary Renal Disease (PRD) codes to the old PRD codes results in a different distribution of PRD groups¶ The incidence is underestimated by approximately 4% due to a small number of centres not submitting complete data for 2015
B2 INCIDENT PATIENTS ACCEPTED FOR RRT IN 2015, AT DAY 1
Table B.2.5Incident rates per million population and percentages by primary renal disease, unadjustedat day 1

All GN PN PKD DM HT RVD Misc Unkn Missing
Type I Type II Both
Pmp Pmp Pmp Pmp Pmp Pmp Pmp Pmp Pmp Pmp Pmp Pmp
42
B2 INCIDENT PATIENTS ACCEPTED FOR RRT IN 2015, AT DAY 1
Table B.2.6Incident rates per million population by primary renal disease, adjustedat day 1, adjusted for age and gender
Austria 134.5 14.5 5.3 6.9 2.9 32.5 35.4 16.4 14.6 25.7 15.7 0Belgium, Dutch-speaking * 161.8 16.8 6.6 8.3 4.1 28.6 32.7 17.2 9.2 57.6 13.4 0Belgium, French-speaking * 196.9 17.8 9.5 6.5 4.1 39.5 43.7 35.2 1.4 62.9 19.8 0Bosnia and Herzegovina 119.4 12.4 13.7 3.3 10.0 24.7 34.8 15.9 2.2 22.5 14.5 0Denmark 105.7 12.1 5.2 7.3 8.2 21.7 30.0 13.7 0.9 16.5 20.0 0Estonia 85.7 16.6 6.7 1.3 16.6 0 16.6 23.5 1.4 19.5 0 0Finland 89.5 10.5 4.4 10.1 15.8 15.1 30.9 4.6 0.8 17.4 10.6 0France 160.2 20.5 7.7 9.1 36.8 38.9 1.6 23.4 21.6 0.6Greece 194.0 16.4 8.0 7.1 5.0 46.3 51.3 18.0 2.5 19.6 71.2 0Iceland 81.4 13.1 0 17.9 5.9 10.3 16.2 10.0 3.0 21.3 0 0Norway 104.7 12.4 4.8 9.9 4.8 13.5 18.3 32.1 1.2 23.7 2.2 0Romania 156.7 19.0 6.2 3.4 17.7 10.3 1.0 27.6 70.5 1.1Serbia 103.0 8.5 10.6 4.1 8.4 13.7 22.1 30.2 2.2 12.6 12.5 0.2Spain, Andalusia 127.3 15.8 7.7 7.4 32.4 12.7 0.5 21.5 29.1 0Spain, Aragon 105.4 2.9 2.6 0.7 0 3.8 3.8 2.1 0.8 2.1 90.5 0Spain, Asturias 133.0 17.9 1.4 7.8 5.0 29.3 34.3 21.6 2.9 19.8 22.4 5.0Spain, Basque country 107.0 15.8 2.3 8.8 2.5 21.0 23.5 19.6 2.3 16.3 18.5 0Spain, Cantabria * 94.7 17.5 3.0 6.1 0 23.7 23.7 3.3 13.1 13.5 8.7 5.8Spain, Castile and León * ‡ 94.1 16.3 5.4 5.2 2.3 20.9 23.2 16.5 0 12.3 15.2 0Spain, Castile-La Mancha * 104.6 19.7 12.8 8.8 23.1 6.6 4.1 11.7 17.9 0Spain, Catalonia 161.9 16.2 8.7 9.8 3.3 24.6 28.2 12.6 4.5 18.6 63.2 0Spain, Extremadura 130.3 19.0 6.5 11.4 29.1 17.2 3.2 12.7 30.4 0.8Spain, Galicia 119.7 16.3 4.2 11.3 5.4 26.6 32.0 14.3 5.4 14.6 21.6 0Spain, Community of Madrid 130.6 14.3 4.8 9.1 2.7 33.0 35.7 19.0 1.6 24.0 22.0 0Spain, Region of Murcia 137.1 28.7 9.8 11.8 28.2 11.1 4.1 21.0 22.5 0Spain, Navarre * 138.2 12.5 4.6 8.6 3.0 21.0 24.0 19.8 4.5 38.2 25.9 0Spain, Valencian region 140.9 19.9 7.1 8.9 28.1 23.9 8.3 17.7 27.0 0Sweden ‡ 113.6 17.0 3.3 7.8 8.7 20.4 29.1 17.1 0.7 26.0 12.7 0Switzerland 99.6 14.4 1.6 6.6 2.4 15.7 18.1 17.3 3.1 24.3 8.5 5.8the Netherlands 114.0 10.1 3.9 4.6 3.9 17.4 21.3 13.7 12.9 19.3 10.3 17.9United Kingdom, All countries * ¶ 116.9 15.0 7.3 7.6 29.2 7.1 2.2 22.0 15.2 11.3United Kingdom, England * ¶ 117.1 14.2 7.2 7.4 28.8 7.6 2.3 21.2 15.4 13.1United Kingdom, Northern Ireland * 128.9 19.0 10.9 7.3 29.7 6.7 0.6 23.3 18.7 12.6United Kingdom, Scotland 112.1 17.3 6.7 10.0 31.3 4.5 1.9 27.6 12.8 0United Kingdom, Wales * 118.1 24.0 8.7 7.6 32.1 3.6 1.9 26.6 13.2 0.5
Abbreviations used: GN: glomerulonephritis/sclerosis; PN: pyelonephritis; PKD: polycystic kidneys, adult type; DM: diabetes mellitus; HT: hypertension; RVD: renal vascular disease; Misc: miscellaneous; Unkn: unknownCategories may not add up because of rounding off or a limited number of cases (<10%) with diabetes mellitus type unknown; When cells are left empty, (complete) data are unavailable* Patients younger than 20 years of age are not reported‡ Mapping the 2012 Primary Renal Disease (PRD) codes to the old PRD codes results in a different distribution of PRD groups¶ The incidence is underestimated by approximately 4% due to a small number of centres not submitting complete data for 2015

All Haemodialysis Peritoneal dialysis Transplant Unkn Missing
HD HD HD HF HDF Total APD CAPD PD Total Living Deceased Tx Total hospital/ home type HD/ type PD type Tx centre Unkn HF/HDF Unkn Unkn
N N N N N N N N N N N N N N N N N
43
B2 INCIDENT PATIENTS ACCEPTED FOR RRT IN 2015, AT DAY 1
Table B.2.7Incident counts by treatment modalityat day 1
Austria 1204 954 0 50 8 67 1079 26 66 5 97 16 12 0 28 0 0Belgium, Dutch-speaking * 1158 836 2 0 3 202 1043 34 68 0 102 4 9 0 13 0 0Belgium, French-speaking * 902 602 4 0 9 173 788 30 65 0 95 10 9 0 19 0 0Bosnia and Herzegovina 404 381 0 0 0 7 388 0 16 0 16 0 0 0 0 0 0Denmark & 621 372 0 0 372 77 108 0 185 29 35 0 64 0 0Estonia 114 87 0 0 0 4 91 17 6 0 23 0 0 0 0 0 0Finland 520 378 12 0 0 6 396 40 80 0 120 2 2 0 4 0 0France 11084 7782 4 16 22 1678 9502 260 873 0 1133 161 288 0 449 0 0Greece 2455 2274 0 0 0 28 2302 43 107 0 150 3 0 0 3 0 0Iceland 24 20 0 0 20 0 1 0 1 3 0 0 3 0 0Norway 514 339 0 0 339 117 117 24 34 0 58 0 0Romania 3125 3021 0 0 3 1 3025 3 71 6 80 6 13 1 20 0 0Serbia 818 698 0 1 0 1 700 4 87 0 91 15 3 0 18 9 0Spain, Andalusia 1037 828 0 0 828 156 156 30 23 0 53 0 0Spain, Aragon 155 109 0 0 12 121 1 31 0 32 2 0 0 2 0 0Spain, Asturias 176 136 0 0 1 137 10 26 0 36 2 1 0 3 0 0Spain, Basque country 265 184 0 0 184 2 61 0 63 15 3 0 18 0 0Spain, Cantabria * 61 47 0 0 47 0 12 0 12 0 2 0 2 0 0Spain, Castile and León * 287 231 0 0 231 16 35 0 51 0 5 0 5 0 0Spain, Castile-La Mancha * 220 171 0 0 171 8 39 0 47 2 2 0 0Spain, Catalonia 1247 777 0 0 211 988 31 134 0 165 68 26 0 94 0 0Spain, Extremadura 152 134 0 0 134 8 10 0 18 0 0 0 0 0 0Spain, Galicia 393 289 1 0 0 1 291 8 70 0 78 23 1 0 24 0 0Spain, Community of Madrid 807 651 0 0 651 37 81 0 118 12 26 0 38 0 0Spain, Region of Murcia 184 149 0 0 0 2 151 3 27 0 30 1 2 0 3 0 0Spain, Navarre * 92 53 2 0 55 20 8 0 28 2 7 0 9 0 0Spain, Valencian region 734 566 2 0 568 11 135 0 146 8 12 0 20 0 0Sweden 1166 740 1 0 741 356 356 40 29 0 69 0 0Switzerland 848 639 3 7 0 0 649 40 100 6 146 38 15 0 53 0 0the Netherlands 1996 1431 0 0 1431 56 262 0 318 221 26 0 247 0 0United Kingdom, All countries * ¶ 7534 4829 17 5 12 643 5506 565 858 29 1452 263 274 39 576 0 0United Kingdom, England * ¶ 6323 3946 12 5 10 622 4595 474 748 25 1247 200 242 39 481 0 0United Kingdom, Northern Ireland * 220 145 1 0 0 1 147 28 7 4 39 29 5 0 34 0 0United Kingdom, Scotland 619 476 0 0 476 40 54 0 94 24 25 0 49 0 0United Kingdom, Wales * 382 268 4 0 2 20 294 24 49 0 73 11 4 0 15 0 0
Abbreviations used: HD: haemodialysis; Unkn: unknown; HF: haemofiltration; HDF: haemodiafiltration; APD: automated peritoneal dialysis; CAPD: continuous ambulatory peritoneal dialysis; PD: peritoneal dialysis; Tx: transplantWhen cells are left empty, (complete) data are unavailable* Patients younger than 20 years of age are not reported& No distinction is made between HD and HDF¶ The incidence is underestimated by approximately 4% due to a small number of centres not submitting complete data for 2015
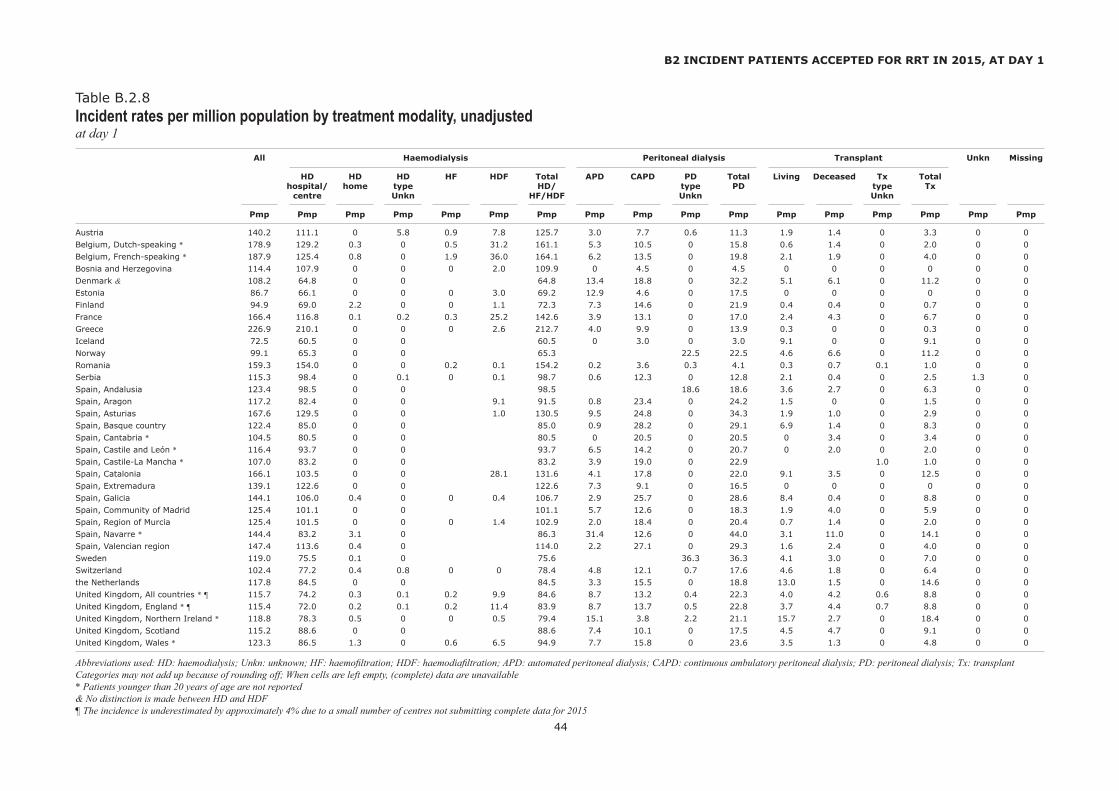
All Haemodialysis Peritoneal dialysis Transplant Unkn Missing
HD HD HD HF HDF Total APD CAPD PD Total Living Deceased Tx Total hospital/ home type HD/ type PD type Tx centre Unkn HF/HDF Unkn Unkn
Pmp Pmp Pmp Pmp Pmp Pmp Pmp Pmp Pmp Pmp Pmp Pmp Pmp Pmp Pmp Pmp Pmp
44
B2 INCIDENT PATIENTS ACCEPTED FOR RRT IN 2015, AT DAY 1
Table B.2.8Incident rates per million population by treatment modality, unadjustedat day 1
Austria 140.2 111.1 0 5.8 0.9 7.8 125.7 3.0 7.7 0.6 11.3 1.9 1.4 0 3.3 0 0Belgium, Dutch-speaking * 178.9 129.2 0.3 0 0.5 31.2 161.1 5.3 10.5 0 15.8 0.6 1.4 0 2.0 0 0Belgium, French-speaking * 187.9 125.4 0.8 0 1.9 36.0 164.1 6.2 13.5 0 19.8 2.1 1.9 0 4.0 0 0Bosnia and Herzegovina 114.4 107.9 0 0 0 2.0 109.9 0 4.5 0 4.5 0 0 0 0 0 0Denmark & 108.2 64.8 0 0 64.8 13.4 18.8 0 32.2 5.1 6.1 0 11.2 0 0Estonia 86.7 66.1 0 0 0 3.0 69.2 12.9 4.6 0 17.5 0 0 0 0 0 0Finland 94.9 69.0 2.2 0 0 1.1 72.3 7.3 14.6 0 21.9 0.4 0.4 0 0.7 0 0France 166.4 116.8 0.1 0.2 0.3 25.2 142.6 3.9 13.1 0 17.0 2.4 4.3 0 6.7 0 0Greece 226.9 210.1 0 0 0 2.6 212.7 4.0 9.9 0 13.9 0.3 0 0 0.3 0 0Iceland 72.5 60.5 0 0 60.5 0 3.0 0 3.0 9.1 0 0 9.1 0 0Norway 99.1 65.3 0 0 65.3 22.5 22.5 4.6 6.6 0 11.2 0 0Romania 159.3 154.0 0 0 0.2 0.1 154.2 0.2 3.6 0.3 4.1 0.3 0.7 0.1 1.0 0 0Serbia 115.3 98.4 0 0.1 0 0.1 98.7 0.6 12.3 0 12.8 2.1 0.4 0 2.5 1.3 0Spain, Andalusia 123.4 98.5 0 0 98.5 18.6 18.6 3.6 2.7 0 6.3 0 0Spain, Aragon 117.2 82.4 0 0 9.1 91.5 0.8 23.4 0 24.2 1.5 0 0 1.5 0 0Spain, Asturias 167.6 129.5 0 0 1.0 130.5 9.5 24.8 0 34.3 1.9 1.0 0 2.9 0 0Spain, Basque country 122.4 85.0 0 0 85.0 0.9 28.2 0 29.1 6.9 1.4 0 8.3 0 0Spain, Cantabria * 104.5 80.5 0 0 80.5 0 20.5 0 20.5 0 3.4 0 3.4 0 0Spain, Castile and León * 116.4 93.7 0 0 93.7 6.5 14.2 0 20.7 0 2.0 0 2.0 0 0Spain, Castile-La Mancha * 107.0 83.2 0 0 83.2 3.9 19.0 0 22.9 1.0 1.0 0 0Spain, Catalonia 166.1 103.5 0 0 28.1 131.6 4.1 17.8 0 22.0 9.1 3.5 0 12.5 0 0Spain, Extremadura 139.1 122.6 0 0 122.6 7.3 9.1 0 16.5 0 0 0 0 0 0Spain, Galicia 144.1 106.0 0.4 0 0 0.4 106.7 2.9 25.7 0 28.6 8.4 0.4 0 8.8 0 0Spain, Community of Madrid 125.4 101.1 0 0 101.1 5.7 12.6 0 18.3 1.9 4.0 0 5.9 0 0Spain, Region of Murcia 125.4 101.5 0 0 0 1.4 102.9 2.0 18.4 0 20.4 0.7 1.4 0 2.0 0 0Spain, Navarre * 144.4 83.2 3.1 0 86.3 31.4 12.6 0 44.0 3.1 11.0 0 14.1 0 0Spain, Valencian region 147.4 113.6 0.4 0 114.0 2.2 27.1 0 29.3 1.6 2.4 0 4.0 0 0Sweden 119.0 75.5 0.1 0 75.6 36.3 36.3 4.1 3.0 0 7.0 0 0Switzerland 102.4 77.2 0.4 0.8 0 0 78.4 4.8 12.1 0.7 17.6 4.6 1.8 0 6.4 0 0the Netherlands 117.8 84.5 0 0 84.5 3.3 15.5 0 18.8 13.0 1.5 0 14.6 0 0United Kingdom, All countries * ¶ 115.7 74.2 0.3 0.1 0.2 9.9 84.6 8.7 13.2 0.4 22.3 4.0 4.2 0.6 8.8 0 0United Kingdom, England * ¶ 115.4 72.0 0.2 0.1 0.2 11.4 83.9 8.7 13.7 0.5 22.8 3.7 4.4 0.7 8.8 0 0United Kingdom, Northern Ireland * 118.8 78.3 0.5 0 0 0.5 79.4 15.1 3.8 2.2 21.1 15.7 2.7 0 18.4 0 0United Kingdom, Scotland 115.2 88.6 0 0 88.6 7.4 10.1 0 17.5 4.5 4.7 0 9.1 0 0United Kingdom, Wales * 123.3 86.5 1.3 0 0.6 6.5 94.9 7.7 15.8 0 23.6 3.5 1.3 0 4.8 0 0
Abbreviations used: HD: haemodialysis; Unkn: unknown; HF: haemofiltration; HDF: haemodiafiltration; APD: automated peritoneal dialysis; CAPD: continuous ambulatory peritoneal dialysis; PD: peritoneal dialysis; Tx: transplantCategories may not add up because of rounding off; When cells are left empty, (complete) data are unavailable* Patients younger than 20 years of age are not reported& No distinction is made between HD and HDF¶ The incidence is underestimated by approximately 4% due to a small number of centres not submitting complete data for 2015

All Haemodialysis Peritoneal dialysis Transplant Unkn Missing
HD HD HD HF HDF Total APD CAPD PD Total Living Deceased Tx Total hospital/ home type HD/ type PD type Tx centre Unkn HF/HDF Unkn Unkn
Pmp Pmp Pmp Pmp Pmp Pmp Pmp Pmp Pmp Pmp Pmp Pmp Pmp Pmp Pmp Pmp Pmp
45
B2 INCIDENT PATIENTS ACCEPTED FOR RRT IN 2015, AT DAY 1
Table B.2.9Incident rates per million population by treatment modality, adjustedat day 1, adjusted for age and gender
Austria 134.5 106.6 0 5.5 0.9 7.3 120.4 2.9 7.5 0.5 10.9 1.8 1.3 0 3.1 0 0Belgium, Dutch-speaking * 161.8 115.9 0.3 0 0.5 28.5 145.1 5.0 9.8 0 14.8 0.6 1.3 0 1.9 0 0Belgium, French-speaking * 196.9 131.6 0.9 0 2.0 37.9 172.4 6.5 13.9 0 20.4 2.1 1.9 0 4.0 0 0Bosnia and Herzegovina 119.4 112.9 0 0 0 2.1 115.0 0 4.4 0 4.4 0 0 0 0 0 0Denmark & 105.7 63.1 0 0 63.1 13.3 18.0 0 31.3 5.2 6.0 0 11.3 0 0Estonia 85.7 65.5 0 0 0 2.8 68.3 13.1 4.3 0 17.4 0 0 0 0 0 0Finland 89.5 63.8 2.2 0 0 1.1 67.1 7.4 14.2 0 21.6 0.4 0.4 0 0.8 0 0France 160.2 112.2 0.1 0.2 0.3 24.2 137.0 3.9 12.3 0 16.3 2.5 4.5 0 7.0 0 0Greece 194.0 179.0 0 0 0 2.3 181.3 3.5 8.9 0 12.4 0.3 0 0 0.3 0 0Iceland 81.4 67.4 0 0 67.4 0 3.8 0 3.8 10.3 0 0 10.3 0 0Norway 104.7 69.1 0 0 69.1 24.1 24.1 4.6 6.8 0 11.4 0 0Romania 156.7 151.5 0 0 0.1 0 151.7 0.1 3.6 0.3 4.0 0.3 0.7 0.1 1.0 0 0Serbia 103.0 87.5 0 0.1 0 0.1 87.8 0.4 10.9 0 11.3 2.2 0.5 0 2.7 1.2 0Spain, Andalusia 127.3 102.4 0 0 102.4 18.7 18.7 3.5 2.7 0 6.2 0 0Spain, Aragon 105.4 72.8 0 0 8.2 81.0 0.7 22.0 0 22.7 1.7 0 0 1.7 0 0Spain, Asturias 133.0 101.3 0 0 0.8 102.1 8.5 20.0 0 28.4 1.8 0.7 0 2.5 0 0Spain, Basque country 107.0 73.4 0 0 73.4 0.8 24.2 0 25.1 7.1 1.4 0 8.5 0 0Spain, Cantabria * 94.7 73.4 0 0 73.4 0 18.4 0 18.4 0 2.9 0 2.9 0 0Spain, Castile and León * 94.1 74.2 0 0 74.2 5.7 12.4 0 18.2 0 1.8 0 1.8 0 0Spain, Castile-La Mancha * 104.6 81.5 0 0 81.5 3.8 18.4 0 22.2 1.0 1.0 0 0Spain, Catalonia 161.9 100.3 0 0 27.4 127.6 4.0 17.9 0 21.9 8.9 3.6 0 12.4 0 0Spain, Extremadura 130.3 114.3 0 0 114.3 7.0 9.0 0 16.0 0 0 0 0 0 0Spain, Galicia 119.7 86.0 0.3 0 0 0.3 86.7 3.0 21.6 0 24.7 8.0 0.3 0 8.3 0 0Spain, Community of Madrid 130.6 105.5 0 0 105.5 6.0 13.0 0 19.0 1.9 4.2 0 6.1 0 0Spain, Region of Murcia 137.1 112.3 0 0 0 1.4 113.8 2.1 19.5 0 21.6 0.5 1.3 0 1.8 0 0Spain, Navarre * 138.2 78.1 2.9 0 81.0 30.4 12.2 0 42.6 3.3 11.3 0 14.6 0 0Spain, Valencian region 140.9 108.2 0.4 0 108.6 2.1 26.2 0 28.3 1.6 2.3 0 3.9 0 0Sweden 113.6 71.2 0.1 0 71.3 35.1 35.1 4.2 3.0 0 7.2 0 0Switzerland 99.6 75.2 0.4 0.8 0 0 76.3 4.8 11.6 0.7 17.1 4.4 1.8 0 6.2 0 0the Netherlands 114.0 82.0 0 0 82.0 3.2 14.8 0 18.1 12.5 1.4 0 13.9 0 0United Kingdom, All countries * ¶ 116.9 74.7 0.3 0.1 0.2 9.9 85.1 8.8 13.4 0.4 22.7 4.2 4.3 0.6 9.1 0 0United Kingdom, England * ¶ 117.1 72.9 0.2 0.1 0.2 11.5 84.8 8.8 13.9 0.5 23.2 3.8 4.6 0.7 9.1 0 0United Kingdom, Northern Ireland * 128.9 86.2 0.6 0 0 0.6 87.4 16.4 3.9 2.3 22.6 16.2 2.7 0 18.9 0 0United Kingdom, Scotland 112.1 85.7 0 0 85.7 7.3 9.9 0 17.2 4.5 4.7 0 9.1 0 0United Kingdom, Wales * 118.1 81.6 1.2 0 0.6 6.1 89.5 7.9 15.7 0 23.7 3.6 1.3 0 4.9 0 0
Abbreviations used: HD: haemodialysis; Unkn: unknown; HF: haemofiltration; HDF: haemodiafiltration; APD: automated peritoneal dialysis; CAPD: continuous ambulatory peritoneal dialysis; PD: peritoneal dialysis; Tx: transplantCategories may not add up because of rounding off; When cells are left empty, (complete) data are unavailable* Patients younger than 20 years of age are not reported& No distinction is made between HD and HDF¶ The incidence is underestimated by approximately 4% due to a small number of centres not submitting complete data for 2015

All Haemodialysis Peritoneal dialysis Transplant Unkn Missing
HD HD HD HF HDF Total APD CAPD PD Total Living Deceased Tx Total hospital/ home type HD/ type PD type Tx centre Unkn HF/HDF Unkn Unkn
% % % % % % % % % % % % % % % % %
46
B2 INCIDENT PATIENTS ACCEPTED FOR RRT IN 2015, AT DAY 1
Table B.2.10Percentages of treatment modality, unadjustedat day 1
Austria 100 79.2 0 4.2 0.7 5.6 89.6 2.2 5.5 0.4 8.1 1.3 1.0 0 2.3 0 0Belgium, Dutch-speaking * 100 72.2 0.2 0 0.3 17.4 90.1 2.9 5.9 0 8.8 0.3 0.8 0 1.1 0 0Belgium, French-speaking * 100 66.7 0.4 0 1.0 19.2 87.4 3.3 7.2 0 10.5 1.1 1.0 0 2.1 0 0Bosnia and Herzegovina 100 94.3 0 0 0 1.7 96.0 0 4.0 0 4.0 0 0 0 0 0 0Denmark & 100 59.9 0 0 59.9 12.4 17.4 0 29.8 4.7 5.6 0 10.3 0 0Estonia 100 76.3 0 0 0 3.5 79.8 14.9 5.3 0 20.2 0 0 0 0 0 0Finland 100 72.7 2.3 0 0 1.2 76.2 7.7 15.4 0 23.1 0.4 0.4 0 0.8 0 0France 100 70.2 0 0.1 0.2 15.1 85.7 2.3 7.9 0 10.2 1.5 2.6 0 4.1 0 0Greece 100 92.6 0 0 0 1.1 93.8 1.8 4.4 0 6.1 0.1 0 0 0.1 0 0Iceland 100 83.3 0 0 83.3 0 4.2 0 4.2 12.5 0 0 12.5 0 0Norway 100 66.0 0 0 66.0 22.8 22.8 4.7 6.6 0 11.3 0 0Romania 100 96.7 0 0 0.1 0 96.8 0.1 2.3 0.2 2.6 0.2 0.4 0 0.6 0 0Serbia 100 85.3 0 0.1 0 0.1 85.6 0.5 10.6 0 11.1 1.8 0.4 0 2.2 1.1 0Spain, Andalusia 100 79.8 0 0 79.8 15.0 15.0 2.9 2.2 0 5.1 0 0Spain, Aragon 100 70.3 0 0 7.7 78.1 0.6 20.0 0 20.6 1.3 0 0 1.3 0 0Spain, Asturias 100 77.3 0 0 0.6 77.8 5.7 14.8 0 20.5 1.1 0.6 0 1.7 0 0Spain, Basque country 100 69.4 0 0 69.4 0.8 23.0 0 23.8 5.7 1.1 0 6.8 0 0Spain, Cantabria * 100 77.0 0 0 77.0 0 19.7 0 19.7 0 3.3 0 3.3 0 0Spain, Castile and León * 100 80.5 0 0 80.5 5.6 12.2 0 17.8 0 1.7 0 1.7 0 0Spain, Castile-La Mancha * 100 77.7 0 0 77.7 3.6 17.7 0 21.4 0.9 0.9 0 0Spain, Catalonia 100 62.3 0 0 16.9 79.2 2.5 10.7 0 13.2 5.5 2.1 0 7.5 0 0Spain, Extremadura 100 88.2 0 0 88.2 5.3 6.6 0 11.8 0 0 0 0 0 0Spain, Galicia 100 73.5 0.3 0 0 0.3 74.0 2.0 17.8 0 19.8 5.9 0.3 0 6.1 0 0Spain, Community of Madrid 100 80.7 0 0 80.7 4.6 10.0 0 14.6 1.5 3.2 0 4.7 0 0Spain, Region of Murcia 100 81.0 0 0 0 1.1 82.1 1.6 14.7 0 16.3 0.5 1.1 0 1.6 0 0Spain, Navarre * 100 57.6 2.2 0 59.8 21.7 8.7 0 30.4 2.2 7.6 0 9.8 0 0Spain, Valencian region 100 77.1 0.3 0 77.4 1.5 18.4 0 19.9 1.1 1.6 0 2.7 0 0Sweden 100 63.5 0.1 0 63.6 30.5 30.5 3.4 2.5 0 5.9 0 0Switzerland 100 75.4 0.4 0.8 0 0 76.5 4.7 11.8 0.7 17.2 4.5 1.8 0 6.3 0 0the Netherlands 100 71.7 0 0 71.7 2.8 13.1 0 15.9 11.1 1.3 0 12.4 0 0United Kingdom, All countries * 100 64.1 0.2 0.1 0.2 8.5 73.1 7.5 11.4 0.4 19.3 3.5 3.6 0.5 7.6 0 0United Kingdom, England * 100 62.4 0.2 0.1 0.2 9.8 72.7 7.5 11.8 0.4 19.7 3.2 3.8 0.6 7.6 0 0United Kingdom, Northern Ireland * 100 65.9 0.5 0 0 0.5 66.8 12.7 3.2 1.8 17.7 13.2 2.3 0 15.5 0 0United Kingdom, Scotland 100 76.9 0 0 76.9 6.5 8.7 0 15.2 3.9 4.0 0 7.9 0 0United Kingdom, Wales * 100 70.2 1.0 0 0.5 5.2 77.0 6.3 12.8 0 19.1 2.9 1.0 0 3.9 0 0
Abbreviations used: HD: haemodialysis; Unkn: unknown; HF: haemofiltration; HDF: haemodiafiltration; APD: automated peritoneal dialysis; CAPD: continuous ambulatory peritoneal dialysis; PD: peritoneal dialysis; Tx: transplantCategories may not add up because of rounding off; When cells are left empty, (complete) data are unavailable* Patients younger than 20 years of age are not reported& No distinction is made between HD and HDF

All 0-19 20-44 45-64 65-74 75+ Men Women DM Non DM
HD PD Tx Un HD PD Tx Un HD PD Tx Un HD PD Tx Un HD PD Tx Un HD PD Tx Un HD PD Tx Un HD PD Tx Un HD PD Tx Un HD PD Tx Un
% % % % % % % % % % % % % % % % % % % % % % % % % % % % % % % % % % % % % % % %
47
Austria 90 8 2 0 50 33 17 0 79 13 8 0 87 9 4 0 91 8 1 0 96 4 0 0 89 8 3 0 90 8 2 0 93 6 1 0 89 9 3 0Belgium, Dutch-speaking * 90 9 1 0 80 18 3 0 78 18 4 0 93 7 0 0 96 4 0 0 90 9 2 0 91 9 0 0 93 6 1 0 89 10 1 0Belgium, French-speaking * 87 11 2 0 75 14 11 0 86 11 3 0 88 10 2 0 91 9 0 0 86 13 2 0 90 7 3 0 90 10 0 0 87 11 3 0Bosnia and Herzegovina 96 4 0 0 100 0 0 0 93 7 0 0 94 6 0 0 98 2 0 0 98 2 0 0 97 3 0 0 94 6 0 0 94 6 0 0 97 3 0 0Denmark 60 30 10 0 64 9 27 0 49 26 25 0 57 30 13 0 61 34 6 0 70 29 1 0 60 30 10 0 60 29 10 0 63 31 6 0 59 29 12 0Estonia 80 20 0 0 100 0 0 0 71 29 0 0 81 19 0 0 83 17 0 0 82 18 0 0 76 24 0 0 83 17 0 0 83 17 0 0 79 21 0 0Finland 76 23 1 0 41 53 6 0 68 30 1 0 74 25 1 0 83 17 0 0 83 17 0 0 78 21 1 0 72 27 1 0 75 25 0 0 77 22 1 0France 86 10 4 0 53 27 20 0 76 12 12 0 83 10 8 0 89 8 2 0 89 11 1 0 87 10 4 0 84 11 5 0 89 9 2 0 85 11 5 0Greece 94 6 0 0 44 56 0 0 89 10 1 0 93 7 0 0 94 6 0 0 96 4 0 0 93 7 0 0 95 5 0 0 95 5 0 0 93 6 0 0Iceland 83 4 13 0 0 0 0 0 57 0 43 0 100 0 0 0 83 17 0 0 100 0 0 0 82 6 12 0 86 0 14 0 80 20 0 0 84 0 16 0Norway 66 23 11 0 8 33 58 0 58 24 18 0 64 21 15 0 72 18 10 0 71 28 1 0 69 22 10 0 61 25 14 0 68 26 7 0 66 22 12 0Romania 97 3 1 0 95 5 0 0 93 3 4 0 98 2 0 0 97 3 0 0 98 2 0 0 97 2 1 0 96 3 1 0 97 3 0 0 97 3 1 0Serbia 86 11 2 1 70 20 10 0 62 15 20 4 86 13 0 1 91 9 0 0 91 8 0 1 86 11 2 1 84 12 2 2 85 13 1 1 86 11 3 1Spain, Andalusia 80 15 5 0 55 0 45 0 60 25 15 0 75 20 5 0 86 11 3 0 91 9 0 0 79 16 5 0 80 13 6 0 89 10 2 0 77 17 6 0Spain, Aragon 78 21 1 0 0 0 0 0 67 27 7 0 79 19 2 0 78 22 0 0 81 19 0 0 75 23 2 0 88 13 0 0 67 33 0 0 79 20 1 0Spain, Asturias 78 20 2 0 0 0 0 0 50 39 11 0 80 20 0 0 77 21 3 0 84 16 0 0 77 21 2 0 80 20 0 0 76 24 0 0 79 19 2 0Spain, Basque country 69 24 7 0 0 0 100 0 41 18 41 0 70 26 4 0 74 23 2 0 75 25 0 0 69 27 4 0 70 17 13 0 72 24 3 0 69 24 8 0Spain, Cantabria * 77 20 3 0 60 40 0 0 71 29 0 0 77 14 9 0 92 8 0 0 77 21 2 0 77 15 8 0 75 25 0 0 78 18 4 0Spain, Castile and León * 80 18 2 0 76 24 0 0 63 33 3 0 84 14 2 0 95 5 0 0 81 17 2 0 80 20 0 0 87 13 0 0 78 19 2 0Spain, Castile-La Mancha * 78 21 1 0 52 48 0 0 70 28 2 0 84 16 0 0 92 8 0 0 79 19 1 0 75 25 0 0 87 11 2 0 75 24 1 0Spain, Catalonia 79 13 8 0 33 11 56 0 58 17 25 0 67 20 13 0 83 14 3 0 93 6 1 0 79 14 7 0 80 12 8 0 80 15 6 0 79 13 8 0Spain, Extremadura 88 12 0 0 100 0 0 0 67 33 0 0 82 18 0 0 93 7 0 0 96 4 0 0 87 13 0 0 90 10 0 0 94 6 0 0 86 14 0 0Spain, Galicia 74 20 6 0 0 0 0 0 51 17 31 0 66 26 8 0 79 18 3 0 85 15 0 0 74 20 6 0 74 19 7 0 76 22 2 0 73 19 8 0Spain, Community of Madrid 81 15 5 0 69 0 31 0 75 19 5 0 76 16 8 0 79 18 3 0 89 10 2 0 81 14 5 0 79 17 4 0 84 13 2 0 79 15 6 0Spain, Region of Murcia 82 16 2 0 100 0 0 0 67 24 10 0 75 24 1 0 91 9 0 0 91 9 0 0 83 15 2 0 80 18 2 0 95 3 3 0 79 20 1 0Spain, Navarre * 60 30 10 0 40 27 33 0 52 33 15 0 86 14 0 0 57 43 0 0 68 26 6 0 41 41 19 0 81 6 13 0 55 36 9 0Spain, Valencian region 77 20 3 0 33 33 33 0 60 30 10 0 71 27 2 0 78 19 3 0 91 9 0 0 77 20 3 0 78 19 3 0 86 12 1 0 75 22 3 0Sweden 64 31 6 0 22 43 35 0 50 37 13 0 56 33 11 0 70 29 2 0 73 27 0 0 64 29 6 0 62 33 6 0 69 27 4 0 62 32 7 0Switzerland 77 17 6 0 24 41 35 0 60 22 17 0 68 20 11 0 81 17 2 0 89 11 0 0 76 17 7 0 78 17 6 0 86 14 0 0 74 18 8 0the Netherlands 72 16 12 0 34 26 39 0 60 15 25 0 67 15 19 0 73 17 10 0 84 15 1 0 72 16 12 0 71 16 13 0 78 19 3 0 70 15 15 0United Kingdom, All countries * 73 19 8 0 57 26 17 0 68 21 10 0 79 16 5 0 84 15 0 0 74 19 7 0 72 19 9 0 78 18 4 0 72 20 9 0United Kingdom, England * 73 20 8 0 57 26 17 0 67 22 10 0 79 16 5 0 83 16 1 0 73 20 7 0 71 20 9 0 77 19 4 0 71 20 9 0United Kingdom, Northern Ireland * 67 18 15 0 44 28 28 0 58 19 23 0 67 16 18 0 87 13 0 0 68 18 14 0 66 17 17 0 84 8 8 0 62 21 18 0United Kingdom, Scotland 77 15 8 0 60 10 30 0 61 22 17 0 76 14 10 0 82 15 2 0 88 12 0 0 76 15 8 0 78 15 7 0 79 17 5 0 76 15 9 0United Kingdom, Wales * 77 19 4 0 62 31 8 0 70 25 5 0 80 15 4 0 90 10 0 0 80 16 4 0 72 24 4 0 80 18 2 0 76 19 5 0
Abbreviations used: HD: haemodialysis; PD: peritoneal dialysis; Tx: transplant; Un: unknown; DM: diabetes mellitusCategories may not add up because of missing values or rounding off* Patients younger than 20 years of age are not reported
B2 INCIDENT PATIENTS ACCEPTED FOR RRT IN 2015, AT DAY 1
Table B.2.11Percentages of treatment modality by age, gender, and primary renal disease, unadjustedat day 1

All 0-19 20-44 45-64 65-74 75+
All Men Women All Men Women All Men Women All Men Women All Men Women All Men Women
N (100%) N (100%) N (100%) N % N % N % N % N % N % N % N % N % N % N % N % N % N % N %
48
Austria 1086 720 366 6 1 3 0 3 1 106 10 76 11 30 8 357 33 234 33 123 34 340 31 237 33 103 28 277 26 170 24 107 29Belgium, Dutch-speaking * 1067 657 410 72 7 48 7 24 6 233 22 153 23 80 20 270 25 184 28 86 21 492 46 272 41 220 54Belgium, French-speaking * 822 503 319 65 8 37 7 28 9 244 30 158 31 86 27 227 28 157 31 70 22 286 35 151 30 135 42Bosnia and Herzegovina 395 240 155 2 1 1 0 1 1 44 11 28 12 16 10 173 44 105 44 68 44 114 29 68 28 46 30 62 16 38 16 24 15Denmark † 589 366 223 10 2 8 2 2 1 96 16 55 15 41 18 180 31 109 30 71 32 173 29 115 31 58 26 130 22 80 22 50 22Estonia 107 46 61 2 2 0 0 2 3 24 22 8 17 16 26 36 34 19 41 17 28 26 24 9 20 17 28 19 18 10 22 9 15Finland 507 333 174 16 3 9 3 7 4 74 15 44 13 30 17 189 37 122 37 67 39 144 28 105 32 39 22 84 17 53 16 31 18France † 10296 6583 3713 132 1 69 1 63 2 941 9 584 9 357 10 2702 26 1696 26 1005 27 2563 25 1739 26 824 22 3958 38 2495 38 1463 39Greece 2189 1461 728 16 1 7 0 9 1 149 7 101 7 48 7 544 25 388 27 156 21 549 25 396 27 153 21 931 43 569 39 362 50Iceland 23 16 7 0 0 0 0 0 0 7 30 5 31 2 29 7 30 5 31 2 29 6 26 4 25 2 29 3 13 2 13 1 14Norway 491 321 170 12 2 8 2 4 2 66 13 43 13 23 14 152 31 100 31 52 31 127 26 77 24 50 29 134 27 93 29 41 24Romania 2590 1541 1049 19 1 7 0 12 1 343 13 217 14 126 12 1108 43 688 45 420 40 693 27 378 25 315 30 427 16 251 16 176 17Serbia † 746 469 268 10 1 8 2 0 0 78 10 55 12 23 9 310 42 190 41 117 44 204 27 131 28 70 26 144 19 84 18 58 22Spain, Andalusia † 1012 653 359 22 2 11 2 11 3 127 13 81 12 46 13 346 34 230 35 116 32 263 26 173 26 89 25 254 25 158 24 96 27Spain, Aragon † 148 110 39 0 0 0 0 0 0 15 10 11 10 4 10 41 28 31 28 10 26 46 31 37 34 9 23 47 32 31 28 16 41Spain, Asturias † 165 112 54 0 0 0 0 0 0 18 11 13 12 5 9 60 36 42 38 18 33 36 22 25 22 11 20 51 31 32 29 20 37Spain, Basque country 254 178 76 3 1 1 1 2 3 22 9 12 7 10 13 83 33 58 33 25 33 83 33 61 34 22 29 63 25 46 26 17 22Spain, Cantabria * 54 42 12 4 7 3 7 1 8 19 35 14 33 5 42 18 33 14 33 4 33 13 24 11 26 2 17Spain, Castile and León * 279 197 82 16 6 8 4 8 10 88 32 69 35 19 23 80 29 62 31 18 22 95 34 58 29 37 45Spain, Castile-La Mancha * † 209 141 68 23 11 14 10 9 13 78 37 54 38 23 34 45 22 28 20 17 25 64 31 45 32 19 28Spain, Catalonia † 1188 786 403 9 1 8 1 1 0 111 9 72 9 39 10 333 28 212 27 121 30 330 28 232 30 98 24 405 34 262 33 143 35Spain, Extremadura † 147 88 58 1 1 0 0 1 2 9 6 6 7 3 5 56 38 38 43 18 31 39 27 21 24 19 33 41 28 23 26 18 31Spain, Galicia † 388 267 121 0 0 0 0 0 0 36 9 21 8 15 12 128 33 95 36 33 27 112 29 83 31 30 25 111 29 68 25 43 36Spain, Community of Madrid † 770 519 251 16 2 9 2 7 3 70 9 47 9 24 10 233 30 159 31 74 29 218 28 141 27 76 30 232 30 163 31 69 27Spain, Region of Murcia 179 116 63 1 1 0 0 1 2 20 11 14 12 6 10 69 39 39 34 30 48 56 31 40 34 16 25 33 18 23 20 10 16Spain, Navarre * 88 64 24 14 16 11 17 3 13 27 31 20 31 7 29 20 23 13 20 7 29 27 31 20 31 7 29Spain, Valencian region 708 473 235 6 1 3 1 3 1 85 12 55 12 30 13 220 31 143 30 77 33 180 25 122 26 58 25 217 31 150 32 67 29Sweden 1054 703 351 22 2 10 1 12 3 134 13 90 13 44 13 314 30 205 29 109 31 288 27 197 28 91 26 296 28 201 29 95 27Switzerland † 808 528 280 16 2 9 2 7 3 78 10 45 9 33 12 244 30 161 30 83 30 237 29 163 31 74 26 233 29 149 28 84 30the Netherlands † 1863 1195 667 34 2 17 1 17 3 191 10 124 10 67 10 622 33 395 33 228 34 536 29 336 28 200 30 479 26 323 27 156 23United Kingdom, All countries * † ¶ 7087 4411 2677 1076 15 626 14 450 17 2604 37 1588 36 1016 38 1742 25 1096 25 646 24 1665 23 1101 25 564 21United Kingdom, England * † ¶ 5922 3713 2209 904 15 532 14 372 17 2144 36 1307 35 837 38 1461 25 924 25 537 24 1413 24 950 26 463 21United Kingdom, Northern Ireland * † 207 109 98 32 15 10 9 22 22 68 33 35 32 33 34 40 19 25 23 16 16 67 32 39 36 28 29United Kingdom, Scotland 593 353 240 10 2 5 1 5 2 86 15 50 14 36 15 257 43 158 45 99 41 151 25 87 25 64 27 89 15 53 15 36 15United Kingdom, Wales * † 369 234 135 52 14 32 14 20 15 130 35 83 35 47 35 87 24 57 24 29 21 100 27 61 26 39 29
Categories may not add up because of missing values or rounding off* Patients younger than 20 years of age are not reported† The incident counts at day 91 are estimated (see methods)¶ The incidence is underestimated by approximately 4% due to a small number of centres not submitting complete data for 2015
B3 INCIDENT PATIENTS ACCEPTED FOR RRT IN 2015, AT DAY 91
Table B.3.1Incident counts and percentages by age and genderat day 91
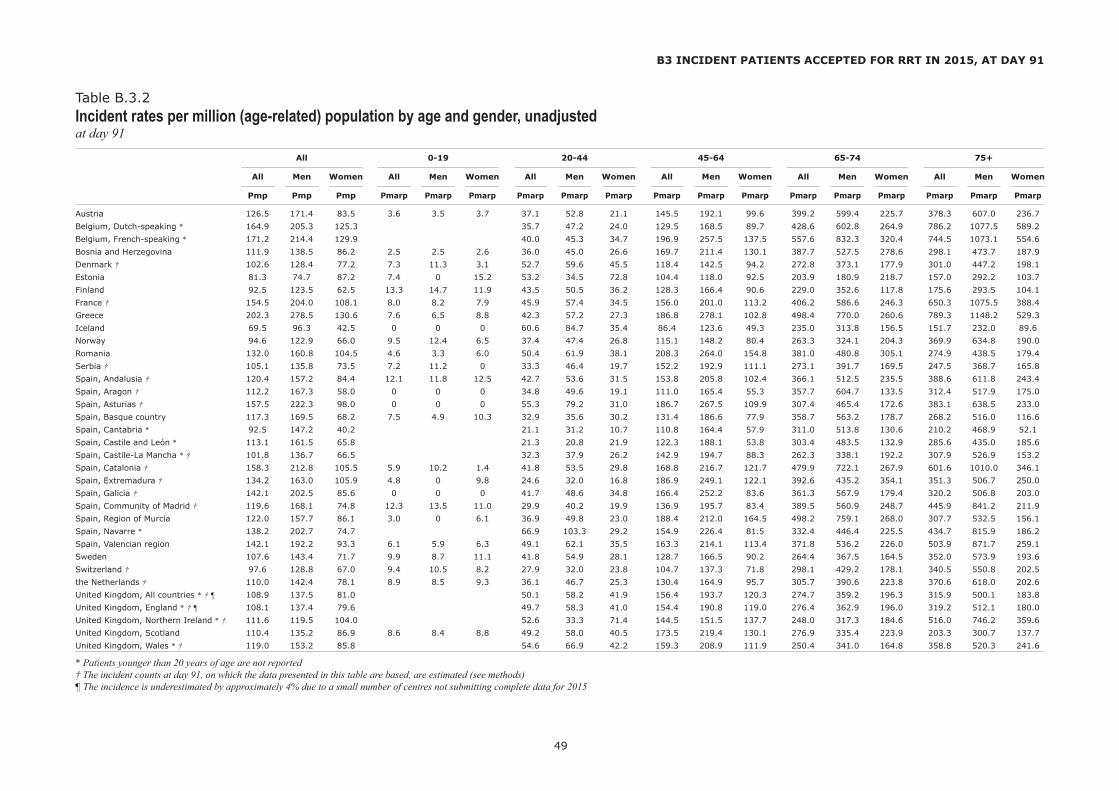
All 0-19 20-44 45-64 65-74 75+
All Men Women All Men Women All Men Women All Men Women All Men Women All Men Women
Pmp Pmp Pmp Pmarp Pmarp Pmarp Pmarp Pmarp Pmarp Pmarp Pmarp Pmarp Pmarp Pmarp Pmarp Pmarp Pmarp Pmarp
49
Austria 126.5 171.4 83.5 3.6 3.5 3.7 37.1 52.8 21.1 145.5 192.1 99.6 399.2 599.4 225.7 378.3 607.0 236.7Belgium, Dutch-speaking * 164.9 205.3 125.3 35.7 47.2 24.0 129.5 168.5 89.7 428.6 602.8 264.9 786.2 1077.5 589.2Belgium, French-speaking * 171.2 214.4 129.9 40.0 45.3 34.7 196.9 257.5 137.5 557.6 832.3 320.4 744.5 1073.1 554.6Bosnia and Herzegovina 111.9 138.5 86.2 2.5 2.5 2.6 36.0 45.0 26.6 169.7 211.4 130.1 387.7 527.5 278.6 298.1 473.7 187.9Denmark † 102.6 128.4 77.2 7.3 11.3 3.1 52.7 59.6 45.5 118.4 142.5 94.2 272.8 373.1 177.9 301.0 447.2 198.1Estonia 81.3 74.7 87.2 7.4 0 15.2 53.2 34.5 72.8 104.4 118.0 92.5 203.9 180.9 218.7 157.0 292.2 103.7Finland 92.5 123.5 62.5 13.3 14.7 11.9 43.5 50.5 36.2 128.3 166.4 90.6 229.0 352.6 117.8 175.6 293.5 104.1France † 154.5 204.0 108.1 8.0 8.2 7.9 45.9 57.4 34.5 156.0 201.0 113.2 406.2 586.6 246.3 650.3 1075.5 388.4Greece 202.3 278.5 130.6 7.6 6.5 8.8 42.3 57.2 27.3 186.8 278.1 102.8 498.4 770.0 260.6 789.3 1148.2 529.3Iceland 69.5 96.3 42.5 0 0 0 60.6 84.7 35.4 86.4 123.6 49.3 235.0 313.8 156.5 151.7 232.0 89.6Norway 94.6 122.9 66.0 9.5 12.4 6.5 37.4 47.4 26.8 115.1 148.2 80.4 263.3 324.1 204.3 369.9 634.8 190.0Romania 132.0 160.8 104.5 4.6 3.3 6.0 50.4 61.9 38.1 208.3 264.0 154.8 381.0 480.8 305.1 274.9 438.5 179.4Serbia † 105.1 135.8 73.5 7.2 11.2 0 33.3 46.4 19.7 152.2 192.9 111.1 273.1 391.7 169.5 247.5 368.7 165.8Spain, Andalusia † 120.4 157.2 84.4 12.1 11.8 12.5 42.7 53.6 31.5 153.8 205.8 102.4 366.1 512.5 235.5 388.6 611.8 243.4Spain, Aragon † 112.2 167.3 58.0 0 0 0 34.8 49.6 19.1 111.0 165.4 55.3 357.7 604.7 133.5 312.4 517.9 175.0Spain, Asturias † 157.5 222.3 98.0 0 0 0 55.3 79.2 31.0 186.7 267.5 109.9 307.4 465.4 172.6 383.1 638.5 233.0Spain, Basque country 117.3 169.5 68.2 7.5 4.9 10.3 32.9 35.6 30.2 131.4 186.6 77.9 358.7 563.2 178.7 268.2 516.0 116.6Spain, Cantabria * 92.5 147.2 40.2 21.1 31.2 10.7 110.8 164.4 57.9 311.0 513.8 130.6 210.2 468.9 52.1Spain, Castile and León * 113.1 161.5 65.8 21.3 20.8 21.9 122.3 188.1 53.8 303.4 483.5 132.9 285.6 435.0 185.6Spain, Castile-La Mancha * † 101.8 136.7 66.5 32.3 37.9 26.2 142.9 194.7 88.3 262.3 338.1 192.2 307.9 526.9 153.2Spain, Catalonia † 158.3 212.8 105.5 5.9 10.2 1.4 41.8 53.5 29.8 168.8 216.7 121.7 479.9 722.1 267.9 601.6 1010.0 346.1Spain, Extremadura † 134.2 163.0 105.9 4.8 0 9.8 24.6 32.0 16.8 186.9 249.1 122.1 392.6 435.2 354.1 351.3 506.7 250.0Spain, Galicia † 142.1 202.5 85.6 0 0 0 41.7 48.6 34.8 166.4 252.2 83.6 361.3 567.9 179.4 320.2 506.8 203.0Spain, Community of Madrid † 119.6 168.1 74.8 12.3 13.5 11.0 29.9 40.2 19.9 136.9 195.7 83.4 389.5 560.9 248.7 445.9 841.2 211.9Spain, Region of Murcia 122.0 157.7 86.1 3.0 0 6.1 36.9 49.8 23.0 188.4 212.0 164.5 498.2 759.1 268.0 307.7 532.5 156.1Spain, Navarre * 138.2 202.7 74.7 66.9 103.3 29.2 154.9 226.4 81.5 332.4 446.4 225.5 434.7 815.9 186.2Spain, Valencian region 142.1 192.2 93.3 6.1 5.9 6.3 49.1 62.1 35.5 163.3 214.1 113.4 371.8 536.2 226.0 503.9 871.7 259.1Sweden 107.6 143.4 71.7 9.9 8.7 11.1 41.8 54.9 28.1 128.7 166.5 90.2 264.4 367.5 164.5 352.0 573.9 193.6Switzerland † 97.6 128.8 67.0 9.4 10.5 8.2 27.9 32.0 23.8 104.7 137.3 71.8 298.1 429.2 178.1 340.5 550.8 202.5the Netherlands † 110.0 142.4 78.1 8.9 8.5 9.3 36.1 46.7 25.3 130.4 164.9 95.7 305.7 390.6 223.8 370.6 618.0 202.6United Kingdom, All countries * † ¶ 108.9 137.5 81.0 50.1 58.2 41.9 156.4 193.7 120.3 274.7 359.2 196.3 315.9 500.1 183.8United Kingdom, England * † ¶ 108.1 137.4 79.6 49.7 58.3 41.0 154.4 190.8 119.0 276.4 362.9 196.0 319.2 512.1 180.0United Kingdom, Northern Ireland * † 111.6 119.5 104.0 52.6 33.3 71.4 144.5 151.5 137.7 248.0 317.3 184.6 516.0 746.2 359.6United Kingdom, Scotland 110.4 135.2 86.9 8.6 8.4 8.8 49.2 58.0 40.5 173.5 219.4 130.1 276.9 335.4 223.9 203.3 300.7 137.7United Kingdom, Wales * † 119.0 153.2 85.8 54.6 66.9 42.2 159.3 208.9 111.9 250.4 341.0 164.8 358.8 520.3 241.6
* Patients younger than 20 years of age are not reported† The incident counts at day 91, on which the data presented in this table are based, are estimated (see methods)¶ The incidence is underestimated by approximately 4% due to a small number of centres not submitting complete data for 2015
B3 INCIDENT PATIENTS ACCEPTED FOR RRT IN 2015, AT DAY 91
Table B.3.2Incident rates per million (age-related) population by age and gender, unadjustedat day 91
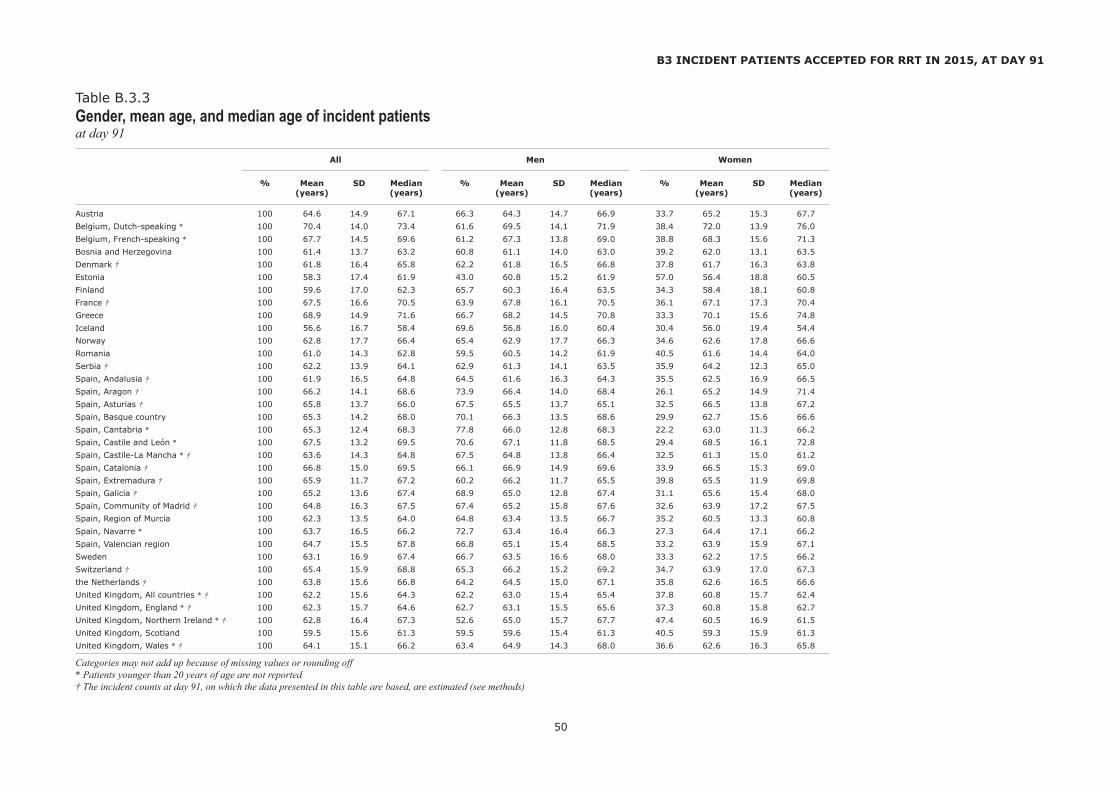
All Men Women
% Mean SD Median % Mean SD Median % Mean SD Median (years) (years) (years) (years) (years) (years)
50
Austria 100 64.6 14.9 67.1 66.3 64.3 14.7 66.9 33.7 65.2 15.3 67.7Belgium, Dutch-speaking * 100 70.4 14.0 73.4 61.6 69.5 14.1 71.9 38.4 72.0 13.9 76.0Belgium, French-speaking * 100 67.7 14.5 69.6 61.2 67.3 13.8 69.0 38.8 68.3 15.6 71.3Bosnia and Herzegovina 100 61.4 13.7 63.2 60.8 61.1 14.0 63.0 39.2 62.0 13.1 63.5Denmark † 100 61.8 16.4 65.8 62.2 61.8 16.5 66.8 37.8 61.7 16.3 63.8Estonia 100 58.3 17.4 61.9 43.0 60.8 15.2 61.9 57.0 56.4 18.8 60.5Finland 100 59.6 17.0 62.3 65.7 60.3 16.4 63.5 34.3 58.4 18.1 60.8France † 100 67.5 16.6 70.5 63.9 67.8 16.1 70.5 36.1 67.1 17.3 70.4Greece 100 68.9 14.9 71.6 66.7 68.2 14.5 70.8 33.3 70.1 15.6 74.8Iceland 100 56.6 16.7 58.4 69.6 56.8 16.0 60.4 30.4 56.0 19.4 54.4Norway 100 62.8 17.7 66.4 65.4 62.9 17.7 66.3 34.6 62.6 17.8 66.6Romania 100 61.0 14.3 62.8 59.5 60.5 14.2 61.9 40.5 61.6 14.4 64.0Serbia † 100 62.2 13.9 64.1 62.9 61.3 14.1 63.5 35.9 64.2 12.3 65.0Spain, Andalusia † 100 61.9 16.5 64.8 64.5 61.6 16.3 64.3 35.5 62.5 16.9 66.5Spain, Aragon † 100 66.2 14.1 68.6 73.9 66.4 14.0 68.4 26.1 65.2 14.9 71.4Spain, Asturias † 100 65.8 13.7 66.0 67.5 65.5 13.7 65.1 32.5 66.5 13.8 67.2Spain, Basque country 100 65.3 14.2 68.0 70.1 66.3 13.5 68.6 29.9 62.7 15.6 66.6Spain, Cantabria * 100 65.3 12.4 68.3 77.8 66.0 12.8 68.3 22.2 63.0 11.3 66.2Spain, Castile and León * 100 67.5 13.2 69.5 70.6 67.1 11.8 68.5 29.4 68.5 16.1 72.8Spain, Castile-La Mancha * † 100 63.6 14.3 64.8 67.5 64.8 13.8 66.4 32.5 61.3 15.0 61.2Spain, Catalonia † 100 66.8 15.0 69.5 66.1 66.9 14.9 69.6 33.9 66.5 15.3 69.0Spain, Extremadura † 100 65.9 11.7 67.2 60.2 66.2 11.7 65.5 39.8 65.5 11.9 69.8Spain, Galicia † 100 65.2 13.6 67.4 68.9 65.0 12.8 67.4 31.1 65.6 15.4 68.0Spain, Community of Madrid † 100 64.8 16.3 67.5 67.4 65.2 15.8 67.6 32.6 63.9 17.2 67.5Spain, Region of Murcia 100 62.3 13.5 64.0 64.8 63.4 13.5 66.7 35.2 60.5 13.3 60.8Spain, Navarre * 100 63.7 16.5 66.2 72.7 63.4 16.4 66.3 27.3 64.4 17.1 66.2Spain, Valencian region 100 64.7 15.5 67.8 66.8 65.1 15.4 68.5 33.2 63.9 15.9 67.1Sweden 100 63.1 16.9 67.4 66.7 63.5 16.6 68.0 33.3 62.2 17.5 66.2Switzerland † 100 65.4 15.9 68.8 65.3 66.2 15.2 69.2 34.7 63.9 17.0 67.3the Netherlands † 100 63.8 15.6 66.8 64.2 64.5 15.0 67.1 35.8 62.6 16.5 66.6United Kingdom, All countries * † 100 62.2 15.6 64.3 62.2 63.0 15.4 65.4 37.8 60.8 15.7 62.4United Kingdom, England * † 100 62.3 15.7 64.6 62.7 63.1 15.5 65.6 37.3 60.8 15.8 62.7United Kingdom, Northern Ireland * † 100 62.8 16.4 67.3 52.6 65.0 15.7 67.7 47.4 60.5 16.9 61.5United Kingdom, Scotland 100 59.5 15.6 61.3 59.5 59.6 15.4 61.3 40.5 59.3 15.9 61.3United Kingdom, Wales * † 100 64.1 15.1 66.2 63.4 64.9 14.3 68.0 36.6 62.6 16.3 65.8
Categories may not add up because of missing values or rounding off* Patients younger than 20 years of age are not reported† The incident counts at day 91, on which the data presented in this table are based, are estimated (see methods)
B3 INCIDENT PATIENTS ACCEPTED FOR RRT IN 2015, AT DAY 91
Table B.3.3Gender, mean age, and median age of incident patientsat day 91

Pmp Pmp Pmp
All Men Women
51
Austria 121.3 162.8 81.7Belgium, Dutch-speaking * 149.3 182.3 117.8Belgium, French-speaking * 180.2 226.3 136.2Bosnia and Herzegovina 116.8 146.0 88.9Denmark † 100.5 123.1 78.9Estonia 80.4 77.1 83.5Finland 87.3 115.0 60.9France † 149.2 193.7 106.7Greece 173.9 234.7 116.0Iceland 77.8 107.9 49.1Norway 99.9 129.2 71.9Romania 129.6 161.2 99.5Serbia † 94.0 123.4 66.1Spain, Andalusia † 124.0 161.6 88.3Spain, Aragon † 100.6 150.0 53.4Spain, Asturias † 125.4 173.6 79.3Spain, Basque country 102.2 144.8 61.6Spain, Cantabria * 84.4 133.1 38.0Spain, Castile and León * 90.7 129.8 53.4Spain, Castile-La Mancha * † 98.2 130.6 67.3Spain, Catalonia † 154.0 206.0 104.3Spain, Extremadura † 126.3 150.9 102.7Spain, Galicia † 118.2 167.6 71.1Spain, Community of Madrid † 124.5 174.3 77.1Spain, Region of Murcia 134.0 174.3 95.6Spain, Navarre * 131.4 189.5 75.9Spain, Valencian region 135.8 182.2 91.6Sweden 103.2 135.1 72.8Switzerland † 94.8 123.3 67.7the Netherlands † 106.5 135.7 78.7United Kingdom, All countries * † ¶ 110.1 136.9 84.6United Kingdom, England * † ¶ 109.8 137.3 83.6United Kingdom, Northern Ireland * † 121.4 127.4 115.7United Kingdom, Scotland 107.6 130.5 85.9United Kingdom, Wales * † 114.4 144.8 85.4
* Patients younger than 20 years of age are not reported† The incident counts at day 91, on which the data presented in this table are based, are estimated (see methods)¶ The incidence is underestimated by approximately 4% due to a small number of centres not submitting complete data for 2015
B3 INCIDENT PATIENTS ACCEPTED FOR RRT IN 2015, AT DAY 91
Table B.3.4Incident rates per million population, adjustedat day 91, adjusted for age and gender

All GN PN PKD DM HT RVD Misc Unkn Missing
Type I Type II Both
Pmp % Pmp % Pmp % Pmp % Pmp % Pmp % Pmp % Pmp % Pmp % Pmp % Pmp % Pmp %
52
Austria 126.5 100 14.3 11.3 4.8 3.8 7.2 5.7 3.0 2.4 31.0 24.5 34.0 26.9 16.0 12.6 14.3 11.3 21.9 17.3 14.0 11.0 0 0Belgium, Dutch-speaking * 164.9 100 17.0 10.3 6.3 3.8 8.5 5.2 4.2 2.5 30.0 18.2 34.1 20.7 17.8 10.8 10.0 6.1 57.3 34.8 13.8 8.3 0 0Belgium, French-speaking * 171.2 100 16.0 9.4 8.1 4.7 6.2 3.6 4.0 2.3 35.2 20.6 39.2 22.9 31.2 18.2 1.2 0.7 51.0 29.8 18.1 10.6 0 0Bosnia and Herzegovina 111.9 100 12.5 11.1 11.6 10.4 3.4 3.0 9.9 8.9 24.1 21.5 34.0 30.4 14.2 12.7 2.0 1.8 20.7 18.5 13.6 12.2 0 0Denmark † 102.6 100 11.6 11.3 5.2 5.0 7.3 7.1 7.7 7.5 20.9 20.4 28.6 27.9 14.0 13.6 0.6 0.6 15.6 15.2 19.7 19.2 0 0Estonia 81.3 100 16.7 20.6 6.8 8.4 1.5 1.9 17.5 21.5 0 0 17.5 21.5 21.3 26.2 0.8 0.9 16.7 20.6 0 0 0 0Finland 92.5 100 11.1 12.0 4.6 4.9 10.8 11.6 14.6 15.8 16.2 17.6 30.8 33.3 4.7 5.1 0.9 1.0 18.2 19.7 11.3 12.2 0 0France † 154.5 100 19.5 12.6 7.3 4.7 8.9 5.8 35.6 23.0 39.1 25.3 1.6 1.1 21.4 13.8 20.5 13.3 0.5 0.3Greece 202.3 100 17.0 8.4 8.6 4.2 7.1 3.5 4.8 2.4 50.6 25.0 55.4 27.4 19.7 9.7 1.8 0.9 19.4 9.6 73.2 36.2 0 0Iceland 69.5 100 12.1 17.4 0 0 15.1 21.7 6.0 8.7 9.1 13.0 15.1 21.7 9.1 13.0 3.0 4.3 15.1 21.7 0 0 0 0Norway 94.6 100 11.8 12.4 4.6 4.9 9.3 9.8 4.4 4.7 12.1 12.8 16.6 17.5 28.1 29.7 1.0 1.0 21.2 22.4 2.1 2.2 0 0Romania 132.0 100 17.1 12.9 4.8 3.7 3.2 2.4 15.2 11.5 7.9 6.0 0.7 0.5 20.2 15.3 62.0 46.9 1.0 0.7Serbia † 105.1 100 8.6 8.2 9.5 9.0 4.5 4.3 8.6 8.1 15.5 14.7 24.0 22.8 31.6 30.0 1.4 1.3 13.5 12.9 11.9 11.3 0.1 0.1Spain, Andalusia † 120.4 100 15.9 13.2 7.8 6.5 7.7 6.4 30.3 25.2 11.7 9.7 0.5 0.4 19.7 16.4 26.9 22.3 0 0Spain, Aragon † 112.2 100 3.0 2.7 3.0 2.7 0.8 0.7 0 0 4.5 4.0 4.5 4.0 2.3 2.0 0.8 0.7 2.3 2.0 95.5 85.2 0 0Spain, Asturias † 157.5 100 21.0 13.3 1.9 1.2 9.5 6.0 5.7 3.6 35.9 22.8 41.6 26.4 24.8 15.7 3.8 2.4 20.0 12.7 29.2 18.5 5.7 3.6Spain, Basque country 117.3 100 16.6 14.2 2.8 2.4 9.7 8.3 2.8 2.4 23.6 20.1 26.3 22.4 23.6 20.1 2.3 2.0 16.2 13.8 19.9 16.9 0 0Spain, Cantabria * 92.5 100 15.4 16.7 3.4 3.7 5.1 5.6 0 0 25.7 27.8 25.7 27.8 3.4 3.7 13.7 14.8 13.7 14.8 8.6 9.3 3.4 3.7Spain, Castile and León * ‡ 113.1 100 19.5 17.2 5.7 5.0 6.1 5.4 2.4 2.2 25.9 22.9 28.4 25.1 21.5 19.0 0 0 14.6 12.9 17.4 15.4 0 0Spain, Castile-La Mancha * † 101.8 100 18.6 18.3 13.1 12.9 8.8 8.6 21.6 21.2 7.3 7.2 4.4 4.3 10.4 10.2 17.7 17.4 0 0Spain, Catalonia † 158.3 100 16.0 10.1 8.6 5.4 10.0 6.3 3.5 2.2 24.1 15.2 27.8 17.6 12.8 8.1 4.8 3.0 16.9 10.7 61.4 38.8 0 0Spain, Extremadura † 134.2 100 19.2 14.3 6.4 4.8 11.9 8.9 29.9 22.3 19.5 14.5 3.7 2.7 11.3 8.4 31.4 23.4 0.9 0.7Spain, Galicia † 142.1 100 18.7 13.2 5.1 3.6 12.8 9.0 5.9 4.1 31.8 22.4 37.6 26.5 18.3 12.9 7.0 4.9 15.9 11.2 26.6 18.7 0 0Spain, Community of Madrid † 119.6 100 13.0 10.9 4.5 3.7 9.0 7.5 2.8 2.3 29.9 25.0 32.7 27.3 18.1 15.2 1.6 1.3 20.7 17.3 20.1 16.8 0 0Spain, Region of Murcia 122.0 100 27.3 22.3 8.2 6.7 10.9 8.9 24.5 20.1 9.5 7.8 3.4 2.8 17.7 14.5 20.4 16.8 0 0Spain, Navarre * 138.2 100 12.6 9.1 3.1 2.3 9.4 6.8 3.1 2.3 22.0 15.9 25.1 18.2 22.0 15.9 4.7 3.4 36.1 26.1 25.1 18.2 0 0Spain, Valencian region 142.1 100 20.1 14.1 6.8 4.8 9.4 6.6 28.5 20.1 24.3 17.1 8.4 5.9 16.9 11.9 27.7 19.5 0 0Sweden ‡ 107.6 100 16.4 15.3 3.4 3.1 7.4 6.9 7.8 7.2 19.8 18.4 27.6 25.6 16.5 15.4 0.6 0.6 23.3 21.6 12.3 11.5 0 0Switzerland † 97.6 100 14.2 14.6 1.6 1.6 6.9 7.1 2.5 2.6 15.9 16.3 18.4 18.9 17.5 18.0 2.8 2.9 21.7 22.2 8.4 8.6 6.0 6.2the Netherlands † 110.0 100 9.5 8.6 3.9 3.5 4.6 4.2 3.6 3.3 17.7 16.1 21.3 19.3 13.2 12.0 12.5 11.4 17.3 15.7 10.3 9.3 17.5 15.9United Kingdom, All countries * † ¶ 108.9 100 14.3 13.2 7.1 6.5 7.3 6.7 27.4 25.2 7.0 6.4 2.1 1.9 20.0 18.3 14.1 13.0 9.6 8.8United Kingdom, England * † ¶ 108.1 100 13.4 12.4 6.9 6.4 7.0 6.5 26.8 24.8 7.4 6.9 2.1 2.0 19.0 17.6 14.2 13.2 11.1 10.3United Kingdom, Northern Ireland * † 111.6 100 17.8 16.0 10.3 9.2 6.3 5.6 25.4 22.7 5.9 5.3 0.5 0.5 20.2 18.1 16.0 14.4 9.2 8.2United Kingdom, Scotland 110.4 100 17.3 15.7 6.5 5.9 10.2 9.3 30.9 28.0 4.8 4.4 1.9 1.7 25.9 23.4 12.8 11.6 0 0United Kingdom, Wales * † 119.0 100 23.8 20.0 9.8 8.2 7.9 6.6 32.3 27.1 3.5 3.0 1.8 1.5 26.8 22.5 12.9 10.8 0.2 0.2
Abbreviations used: GN: glomerulonephritis/sclerosis; PN: pyelonephritis; PKD: polycystic kidneys, adult type; DM: diabetes mellitus; HT: hypertension; RVD: renal vascular disease; Misc: miscellaneous; Unkn: unknownCategories may not add up because of rounding off or a limited number of cases (<10%) with diabetes mellitus type unknown; When cells are left empty, (complete) data are unavailable* Patients younger than 20 years of age are not reported† The incident counts at day 91, on which the data presented in this table are based, are estimated (see methods)‡ Mapping the 2012 Primary Renal Disease (PRD) codes to the old PRD codes results in a different distribution of PRD groups¶ The incidence is underestimated by approximately 4% due to a small number of centres not submitting complete data for 2015
B3 INCIDENT PATIENTS ACCEPTED FOR RRT IN 2015, AT DAY 91
Table B.3.5Incident rates per million population and percentages by primary renal disease, unadjustedat day 91

All GN PN PKD DM HT RVD Misc Unkn Missing
Type I Type II Both
Pmp Pmp Pmp Pmp Pmp Pmp Pmp Pmp Pmp Pmp Pmp Pmp
53
B3 INCIDENT PATIENTS ACCEPTED FOR RRT IN 2015, AT DAY 91
Table B.3.6Incident rates per million population by primary renal disease, adjustedat day 91, adjusted for age and gender
Austria 121.3 13.7 4.6 6.9 3.0 29.7 32.7 15.1 13.6 21.3 13.4 0Belgium, Dutch-speaking * 149.3 15.9 6.1 8.0 3.9 26.9 30.9 15.9 8.4 51.5 12.6 0Belgium, French-speaking * 180.2 16.7 8.7 6.3 4.1 37.4 41.5 32.7 1.4 54.6 18.4 0Bosnia and Herzegovina 116.8 12.4 12.7 3.3 9.7 24.5 34.2 15.9 2.2 21.6 14.3 0Denmark † 100.5 11.9 5.0 7.0 7.9 19.8 27.6 13.4 0.7 15.4 19.5 0Estonia 80.4 16.5 6.7 1.3 16.7 0 16.7 22.0 0.8 16.5 0 0Finland 87.3 10.5 4.3 10.1 15.5 14.2 29.7 4.6 0.8 17.0 10.4 0France † 149.2 19.7 7.2 9.0 34.7 36.0 1.6 21.1 19.4 0.6Greece 173.9 15.8 7.4 6.9 4.7 43.0 47.8 16.3 1.5 17.1 61.1 0Iceland 77.8 13.1 0 17.9 5.9 9.9 15.8 10.1 3.0 17.8 0 0Norway 99.9 12.2 4.7 9.9 4.6 12.9 17.5 30.6 1.0 21.9 2.2 0Romania 129.6 16.9 4.7 3.2 14.8 7.7 0.7 19.9 60.7 1.0Serbia † 94.0 8.1 8.7 4.1 7.4 13.1 20.5 28.5 1.3 12.1 10.9 0.2Spain, Andalusia † 124.0 16.0 8.0 7.6 31.4 12.2 0.5 20.3 27.9 0Spain, Aragon † 100.6 2.9 2.6 0.7 0 3.8 3.8 2.1 0.8 2.1 85.7 0Spain, Asturias † 125.4 17.8 1.4 7.8 5.0 28.3 33.2 18.9 2.9 17.0 21.6 5.0Spain, Basque country 102.2 15.3 2.4 8.8 2.5 20.5 23.0 19.5 1.9 14.6 16.8 0Spain, Cantabria * 84.4 14.4 3.0 4.5 0 22.3 22.3 3.1 13.4 12.3 8.7 2.7Spain, Castile and León * ‡ 90.7 16.3 5.0 5.2 2.3 20.3 22.6 15.6 0 12.0 14.1 0Spain, Castile-La Mancha * † 98.2 18.4 12.8 8.8 21.7 6.3 4.1 10.2 16.2 0Spain, Catalonia † 154.0 15.6 8.3 9.8 3.3 24.1 27.7 12.1 4.5 16.8 59.1 0Spain, Extremadura † 126.3 18.9 6.4 11.4 28.4 18.5 3.2 10.4 28.3 0.8Spain, Galicia † 118.2 16.2 4.2 11.2 5.4 26.3 31.7 14.2 5.4 13.9 21.3 0Spain, Community of Madrid † 124.5 13.4 4.6 8.9 2.7 32.0 34.7 18.9 1.6 21.6 20.9 0Spain, Region of Murcia 134.0 28.6 9.1 11.9 27.5 11.1 4.1 19.7 22.0 0Spain, Navarre * 131.4 12.5 3.1 8.6 3.0 21.1 24.0 19.4 4.5 35.0 24.2 0Spain, Valencian region 135.8 19.5 6.5 8.9 27.3 23.0 7.9 16.6 26.2 0Sweden ‡ 103.2 16.4 3.1 7.6 7.8 18.0 25.8 15.3 0.6 22.6 11.8 0Switzerland † 94.8 13.9 1.6 6.6 2.4 15.4 17.8 17.0 2.8 21.2 8.2 5.8the Netherlands † 106.5 9.2 3.7 4.4 3.7 16.7 20.4 13.1 12.1 16.7 9.9 16.8United Kingdom, All countries * † ¶ 110.1 14.6 7.1 7.6 27.8 7.0 2.0 20.2 14.2 9.7United Kingdom, England * † ¶ 109.8 13.7 6.9 7.3 27.3 7.5 2.1 19.3 14.4 11.2United Kingdom, Northern Ireland * † 121.4 19.1 11.0 6.6 27.5 6.7 0.6 21.8 17.9 10.6United Kingdom, Scotland 107.6 16.9 6.5 10.0 30.1 4.5 1.8 25.3 12.5 0United Kingdom, Wales * † 114.4 23.9 9.1 8.1 30.6 3.5 1.6 25.5 12.1 0.3
Abbreviations used: GN: glomerulonephritis/sclerosis; PN: pyelonephritis; PKD: polycystic kidneys, adult type; DM: diabetes mellitus; HT: hypertension; RVD: renal vascular disease; Misc: miscellaneous; Unkn: unknownCategories may not add up because of rounding off or a limited number of cases (<10%) with diabetes mellitus type unknown; When cells are left empty, (complete) data are unavailable* Patients younger than 20 years of age are not reported† The incident counts at day 91, on which the data presented in this table are based, are estimated (see methods)‡ Mapping the 2012 Primary Renal Disease (PRD) codes to the old PRD codes results in a different distribution of PRD groups¶ The incidence is underestimated by approximately 4% due to a small number of centres not submitting complete data for 2015

All Haemodialysis Peritoneal dialysis Transplant Unkn Missing
HD HD HD HF HDF Total APD CAPD PD Total Living Deceased Tx Total hospital/ home type HD/ type PD type Tx centre Unkn HF/HDF Unkn Unkn
N N N N N N N N N N N N N N N N N
54
B3 INCIDENT PATIENTS ACCEPTED FOR RRT IN 2015, AT DAY 91
Table B.3.7Incident counts by treatment modalityat day 91
Austria 1086 831 1 2 0 100 934 44 61 4 109 31 12 0 43 0 0Belgium, Dutch-speaking * 1067 671 2 0 2 263 938 67 45 0 112 4 13 0 17 0 0Belgium, French-speaking * 822 509 5 0 6 189 709 35 56 0 91 10 12 0 22 0 0Bosnia and Herzegovina 395 367 0 0 0 7 374 0 20 0 20 0 1 0 1 0 0Denmark † & 589 336 0 0 336 90 84 0 174 38 40 0 79 0 0Estonia 107 80 0 0 0 4 84 16 6 0 22 0 1 0 1 0 0Finland 507 308 23 0 0 44 375 68 53 0 121 4 7 0 11 0 0France † 10296 6842 5 13 13 1759 8633 365 792 0 1157 181 321 0 502 4 0Greece 2189 1915 0 0 0 113 2028 77 78 0 155 5 1 0 6 0 0Iceland 23 18 0 0 18 0 1 0 1 3 1 0 4 0 0Norway 491 320 0 0 320 109 109 26 36 0 62 0 0Romania 2590 2475 0 0 0 2 2477 9 64 4 77 14 19 3 36 0 0Serbia † 746 622 0 0 0 9 631 4 83 0 87 15 3 0 18 10 0Spain, Andalusia † 1012 784 0 0 784 161 161 30 36 0 66 0 0Spain, Aragon † 148 96 0 0 13 109 2 35 0 37 2 0 0 2 0 0Spain, Asturias † 165 124 0 0 1 125 13 25 0 37 2 1 0 3 0 0Spain, Basque country 254 170 0 0 170 2 64 0 66 15 3 0 18 0 0Spain, Cantabria * 54 40 0 0 40 0 11 0 11 0 3 0 3 0 0Spain, Castile and León * 279 221 0 0 221 16 36 0 52 0 6 0 6 0 0Spain, Castile-La Mancha * † 209 158 0 0 158 8 39 0 47 5 5 0 0Spain, Catalonia † 1188 473 0 0 432 905 54 121 0 174 73 35 0 109 0 0Spain, Extremadura † 147 129 0 0 129 8 10 0 18 0 0 0 0 0 0Spain, Galicia † 388 276 1 0 0 1 278 13 69 0 82 27 1 0 28 0 0Spain, Community of Madrid † 770 607 0 0 607 38 82 0 121 12 30 0 42 0 0Spain, Region of Murcia 179 107 0 0 0 35 142 2 32 0 34 1 2 0 3 0 0Spain, Navarre * 88 47 1 0 48 21 7 0 28 2 10 0 12 0 0Spain, Valencian region 708 530 3 0 533 12 137 0 149 9 17 0 26 0 0Sweden 1054 634 2 0 636 339 339 47 32 0 79 0 0Switzerland † 808 599 3 6 0 0 608 43 95 5 142 43 15 0 58 0 0the Netherlands † 1863 1274 0 0 1274 125 198 0 323 237 29 0 266 0 0United Kingdom, All countries * † ¶ § 7087 4274 33 4 8 718 5037 713 671 20 1404 296 311 39 647 0 0United Kingdom, England * † ¶ 5922 3457 25 4 6 699 4191 594 589 17 1200 225 267 38 530 0 0United Kingdom, Northern Ireland * † 207 121 1 0 0 0 123 37 2 3 43 33 8 0 41 0 0United Kingdom, Scotland 593 445 1 0 446 46 43 0 89 27 31 0 58 0 0United Kingdom, Wales * † 369 246 5 0 2 19 273 31 42 0 73 14 8 1 23 0 0
Abbreviations used: HD: haemodialysis; Unkn: unknown; HF: haemofiltration; HDF: haemodiafiltration; APD: automated peritoneal dialysis; CAPD: continuous ambulatory peritoneal dialysis; PD: peritoneal dialysis; Tx: transplantCategories may not add up because of rounding off; When cells are left empty, (complete) data are unavailable* Patients younger than 20 years of age are not reported† The incident counts at day 91 are estimated (see methods)& No distinction is made between HD and HDF¶ The incidence is underestimated by approximately 4% due to a small number of centres not submitting complete data for 2015§ HDF is not accurately captured from some units and so usage may be an underestimate for the UK

All Haemodialysis Peritoneal dialysis Transplant Unkn Missing
HD HD HD HF HDF Total APD CAPD PD Total Living Deceased Tx Total hospital/ home type HD/ type PD type Tx centre Unkn HF/HDF Unkn Unkn
Pmp Pmp Pmp Pmp Pmp Pmp Pmp Pmp Pmp Pmp Pmp Pmp Pmp Pmp Pmp Pmp Pmp
55
B3 INCIDENT PATIENTS ACCEPTED FOR RRT IN 2015, AT DAY 91
Table B.3.8Incident rates per million population by treatment modality, unadjustedat day 91
Austria 126.5 96.8 0.1 0.2 0 11.6 108.8 5.1 7.1 0.5 12.7 3.6 1.4 0 5.0 0 0Belgium, Dutch-speaking * 164.9 103.7 0.3 0 0.3 40.6 144.9 10.4 7.0 0 17.3 0.6 2.0 0 2.6 0 0Belgium, French-speaking * 171.2 106.0 1.0 0 1.2 39.4 147.7 7.3 11.7 0 19.0 2.1 2.5 0 4.6 0 0Bosnia and Herzegovina 111.9 103.9 0 0 0 2.0 105.9 0 5.7 0 5.7 0 0.3 0 0.3 0 0Denmark † & 102.6 58.5 0 0 58.5 15.7 14.6 0 30.4 6.7 7.0 0 13.7 0 0Estonia 81.3 60.8 0 0 0 3.0 63.9 12.2 4.6 0 16.7 0 0.8 0 0.8 0 0Finland 92.5 56.2 4.2 0 0 8.0 68.4 12.4 9.7 0 22.1 0.7 1.3 0 2.0 0 0France † 154.5 102.7 0.1 0.2 0.2 26.4 129.6 5.5 11.9 0 17.4 2.7 4.8 0 7.5 0.1 0Greece 202.3 177.0 0 0 0 10.4 187.4 7.1 7.2 0 14.3 0.5 0.1 0 0.6 0 0Iceland 69.5 54.4 0 0 54.4 0 3.0 0 3.0 9.1 3.0 0 12.1 0 0Norway 94.6 61.7 0 0 61.7 21.0 21.0 5.0 6.9 0 11.9 0 0Romania 132.0 126.2 0 0 0 0.1 126.3 0.5 3.3 0.2 3.9 0.7 1.0 0.2 1.8 0 0Serbia † 105.1 87.7 0 0 0 1.3 88.9 0.6 11.7 0 12.3 2.1 0.4 0 2.5 1.5 0Spain, Andalusia † 120.4 93.3 0 0 93.3 19.2 19.2 3.6 4.3 0 7.9 0 0Spain, Aragon † 112.2 72.3 0 0 10.1 82.4 1.8 26.5 0 28.2 1.5 0 0 1.5 0 0Spain, Asturias † 157.5 118.1 0 0 1.0 119.1 12.1 23.5 0 35.6 1.9 1.0 0 2.9 0 0Spain, Basque country 117.3 78.5 0 0 78.5 0.9 29.6 0 30.5 6.9 1.4 0 8.3 0 0Spain, Cantabria * 92.5 68.5 0 0 68.5 0 18.8 0 18.8 0 5.1 0 5.1 0 0Spain, Castile and León * 113.1 89.6 0 0 89.6 6.5 14.6 0 21.1 0 2.4 0 2.4 0 0Spain, Castile-La Mancha * † 101.8 76.7 0 0 76.7 3.9 19.0 0 22.9 2.3 2.3 0 0Spain, Catalonia † 158.3 63.0 0 0 57.6 120.6 7.1 16.1 0 23.2 9.8 4.7 0 14.5 0 0Spain, Extremadura † 134.2 117.7 0 0 117.7 7.3 9.1 0 16.5 0 0 0 0 0 0Spain, Galicia † 142.1 101.1 0.4 0 0 0.4 101.8 4.9 25.2 0 30.1 9.9 0.4 0 10.3 0 0Spain, Community of Madrid † 119.6 94.3 0 0 94.3 6.0 12.8 0 18.7 1.9 4.7 0 6.5 0 0Spain, Region of Murcia 122.0 72.9 0 0 0 23.9 96.8 1.4 21.8 0 23.2 0.7 1.4 0 2.0 0 0Spain, Navarre * 138.2 73.8 1.6 0 75.4 33.0 11.0 0 44.0 3.1 15.7 0 18.8 0 0Spain, Valencian region 142.1 106.4 0.6 0 107.0 2.4 27.5 0 29.9 1.8 3.4 0 5.2 0 0Sweden 107.6 64.7 0.2 0 64.9 34.6 34.6 4.8 3.3 0 8.1 0 0Switzerland † 97.6 72.3 0.4 0.7 0 0 73.4 5.2 11.4 0.6 17.1 5.2 1.8 0 7.0 0 0the Netherlands † 110.0 75.2 0 0 75.2 7.4 11.7 0 19.1 14.0 1.7 0 15.7 0 0United Kingdom, All countries * † ¶ § 108.9 65.6 0.5 0.1 0.1 11.0 77.4 11.0 10.3 0.3 21.6 4.6 4.8 0.6 9.9 0 0United Kingdom, England * † ¶ 108.1 63.1 0.5 0.1 0.1 12.8 76.5 10.8 10.8 0.3 21.9 4.1 4.9 0.7 9.7 0 0United Kingdom, Northern Ireland * † 111.6 65.5 0.5 0 0 0 66.4 19.8 0.9 1.4 23.2 17.8 4.1 0 22.0 0 0United Kingdom, Scotland 110.4 82.8 0.2 0 83.0 8.6 8.0 0 16.6 5.0 5.8 0 10.8 0 0United Kingdom, Wales * † 119.0 79.3 1.7 0 0.6 6.0 88.0 9.9 13.7 0 23.6 4.4 2.6 0.4 7.4 0 0
Abbreviations used: HD: haemodialysis; Unkn: unknown; HF: haemofiltration; HDF: haemodiafiltration; APD: automated peritoneal dialysis; CAPD: continuous ambulatory peritoneal dialysis; PD: peritoneal dialysis; Tx: transplantCategories may not add up because of rounding off; When cells are left empty, (complete) data are unavailable* Patients younger than 20 years of age are not reported† The incident counts at day 91, on which the data presented in this table are based, are estimated (see methods)& No distinction is made between HD and HDF¶ The incidence is underestimated by approximately 4% due to a small number of centres not submitting complete data for 2015§ HDF is not accurately captured from some units and so usage may be an underestimate for the UK

All Haemodialysis Peritoneal dialysis Transplant Unkn Missing
HD HD HD HF HDF Total APD CAPD PD Total Living Deceased Tx Total hospital/ home type HD/ type PD type Tx centre Unkn HF/HDF Unkn Unkn
Pmp Pmp Pmp Pmp Pmp Pmp Pmp Pmp Pmp Pmp Pmp Pmp Pmp Pmp Pmp Pmp Pmp
56
B3 INCIDENT PATIENTS ACCEPTED FOR RRT IN 2015, AT DAY 91
Table B.3.9Incident rates per million population by treatment modality, adjustedat day 91, adjusted for age and gender
Austria 121.3 92.8 0.1 0.2 0 11.0 104.1 5.0 6.9 0.4 12.3 3.5 1.4 0 4.9 0 0Belgium, Dutch-speaking * 149.3 92.8 0.4 0 0.3 36.9 130.4 9.9 6.5 0 16.4 0.6 1.8 0 2.5 0 0Belgium, French-speaking * 180.2 111.6 1.1 0 1.3 41.6 155.6 7.7 12.2 0 19.9 2.1 2.6 0 4.7 0 0Bosnia and Herzegovina 116.8 109.0 0 0 0 2.1 111.1 0 5.4 0 5.4 0 0.2 0 0.2 0 0Denmark † & 301.4 0.5 0 0 0.5 3.0 0 0 1.1 1.8 1.0 0 2.7 0 0Estonia 80.4 60.2 0 0 0 2.8 63.0 12.2 4.3 0 16.5 0 0.8 0 0.8 0 0Finland 87.3 51.9 4.1 0 0 7.5 63.5 12.6 9.1 0 21.7 0.7 1.4 0 2.1 0 0France † 447.6 0 0 0 0 1.6 0 1.7 0.2 0 0.8 0.4 0.6 0 1.0 0.1 0Greece 173.9 150.6 0 0 0 9.8 160.4 6.5 6.5 0 12.9 0.5 0.1 0 0.6 0 0Iceland 77.8 60.8 0 0 60.8 0 3.8 0 3.8 10.3 2.9 0 13.2 0 0Norway 99.9 65.3 0 0 65.3 22.4 22.4 5.0 7.2 0 12.2 0 0Romania 129.6 123.9 0 0 0 0.1 124.0 0.5 3.2 0.2 3.9 0.7 0.9 0.2 1.8 0 0Serbia † 282.1 0.2 0 0 0 1.1 0.2 0 0.3 0 0.3 0 0 0 0 0.2 0Spain, Andalusia † 372.1 0.5 0 0 0.5 1.2 1.2 0 1.5 0 1.5 0 0Spain, Aragon † 301.8 0 0 0 0.9 0 0.9 3.3 0 4.2 0 0 0 0 0 0Spain, Asturias † 376.1 1.0 0 0 0 1.0 2.0 1.2 0 3.2 0 0 0 0 0 0Spain, Basque country 102.2 67.4 0 0 67.4 0.8 25.5 0 26.3 7.1 1.4 0 8.5 0 0Spain, Cantabria * 84.4 62.9 0 0 62.9 0 16.8 0 16.8 0 4.8 0 4.8 0 0Spain, Castile and León * 90.7 70.1 0 0 70.1 5.7 12.8 0 18.5 0 2.1 0 2.1 0 0Spain, Castile-La Mancha * † 294.6 1.0 0 0 1.0 0 1.3 0 1.3 1.5 1.5 0 0Spain, Catalonia † 461.9 0 0 0 28.1 0 3.2 0.5 0 1.9 0.7 1.3 0 2.0 0 0Spain, Extremadura † 378.8 2.4 0 0 2.4 0 1.1 0 1.1 0 0 0 0 0 0Spain, Galicia † 354.7 1.7 0 0 0 0 1.7 1.5 1.5 0 2.2 1.6 0 0 1.6 0 0Spain, Community of Madrid † 373.5 0.2 0 0 0.2 0.6 0.3 0 1.0 0 0.7 0 0.7 0 0Spain, Region of Murcia 134.0 82.0 0 0 0 25.8 107.8 1.2 23.2 0 24.4 0.5 1.3 0 1.8 0 0Spain, Navarre * 131.4 68.4 1.5 0 69.9 31.7 10.8 0 42.6 3.3 15.6 0 18.9 0 0Spain, Valencian region 135.8 101.5 0.5 0 102.0 2.3 26.6 0 28.8 1.8 3.2 0 5.0 0 0Sweden 103.2 61.1 0.2 0 61.3 33.5 33.5 5.0 3.4 0 8.3 0 0Switzerland † 284.4 0.2 0 0 0 0 0.2 0.5 0.5 0 0.5 0.6 0 0 0.6 0 0the Netherlands † 319.6 0.1 0 0 0.1 4.1 0.2 0 1.3 1.0 0.3 0 1.3 0 0United Kingdom, All countries * † ¶ § 330.4 0 0.2 0 0 1.4 0 2.4 0 0 0.3 0.6 0.6 0.1 1.2 0 0United Kingdom, England * † ¶ 329.4 0 0.2 0 0 1.7 0 2.3 0.1 0.1 0.3 0.5 0.5 0.1 1.0 0 0United Kingdom, Northern Ireland * † 364.2 0 0 0 0 0 0 6.9 0 0 4.8 2.3 1.6 0 3.8 0 0United Kingdom, Scotland 107.6 80.4 0.2 0 80.6 8.3 8.0 0 16.3 5.1 5.7 0 10.8 0 0United Kingdom, Wales * † 343.2 1.2 0.4 0 0 0 0.8 3.9 1.8 0 2.3 1.0 1.3 0.5 2.7 0 0
Abbreviations used: HD: haemodialysis; Unkn: unknown; HF: haemofiltration; HDF: haemodiafiltration; APD: automated peritoneal dialysis; CAPD: continuous ambulatory peritoneal dialysis; PD: peritoneal dialysis; Tx: transplantCategories may not add up because of rounding off; When cells are left empty, (complete) data are unavailable* Patients younger than 20 years of age are not reported† The incident counts at day 91, on which the data presented in this table are based, are estimated (see methods)& No distinction is made between HD and HDF¶ The incidence is underestimated by approximately 4% due to a small number of centres not submitting complete data for 2015§ HDF is not accurately captured from some units and so usage may be an underestimate for the UK

All Haemodialysis Peritoneal dialysis Transplant Unkn Missing
HD HD HD HF HDF Total APD CAPD PD Total Living Deceased Tx Total hospital/ home type HD/ type PD type Tx centre Unkn HF/HDF Unkn Unkn
% % % % % % % % % % % % % % % % %
57
B3 INCIDENT PATIENTS ACCEPTED FOR RRT IN 2015, AT DAY 91
Table B.3.10Percentages of treatment modality, unadjustedat day 91
Austria 100 76.5 0.1 0.2 0 9.2 86.0 4.1 5.6 0.4 10.0 2.9 1.1 0 4.0 0 0Belgium, Dutch-speaking * 100 62.9 0.2 0 0.2 24.6 87.9 6.3 4.2 0 10.5 0.4 1.2 0 1.6 0 0Belgium, French-speaking * 100 61.9 0.6 0 0.7 23.0 86.3 4.3 6.8 0 11.1 1.2 1.5 0 2.7 0 0Bosnia and Herzegovina 100 92.9 0 0 0 1.8 94.7 0 5.1 0 5.1 0 0.3 0 0.3 0 0Denmark † & 100 57.0 0 0 57.0 15.3 14.3 0 29.6 6.5 6.8 0 13.4 0 0Estonia 100 74.8 0 0 0 3.7 78.5 15.0 5.6 0 20.6 0 0.9 0 0.9 0 0Finland 100 60.7 4.5 0 0 8.7 74.0 13.4 10.5 0 23.9 0.8 1.4 0 2.2 0 0France † 100 66.5 0.1 0.1 0.1 17.1 83.8 3.5 7.7 0 11.2 1.8 3.1 0 4.9 0 0Greece 100 87.5 0 0 0 5.2 92.6 3.5 3.6 0 7.1 0.2 0 0 0.3 0 0Iceland 100 78.3 0 0 78.3 0 4.3 0 4.3 13.0 4.3 0 17.4 0 0Norway 100 65.2 0 0 65.2 22.2 22.2 5.3 7.3 0 12.6 0 0Romania 100 95.6 0 0 0 0.1 95.6 0.3 2.5 0.2 3.0 0.5 0.7 0.1 1.4 0 0Serbia † 100 83.4 0 0 0 1.2 84.5 0.5 11.1 0 11.7 2.0 0.4 0 2.4 1.4 0Spain, Andalusia † 100 77.5 0 0 77.5 15.9 15.9 3.0 3.6 0 6.6 0 0Spain, Aragon † 100 64.5 0 0 9.0 73.5 1.6 23.6 0 25.2 1.3 0 0 1.3 0 0Spain, Asturias † 100 75.0 0 0 0.6 75.6 7.7 14.9 0 22.6 1.2 0.6 0 1.8 0 0Spain, Basque country 100 66.9 0 0 66.9 0.8 25.2 0 26.0 5.9 1.2 0 7.1 0 0Spain, Cantabria * 100 74.1 0 0 74.1 0 20.4 0 20.4 0 5.6 0 5.6 0 0Spain, Castile and León * 100 79.2 0 0 79.2 5.7 12.9 0 18.6 0 2.2 0 2.2 0 0Spain, Castile-La Mancha * † 100 75.3 0 0 75.3 3.8 18.6 0 22.5 2.2 2.2 0 0Spain, Catalonia † 100 39.8 0 0 36.4 76.2 4.5 10.2 0 14.7 6.2 3.0 0 9.1 0 0Spain, Extremadura † 100 87.7 0 0 87.7 5.5 6.8 0 12.3 0 0 0 0 0 0Spain, Galicia † 100 71.1 0.3 0 0 0.3 71.6 3.4 17.7 0 21.2 7.0 0.3 0 7.2 0 0Spain, Community of Madrid † 100 78.9 0 0 78.9 5.0 10.7 0 15.7 1.6 3.9 0 5.5 0 0Spain, Region of Murcia 100 59.8 0 0 0 19.6 79.3 1.1 17.9 0 19.0 0.6 1.1 0 1.7 0 0Spain, Navarre * 100 53.4 1.1 0 54.5 23.9 8.0 0 31.8 2.3 11.4 0 13.6 0 0Spain, Valencian region 100 74.9 0.4 0 75.3 1.7 19.4 0 21.0 1.3 2.4 0 3.7 0 0Sweden 100 60.2 0.2 0 60.3 32.2 32.2 4.5 3.0 0 7.5 0 0Switzerland † 100 74.1 0.4 0.7 0 0 75.2 5.3 11.7 0.6 17.6 5.4 1.9 0 7.2 0 0the Netherlands † 100 68.4 0 0 68.4 6.7 10.6 0 17.4 12.7 1.5 0 14.3 0 0United Kingdom, All countries * † § 100 60.3 0.5 0.1 0.1 10.1 71.1 10.1 9.5 0.3 19.8 4.2 4.4 0.6 9.1 0 0United Kingdom, England * † 100 58.4 0.4 0.1 0.1 11.8 70.8 10.0 10.0 0.3 20.3 3.8 4.5 0.6 9.0 0 0United Kingdom, Northern Ireland * † 100 59.2 0.5 0 0 0 59.5 18.7 0.8 1.3 20.8 16.0 3.7 0 19.7 0 0United Kingdom, Scotland 100 75.0 0.2 0 75.2 7.8 7.3 0 15.0 4.6 5.2 0 9.8 0 0United Kingdom, Wales * † 100 66.9 1.4 0 0.5 5.1 74.0 8.3 11.5 0 19.8 3.7 2.2 0.4 6.2 0 0
Abbreviations used: HD: haemodialysis; Unkn: unknown; HF: haemofiltration; HDF: haemodiafiltration; APD: automated peritoneal dialysis; CAPD: continuous ambulatory peritoneal dialysis; PD: peritoneal dialysis; Tx: transplantCategories may not add up because of rounding off; When cells are left empty, (complete) data are unavailable* Patients younger than 20 years of age are not reported† The incident counts at day 91, on which the data presented in this table are based, are estimated (see methods)& No distinction is made between HD and HDF§ HDF is not accurately captured from some units and so usage may be an underestimate for the UK
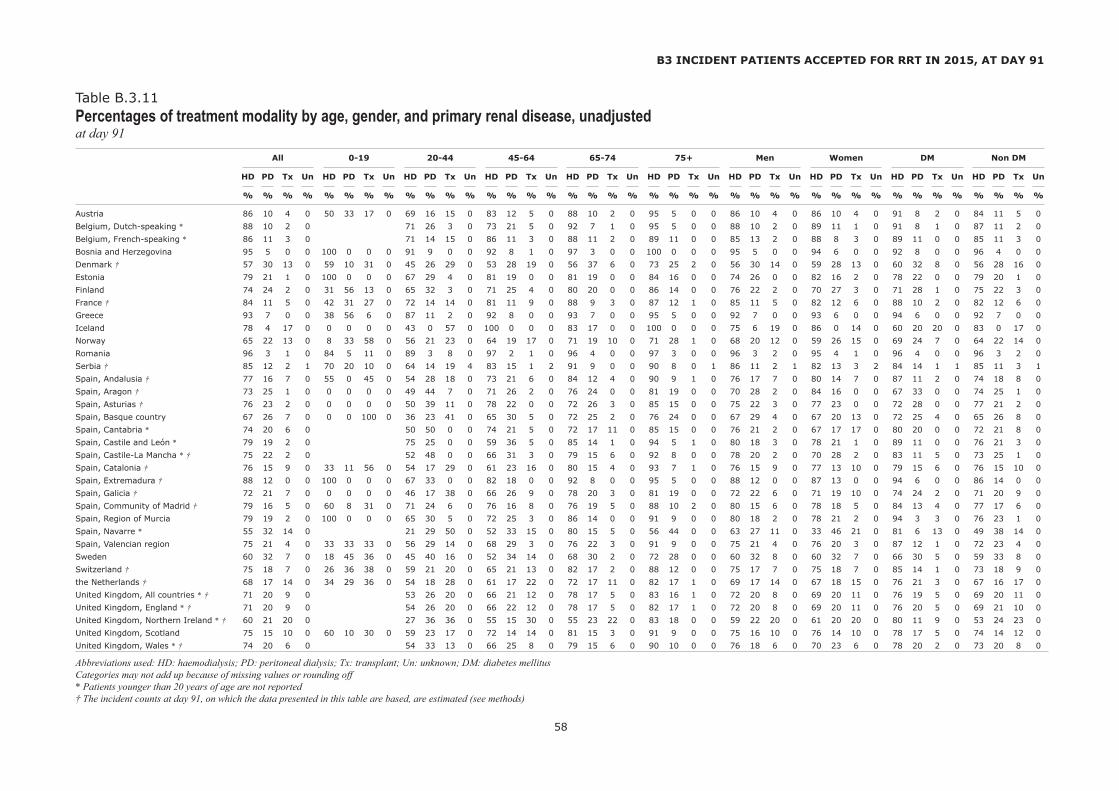
All 0-19 20-44 45-64 65-74 75+ Men Women DM Non DM
HD PD Tx Un HD PD Tx Un HD PD Tx Un HD PD Tx Un HD PD Tx Un HD PD Tx Un HD PD Tx Un HD PD Tx Un HD PD Tx Un HD PD Tx Un
% % % % % % % % % % % % % % % % % % % % % % % % % % % % % % % % % % % % % % % %
58
Austria 86 10 4 0 50 33 17 0 69 16 15 0 83 12 5 0 88 10 2 0 95 5 0 0 86 10 4 0 86 10 4 0 91 8 2 0 84 11 5 0Belgium, Dutch-speaking * 88 10 2 0 71 26 3 0 73 21 5 0 92 7 1 0 95 5 0 0 88 10 2 0 89 11 1 0 91 8 1 0 87 11 2 0Belgium, French-speaking * 86 11 3 0 71 14 15 0 86 11 3 0 88 11 2 0 89 11 0 0 85 13 2 0 88 8 3 0 89 11 0 0 85 11 3 0Bosnia and Herzegovina 95 5 0 0 100 0 0 0 91 9 0 0 92 8 1 0 97 3 0 0 100 0 0 0 95 5 0 0 94 6 0 0 92 8 0 0 96 4 0 0Denmark † 57 30 13 0 59 10 31 0 45 26 29 0 53 28 19 0 56 37 6 0 73 25 2 0 56 30 14 0 59 28 13 0 60 32 8 0 56 28 16 0Estonia 79 21 1 0 100 0 0 0 67 29 4 0 81 19 0 0 81 19 0 0 84 16 0 0 74 26 0 0 82 16 2 0 78 22 0 0 79 20 1 0Finland 74 24 2 0 31 56 13 0 65 32 3 0 71 25 4 0 80 20 0 0 86 14 0 0 76 22 2 0 70 27 3 0 71 28 1 0 75 22 3 0France † 84 11 5 0 42 31 27 0 72 14 14 0 81 11 9 0 88 9 3 0 87 12 1 0 85 11 5 0 82 12 6 0 88 10 2 0 82 12 6 0Greece 93 7 0 0 38 56 6 0 87 11 2 0 92 8 0 0 93 7 0 0 95 5 0 0 92 7 0 0 93 6 0 0 94 6 0 0 92 7 0 0Iceland 78 4 17 0 0 0 0 0 43 0 57 0 100 0 0 0 83 17 0 0 100 0 0 0 75 6 19 0 86 0 14 0 60 20 20 0 83 0 17 0Norway 65 22 13 0 8 33 58 0 56 21 23 0 64 19 17 0 71 19 10 0 71 28 1 0 68 20 12 0 59 26 15 0 69 24 7 0 64 22 14 0Romania 96 3 1 0 84 5 11 0 89 3 8 0 97 2 1 0 96 4 0 0 97 3 0 0 96 3 2 0 95 4 1 0 96 4 0 0 96 3 2 0Serbia † 85 12 2 1 70 20 10 0 64 14 19 4 83 15 1 2 91 9 0 0 90 8 0 1 86 11 2 1 82 13 3 2 84 14 1 1 85 11 3 1Spain, Andalusia † 77 16 7 0 55 0 45 0 54 28 18 0 73 21 6 0 84 12 4 0 90 9 1 0 76 17 7 0 80 14 7 0 87 11 2 0 74 18 8 0Spain, Aragon † 73 25 1 0 0 0 0 0 49 44 7 0 71 26 2 0 76 24 0 0 81 19 0 0 70 28 2 0 84 16 0 0 67 33 0 0 74 25 1 0Spain, Asturias † 76 23 2 0 0 0 0 0 50 39 11 0 78 22 0 0 72 26 3 0 85 15 0 0 75 22 3 0 77 23 0 0 72 28 0 0 77 21 2 0Spain, Basque country 67 26 7 0 0 0 100 0 36 23 41 0 65 30 5 0 72 25 2 0 76 24 0 0 67 29 4 0 67 20 13 0 72 25 4 0 65 26 8 0Spain, Cantabria * 74 20 6 0 50 50 0 0 74 21 5 0 72 17 11 0 85 15 0 0 76 21 2 0 67 17 17 0 80 20 0 0 72 21 8 0Spain, Castile and León * 79 19 2 0 75 25 0 0 59 36 5 0 85 14 1 0 94 5 1 0 80 18 3 0 78 21 1 0 89 11 0 0 76 21 3 0Spain, Castile-La Mancha * † 75 22 2 0 52 48 0 0 66 31 3 0 79 15 6 0 92 8 0 0 78 20 2 0 70 28 2 0 83 11 5 0 73 25 1 0Spain, Catalonia † 76 15 9 0 33 11 56 0 54 17 29 0 61 23 16 0 80 15 4 0 93 7 1 0 76 15 9 0 77 13 10 0 79 15 6 0 76 15 10 0Spain, Extremadura † 88 12 0 0 100 0 0 0 67 33 0 0 82 18 0 0 92 8 0 0 95 5 0 0 88 12 0 0 87 13 0 0 94 6 0 0 86 14 0 0Spain, Galicia † 72 21 7 0 0 0 0 0 46 17 38 0 66 26 9 0 78 20 3 0 81 19 0 0 72 22 6 0 71 19 10 0 74 24 2 0 71 20 9 0Spain, Community of Madrid † 79 16 5 0 60 8 31 0 71 24 6 0 76 16 8 0 76 19 5 0 88 10 2 0 80 15 6 0 78 18 5 0 84 13 4 0 77 17 6 0Spain, Region of Murcia 79 19 2 0 100 0 0 0 65 30 5 0 72 25 3 0 86 14 0 0 91 9 0 0 80 18 2 0 78 21 2 0 94 3 3 0 76 23 1 0Spain, Navarre * 55 32 14 0 21 29 50 0 52 33 15 0 80 15 5 0 56 44 0 0 63 27 11 0 33 46 21 0 81 6 13 0 49 38 14 0Spain, Valencian region 75 21 4 0 33 33 33 0 56 29 14 0 68 29 3 0 76 22 3 0 91 9 0 0 75 21 4 0 76 20 3 0 87 12 1 0 72 23 4 0Sweden 60 32 7 0 18 45 36 0 45 40 16 0 52 34 14 0 68 30 2 0 72 28 0 0 60 32 8 0 60 32 7 0 66 30 5 0 59 33 8 0Switzerland † 75 18 7 0 26 36 38 0 59 21 20 0 65 21 13 0 82 17 2 0 88 12 0 0 75 17 7 0 75 18 7 0 85 14 1 0 73 18 9 0the Netherlands † 68 17 14 0 34 29 36 0 54 18 28 0 61 17 22 0 72 17 11 0 82 17 1 0 69 17 14 0 67 18 15 0 76 21 3 0 67 16 17 0United Kingdom, All countries * † 71 20 9 0 53 26 20 0 66 21 12 0 78 17 5 0 83 16 1 0 72 20 8 0 69 20 11 0 76 19 5 0 69 20 11 0United Kingdom, England * † 71 20 9 0 54 26 20 0 66 22 12 0 78 17 5 0 82 17 1 0 72 20 8 0 69 20 11 0 76 20 5 0 69 21 10 0United Kingdom, Northern Ireland * † 60 21 20 0 27 36 36 0 55 15 30 0 55 23 22 0 83 18 0 0 59 22 20 0 61 20 20 0 80 11 9 0 53 24 23 0United Kingdom, Scotland 75 15 10 0 60 10 30 0 59 23 17 0 72 14 14 0 81 15 3 0 91 9 0 0 75 16 10 0 76 14 10 0 78 17 5 0 74 14 12 0United Kingdom, Wales * † 74 20 6 0 54 33 13 0 66 25 8 0 79 15 6 0 90 10 0 0 76 18 6 0 70 23 6 0 78 20 2 0 73 20 8 0
Abbreviations used: HD: haemodialysis; PD: peritoneal dialysis; Tx: transplant; Un: unknown; DM: diabetes mellitusCategories may not add up because of missing values or rounding off* Patients younger than 20 years of age are not reported† The incident counts at day 91, on which the data presented in this table are based, are estimated (see methods)
B3 INCIDENT PATIENTS ACCEPTED FOR RRT IN 2015, AT DAY 91
Table B.3.11Percentages of treatment modality by age, gender, and primary renal disease, unadjustedat day 91

All 0-19 20-44 45-64 65-74 75+
All Men Women All Men Women All Men Women All Men Women All Men Women All Men Women
N (100%) N (100%) N (100%) N % N % N % N % N % N % N % N % N % N % N % N % N % N % N %
59
Austria 9259 5921 3338 92 1 64 1 28 1 1257 14 777 13 480 14 3800 41 2433 41 1367 41 2368 26 1571 27 797 24 1742 19 1076 18 666 20Belgium, Dutch-speaking * 8142 4844 3298 864 11 526 11 338 10 2699 33 1644 34 1055 32 1950 24 1210 25 740 22 2629 32 1464 30 1165 35Belgium, French-speaking * 6143 3900 2243 721 12 452 12 269 12 2132 35 1356 35 776 35 1559 25 1014 26 545 24 1731 28 1078 28 653 29Bosnia and Herzegovina 2653 1580 1073 22 1 15 1 7 1 456 17 282 18 174 16 1105 42 682 43 423 39 642 24 358 23 284 26 428 16 243 15 185 17Denmark 5190 3257 1933 86 2 55 2 31 2 972 19 604 19 368 19 2093 40 1293 40 800 41 1256 24 802 25 454 23 783 15 503 15 280 14Estonia 869 481 388 6 1 3 1 3 1 178 20 91 19 87 22 377 43 227 47 150 39 178 20 93 19 85 22 130 15 67 14 63 16Finland 4679 2990 1689 120 3 68 2 52 3 689 15 445 15 244 14 1981 42 1243 42 738 44 1238 26 804 27 434 26 651 14 430 14 221 13France 83042 50721 32321 904 1 530 1 374 1 11749 14 7111 14 4638 14 30429 37 18648 37 11781 36 19109 23 12006 24 7103 22 20851 25 12426 24 8425 26Greece 13359 8609 4750 102 1 59 1 43 1 1594 12 1032 12 562 12 4644 35 3082 36 1562 33 3128 23 2044 24 1084 23 3891 29 2392 28 1499 32Iceland 218 134 84 6 3 4 3 2 2 61 28 33 25 28 33 80 37 52 39 28 33 49 22 31 23 18 21 22 10 14 10 8 10Norway 4836 3151 1685 80 2 47 1 33 2 840 17 530 17 310 18 1936 40 1270 40 666 40 1166 24 762 24 404 24 814 17 542 17 272 16Romania || 18977 10721 8256 117 1 59 1 58 1 2988 16 1821 17 1167 14 7898 42 4568 43 3330 40 4484 24 2460 23 2024 25 3490 18 1813 17 1677 20Serbia 5673 3423 2219 47 1 23 1 15 1 929 16 564 16 363 16 2563 45 1559 46 996 45 1361 24 820 24 533 24 773 14 457 13 312 14Spain, Andalusia 9640 5907 3733 98 1 60 1 38 1 1584 16 994 17 590 16 3884 40 2466 42 1418 38 2271 24 1379 23 892 24 1803 19 1008 17 795 21Spain, Aragon 1539 1006 533 9 1 4 0 5 1 200 13 116 12 84 16 598 39 403 40 195 37 347 23 239 24 108 20 385 25 244 24 141 26Spain, Asturias 1256 817 439 8 1 6 1 2 0 136 11 89 11 47 11 536 43 352 43 184 42 301 24 203 25 98 22 275 22 167 20 108 25Spain, Basque country 2656 1707 949 27 1 14 1 13 1 383 14 242 14 141 15 991 37 638 37 353 37 686 26 441 26 245 26 569 21 372 22 197 21Spain, Cantabria * 662 455 207 88 13 52 11 36 17 267 40 182 40 85 41 176 27 126 28 50 24 131 20 95 21 36 17Spain, Castile and León * 2761 1837 924 307 11 202 11 105 11 1060 38 713 39 347 38 651 24 439 24 212 23 743 27 483 26 260 28Spain, Castile-La Mancha * 2241 1378 863 309 14 188 14 121 14 920 41 597 43 323 37 497 22 305 22 192 22 515 23 288 21 227 26Spain, Catalonia 10171 6397 3774 117 1 68 1 49 1 1331 13 849 13 482 13 3709 36 2342 37 1367 36 2580 25 1672 26 908 24 2434 24 1466 23 968 26Spain, Extremadura 1256 776 480 4 0 1 0 3 1 175 14 111 14 64 13 539 43 354 46 185 39 268 21 170 22 98 20 270 21 140 18 130 27Spain, Galicia 3559 2274 1285 16 0 10 0 6 0 466 13 279 12 187 15 1411 40 913 40 498 39 902 25 593 26 309 24 764 21 479 21 285 22Spain, Community of Madrid 7008 4425 2583 83 1 46 1 37 1 1017 15 590 13 427 17 2726 39 1753 40 973 38 1636 23 1066 24 570 22 1546 22 970 22 576 22Spain, Region of Murcia 1888 1213 675 13 1 10 1 3 0 251 13 156 13 95 14 757 40 473 39 284 42 460 24 319 26 141 21 407 22 255 21 152 23Spain, Navarre * 799 516 283 114 14 71 14 43 15 318 40 206 40 112 40 199 25 129 25 70 25 168 21 110 21 58 20Spain, Valencian region 6638 4165 2473 63 1 44 1 19 1 871 13 547 13 324 13 2430 37 1517 36 913 37 1633 25 1049 25 584 24 1641 25 1008 24 633 26Sweden 9421 6051 3370 177 2 104 2 73 2 1517 16 928 15 589 17 3721 39 2370 39 1351 40 2412 26 1586 26 826 25 1594 17 1063 18 531 16Switzerland † 7714 4825 2884 91 1 49 1 41 1 917 12 561 12 355 12 2722 35 1702 35 1018 35 1788 23 1163 24 624 22 1700 22 1037 21 663 23the Netherlands 16764 10074 6690 232 1 141 1 91 1 2629 16 1575 16 1054 16 6704 40 4011 40 2693 40 4114 25 2507 25 1607 24 3085 18 1840 18 1245 19United Kingdom, All countries * ¶ 60537 36860 23677 11909 20 7097 19 4812 20 26332 43 15957 43 10375 44 12525 21 7610 21 4915 21 9771 16 6196 17 3575 15United Kingdom, England * ¶ 50999 31079 19920 9981 20 5971 19 4010 20 22113 43 13405 43 8708 44 10603 21 6427 21 4176 21 8302 16 5276 17 3026 15United Kingdom, Northern Ireland * 1693 1026 667 363 21 203 20 160 24 696 41 427 42 269 40 322 19 197 19 125 19 312 18 199 19 113 17United Kingdom, Scotland 4923 2898 2025 75 2 49 2 26 1 1003 20 586 20 417 21 2280 46 1338 46 942 47 955 19 576 20 379 19 610 12 349 12 261 13United Kingdom, Wales * 2997 1906 1091 562 19 337 18 225 21 1243 41 787 41 456 42 645 22 410 22 235 22 547 18 372 20 175 16
Categories may not add up because of missing values or rounding off* Patients younger than 20 years of age are not reported|| The prevalence is underestimated by approximately 3% due to an estimated 30% underreporting of patients living on a functioning graft† The prevalence is underestimated by approximately 6% due to an estimated 11% underreporting of patients living on a functioning graft¶ The prevalence is underestimated by approximately 1% due to a small number of centres not submitting complete data for 2015
B4 PREVALENT PATIENTS ON RRT IN 2015
Table B.4.1Prevalent counts and percentages by age and genderprevalent patients on December 31

All 0-19 20-44 45-64 65-74 75+
All Men Women All Men Women All Men Women All Men Women All Men Women All Men Women
Pmp Pmp Pmp Pmarp Pmarp Pmarp Pmarp Pmarp Pmarp Pmarp Pmarp Pmarp Pmarp Pmarp Pmarp Pmarp Pmarp Pmarp
60
Austria 1078.5 1409.6 761.3 54.5 73.9 34.1 439.4 539.4 338.0 1548.7 1997.2 1106.5 2780.2 3973.2 1746.5 2379.2 3842.1 1473.0Belgium, Dutch-speaking * 1257.9 1513.7 1007.8 428.5 516.9 338.4 1499.7 1810.2 1183.4 3095.7 3963.9 2279.4 4201.0 5799.6 3120.2Belgium, French-speaking * 1279.3 1662.0 913.6 443.8 553.3 333.1 1720.5 2209.8 1240.5 3829.6 5375.2 2494.8 4506.3 7661.0 2682.7Bosnia and Herzegovina 751.3 912.1 596.5 28.0 37.1 18.3 372.7 453.0 289.5 1084.1 1372.8 809.6 2183.5 2776.9 1720.1 2058.0 3029.0 1448.2Denmark 904.2 1141.2 669.9 64.7 80.7 47.9 533.2 654.5 408.8 1376.8 1695.2 1056.2 1980.5 2602.0 1392.9 1808.5 2812.1 1102.0Estonia 660.6 781.2 554.5 22.2 21.6 22.8 394.3 392.7 396.1 1093.1 1409.6 815.9 1396.2 1869.5 1093.3 1074.4 1957.9 726.0Finland 853.9 1108.8 606.9 100.0 110.8 88.6 405.5 510.6 294.8 1345.0 1695.1 997.9 1968.3 2700.3 1310.3 1361.1 2380.9 742.4France 1246.4 1571.7 940.9 55.2 63.2 46.7 572.6 699.5 448.1 1756.6 2210.0 1326.0 3028.6 4050.1 2123.3 3425.3 5356.3 2236.3Greece 1234.6 1641.0 852.1 48.5 54.8 41.9 452.3 584.7 319.4 1594.9 2209.4 1029.8 2839.7 3974.3 1846.0 3299.0 4826.9 2191.9Iceland 659.0 806.1 510.4 67.5 88.2 46.0 527.8 558.8 495.3 987.2 1285.8 689.7 1919.2 2431.6 1408.2 1112.4 1624.3 717.0Norway 932.0 1206.6 653.8 63.5 72.7 53.8 476.4 584.6 361.8 1465.5 1882.6 1030.3 2417.5 3207.3 1650.8 2246.7 3699.5 1260.4Romania || 967.4 1118.9 822.7 28.4 27.9 29.0 438.6 519.6 352.9 1484.6 1752.5 1227.2 2465.5 3128.8 1960.4 2246.9 3167.5 1709.7Serbia 799.5 990.6 609.6 34.0 32.3 22.3 396.1 473.2 314.8 1258.2 1580.0 948.3 1818.9 2445.6 1290.7 1331.4 1997.9 886.8Spain, Andalusia 1147.3 1421.8 878.8 54.1 64.3 43.2 533.9 659.9 404.0 1724.8 2203.4 1251.9 3164.9 4077.2 2351.5 2758.8 3911.1 2008.5Spain, Aragon 1163.6 1534.6 799.1 36.4 31.4 41.7 464.2 523.5 401.4 1632.2 2173.9 1077.4 2698.1 3906.1 1601.8 2577.1 4076.2 1574.8Spain, Asturias 1196.3 1626.3 801.8 52.3 76.4 26.9 418.0 542.4 291.4 1677.6 2260.2 1123.5 2547.0 3729.6 1537.3 2052.1 3367.1 1279.5Spain, Basque country 1227.0 1625.4 851.6 67.9 68.5 67.3 572.7 717.1 425.6 1568.6 2052.7 1099.8 2964.4 4071.6 1990.3 2422.0 4172.6 1351.4Spain, Cantabria * 1133.7 1594.4 693.3 464.3 541.1 385.4 1557.5 2137.7 985.1 3040.8 4624.2 1632.3 2117.8 4049.6 937.6Spain, Castile and León * 1119.4 1505.9 741.2 409.5 524.6 288.0 1472.7 1943.3 983.4 2468.7 3423.6 1564.9 2233.7 3622.9 1304.5Spain, Castile-La Mancha * 1090.0 1332.7 844.5 433.8 508.9 352.8 1693.0 2139.0 1222.1 2918.5 3727.0 2170.5 2477.8 3347.4 1863.6Spain, Catalonia 1354.7 1732.8 988.9 76.6 86.4 66.2 503.3 630.8 371.1 1877.9 2393.9 1371.4 3748.0 5203.8 2473.7 3615.3 5658.8 2337.1Spain, Extremadura 1149.1 1431.5 871.3 19.2 9.4 29.5 477.8 591.4 358.5 1788.5 2300.2 1254.5 2674.8 3580.2 1859.2 2313.4 3040.2 1839.8Spain, Galicia 1304.8 1724.8 911.9 37.1 44.9 28.8 535.2 635.3 433.3 1838.8 2423.9 1274.8 2901.5 4074.1 1869.1 2197.5 3569.8 1335.0Spain, Community of Madrid 1088.7 1433.4 771.1 63.8 69.0 58.3 432.4 507.7 358.9 1599.5 2157.2 1091.3 2927.3 4230.5 1857.3 2967.2 5005.7 1760.1Spain, Region of Murcia 1286.7 1649.4 922.3 38.4 57.4 18.2 462.7 554.5 363.8 2066.8 2571.7 1557.5 4092.7 6053.9 2361.7 3795.3 5904.0 2373.2Spain, Navarre * 1254.4 1634.1 881.1 545.0 666.8 418.8 1824.6 2331.6 1303.3 3307.3 4429.8 2254.5 2704.7 4487.6 1542.4Spain, Valencian region 1332.7 1692.5 981.4 63.8 86.7 39.6 503.0 617.7 382.9 1803.8 2271.1 1344.2 3372.7 4610.6 2275.3 3810.5 5857.7 2448.0Sweden 961.4 1234.5 688.1 79.6 90.8 67.7 473.4 566.4 376.0 1525.1 1924.7 1117.9 2214.4 2958.6 1493.2 1895.8 3035.2 1082.4Switzerland † 931.4 1177.5 689.2 54.5 57.1 50.5 326.8 395.6 255.8 1170.0 1454.1 880.6 2246.1 3056.1 1501.8 2484.5 3824.9 1604.8the Netherlands 989.6 1200.0 782.9 60.7 72.1 48.8 496.3 591.8 399.8 1404.7 1676.3 1131.5 2346.6 2911.1 1801.5 2385.4 3516.8 1616.7United Kingdom, All countries * ¶ 929.8 1149.2 716.7 554.0 659.9 448.0 1581.6 1946.1 1228.0 1975.6 2494.0 1494.6 1853.6 2815.1 1164.3United Kingdom, England * ¶ 930.9 1149.8 717.7 548.8 655.2 442.0 1592.8 1957.1 1238.0 2006.0 2524.3 1524.2 1875.8 2843.9 1177.1United Kingdom, Northern Ireland * 914.3 1128.6 707.7 596.1 675.2 519.0 1486.3 1848.6 1133.6 1980.1 2534.0 1472.7 2414.8 3807.4 1468.7United Kingdom, Scotland 916.2 1110.1 733.0 64.7 82.6 45.9 573.3 680.1 469.7 1539.6 1858.1 1238.1 1751.4 2220.4 1325.8 1393.6 1979.9 998.3United Kingdom, Wales * 967.1 1249.4 693.3 590.5 704.4 475.3 1523.6 1972.7 1093.7 1863.6 2438.3 1320.6 1962.9 3173.0 1084.0
* Patients younger than 20 years of age are not reported|| The prevalence is underestimated by approximately 3% due to an estimated 30% underreporting of patients living on a functioning graft† The prevalence is underestimated by approximately 6% due to an estimated 11% underreporting of patients living on a functioning graft¶ The prevalence is underestimated by approximately 1% due to a small number of centres not submitting complete data for 2015
B4 PREVALENT PATIENTS ON RRT IN 2015
Table B.4.2Prevalence per million (age-related) population by age and gender, unadjustedprevalent patients on December 31

All Men Women
% Mean SD Median % Mean SD Median % Mean SD Median (years) (years) (years) (years) (years) (years)
61
Austria 100 61.0 15.3 62.6 63.9 61.0 15.1 62.7 36.1 61.0 15.6 62.5Belgium, Dutch-speaking * 100 65.8 15.3 67.6 59.5 65.3 15.1 67.0 40.5 66.5 15.5 68.5Belgium, French-speaking * 100 64.8 15.3 66.3 63.5 64.8 15.1 66.3 36.5 64.8 15.8 66.3Bosnia and Herzegovina 100 59.4 15.1 61.5 59.6 58.9 15.0 60.7 40.4 60.2 15.2 62.5Denmark 100 58.4 16.1 59.9 62.8 58.6 16.2 60.2 37.2 58.1 16.1 59.5Estonia 100 57.8 15.3 58.3 55.4 57.7 14.8 57.1 44.6 57.8 15.9 59.8Finland 100 58.8 16.3 61.2 63.9 59.2 16.2 61.7 36.1 58.2 16.5 60.2France 100 63.0 16.5 65.0 61.1 62.9 16.3 65.0 38.9 63.0 16.8 65.0Greece 100 64.0 15.7 66.1 64.4 63.7 15.4 65.7 35.6 64.6 16.1 66.9Iceland 100 54.6 17.2 55.4 61.5 55.2 17.3 55.7 38.5 53.6 17.1 54.9Norway 100 59.3 16.2 61.3 65.2 59.5 16.1 61.6 34.8 58.9 16.4 60.7Romania 100 60.5 15.2 62.3 56.5 59.9 15.1 61.5 43.5 61.4 15.2 63.2Serbia 100 59.2 14.4 61.3 60.3 59.3 14.2 61.4 39.1 59.2 14.4 60.9Spain, Andalusia 100 60.2 15.6 61.6 61.3 59.7 15.4 60.8 38.7 61.0 15.9 63.0Spain, Aragon 100 62.7 15.3 64.0 65.4 63.1 14.8 64.3 34.6 62.1 16.2 62.9Spain, Asturias 100 62.8 14.3 63.2 65.0 62.7 14.2 63.1 35.0 62.8 14.6 63.4Spain, Basque country 100 61.8 15.5 63.8 64.3 62.1 15.3 64.0 35.7 61.2 15.8 63.0Spain, Cantabria * 100 62.2 14.5 63.5 68.7 63.0 14.3 64.2 31.3 60.4 14.9 60.4Spain, Castile and León * 100 64.3 14.6 65.3 66.5 64.1 14.4 65.0 33.5 64.6 14.9 65.5Spain, Castile-La Mancha * 100 62.0 14.6 62.7 61.5 61.7 14.3 62.2 38.5 62.5 15.1 64.2Spain, Catalonia 100 62.7 15.8 64.7 62.9 62.5 15.5 64.6 37.1 63.0 16.1 64.9Spain, Extremadura 100 61.4 15.0 61.8 61.8 60.8 14.3 61.3 38.2 62.3 15.9 64.0Spain, Galicia 100 62.2 14.8 63.8 63.9 62.4 14.4 63.9 36.1 62.1 15.4 63.6Spain, Community of Madrid 100 61.5 15.8 62.8 63.1 61.9 15.5 63.3 36.9 60.9 16.3 62.1Spain, Region of Murcia 100 61.8 15.2 63.2 64.2 62.0 15.0 63.8 35.8 61.5 15.5 61.9Spain, Navarre * 100 62.0 14.6 63.6 64.6 62.4 14.3 63.9 35.4 61.4 15.1 62.7Spain, Valencian region 100 62.8 15.7 64.7 62.7 62.8 15.7 64.7 37.3 62.9 15.6 64.7Sweden 100 59.6 16.2 61.8 64.2 60.1 16.1 62.5 35.8 58.8 16.4 60.8Switzerland 100 62.5 15.9 64.4 62.5 62.6 15.7 64.5 37.4 62.3 16.3 63.9the Netherlands 100 60.1 16.0 62.1 60.1 60.1 16.0 62.2 39.9 60.1 16.0 62.0United Kingdom, All countries * 100 58.6 15.5 59.0 60.9 58.9 15.5 59.4 39.1 58.1 15.4 58.5United Kingdom, England * 100 58.6 15.5 59.1 60.9 58.9 15.5 59.4 39.1 58.2 15.4 58.7United Kingdom, Northern Ireland * 100 58.4 16.1 58.0 60.6 59.0 15.8 59.0 39.4 57.5 16.4 57.1United Kingdom, Scotland 100 56.6 15.7 57.3 58.9 56.6 15.7 57.6 41.1 56.6 15.6 56.9United Kingdom, Wales * 100 59.4 15.7 60.0 63.6 59.9 15.7 60.7 36.4 58.4 15.7 59.4
Categories may not add up because of missing values or rounding off* Patients younger than 20 years of age are not reported
B4 PREVALENT PATIENTS ON RRT IN 2015
Table B.4.3Gender, mean age, and median ageprevalent patients on December 31

Pmp Pmp Pmp
All Men Women
62
Austria 1035.3 1343.2 741.6Belgium, Dutch-speaking * 1161.9 1371.7 961.7Belgium, French-speaking * 1340.1 1741.9 957.0Bosnia and Herzegovina 782.8 959.6 614.2Denmark 888.2 1111.4 675.3Estonia 663.3 803.6 529.4Finland 809.6 1043.4 586.7France 1234.6 1538.6 944.7Greece 1110.0 1453.2 782.6Iceland 726.1 883.7 575.8Norway 969.5 1248.3 703.6Romania || 954.2 1121.7 794.5Serbia 733.6 916.5 559.2Spain, Andalusia 1168.9 1441.8 908.6Spain, Aragon 1054.9 1383.6 741.4Spain, Asturias 988.0 1317.0 674.2Spain, Basque country 1092.6 1423.6 777.0Spain, Cantabria * 1020.1 1418.3 640.3Spain, Castile and León * 924.6 1225.1 638.0Spain, Castile-La Mancha * 1076.3 1308.9 854.5Spain, Catalonia 1325.9 1687.5 981.1Spain, Extremadura 1076.9 1336.6 829.2Spain, Galicia 1115.6 1448.5 798.0Spain, Community of Madrid 1113.4 1460.3 782.5Spain, Region of Murcia 1405.0 1814.4 1014.6Spain, Navarre * 1197.0 1541.2 868.7Spain, Valencian region 1277.5 1612.6 958.0Sweden 939.0 1192.2 697.4Switzerland † 844.7 1054.2 644.9the Netherlands 964.8 1153.0 785.3United Kingdom, All countries * ¶ 947.5 1159.6 745.3United Kingdom, England * ¶ 953.1 1165.4 750.6United Kingdom, Northern Ireland * 981.6 1204.5 769.1United Kingdom, Scotland 902.8 1084.9 729.1United Kingdom, Wales * 944.1 1206.3 694.0
* Patients younger than 20 years of age are not reported|| The prevalence is underestimated by approximately 3% due to an estimated 30% underreporting of patients living on a functioning graft† The prevalence is underestimated by approximately 6% due to an estimated 11% underreporting of patients living on a functioning graft¶ The prevalence is underestimated by approximately 1% due to a small number of centres not submitting complete data for 2015
B4 PREVALENT PATIENTS ON RRT IN 2015
Table B.4.4Prevalence per million population, adjustedprevalent patients on December 31, adjusted for age and gender

All GN PN PKD DM HT RVD Misc Unkn Missing
Type I Type II Both
Pmp % Pmp % Pmp % Pmp % Pmp % Pmp % Pmp % Pmp % Pmp % Pmp % Pmp % Pmp %
63
Austria 1078.5 100 246.5 22.9 77.2 7.2 77.3 7.2 57.7 5.3 155.3 14.4 212.9 19.7 92.8 8.6 73.5 6.8 194.3 18.0 103.9 9.6 0 0Belgium, Dutch-speaking * 1257.9 100 220.3 17.5 90.2 7.2 125.6 10.0 52.5 4.2 163.8 13.0 216.3 17.2 100.3 8.0 61.2 4.9 324.9 25.8 119.1 9.5 0 0Belgium, French-speaking * 1279.3 100 211.2 16.5 101.8 8.0 99.5 7.8 35.8 2.8 187.2 14.6 223.0 17.4 197.2 15.4 30.4 2.4 330.7 25.9 85.4 6.7 0 0Bosnia and Herzegovina 751.3 100 148.7 19.8 114.1 15.2 39.1 5.2 94.6 12.6 50.4 6.7 145.0 19.3 81.6 10.9 7.4 1.0 142.2 18.9 73.3 9.8 0 0Denmark 904.2 100 184.9 20.4 61.3 6.8 87.5 9.7 80.3 8.9 72.7 8.0 153.0 16.9 91.3 10.1 0.3 0 145.7 16.1 180.3 19.9 0 0Estonia 660.6 100 175.6 26.6 103.4 15.7 62.3 9.4 123.9 18.8 0 0 123.9 18.8 40.3 6.1 77.5 11.7 77.5 11.7 0 0 0 0Finland 853.9 100 179.4 21.0 73.9 8.7 116.4 13.6 134.7 15.8 82.3 9.6 217.0 25.4 31.8 3.7 4.7 0.6 149.6 17.5 81.0 9.5 0 0France 1246.4 100 259.0 20.8 92.2 7.4 122.2 9.8 198.4 15.9 203.5 16.3 11.5 0.9 220.8 17.7 112.6 9.0 26.3 2.1Greece 1234.6 100 218.8 17.7 78.1 6.3 98.6 8.0 26.6 2.2 203.0 16.4 229.6 18.6 113.4 9.2 17.1 1.4 119.2 9.7 359.7 29.1 0 0Iceland 659.0 100 178.3 27.1 57.4 8.7 69.5 10.6 48.4 7.3 21.2 3.2 69.5 10.6 96.7 14.7 6.0 0.9 154.2 23.4 27.2 4.1 0 0Norway 932.0 100 262.1 28.1 71.7 7.7 100.6 10.8 124.1 13.3 164.2 17.6 6.6 0.7 180.8 19.4 21.8 2.3 0.2 0Romania || 967.4 100 195.2 20.2 90.2 9.3 48.2 5.0 101.7 10.5 51.2 5.3 6.0 0.6 140.9 14.6 333.0 34.4 1.0 0.1Serbia 799.5 100 153.1 19.1 84.8 10.6 53.6 6.7 50.6 6.3 81.2 10.2 131.8 16.5 195.3 24.4 8.6 1.1 107.7 13.5 62.3 7.8 2.4 0.3Spain, Andalusia 1147.3 100 152.7 13.3 117.0 10.2 110.1 9.6 175.7 15.3 89.9 7.8 0.5 0 161.0 14.0 340.5 29.7 0 0Spain, Aragon 1163.6 100 208.7 17.9 65.8 5.7 95.3 8.2 70.3 6.0 109.6 9.4 180.0 15.5 111.1 9.6 25.7 2.2 142.9 12.3 334.2 28.7 0 0Spain, Asturias 1196.3 100 243.8 20.4 80.0 6.7 132.4 11.1 55.2 4.6 141.0 11.8 196.2 16.4 155.3 13.0 14.3 1.2 181.0 15.1 186.7 15.6 6.7 0.6Spain, Basque country 1227.0 100 203.7 16.6 95.2 7.8 147.4 12.0 41.1 3.4 91.0 7.4 132.1 10.8 135.8 11.1 41.1 3.4 172.8 14.1 298.9 24.4 0 0Spain, Cantabria * 1133.7 100 368.2 32.5 97.6 8.6 111.3 9.8 46.2 4.1 106.2 9.4 152.4 13.4 118.2 10.4 80.5 7.1 135.3 11.9 58.2 5.1 12.0 1.1Spain, Castile and León * ‡ 1119.4 100 195.0 17.4 67.7 6.0 98.5 8.8 68.5 6.1 124.5 11.1 193.0 17.2 141.1 12.6 0 0 135.8 12.1 288.3 25.8 0 0Spain, Castile-La Mancha * 1090.0 100 226.7 20.8 132.3 12.1 125.0 11.5 165.9 15.2 68.1 6.2 18.5 1.7 120.6 11.1 229.1 21.0 3.9 0.4Spain, Catalonia 1354.7 100 273.3 20.2 133.5 9.9 137.6 10.2 36.4 2.7 149.0 11.0 188.3 13.9 115.2 8.5 38.8 2.9 147.2 10.9 320.9 23.7 0 0Spain, Extremadura 1149.1 100 222.3 19.3 86.9 7.6 114.4 10.0 174.7 15.2 79.6 6.9 18.3 1.6 123.5 10.7 316.6 27.5 12.8 1.1Spain, Galicia 1304.8 100 256.6 19.7 86.9 6.7 144.4 11.1 58.7 4.5 164.2 12.6 222.9 17.1 106.3 8.1 35.6 2.7 184.8 14.2 267.3 20.5 0 0Spain, Community of Madrid 1088.7 100 234.3 21.5 85.9 7.9 116.2 10.7 45.2 4.2 148.5 13.6 193.7 17.8 120.7 11.1 15.7 1.4 183.9 16.9 138.3 12.7 0 0Spain, Region of Murcia 1286.7 100 341.4 26.5 107.7 8.4 78.4 6.1 175.2 13.6 72.2 5.6 59.3 4.6 186.7 14.5 265.8 20.7 0 0Spain, Navarre * 1254.4 100 235.5 18.8 42.4 3.4 166.4 13.3 67.5 5.4 108.3 8.6 175.8 14.0 180.5 14.4 4.7 0.4 262.2 20.9 186.8 14.9 0 0Spain, Valencian region 1332.7 100 250.2 18.8 128.7 9.7 117.3 8.8 177.3 13.3 174.3 13.1 46.6 3.5 155.0 11.6 283.5 21.3 0 0Sweden ‡ 961.4 100 245.0 25.5 49.7 5.2 100.2 10.4 170.2 17.7 88.6 9.2 1.0 0.1 201.0 20.9 105.6 11.0 0 0Switzerland † 931.4 100 210.2 22.6 34.3 3.7 34.4 3.7 43.0 4.6 97.8 10.5 140.8 15.1 102.0 11.0 26.4 2.8 261.3 28.1 74.6 8.0 47.3 5.1the Netherlands 989.6 100 158.0 16.0 68.5 6.9 80.2 8.1 38.4 3.9 86.8 8.8 125.3 12.7 109.4 11.1 61.0 6.2 189.5 19.1 113.4 11.5 84.4 8.5United Kingdom, All countries * ¶ 929.8 100 177.7 19.1 98.0 10.5 90.0 9.7 154.1 16.6 57.2 6.1 15.0 1.6 167.2 18.0 145.5 15.6 25.1 2.7United Kingdom, England * ¶ 930.9 100 172.3 18.5 93.9 10.1 87.4 9.4 154.8 16.6 60.8 6.5 14.9 1.6 167.2 18.0 150.2 16.1 29.3 3.2United Kingdom, Northern Ireland * 914.3 100 176.6 19.3 144.2 15.8 108.6 11.9 139.3 15.2 37.8 4.1 12.4 1.4 176.1 19.3 109.1 11.9 10.3 1.1United Kingdom, Scotland 916.2 100 201.6 22.0 121.3 13.2 106.6 11.6 145.4 15.9 35.9 3.9 13.4 1.5 180.0 19.6 111.9 12.2 0.2 0United Kingdom, Wales * 967.1 100 236.2 24.4 107.1 11.1 96.2 9.9 164.2 17.0 40.7 4.2 21.3 2.2 155.9 16.1 142.9 14.8 2.6 0.3
Abbreviations used: GN: glomerulonephritis/sclerosis; PN: pyelonephritis; PKD: polycystic kidneys, adult type; DM: diabetes mellitus; HT: hypertension; RVD: renal vascular disease; Misc: miscellaneous; Unkn: unknownCategories may not add up because of rounding off or a limited number of cases (<10%) with diabetes mellitus type unknown; When cells are left empty, (complete) data are unavailable* Patients younger than 20 years of age are not reported|| The prevalence is underestimated by approximately 3% due to an estimated 30% underreporting of patients living on a functioning graft‡ Mapping the 2012 Primary Renal Disease (PRD) codes to the old PRD codes results in a different distribution of PRD groups† The prevalence is underestimated by approximately 6% due to an estimated 11% underreporting of patients living on a functioning graft¶ The prevalence is underestimated by approximately 1% due to a small number of centres not submitting complete data for 2015
B4 PREVALENT PATIENTS ON RRT IN 2015
Table B.4.5Prevalence per million population and percentages by primary renal disease, unadjustedprevalent patients on December 31

All GN PN PKD DM HT RVD Misc Unkn Missing
Type I Type II Both
Pmp Pmp Pmp Pmp Pmp Pmp Pmp Pmp Pmp Pmp Pmp Pmp
64
B4 PREVALENT PATIENTS ON RRT IN 2015
Table B.4.6Prevalence per million population by primary renal disease, adjustedprevalent patients on December 31, adjusted for age and gender
Austria 1035.3 236.2 75.0 73.5 55.3 148.4 203.7 88.6 69.7 188.5 100.0 0Belgium, Dutch-speaking * 1161.9 207.3 85.3 117.4 49.5 146.4 195.8 89.6 52.7 302.1 111.5 0Belgium, French-speaking * 1340.1 220.8 107.1 104.4 37.6 199.4 237.1 204.9 31.6 345.0 89.1 0Bosnia and Herzegovina 782.8 148.4 120.0 38.4 98.3 51.8 150.2 86.9 9.0 154.7 75.2 0Denmark 888.2 184.7 61.8 83.1 79.8 68.1 148.0 87.4 0.4 145.5 177.4 0Estonia 663.3 179.1 100.8 59.0 127.4 0 127.4 40.6 77.2 79.1 0 0Finland 809.6 169.3 70.8 104.5 136.8 71.9 208.7 29.4 4.3 146.3 76.3 0France 1234.6 263.2 94.0 121.0 194.4 190.7 11.0 224.1 109.7 26.4Greece 1110.0 207.6 72.5 92.0 26.2 173.7 199.9 97.0 14.9 111.4 314.7 0Iceland 726.1 195.5 64.9 79.3 51.1 22.6 73.7 110.4 7.1 164.5 30.7 0Norway 969.5 270.0 74.8 105.4 128.3 174.3 6.7 187.4 22.4 0.2Romania || 954.2 192.5 88.9 46.8 99.0 51.2 6.0 139.6 329.3 1.0Serbia 733.6 145.7 79.4 47.4 47.1 71.2 118.3 176.7 7.4 98.5 57.9 2.3Spain, Andalusia 1168.9 151.8 118.7 113.4 180.9 92.8 0.5 163.5 347.3 0Spain, Aragon 1054.9 193.8 61.3 88.6 65.6 96.7 162.3 92.5 20.7 133.8 301.9 0Spain, Asturias 988.0 205.8 71.2 109.1 48.1 112.4 160.5 115.6 11.1 158.8 149.4 6.5Spain, Basque country 1092.6 186.0 85.5 128.4 37.5 78.9 116.4 114.5 34.4 163.0 264.4 0Spain, Cantabria * 1020.1 331.6 88.9 98.0 42.6 95.5 138.1 101.5 72.1 127.1 52.1 10.8Spain, Castile and León * ‡ 924.6 168.4 58.4 84.2 59.8 95.5 155.3 101.8 0 115.2 241.3 0Spain, Castile-La Mancha * 1076.3 226.9 128.8 127.4 167.3 64.4 17.5 119.5 220.7 3.8Spain, Catalonia 1325.9 269.4 129.7 137.5 35.2 147.8 186.1 111.3 37.5 145.1 309.2 0Spain, Extremadura 1076.9 213.2 81.4 111.3 161.7 72.8 16.0 118.5 289.6 12.5Spain, Galicia 1115.6 228.5 77.5 125.1 54.5 131.0 185.4 83.7 26.6 168.7 220.0 0Spain, Community of Madrid 1113.4 237.7 85.4 120.5 43.8 158.4 202.2 124.7 16.2 185.9 140.7 0Spain, Region of Murcia 1405.0 367.9 114.8 85.3 193.8 80.4 66.1 202.6 294.0 0Spain, Navarre * 1197.0 228.2 42.6 159.2 63.6 105.9 169.5 163.5 4.5 254.0 175.4 0Spain, Valencian region 1277.5 241.4 124.2 113.4 170.2 164.3 44.2 150.6 269.3 0Sweden ‡ 939.0 242.2 49.1 97.5 164.6 82.0 1.0 198.5 104.1 0Switzerland † 844.7 187.2 31.7 33.7 36.0 93.1 129.1 96.0 25.1 223.7 72.1 46.2the Netherlands 964.8 153.4 67.7 75.6 37.6 83.0 120.6 107.2 59.6 186.7 112.1 82.0United Kingdom, All countries * ¶ 947.5 181.9 100.7 91.8 156.7 57.7 14.6 171.1 147.6 25.4United Kingdom, England * ¶ 953.1 177.1 96.6 89.9 158.4 61.8 14.6 171.7 153.1 29.8United Kingdom, Northern Ireland * 981.6 188.4 153.6 115.2 149.5 42.1 13.9 189.6 118.0 11.3United Kingdom, Scotland 902.8 199.6 121.3 101.9 142.9 34.6 12.9 178.4 111.1 0.2United Kingdom, Wales * 944.1 233.4 109.8 92.6 159.0 38.2 18.8 153.2 136.7 2.4
Abbreviations used: GN: glomerulonephritis/sclerosis; PN: pyelonephritis; PKD: polycystic kidneys, adult type; DM: diabetes mellitus; HT: hypertension; RVD: renal vascular disease; Misc: miscellaneous; Unkn: unknownCategories may not add up because of rounding off or a limited number of cases (<10%) with diabetes mellitus type unknown; When cells are left empty, (complete) data are unavailable* Patients younger than 20 years of age are not reported|| The prevalence is underestimated by approximately 3% due to an estimated 30% underreporting of patients living on a functioning graft‡ Mapping the 2012 Primary Renal Disease (PRD) codes to the old PRD codes results in a different distribution of PRD groups† The prevalence is underestimated by approximately 6% due to an estimated 11% underreporting of patients living on a functioning graft¶ The prevalence is underestimated by approximately 1% due to a small number of centres not submitting complete data for 2015

All Haemodialysis Peritoneal dialysis Transplant Unkn Missing
HD HD HD HF HDF Total APD CAPD PD Total Living Deceased Tx Total hospital/ home type HD/ type PD type Tx centre Unkn HF/HDF Unkn Unkn
N N N N N N N N N N N N N N N N N
65
B4 PREVALENT PATIENTS ON RRT IN 2015
Table B.4.7Prevalent counts by treatment modalityprevalent patients on December 31
Austria 9259 2975 2 3 2 1077 4059 200 189 8 397 750 4048 5 4803 0 0Belgium, Dutch-speaking * 8142 2583 56 0 6 1635 4280 238 104 0 342 211 3303 6 3520 0 0Belgium, French-speaking * 6143 2370 55 0 31 870 3326 136 151 0 287 205 2050 266 2521 9 0Bosnia and Herzegovina 2653 2030 0 0 0 256 2286 3 87 1 91 186 85 5 276 0 0Denmark & 5190 1815 145 0 1960 305 208 14 527 1066 1634 2 2702 1 0Estonia 869 310 0 0 1 12 323 41 8 0 49 5 492 0 497 0 0Finland 4679 872 132 0 0 505 1509 203 130 0 333 215 2610 12 2837 0 0France 83042 29973 231 155 72 12275 42706 1181 1851 0 3032 3642 30973 2306 36921 383 0Greece 13359 7240 0 0 1 2788 10029 451 256 0 707 1068 1555 0 2623 0 0Iceland 218 53 0 0 53 3 6 0 9 104 52 0 156 0 0Norway 4836 1158 17 1 1176 214 214 1366 2074 6 3446 0 0Romania || 18977 15850 6 2 8 73 15939 78 1324 4 1406 324 558 737 1619 13 0Serbia 5673 3728 28 3 19 603 4381 37 478 4 519 471 285 0 756 17 0Spain, Andalusia 9640 4121 9 0 4130 406 406 406 4698 0 5104 0 0Spain, Aragon 1539 422 1 0 90 513 14 73 0 87 70 867 0 937 2 0Spain, Asturias 1256 455 1 0 0 2 458 42 74 0 116 33 649 0 682 0 0Spain, Basque country 2656 804 3 0 807 22 160 0 182 117 1545 0 1662 5 0Spain, Cantabria * 662 178 0 0 178 0 31 0 31 27 425 0 452 1 0Spain, Castile and León * 2761 1075 2 0 1077 70 105 0 175 0 1509 0 1509 0 0Spain, Castile-La Mancha * 2241 842 2 0 844 32 85 0 117 1277 1277 3 0Spain, Catalonia 10171 1533 3 0 2719 4255 215 205 0 420 1082 4414 0 5496 0 0Spain, Extremadura 1256 595 10 0 605 39 35 0 74 20 257 300 577 0 0Spain, Galicia 3559 1557 10 0 0 10 1577 104 158 0 262 189 1488 41 1718 2 0Spain, Community of Madrid 7008 2561 21 57 2639 126 226 15 367 249 3752 0 4001 1 0Spain, Region of Murcia 1888 458 0 0 0 495 953 10 92 0 102 51 782 0 833 0 0Spain, Navarre * 799 268 14 0 282 32 10 0 42 29 446 0 475 0 0Spain, Valencian region 6638 3374 17 0 3391 50 391 0 441 98 2008 697 2803 3 0Sweden 9421 2963 137 0 3100 841 841 2336 3143 0 5479 1 0Switzerland † 7714 3134 33 14 0 0 3181 123 266 6 395 1352 2702 78 4132 6 0the Netherlands 16764 5340 279 0 5619 459 405 0 864 4960 5308 13 10281 0 0United Kingdom, All countries * ¶ § 60537 20355 1207 32 15 3052 24661 1951 1559 68 3578 10092 21189 1007 32288 10 0United Kingdom, England * ¶ 50999 16931 1042 16 13 2983 20985 1636 1361 66 3063 8485 17546 910 26941 10 0United Kingdom, Northern Ireland * 1693 563 21 16 0 23 623 79 4 1 84 376 548 62 986 0 0United Kingdom, Scotland 4923 1868 53 0 1921 152 75 0 227 806 1948 21 2775 0 0United Kingdom, Wales * 2997 1003 91 0 2 46 1142 89 119 1 209 458 1174 14 1646 0 0
Abbreviations used: HD: haemodialysis; Unkn: unknown; HF: haemofiltration; HDF: haemodiafiltration; APD: automated peritoneal dialysis; CAPD: continuous ambulatory peritoneal dialysis; PD: peritoneal dialysis; Tx: transplantWhen cells are left empty, (complete) data are unavailable* Patients younger than 20 years of age are not reported & No distinction is made between HD and HDF|| The overall prevalence of RRT is underestimated by approximately 3% due to an estimated 30% underreporting of patients living on a functioning graft† The prevalence is underestimated by approximately 6% due to an estimated 11% underreporting of patients living on a functioning graft¶ The prevalence is underestimated by approximately 1% due to a small number of centres not submitting complete data for 2015§ HDF is not accurately captured from some units and so usage may be an underestimate for the UK

All Haemodialysis Peritoneal dialysis Transplant Unkn Missing
HD HD HD HF HDF Total APD CAPD PD Total Living Deceased Tx Total hospital/ home type HD/ type PD type Tx centre Unkn HF/HDF Unkn Unkn
Pmp Pmp Pmp Pmp Pmp Pmp Pmp Pmp Pmp Pmp Pmp Pmp Pmp Pmp Pmp Pmp Pmp
66
B4 PREVALENT PATIENTS ON RRT IN 2015
Table B.4.8Prevalence per million population by treatment modality, unadjustedprevalent patients on December 31
Austria 1078.5 346.5 0.2 0.3 0.2 125.5 472.8 23.3 22.0 0.9 46.2 87.4 471.5 0.6 559.5 0 0Belgium, Dutch-speaking * 1257.9 399.1 8.7 0 0.9 252.6 661.3 36.8 16.1 0 52.8 32.6 510.3 0.9 543.8 0 0Belgium, French-speaking * 1279.3 493.6 11.5 0 6.5 181.2 692.7 28.3 31.4 0 59.8 42.7 426.9 55.4 525.0 1.9 0Bosnia and Herzegovina 751.3 574.9 0 0 0 72.5 647.4 0.8 24.6 0.3 25.8 52.7 24.1 1.4 78.2 0 0Denmark & 904.2 316.2 25.3 0 341.5 53.1 36.2 2.4 91.8 185.7 284.7 0.3 470.8 0.2 0Estonia 660.6 235.7 0 0 0.8 9.1 245.6 31.2 6.1 0 37.3 3.8 374.0 0 377.8 0 0Finland 853.9 159.1 24.1 0 0 92.2 275.4 37.0 23.7 0 60.8 39.2 476.3 2.2 517.7 0 0France 1246.4 449.9 3.5 2.3 1.1 184.2 641.0 17.7 27.8 0 45.5 54.7 464.9 34.6 554.2 5.7 0Greece 1234.6 669.1 0 0 0.1 257.6 926.8 41.7 23.7 0 65.3 98.7 143.7 0 242.4 0 0Iceland 659.0 160.2 0 0 160.2 9.1 18.1 0 27.2 314.4 157.2 0 471.6 0 0Norway 932.0 223.2 3.3 0.2 226.7 41.2 41.2 263.3 399.7 1.2 664.1 0 0Romania || 967.4 808.0 0.3 0.1 0.4 3.7 812.5 4.0 67.5 0.2 71.7 16.5 28.4 37.6 82.5 0.7 0Serbia 799.5 525.4 3.9 0.4 2.7 85.0 617.4 5.2 67.4 0.6 73.1 66.4 40.2 0 106.5 2.4 0Spain, Andalusia 1147.3 490.5 1.1 0 491.5 48.3 48.3 48.3 559.1 0 607.4 0 0Spain, Aragon 1163.6 319.1 0.8 0 68.0 387.9 10.6 55.2 0 65.8 52.9 655.5 0 708.5 1.5 0Spain, Asturias 1196.3 433.4 1.0 0 0 1.9 436.2 40.0 70.5 0 110.5 31.4 618.2 0 649.6 0 0Spain, Basque country 1227.0 371.4 1.4 0 372.8 10.2 73.9 0 84.1 54.1 713.8 0 767.8 2.3 0Spain, Cantabria * 1133.7 304.8 0 0 304.8 0 53.1 0 53.1 46.2 727.8 0 774.0 1.7 0Spain, Castile and León * 1119.4 435.8 0.8 0 436.7 28.4 42.6 0 71.0 0 611.8 0 611.8 0 0Spain, Castile-La Mancha * 1090.0 409.5 1.0 0 410.5 15.6 41.3 0 56.9 621.1 621.1 1.5 0Spain, Catalonia 1354.7 204.2 0.4 0 362.1 566.7 28.6 27.3 0 55.9 144.1 587.9 0 732.0 0 0Spain, Extremadura 1149.1 544.4 9.1 0 553.5 35.7 32.0 0 67.7 18.3 235.1 274.5 527.9 0 0Spain, Galicia 1304.8 570.8 3.7 0 0 3.7 578.2 38.1 57.9 0 96.1 69.3 545.5 15.0 629.9 0.7 0Spain, Community of Madrid 1088.7 397.9 3.3 8.9 410.0 19.6 35.1 2.3 57.0 38.7 582.9 0 621.6 0.2 0Spain, Region of Murcia 1286.7 312.1 0 0 0 337.4 649.5 6.8 62.7 0 69.5 34.8 533.0 0 567.7 0 0Spain, Navarre * 1254.4 420.7 22.0 0 442.7 50.2 15.7 0 65.9 45.5 700.2 0 745.7 0 0Spain, Valencian region 1332.7 677.4 3.4 0 680.8 10.0 78.5 0 88.5 19.7 403.2 139.9 562.8 0.6 0Sweden 961.4 302.4 14.0 0 316.4 85.8 85.8 238.4 320.7 0 559.1 0.1 0Switzerland † 931.4 378.4 4.0 1.7 0 0 384.1 14.9 32.1 0.7 47.7 163.2 326.2 9.4 498.9 0.7 0the Netherlands 989.6 315.2 16.5 0 331.7 27.1 23.9 0 51.0 292.8 313.3 0.8 606.9 0 0United Kingdom, All countries * ¶ § 929.8 312.6 18.5 0.5 0.2 46.9 378.8 30.0 23.9 1.0 55.0 155.0 325.4 15.5 495.9 0.2 0United Kingdom, England * ¶ 930.9 309.0 19.0 0.3 0.2 54.4 383.0 29.9 24.8 1.2 55.9 154.9 320.3 16.6 491.7 0.2 0United Kingdom, Northern Ireland * 914.3 304.1 11.3 8.6 0 12.4 336.5 42.7 2.2 0.5 45.4 203.1 296.0 33.5 532.5 0 0United Kingdom, Scotland 916.2 347.7 9.9 0 357.5 28.3 14.0 0 42.2 150.0 362.6 3.9 516.5 0 0United Kingdom, Wales * 967.1 323.6 29.4 0 0.6 14.8 368.5 28.7 38.4 0.3 67.4 147.8 378.8 4.5 531.1 0 0
Abbreviations used: HD: haemodialysis; Unkn: unknown; HF: haemofiltration; HDF: haemodiafiltration; APD: automated peritoneal dialysis; CAPD: continuous ambulatory peritoneal dialysis; PD: peritoneal dialysis; Tx: transplantCategories may not add up because of rounding off; When cells are left empty, (complete) data are unavailable* Patients younger than 20 years of age are not reported & No distinction is made between HD and HDF|| The overall prevalence of RRT is underestimated by approximately 3% due to an estimated 30% underreporting of patients living on a functioning graft† The prevalence is underestimated by approximately 6% due to an estimated 11% underreporting of patients living on a functioning graft¶ The prevalence is underestimated by approximately 1% due to a small number of centres not submitting complete data for 2015§ HDF is not accurately captured from some units and so usage may be an underestimate for the UK

All Haemodialysis Peritoneal dialysis Transplant Unkn Missing
HD HD HD HF HDF Total APD CAPD PD Total Living Deceased Tx Total hospital/ home type HD/ type PD type Tx centre Unkn HF/HDF Unkn Unkn
Pmp Pmp Pmp Pmp Pmp Pmp Pmp Pmp Pmp Pmp Pmp Pmp Pmp Pmp Pmp Pmp Pmp
67
B4 PREVALENT PATIENTS ON RRT IN 2015
Table B.4.9Prevalence per million population by treatment modality, adjustedprevalent patients on December 31, adjusted for age and gender
Austria 1035.3 331.4 0.2 0.3 0.2 119.2 451.4 22.6 21.1 0.9 44.6 85.4 453.2 0.6 539.2 0 0Belgium, Dutch-speaking * 1161.9 355.9 8.0 0 0.8 225.9 590.5 34.6 15.2 0 49.9 33.3 487.3 0.9 521.5 0 0Belgium, French-speaking * 1340.1 514.7 12.0 0 6.8 191.4 724.9 29.8 33.6 0 63.4 44.1 447.8 58.2 550.0 1.9 0Bosnia and Herzegovina 782.8 607.4 0 0 0 72.7 680.1 0.8 24.9 0.3 25.9 52.0 23.4 1.4 76.8 0 0Denmark & 888.2 307.3 25.0 0 332.2 51.2 34.7 2.3 88.3 188.6 278.6 0.4 467.5 0.2 0Estonia 663.3 235.0 0 0 0.8 8.7 244.5 30.9 5.6 0 36.5 4.0 378.3 0 382.3 0 0Finland 809.6 147.7 23.8 0 0 85.7 257.2 35.4 22.1 0 57.6 38.6 454.1 2.2 494.8 0 0France 1234.6 434.7 3.6 2.4 1.1 176.7 618.4 17.5 25.9 0 43.4 57.8 474.6 34.7 567.1 5.8 0Greece 1110.0 573.5 0 0 0.1 239.9 813.5 38.3 21.1 0 59.3 98.8 138.4 0 237.1 0 0Iceland 726.1 183.9 0 0 183.9 9.7 23.1 0 32.8 340.1 169.3 0 509.5 0 0Norway 969.5 235.2 3.3 0.2 238.7 44.4 44.4 269.0 416.2 1.2 686.3 0 0Romania || 954.2 796.7 0.3 0.1 0.4 3.7 801.2 4.1 66.6 0.2 70.8 16.2 28.1 37.2 81.6 0.6 0Serbia 733.6 472.1 3.5 0.4 2.4 79.8 558.3 4.7 61.4 0.5 66.7 67.6 38.8 0 106.4 2.3 0Spain, Andalusia 1168.9 506.8 1.0 0 507.9 49.4 49.4 47.9 563.8 0 611.7 0 0Spain, Aragon 1054.9 267.4 0.7 0 60.7 328.8 9.1 51.0 0 60.1 52.8 611.7 0 664.5 1.5 0Spain, Asturias 988.0 338.9 0.8 0 0 1.4 341.1 33.9 56.4 0 90.4 28.7 527.8 0 556.6 0 0Spain, Basque country 1092.6 312.2 1.2 0 313.4 9.2 63.8 0 73.0 53.2 651.0 0 704.1 2.1 0Spain, Cantabria * 1020.1 264.8 0 0 264.8 0 47.4 0 47.4 46.5 659.6 0 706.1 1.7 0Spain, Castile and León * 924.6 324.3 0.9 0 325.3 23.9 34.2 0 58.1 0 541.2 0 541.2 0 0Spain, Castile-La Mancha * 1076.3 391.4 0.8 0 392.2 15.2 40.3 0 55.5 627.1 627.1 1.5 0Spain, Catalonia 1325.9 196.0 0.4 0 348.4 544.8 28.2 26.9 0 55.1 141.1 584.9 0 726.0 0 0Spain, Extremadura 1076.9 494.2 8.9 0 503.2 33.5 29.8 0 63.2 18.1 228.5 263.9 510.5 0 0Spain, Galicia 1115.6 454.3 3.3 0 0 3.3 461.0 34.0 47.8 0 81.8 66.9 488.9 16.1 571.9 0.9 0Spain, Community of Madrid 1113.4 409.3 3.2 9.3 421.8 20.0 35.8 2.3 58.1 38.7 594.6 0 633.3 0.2 0Spain, Region of Murcia 1405.0 346.1 0 0 0 372.7 718.8 6.9 68.6 0 75.5 35.8 574.9 0 610.7 0 0Spain, Navarre * 1197.0 393.9 20.7 0 414.7 47.4 14.8 0 62.2 43.7 676.5 0 720.1 0 0Spain, Valencian region 1277.5 643.1 3.3 0 646.5 9.8 75.5 0 85.3 19.4 389.9 135.9 545.2 0.6 0Sweden 939.0 286.4 14.2 0 300.6 81.5 81.5 241.7 315.1 0 556.7 0.1 0Switzerland † 844.7 366.4 3.8 1.6 0 0 371.8 14.6 31.3 0.7 46.6 141.0 275.5 9.2 425.7 0.7 0the Netherlands 964.8 311.2 16.0 0 327.1 26.8 23.1 0 49.9 285.6 301.4 0.8 587.7 0 0United Kingdom, All countries * ¶ § 947.5 314.2 19.0 0.5 0.2 47.1 381.0 30.3 24.1 1.0 55.4 160.7 334.2 16.0 510.9 0.2 0United Kingdom, England * ¶ 953.1 312.4 19.6 0.3 0.2 55.0 387.5 30.3 25.2 1.2 56.7 161.0 330.4 17.3 508.6 0.2 0United Kingdom, Northern Ireland * 981.6 331.6 12.0 9.8 0 13.6 367.0 46.2 2.4 0.5 49.1 214.8 315.6 35.1 565.5 0 0United Kingdom, Scotland 902.8 337.6 9.6 0 347.2 27.6 13.7 0 41.3 151.2 359.1 4.0 514.3 0 0United Kingdom, Wales * 944.1 300.0 29.4 0 0.7 13.9 344.0 27.8 35.9 0.3 64.0 153.6 378.0 4.5 536.1 0 0
Abbreviations used: HD: haemodialysis; Unkn: unknown; HF: haemofiltration; HDF: haemodiafiltration; APD: automated peritoneal dialysis; CAPD: continuous ambulatory peritoneal dialysis; PD: peritoneal dialysis; Tx: transplantCategories may not add up because of rounding off; When cells are left empty, (complete) data are unavailable* Patients younger than 20 years of age are not reported & No distinction is made between HD and HDF|| The overall prevalence of RRT is underestimated by approximately 3% due to an estimated 30% underreporting of patients living on a functioning graft† The prevalence is underestimated by approximately 6% due to an estimated 11% underreporting of patients living on a functioning graft¶ The prevalence is underestimated by approximately 1% due to a small number of centres not submitting complete data for 2015§ HDF is not accurately captured from some units and so usage may be an underestimate for the UK

All Haemodialysis Peritoneal dialysis Transplant Unkn Missing
HD HD HD HF HDF Total APD CAPD PD Total Living Deceased Tx Total hospital/ home type HD/ type PD type Tx centre Unkn HF/HDF Unkn Unkn
% % % % % % % % % % % % % % % % %
68
B4 PREVALENT PATIENTS ON RRT IN 2015
Table B.4.10Percentages of treatment modality, unadjustedprevalent patients on December 31
Austria 100 32.1 0 0 0 11.6 43.8 2.2 2.0 0.1 4.3 8.1 43.7 0.1 51.9 0 0Belgium, Dutch-speaking * 100 31.7 0.7 0 0.1 20.1 52.6 2.9 1.3 0 4.2 2.6 40.6 0.1 43.2 0 0Belgium, French-speaking * 100 38.6 0.9 0 0.5 14.2 54.1 2.2 2.5 0 4.7 3.3 33.4 4.3 41.0 0.1 0Bosnia and Herzegovina 100 76.5 0 0 0 9.6 86.2 0.1 3.3 0 3.4 7.0 3.2 0.2 10.4 0 0Denmark & 100 35.0 2.8 0 37.8 5.9 4.0 0.3 10.2 20.5 31.5 0 52.1 0 0Estonia 100 35.7 0 0 0.1 1.4 37.2 4.7 0.9 0 5.6 0.6 56.6 0 57.2 0 0Finland 100 18.6 2.8 0 0 10.8 32.3 4.3 2.8 0 7.1 4.6 55.8 0.3 60.6 0 0France 100 36.1 0.3 0.2 0.1 14.8 51.4 1.4 2.2 0 3.7 4.4 37.3 2.8 44.5 0.5 0Greece 100 54.2 0 0 0 20.9 75.1 3.4 1.9 0 5.3 8.0 11.6 0 19.6 0 0Iceland 100 24.3 0 0 24.3 1.4 2.8 0 4.1 47.7 23.9 0 71.6 0 0Norway 100 23.9 0.4 0 24.3 4.4 4.4 28.2 42.9 0.1 71.3 0 0Romania 100 83.5 0 0 0 0.4 84.0 0.4 7.0 0 7.4 1.7 2.9 3.9 8.5 0.1 0Serbia 100 65.7 0.5 0.1 0.3 10.6 77.2 0.7 8.4 0.1 9.1 8.3 5.0 0 13.3 0.3 0Spain, Andalusia 100 42.7 0.1 0 42.8 4.2 4.2 4.2 48.7 0 52.9 0 0Spain, Aragon 100 27.4 0.1 0 5.8 33.3 0.9 4.7 0 5.7 4.5 56.3 0 60.9 0.1 0Spain, Asturias 100 36.2 0.1 0 0 0.2 36.5 3.3 5.9 0 9.2 2.6 51.7 0 54.3 0 0Spain, Basque country 100 30.3 0.1 0 30.4 0.8 6.0 0 6.9 4.4 58.2 0 62.6 0.2 0Spain, Cantabria * 100 26.9 0 0 26.9 0 4.7 0 4.7 4.1 64.2 0 68.3 0.2 0Spain, Castile and León * 100 38.9 0.1 0 39.0 2.5 3.8 0 6.3 0 54.7 0 54.7 0 0Spain, Castile-La Mancha * 100 37.6 0.1 0 37.7 1.4 3.8 0 5.2 57.0 57.0 0.1 0Spain, Catalonia 100 15.1 0 0 26.7 41.8 2.1 2.0 0 4.1 10.6 43.4 0 54.0 0 0Spain, Extremadura 100 47.4 0.8 0 48.2 3.1 2.8 0 5.9 1.6 20.5 23.9 45.9 0 0Spain, Galicia 100 43.7 0.3 0 0 0.3 44.3 2.9 4.4 0 7.4 5.3 41.8 1.2 48.3 0.1 0Spain, Community of Madrid 100 36.5 0.3 0.8 37.7 1.8 3.2 0.2 5.2 3.6 53.5 0 57.1 0 0Spain, Region of Murcia 100 24.3 0 0 0 26.2 50.5 0.5 4.9 0 5.4 2.7 41.4 0 44.1 0 0Spain, Navarre * 100 33.5 1.8 0 35.3 4.0 1.3 0 5.3 3.6 55.8 0 59.4 0 0Spain, Valencian region 100 50.8 0.3 0 51.1 0.8 5.9 0 6.6 1.5 30.3 10.5 42.2 0 0Sweden 100 31.5 1.5 0 32.9 8.9 8.9 24.8 33.4 0 58.2 0 0Switzerland 100 40.6 0.4 0.2 0 0 41.2 1.6 3.4 0.1 5.1 17.5 35.0 1.0 53.6 0.1 0the Netherlands 100 31.9 1.7 0 33.5 2.7 2.4 0 5.2 29.6 31.7 0.1 61.3 0 0United Kingdom, All countries * § 100 33.6 2.0 0.1 0 5.0 40.7 3.2 2.6 0.1 5.9 16.7 35.0 1.7 53.3 0 0United Kingdom, England * 100 33.2 2.0 0 0 5.8 41.1 3.2 2.7 0.1 6.0 16.6 34.4 1.8 52.8 0 0United Kingdom, Northern Ireland * 100 33.3 1.2 0.9 0 1.4 36.8 4.7 0.2 0.1 5.0 22.2 32.4 3.7 58.2 0 0United Kingdom, Scotland 100 37.9 1.1 0 39.0 3.1 1.5 0 4.6 16.4 39.6 0.4 56.4 0 0United Kingdom, Wales * 100 33.5 3.0 0 0.1 1.5 38.1 3.0 4.0 0 7.0 15.3 39.2 0.5 54.9 0 0
Abbreviations used: HD: haemodialysis; Unkn: unknown; HF: haemofiltration; HDF: haemodiafiltration; APD: automated peritoneal dialysis; CAPD: continuous ambulatory peritoneal dialysis; PD: peritoneal dialysis; Tx: transplantCategories may not add up because of rounding off; When cells are left empty, (complete) data are unavailable* Patients younger than 20 years of age are not reported& No distinction is made between HD and HDF§ HDF is not accurately captured from some units and so usage may be an underestimate for the UK

All 0-19 20-44 45-64 65-74 75+ Men Women DM Non DM
HD PD Tx Un HD PD Tx Un HD PD Tx Un HD PD Tx Un HD PD Tx Un HD PD Tx Un HD PD Tx Un HD PD Tx Un HD PD Tx Un HD PD Tx Un
% % % % % % % % % % % % % % % % % % % % % % % % % % % % % % % % % % % % % % % %
69
Austria 44 4 52 0 9 4 87 0 27 5 68 0 35 5 61 0 48 4 48 0 72 4 24 0 44 4 51 0 43 4 53 0 58 4 38 0 40 4 55 0Belgium, Dutch-speaking * 53 4 43 0 28 7 66 0 31 4 65 0 51 4 45 0 84 3 12 0 52 4 44 0 53 4 43 0 71 4 25 0 49 4 47 0Belgium, French-speaking * 54 5 41 0 34 5 61 0 40 4 56 0 54 5 41 0 79 5 15 0 54 5 41 0 54 5 42 0 72 5 22 0 50 5 45 0Bosnia and Herzegovina 86 3 10 0 50 14 36 0 64 4 32 0 87 4 10 0 95 3 2 0 98 2 0 0 85 3 12 0 88 4 8 0 90 6 4 0 85 3 12 0Denmark 38 10 52 0 8 2 90 0 20 5 75 0 30 7 63 0 46 14 40 0 70 19 10 0 38 11 51 0 37 9 54 0 52 13 35 0 35 10 56 0Estonia 37 6 57 0 33 0 67 0 26 5 69 0 26 5 69 0 46 5 49 0 72 11 17 0 34 5 61 0 41 7 53 0 32 7 61 0 38 5 56 0Finland 32 7 61 0 5 9 86 0 24 6 70 0 26 7 67 0 35 6 58 0 61 10 30 0 34 7 58 0 29 7 64 0 40 9 51 0 30 6 64 0France 51 4 44 0 18 6 76 0 31 2 66 0 39 3 58 1 54 3 42 0 81 6 13 0 51 3 45 0 52 4 44 0 73 4 22 0 47 4 49 0Greece 75 5 20 0 24 23 54 0 51 6 43 0 66 5 29 0 80 6 14 0 93 5 3 0 76 5 20 0 74 6 20 0 90 6 4 0 72 5 23 0Iceland 24 4 72 0 17 0 83 0 16 3 80 0 15 3 83 0 29 8 63 0 73 5 23 0 25 3 72 0 23 6 71 0 22 4 74 0 25 4 71 0Norway 24 4 71 0 3 5 93 0 17 2 81 0 17 3 80 0 26 5 69 0 49 10 41 0 25 4 71 0 23 5 72 0 34 5 60 0 23 4 73 0Romania 84 7 9 0 60 23 17 0 68 6 25 0 84 7 10 0 90 8 2 0 91 9 0 0 83 7 10 0 85 8 7 0 88 9 3 0 84 7 9 0Serbia 77 9 13 0 43 6 51 0 53 9 38 1 77 9 14 0 88 10 2 0 90 9 0 1 78 8 14 0 75 11 13 0 77 16 6 0 77 8 15 0Spain, Andalusia 43 4 53 0 14 1 85 0 25 4 71 0 31 4 64 0 48 4 48 0 79 4 17 0 42 4 54 0 44 4 51 0 64 4 31 0 39 4 57 0Spain, Aragon 33 6 61 0 0 11 89 0 16 6 79 0 23 6 71 0 32 5 63 0 61 6 34 0 34 6 60 0 33 5 62 0 45 5 50 0 31 6 63 0Spain, Asturias 36 9 54 0 13 0 88 0 23 8 69 0 29 9 63 0 33 11 56 0 63 9 28 0 37 10 53 0 35 8 58 0 50 13 38 0 34 9 58 0Spain, Basque country 30 7 63 0 0 0 100 0 14 4 82 1 21 7 72 0 32 8 59 0 57 8 35 0 32 7 61 0 28 7 65 0 54 11 35 0 28 6 66 0Spain, Cantabria * 27 5 68 0 13 6 82 0 17 3 80 0 29 5 66 0 53 8 38 1 29 5 65 0 22 4 74 0 47 6 47 0 24 5 72 0Spain, Castile and León * 39 6 55 0 20 5 75 0 23 7 70 0 38 6 56 0 71 6 23 0 40 6 53 0 36 6 57 0 56 7 36 0 35 6 58 0Spain, Castile-La Mancha * 38 5 57 0 21 8 71 0 28 7 65 0 35 3 62 0 68 3 29 0 38 5 56 0 37 5 58 0 56 6 39 0 34 5 60 0Spain, Catalonia 42 4 54 0 5 2 93 0 20 3 77 0 27 4 69 0 42 5 53 0 77 4 19 0 42 4 54 0 42 4 55 0 61 5 34 0 39 4 57 0Spain, Extremadura 48 6 46 0 25 0 75 0 25 6 69 0 37 7 55 0 54 4 41 0 80 4 16 0 47 6 47 0 50 5 45 0 71 6 23 0 44 6 50 0Spain, Galicia 44 7 48 0 0 6 94 0 26 5 69 0 31 7 62 0 47 8 45 0 79 8 13 0 45 8 47 0 43 7 50 0 63 10 27 0 40 7 53 0Spain, Community of Madrid 38 5 57 0 17 5 78 0 23 6 72 0 26 5 68 0 39 6 55 0 68 4 28 0 39 5 56 0 36 5 59 0 56 6 37 0 34 5 61 0Spain, Region of Murcia 50 5 44 0 0 8 92 0 33 6 61 0 36 6 59 0 53 6 40 0 87 3 10 0 51 6 43 0 50 5 45 0 72 5 23 0 47 5 47 0Spain, Navarre * 35 5 59 0 15 6 79 0 26 5 69 0 36 2 62 0 65 10 26 0 37 5 57 0 32 5 63 0 53 3 45 0 32 6 62 0Spain, Valencian region 51 7 42 0 19 10 71 0 28 7 65 0 38 8 54 0 51 7 42 0 84 4 12 0 52 7 41 0 50 6 44 0 70 6 24 0 48 7 45 0Sweden 33 9 58 0 6 7 88 0 20 7 73 0 24 7 69 0 35 10 55 0 65 15 20 0 34 9 57 0 32 9 60 0 45 11 43 0 30 8 61 0Switzerland 41 5 54 0 7 8 86 0 26 6 68 0 31 5 64 0 47 5 47 0 73 7 21 0 42 5 53 0 40 5 55 0 55 5 39 0 39 5 56 0the Netherlands 34 5 61 0 9 5 86 0 17 3 79 0 23 4 73 0 36 6 59 0 69 9 22 0 33 5 62 0 34 5 61 0 55 7 38 0 30 5 65 0United Kingdom, All countries * 41 6 53 0 23 4 72 0 32 5 63 0 48 7 45 0 77 9 15 0 41 6 53 0 40 6 54 0 58 8 35 0 37 6 57 0United Kingdom, England * 41 6 53 0 24 4 72 0 32 5 63 0 48 7 45 0 77 9 14 0 42 6 52 0 41 6 54 0 58 8 34 0 38 6 57 0United Kingdom, Northern Ireland * 37 5 58 0 16 3 80 0 24 4 72 0 49 5 46 0 77 9 14 0 37 5 59 0 37 5 58 0 60 6 34 0 33 5 63 0United Kingdom, Scotland 39 5 56 0 13 7 80 0 21 4 76 0 32 4 64 0 54 5 41 0 76 6 17 0 39 4 57 0 40 5 56 0 58 7 35 0 35 4 60 0United Kingdom, Wales * 38 7 55 0 23 6 72 0 27 6 66 0 41 9 51 0 75 8 17 0 38 7 55 0 38 7 55 0 52 8 40 0 35 7 58 0
Abbreviations used: HD: haemodialysis; PD: peritoneal dialysis; Tx: transplant; Un: unknown; DM: diabetes mellitusCategories may not add up because of missing values or rounding off* Patients younger than 20 years of age are not reported
B4 PREVALENT PATIENTS ON RRT IN 2015
Table B.4.11Percentages of treatment modality by age, gender, and primary renal disease, unadjustedprevalent patients on December 31

All Living Deceased Donor type Unkn
Related Unrelated Type Unkn All
N % N % N % N % N % N % N %
70
Austria § 413 100 36 8.7 25 6.1 0 0 61 14.8 352 85.2 0 0Belgium, Dutch-speaking * 267 100 5 1.9 12 4.5 0 0 17 6.4 250 93.6 0 0Belgium, French-speaking * 190 100 15 7.9 12 6.3 0 0 27 14.2 163 85.8 0 0Bosnia and Herzegovina 35 100 19 54.3 4 11.4 2 5.7 25 71.4 10 28.6 0 0Denmark 270 100 70 25.9 46 17.0 0 0 116 43.0 154 57.0 0 0Estonia 38 100 3 7.9 0 0 0 0 3 7.9 35 92.1 0 0Finland 245 100 14 5.7 1 0.4 0 0 15 6.1 229 93.5 1 0.4France 3490 100 547 15.7 0 0 0 0 547 15.7 2939 84.2 4 0.1Greece 114 100 33 28.9 5 4.4 0 0 38 33.3 76 66.7 0 0Iceland 7 100 5 71.4 2 28.6 0 0 7 100 0 0 0 0Norway 254 100 40 15.7 23 9.1 0 0 63 24.8 191 75.2 0 0Romania || 169 100 35 20.7 0 0 3 1.8 38 22.5 102 60.4 29 17.2Serbia 60 100 16 26.7 0 0 17 28.3 33 55.0 26 43.3 1 1.7Spain, Andalusia 455 100 36 7.9 24 5.3 0 0 60 13.2 395 86.8 0 0Spain, Aragon 79 100 2 2.5 1 1.3 0 0 3 3.8 76 96.2 0 0Spain, Asturias 56 100 3 5.4 0 0 0 0 3 5.4 53 94.6 0 0Spain, Basque country 160 100 0 0 0 0 26 16.3 26 16.3 134 83.8 0 0Spain, Cantabria * 55 100 3 5.5 0 0 0 0 3 5.5 52 94.5 0 0Spain, Castile and León * 124 100 0 0 0 0 0 0 0 0 124 100 0 0Spain, Castile-La Mancha * 111 100 111 100Spain, Catalonia 647 100 160 24.7 0 0 0 0 160 24.7 487 75.3 0 0Spain, Extremadura 55 100 1 1.8 3 5.5 0 0 4 7.3 48 87.3 3 5.5Spain, Galicia 168 100 22 13.1 16 9.5 0 0 38 22.6 130 77.4 0 0Spain, Community of Madrid 407 100 23 5.7 6 1.5 0 0 29 7.1 378 92.9 0 0Spain, Region of Murcia 70 100 2 2.9 2 2.9 0 0 4 5.7 66 94.3 0 0Spain, Navarre * 50 100 0 0 0 0 6 12.0 6 12.0 44 88.0 0 0Spain, Valencian region 276 100 19 6.9 5 1.8 1 0.4 25 9.1 248 89.9 3 1.1Sweden 418 100 80 19.1 51 12.2 0 0 131 31.3 287 68.7 0 0Switzerland † 303 100 25 8.3 17 5.6 53 17.5 95 31.4 205 67.7 3 1.0the Netherlands 980 100 515 52.6 515 52.6 464 47.3 1 0.1United Kingdom, All countries * ¶ 2842 100 388 13.7 266 9.4 208 7.3 862 30.3 1924 67.7 56 2.0United Kingdom, England * ¶ 2398 100 331 13.8 227 9.5 140 5.8 698 29.1 1644 68.6 56 2.3United Kingdom, Northern Ireland * 111 100 38 34.2 22 19.8 1 0.9 61 55.0 50 45.0 0 0United Kingdom, Scotland 255 100 7 2.7 1 0.4 70 27.5 78 30.6 177 69.4 0 0United Kingdom, Wales * 85 100 12 14.1 16 18.8 0 0 28 32.9 57 67.1 0 0
Categories may not add up because of rounding off; When cells are left empty, (complete) data are unavailable§ Data based on residents and non-residents* Patients younger than 20 years of age are not reported|| The transplantation activity reflects 70% of the total transplantation activity in the country, because there is an underreporting of preemptive transplantations† The transplant activity reflects 94% of the total transplant activity in the country¶ The transplant activity is underestimated by approximately 7% due to one centre not submitting complete data for 2015
B5 KIDNEY TRANSPLANTS IN 2015
Table B.5.1Kidney transplant counts and percentages by donor type

All Living Deceased Donor type Unkn
Related Unrelated Type Unkn All
Pmp Pmp Pmp Pmp Pmp Pmp Pmp
71
Austria § 43.8 4.0 2.9 0 6.9 36.9 0Belgium, Dutch-speaking * 41.3 0.8 1.9 0 2.6 38.6 0Belgium, French-speaking * 39.6 3.1 2.5 0 5.6 33.9 0Bosnia and Herzegovina 9.9 5.4 1.1 0.6 7.1 2.8 0Denmark 47.0 12.2 8.0 0 20.2 26.8 0Estonia 28.9 2.3 0 0 2.3 26.6 0Finland 44.7 2.6 0.2 0 2.7 41.8 0.2France 52.4 8.2 0 0 8.2 44.1 0.1Greece 10.5 3.0 0.5 0 3.5 7.0 0Iceland 21.2 15.1 6.0 0 21.2 0 0Norway 49.0 7.7 4.4 0 12.1 36.8 0Romania || 8.6 1.8 0 0.2 1.9 5.2 1.5Serbia 8.5 2.3 0 2.4 4.7 3.7 0.1Spain, Andalusia 54.2 4.3 2.9 0 7.1 47.0 0Spain, Aragon 59.7 1.5 0.8 0 2.3 57.5 0Spain, Asturias 53.3 2.9 0 0 2.9 50.5 0Spain, Basque country 73.9 0 0 12.0 12.0 61.9 0Spain, Cantabria * 94.2 5.1 0 0 5.1 89.0 0Spain, Castile and León * 50.3 0 0 0 0 50.3 0Spain, Castile-La Mancha * 54.0 54.0Spain, Catalonia 86.2 21.3 0 0 21.3 64.9 0Spain, Extremadura 50.3 0.9 2.7 0 3.7 43.9 2.7Spain, Galicia 61.6 8.1 5.9 0 13.9 47.7 0Spain, Community of Madrid 63.2 3.6 0.9 0 4.5 58.7 0Spain, Region of Murcia 47.7 1.4 1.4 0 2.7 45.0 0Spain, Navarre * 78.5 0 0 9.4 9.4 69.1 0Spain, Valencian region 55.4 3.8 1.0 0.2 5.0 49.8 0.6Sweden 42.7 8.2 5.2 0 13.4 29.3 0Switzerland † 36.6 3.0 2.1 6.4 11.5 24.8 0.4the Netherlands 57.9 30.4 30.4 27.4 0.1United Kingdom, All countries * ¶ 43.6 6.0 4.1 3.2 13.2 29.5 0.9United Kingdom, England * ¶ 43.8 6.0 4.1 2.6 12.7 30.0 1.0United Kingdom, Northern Ireland * 59.9 20.5 11.9 0.5 32.9 27.0 0United Kingdom, Scotland 47.5 1.3 0.2 13.0 14.5 32.9 0United Kingdom, Wales * 27.4 3.9 5.2 0 9.0 18.4 0
Categories may not add up because of rounding off; When cells are left empty, (complete) data are unavailable§ The number of transplants differs from table B.5.1 as non-residents are excluded for this analysis* Patients younger than 20 years of age are not reported|| The transplantation activity reflects 70% of the total transplantation activity in the country, because there is an underreporting of preemptive transplantations† The transplant activity reflects 94% of the total transplant activity in the country¶ The transplant activity is underestimated by approximately 7% due to one centre not submitting complete data for 2015
B5 KIDNEY TRANSPLANTS IN 2015
Table B.5.2Kidney transplants per million population by donor type, unadjusted

90 day 1 year 2 year 5 year 90 day 1 year 2 year
72
Survival probabilities as % (95% CI)
cohort 2006 - 2010 cohort 2009 - 2013
B6 SURVIVAL PROBABILITYPatient Survival on RRT (cohort 2006-2010 and cohort 2009-2013)
Table B.6.1Incident RRT patients, from day 1, unadjustedby age, gender, and primary renal disease
0-19 99.2 (98.7-99.6) 97.1 (96.2-97.8) 96.1 (95.1-97.0) 94.4 (93.2-95.4) 99.3 (98.8-99.6) 97.7 (96.9-98.4) 96.4 (95.4-97.2)
20-44 99.1 (99.0-99.2) 96.9 (96.7-97.2) 94.4 (94.1-94.7) 89.0 (88.5-89.4) 99.2 (99.1-99.3) 97.2 (97.0-97.5) 94.9 (94.6-95.2)
45-64 96.9 (96.8-97.1) 90.5 (90.3-90.7) 83.7 (83.4-84.0) 67.2 (66.9-67.5) 97.3 (97.2-97.4) 91.3 (91.1-91.5) 85.2 (85.0-85.5)
65-74 93.7 (93.5-94.0) 81.5 (81.2-81.8) 69.6 (69.3-69.9) 42.3 (42.1-42.5) 94.4 (94.2-94.6) 83.5 (83.2-83.8) 72.4 (72.1-72.7)
75+ 89.7 (89.4-89.9) 72.0 (71.7-72.3) 55.7 (55.5-56.0) 23.4 (23.3-23.5) 90.5 (90.3-90.7) 73.8 (73.6-74.1) 58.1 (57.9-58.4)
Men 94.2 (94.1-94.4) 83.2 (83.0-83.4) 72.5 (72.3-72.7) 49.3 (49.2-49.5) 94.6 (94.4-94.7) 84.3 (84.1-84.5) 74.1 (73.9-74.3)
Women 93.9 (93.8-94.1) 83.3 (83.0-83.5) 73.1 (72.8-73.3) 51.2 (51.0-51.4) 94.6 (94.4-94.8) 84.5 (84.2-84.7) 74.9 (74.6-75.1)
Diabetes 94.9 (94.7-95.1) 83.6 (83.3-84.0) 71.0 (70.6-71.3) 42.6 (42.4-42.9) 95.4 (95.2-95.6) 85.1 (84.8-85.4) 73.5 (73.2-73.8)
Hypertension / renal vascular disease 94.1 (93.8-94.3) 81.6 (81.3-82.0) 68.6 (68.2-69.0) 40.4 (40.2-40.7) 94.2 (94.0-94.5) 82.8 (82.4-83.1) 70.2 (69.8-70.5)
Glomerulonephritis 97.4 (97.1-97.6) 92.0 (91.6-92.4) 86.3 (85.9-86.8) 71.9 (71.4-72.3) 97.3 (97.1-97.6) 92.2 (91.8-92.5) 86.8 (86.4-87.2)
Other causes 93.3 (93.1-93.5) 82.2 (81.9-82.4) 72.7 (72.4-72.9) 52.8 (52.6-53.0) 93.9 (93.8-94.1) 83.2 (82.9-83.4) 73.9 (73.6-74.1)
All 94.1 (94.0-94.2) 83.2 (83.1-83.4) 72.7 (72.6-72.9) 50.0 (49.9-50.1) 94.6 (94.5-94.7) 84.4 (84.2-84.5) 74.3 (74.2-74.5)
Based on data from Austria, Belgium (Dutch-speaking), Belgium (French-speaking), Denmark, Finland, France, Greece, Iceland, Norway, Spain (Andalusia), Spain (Aragon), Spain (Asturias), Spain (Basque country), Spain (Cantabria), Spain (Castile and León), Spain (Castile-La Mancha), Spain (Catalonia), Spain (Extremadura), Spain (Galicia), Spain (Community of Madrid), Spain (Valencian region), Sweden, the Netherlands, United Kingdom (England/Northern Ireland/Wales) and United Kingdom (Scotland)

90 day 1 year 2 year 5 year 90 day 1 year 2 year
73
Survival probabilities as % (95% CI)
cohort 2006 - 2010 cohort 2009 - 2013
B6 SURVIVAL PROBABILITYPatient Survival on RRT (cohort 2006-2010 and cohort 2009-2013)
Table B.6.2Incident RRT patients, from day 1, adjustedadjusted for age, gender, and primary renal disease
0-19 99.1 (98.6-99.6) 96.9 (95.9-97.8) 95.9 (94.8-96.9) 94.0 (92.8-95.2) 99.3 (98.9-99.7) 97.8 (97.0-98.5) 96.4 (95.4-97.4)
20-44 99.1 (99.0-99.2) 96.9 (96.6-97.1) 94.3 (93.9-94.6) 88.5 (88.1-89.0) 99.2 (99.1-99.3) 97.2 (97.0-97.5) 94.7 (94.4-95.1)
45-64 97.1 (96.9-97.2) 90.8 (90.6-91.1) 84.1 (83.8-84.5) 67.5 (67.1-68.0) 97.4 (97.3-97.6) 91.5 (91.3-91.8) 85.5 (85.2-85.8)
65-74 94.1 (93.9-94.4) 82.5 (82.1-82.9) 70.8 (70.4-71.3) 43.5 (43.0-44.0) 94.7 (94.5-94.9) 84.2 (83.8-84.5) 73.2 (72.8-73.7)
75+ 89.9 (89.7-90.2) 72.7 (72.3-73.1) 56.5 (56.1-57.0) 23.8 (23.4-24.2) 90.7 (90.5-91.0) 74.4 (74.0-74.8) 58.8 (58.4-59.3)
Men 95.3 (95.2-95.4) 85.7 (85.5-86.0) 75.6 (75.3-75.9) 49.8 (49.4-50.1) 95.6 (95.5-95.7) 86.7 (86.5-86.9) 77.2 (76.9-77.4)
Women 95.2 (95.1-95.4) 86.3 (86.0-86.5) 76.9 (76.6-77.3) 53.3 (52.8-53.7) 95.7 (95.5-95.8) 87.2 (86.9-87.5) 78.4 (78.1-78.7)
Diabetes 95.4 (95.2-95.6) 85.0 (84.6-85.3) 72.6 (72.2-73.1) 42.1 (41.6-42.7) 95.9 (95.7-96.1) 86.6 (86.3-86.9) 75.5 (75.1-76.0)
Hypertension / renal vascular disease 96.2 (96.1-96.4) 88.0 (87.7-88.3) 78.4 (77.9-78.8) 52.6 (52.0-53.2) 96.3 (96.2-96.5) 88.7 (88.4-89.0) 79.5 (79.1-79.9)
Glomerulonephritis 96.8 (96.6-97.1) 90.3 (89.9-90.8) 83.1 (82.5-83.8) 63.4 (62.6-64.3) 96.9 (96.6-97.1) 90.6 (90.2-91.1) 83.9 (83.3-84.5)
Other causes 94.1 (94.0-94.3) 83.9 (83.6-84.2) 74.5 (74.1-74.8) 51.7 (51.3-52.1) 94.7 (94.6-94.9) 85.0 (84.7-85.2) 75.9 (75.6-76.2)
All 95.3 (95.2-95.4) 85.9 (85.8-86.1) 76.1 (75.9-76.3) 51.1 (50.8-51.4) 95.6 (95.5-95.7) 86.9 (86.7-87.1) 77.6 (77.4-77.9)
Based on data from Austria, Belgium (Dutch-speaking), Belgium (French-speaking), Denmark, Finland, France, Greece, Iceland, Norway, Spain (Andalusia), Spain (Aragon), Spain (Asturias), Spain (Basque country), Spain (Cantabria), Spain (Castile and León), Spain (Castile-La Mancha), Spain (Catalonia), Spain (Extremadura), Spain (Galicia), Spain (Community of Madrid), Spain (Valencian region), Sweden, the Netherlands, United Kingdom (England/Northern Ireland/Wales) and United Kingdom (Scotland)

1 year 2 year 5 year 1 year 2 year
74
Survival probabilities as % (95% CI)
cohort 2006 - 2010 cohort 2009 - 2013
B6 SURVIVAL PROBABILITYPatient Survival on RRT (cohort 2006-2010 and cohort 2009-2013)
Table B.6.3Incident RRT patients, from day 91, unadjustedby age, gender, and primary renal disease
0-19 97.6 (96.7-98.2) 96.7 (95.7-97.4) 95.1 (93.9-96.0) 98.0 (97.1-98.6) 97.0 (96.0-97.7)
20-44 97.2 (97.0-97.5) 94.7 (94.4-95.0) 89.3 (88.8-89.7) 97.4 (97.2-97.6) 95.2 (94.9-95.5)
45-64 91.5 (91.3-91.8) 84.9 (84.6-85.1) 67.9 (67.6-68.2) 92.3 (92.1-92.5) 86.1 (85.8-86.3)
65-74 83.7 (83.3-84.0) 71.5 (71.1-71.8) 42.9 (42.7-43.1) 85.6 (85.3-85.9) 73.9 (73.5-74.2)
75+ 75.7 (75.4-76.0) 58.2 (57.9-58.5) 23.9 (23.8-24.0) 77.3 (77.0-77.6) 60.3 (60.0-60.5)
Men 85.4 (85.2-85.6) 74.5 (74.3-74.8) 50.6 (50.4-50.7) 86.4 (86.3-86.6) 75.8 (75.6-76.0)
Women 85.9 (85.6-86.2) 75.5 (75.2-75.7) 52.8 (52.5-53.0) 86.9 (86.6-87.1) 76.8 (76.5-77.1)
Diabetes 84.7 (84.3-85.0) 71.8 (71.5-72.2) 42.7 (42.4-42.9) 86.1 (85.8-86.4) 74.0 (73.7-74.4)
Hypertension / renal vascular disease 83.3 (82.9-83.6) 69.8 (69.4-70.2) 40.9 (40.6-41.1) 84.6 (84.2-84.9) 71.5 (71.1-71.9)
Glomerulonephritis 93.1 (92.7-93.5) 87.2 (86.8-87.7) 72.6 (72.1-73.1) 93.4 (93.0-93.7) 87.6 (87.2-88.0)
Other causes 85.5 (85.2-85.7) 75.8 (75.5-76.0) 55.1 (54.8-55.3) 86.1 (85.9-86.4) 76.4 (76.2-76.7)
All 85.6 (85.4-85.7) 74.9 (74.7-75.1) 51.4 (51.2-51.5) 86.6 (86.4-86.7) 76.1 (76.0-76.3)
Based on data from Austria, Belgium (Dutch-speaking), Belgium (French-speaking), Denmark, Finland, France, Greece, Iceland, Norway, Spain (Andalusia), Spain (Aragon), Spain (Asturias), Spain (Basque country), Spain (Cantabria), Spain (Castile and León), Spain (Castile-La Mancha), Spain (Catalonia), Spain (Extremadura), Spain (Galicia), Spain (Community of Madrid), Spain (Valencian region), Sweden, the Netherlands, United Kingdom (England/Northern Ireland/Wales) and United Kingdom (Scotland)
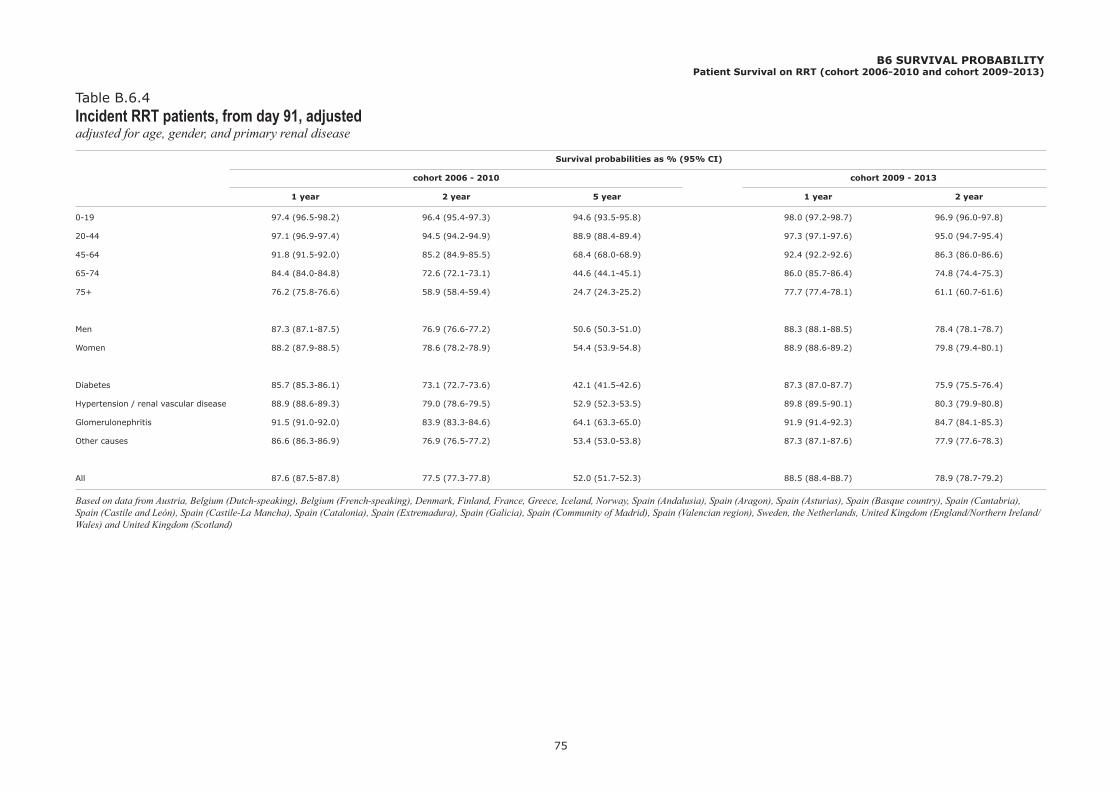
1 year 2 year 5 year 1 year 2 year
75
Survival probabilities as % (95% CI)
cohort 2006 - 2010 cohort 2009 - 2013
B6 SURVIVAL PROBABILITYPatient Survival on RRT (cohort 2006-2010 and cohort 2009-2013)
Table B.6.4Incident RRT patients, from day 91, adjustedadjusted for age, gender, and primary renal disease
0-19 97.4 (96.5-98.2) 96.4 (95.4-97.3) 94.6 (93.5-95.8) 98.0 (97.2-98.7) 96.9 (96.0-97.8)
20-44 97.1 (96.9-97.4) 94.5 (94.2-94.9) 88.9 (88.4-89.4) 97.3 (97.1-97.6) 95.0 (94.7-95.4)
45-64 91.8 (91.5-92.0) 85.2 (84.9-85.5) 68.4 (68.0-68.9) 92.4 (92.2-92.6) 86.3 (86.0-86.6)
65-74 84.4 (84.0-84.8) 72.6 (72.1-73.1) 44.6 (44.1-45.1) 86.0 (85.7-86.4) 74.8 (74.4-75.3)
75+ 76.2 (75.8-76.6) 58.9 (58.4-59.4) 24.7 (24.3-25.2) 77.7 (77.4-78.1) 61.1 (60.7-61.6)
Men 87.3 (87.1-87.5) 76.9 (76.6-77.2) 50.6 (50.3-51.0) 88.3 (88.1-88.5) 78.4 (78.1-78.7)
Women 88.2 (87.9-88.5) 78.6 (78.2-78.9) 54.4 (53.9-54.8) 88.9 (88.6-89.2) 79.8 (79.4-80.1)
Diabetes 85.7 (85.3-86.1) 73.1 (72.7-73.6) 42.1 (41.5-42.6) 87.3 (87.0-87.7) 75.9 (75.5-76.4)
Hypertension / renal vascular disease 88.9 (88.6-89.3) 79.0 (78.6-79.5) 52.9 (52.3-53.5) 89.8 (89.5-90.1) 80.3 (79.9-80.8)
Glomerulonephritis 91.5 (91.0-92.0) 83.9 (83.3-84.6) 64.1 (63.3-65.0) 91.9 (91.4-92.3) 84.7 (84.1-85.3)
Other causes 86.6 (86.3-86.9) 76.9 (76.5-77.2) 53.4 (53.0-53.8) 87.3 (87.1-87.6) 77.9 (77.6-78.3)
All 87.6 (87.5-87.8) 77.5 (77.3-77.8) 52.0 (51.7-52.3) 88.5 (88.4-88.7) 78.9 (78.7-79.2)
Based on data from Austria, Belgium (Dutch-speaking), Belgium (French-speaking), Denmark, Finland, France, Greece, Iceland, Norway, Spain (Andalusia), Spain (Aragon), Spain (Asturias), Spain (Basque country), Spain (Cantabria), Spain (Castile and León), Spain (Castile-La Mancha), Spain (Catalonia), Spain (Extremadura), Spain (Galicia), Spain (Community of Madrid), Spain (Valencian region), Sweden, the Netherlands, United Kingdom (England/Northern Ireland/Wales) and United Kingdom (Scotland)

90 day 1 year 2 year 5 year 90 day 1 year 2 year
76
Survival probabilities as % (95% CI)
cohort 2006 - 2010 cohort 2009 - 2013
B6 SURVIVAL PROBABILITYPatient Survival on Dialysis (cohort 2006-2010 and cohort 2009-2013)
Table B.6.5Incident dialysis patients, from day 1, unadjustedby age, gender, and primary renal disease
0-19 99.0 (98.2-99.4) 96.1 (94.7-97.1) 94.1 (92.3-95.6) 88.8 (85.5-91.4) 99.2 (98.5-99.6) 97.1 (95.8-98.0) 94.0 (92.0-95.5)
20-44 99.0 (98.9-99.2) 96.4 (96.0-96.6) 92.7 (92.3-93.1) 82.2 (81.5-82.9) 99.1 (99.0-99.3) 96.7 (96.4-97.0) 93.2 (92.8-93.6)
45-64 96.8 (96.6-97.0) 89.8 (89.5-90.0) 81.7 (81.4-82.1) 59.0 (58.7-59.3) 97.2 (97.0-97.3) 90.5 (90.2-90.7) 83.1 (82.8-83.4)
65-74 93.6 (93.4-93.9) 81.1 (80.8-81.4) 68.8 (68.4-69.1) 39.5 (39.3-39.7) 94.2 (94.0-94.5) 83.0 (82.6-83.3) 71.3 (70.9-71.6)
75+ 89.6 (89.3-89.8) 71.9 (71.6-72.2) 55.6 (55.3-55.8) 23.1 (23.0-23.2) 90.4 (90.2-90.7) 73.7 (73.5-74.0) 57.9 (57.7-58.2)
Men 94.0 (93.8-94.1) 82.2 (82.0-82.4) 70.2 (70.0-70.4) 41.0 (40.9-41.2) 94.3 (94.2-94.5) 83.3 (83.1-83.5) 71.6 (71.4-71.8)
Women 93.7 (93.5-93.9) 82.2 (81.9-82.5) 70.7 (70.4-71.0) 43.1 (42.9-43.3) 94.3 (94.1-94.5) 83.3 (83.1-83.6) 72.3 (72.0-72.6)
Diabetes 94.8 (94.5-95.0) 83.1 (82.7-83.4) 69.6 (69.3-70.0) 37.4 (37.2-37.6) 95.3 (95.1-95.5) 84.7 (84.3-85.0) 72.3 (71.9-72.6)
Hypertension / renal vascular disease 93.9 (93.7-94.2) 81.2 (80.8-81.6) 67.5 (67.1-67.9) 36.1 (35.8-36.3) 94.1 (93.9-94.4) 82.3 (81.9-82.7) 69.0 (68.6-69.3)
Glomerulonephritis 97.2 (96.9-97.4) 91.1 (90.7-91.5) 83.9 (83.3-84.4) 61.4 (60.8-61.9) 97.1 (96.9-97.4) 91.2 (90.7-91.6) 84.2 (83.7-84.7)
Other causes 93.0 (92.8-93.1) 80.9 (80.6-81.1) 69.9 (69.6-70.1) 43.7 (43.5-43.9) 93.5 (93.4-93.7) 81.7 (81.5-81.9) 70.8 (70.5-71.0)
All 93.9 (93.7-94.0) 82.2 (82.1-82.4) 70.4 (70.2-70.6) 41.8 (41.7-41.9) 94.3 (94.2-94.4) 83.3 (83.1-83.4) 71.9 (71.7-72.0)
Based on data from Austria, Belgium (Dutch-speaking), Belgium (French-speaking), Denmark, Finland, France, Greece, Iceland, Norway, Spain (Andalusia), Spain (Aragon), Spain (Asturias), Spain (Basque country), Spain (Cantabria), Spain (Castile and León), Spain (Castile-La Mancha), Spain (Catalonia), Spain (Extremadura), Spain (Galicia), Spain (Community of Madrid), Spain (Valencian region), Sweden, the Netherlands, United Kingdom (England/Northern Ireland/Wales) and United Kingdom (Scotland)

90 day 1 year 2 year 5 year 90 day 1 year 2 year
77
Survival probabilities as % (95% CI)
cohort 2006 - 2010 cohort 2009 - 2013
B6 SURVIVAL PROBABILITYPatient Survival on Dialysis (cohort 2006-2010 and cohort 2009-2013)
Table B.6.6Incident dialysis patients, from day 1, adjustedadjusted for age, gender, and primary renal disease
0-19 98.8 (98.2-99.5) 95.8 (94.4-97.2) 93.8 (91.9-95.7) 86.7 (82.5-91.2) 99.1 (98.5-99.7) 97.0 (95.8-98.1) 93.9 (91.9-95.8)
20-44 99.0 (98.9-99.2) 96.4 (96.0-96.7) 92.6 (92.1-93.1) 80.9 (80.0-81.8) 99.1 (99.0-99.3) 96.7 (96.4-97.0) 93.1 (92.7-93.6)
45-64 96.9 (96.8-97.1) 90.1 (89.9-90.4) 82.3 (81.9-82.7) 58.7 (58.1-59.2) 97.3 (97.1-97.4) 90.8 (90.5-91.0) 83.5 (83.1-83.9)
65-74 94.0 (93.7-94.2) 82.0 (81.6-82.4) 69.9 (69.4-70.4) 40.1 (39.6-40.6) 94.5 (94.3-94.8) 83.6 (83.2-84.0) 72.1 (71.6-72.5)
75+ 89.8 (89.5-90.1) 72.4 (72.0-72.8) 56.2 (55.7-56.6) 23.4 (23.0-23.8) 90.6 (90.4-90.9) 74.2 (73.8-74.6) 58.5 (58.0-58.9)
Men 94.8 (94.6-94.9) 84.2 (84.0-84.5) 73.0 (72.7-73.3) 43.7 (43.3-44.1) 95.2 (95.1-95.3) 85.5 (85.3-85.7) 74.9 (74.7-75.2)
Women 94.7 (94.5-94.8) 84.7 (84.4-85.0) 74.3 (73.9-74.7) 47.3 (46.8-47.8) 95.3 (95.1-95.4) 85.9 (85.7-86.2) 76.2 (75.8-76.5)
Diabetes 95.1 (94.9-95.3) 83.9 (83.6-84.3) 70.9 (70.4-71.4) 38.0 (37.4-38.6) 95.7 (95.5-95.9) 85.8 (85.5-86.2) 74.1 (73.7-74.6)
Hypertension / renal vascular disease 95.7 (95.5-95.9) 86.3 (85.9-86.6) 75.5 (75.0-75.9) 46.7 (46.1-47.3) 95.9 (95.7-96.1) 87.4 (87.1-87.7) 77.2 (76.8-77.6)
Glomerulonephritis 96.7 (96.4-97.0) 89.7 (89.2-90.2) 81.5 (80.8-82.2) 56.3 (55.3-57.4) 96.7 (96.4-97.0) 89.9 (89.4-90.4) 82.1 (81.5-82.8)
Other causes 93.5 (93.3-93.7) 82.3 (82.0-82.6) 71.8 (71.4-72.1) 45.4 (44.9-45.8) 94.2 (94.1-94.4) 83.6 (83.3-83.8) 73.4 (73.1-73.8)
All 94.7 (94.6-94.8) 84.4 (84.2-84.6) 73.5 (73.3-73.7) 45.0 (44.7-45.4) 95.2 (95.1-95.3) 85.7 (85.5-85.9) 75.4 (75.2-75.6)
Based on data from Austria, Belgium (Dutch-speaking), Belgium (French-speaking), Denmark, Finland, France, Greece, Iceland, Norway, Spain (Andalusia), Spain (Aragon), Spain (Asturias), Spain (Basque country), Spain (Cantabria), Spain (Castile and León), Spain (Castile-La Mancha), Spain (Catalonia), Spain (Extremadura), Spain (Galicia), Spain (Community of Madrid), Spain (Valencian region), Sweden, the Netherlands, United Kingdom (England/Northern Ireland/Wales) and United Kingdom (Scotland)
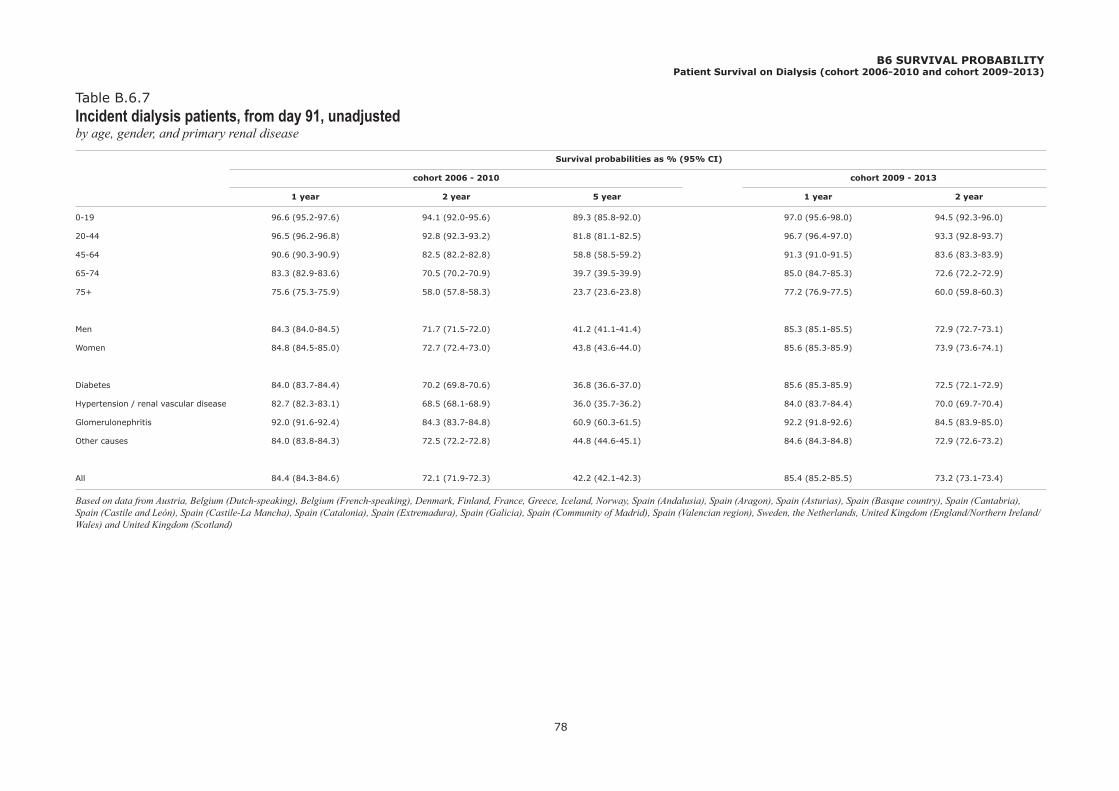
1 year 2 year 5 year 1 year 2 year
78
Survival probabilities as % (95% CI)
cohort 2006 - 2010 cohort 2009 - 2013
B6 SURVIVAL PROBABILITYPatient Survival on Dialysis (cohort 2006-2010 and cohort 2009-2013)
Table B.6.7Incident dialysis patients, from day 91, unadjustedby age, gender, and primary renal disease
0-19 96.6 (95.2-97.6) 94.1 (92.0-95.6) 89.3 (85.8-92.0) 97.0 (95.6-98.0) 94.5 (92.3-96.0)
20-44 96.5 (96.2-96.8) 92.8 (92.3-93.2) 81.8 (81.1-82.5) 96.7 (96.4-97.0) 93.3 (92.8-93.7)
45-64 90.6 (90.3-90.9) 82.5 (82.2-82.8) 58.8 (58.5-59.2) 91.3 (91.0-91.5) 83.6 (83.3-83.9)
65-74 83.3 (82.9-83.6) 70.5 (70.2-70.9) 39.7 (39.5-39.9) 85.0 (84.7-85.3) 72.6 (72.2-72.9)
75+ 75.6 (75.3-75.9) 58.0 (57.8-58.3) 23.7 (23.6-23.8) 77.2 (76.9-77.5) 60.0 (59.8-60.3)
Men 84.3 (84.0-84.5) 71.7 (71.5-72.0) 41.2 (41.1-41.4) 85.3 (85.1-85.5) 72.9 (72.7-73.1)
Women 84.8 (84.5-85.0) 72.7 (72.4-73.0) 43.8 (43.6-44.0) 85.6 (85.3-85.9) 73.9 (73.6-74.1)
Diabetes 84.0 (83.7-84.4) 70.2 (69.8-70.6) 36.8 (36.6-37.0) 85.6 (85.3-85.9) 72.5 (72.1-72.9)
Hypertension / renal vascular disease 82.7 (82.3-83.1) 68.5 (68.1-68.9) 36.0 (35.7-36.2) 84.0 (83.7-84.4) 70.0 (69.7-70.4)
Glomerulonephritis 92.0 (91.6-92.4) 84.3 (83.7-84.8) 60.9 (60.3-61.5) 92.2 (91.8-92.6) 84.5 (83.9-85.0)
Other causes 84.0 (83.8-84.3) 72.5 (72.2-72.8) 44.8 (44.6-45.1) 84.6 (84.3-84.8) 72.9 (72.6-73.2)
All 84.4 (84.3-84.6) 72.1 (71.9-72.3) 42.2 (42.1-42.3) 85.4 (85.2-85.5) 73.2 (73.1-73.4)
Based on data from Austria, Belgium (Dutch-speaking), Belgium (French-speaking), Denmark, Finland, France, Greece, Iceland, Norway, Spain (Andalusia), Spain (Aragon), Spain (Asturias), Spain (Basque country), Spain (Cantabria), Spain (Castile and León), Spain (Castile-La Mancha), Spain (Catalonia), Spain (Extremadura), Spain (Galicia), Spain (Community of Madrid), Spain (Valencian region), Sweden, the Netherlands, United Kingdom (England/Northern Ireland/Wales) and United Kingdom (Scotland)

1 year 2 year 5 year 1 year 2 year
79
Survival probabilities as % (95% CI)
cohort 2006 - 2010 cohort 2009 - 2013
B6 SURVIVAL PROBABILITYPatient Survival on Dialysis (cohort 2006-2010 and cohort 2009-2013)
Table B.6.8Incident dialysis patients, from day 91, adjustedadjusted for age, gender, and primary renal disease
0-19 96.5 (95.2-97.8) 93.5 (91.3-95.7) 86.4 (81.6-91.4) 96.9 (95.6-98.2) 94.3 (92.3-96.3)
20-44 96.5 (96.1-96.8) 92.6 (92.1-93.1) 80.5 (79.5-81.4) 96.6 (96.3-97.0) 93.2 (92.7-93.6)
45-64 91.0 (90.7-91.3) 83.0 (82.6-83.4) 58.7 (58.1-59.3) 91.5 (91.2-91.8) 84.0 (83.6-84.4)
65-74 83.9 (83.5-84.3) 71.5 (71.0-72.0) 40.8 (40.2-41.3) 85.4 (85.1-85.8) 73.5 (73.0-73.9)
75+ 76.0 (75.5-76.4) 58.5 (58.1-59.0) 24.2 (23.8-24.7) 77.5 (77.1-77.9) 60.7 (60.3-61.2)
Men 85.8 (85.6-86.1) 74.2 (73.9-74.5) 43.9 (43.5-44.3) 87.0 (86.8-87.2) 76.0 (75.7-76.3)
Women 86.7 (86.4-87.0) 75.8 (75.4-76.2) 47.9 (47.4-48.4) 87.6 (87.3-87.9) 77.4 (77.0-77.7)
Diabetes 84.7 (84.3-85.1) 71.2 (70.7-71.7) 37.6 (37.0-38.2) 86.5 (86.2-86.9) 74.3 (73.8-74.8)
Hypertension / renal vascular disease 87.2 (86.8-87.6) 75.9 (75.4-76.4) 46.5 (45.8-47.1) 88.5 (88.1-88.8) 77.8 (77.4-78.3)
Glomerulonephritis 90.7 (90.2-91.3) 82.0 (81.3-82.7) 56.3 (55.2-57.3) 91.0 (90.5-91.5) 82.6 (81.9-83.3)
Other causes 85.0 (84.7-85.3) 74.0 (73.7-74.4) 46.4 (46.0-46.9) 85.9 (85.6-86.2) 75.3 (74.9-75.6)
All 86.2 (86.0-86.3) 74.8 (74.5-75.0) 45.4 (45.1-45.7) 87.3 (87.1-87.4) 76.5 (76.2-76.7)
Based on data from Austria, Belgium (Dutch-speaking), Belgium (French-speaking), Denmark, Finland, France, Greece, Iceland, Norway, Spain (Andalusia), Spain (Aragon), Spain (Asturias), Spain (Basque country), Spain (Cantabria), Spain (Castile and León), Spain (Castile-La Mancha), Spain (Catalonia), Spain (Extremadura), Spain (Galicia), Spain (Community of Madrid), Spain (Valencian region), Sweden, the Netherlands, United Kingdom (England/Northern Ireland/Wales) and United Kingdom (Scotland)

1 year 2 year 5 year 1 year 2 year
80
Survival probabilities as % (95% CI)
cohort 2006 - 2010 cohort 2009 - 2013
B6 SURVIVAL PROBABILITYPatient Survival after First Transplant (cohort 2006-2010 and cohort 2009-2013)
Table B.6.9First transplant patients (deceased donor), from day of transplant, unadjustedby age, gender, and primary renal disease
0-19 99.2 (98.2-99.6) 99.0 (98.0-99.5) 97.6 (96.3-98.5) 98.4 (97.1-99.1) 97.9 (96.6-98.7)
20-44 98.4 (98.1-98.7) 97.7 (97.3-98.0) 95.3 (94.9-95.8) 98.7 (98.4-98.9) 98.1 (97.7-98.3)
45-64 96.5 (96.2-96.8) 94.6 (94.2-95.0) 88.1 (87.6-88.6) 96.8 (96.5-97.0) 94.8 (94.5-95.1)
65+ 91.0 (90.2-91.7) 87.4 (86.5-88.2) 74.1 (73.1-75.0) 92.5 (91.9-93.0) 88.5 (87.8-89.1)
Men 95.9 (95.6-96.2) 93.9 (93.5-94.2) 86.9 (86.4-87.3) 96.2 (95.9-96.4) 93.9 (93.6-94.2)
Women 96.6 (96.2-96.9) 95.1 (94.7-95.5) 89.7 (89.2-90.3) 96.5 (96.2-96.8) 94.9 (94.6-95.3)
Diabetes 94.6 (93.9-95.2) 92.1 (91.3-92.8) 83.1 (82.1-84.0) 94.6 (94.0-95.1) 91.6 (90.8-92.2)
Hypertension / renal vascular disease 93.7 (92.7-94.5) 90.8 (89.8-91.8) 81.8 (80.6-83.0) 94.7 (94.0-95.3) 91.7 (90.9-92.5)
Glomerulonephritis 97.2 (96.7-97.6) 96.0 (95.5-96.5) 91.1 (90.4-91.8) 97.6 (97.2-98.0) 96.2 (95.7-96.6)
Other causes 96.7 (96.4-97.0) 95.1 (94.7-95.4) 89.5 (89.0-89.9) 96.8 (96.5-97.0) 95.0 (94.7-95.3)
All 96.1 (95.9-96.4) 94.3 (94.1-94.6) 88.0 (87.6-88.3) 96.3 (96.1-96.5) 94.3 (94.0-94.5)
Based on data from Austria, Belgium (Dutch-speaking), Belgium (French-speaking), Denmark, Finland, France, Greece, Iceland, Norway, Spain (Andalusia), Spain (Aragon), Spain (Asturias), Spain (Basque country), Spain (Cantabria), Spain (Castile and León), Spain (Catalonia), Spain (Extremadura), Spain (Galicia), Spain (Community of Madrid), Spain (Valencian region), Sweden, the Netherlands, United Kingdom (England/Northern Ireland/Wales) and United Kingdom (Scotland)
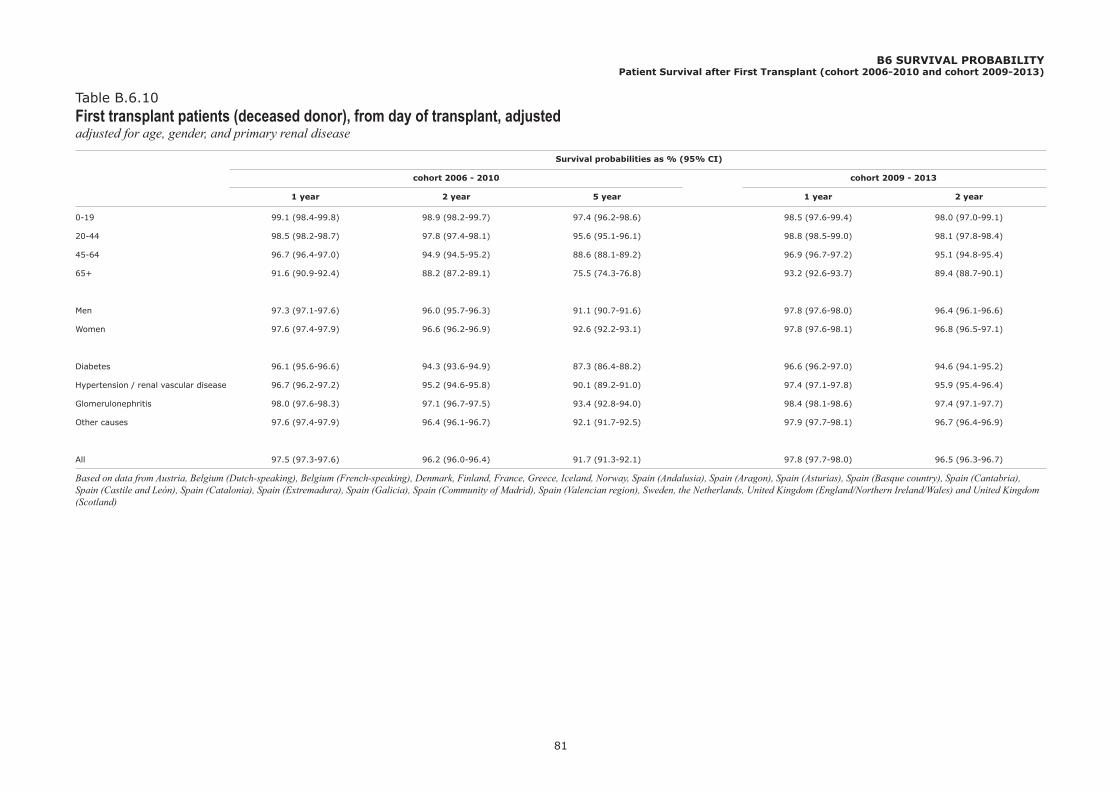
1 year 2 year 5 year 1 year 2 year
81
Survival probabilities as % (95% CI)
cohort 2006 - 2010 cohort 2009 - 2013
B6 SURVIVAL PROBABILITYPatient Survival after First Transplant (cohort 2006-2010 and cohort 2009-2013)
Table B.6.10First transplant patients (deceased donor), from day of transplant, adjustedadjusted for age, gender, and primary renal disease
0-19 99.1 (98.4-99.8) 98.9 (98.2-99.7) 97.4 (96.2-98.6) 98.5 (97.6-99.4) 98.0 (97.0-99.1)
20-44 98.5 (98.2-98.7) 97.8 (97.4-98.1) 95.6 (95.1-96.1) 98.8 (98.5-99.0) 98.1 (97.8-98.4)
45-64 96.7 (96.4-97.0) 94.9 (94.5-95.2) 88.6 (88.1-89.2) 96.9 (96.7-97.2) 95.1 (94.8-95.4)
65+ 91.6 (90.9-92.4) 88.2 (87.2-89.1) 75.5 (74.3-76.8) 93.2 (92.6-93.7) 89.4 (88.7-90.1)
Men 97.3 (97.1-97.6) 96.0 (95.7-96.3) 91.1 (90.7-91.6) 97.8 (97.6-98.0) 96.4 (96.1-96.6)
Women 97.6 (97.4-97.9) 96.6 (96.2-96.9) 92.6 (92.2-93.1) 97.8 (97.6-98.1) 96.8 (96.5-97.1)
Diabetes 96.1 (95.6-96.6) 94.3 (93.6-94.9) 87.3 (86.4-88.2) 96.6 (96.2-97.0) 94.6 (94.1-95.2)
Hypertension / renal vascular disease 96.7 (96.2-97.2) 95.2 (94.6-95.8) 90.1 (89.2-91.0) 97.4 (97.1-97.8) 95.9 (95.4-96.4)
Glomerulonephritis 98.0 (97.6-98.3) 97.1 (96.7-97.5) 93.4 (92.8-94.0) 98.4 (98.1-98.6) 97.4 (97.1-97.7)
Other causes 97.6 (97.4-97.9) 96.4 (96.1-96.7) 92.1 (91.7-92.5) 97.9 (97.7-98.1) 96.7 (96.4-96.9)
All 97.5 (97.3-97.6) 96.2 (96.0-96.4) 91.7 (91.3-92.1) 97.8 (97.7-98.0) 96.5 (96.3-96.7)
Based on data from Austria, Belgium (Dutch-speaking), Belgium (French-speaking), Denmark, Finland, France, Greece, Iceland, Norway, Spain (Andalusia), Spain (Aragon), Spain (Asturias), Spain (Basque country), Spain (Cantabria), Spain (Castile and León), Spain (Catalonia), Spain (Extremadura), Spain (Galicia), Spain (Community of Madrid), Spain (Valencian region), Sweden, the Netherlands, United Kingdom (England/Northern Ireland/Wales) and United Kingdom (Scotland)

1 year 2 year 5 year 1 year 2 year
82
Survival probabilities as % (95% CI)
cohort 2006 - 2010 cohort 2009 - 2013
B6 SURVIVAL PROBABILITYPatient Survival after First Transplant (cohort 2006-2010 and cohort 2009-2013)
Table B.6.11First transplant patients (living donor), from day of transplant, unadjustedby age, gender, and primary renal disease
0-19 99.6 (98.2-99.9) 99.6 (98.2-99.9) 99.3 (97.9-99.8) 99.8 (98.5-100.0) 99.8 (98.5-100.0)
20-44 99.4 (99.1-99.6) 99.2 (98.8-99.4) 97.6 (97.1-98.1) 99.7 (99.5-99.9) 99.4 (99.1-99.6)
45-64 98.1 (97.6-98.5) 97.0 (96.4-97.5) 92.6 (91.8-93.4) 98.5 (98.1-98.8) 97.4 (97.0-97.8)
65+ 95.6 (93.9-96.8) 92.4 (90.4-94.1) 80.0 (77.5-82.3) 96.9 (95.7-97.8) 93.6 (92.0-94.8)
Men 98.5 (98.1-98.8) 97.7 (97.2-98.0) 93.9 (93.3-94.5) 98.8 (98.6-99.1) 97.9 (97.6-98.3)
Women 98.7 (98.2-99.0) 97.7 (97.2-98.2) 94.4 (93.6-95.1) 99.0 (98.6-99.3) 97.9 (97.4-98.3)
Diabetes 96.4 (94.7-97.5) 94.0 (92.1-95.5) 85.4 (82.9-87.5) 97.2 (95.9-98.1) 95.5 (94.0-96.7)
Hypertension / renal vascular disease 96.9 (95.4-98.0) 95.9 (94.1-97.1) 89.6 (87.3-91.5) 97.9 (96.7-98.6) 96.4 (94.9-97.4)
Glomerulonephritis 99.2 (98.7-99.5) 98.7 (98.2-99.1) 96.6 (95.8-97.3) 99.3 (98.9-99.5) 98.6 (98.1-99.0)
Other causes 98.9 (98.6-99.2) 98.2 (97.8-98.5) 95.0 (94.4-95.6) 99.1 (98.9-99.3) 98.2 (97.9-98.5)
All 98.6 (98.3-98.8) 97.7 (97.4-98.0) 94.1 (93.6-94.6) 98.9 (98.7-99.1) 97.9 (97.6-98.2)
Based on data from Austria, Belgium (Dutch-speaking), Belgium (French-speaking), Denmark, Finland, France, Greece, Iceland, Norway, Spain (Andalusia), Spain (Aragon), Spain (Asturias), Spain (Basque country), Spain (Cantabria), Spain (Castile and León), Spain (Catalonia), Spain (Extremadura), Spain (Galicia), Spain (Community of Madrid), Spain (Valencian region), Sweden, the Netherlands, United Kingdom (England/Northern Ireland/Wales) and United Kingdom (Scotland)

1 year 2 year 5 year 1 year 2 year
83
Survival probabilities as % (95% CI)
cohort 2006 - 2010 cohort 2009 - 2013
B6 SURVIVAL PROBABILITYPatient Survival after First Transplant (cohort 2006-2010 and cohort 2009-2013)
Table B.6.12First transplant patients (living donor), from day of transplant, adjustedadjusted for age, gender, and primary renal disease
0-19 99.5 (98.7-100.0) 99.5 (98.7-100.0) 99.2 (98.3-100.0) 99.8 (99.3-100.0) 99.8 (99.3-100.0)
20-44 99.4 (99.1-99.7) 99.1 (98.8-99.4) 97.5 (97.0-98.0) 99.7 (99.6-99.9) 99.3 (99.1-99.6)
45-64 98.3 (97.9-98.7) 97.2 (96.7-97.7) 92.9 (92.0-93.7) 98.6 (98.3-98.9) 97.5 (97.1-98.0)
65+ 96.2 (94.8-97.6) 93.6 (91.8-95.4) 82.1 (79.3-85.0) 96.9 (95.8-97.9) 93.8 (92.4-95.3)
Men 98.8 (98.5-99.0) 98.1 (97.7-98.4) 94.6 (93.9-95.2) 99.1 (98.8-99.3) 98.4 (98.0-98.7)
Women 98.7 (98.3-99.1) 97.8 (97.2-98.3) 94.4 (93.5-95.2) 99.1 (98.8-99.4) 98.0 (97.6-98.5)
Diabetes 97.3 (96.2-98.3) 95.5 (94.1-96.9) 88.6 (86.5-90.8) 98.1 (97.3-98.9) 96.9 (95.9-97.9)
Hypertension / renal vascular disease 98.1 (97.2-98.9) 97.4 (96.4-98.4) 93.1 (91.5-94.8) 98.7 (98.1-99.3) 97.8 (97.0-98.6)
Glomerulonephritis 99.1 (98.7-99.5) 98.6 (98.1-99.1) 96.3 (95.4-97.1) 99.2 (98.9-99.6) 98.5 (98.1-99.0)
Other causes 98.9 (98.6-99.2) 98.2 (97.8-98.6) 94.9 (94.2-95.6) 99.2 (99.0-99.4) 98.4 (98.0-98.7)
All 98.7 (98.5-99.0) 98.0 (97.7-98.3) 94.5 (94.0-95.0) 99.1 (98.9-99.2) 98.2 (98.0-98.5)
Based on data from Austria, Belgium (Dutch-speaking), Belgium (French-speaking), Denmark, Finland, France, Greece, Iceland, Norway, Spain (Andalusia), Spain (Aragon), Spain (Asturias), Spain (Basque country), Spain (Cantabria), Spain (Castile and León), Spain (Catalonia), Spain (Extremadura), Spain (Galicia), Spain (Community of Madrid), Spain (Valencian region), Sweden, the Netherlands, United Kingdom (England/Northern Ireland/Wales) and United Kingdom (Scotland)

1 year 2 year 5 year 1 year 2 year
84
Survival probabilities as % (95% CI)
cohort 2006 - 2010 cohort 2009 - 2013
B6 SURVIVAL PROBABILITYGraft Survival after First Transplant (cohort 2006-2010 and cohort 2009-2013)
Table B.6.13First graft (deceased donor), from day of transplant, unadjustedby age, gender, and primary renal disease
0-19 92.7 (90.7-94.3) 90.0 (87.9-91.8) 82.9 (80.5-85.0) 91.8 (89.7-93.4) 89.3 (87.1-91.1)
20-44 93.8 (93.2-94.3) 91.8 (91.2-92.4) 84.8 (84.1-85.5) 94.3 (93.8-94.8) 92.3 (91.8-92.9)
45-64 91.3 (90.8-91.7) 88.6 (88.1-89.1) 79.9 (79.4-80.4) 91.7 (91.3-92.1) 88.9 (88.5-89.3)
65+ 84.7 (83.8-85.6) 80.6 (79.6-81.5) 65.9 (65.0-66.8) 86.0 (85.3-86.6) 81.3 (80.5-82.0)
Men 90.9 (90.5-91.3) 88.1 (87.6-88.5) 78.5 (78.0-79.0) 91.0 (90.6-91.3) 87.7 (87.3-88.1)
Women 90.8 (90.2-91.3) 88.3 (87.7-88.8) 79.7 (79.0-80.3) 91.2 (90.7-91.7) 88.7 (88.2-89.2)
Diabetes 90.2 (89.3-91.0) 86.9 (85.9-87.7) 75.6 (74.6-76.6) 89.7 (89.0-90.4) 85.8 (85.0-86.6)
Hypertension / renal vascular disease 88.2 (87.1-89.2) 84.9 (83.7-86.0) 72.1 (70.8-73.3) 88.7 (87.7-89.5) 84.9 (83.9-85.8)
Glomerulonephritis 91.3 (90.6-92.0) 88.9 (88.2-89.6) 80.7 (79.8-81.5) 91.9 (91.3-92.5) 89.2 (88.6-89.9)
Other causes 91.4 (91.0-91.9) 88.9 (88.4-89.4) 80.6 (80.1-81.2) 91.7 (91.3-92.1) 89.1 (88.6-89.5)
All 90.9 (90.5-91.2) 88.1 (87.8-88.5) 78.9 (78.5-79.3) 91.1 (90.8-91.3) 88.1 (87.7-88.4)
Based on data from Austria, Belgium (Dutch-speaking), Belgium (French-speaking), Denmark, Finland, France, Greece, Iceland, Norway, Spain (Andalusia), Spain (Aragon), Spain (Asturias), Spain (Basque country), Spain (Cantabria), Spain (Castile and León), Spain (Catalonia), Spain (Extremadura), Spain (Galicia), Spain (Community of Madrid), Spain (Valencian region), Sweden, the Netherlands, United Kingdom (England/Northern Ireland/Wales) and United Kingdom (Scotland)

1 year 2 year 5 year 1 year 2 year
85
Survival probabilities as % (95% CI)
cohort 2006 - 2010 cohort 2009 - 2013
B6 SURVIVAL PROBABILITYGraft Survival after First Transplant (cohort 2006-2010 and cohort 2009-2013)
Table B.6.14First graft (deceased donor), from day of transplant, adjustedadjusted for age, gender, and primary renal disease
0-19 92.2 (90.2-94.2) 89.4 (87.1-91.7) 81.7 (78.8-84.7) 91.5 (89.4-93.6) 88.8 (86.4-91.2)
20-44 93.8 (93.3-94.4) 91.9 (91.3-92.6) 85.1 (84.3-85.9) 94.3 (93.8-94.9) 92.4 (91.8-93.0)
45-64 91.4 (90.9-91.9) 88.8 (88.3-89.3) 80.2 (79.5-80.8) 91.8 (91.4-92.3) 89.1 (88.6-89.6)
65+ 85.3 (84.3-86.3) 81.2 (80.0-82.3) 66.9 (65.5-68.3) 86.6 (85.8-87.4) 82.0 (81.1-82.9)
Men 91.9 (91.5-92.3) 89.4 (88.9-89.8) 80.5 (79.9-81.2) 92.4 (92.1-92.8) 89.6 (89.2-90.1)
Women 91.5 (90.9-92.0) 89.1 (88.5-89.7) 81.0 (80.2-81.8) 92.3 (91.8-92.8) 90.0 (89.5-90.5)
Diabetes 90.9 (90.0-91.7) 87.8 (86.8-88.8) 77.0 (75.7-78.3) 91.2 (90.5-91.9) 87.7 (86.9-88.6)
Hypertension / renal vascular disease 90.6 (89.6-91.6) 87.8 (86.6-88.9) 77.0 (75.5-78.5) 91.4 (90.6-92.2) 88.3 (87.4-89.3)
Glomerulonephritis 91.8 (91.2-92.6) 89.5 (88.8-90.3) 81.7 (80.7-82.7) 92.8 (92.2-93.4) 90.3 (89.6-91.0)
Other causes 92.0 (91.5-92.5) 89.6 (89.1-90.1) 81.7 (81.0-82.4) 92.6 (92.2-93.0) 90.2 (89.8-90.7)
All 91.8 (91.4-92.1) 89.3 (88.9-89.7) 80.7 (80.2-81.2) 92.4 (92.1-92.7) 89.8 (89.4-90.1)
Based on data from Austria, Belgium (Dutch-speaking), Belgium (French-speaking), Denmark, Finland, France, Greece, Iceland, Norway, Spain (Andalusia), Spain (Aragon), Spain (Asturias), Spain (Basque country), Spain (Cantabria), Spain (Castile and León), Spain (Catalonia), Spain (Extremadura), Spain (Galicia), Spain (Community of Madrid), Spain (Valencian region), Sweden, the Netherlands, United Kingdom (England/Northern Ireland/Wales) and United Kingdom (Scotland)

1 year 2 year 5 year 1 year 2 year
86
Survival probabilities as % (95% CI)
cohort 2006 - 2010 cohort 2009 - 2013
B6 SURVIVAL PROBABILITYGraft Survival after First Transplant (cohort 2006-2010 and cohort 2009-2013)
Table B.6.15First graft (living donor), from day of transplant, unadjustedby age, gender, and primary renal disease
0-19 97.1 (95.1-98.3) 96.2 (94.1-97.6) 89.4 (86.6-91.7) 96.8 (94.8-98.0) 96.4 (94.3-97.7)
20-44 96.4 (95.8-96.9) 94.7 (94.0-95.4) 89.0 (88.0-89.8) 97.3 (96.8-97.8) 95.8 (95.2-96.4)
45-64 95.8 (95.2-96.4) 94.1 (93.3-94.8) 87.8 (86.8-88.7) 96.1 (95.5-96.6) 94.2 (93.5-94.8)
65+ 92.6 (90.6-94.2) 89.2 (86.9-91.0) 75.3 (72.8-77.6) 95.2 (93.8-96.3) 91.5 (89.8-92.9)
Men 95.9 (95.3-96.3) 94.3 (93.7-94.9) 87.5 (86.6-88.2) 96.6 (96.1-97.0) 95.0 (94.5-95.5)
Women 95.9 (95.2-96.5) 93.7 (92.8-94.4) 87.2 (86.1-88.2) 96.4 (95.8-96.9) 94.1 (93.3-94.7)
Diabetes 93.6 (91.6-95.1) 90.7 (88.5-92.5) 79.3 (76.7-81.5) 94.9 (93.3-96.2) 92.4 (90.6-93.9)
Hypertension / renal vascular disease 93.9 (91.9-95.4) 91.4 (89.3-93.2) 82.1 (79.5-84.3) 95.4 (93.9-96.6) 93.2 (91.4-94.6)
Glomerulonephritis 95.9 (95.0-96.6) 94.2 (93.2-95.0) 87.8 (86.5-89.0) 96.5 (95.7-97.1) 94.7 (93.9-95.5)
Other causes 96.5 (96.0-97.0) 95.0 (94.3-95.5) 89.2 (88.3-89.9) 96.8 (96.4-97.3) 95.1 (94.6-95.6)
All 95.9 (95.4-96.3) 94.1 (93.6-94.5) 87.4 (86.7-88.0) 96.5 (96.2-96.8) 94.7 (94.3-95.1)
Based on data from Austria, Belgium (Dutch-speaking), Belgium (French-speaking), Denmark, Finland, France, Greece, Iceland, Norway, Spain (Andalusia), Spain (Aragon), Spain (Asturias), Spain (Basque country), Spain (Cantabria), Spain (Castile and León), Spain (Catalonia), Spain (Extremadura), Spain (Galicia), Spain (Community of Madrid), Spain (Valencian region), Sweden, the Netherlands, United Kingdom (England/Northern Ireland/Wales) and United Kingdom (Scotland)

1 year 2 year 5 year 1 year 2 year
87
Survival probabilities as % (95% CI)
cohort 2006 - 2010 cohort 2009 - 2013
B6 SURVIVAL PROBABILITYGraft Survival after First Transplant (cohort 2006-2010 and cohort 2009-2013)
Table B.6.16First graft (living donor), from day of transplant, adjustedadjusted for age, gender, and primary renal disease
0-19 96.6 (94.8-98.4) 95.8 (93.8-97.8) 88.1 (84.9-91.4) 96.4 (94.6-98.2) 95.9 (94.0-97.8)
20-44 96.3 (95.6-96.9) 94.6 (93.8-95.3) 88.5 (87.5-89.6) 97.2 (96.7-97.7) 95.7 (95.1-96.3)
45-64 95.9 (95.2-96.5) 94.1 (93.4-94.9) 87.8 (86.7-88.9) 96.1 (95.5-96.6) 94.2 (93.5-94.9)
65+ 92.9 (91.0-94.8) 89.8 (87.6-92.1) 76.4 (73.3-79.8) 94.9 (93.5-96.3) 91.2 (89.5-93.0)
Men 95.8 (95.2-96.4) 94.2 (93.6-94.9) 87.0 (86.1-88.0) 96.4 (96.0-96.9) 94.9 (94.4-95.5)
Women 95.4 (94.6-96.1) 92.9 (92.0-93.9) 85.8 (84.5-87.1) 96.0 (95.3-96.6) 93.4 (92.6-94.3)
Diabetes 93.7 (92.0-95.5) 90.9 (88.7-93.0) 79.6 (76.6-82.6) 95.2 (93.7-96.6) 92.7 (91.0-94.5)
Hypertension / renal vascular disease 94.1 (92.4-95.9) 91.8 (89.7-93.9) 82.7 (79.9-85.6) 95.7 (94.4-97.0) 93.6 (92.0-95.2)
Glomerulonephritis 95.5 (94.6-96.4) 93.7 (92.6-94.8) 86.8 (85.3-88.4) 96.2 (95.4-96.9) 94.3 (93.4-95.2)
Other causes 96.3 (95.7-96.8) 94.7 (94.0-95.3) 88.5 (87.5-89.4) 96.7 (96.2-97.2) 94.9 (94.4-95.5)
All 95.6 (95.2-96.1) 93.8 (93.2-94.3) 86.6 (85.8-87.4) 96.3 (95.9-96.7) 94.4 (93.9-94.9)
Based on data from Austria, Belgium (Dutch-speaking), Belgium (French-speaking), Denmark, Finland, France, Greece, Iceland, Norway, Spain (Andalusia), Spain (Aragon), Spain (Asturias), Spain (Basque country), Spain (Cantabria), Spain (Castile and León), Spain (Catalonia), Spain (Extremadura), Spain (Galicia), Spain (Community of Madrid), Spain (Valencian region), Sweden, the Netherlands, United Kingdom (England/Northern Ireland/Wales) and United Kingdom (Scotland)

88
Figure B.6.1Adjusted patient survival by primary renal disease: Incident RRT patientsfrom day 1, adjusted for age and gender
Figure B.6.2Adjusted patient survival by modality: Incident dialysis patientsfrom day 91, adjusted for age, gender, and primary renal disease
Figure B.6.3Adjusted patient survival by donor type: Patients receiving a first kidney transplantfrom day of transplant, adjusted for age, gender, and primary renal disease
0
10
20
30
40
50
60
70
80
90
100
0 1 2 3 4 5
Sur
viva
l pro
babi
lity
(%)
Years
Diabetes
Hypertension
Glomerulonephritis
Other causes
0
10
20
30
40
50
60
70
80
90
100
0 1 2 3 4 5
Sur
viva
l pro
babi
lity
(%)
Years
Haemodialysis
Peritoneal dialysis
0
10
20
30
40
50
60
70
80
90
100
0 1 2 3 4 5
Sur
viva
l pro
babi
lity
(%)
Years
Living donor
Deceased donor
Survival on dialysis was examined using the Cox regression method, with transplantation as a censored observation (see methods)
B6 SURVIVAL PROBABILITYPatient survival by Primary Renal Disease and Treatment Modality (cohort 2006-2010)

89
Figure B.6.4Adjusted cumulative incidence of death and receiving a kidney transplant: Incident dialysis patientsfrom day 1, adjusted for age, gender and primary renal disease
0
10
20
30
40
50
60
70
80
90
100
0 1 2 3 4 5
Perc
enta
ge o
f pa
tient
s
Years
Survival on dialysis was examined using the Fine and Gray competing risk method, with transplantation as a competing event (see methods)
Death (15.1%)
Transplanted (47.0%)
B6 SURVIVAL PROBABILITYPatient survival by Primary Renal Disease and Treatment Modality (cohort 2006-2010)
Remaining on dialysis (37.9%)

Age All Men Women Age All Men Women Age All Men Women
General population ESRD: Dialysis ESRD: Transplant
90
0 81.2 78.7 83.7 0-19 39.6 39.8 39.3 0-19 62.6 62.1 63.4
5 76.6 74.0 79.0
10 71.6 69.1 74.0
15 66.6 64.1 69.0
20 61.7 59.2 64.1 20-24 21.8 22.0 21.4 20-24 43.3 42.8 44.3
25 56.8 54.4 59.1 25-29 19.1 19.2 18.8 25-29 39.0 38.5 39.8
30 51.9 49.5 54.2 30-34 16.2 16.1 16.2 30-34 34.6 34.2 35.4
35 47.1 44.7 49.3 35-39 13.9 13.9 14.1 35-39 30.5 30.1 31.2
40 42.2 39.9 44.4 40-44 11.9 11.8 12.2 40-44 26.5 26.0 27.4
45 37.5 35.2 39.6 45-49 10.2 9.9 10.6 45-49 22.8 22.3 23.7
50 32.8 30.7 34.9 50-54 8.5 8.3 8.9 50-54 19.0 18.5 19.9
55 28.4 26.3 30.3 55-59 7.1 7.0 7.5 55-59 15.8 15.4 16.5
60 24.1 22.1 25.8 60-64 6.1 6.0 6.5 60-64 12.7 12.4 13.3
65 19.9 18.2 21.5 65-69 5.4 5.2 5.6 65-69 10.1 9.9 10.5
70 16.0 14.5 17.3 70-74 4.7 4.6 4.8 70-74 7.7 7.6 7.9
75 12.3 11.1 13.3 75-79 4.0 3.9 4.1 75-79 5.6 5.6 5.5
80 9.0 8.0 9.7 80-84 3.3 3.3 3.3 80-84 3.5 3.6 3.3
85 6.3 5.6 6.7 85-89 2.2 2.1 2.2
Based on data from Austria, Belgium (Dutch-speaking), Belgium (French-speaking), Denmark, Finland, France, Greece, Iceland, Norway, Spain (Andalusia), Spain (Aragon), Spain (Asturias), Spain (Basque Country), Spain (Cantabria), Spain (Castile and León), Spain (Castile-La Mancha), Spain (Catalonia), Spain (Extremadura), Spain (Galicia), Spain (Community of Madrid), Spain (Valencian region), Sweden, the Netherlands, United Kingdom (England, Northern Ireland and Wales), United Kingdom (Scotland)
B7 EXPECTED REMAINING LIFETIMES
Table B.7.1Expected remaining lifetimes (years) of the general population (cohort 2011-2015) and of prevalent dialysis and transplant patients (cohort 2011-2015)by age and gender

Section C: Aggregated data reference tables
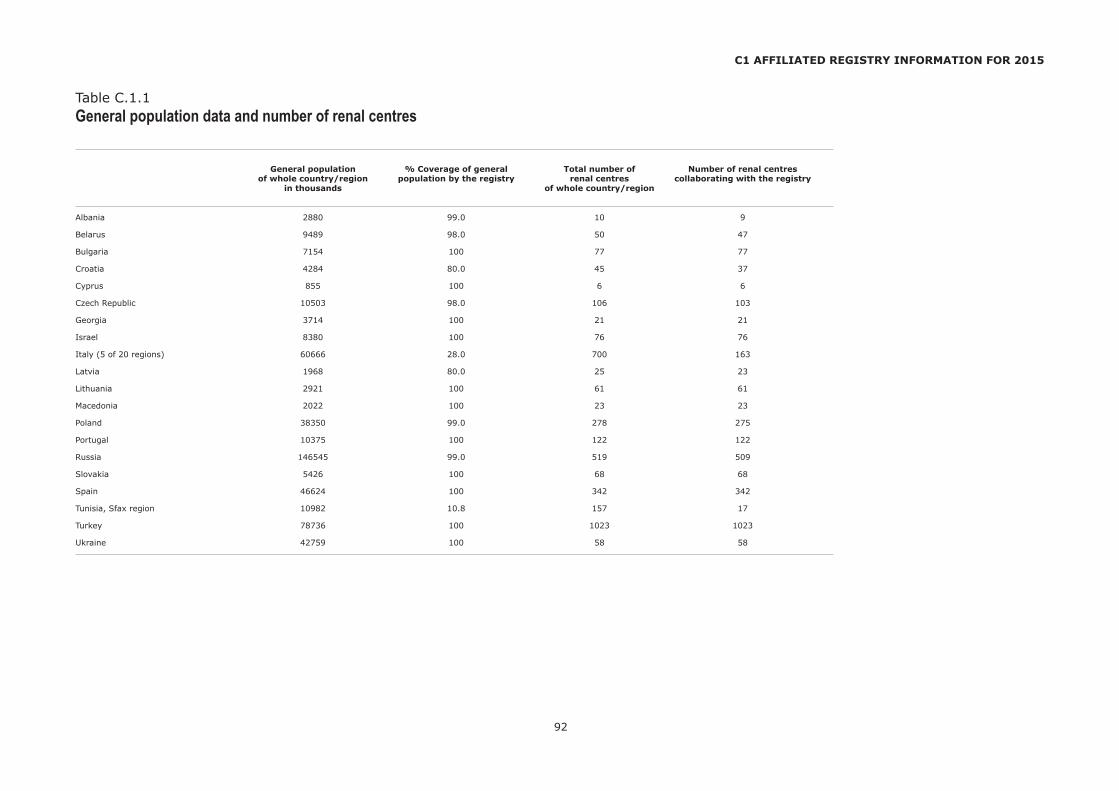
92
General population % Coverage of general Total number of Number of renal centres of whole country/region population by the registry renal centres collaborating with the registry in thousands of whole country/region
Albania 2880 99.0 10 9
Belarus 9489 98.0 50 47
Bulgaria 7154 100 77 77
Croatia 4284 80.0 45 37
Cyprus 855 100 6 6
Czech Republic 10503 98.0 106 103
Georgia 3714 100 21 21
Israel 8380 100 76 76
Italy (5 of 20 regions) 60666 28.0 700 163
Latvia 1968 80.0 25 23
Lithuania 2921 100 61 61
Macedonia 2022 100 23 23
Poland 38350 99.0 278 275
Portugal 10375 100 122 122
Russia 146545 99.0 519 509
Slovakia 5426 100 68 68
Spain 46624 100 342 342
Tunisia, Sfax region 10982 10.8 157 17
Turkey 78736 100 1023 1023
Ukraine 42759 100 58 58
C1 AFFILIATED REGISTRY INFORMATION FOR 2015
Table C.1.1General population data and number of renal centres

All 0-19 20-44 45-64 65-74 75+
All Men Women All Men Women All Men Women All Men Women All Men Women All Men Women
N (100%) N (100%) N (100%) N % N % N % N % N % N % N % N % N % N % N % N % N % N % N %
93
C2 INCIDENT PATIENTS ACCEPTED FOR RRT IN 2015, AT DAY 1
Table C.2.1Incident counts and percentages by age and genderat day 1
Albania 251 161 90 1 0 1 1 0 0 60 24 39 24 21 23 136 54 85 53 51 57 41 16 27 17 14 16 13 5 9 6 4 4
Belarus 747 412 335 3 0 3 1 0 0 155 21 88 21 67 20 357 48 199 48 158 47 167 22 91 22 76 23 65 9 31 8 34 10
Bulgaria † 1093 557 536
Croatia 540 328 212 5 1 4 1 1 0 37 7 30 9 7 3 193 36 120 37 73 34 141 26 88 27 53 25 164 30 86 26 78 37
Cyprus 164 118 46 4 2 2 2 2 4 11 7 9 8 2 4 43 26 29 25 14 30 47 29 32 27 15 33 59 36 46 39 13 28
Czech Republic † 2393
Georgia 694 461 233 10 1 4 1 6 3 68 10 38 8 30 13 330 48 236 51 94 40 163 23 106 23 57 24 123 18 77 17 46 20
Israel 1606 1046 560 40 2 24 2 16 3 141 9 92 9 49 9 477 30 333 32 144 26 431 27 268 26 163 29 517 32 329 31 188 34
Italy (5 of 20 regions) 2232 1467 765 24 1 19 1 5 1 155 7 100 7 55 7 581 26 399 27 182 24 579 26 393 27 186 24 893 40 556 38 337 44
Latvia 152 78 74 2 1 2 3 0 0 20 13 13 17 7 9 49 32 25 32 24 32 44 29 21 27 23 31 37 24 17 22 20 27
Lithuania 308 197 111 2 1 1 1 1 1 37 12 29 15 8 7 87 28 57 29 30 27 86 28 52 26 34 31 96 31 58 29 38 34
Macedonia 307 172 135 2 1 0 0 2 1 25 8 18 10 7 5 116 38 62 36 54 40 93 30 47 27 46 34 71 23 45 26 26 19
Poland 6617
Portugal 2352
Russia † 7413 3920 3493 352 5 218 6 134 4 1734 23 945 24 789 23 3488 47 1797 46 1691 48 1338 18 679 17 659 19 501 7 281 7 220 6
Slovakia † 916 562 354 1 0 0 0 1 0 107 12 76 14 31 9 333 36 229 41 104 29 296 32 161 29 135 38 179 20 96 17 83 23
Spain § 6277 4236 2041 32 1 20 0 12 1 643 10 411 10 232 11 1977 31 1345 32 632 31 1749 28 1230 29 519 25 1876 30 1230 29 646 32
Tunisia, Sfax region 193 109 84 3 2 0 0 3 4 36 19 27 25 9 11 69 36 43 39 26 31 36 19 19 17 17 20 49 25 20 18 29 35
Turkey 11597
Ukraine 1024 568 456
Categories may not add up because of missing values or rounding offWhen cells are left empty, the data are unavailable† Data include dialysis patients only§ Data presented in the column 0-19 refer to patients aged 0-14 years and data presented in the column 20-44 refer to patients aged 15-44 years

All 0-19 20-44 45-64 65-74 75+
All Men Women All Men Women All Men Women All Men Women All Men Women All Men Women
Pmp Pmp Pmp Pmarp Pmarp Pmarp Pmarp Pmarp Pmarp Pmarp Pmarp Pmarp Pmarp Pmarp Pmarp Pmarp Pmarp Pmarp
94
C2 INCIDENT PATIENTS ACCEPTED FOR RRT IN 2015, AT DAY 1
Table C.2.2Incident rates per million (age-related) population by age and gender, unadjustedat day 1
Albania 88.0 111.4 64.0 1.3 2.5 0 60.8 76.6 44.0 185.6 234.6 137.7 187.4 250.2 126.3 91.2 135.7 52.5
Belarus 80.3 95.2 67.4 1.5 3.0 0 45.7 51.6 39.6 136.4 167.5 110.6 243.4 357.1 176.3 100.5 178.7 71.8
Bulgaria † 152.8 160.2 145.8
Croatia 157.6 198.5 119.4 7.0 10.9 2.9 32.6 52.2 12.5 199.1 253.4 147.2 425.7 618.0 280.7 595.9 918.8 429.5
Cyprus 191.8 283.7 104.8 20.6 20.0 21.3 32.5 55.6 11.4 204.8 284.3 129.6 701.5 1000.0 428.6 1282.6 2300.0 500.0
Czech Republic † 232.5
Georgia 186.9 260.0 120.1 10.9 8.3 13.8 52.4 59.0 46.0 340.7 529.9 179.7 585.5 937.2 344.8 491.6 891.2 280.8
Israel 191.6 251.9 132.5 13.2 15.5 10.9 49.4 64.3 34.5 300.5 432.9 176.0 845.8 1130.8 597.9 1261.3 1949.1 779.8
Italy (5 of 20 regions) 131.4 177.9 87.5 7.7 11.8 3.3 29.6 37.9 21.2 119.0 167.2 72.9 316.1 455.7 191.9 467.1 740.1 290.4
Latvia 96.5 107.9 86.9 6.5 12.6 0 38.2 48.9 27.1 113.4 126.5 102.4 276.4 354.7 230.0 247.3 408.7 185.2
Lithuania 105.4 146.4 70.5 3.4 3.3 3.4 38.5 60.2 16.7 106.4 152.4 67.6 310.5 495.2 197.7 355.6 734.2 199.0
Macedonia 151.8 169.5 134.1 3.4 0 7.0 32.9 46.3 18.8 254.4 275.6 233.8 637.0 691.2 589.7 1044.1 1551.7 666.7
Poland 174.3
Portugal 226.7
Russia † 51.1 58.3 44.9 11.2 13.5 8.8 32.2 35.2 29.2 87.9 101.1 77.2 126.7 173.3 99.3 52.2 107.2 31.6
Slovakia † 168.8 212.3 127.4 0.9 0 1.8 51.7 71.8 30.7 228.6 321.6 139.6 627.1 805.0 496.3 573.7 932.0 397.1
Spain § 134.6 185.1 86.0 4.6 5.5 3.5 34.9 43.9 25.6 156.9 215.6 99.4 406.7 610.7 227.0 438.9 740.1 247.3
Tunisia, Sfax region 162.7 184.4 141.2 8.1 0 16.7 75.9 116.7 37.1 278.5 350.2 208.1 690.1 751.8 632.2 1200.3 1011.9 1377.0
Turkey 147.3
Ukraine 23.9 28.7 19.9
When cells are left empty, the data are unavailable† Data include dialysis patients only§ Data presented in the column 0-19 refer to patients aged 0-14 years and data presented in the column 20-44 refer to patients aged 15-44 years

% Mean SD Median % Mean SD Median % Mean SD Median (years) (years) (years) (years) (years) (years)
All Men Women
95
C2 INCIDENT PATIENTS ACCEPTED FOR RRT IN 2015, AT DAY 1
Table C.2.3Gender, mean age, and median age of incident patientsat day 1
Albania 100 52.5 15.1 51.8 64.1 55.0 15.4 56.5 35.9 48.0 16.1 47.5
Belarus 100 55.2 44.8
Bulgaria † 100 51.0 49.0
Croatia 100 65.3 14.4 67.0 60.7 63.8 15.2 66.0 39.3 67.6 12.3 69.0
Cyprus 100 66.3 16.9 70.0 72.0 66.8 16.3 71.0 28.0 64.9 18.5 69.0
Czech Republic
Georgia 100 61.9 14.8 62.3 66.4 61.3 13.6 62.4 33.6 63.1 16.0 62.2
Israel 100 65.3 16.6 68.6 65.1 65.2 16.8 68.0 34.9 65.6 17.1 69.2
Italy (5 of 20 regions) 100 68.2 15.5 71.5 65.7 67.8 16.3 77.6 34.3 69.1 15.8 72.9
Latvia 100 62.2 16.2 66.0 51.3 61.1 17.0 64.0 48.7 63.4 15.2 67.0
Lithuania 100 64.7 15.9 66.4 64.0 63.9 16.6 65.6 36.0 66.2 14.7 68.5
Macedonia 100 63.5 13.8 66.0 56.0 63.6 14.2 66.0 44.0 63.5 13.3 65.0
Poland
Portugal
Russia † 100 52.3 16.8 56.0 52.9 51.4 17.1 54.0 47.1 53.3 16.4 57.0
Slovakia † 100 62.8 14.1 65.0 61.4 61.4 13.8 63.0 38.6 64.9 13.6 67.0
Spain 100 64.8 15.2 67.4 67.5 65.0 14.6 67.3 32.5 64.3 15.6 67.6
Tunisia, Sfax region 100 59.4 17.4 61.0 56.5 56.3 17.3 57.0 43.5 63.4 17.3 66.0
Turkey
Ukraine 100 48.1 14.6 50.0 55.5 48.2 14.4 50.0 44.5 47.9 15.0 50.0
Categories may not add up because of missing values or rounding offWhen cells are left empty, the data are unavailable† Data include dialysis patients only

Pmp Pmp Pmp
All Men Women
96
C2 INCIDENT PATIENTS ACCEPTED FOR RRT IN 2015, AT DAY 1
Table C.2.4Incident rates per million population, adjustedat day 1, adjusted for age and gender
Albania 87.1 110.3 63.4
Belarus
Bulgaria
Croatia 151.7 198.9 112.3
Cyprus 240.9 331.7 136.5
Czech Republic
Georgia 202.4 300.6 124.5
Israel 285.1 367.2 199.3
Italy (5 of 20 regions) 111.9 147.5 75.8
Latvia 90.0 111.0 76.6
Lithuania 100.0 152.7 63.4
Macedonia 224.2 251.6 189.7
Poland
Portugal
Russia † 51.8 63.9 43.3
Slovakia † 181.4 237.6 134.0
Spain 125.2 167.9 81.2
Tunisia, Sfax region 233.8 241.4 231.2
Turkey
Ukraine
When cells are left empty, the data are unavailable† Data include dialysis patients only

All GN PN PKD DM HT RVD Misc Unkn Missing
Type I Type II Both
Pmp % Pmp % Pmp % Pmp % Pmp % Pmp % Pmp % Pmp % Pmp % Pmp % Pmp % Pmp %
97
C2 INCIDENT PATIENTS ACCEPTED FOR RRT IN 2015, AT DAY 1
Table C.2.5Incident rates per million population and percentages by primary renal disease, unadjustedat day 1
Albania 88.0 100 14.0 15.9 15.4 17.5 3.5 4.0 1.1 1.2 9.5 10.8 10.5 12.0 6.3 7.2 1.8 2.0 9.1 10.4 27.4 31.1 0 0
Belarus 80.3 100 17.9 22.2 8.0 9.9 5.8 7.2 4.4 5.5 13.5 16.9 18.0 22.4 8.1 10.0 3.8 4.7 17.3 21.6 0.6 0.8 1.0 1.2
Bulgaria † 152.8 100 20.5 13.4 12.7 8.3 13.8 9.1 38.9 25.4 19.8 13.0 15.5 10.2 21.9 14.4 7.4 4.8 2.1 1.4
Croatia 157.6 100 28.9 18.3 18.7 11.9 8.5 5.4 46.4 29.4 2.6 1.7 49.0 31.1 35.0 22.2 5.0 3.1 6.7 4.3 5.8 3.7 0 0
Cyprus 191.8 100 23.4 12.2 7.0 3.7 8.2 4.3 4.7 2.4 66.7 34.8 71.3 37.2 35.1 18.3 4.7 2.4 18.7 9.8 23.4 12.2 0 0
Czech Republic
Georgia 186.9 100 20.5 11.0 14.8 7.9 12.7 6.8 9.2 4.9 33.4 17.9 42.5 22.8 18.6 9.9 8.6 4.6 7.8 4.2 56.0 30.0 5.4 2.9
Israel 191.6 100 11.0 5.7 4.8 2.5 5.4 2.8 25.5 13.3 60.7 31.7 86.3 45.0 16.8 8.8 5.4 2.8 23.9 12.5 27.8 14.5 10.4 5.4
Italy (5 of 20 regions) 131.4 100 13.5 10.3 4.7 3.5 7.0 5.3 23.7 18.0 16.5 12.6 9.4 7.1 13.9 10.6 27.8 21.2 14.9 11.3
Latvia 96.5 100 15.2 15.8 12.7 13.2 7.0 7.2 3.2 3.3 11.4 11.8 14.6 15.1 17.8 18.4 0 0 10.2 10.5 19.1 19.7 0 0
Lithuania 105.4 100 18.5 17.5 18.5 17.5 9.6 9.1 15.1 14.3 19.5 18.5 2.7 2.6 13.0 12.3 3.1 2.9 5.5 5.2
Macedonia 151.8 100 10.9 7.2 7.9 5.2 10.9 7.2 5.4 3.6 29.7 19.5 35.1 23.1 43.0 28.3 0.5 0.3 25.2 16.6 18.3 12.1 0 0
Poland
Portugal & + 226.7 100 24.6 10.8 10.7 4.7 74.3 32.8 28.6 12.6 42.2 18.6 38.7 17.1 7.5 3.3
Russia † 51.1 100 18.2 35.5 5.3 10.4 4.5 8.9 3.5 6.9 5.4 10.6 8.9 17.5 4.2 8.3 0.9 1.8 7.1 13.8 1.9 3.8 0 0
Slovakia † 168.8 100 18.4 10.9 17.0 10.0 5.5 3.3 61.6 36.5 14.6 8.6 6.5 3.8 41.3 24.5 4.1 2.4 0 0
Spain ¶ 134.6 100 17.3 12.9 10.3 7.7 9.0 6.7 31.2 23.2 20.7 15.3 15.8 11.8 30.3 22.5 0 0
Tunisia, Sfax region § 162.7 100 9.3 5.7 20.2 12.4 11.0 6.7 52.3 32.1 3.4 2.1 1.7 1.0 59.0 36.3 5.9 3.6
Turkey ‡ 147.3 100 1.3 0.9 0.5 0.3 0.9 0.6 2.6 1.7 5.5 3.7 8.1 5.5 6.2 4.2 0.3 0.2 2.3 1.5 2.3 1.6 125.6 85.3
Ukraine + 23.9 100 7.8 32.6 4.1 17.3 2.5 10.4 5.8 24.2 1.6 6.5 2.1 8.6 0.1 0.3 0 0
Abbreviations used: GN: glomerulonephritis/sclerosis; PN: pyelonephritis; PKD: polycystic kidneys, adult type; DM: diabetes mellitus; HT: hypertension; RVD: renal vascular disease; Misc: miscellaneous; Unkn: unknownCategories may not add up because of rounding offWhen cells are left empty, the data are unavailable† Data include dialysis patients only& Pyelonephritis is not reported separately, but is included into miscellaneous+ Renal vascular disease is not reported separately, but is included into miscellaneous¶ Renal vascular disease is not reported separately, but is included into hypertension§ Hypertension is not reported separately, but is included into renal vascular disease‡ Data are available for 1707 dialysis patients (14.7% of total)

All Haemodialysis Peritoneal dialysis Transplant Missing
HD HD HD HF HDF Total APD CAPD PD Total Living Deceased Tx Total hospital/ home type HD/ type PD type Tx centre Unkn HF/HDF Unkn Unkn
N N N N N N N N N N N N N N N N
98
C2 INCIDENT PATIENTS ACCEPTED FOR RRT IN 2015, AT DAY 1
Table C.2.6Incident counts by treatment modalityat day 1
Albania 251 230 0 0 0 0 230 0 3 0 3 5 0 0 5 13
Belarus 747 668 0 0 0 10 678 7 56 0 63 6 0 0 6 0
Bulgaria † 1093 995 0 0 0 87 1082 0 11 0 11 0
Croatia 540 454 0 0 0 61 515 9 10 0 19 2 4 0 6 0
Cyprus 164 129 129 2 32 0 34 1 0 0 1 0
Czech Republic † 2393 2295 2295 98 98 0
Georgia 694 658 0 0 0 0 658 29 2 0 31 2 0 0 2 3
Israel 1606 1421 0 0 0 0 1421 56 71 0 127 48 4 6 58 0
Italy (5 of 20 regions) 2232 1761 1 0 11 161 1934 128 154 0 282 7 9 0 16 0
Latvia 152 116 0 0 0 0 116 34 34 2 0 0 2 0
Lithuania 308 287 0 0 0 0 287 20 20 1 0 0 1 0
Macedonia 307 294 0 0 0 0 294 0 7 0 7 6 0 0 6 0
Poland 6617 5877 0 5877 100 270 370 740 0 0 0 0 0
Portugal 2352 2106 0 0 0 0 2106 229 229 17 0 0 17 0
Russia † 7413 6829 0 0 0 0 6829 0 584 0 584 0
Slovakia
Spain 6277 4914 4914 1048 1048 315 315 0
Tunisia, Sfax region 193 183 0 0 0 0 183 4 6 0 10 0 0 0 0 0
Turkey 11597 9334 3 0 4 249 9590 80 339 576 995 995 17 0 1012 0
Ukraine 1024 732 0 0 0 117 849 3 172 0 175 0 0 0 0 0
Abbreviations used: HD: haemodialysis; Unkn: unknown; HF: haemofiltration; HDF: haemodiafiltration; APD: automated peritoneal dialysis; CAPD: continuous ambulatory peritoneal dialysis; PD: peritoneal dialysis; Tx: transplantWhen cells are left empty, the data are unavailable† Data include dialysis patients only
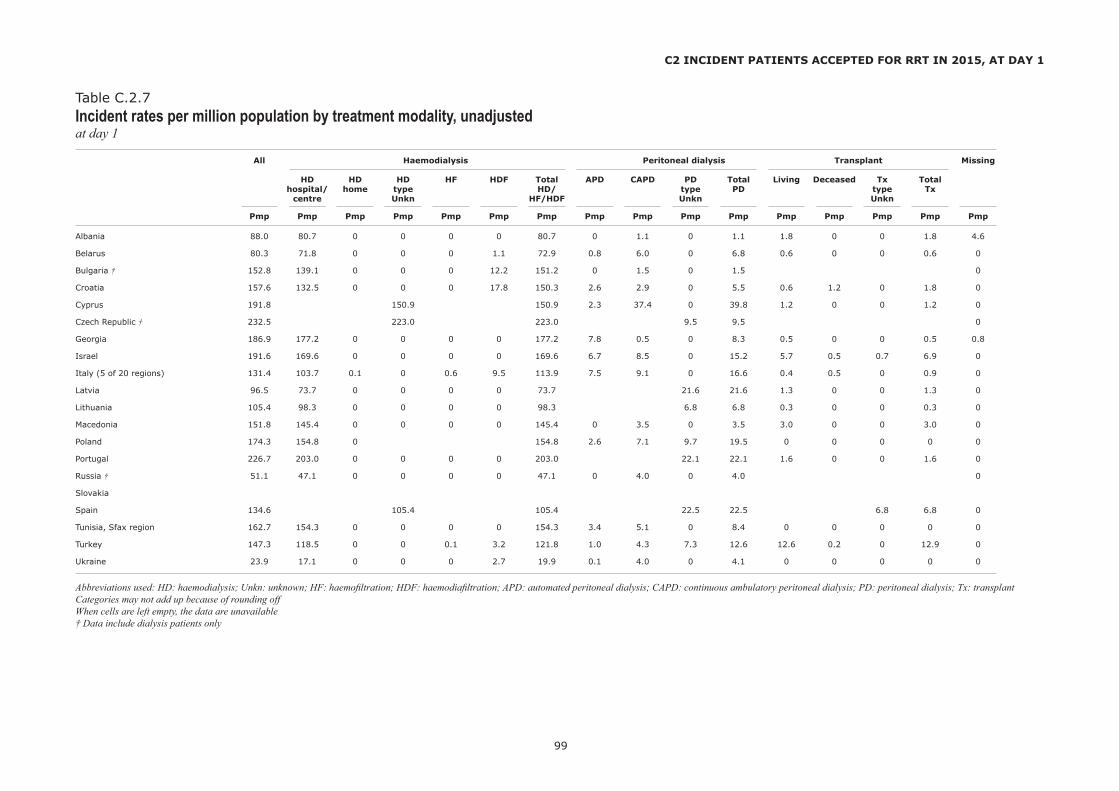
All Haemodialysis Peritoneal dialysis Transplant Missing
HD HD HD HF HDF Total APD CAPD PD Total Living Deceased Tx Total hospital/ home type HD/ type PD type Tx centre Unkn HF/HDF Unkn Unkn
Pmp Pmp Pmp Pmp Pmp Pmp Pmp Pmp Pmp Pmp Pmp Pmp Pmp Pmp Pmp Pmp
99
C2 INCIDENT PATIENTS ACCEPTED FOR RRT IN 2015, AT DAY 1
Table C.2.7Incident rates per million population by treatment modality, unadjustedat day 1
Albania 88.0 80.7 0 0 0 0 80.7 0 1.1 0 1.1 1.8 0 0 1.8 4.6
Belarus 80.3 71.8 0 0 0 1.1 72.9 0.8 6.0 0 6.8 0.6 0 0 0.6 0
Bulgaria † 152.8 139.1 0 0 0 12.2 151.2 0 1.5 0 1.5 0
Croatia 157.6 132.5 0 0 0 17.8 150.3 2.6 2.9 0 5.5 0.6 1.2 0 1.8 0
Cyprus 191.8 150.9 150.9 2.3 37.4 0 39.8 1.2 0 0 1.2 0
Czech Republic † 232.5 223.0 223.0 9.5 9.5 0
Georgia 186.9 177.2 0 0 0 0 177.2 7.8 0.5 0 8.3 0.5 0 0 0.5 0.8
Israel 191.6 169.6 0 0 0 0 169.6 6.7 8.5 0 15.2 5.7 0.5 0.7 6.9 0
Italy (5 of 20 regions) 131.4 103.7 0.1 0 0.6 9.5 113.9 7.5 9.1 0 16.6 0.4 0.5 0 0.9 0
Latvia 96.5 73.7 0 0 0 0 73.7 21.6 21.6 1.3 0 0 1.3 0
Lithuania 105.4 98.3 0 0 0 0 98.3 6.8 6.8 0.3 0 0 0.3 0
Macedonia 151.8 145.4 0 0 0 0 145.4 0 3.5 0 3.5 3.0 0 0 3.0 0
Poland 174.3 154.8 0 154.8 2.6 7.1 9.7 19.5 0 0 0 0 0
Portugal 226.7 203.0 0 0 0 0 203.0 22.1 22.1 1.6 0 0 1.6 0
Russia † 51.1 47.1 0 0 0 0 47.1 0 4.0 0 4.0 0
Slovakia
Spain 134.6 105.4 105.4 22.5 22.5 6.8 6.8 0
Tunisia, Sfax region 162.7 154.3 0 0 0 0 154.3 3.4 5.1 0 8.4 0 0 0 0 0
Turkey 147.3 118.5 0 0 0.1 3.2 121.8 1.0 4.3 7.3 12.6 12.6 0.2 0 12.9 0
Ukraine 23.9 17.1 0 0 0 2.7 19.9 0.1 4.0 0 4.1 0 0 0 0 0
Abbreviations used: HD: haemodialysis; Unkn: unknown; HF: haemofiltration; HDF: haemodiafiltration; APD: automated peritoneal dialysis; CAPD: continuous ambulatory peritoneal dialysis; PD: peritoneal dialysis; Tx: transplantCategories may not add up because of rounding offWhen cells are left empty, the data are unavailable† Data include dialysis patients only
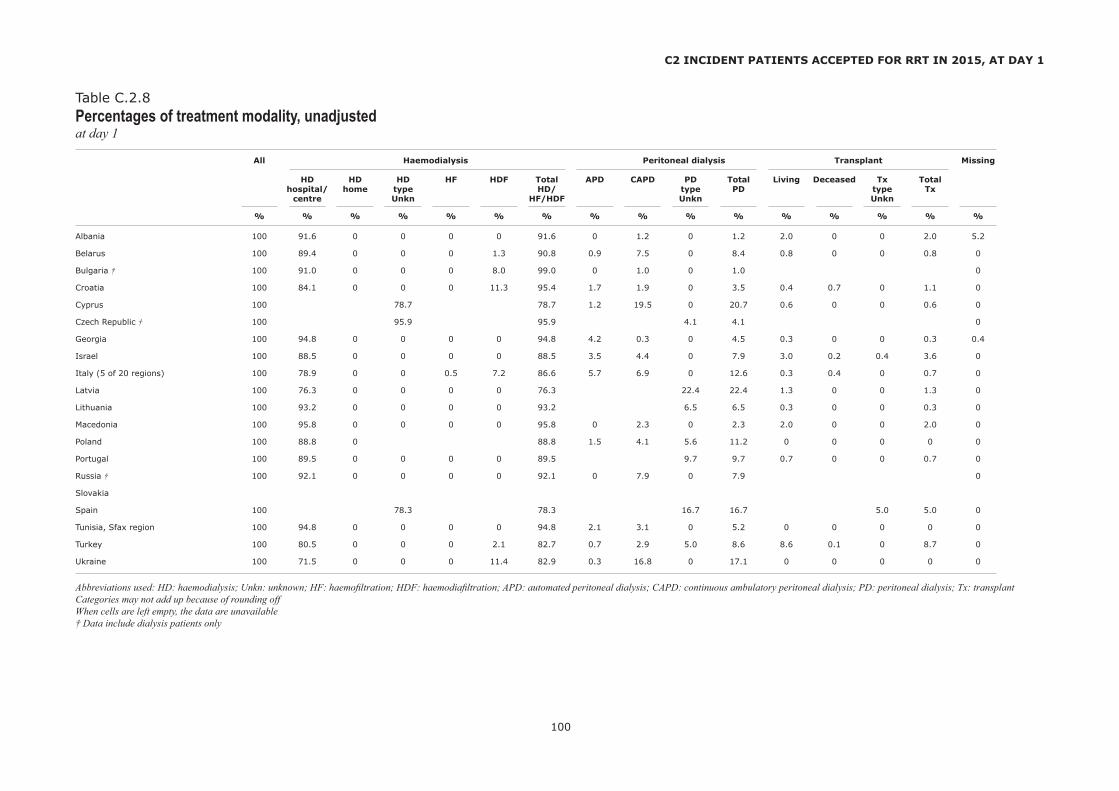
All Haemodialysis Peritoneal dialysis Transplant Missing
HD HD HD HF HDF Total APD CAPD PD Total Living Deceased Tx Total hospital/ home type HD/ type PD type Tx centre Unkn HF/HDF Unkn Unkn
% % % % % % % % % % % % % % % %
100
C2 INCIDENT PATIENTS ACCEPTED FOR RRT IN 2015, AT DAY 1
Table C.2.8Percentages of treatment modality, unadjustedat day 1
Albania 100 91.6 0 0 0 0 91.6 0 1.2 0 1.2 2.0 0 0 2.0 5.2
Belarus 100 89.4 0 0 0 1.3 90.8 0.9 7.5 0 8.4 0.8 0 0 0.8 0
Bulgaria † 100 91.0 0 0 0 8.0 99.0 0 1.0 0 1.0 0
Croatia 100 84.1 0 0 0 11.3 95.4 1.7 1.9 0 3.5 0.4 0.7 0 1.1 0
Cyprus 100 78.7 78.7 1.2 19.5 0 20.7 0.6 0 0 0.6 0
Czech Republic † 100 95.9 95.9 4.1 4.1 0
Georgia 100 94.8 0 0 0 0 94.8 4.2 0.3 0 4.5 0.3 0 0 0.3 0.4
Israel 100 88.5 0 0 0 0 88.5 3.5 4.4 0 7.9 3.0 0.2 0.4 3.6 0
Italy (5 of 20 regions) 100 78.9 0 0 0.5 7.2 86.6 5.7 6.9 0 12.6 0.3 0.4 0 0.7 0
Latvia 100 76.3 0 0 0 0 76.3 22.4 22.4 1.3 0 0 1.3 0
Lithuania 100 93.2 0 0 0 0 93.2 6.5 6.5 0.3 0 0 0.3 0
Macedonia 100 95.8 0 0 0 0 95.8 0 2.3 0 2.3 2.0 0 0 2.0 0
Poland 100 88.8 0 88.8 1.5 4.1 5.6 11.2 0 0 0 0 0
Portugal 100 89.5 0 0 0 0 89.5 9.7 9.7 0.7 0 0 0.7 0
Russia † 100 92.1 0 0 0 0 92.1 0 7.9 0 7.9 0
Slovakia
Spain 100 78.3 78.3 16.7 16.7 5.0 5.0 0
Tunisia, Sfax region 100 94.8 0 0 0 0 94.8 2.1 3.1 0 5.2 0 0 0 0 0
Turkey 100 80.5 0 0 0 2.1 82.7 0.7 2.9 5.0 8.6 8.6 0.1 0 8.7 0
Ukraine 100 71.5 0 0 0 11.4 82.9 0.3 16.8 0 17.1 0 0 0 0 0
Abbreviations used: HD: haemodialysis; Unkn: unknown; HF: haemofiltration; HDF: haemodiafiltration; APD: automated peritoneal dialysis; CAPD: continuous ambulatory peritoneal dialysis; PD: peritoneal dialysis; Tx: transplantCategories may not add up because of rounding offWhen cells are left empty, the data are unavailable† Data include dialysis patients only

All 0-19 20-44 45-64 65-74 75+
All Men Women All Men Women All Men Women All Men Women All Men Women All Men Women
N (100%) N (100%) N (100%) N % N % N % N % N % N % N % N % N % N % N % N % N % N % N %
101
Albania 230 150 80 0 0 0 0 0 0 58 25 38 25 20 25 125 54 79 53 46 58 37 16 26 17 11 14 10 4 7 5 3 4
Belarus 629 352 277 3 0 3 1 0 0 141 22 78 22 63 23 292 46 165 47 127 46 147 23 83 24 64 23 46 7 23 7 23 8
Bulgaria † 931 472 459
Croatia 477 291 186 5 1 4 1 1 1 35 7 28 10 7 4 177 37 112 38 65 35 123 26 77 26 46 25 137 29 70 24 67 36
Cyprus 154 111 43 4 3 2 2 2 5 11 7 9 8 2 5 40 26 27 24 13 30 45 29 31 28 14 33 54 35 42 38 12 28
Czech Republic
Georgia 585 388 197 9 2 4 1 5 3 61 10 35 9 26 13 289 49 203 52 86 44 130 22 88 23 42 21 96 16 58 15 38 19
Israel 1530 1003 527 40 3 24 2 16 3 144 9 93 9 51 10 464 30 327 33 137 26 412 27 259 26 153 29 470 31 300 30 170 32
Italy (5 of 20 regions) 2066 1365 701 21 1 16 1 5 1 151 7 98 7 53 8 557 27 382 28 175 25 545 26 368 27 177 25 792 38 501 37 291 42
Latvia 146 75 71 2 1 2 3 0 0 20 14 13 17 7 10 47 32 24 32 23 32 41 28 19 25 22 31 36 25 17 23 19 27
Lithuania 286 177 109 2 1 1 1 1 1 37 13 29 16 8 7 81 28 52 29 29 27 76 27 43 24 33 30 90 31 52 29 38 35
Macedonia 253 143 110 2 1 0 0 2 2 25 10 18 13 7 6 103 41 56 39 47 43 74 29 34 24 40 36 49 19 35 24 14 13
Poland
Portugal 2218
Russia
Slovakia 766 477 289 1 0 0 0 1 0 94 12 68 14 26 9 290 38 201 42 89 31 242 32 137 29 105 36 139 18 71 15 68 24
Spain
Tunisia, Sfax region
Turkey
Ukraine
Categories may not add up because of missing values or rounding offWhen cells are left empty, the data are unavailable† Data include dialysis patients only
C3 INCIDENT PATIENTS ACCEPTED FOR RRT IN 2015, AT DAY 91
Table C.3.1Incident counts and percentages by age and genderat day 91

All 0-19 20-44 45-64 65-74 75+
All Men Women All Men Women All Men Women All Men Women All Men Women All Men Women
Pmp Pmp Pmp Pmarp Pmarp Pmarp Pmarp Pmarp Pmarp Pmarp Pmarp Pmarp Pmarp Pmarp Pmarp Pmarp Pmarp Pmarp
102
Albania 80.7 103.8 56.9 0 0 0 58.8 74.7 41.9 170.6 218.0 124.2 169.1 240.9 99.2 70.1 105.5 39.4
Belarus 67.6 81.4 55.7 1.5 3.0 0 41.5 45.8 37.3 111.6 138.9 88.9 214.3 325.7 148.4 71.1 132.6 48.6
Bulgaria † 130.1 135.7 124.8
Croatia 139.2 176.2 104.8 7.0 10.9 2.9 30.9 48.7 12.5 182.5 236.5 131.0 371.4 540.7 243.6 497.8 747.9 368.9
Cyprus 180.1 266.8 97.9 20.6 20.0 21.3 32.5 55.6 11.4 190.5 264.7 120.4 671.6 968.8 400.0 1173.9 2100.0 461.5
Czech Republic
Georgia 157.5 218.8 101.5 9.8 8.3 11.5 47.0 54.3 39.9 298.4 455.8 164.4 467.0 778.1 254.1 383.7 671.3 232.0
Israel 182.6 241.5 124.7 13.2 15.5 10.9 50.5 65.0 35.9 292.3 425.1 167.5 808.5 1092.8 561.3 1146.6 1777.3 705.1
Italy (5 of 20 regions) 121.6 165.5 80.2 6.7 9.9 3.3 28.8 37.2 20.4 114.1 160.1 70.1 297.6 426.7 182.6 414.3 666.9 250.7
Latvia 92.7 103.7 83.4 6.5 12.6 0 38.2 48.9 27.1 108.8 121.5 98.1 257.5 320.9 220.0 240.6 408.7 175.9
Lithuania 97.9 131.5 69.2 3.4 3.3 3.4 38.5 60.2 16.7 99.0 139.0 65.3 274.4 409.5 191.9 333.3 658.2 199.0
Macedonia 125.1 140.9 109.2 3.4 0 7.0 32.9 46.3 18.8 225.9 248.9 203.5 506.8 500.0 512.8 720.6 1206.9 359.0
Poland
Portugal 213.8
Russia
Slovakia 141.2 180.2 104.0 0.9 0 1.8 45.5 64.3 25.7 199.0 282.3 119.5 512.7 685.0 386.0 445.5 689.3 325.4
Spain
Tunisia, Sfax region
Turkey
Ukraine
When cells are left empty, the data are unavailable† Data include dialysis patients only
C3 INCIDENT PATIENTS ACCEPTED FOR RRT IN 2015, AT DAY 91
Table C.3.2Incident rates per million (age-related) population by age and gender, unadjustedat day 91
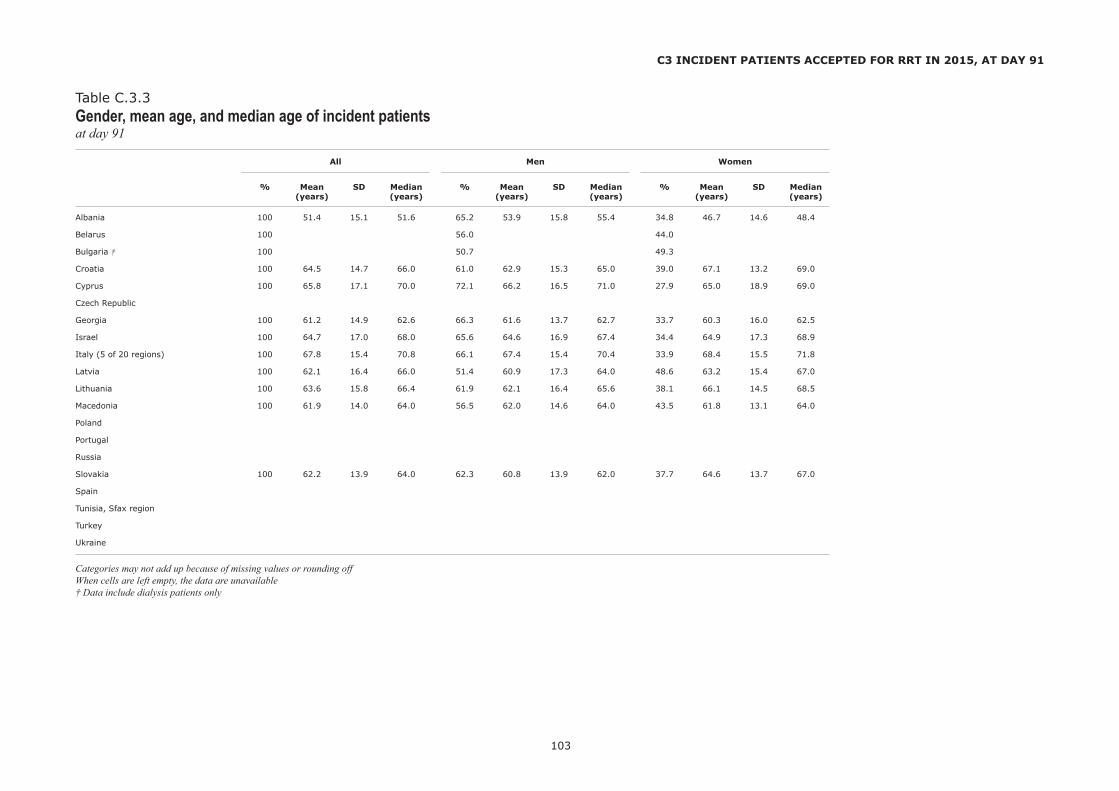
% Mean SD Median % Mean SD Median % Mean SD Median (years) (years) (years) (years) (years) (years)
All Men Women
103
Albania 100 51.4 15.1 51.6 65.2 53.9 15.8 55.4 34.8 46.7 14.6 48.4
Belarus 100 56.0 44.0
Bulgaria † 100 50.7 49.3
Croatia 100 64.5 14.7 66.0 61.0 62.9 15.3 65.0 39.0 67.1 13.2 69.0
Cyprus 100 65.8 17.1 70.0 72.1 66.2 16.5 71.0 27.9 65.0 18.9 69.0
Czech Republic
Georgia 100 61.2 14.9 62.6 66.3 61.6 13.7 62.7 33.7 60.3 16.0 62.5
Israel 100 64.7 17.0 68.0 65.6 64.6 16.9 67.4 34.4 64.9 17.3 68.9
Italy (5 of 20 regions) 100 67.8 15.4 70.8 66.1 67.4 15.4 70.4 33.9 68.4 15.5 71.8
Latvia 100 62.1 16.4 66.0 51.4 60.9 17.3 64.0 48.6 63.2 15.4 67.0
Lithuania 100 63.6 15.8 66.4 61.9 62.1 16.4 65.6 38.1 66.1 14.5 68.5
Macedonia 100 61.9 14.0 64.0 56.5 62.0 14.6 64.0 43.5 61.8 13.1 64.0
Poland
Portugal
Russia
Slovakia 100 62.2 13.9 64.0 62.3 60.8 13.9 62.0 37.7 64.6 13.7 67.0
Spain
Tunisia, Sfax region
Turkey
Ukraine
Categories may not add up because of missing values or rounding offWhen cells are left empty, the data are unavailable† Data include dialysis patients only
C3 INCIDENT PATIENTS ACCEPTED FOR RRT IN 2015, AT DAY 91
Table C.3.3Gender, mean age, and median age of incident patientsat day 91

Pmp Pmp Pmp
All Men Women
104
C3 INCIDENT PATIENTS ACCEPTED FOR RRT IN 2015, AT DAY 91
Table C.3.4Incident rates per million population, adjustedat day 91, adjusted for age and gender
Albania 79.8 102.8 56.3
Belarus
Bulgaria
Croatia 133.9 175.3 98.9
Cyprus 225.3 311.2 127.4
Czech Republic
Georgia 179.6 263.5 113.4
Israel 270.5 351.7 186.4
Italy (5 of 20 regions) 104.0 137.7 69.8
Latvia 86.6 106.9 73.7
Lithuania 93.0 136.9 62.6
Macedonia 176.8 203.1 144.5
Poland
Portugal
Russia
Slovakia 150.4 198.7 109.3
Spain
Tunisia, Sfax region
Turkey
Ukraine
When cells are left empty, the data are unavailable
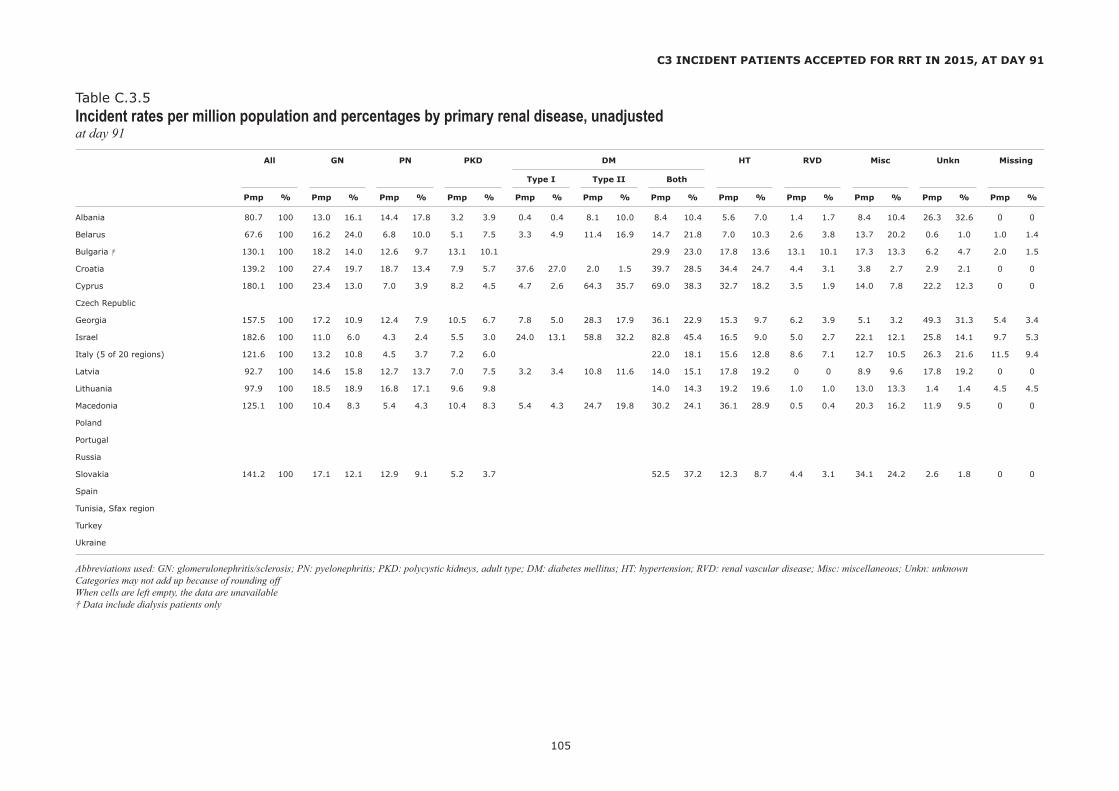
All GN PN PKD DM HT RVD Misc Unkn Missing
Type I Type II Both
Pmp % Pmp % Pmp % Pmp % Pmp % Pmp % Pmp % Pmp % Pmp % Pmp % Pmp % Pmp %
105
Albania 80.7 100 13.0 16.1 14.4 17.8 3.2 3.9 0.4 0.4 8.1 10.0 8.4 10.4 5.6 7.0 1.4 1.7 8.4 10.4 26.3 32.6 0 0
Belarus 67.6 100 16.2 24.0 6.8 10.0 5.1 7.5 3.3 4.9 11.4 16.9 14.7 21.8 7.0 10.3 2.6 3.8 13.7 20.2 0.6 1.0 1.0 1.4
Bulgaria † 130.1 100 18.2 14.0 12.6 9.7 13.1 10.1 29.9 23.0 17.8 13.6 13.1 10.1 17.3 13.3 6.2 4.7 2.0 1.5
Croatia 139.2 100 27.4 19.7 18.7 13.4 7.9 5.7 37.6 27.0 2.0 1.5 39.7 28.5 34.4 24.7 4.4 3.1 3.8 2.7 2.9 2.1 0 0
Cyprus 180.1 100 23.4 13.0 7.0 3.9 8.2 4.5 4.7 2.6 64.3 35.7 69.0 38.3 32.7 18.2 3.5 1.9 14.0 7.8 22.2 12.3 0 0
Czech Republic
Georgia 157.5 100 17.2 10.9 12.4 7.9 10.5 6.7 7.8 5.0 28.3 17.9 36.1 22.9 15.3 9.7 6.2 3.9 5.1 3.2 49.3 31.3 5.4 3.4
Israel 182.6 100 11.0 6.0 4.3 2.4 5.5 3.0 24.0 13.1 58.8 32.2 82.8 45.4 16.5 9.0 5.0 2.7 22.1 12.1 25.8 14.1 9.7 5.3
Italy (5 of 20 regions) 121.6 100 13.2 10.8 4.5 3.7 7.2 6.0 22.0 18.1 15.6 12.8 8.6 7.1 12.7 10.5 26.3 21.6 11.5 9.4
Latvia 92.7 100 14.6 15.8 12.7 13.7 7.0 7.5 3.2 3.4 10.8 11.6 14.0 15.1 17.8 19.2 0 0 8.9 9.6 17.8 19.2 0 0
Lithuania 97.9 100 18.5 18.9 16.8 17.1 9.6 9.8 14.0 14.3 19.2 19.6 1.0 1.0 13.0 13.3 1.4 1.4 4.5 4.5
Macedonia 125.1 100 10.4 8.3 5.4 4.3 10.4 8.3 5.4 4.3 24.7 19.8 30.2 24.1 36.1 28.9 0.5 0.4 20.3 16.2 11.9 9.5 0 0
Poland
Portugal
Russia
Slovakia 141.2 100 17.1 12.1 12.9 9.1 5.2 3.7 52.5 37.2 12.3 8.7 4.4 3.1 34.1 24.2 2.6 1.8 0 0
Spain
Tunisia, Sfax region
Turkey
Ukraine
Abbreviations used: GN: glomerulonephritis/sclerosis; PN: pyelonephritis; PKD: polycystic kidneys, adult type; DM: diabetes mellitus; HT: hypertension; RVD: renal vascular disease; Misc: miscellaneous; Unkn: unknownCategories may not add up because of rounding offWhen cells are left empty, the data are unavailable† Data include dialysis patients only
C3 INCIDENT PATIENTS ACCEPTED FOR RRT IN 2015, AT DAY 91
Table C.3.5Incident rates per million population and percentages by primary renal disease, unadjustedat day 91

All Haemodialysis Peritoneal dialysis Transplant Missing
HD HD HD HF HDF Total APD CAPD PD Total Living Deceased Tx Total hospital/ home type HD/ type PD type Tx centre Unkn HF/HDF Unkn Unkn
N N N N N N N N N N N N N N N N
106
Albania 230 222 0 0 0 0 222 0 3 0 3 5 0 0 5 0
Belarus 629 512 0 0 0 22 534 7 82 0 89 6 0 0 6 0
Bulgaria † 931 825 0 0 0 59 884 6 21 0 27 0
Croatia 477 389 0 0 0 61 450 9 12 0 21 2 4 0 6 0
Cyprus 154 120 120 2 31 0 33 1 0 0 1 0
Czech Republic
Georgia 585 524 0 0 0 0 524 24 2 0 26 3 0 0 3 32
Israel 1530 1334 0 0 0 0 1334 55 69 0 124 61 2 9 72 0
Italy (5 of 20 regions) 2066 1531 1 11 13 189 1745 158 144 0 302 11 8 0 19 0
Latvia 146 112 0 0 0 0 112 32 32 2 0 0 2 0
Lithuania 286 265 0 0 0 0 265 20 20 1 0 0 1 0
Macedonia 253 241 0 0 0 0 241 0 6 0 6 6 0 0 6 0
Poland
Portugal # 2218 1978 0 0 0 0 1978 223 223 17 17 0
Russia
Slovakia 766 286 3 0 1 442 732 10 12 0 22 4 8 0 12 0
Spain
Tunisia, Sfax region
Turkey
Ukraine
Abbreviations used: HD: haemodialysis; Unkn: unknown; HF: haemofiltration; HDF: haemodiafiltration; APD: automated peritoneal dialysis; CAPD: continuous ambulatory peritoneal dialysis; PD: peritoneal dialysis; Tx: transplantWhen cells are left empty, the data are unavailable† Data include dialysis patients only# Only pre-emptive transplantations (at day 1) are included
C3 INCIDENT PATIENTS ACCEPTED FOR RRT IN 2015, AT DAY 91
Table C.3.6Incident counts by treatment modalityat day 91

All Haemodialysis Peritoneal dialysis Transplant Missing
HD HD HD HF HDF Total APD CAPD PD Total Living Deceased Tx Total hospital/ home type HD/ type PD type Tx centre Unkn HF/HDF Unkn Unkn
Pmp Pmp Pmp Pmp Pmp Pmp Pmp Pmp Pmp Pmp Pmp Pmp Pmp Pmp Pmp Pmp
107
Albania 80.7 77.9 0 0 0 0 77.9 0 1.1 0 1.1 1.8 0 0 1.8 0
Belarus 67.6 55.1 0 0 0 2.4 57.4 0.8 8.8 0 9.6 0.6 0 0 0.6 0
Bulgaria † 130.1 115.3 0 0 0 8.2 123.6 0.8 2.9 0 3.8 0
Croatia 139.2 113.5 0 0 0 17.8 131.3 2.6 3.5 0 6.1 0.6 1.2 0 1.8 0
Cyprus 180.1 140.4 140.4 2.3 36.3 0 38.6 1.2 0 0 1.2 0
Czech Republic
Georgia 157.5 141.1 0 0 0 0 141.1 6.5 0.5 0 7.0 0.8 0 0 0.8 8.6
Israel 182.6 159.2 0 0 0 0 159.2 6.6 8.2 0 14.8 7.3 0.2 1.1 8.6 0
Italy (5 of 20 regions) 121.6 90.1 0.1 0.6 0.8 11.1 102.7 9.3 8.5 0 17.8 0.6 0.5 0 1.1 0
Latvia 92.7 71.1 0 0 0 0 71.1 20.3 20.3 1.3 0 0 1.3 0
Lithuania 97.9 90.7 0 0 0 0 90.7 6.8 6.8 0.3 0 0 0.3 0
Macedonia 125.1 119.2 0 0 0 0 119.2 0 3.0 0 3.0 3.0 0 0 3.0 0
Poland
Portugal # 213.8 190.7 0 0 0 0 190.7 21.5 21.5 1.6 1.6 0
Russia
Slovakia 141.2 52.7 0.6 0 0.2 81.5 134.9 1.8 2.2 0 4.1 0.7 1.5 0 2.2 0
Spain
Tunisia, Sfax region
Turkey
Ukraine
Abbreviations used: HD: haemodialysis; Unkn: unknown; HF: haemofiltration; HDF: haemodiafiltration; APD: automated peritoneal dialysis; CAPD: continuous ambulatory peritoneal dialysis; PD: peritoneal dialysis; Tx: transplantCategories may not add up because of rounding offWhen cells are left empty, the data are unavailable† Data include dialysis patients only# Only pre-emptive transplantations (at day 1) are included
C3 INCIDENT PATIENTS ACCEPTED FOR RRT IN 2015, AT DAY 91
Table C.3.7Incident rates per million population by treatment modality, unadjustedat day 91
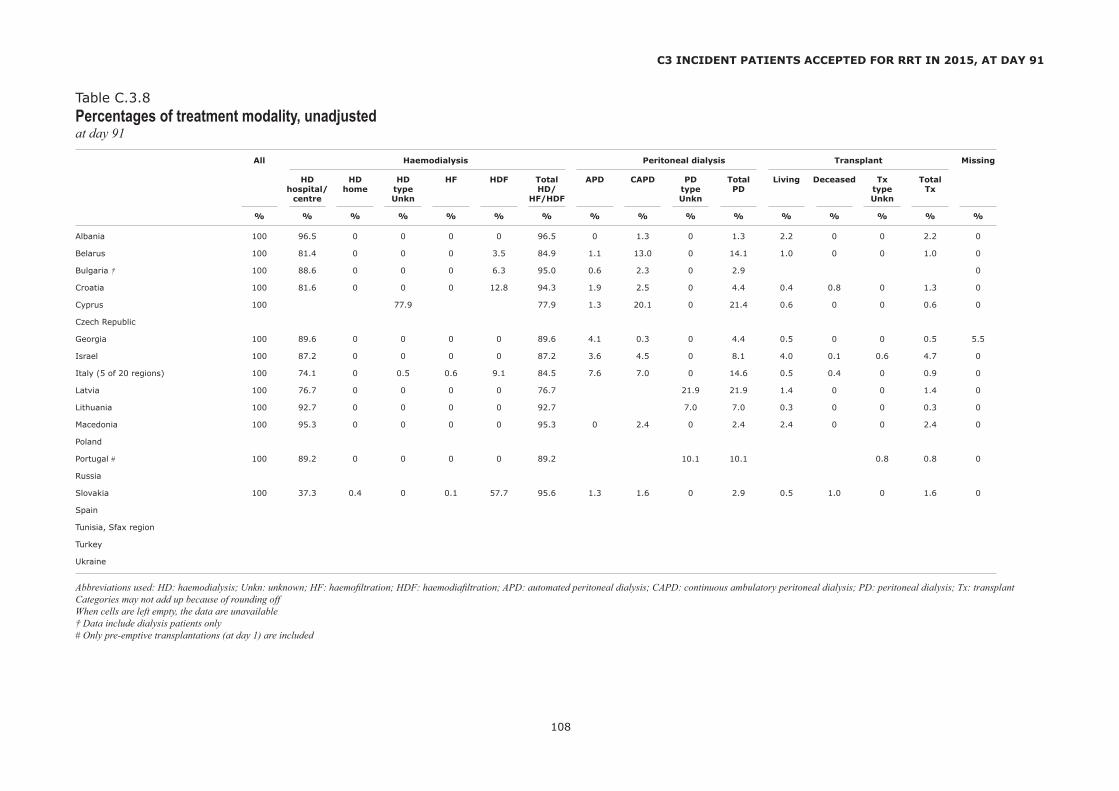
All Haemodialysis Peritoneal dialysis Transplant Missing
HD HD HD HF HDF Total APD CAPD PD Total Living Deceased Tx Total hospital/ home type HD/ type PD type Tx centre Unkn HF/HDF Unkn Unkn
% % % % % % % % % % % % % % % %
108
Albania 100 96.5 0 0 0 0 96.5 0 1.3 0 1.3 2.2 0 0 2.2 0
Belarus 100 81.4 0 0 0 3.5 84.9 1.1 13.0 0 14.1 1.0 0 0 1.0 0
Bulgaria † 100 88.6 0 0 0 6.3 95.0 0.6 2.3 0 2.9 0
Croatia 100 81.6 0 0 0 12.8 94.3 1.9 2.5 0 4.4 0.4 0.8 0 1.3 0
Cyprus 100 77.9 77.9 1.3 20.1 0 21.4 0.6 0 0 0.6 0
Czech Republic
Georgia 100 89.6 0 0 0 0 89.6 4.1 0.3 0 4.4 0.5 0 0 0.5 5.5
Israel 100 87.2 0 0 0 0 87.2 3.6 4.5 0 8.1 4.0 0.1 0.6 4.7 0
Italy (5 of 20 regions) 100 74.1 0 0.5 0.6 9.1 84.5 7.6 7.0 0 14.6 0.5 0.4 0 0.9 0
Latvia 100 76.7 0 0 0 0 76.7 21.9 21.9 1.4 0 0 1.4 0
Lithuania 100 92.7 0 0 0 0 92.7 7.0 7.0 0.3 0 0 0.3 0
Macedonia 100 95.3 0 0 0 0 95.3 0 2.4 0 2.4 2.4 0 0 2.4 0
Poland
Portugal # 100 89.2 0 0 0 0 89.2 10.1 10.1 0.8 0.8 0
Russia
Slovakia 100 37.3 0.4 0 0.1 57.7 95.6 1.3 1.6 0 2.9 0.5 1.0 0 1.6 0
Spain
Tunisia, Sfax region
Turkey
Ukraine
Abbreviations used: HD: haemodialysis; Unkn: unknown; HF: haemofiltration; HDF: haemodiafiltration; APD: automated peritoneal dialysis; CAPD: continuous ambulatory peritoneal dialysis; PD: peritoneal dialysis; Tx: transplantCategories may not add up because of rounding offWhen cells are left empty, the data are unavailable† Data include dialysis patients only# Only pre-emptive transplantations (at day 1) are included
C3 INCIDENT PATIENTS ACCEPTED FOR RRT IN 2015, AT DAY 91
Table C.3.8Percentages of treatment modality, unadjustedat day 91

All 0-19 20-44 45-64 65-74 75+
All Men Women All Men Women All Men Women All Men Women All Men Women All Men Women
N (100%) N (100%) N (100%) N % N % N % N % N % N % N % N % N % N % N % N % N % N % N %
109
Albania 1214 760 454 11 1 6 1 5 1 430 35 255 34 175 39 555 46 351 46 204 45 188 15 126 17 62 14 30 2 22 3 8 2
Belarus 3204 1677 1527 24 1 14 1 10 1 965 30 516 31 449 29 1534 48 836 50 698 46 557 17 259 15 298 20 124 4 52 3 72 5
Bulgaria 4241 2077 2164
Croatia 2553 1483 1070 9 0 5 0 4 0 187 7 113 8 74 7 893 35 563 38 330 31 694 27 418 28 276 26 770 30 384 26 386 36
Cyprus
Czech Republic ‡ 11444 11 0 661 6 2378 21 2134 19 1484 13
Georgia 2327 1513 814 19 1 10 1 9 1 417 18 260 17 157 19 1268 54 838 55 430 53 448 19 302 20 146 18 175 8 103 7 72 9
Israel † 6442 3906 2536 78 1 46 1 32 1 538 8 334 9 204 8 2108 33 1367 35 741 29 1752 27 1024 26 728 29 1966 31 1135 29 831 33
Italy (5 of 20 regions) 17832 11312 6520 195 1 116 1 79 1 2501 14 1578 14 923 14 6605 37 4191 37 2414 37 4176 23 2705 24 1471 23 4355 24 2722 24 1633 25
Latvia 1007 523 484 12 1 10 2 2 0 219 22 123 24 96 20 448 44 228 44 220 45 206 20 99 19 107 22 122 12 63 12 59 12
Lithuania 2203
Macedonia 1598 929 669 10 1 3 0 7 1 265 17 158 17 107 16 790 49 466 50 324 48 343 21 183 20 160 24 190 12 119 13 71 11
Poland 30400
Portugal 18928 11368 7560
Russia 43955 23303 20652 484 1 294 1 190 1 10262 23 5951 26 4311 21 22156 50 11637 50 10519 51 7888 18 3740 16 4148 20 3165 7 1681 7 1484 7
Slovakia † 3337 1942 1395 2 0 1 0 1 0 325 10 188 10 137 10 1285 39 841 43 444 32 1079 32 607 31 472 34 646 19 305 16 341 24
Spain § 56354 35600 20754 307 1 184 1 123 1 9506 17 5853 16 3653 18 22193 39 14262 40 7931 38 13125 23 8479 24 4646 22 11223 20 6822 19 4401 21
Tunisia, Sfax region † 923 511 412 9 1 3 1 6 1 191 21 118 23 73 18 347 38 202 40 145 35 192 21 107 21 85 21 184 20 81 16 103 25
Turkey 73660
Ukraine 7610 4346 3264
C4 PREVALENT PATIENTS ON RRT IN 2015
Table C.4.1Prevalent counts and percentages by age and genderprevalent patients on December 31
Categories may not add up because of missing values or rounding offWhen cells are left empty, the data are unavailable‡ Data per age category include dialysis patients only (total N=6668)† Data include dialysis patients only§ Data presented in the column 0-19 refer to patients aged 0-14 years and data presented in the column 20-44 refer to patients aged 15-44 years

All 0-19 20-44 45-64 65-74 75+
All Men Women All Men Women All Men Women All Men Women All Men Women All Men Women
Pmp Pmp Pmp Pmarp Pmarp Pmarp Pmarp Pmarp Pmarp Pmarp Pmarp Pmarp Pmarp Pmarp Pmarp Pmarp Pmarp Pmarp
110
Albania 425.8 525.8 322.9 14.3 15.0 13.5 436.1 501.1 366.7 757.6 968.7 551.0 859.3 1167.6 559.2 210.4 331.7 104.9
Belarus 344.5 387.7 307.0 12.3 13.9 10.5 284.3 302.8 265.6 586.3 703.8 488.5 812.0 1016.5 691.1 191.7 299.8 152.1
Bulgaria 592.8 597.4 588.5
Croatia 744.9 897.7 602.7 12.6 13.6 11.5 164.8 196.7 132.1 921.0 1188.8 665.3 2095.4 2935.4 1461.9 2798.0 4102.6 2125.6
Cyprus
Czech Republic ‡ 1111.8 5.4 180.7 880.5 1833.0 2035.3
Georgia 626.6 853.4 419.4 20.7 20.7 20.6 321.6 403.4 240.7 1309.1 1881.5 821.9 1609.2 2670.2 883.2 699.4 1192.1 439.6
Israel † 768.7 940.5 600.0 25.8 29.7 21.7 188.6 233.6 143.4 1328.0 1777.2 905.8 3438.0 4320.7 2670.6 4796.3 6723.9 3446.7
Italy (5 of 20 regions) 1049.8 1371.5 746.1 62.4 72.0 52.1 477.8 598.5 355.3 1352.8 1756.0 967.3 2280.1 3136.6 1517.9 2277.9 3623.3 1407.0
Latvia 639.6 723.2 568.6 38.8 62.8 13.3 417.9 463.1 371.5 1037.0 1153.8 938.6 1294.0 1672.3 1070.0 815.5 1514.4 546.3
Lithuania 754.2
Macedonia 790.3 915.3 664.3 16.9 9.9 24.4 348.2 406.2 287.6 1732.5 2071.1 1402.6 2349.3 2691.2 2051.3 2794.1 4103.4 1820.5
Poland 800.7
Portugal 1824.4 2308.7 1386.9
Russia 303.0 346.7 265.2 15.4 18.3 12.4 190.6 222.0 159.4 558.3 654.6 480.2 747.2 954.7 624.8 330.0 641.5 212.9
Slovakia † 615.0 733.7 502.0 1.8 1.7 1.8 157.2 177.7 135.6 881.9 1181.2 596.0 2286.0 3035.0 1735.3 2070.5 2961.2 1631.6
Spain § 1208.7 1555.3 874.4 43.7 51.0 36.0 515.7 624.7 403.0 1761.8 2286.3 1247.2 3052.3 4210.0 2032.4 2625.9 4104.7 1684.9
Tunisia, Sfax region † 778.2 864.7 692.3 24.2 15.6 33.4 402.9 510.1 300.8 1400.6 1645.0 1160.4 3680.7 4233.9 3160.8 4507.2 4098.4 4890.8
Turkey 935.5
Ukraine 178.0 219.6 142.1
C4 PREVALENT PATIENTS ON RRT IN 2015
Table C.4.2Prevalence per million (age-related) population by age and gender, unadjustedprevalent patients on December 31
When cells are left empty, the data are unavailable‡ Data per age category include dialysis patients only (total N=6668)† Data include dialysis patients only§ Data presented in the column 0-19 refer to patients aged 0-14 years and data presented in the column 20-44 refer to patients aged 15-44 years

% Mean SD Median % Mean SD Median % Mean SD Median (years) (years) (years) (years) (years) (years)
All Men Women
111
Albania 100 50.3 15.1 51.1 62.6 52.1 15.4 53.7 37.4 47.3 14.9 48.4
Belarus 100 52.3 47.7
Bulgaria 100 49.0 51.0
Croatia 100 65.6 13.7 67.0 58.1 64.7 13.3 66.0 41.9 66.9 14.1 69.0
Cyprus
Czech Republic
Georgia 100 56.5 13.7 57.4 65.0 56.7 13.2 57.7 35.0 56.1 14.3 57.2
Israel † 100 65.6 15.5 68.0 60.6 65.2 15.4 67.0 39.4 66.3 15.5 69.0
Italy (5 of 20 regions) 100 62.2 16.3 64.0 63.4 62.2 16.2 64.1 36.6 62.2 16.6 63.8
Latvia 100 55.9 16.0 57.0 51.9 54.7 16.8 55.0 48.1 57.2 15.1 59.0
Lithuania
Macedonia 100 57.8 14.0 59.0 58.1 57.7 14.0 58.0 41.9 57.9 14.1 60.0
Poland
Portugal † 100 66.8 60.1 39.9
Russia 100 54.4 14.3 56.0 53.0 53.5 14.6 55.0 47.0 55.4 14.0 57.0
Slovakia † 100 63.3 13.3 65.0 58.2 62.3 13.3 65.0 41.8 64.7 13.9 67.0
Spain 100 63.2 15.6 64.8 63.2 63.1 15.4 64.6 36.8 63.3 16.0 65.0
Tunisia, Sfax region † 100 58.3 16.4 60.0 55.4 56.7 16.6 58.0 44.6 60.3 16.5 63.0
Turkey
Ukraine 100 48.6 13.9 50.0 57.1 48.7 13.9 50.0 42.9 48.4 14.0 50.0
C4 PREVALENT PATIENTS ON RRT IN 2015
Table C.4.3Gender, mean age, and median ageprevalent patients on December 31
Categories may not add up because of missing values or rounding offWhen cells are left empty, the data are unavailable† Data include dialysis patients only

Pmp Pmp Pmp
All Men Women
112
Albania 433.5 520.6 319.5
Belarus
Bulgaria
Croatia 679.5 848.4 540.0
Cyprus
Czech Republic
Georgia 668.6 965.6 427.1
Israel † 1152.2 1375.0 918.2
Italy (5 of 20 regions) 933.1 1193.7 674.1
Latvia 612.3 731.1 527.2
Lithuania
Macedonia 1038.4 1216.2 845.8
Poland
Portugal
Russia 307.0 378.1 256.7
Slovakia † 661.0 820.4 529.3
Spain 1144.6 1447.9 837.7
Tunisia, Sfax region † 1133.3 1160.8 1098.2
Turkey
Ukraine
C4 PREVALENT PATIENTS ON RRT IN 2015
Table C.4.4Prevalence per million population, adjustedprevalent patients on December 31, adjusted for age and gender
When cells are left empty, the data are unavailable† Data include dialysis patients only

All GN PN PKD DM HT RVD Misc Unkn Missing
Type I Type II Both
Pmp % Pmp % Pmp % Pmp % Pmp % Pmp % Pmp % Pmp % Pmp % Pmp % Pmp % Pmp %
113
C4 PREVALENT PATIENTS ON RRT IN 2015
Table C.4.5Prevalence per million population and percentages by primary renal disease, unadjustedprevalent patients on December 31
Albania 425.8 100 62.1 14.6 108.4 25.5 29.5 6.9 10.5 2.5 40.0 9.4 50.5 11.9 34.4 8.1 12.3 2.9 51.9 12.2 69.8 16.4 7.0 1.6
Belarus 344.5 100 151.7 44.0 31.9 9.3 35.4 10.3 21.5 6.2 26.2 7.6 47.7 13.9 18.1 5.2 5.9 1.7 52.4 15.2 1.0 0.3 0.4 0.1
Bulgaria
Croatia 744.9 100 108.3 14.5 75.3 10.1 50.8 6.8 44.1 5.9 147.4 19.8 191.4 25.7 92.2 12.4 18.7 2.5 155.5 20.9 52.8 7.1 0 0
Cyprus
Czech Republic
Georgia 626.6 100 75.1 12.0 54.9 8.8 46.3 7.4 21.3 3.4 108.8 17.4 130.1 20.8 68.9 11.0 23.2 3.7 26.1 4.2 194.1 31.0 7.8 1.2
Israel † 768.7 100 74.0 9.6 28.3 3.7 29.6 3.8 186.3 24.2 166.2 21.6 352.5 45.9 76.7 10.0 20.6 2.7 97.1 12.6 88.1 11.5 1.8 0.2
Italy (5 of 20 regions) 1049.8 100 219.5 20.9 60.1 5.7 92.5 8.8 121.3 11.6 110.2 10.5 65.6 6.2 90.1 8.6 235.5 22.4 54.9 5.2
Latvia 639.6 100 197.5 30.9 89.6 14.0 79.4 12.4 32.4 5.1 27.9 4.4 60.3 9.4 76.2 11.9 2.5 0.4 88.9 13.9 45.1 7.1 0 0
Lithuania
Macedonia 790.3 100 125.1 15.8 61.8 7.8 81.6 10.3 17.3 2.2 103.9 13.1 121.2 15.3 192.4 24.3 1.0 0.1 106.8 13.5 99.9 12.6 0.5 0.1
Poland
Portugal † & + 1824.4 100 152.9 12.9 73.3 6.2 326.9 27.7 159.1 13.5 215.0 18.2 225.3 19.1 29.6 2.5
Russia 303.0 100 140.1 46.2 28.7 9.5 30.4 10.0 18.7 6.2 17.9 5.9 36.7 12.1 15.5 5.1 3.6 1.2 40.6 13.4 7.5 2.5 0 0
Slovakia † 615.0 100 81.8 13.3 69.5 11.3 28.6 4.6 211.0 34.3 49.6 8.1 19.2 3.1 145.4 23.6 10.0 1.6 0 0
Spain ¶ 1208.7 100 227.7 18.8 125.0 10.3 118.9 9.8 190.1 15.7 141.2 11.7 127.1 10.5 278.7 23.1 0 0
Tunisia, Sfax region † § 778.2 100 99.5 12.8 140.0 18.0 58.2 7.5 155.1 19.9 20.2 2.6 5.9 0.8 292.6 37.6 6.7 0.9
Turkey ‡ 935.5 100 5.2 0.6 1.6 0.2 3.9 0.4 5.3 0.6 20.7 2.2 26.0 2.8 23.2 2.5 0.8 0.1 9.8 1.1 10.7 1.1 854.2 91.3
Ukraine + 178.0 100 75.7 42.5 25.3 14.2 18.7 10.5 26.6 14.9 8.4 4.7 18.0 10.1 0.8 0.4 4.5 2.5
Abbreviations used: GN: glomerulonephritis/sclerosis; PN: pyelonephritis; PKD: polycystic kidneys, adult type; DM: diabetes mellitus; HT: hypertension; RVD: renal vascular disease; Misc: miscellaneous; Unkn: unknownCategories may not add up because of rounding offWhen cells are left empty, the data are unavailable† Data include dialysis patients only& Pyelonephritis is not reported separately, but is included into miscellaneous+ Renal vascular disease is not reported separately, but is included into miscellaneous¶ Renal vascular disease is not reported separately, but is included into hypertension§ Hypertension is not reported separately, but is included into renal vascular disease‡ Data are available for 6400 of 73660 patients (8.7%)

All Haemodialysis Peritoneal dialysis Transplant Missing
HD HD HD HF HDF Total APD CAPD PD Total Living Deceased Tx Total hospital/ home type HD/ type PD type Tx centre Unkn HF/HDF Unkn Unkn
N N N N N N N N N N N N N N N N
114
Abbreviations used: HD: haemodialysis; Unkn: unknown; HF: haemofiltration; HDF: haemodiafiltration; APD: automated peritoneal dialysis; CAPD: continuous ambulatory peritoneal dialysis; PD: peritoneal dialysis; Tx: transplantWhen cells are left empty, the data are unavailable† Data include dialysis patients only
C4 PREVALENT PATIENTS ON RRT IN 2015
Table C.4.6Prevalent counts by treatment modalityprevalent patients on December 31
Albania 1214 913 0 0 0 0 913 51 0 0 51 174 43 13 230 20
Belarus 3204 1564 0 0 0 143 1707 15 263 0 278 80 1139 0 1219 0
Bulgaria 4241 3402 0 0 0 113 3515 54 105 0 159 102 457 8 567 0
Croatia 2553 1700 0 0 0 233 1933 51 63 0 114 10 209 7 226 280
Cyprus
Czech Republic 11444 1706 6 4311 6203 465 465 4776 4776 0
Georgia 2327 1949 0 0 0 0 1949 94 9 0 103 268 0 2 270 5
Israel † 6442 6023 0 0 0 0 6023 224 194 0 418 1
Italy (5 of 20 regions) 17832 8131 17 135 140 2195 10618 765 770 11 1546 392 5276 0 5668 0
Latvia 1007 373 0 0 0 0 373 92 92 542 542 0
Lithuania 2203 1328 0 0 0 0 1328 33 18 0 51 824 824 0
Macedonia 1598 1352 1 0 0 0 1353 0 32 0 32 197 16 0 213 0
Poland 30400 18809 0 18809 1091 1091 10500 10500 0
Portugal 18928 4326 0 0 0 7188 11514 330 421 0 751 536 6127 0 6663 0
Russia 43955 33504 0 0 0 0 33504 0 2264 0 2264 1244 5421 1522 8187 0
Slovakia † 3337 901 18 0 2 2340 3261 43 33 0 76 0
Spain 56354 23649 23649 3106 3106 29599 29599 0
Tunisia, Sfax region † 923 890 0 0 0 0 890 10 23 0 33 0
Turkey 73660 54517 300 21 6 2107 56951 1160 2639 110 3909 0 0 12800 12800 0
Ukraine 7610 4770 0 0 0 842 5612 48 879 0 927 818 190 63 1071 0

All Haemodialysis Peritoneal dialysis Transplant Missing
HD HD HD HF HDF Total APD CAPD PD Total Living Deceased Tx Total hospital/ home type HD/ type PD type Tx centre Unkn HF/HDF Unkn Unkn
Pmp Pmp Pmp Pmp Pmp Pmp Pmp Pmp Pmp Pmp Pmp Pmp Pmp Pmp Pmp Pmp
115
C4 PREVALENT PATIENTS ON RRT IN 2015
Table C.4.7Prevalence per million population by treatment modality, unadjustedprevalent patients on December 31
Albania 425.8 320.2 0 0 0 0 320.2 17.9 0 0 17.9 61.0 15.1 4.6 80.7 7.0
Belarus 344.5 168.2 0 0 0 15.4 183.6 1.6 28.3 0 29.9 8.6 122.5 0 131.1 0
Bulgaria 592.8 475.5 0 0 0 15.8 491.3 7.5 14.7 0 22.2 14.3 63.9 1.1 79.3 0
Croatia 744.9 496.0 0 0 0 68.0 564.0 14.9 18.4 0 33.3 2.9 61.0 2.0 65.9 81.7
Cyprus
Czech Republic 1111.8 165.7 0.6 418.8 602.6 45.2 45.2 464.0 464.0 0
Georgia 626.6 524.8 0 0 0 0 524.8 25.3 2.4 0 27.7 72.2 0 0.5 72.7 1.3
Israel † 768.7 718.7 0 0 0 0 718.7 26.7 23.1 0 49.9 0.1
Italy (5 of 20 regions) 1049.8 478.7 1.0 7.9 8.2 129.2 625.1 45.0 45.3 0.6 91.0 23.1 310.6 0 333.7 0
Latvia 639.6 236.9 0 0 0 0 236.9 58.4 58.4 344.3 344.3 0
Lithuania 754.2 454.6 0 0 0 0 454.6 11.3 6.2 0 17.5 282.1 282.1 0
Macedonia 790.3 668.6 0.5 0 0 0 669.1 0 15.8 0 15.8 97.4 7.9 0 105.3 0
Poland 800.7 495.4 0 495.4 28.7 28.7 276.6 276.6 0
Portugal 1824.4 417.0 0 0 0 692.8 1109.8 31.8 40.6 0 72.4 51.7 590.6 0 642.2 0
Russia 303.0 230.9 0 0 0 0 230.9 0 15.6 0 15.6 8.6 37.4 10.5 56.4 0
Slovakia † 615.0 166.1 3.3 0 0.4 431.3 601.0 7.9 6.1 0 14.0 0
Spain 1208.7 507.2 507.2 66.6 66.6 634.8 634.8 0
Tunisia, Sfax region † 778.2 750.4 0 0 0 0 750.4 8.4 19.4 0 27.8 0
Turkey 935.5 692.4 3.8 0.3 0.1 26.8 723.3 14.7 33.5 1.4 49.6 0 0 162.6 162.6 0
Ukraine 178.0 111.6 0 0 0 19.7 131.2 1.1 20.6 0 21.7 19.1 4.4 1.5 25.0 0
Abbreviations used: HD: haemodialysis; Unkn: unknown; HF: haemofiltration; HDF: haemodiafiltration; APD: automated peritoneal dialysis; CAPD: continuous ambulatory peritoneal dialysis; PD: peritoneal dialysis; Tx: transplantCategories may not add up because of rounding offWhen cells are left empty, the data are unavailable† Data include dialysis patients only
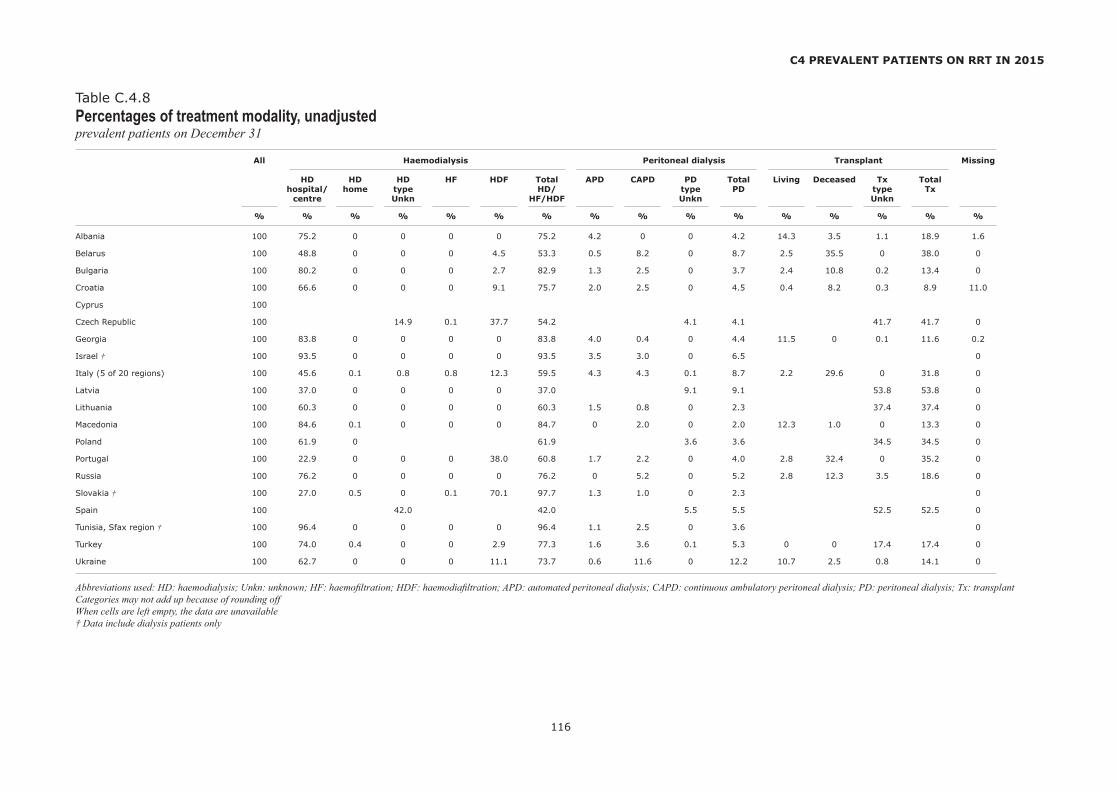
All Haemodialysis Peritoneal dialysis Transplant Missing
HD HD HD HF HDF Total APD CAPD PD Total Living Deceased Tx Total hospital/ home type HD/ type PD type Tx centre Unkn HF/HDF Unkn Unkn
% % % % % % % % % % % % % % % %
116
Abbreviations used: HD: haemodialysis; Unkn: unknown; HF: haemofiltration; HDF: haemodiafiltration; APD: automated peritoneal dialysis; CAPD: continuous ambulatory peritoneal dialysis; PD: peritoneal dialysis; Tx: transplantCategories may not add up because of rounding offWhen cells are left empty, the data are unavailable† Data include dialysis patients only
C4 PREVALENT PATIENTS ON RRT IN 2015
Table C.4.8Percentages of treatment modality, unadjustedprevalent patients on December 31
Albania 100 75.2 0 0 0 0 75.2 4.2 0 0 4.2 14.3 3.5 1.1 18.9 1.6
Belarus 100 48.8 0 0 0 4.5 53.3 0.5 8.2 0 8.7 2.5 35.5 0 38.0 0
Bulgaria 100 80.2 0 0 0 2.7 82.9 1.3 2.5 0 3.7 2.4 10.8 0.2 13.4 0
Croatia 100 66.6 0 0 0 9.1 75.7 2.0 2.5 0 4.5 0.4 8.2 0.3 8.9 11.0
Cyprus 100
Czech Republic 100 14.9 0.1 37.7 54.2 4.1 4.1 41.7 41.7 0
Georgia 100 83.8 0 0 0 0 83.8 4.0 0.4 0 4.4 11.5 0 0.1 11.6 0.2
Israel † 100 93.5 0 0 0 0 93.5 3.5 3.0 0 6.5 0
Italy (5 of 20 regions) 100 45.6 0.1 0.8 0.8 12.3 59.5 4.3 4.3 0.1 8.7 2.2 29.6 0 31.8 0
Latvia 100 37.0 0 0 0 0 37.0 9.1 9.1 53.8 53.8 0
Lithuania 100 60.3 0 0 0 0 60.3 1.5 0.8 0 2.3 37.4 37.4 0
Macedonia 100 84.6 0.1 0 0 0 84.7 0 2.0 0 2.0 12.3 1.0 0 13.3 0
Poland 100 61.9 0 61.9 3.6 3.6 34.5 34.5 0
Portugal 100 22.9 0 0 0 38.0 60.8 1.7 2.2 0 4.0 2.8 32.4 0 35.2 0
Russia 100 76.2 0 0 0 0 76.2 0 5.2 0 5.2 2.8 12.3 3.5 18.6 0
Slovakia † 100 27.0 0.5 0 0.1 70.1 97.7 1.3 1.0 0 2.3 0
Spain 100 42.0 42.0 5.5 5.5 52.5 52.5 0
Tunisia, Sfax region † 100 96.4 0 0 0 0 96.4 1.1 2.5 0 3.6 0
Turkey 100 74.0 0.4 0 0 2.9 77.3 1.6 3.6 0.1 5.3 0 0 17.4 17.4 0
Ukraine 100 62.7 0 0 0 11.1 73.7 0.6 11.6 0 12.2 10.7 2.5 0.8 14.1 0

All Living Deceased Donor type Unkn
Related Unrelated Type Unkn All
N % N % N % N % N % N % N %
117
C5 KIDNEY TRANSPLANTS IN 2015
Table C.5.1Kidney transplant counts and percentages by donor type
Albania 27 100 18 66.7 2 7.4 1 3.7 21 77.8 6 22.2 0 0
Belarus 285 100 15 5.3 0 0 0 0 15 5.3 270 94.7 0 0
Bulgaria 51 100 13 25.5 0 0 0 0 13 25.5 38 74.5 0 0
Croatia 160 100 5 3.1 0 0 0 0 5 3.1 155 96.9 0 0
Cyprus 20 100 10 50.0 9 45.0 0 0 19 95.0 1 5.0 0 0
Czech Republic 453 100 53 11.7 53 11.7 400 88.3 0 0
Georgia 57 100 57 100 0 0 0 0 57 100 0 0 0 0
Israel 348 100 348 100
Italy (5 of 20 regions) 452 100 14 3.1 1 0.2 17 3.8 32 7.1 420 92.9 0 0
Latvia 64 100 8 12.5 3 4.7 0 0 11 17.2 53 82.8 0 0
Lithuania 115 100 8 7.0 0 0 1 0.9 9 7.8 106 92.2 0 0
Macedonia 12 100 8 66.7 1 8.3 0 0 9 75.0 3 25.0 0 0
Poland 1077 100 51 4.7 9 0.8 0 0 60 5.6 1017 94.4 0 0
Portugal 485 100 62 12.8 62 12.8 423 87.2 0 0
Russia 945 100 190 20.1 0 0 0 0 190 20.1 755 79.9 0 0
Slovakia + 184 100 14 7.6 5 2.7 0 0 19 10.3 165 89.7 0 0
Spain ¤ 2905 100 388 13.4 388 13.4 2517 86.6 0 0
Tunisia, Sfax region 8 100 8 100 0 0 0 0 8 100 0 0 0 0
Turkey 3204 100 2355 73.5 179 5.6 0 0 2534 79.1 670 20.9 0 0
Ukraine 102 100 102 100
Categories may not add up because of rounding offWhen cells are left empty, the data are unavailable+ Data from: Slovak Centre of Organ Transplantation¤ Data from: Organización Nacional de Trasplantes (ONT), 2015 from total Spanish population

All Living Deceased Donor type Unkn
Related Unrelated Type Unkn All
Pmp Pmp Pmp Pmp Pmp Pmp Pmp
118
C5 KIDNEY TRANSPLANTS IN 2015
Table C.5.2Kidney transplants per million population by donor type, unadjusted
Albania 9.5 6.3 0.7 0.4 7.4 2.1 0
Belarus 30.6 1.6 0 0 1.6 29.0 0
Bulgaria 7.1 1.8 0 0 1.8 5.3 0
Croatia 46.7 1.5 0 0 1.5 45.2 0
Cyprus 23.4 11.7 10.5 0 22.2 1.2 0
Czech Republic 44.0 5.1 5.1 38.9 0
Georgia 15.3 15.3 0 0 15.3 0 0
Israel 41.5 41.5
Italy (5 of 20 regions) 26.6 0.8 0.1 1.0 1.9 24.7 0
Latvia 40.7 5.1 1.9 0 7.0 33.7 0
Lithuania 39.4 2.7 0 0.3 3.1 36.3 0
Macedonia 5.9 4.0 0.5 0 4.5 1.5 0
Poland 28.4 1.3 0.2 0 1.6 26.8 0
Portugal 46.7 6.0 6.0 40.8 0
Russia 6.5 1.3 0 0 1.3 5.2 0
Slovakia + 33.9 2.6 0.9 0 3.5 30.4 0
Spain ¤ 62.3 8.3 8.3 54.0 0
Tunisia, Sfax region 6.7 6.7 0 0 6.7 0 0
Turkey 40.7 29.9 2.3 0 32.2 8.5 0
Ukraine 2.4 2.4
Categories may not add up because of rounding offWhen cells are left empty, the data are unavailable+ Data from: Slovak Centre of Organ Transplantation¤ Data from: Organización Nacional de Trasplantes (ONT), 2015 from total Spanish population

Section D: Paediatric data reference tables


121
Section D: Paediatric data reference tables
The incidence and prevalence of RRT in paediatric patients are based on data from 25 registries from 16 countries that provided individual patient data on children via the ERA-EDTA Registry, including Austria, Bosnia and Herzegovina, Denmark, Estonia, Finland, France, Greece, Iceland, Norway, Romania, Serbia, Spain (Andalusia), Spain (Aragon), Spain (Asturias), Spain (Basque country), Spain (Catalonia), Spain (Extremadura), Spain (Galicia), Spain (community of Madrid), Spain (region of Murcia), Spain (Valencian region), Sweden, Switzerland, the Netherlands, and United Kingdom (Scotland). In the analyses the data collected between 2010 and 2015 were used. As not all countries provided data over the complete period and to allow for comparison over the years, data are shown both including and excluding the data from Bosnia and Herzegovina, Estonia, France, Romania, Serbia, Spain (region of Murcia), and Switzerland. The methods that were applied to the data on paediatric patients were similar to those applied to the data on adult patients and are described in the Methods section. However, as not all regions in Spain had specialised paediatric centres, non-residents were also included in the incidence and prevalence.
Cohort All 0-4 5-9 10-14 15-19
N N N N N
D1 GENERAL POPULATION AGE DISTRIBUTIONTable D.1.1Population covered (in thousands)by age and cohort
2010 22212 5608 5431 5369 5804
2011 22189 5618 5475 5368 5728
2012 22150 5587 5524 5397 5642
2013 22066 5512 5572 5415 5567
2014 21980 5401 5623 5447 5508
2015 21941 5311 5656 5484 5489
2010 * 41972 10544 10381 10254 10793
2011 * 44575 11075 11133 10991 11376
2012 * 45209 11245 11297 11205 11461
2013 * 45430 11196 11485 11337 11412
2014 * 45336 11027 11570 11381 11357
2015 * 46840 11305 11980 11782 11774
2010-2015 * 269361 66392 67846 66950 68173
* Including data from France (coverage from 98.3% in 2010 to 100% in 2012), Bosnia Herzegovina and Serbia since 2011, Spain (region of Murcia) since 2012, Estonia since 2013, Romania (coverage from 100% in 2010 to 97.8% in 2015), Switzerland (coverage 99.9%) since 2015

122
Cohort All 0-4 5-9 10-14 15-19
N N N N N
All 0-4 5-9 10-14 15-19
N N N N N
Cohort All 0-4 5-9 10-14 15-19
HD PD Tx HD PD Tx HD PD Tx HD PD Tx HD PD Tx
N N N N N N N N N N N N N N N
D2 INCIDENT PATIENTS ACCEPTED FOR RRT, AT DAY 1Table D.2.1Incident counts by age and cohortat day 1
2010-2011 375 106 40 90 139
2012-2013 361 70 65 88 138
2014-2015 383 83 65 85 150
2010-2011 * 701 164 85 159 293
2012-2013 * 678 127 102 174 275
2014-2015 * 727 153 105 172 297
2010-2015 * 2106 444 292 505 865
* Including data from France (coverage from 98.3% in 2010 to 100% in 2012), Bosnia Herzegovina and Serbia since 2011, Spain (region of Murcia) since 2012, Estonia since 2013, Romania (coverage from 100% in 2010 to 97.8% in 2015), Switzerland (coverage 99.9%) since 2015
Table D.2.2Incident counts by age, treatment modality, and cohortat day 1
2010-2011 150 136 89 22 69 15 11 14 15 32 23 35 85 30 24
2012-2013 156 97 108 18 45 7 22 13 30 33 17 38 83 22 33
2014-2015 150 110 123 16 49 18 19 17 29 42 14 29 73 30 47
2010-2011 * 345 192 150 46 93 22 33 22 26 74 31 52 192 46 50
2012-2013 * 346 161 162 34 77 13 45 22 35 81 29 59 186 33 55
2014-2015 * 352 193 181 38 94 20 40 28 37 96 26 50 178 45 74
2010-2015 *† 1043 546 493 118 264 55 118 72 98 251 86 161 556 124 179
* Including data from France (coverage from 98.3% in 2010 to 100% in 2012), Bosnia Herzegovina and Serbia since 2011, Spain (region of Murcia) since 2012, Estonia since 2013, Romania (coverage from 100% in 2010 to 97.8% in 2015), Switzerland (coverage 99.9%) since 2015† For 24 patients information on treatment modality at start was unavailable
Table D.2.3Incident counts by age and primary renal diseasebetween 2010 and 2015, at day 1
CAKUT 640 162 96 181 201
Glomerulonephritis 382 52 49 68 213
Cystic kidney disease 199 40 46 64 49
Hereditary Nephropathy 166 65 21 25 55
Ischaemic Renal Failure 26 10 2 7 7
HUS 59 15 6 11 27
Metabolic disorders 41 10 11 12 8
Vasculitis 41 1 10 30
Miscellaneous 210 48 21 40 101
Missing, unknown 342 41 40 87 174
Including data from France (coverage from 98.3% in 2010 to 100% in 2012), Bosnia Herzegovina and Serbia since 2011, Spain (region of Murcia) since 2012, Estonia since 2013, Romania (coverage from 100% in 2010 to 97.8% in 2015), Switzerland (coverage 99.9%) since 2015

123
Cohort All 0-4 5-9 10-14 15-19
HD PD Tx HD PD Tx HD PD Tx HD PD Tx HD PD Tx
Pmarp Pmarp Pmarp Pmarp Pmarp Pmarp Pmarp Pmarp Pmarp Pmarp Pmarp Pmarp Pmarp Pmarp Pmarp
Cohort All 0-4 5-9 10-14 15-19
Pmarp Pmarp Pmarp Pmarp Pmarp
All 0-4 5-9 10-14 15-19
Pmarp Pmarp Pmarp Pmarp Pmarp
D2 INCIDENT PATIENTS ACCEPTED FOR RRT, AT DAY 1Table D.2.4Incident rates per million age-related population by age and cohortat day 1
2010-2011 8.4 9.4 3.7 8.4 12.1
2012-2013 8.2 6.3 5.9 8.1 12.3
2014-2015 8.7 7.7 5.8 7.8 13.6
2010-2011 * 8.1 7.6 4.0 7.5 13.2
2012-2013 * 7.5 5.7 4.5 7.7 12.0
2014-2015 * 7.9 6.9 4.5 7.4 12.8
2010-2015 * 7.8 6.7 4.3 7.5 12.7
* Including data from France (coverage from 98.3% in 2010 to 100% in 2012), Bosnia Herzegovina and Serbia since 2011, Spain (region of Murcia) since 2012, Estonia since 2013, Romania (coverage from 100% in 2010 to 97.8% in 2015), Switzerland (coverage 99.9%) since 2015
Table D.2.5Incident rates per million age-related population by age, treatment modality, and cohortat day 1
2010-2011 3.4 3.1 2.0 2.0 6.1 1.3 1.0 1.3 1.4 3.0 2.1 3.3 7.4 2.6 2.1
2012-2013 3.5 2.2 2.4 1.6 4.1 0.6 2.0 1.2 2.7 3.1 1.6 3.5 7.4 2.0 2.9
2014-2015 3.4 2.5 2.8 1.5 4.6 1.7 1.7 1.5 2.6 3.8 1.3 2.7 6.6 2.7 4.3
2010-2011 * 4.0 2.2 1.7 2.1 4.3 1.0 1.5 1.0 1.2 3.5 1.5 2.4 8.7 2.1 2.3
2012-2013 * 3.8 1.8 1.8 1.5 3.4 0.6 2.0 1.0 1.5 3.6 1.3 2.6 8.1 1.4 2.4
2014-2015 * 3.8 2.1 2.0 1.7 4.2 0.9 1.7 1.2 1.6 4.1 1.1 2.2 7.7 1.9 3.2
2010-2015 *† 3.9 2.0 1.8 1.8 4.0 0.8 1.7 1.1 1.4 3.7 1.3 2.4 8.2 1.8 2.6
* Including data from France (coverage from 98.3% in 2010 to 100% in 2012), Bosnia Herzegovina and Serbia since 2011, Spain (region of Murcia) since 2012, Estonia since 2013, Romania (coverage from 100% in 2010 to 97.8% in 2015), Switzerland (coverage 99.9%) since 2015† For 24 patients information on treatment modality at start was unavailable
Table D.2.6Incident rates per million age-related population by age and primary renal diseasebetween 2010 and 2015, at day 1
CAKUT 2.4 2.4 1.4 2.7 2.9
Glomerulonephritis 1.4 0.8 0.7 1.0 3.1
Cystic kidney disease 0.7 0.6 0.7 1.0 0.7
Hereditary Nephropathy 0.6 1.0 0.3 0.4 0.8
Ischaemic Renal Failure 0.1 0.2 0.0 0.1 0.1
HUS 0.2 0.2 0.1 0.2 0.4
Metabolic disorders 0.2 0.2 0.2 0.2 0.1
Vasculitis 0.2 0.0 0.1 0.4
Miscellaneous 0.8 0.7 0.3 0.6 1.5
Missing, unknown 1.3 0.6 0.6 1.3 2.6
Including data from France (coverage from 98.3% in 2010 to 100% in 2012), Bosnia Herzegovina and Serbia since 2011, Spain (region of Murcia) since 2012, Estonia since 2013, Romania (coverage from 100% in 2010 to 97.8% in 2015), Switzerland (coverage 99.9%) since 2015

124
Cohort All 0-4 5-9 10-14 15-19
N N N N N
All 0-4 5-9 10-14 15-19
N N N N N
Cohort All 0-4 5-9 10-14 15-19
HD PD Tx HD PD Tx HD PD Tx HD PD Tx HD PD Tx
N N N N N N N N N N N N N N N
D3 PREVALENT PATIENTS ON RRTTable D.3.1Prevalent counts by age and cohortprevalent patients on December 31
2010 1479 143 240 375 721
2011 1475 156 234 402 683
2012 1464 144 254 408 658
2013 1445 123 264 401 657
2014 1443 124 278 392 649
2015 1457 121 291 399 646
2010 * 2491 209 398 625 1259
2011 * 2547 236 396 670 1245
2012 * 2537 222 415 680 1220
2013 * 2548 205 426 702 1215
2014 * 2532 200 449 698 1185
2015 * 2613 223 454 731 1205
* Including data from France (coverage from 98.3% in 2010 to 100% in 2012), Bosnia Herzegovina and Serbia since 2011, Spain (region of Murcia) since 2012, Estonia since 2013, Romania (coverage from 100% in 2010 to 97.8% in 2015), Switzerland (coverage 99.9%) since 2015
Table D.3.2Prevalent counts by age, treatment modality, and cohortprevalent patients on December 31
2010 163 126 1178 20 54 69 17 18 204 32 18 322 94 36 583
2011 169 131 1164 25 60 71 13 24 196 36 18 346 95 29 551
2012 155 127 1172 22 60 62 13 17 222 33 19 355 87 31 533
2013 165 101 1168 18 34 70 19 19 225 34 16 348 94 32 525
2014 136 100 1199 12 37 74 17 20 241 28 12 348 79 31 536
2015 137 91 1219 12 33 76 32 17 241 29 15 349 64 26 553
2010 * 367 192 1879 32 76 93 37 29 326 75 33 505 223 54 955
2011 * 406 206 1883 47 78 107 36 36 314 82 36 543 241 56 919
2012 * 393 209 1895 45 81 93 42 33 333 76 40 557 230 55 912
2013 * 420 190 1906 44 63 94 43 36 343 85 36 572 248 55 897
2014 * 394 182 1936 37 64 95 46 39 362 87 27 577 224 52 902
2015 * 407 185 2011 44 75 104 60 32 361 102 29 594 201 49 952
* Including data from France (coverage from 98.3% in 2010 to 100% in 2012), Bosnia Herzegovina and Serbia since 2011, Spain (region of Murcia) since 2012, Estonia since 2013, Romania (coverage from 100% in 2010 to 97.8% in 2015), Switzerland (coverage 99.9%) since 2015
Table D.3.3Prevalent counts by age and primary renal diseaseprevalent patients on December 31, 2015
CAKUT 921 81 176 249 415
Glomerulonephritis 385 29 55 100 201
Cystic kidney disease 262 20 45 86 111
Hereditary Nephropathy 252 38 56 70 88
Ischaemic Renal Failure 47 3 12 17 15
HUS 95 3 16 28 48
Metabolic disorders 70 5 19 23 23
Vasculitis 27 0 1 4 22
Miscellaneous 240 21 34 65 120
Missing, unknown 314 23 40 89 162
Including data from Romania (coverage 97.8% in 2015) and Switzerland (coverage 99.9% in 2015)

125
Cohort All 0-4 5-9 10-14 15-19
HD PD Tx HD PD Tx HD PD Tx HD PD Tx HD PD Tx
Pmarp Pmarp Pmarp Pmarp Pmarp Pmarp Pmarp Pmarp Pmarp Pmarp Pmarp Pmarp Pmarp Pmarp Pmarp
All 0-4 5-9 10-14 15-19
Pmarp Pmarp Pmarp Pmarp Pmarp
Cohort All 0-4 5-9 10-14 15-19
Pmarp Pmarp Pmarp Pmarp Pmarp
D3 PREVALENT PATIENTS ON RRTTable D.3.4Prevalence per million age-related population by age and cohortprevalent patients on December 31
2010 66.6 25.5 44.2 69.9 124.2
2011 66.5 27.8 42.7 74.9 119.2
2012 66.1 25.8 46.0 75.6 116.6
2013 65.5 22.3 47.4 74.1 118.0
2014 65.7 23.0 49.4 72.0 117.8
2015 66.4 22.8 51.4 72.8 117.7
2010 * 59.3 19.8 38.3 61.0 116.7
2011 * 57.1 21.3 35.6 61.0 109.4
2012 * 56.1 19.7 36.7 60.7 106.4
2013 * 56.1 18.3 37.1 61.9 106.5
2014 * 55.9 18.1 38.8 61.3 104.3
2015 * 55.8 19.7 37.9 62.0 102.3
* Including data from France (coverage from 98.3% in 2010 to 100% in 2012), Bosnia Herzegovina and Serbia since 2011, Spain (region of Murcia) since 2012, Estonia since 2013, Romania (coverage from 100% in 2010 to 97.8% in 2015), Switzerland (coverage 99.9%) since 2015
Table D.3.5Prevalence per million age-related population by age, treatment modality, and cohortprevalent patients on December 31
2010 7.3 5.7 53.0 3.6 9.6 12.3 3.1 3.3 37.6 6.0 3.4 60.0 16.2 6.2 100.4
2011 7.6 5.9 52.5 4.5 10.7 12.6 2.4 4.4 35.8 6.7 3.4 64.5 16.6 5.1 96.2
2012 7.0 5.7 52.9 3.9 10.7 11.1 2.4 3.1 40.2 6.1 3.5 65.8 15.4 5.5 94.5
2013 7.5 4.6 52.9 3.3 6.2 12.7 3.4 3.4 40.4 6.3 3.0 64.3 16.9 5.7 94.3
2014 6.2 4.5 54.6 2.2 6.9 13.7 3.0 3.6 42.9 5.1 2.2 63.9 14.3 5.6 97.3
2015 6.2 4.1 55.6 2.3 6.2 14.3 5.7 3.0 42.6 5.3 2.7 63.6 11.7 4.7 100.7
2010 * 8.7 4.6 44.8 3.0 7.2 8.8 3.6 2.8 31.4 7.3 3.2 49.2 20.7 5.0 88.5
2011 * 9.1 4.6 42.2 4.2 7.0 9.7 3.2 3.2 28.2 7.5 3.3 49.4 21.2 4.9 80.8
2012 * 8.7 4.6 41.9 4.0 7.2 8.3 3.7 2.9 29.5 6.8 3.6 49.7 20.1 4.8 79.6
2013 * 9.2 4.2 42.0 3.9 5.6 8.4 3.7 3.1 29.9 7.5 3.2 50.5 21.7 4.8 78.6
2014 * 8.7 4.0 42.7 3.4 5.8 8.6 4.0 3.4 31.3 7.6 2.4 50.7 19.7 4.6 79.4
2015 * 8.7 3.9 42.9 3.9 6.6 9.2 5.0 2.7 30.1 8.7 2.5 50.4 17.1 4.2 80.9
* Including data from France (coverage from 98.3% in 2010 to 100% in 2012), Bosnia Herzegovina and Serbia since 2011, Spain (region of Murcia) since 2012, Estonia since 2013, Romania (coverage from 100% in 2010 to 97.8% in 2015), Switzerland (coverage 99.9%) since 2015
Table D.3.6Prevalence per million age-related population by age and primary renal diseaseprevalent patients on December 31, 2015
CAKUT 19.7 7.2 14.7 21.1 35.2
Glomerulonephritis 8.2 2.6 4.6 8.5 17.1
Cystic kidney disease 5.6 1.8 3.8 7.3 9.4
Hereditary Nephropathy 5.4 3.4 4.7 5.9 7.5
Ischaemic Renal Failure 1.0 0.3 1.0 1.4 1.3
HUS 2.0 0.3 1.3 2.4 4.1
Metabolic disorders 1.5 0.4 1.6 2.0 2.0
Vasculitis 0.6 0.1 0.3 1.9
Miscellaneous 5.1 1.9 2.8 5.5 10.2
Missing, unknown 6.7 2.0 3.3 7.6 13.8
Including data from Romania (coverage 97.8% in 2015) and Switzerland (coverage 99.9% in 2015)


Methods


129
VI Methods
The ERA-EDTA Registry is located at the Department of Medical Informatics in the Academic Medical Center in Amsterdam, the Netherlands. This department hosts several clinical registries which share a quality management system with standard operating procedures for data collection, data storage, data analysis, and the production of the annual report. The quality management system has been certified according to the ISO 9001:2000 norm since 2004, according to the ISO 9001:2008 norm since 2010 and according to the ISO 9001:2015 norm since September 2016.
Data collection and preparation
Individual patient data
Data collectionOn an annual basis data sets containing individual patient data are sent to the ERA-EDTA Registry office in Amsterdam. Supported file formats for data delivery include Microsoft Access, Microsoft Excel, SPSS, SAS, and delimited text files. Collaborating registries either upload their data via a secure data upload portal or send PGP encrypted or password protected data by email.
VariablesThe ERA-EDTA Registry asks national and regional registries for the data shown in Table 1.
Table 1: Variables collected for individual patients
Patient data Transaction data
Patient identifier Patient identifierCountry of registry Date of eventDate of birth Type of event / treatmentGender Cause of deathPrimary Renal Disease Treatment centreDate of first RRT Source registry Destination registry
Collaborating registries and participating countriesIndividual patient data from 32 national and regional registries in 17 countries were used to create the tables in Section B of this annual report. Registry data are subject to continuous alteration and improvement. Small differences between ERA-EDTA Registry data and the data presented in the national and regional registry’s own annual reports may result from different times of data extraction. Minor differences between the numbers reported by the UK Renal Registry and this annual report may occur because the prevalence as reported in the UK Renal Registry Report is based on quarterly data returns, whereas the prevalence as reported in this annual report is based on data derived from the treatment modality timeline. The data on Spain presented in Section B of this report are based on separate data sets received from 14 of 19 regions: Andalusia, Aragon, Asturias, Basque country, Cantabria, Castile and León, Castile-La Mancha, Catalonia, Extremadura, Galicia, Community of Madrid, Region of Murcia, Navarre and Valencian region.

130
Differences between collaborating registries
Definitions and collection of dataIn the comparison of data between registries it should be recognized that there may be small differences between registries in definitions and in the collection of their data. For example, the different registries do not collect data at the same level of detail, especially with regard to the various subtypes of treatment modalities.
Patient populationThe data from Belgium (Dutch-speaking), Belgium (French-speaking), Spain (Cantabria), Spain (Castile and León), Spain (Castile-La Mancha), Spain (Navarre) and the United Kingdom (England/Northern Ireland/Wales) is comprised of patients older than 20 years of age. It has been estimated that the inclusion of data on children would add approximately 2 per million population (Pmp) to the incidence rate and about 13 Pmp to the prevalence.For the calculation of the incidence of those alive and on RRT on day 91, registries were asked to provide data with follow-up until 31st March 2016. For the following registries data were only available until 31st December 2015: Denmark, France, the Netherlands, Serbia, Spain (Andalusia), Spain (Aragon), Spain (Asturias), Spain (Castille-La Mancha), Spain (Catalonia), Spain (Extremadura), Spain (Galicia), Spain (Community of Madrid), Switzerland and the United Kingdom (England, Wales and Northern Ireland). For these registries the incidence on day 91 was estimated as explained in the paragraph on statistical analyses
Data loading and cleaningThe data from the registries were imported using an in-house developed import utility. This program first uniforms the data and then translates any non-standard codes. Consistency checks were performed, and thereafter the data were converted to the desired format in order to make the storage of the data in the relational and event-driven database possible. The new data, provided by the national and regional registries, replaced all existing data in the ERA-EDTA Registry database. In this way changes in the data sets made by the national and regional registries were adopted by the ERA-EDTA Registry. The import utility performed extensive logging and the logging-results were used to provide the national and regional registries with feedback concerning inconsistencies or other problems identified in the data.After analysing the data, the results were compared to the annual reports published by the national and regional registries as a first check for errors. In the case of discrepancies the registry was contacted and potential problems regarding (the interpretation of) their data set were solved. Thereafter, more detailed reports were produced which needed approval from the registry representative before publication in this ERA-EDTA Registry Annual Report.
ERA-EDTA Registry databaseMicrosoft SQL Server (a database management system) was used to manage the ERA-EDTA Registry database. This relational and event-driven database consists of a patient and a transaction table which can be extended according to future needs.
General population dataMidyear population data of the contributing countries were provided by Eurostat [1], the national bureau of statistics or the national or regional registry. The sources of the population data used for the analyses in Section B are shown in Table 2.
Reference populationIn this year’s Annual Report, the age and gender distribution of the EU27 of 2010 as provided by Eurostat [1] was used for the adjustment of incidence rates and prevalence for age and gender. The age and gender distribution of EU27 in 2010 is shown in Table 3.

131
Table 2: Sources of the general population data for the national and regional registries participating with individual patient data in Section B
Registry Sources of general population data of 2015
Austria RegistryBelgium, Dutch-speaking http://ec.europa.eu/eurostat/Belgium, French-speaking http://ec.europa.eu/eurostat/Bosnia and Herzegovina http://www.popis2013.ba/Denmark http://ec.europa.eu/eurostat/ Greenland http://www.stat.gl/Estonia http://ec.europa.eu/eurostat/Finland http://ec.europa.eu/eurostat/France http://ec.europa.eu/eurostat/Greece http://ec.europa.eu/eurostat/Iceland http://ec.europa.eu/eurostat/Norway http://ec.europa.eu/eurostat/Romania http://ec.europa.eu/eurostat/Serbia http://ec.europa.eu/eurostat/Spain, Andalusia http://www.ine.es/Spain, Aragon http://www.ine.es/Spain, Asturias http://www.ine.es/Spain, Basque country http://www.ine.es/Spain, Cantabria http://www.ine.es/Spain, Castile and León http://www.ine.es/Spain, Castile-La Mancha http://www.ine.es/Spain, Catalonia http://www.ine.es/Spain, Extremadura http://www.ine.es/Spain, Galicia http://www.ine.es/Spain, Community of Madrid http://www.ine.es/Spain, Region of Murcia http://www.ine.es/Spain, Navarre http://www.ine.es/Spain, Valencian region http://www.ine.es/Sweden http://ec.europa.eu/eurostat/Switzerland http://ec.europa.eu/eurostat/the Netherlands http://ec.europa.eu/eurostat/United Kingdom, England/Northern Ireland/Wales http://www.ons.gov.uk/United Kingdom, Scotland http://www.ons.gov.uk/
Table 3: The age and gender distribution of the reference population EU27 (2010)
Age groups All Men Women
N N N
0-4 26,395,042 13,538,482 12,856,5605-9 25,671,423 13,164,757 12,506,66610-14 26,227,258 13,447,626 12,779,63215-19 28,871,932 14,799,902 14,072,03020-24 31,748,967 16,165,507 15,583,46025-29 33,637,765 17,036,136 16,601,62930-34 34,721,373 17,582,565 17,138,80835-39 36,330,818 18,323,844 18,006,97440-44 37,936,179 19,089,702 18,846,47745-49 36,959,424 18,442,336 18,517,08850-54 34,559,527 17,057,371 17,502,15655-59 32,008,654 15,585,644 16,423,01060-64 28,943,516 13,927,064 15,016,45265-69 24,005,279 11,254,363 12,750,91670-74 21,947,335 9,832,684 12,114,65175-79 17,793,563 7,435,782 10,357,78180-84 12,919,229 4,816,223 8,103,00685+ 10,407,098 3,110,189 7,296,909
Total 501,084,382 244,610,177 256,474,205

132
Aggregated data
Data collectionSection C relates to national and regional registries providing the ERA-EDTA Registry with aggregated data. Data were provided via a Microsoft Excel template and imported for inclusion in this annual report.
Collaborating registriesAggregated data from 20 national and regional registries were used for the preparation of the tables in Section C. The following countries participated in Section C of this year’s annual report: Albania, Belarus, Bulgaria, Croatia, Cyprus, Czech Republic, Georgia, Israel, Italy, Latvia, Lithuania, Macedonia, Poland, Portugal, Russia, Slovakia, Spain, Tunisia (Sfax region), Turkey, and Ukraine.Data from Italy are based on 5 of the 20 regions: Calabria, Emilia-Romagna, Liguria, Puglia, and Veneto.
Data loading and cleaningThe Microsoft Excel templates used for data collection included automated consistency checks. Additional checks were performed manually.
General population dataThe population data needed for the calculation of incidence rates and prevalence Pmp were reported by the collaborating registries.
Reference populationAs in Section B, we used the age and gender distribution of the EU27 of 2010 (see Table 3) as provided by Eurostat [1] for the adjustment of the incidence rates and prevalence.
Coding systems
Primary renal diseaseRenal diseases were defined according to both the old and new (2012) ERA-EDTA coding systems and subsequently classified into groups (Appendix 1 and 2). When the 2012 PRD codes were provided, they were categorized into the old PRD groups, which resulted in a somewhat different distribution of the PRD groups
Causes of deathCauses of death were defined according to the ERA-EDTA coding systems and subsequently classified into groups (Appendix 3).
Event type codesAppendix 4 provides an overview of the coding currently used for event type codes in the ERA-EDTA database.
Statistical analyses
An overview of the renal registries contributing data for the different types of analyses is given in Appendix 5. For the data analyses SAS 9.4 [2] was used. This statistical software package is able to maintain large datasets, is syntax driven which increases reproducibility of results, and has extensive capabilities with regard to statistics and data management.
Summary sectionThe tables and figures in the summary section are based on data from registries providing individual patient data and registries providing aggregated data. Summary statistics were calculated for all registries providing individual patient data (presented as “Individual data”), for all registries providing aggregated data (presented as “Aggregated data”) and for all registries combined (presented as “All countries”). Where possible these summary statistics were calculated as the sum of the individual

133
values. In all other cases summary statistics were calculated as weighted averages. The weights were dependent on the denominator (i.e. the population size for Pmp values and the total incident count or prevalent count for percentages) and were calculated as the contribution of the registry to the total of the registries.
Individual patient data
Incidence and prevalenceThe incidence and prevalence tables were based on 32 data sets from national or regional registries from 17 countries that provided individual patient data for 2015, including Austria, Belgium (Dutch-speaking), Belgium (French-speaking), Bosnia and Herzegovina, Denmark, Estonia, Finland, France, Greece, Iceland, Norway, Romania, Serbia, Spain (Andalusia), Spain (Aragon), Spain (Asturias), Spain (Basque country), Spain (Cantabria), Spain (Castile and León), Spain (Castile-La Mancha), Spain (Catalonia), Spain (Extremadura), Spain (Galicia), Spain (Community of Madrid), Spain (Region of Murcia), Spain (Navarre), Spain (Valencian region), Sweden, Switzerland, the Netherlands, United Kingdom (England/Northern Ireland/Wales) and United Kingdom (Scotland).
Methods for calculating incidence and prevalenceThe incidence rate and the prevalence of those alive and on RRT were calculated for the total population and for subgroups based on gender, age group, treatment modality, and primary renal disease. The incidence rate or prevalence Pmp is the observed incident or prevalent count divided by the general population in that year and multiplied by one million. For the incidence rate or prevalence per million age-related population (Pmarp) the observed incident or prevalent count per age category was divided by the general population in that age category and multiplied by one million. For those registries that had no data available with a follow-up until March 31st, 2016, the incidence of RRT on day 91 was estimated. We assumed that the relative difference between the incidence on day 1 and the incidence on day 91 was similar for patients who started RRT in the first nine months of 2015, when compared to patients who started RRT in the last three months of 2015. For the calculation of the mean and median age for incident patients on day 91, we used the actual age on day 91.
Adjustment of incidence and prevalenceDifferences in the unadjusted incidence rate and prevalence across countries might be due to the differences in the age and gender distribution of the general population. The EU27 age and gender distribution of the European population (Table 3) was therefore used to adjust incidence rates and prevalence for age and gender [1]. Adjusted rates were derived by applying the weights of the reference population to the observed variable-specific rates (e.g. incidence rate per age group) in a country. This weighted average provides a single summary rate for each country that would be expected if that country had the age and gender distribution of the reference population. The following example shows how to calculate the age adjusted incidence rate. In this example the incidence rate of country A is 269 Pmp, the age-specific rates of country A and the reference population distribution with respect to age are shown in Table 4.
Table 4: Calculation of the adjusted incidence rate
Age groups Incidence rate Reference country A population
Pmp %
0-19 332 31.720-44 261 39.345-64 64 29.0Total 269 100
The adjusted incident rate of country A is: (0.317 * 332) + (0.393 * 261) + (0.29 * 64) = 226 Pmp
Performed kidney transplantsFor all participating countries and regions the number of kidney transplants performed during the year was presented by donor type. In Iceland the number of transplants was somewhat lower, because several patients received transplants in other countries. Rates are expressed as numbers, percentages and Pmp.

134
Survival probabilityIn this annual report, patient survival on RRT, patient survival on dialysis, patient survival after the first transplant, and graft survival after the first transplant are presented in tables by age, gender and primary renal disease. In addition, patient survival is presented in figures by primary renal disease and by treatment modality. Survival probabilities are presented as percentages from 0 to 100. For this report the survival analyses were based on data from Austria, Belgium (Dutch-speaking), Belgium (French-speaking), Denmark, Finland, France, Greece, Iceland, Norway, Spain (Andalusia), Spain (Aragon), Spain (Asturias), Spain (Basque country), Spain (Cantabria), Spain (Castile and León), Spain (Castile-La Mancha), Spain (Catalonia), Spain (Extremadura), Spain (Galicia), Spain (Community of Madrid), Spain (Valencian region), Sweden, the Netherlands, United Kingdom (England/Wales/Northern Ireland) and United Kingdom (Scotland). The differences between the survival probabilities of this annual report and survival probabilities published in earlier annual reports of the ERA-EDTA Registry may be partly due to differences in participating countries.Survival was analysed from day 1 and from day 91 onwards for those patients alive and on RRT on those days. For the analysis of survival data two five-year cohorts were used:• 2006-2010 - for the presentation of 90-day, one-, two- and five-year survival probabilities.• 2009-2013 - for the presentation of 90-day, one- and two-year survival probabilities.31st December 2015 was applied as censoring date for all survival analyses. For the different types of survival analysis the events, competing events and censoring were defined as shown in Table 5.
Table 5: Overview of the events, competing events, and censoring as defined for the survival analyses in Section B
Survival type Event Competing event Censoring
Patients on renal replacement therapy Death of patient Recovery of renal function * Loss to follow-up End of follow-up timePatients on dialysis 1) Death of patient Transplantation Recovery of renal function * Loss to follow-up End of follow-up time 2) Death of patient Transplantation Recovery of renal function * Loss to follow-up End of follow-up timeFirst transplant recipients Death of patient Loss to follow-up End of follow-up timeFirst graft Death of patient Loss to follow-up Graft failure End of follow-up time
* This was only considered as a censored observation when a patient’s renal function had recovered for a period of more than 30 days.
Unadjusted survival probabilitiesUnadjusted survival probabilities were calculated using the Kaplan-Meier method. In the unadjusted survival analysis the cells in the tables were left blank when there were less than 100 patients in that cell.
Adjusted survival probabilitiesThe Cox regression model was used to calculate survival probabilities while accounting for confound-ers [3]. Survival probabilities were adjusted for age, gender and primary renal disease. As the RRT population changes over time, it was decided to adjust for fixed values for a number of variables in the survival analyses to make the results omparable across time periods. The fixed values of variables used for the survival tables are shown in Table 6. In the tables presenting the adjusted survival probabilities, cells with less than 100 patients were left empty. Patients for whom age, gender, or primary renal disease was missing were excluded. For Figure B.6.4 the Fine and Gray competing risks method (cause-specific cumulative incidence method) [4,5] was used to estimate the adjusted cumulative probability of death in 5 years for pa-tients starting dialysis, taking into account that these patients can experience a competing event, i.e. a kidney transplantation. This method was also used to estimate the adjusted cumulative prob-ability of receiving a kidney transplant (competing event) and the adjusted cumulative probability of remaining on dialysis (event free).
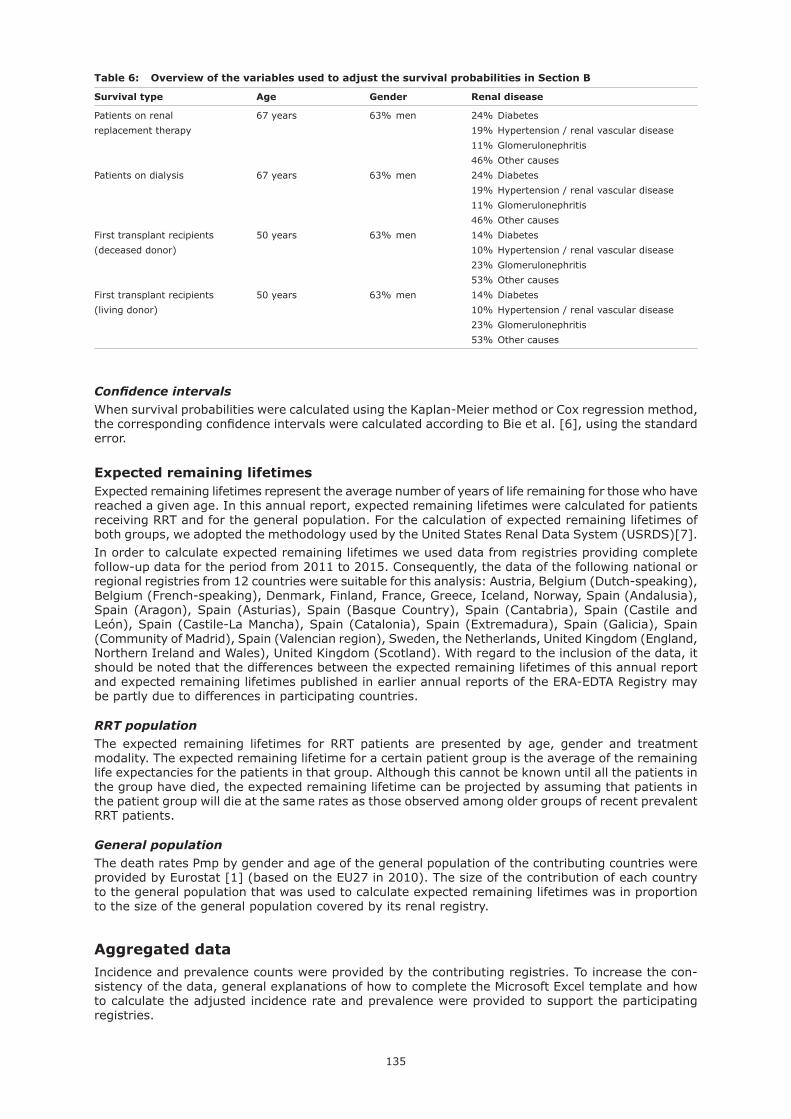
135
Table 6: Overview of the variables used to adjust the survival probabilities in Section B
Survival type Age Gender Renal disease
Patients on renal 67 years 63% men 24% Diabetesreplacement therapy 19% Hypertension / renal vascular disease 11% Glomerulonephritis 46% Other causesPatients on dialysis 67 years 63% men 24% Diabetes 19% Hypertension / renal vascular disease 11% Glomerulonephritis 46% Other causesFirst transplant recipients 50 years 63% men 14% Diabetes(deceased donor) 10% Hypertension / renal vascular disease 23% Glomerulonephritis 53% Other causesFirst transplant recipients 50 years 63% men 14% Diabetes(living donor) 10% Hypertension / renal vascular disease 23% Glomerulonephritis 53% Other causes
Confidence intervalsWhen survival probabilities were calculated using the Kaplan-Meier method or Cox regression method, the corresponding confidence intervals were calculated according to Bie et al. [6], using the standard error.
Expected remaining lifetimesExpected remaining lifetimes represent the average number of years of life remaining for those who have reached a given age. In this annual report, expected remaining lifetimes were calculated for patients receiving RRT and for the general population. For the calculation of expected remaining lifetimes of both groups, we adopted the methodology used by the United States Renal Data System (USRDS)[7].In order to calculate expected remaining lifetimes we used data from registries providing complete follow-up data for the period from 2011 to 2015. Consequently, the data of the following national or regional registries from 12 countries were suitable for this analysis: Austria, Belgium (Dutch-speaking), Belgium (French-speaking), Denmark, Finland, France, Greece, Iceland, Norway, Spain (Andalusia), Spain (Aragon), Spain (Asturias), Spain (Basque Country), Spain (Cantabria), Spain (Castile and León), Spain (Castile-La Mancha), Spain (Catalonia), Spain (Extremadura), Spain (Galicia), Spain (Community of Madrid), Spain (Valencian region), Sweden, the Netherlands, United Kingdom (England, Northern Ireland and Wales), United Kingdom (Scotland). With regard to the inclusion of the data, it should be noted that the differences between the expected remaining lifetimes of this annual report and expected remaining lifetimes published in earlier annual reports of the ERA-EDTA Registry may be partly due to differences in participating countries.
RRT populationThe expected remaining lifetimes for RRT patients are presented by age, gender and treatment modality. The expected remaining lifetime for a certain patient group is the average of the remaining life expectancies for the patients in that group. Although this cannot be known until all the patients in the group have died, the expected remaining lifetime can be projected by assuming that patients in the patient group will die at the same rates as those observed among older groups of recent prevalent RRT patients.
General populationThe death rates Pmp by gender and age of the general population of the contributing countries were provided by Eurostat [1] (based on the EU27 in 2010). The size of the contribution of each country to the general population that was used to calculate expected remaining lifetimes was in proportion to the size of the general population covered by its renal registry.
Aggregated dataIncidence and prevalence counts were provided by the contributing registries. To increase the con-sistency of the data, general explanations of how to complete the Microsoft Excel template and how to calculate the adjusted incidence rate and prevalence were provided to support the participating registries.

136
Paediatric SectionThe incidence and prevalence tables in Section D of this annual report were based on data from 25 national or regional registries from 16 countries that provided complete individual patient data in their paediatric population for 2010 to 2015, including Austria, Bosnia and Herzegovina, Denmark, Estonia, Finland, France, Greece, Iceland, Norway, Romania, Serbia, Spain (Andalusia), Spain (Aragon), Spain (Asturias), Spain (Basque country), Spain (Catalonia), Spain (Extremadura), Spain (Galicia), Spain (community of Madrid), Spain (region of Murcia), Spain (Valencian region), Sweden, Switzerland, the Netherlands, and United Kingdom (Scotland). For France the coverage of the general population by the registry increased from 98.3% in 2010 to 100% from 2012 onwards. For Romania the coverage decreased from 100% in 2010 to 97.8% in 2015. Bosnia Herzegovina and Serbia provided data since 2011, Spain (Region of Murcia) since 2012, Estonia since 2013, and Switzerland (coverage 99.9%) since 2015. Furthermore, as not every region in Spain had a specialised paediatric centre, paediatric patients could be treated in other regions than their resident region. This would result in an underestimation of the incidence and prevalence in these regions. To allow for this, non-resident paediatric patients were not excluded from the paediatric tables. Incidence (on day 1) and prevalence on RRT were calculated for subgroups based on age, treatment modality, and primary renal disease. Incidence on RRT by 2-year cohorts was presented for paediatric patients who started RRT between 2010 and 2015. The cohorts 2010-2011, 2012-2013 and 2014-2015 were presented twice, once including and once excluding the countries with a limited follow-up to allow for a comparison over time. The incidence rate on RRT Pmarp was the observed incident count in that particular time period divided by the age-related general population in that time period (for example the total population in 2014 plus the total population in 2015) multiplied by one million. The grouping of primary renal disease codes for the paediatric population is described in Table 7 as it differs from the grouping in the adult population.
Table 7: Grouping of primary renal diseases for paediatric patients in Section D Groups and codes included
Primary renal disease group Primary renal disease code (see appendix 1)
Congenital anomalies of the kidney and urinary tract (CAKUT) 20, 21, 22, 23, 24, 25, 29, 60, 61, 63, and 66Glomerulonephritis 10, 11, 12, 13, 14, 15, 16, 17, 19, and 86 Cystic kidney disease 40, 41, 42, 43, and 49Hereditary nephropathy 50, 51, and 59Ischaemic renal failure 90Haemolytic uraemic syndrome (HUS) 88Metabolic disorders 52, 53, 54, 92, and 93Vasculitis 73, 74, 84, 85, and 87Miscellaneous 30, 31, 32, 33, 34, 39, 70, 71, 72, 75, 76, 78, 79, 80, 81, 82, 83, 89, 91, 94, 95, 96, and 99Missing, unknown missing and 00
The prevalence on RRT was presented at 31st December of each year from 2010 to 2015 and were presented twice, once including and once excluding the above mentioned countries and periods to allow for a comparison over time. The prevalence on RRT by primary renal disease was calculated for patients prevalent on 31st December, 2015.
Bibliography
1) Eurostat: http://ec.europa.eu/eurostat/data/database.2) SAS Institute Inc., Cary, NC, USA.3) Altman, D. Practical statistics for medical research. second ed. 1999, London: Chapman & Hall.4) Noordzij M, Leffondré K, van Stralen KJ, Zoccali C, Dekker FW, Jager KJ. When do we need competing risks
methods for survival analysis in nephrology? Nephrol Dial Transplant. 2013 Nov; 28 :2670-2677.5) Wolbers M, Koller MT, Stel VS, Schaer B, Jager KJ, Leffondré K, Heinze G. Competing risks analyses: objec-
tives and approaches. Eur Heart J. 2014; 35: 2936-41.6) Bie O, Borgan O and Liestol K. Confidence intervals and confidence bands for the cumulative hazard rate
function and their small sample properties. Scandinavian Journal of Statistics 1987; 14: 221-233.7) U.S. Renal Data System, USRDS 2012 Annual Data Report: Atlas of End-Stage Renal Disease in the United
States, National Institutes of Health, National Institute of Diabetes and Digestive and Kidney Diseases, Bethesda, MD, 2012.

Appendices

138
Appendix 1 - Grouping of primary renal diseases
1994 1995 PRD Primary renal disease code code group
10 10 I Glomerulonephritis; histologically NOT examined 11 11 I Focal segmental glomerulosclerosis with nephrotic syndrome in children 12 12 I IgA nephropathy (proven by immunofluorescence, not code 76 or 85) 13 13 I Dense deposit disease; membrano-proliferative GN; type II (proven by immunofluorescence / electron microscopy) 14 14 I Membranous nephropathy 15 15 I Membrano-proliferative GN; type I (proven by immunofluorescence / electron microscopy, not code 84 or 89) 16 16 I Crescentic (extracapillary) glomerulonephritis (type I, II, III) 17 17 I Focal segmental glomerulosclerosis with nephrotic syndrome in adults 19 19 I Glomerulonephritis; histologically examined, not given above 20 20 II Pyelonephritis; cause not specified 21 21 II Pyelonephritis associated with neurogenic bladder 22 22 II Pyelonephritis due to congenital obstructive uropathy with/without vesico-ureteric reflux 23 23 II Pyelonephritis due to acquired obstructive uropathy 24 24 II Pyelonephritis due to vesico-ureteric reflux without obstruction 25 25 II Pyelonephritis due to urolithiasis 29 29 II Pyelonephritis due to other cause 30 30 VII Interstitial nephritis (not pyelonephritis) due to other cause, or unspecified (not mentioned above) 31 31 VII Nephropathy (interstitial) due to analgesic drugs 32 32 VII Nephropathy (interstitial) due to cis-platinum 33 33 VII Nephropathy (interstitial) due to cyclosporin A 34 VII Lead induced nephropathy (interstitial) 39 39 VII Drug induced nephropathy (interstitial) not mentioned above 40 40 VII Cystic kidney disease - type unspecified 41 41 III Polycystic kidneys; adult type (dominant) 42 42 VII Polycystic kidneys; infantile (recessive) 43 43 VII Medullary cystic disease; including nephronophthisis 49 49 VII Cystic kidney disease - other specified type 50 50 VII Hereditary / Familial nephropathy - type unspecified 51 51 VII Hereditary nephritis with nerve deafness (Alport’s Syndrome) 52 52 VII Cystinosis 53 53 VII Primary oxalosis 54 54 VII Fabry’s disease 59 59 VII Hereditary nephropathy - other specified type 60 60 VII Renal hypoplasia (congenital) - type unspecified 61 61 VII Oligomeganephronic hypoplasia 63 63 VII Congenital renal dysplasia with or without urinary tract malformation 66 66 VII Syndrome of agenesis of abdominal muscles (Prune Belly) 70 70 V Renal vascular disease - type unspecified 71 71 IV Renal vascular disease due to malignant hypertension 72 72 IV Renal vascular disease due to hypertension 73 73 VII Renal vascular disease due to polyarteritis 74 74 VII Wegener’s granulomatosis 75 VII Ischaemic renal disease/cholesterol embolism (1998 prd code) 76 76 VII Glomerulonephritis related to liver cirrhosis 78 VII Cryoglobulinaemic glomerulonephritis 79 79 V Renal vascular disease - due to other cause (not given above and not code 84-88) 80 80 VI Diabetes glomerulosclerosis or diabetic nephropathy - Type I 81 80 VI Diabetes glomerulosclerosis or diabetic nephropathy - Type II 82 82 VII Myelomatosis / light chain deposit disease 83 83 VII Amyloid 84 84 VII Lupus erythematosus 85 85 VII Henoch-Schoenlein purpura 86 86 VII Goodpasture’s Syndrome 87 87 VII Systemic sclerosis (scleroderma) 88 88 VII Haemolytic Uraemic Syndrome (including Moschcowitz Syndrome) 89 89 VII Multi-system disease - other (not mentioned above) 90 90 VII Tubular necrosis (irreversible) or cortical necrosis (different from 88) 91 91 VII Tuberculosis 92 92 VII Gout 93 93 VII Nephrocalcinosis and hypercalcaemic nephropathy 94 94 VII Balkan nephropathy 95 95 VII Kidney tumour 96 96 VII Traumatic or surgical loss of kidney 99 99 VII Other identified renal disorders 00 00 VIII Chronic renal failure; aetiology uncertainPRD group: I: glomerulonephritis / sclerosis; II: pyelonephritis; III: polycystic kidneys, adult type; IV: hypertension; V: renal vascular disease; VI: diabetes; VII: miscellaneous; VIII: unknown

139
Appendix 2 - Grouping of primary renal disease codes 2012
I: GLOMERULAR DISEASE Code Primary renal disease
1003 Adult nephrotic syndrome - no histology1472 Anti-Glomerular basement membrane (GBM) disease / Goodpasture’s syndrome - histologically proven1464 Anti-Glomerular basement membrane (GBM) disease / Goodpasture’s syndrome - no histology1440 Churg-Strauss syndrome - histologically proven1438 Churg-Strauss syndrome - no histology1088 Congenital nephrotic syndrome (CNS) - congenital infection1057 Congenital nephrotic syndrome (CNS) - diffuse mesangial sclerosis1042 Congenital nephrotic syndrome (CNS) - Finnish type - histologically proven1035 Congenital nephrotic syndrome (CNS) - Finnish type - no histology1061 Congenital nephrotic syndrome (CNS) - focal segmental glomerulosclerosis (FSGS)1026 Congenital nephrotic syndrome (CNS) - no histology1570 Cryoglobulinaemia secondary to hepatitis C - histologically proven1562 Cryoglobulinaemia secondary to hepatitis C - no histology1591 Cryoglobulinaemia secondary to systemic disease - histologically proven1589 Cryoglobulinaemia secondary to systemic disease - no histology1074 Denys-Drash syndrome1331 Diffuse endocapillary glomerulonephritis1558 Essential mixed cryoglobulinaemia - histologically proven1543 Essential mixed cryoglobulinaemia - no histology1308 Familial focal segmental glomerulosclerosis (FSGS) - autosomal dominant - histologically proven1298 Familial focal segmental glomerulosclerosis (FSGS) - autosomal dominant - no histology1280 Familial focal segmental glomerulosclerosis (FSGS) - autosomal recessive - histologically proven1279 Familial focal segmental glomerulosclerosis (FSGS) - autosomal recessive - no histology1144 Familial IgA nephropathy - histologically proven1137 Familial IgA nephropathy - no histology1354 Focal and segmental proliferative glomerulonephritis1320 Focal segmental glomerulosclerosis (FSGS) secondary to obesity - histologically proven1312 Focal segmental glomerulosclerosis (FSGS) secondary to obesity - no histology1377 Glomerulonephritis - histologically indeterminate3749 Glomerulonephritis - no histology1365 Glomerulonephritis - secondary to other systemic disease1417 Granulomatosis with polyangiitis - histologically proven1401 Granulomatosis with polyangiitis - no histology1515 Henoch-Schönlein purpura / nephritis - histologically proven1504 Henoch-Schönlein purpura / nephritis - no histology1251 Idiopathic rapidly progressive (crescentic) glomerulonephritis1128 IgA nephropathy - histologically proven1116 IgA nephropathy - no histology1163 IgA nephropathy secondary to liver cirrhosis - histologically proven1159 IgA nephropathy secondary to liver cirrhosis - no histology1171 IgM - associated nephropathy1205 Membranous nephropathy - drug induced1185 Membranous nephropathy - idiopathic1214 Membranous nephropathy - infection associated1192 Membranous nephropathy - malignancy associated1349 Mesangial proliferative glomerulonephritis 1222 Mesangiocapillary glomerulonephritis type 11233 Mesangiocapillary glomerulonephritis type 2 (dense deposit disease)1246 Mesangiocapillary glomerulonephritis type 31429 Microscopic polyangiitis - histologically proven1100 Minimal change nephropathy - histologically proven1090 Minimal change nephropathy - no histology3615 Nephrotic syndrome of childhood - no trial of steroids - no histology3604 Nephrotic syndrome of childhood - steroid resistant - no histology1019 Nephrotic syndrome of childhood - steroid sensitive - no histology1455 Polyarteritis nodosa1267 Primary focal segmental glomerulosclerosis (FSGS)1536 Renal scleroderma / systemic sclerosis - histologically proven1527 Renal scleroderma / systemic sclerosis - no histology1493 Systemic lupus erythematosus / nephritis - histologically proven1486 Systemic lupus erythematosus / nephritis - no histology1383 Systemic vasculitis - ANCA negative - histologically proven1396 Systemic vasculitis - ANCA positive - no histology

140
II: TUBULOINTERSTITIAL DISEASE Code Primary renal disease
1768 Acquired obstructive nephropathy due to neurogenic bladder1752 Acquired obstructive uropathy / nephropathy2196 Acute urate nephropathy - histologically proven2183 Acute urate nephropathy - no histology1995 Aristolochic acid nephropathy (Balkan / Chinese herb / endemic nephropathy) - histologically proven1982 Aristolochic acid nephropathy (Balkan / Chinese herb / endemic nephropathy) - no histology1710 Bladder exstrophy1845 Calcium oxalate urolithiasis1832 Calculus nephropathy / urolithiasis2203 Chronic urate nephropathy - histologically proven3636 Chronic urate nephropathy - no histology1625 Congenital dysplasia / hypoplasia1706 Congenital neurogenic bladder1660 Congenital pelvi-ureteric junction obstruction1673 Congenital vesico-ureteric junction obstruction2014 Drug-induced tubulointerstitial nephritis - histologically proven2005 Drug-induced tubulointerstitial nephritis - no histology1641 Dysplasia due to fetal ACE-inhibitor exposure1850 Enteric hyperoxaluria 1911 Familial interstitial nephropathy - histologically proven1907 Familial interstitial nephropathy - no histology1618 Familial reflux nephropathy1656 Glomerulocystic disease2257 Hantavirus nephropathy3662 Hypercalcaemic nephropathy 1813 Idiopathic retroperitoneal fibrosis2177 Lead induced nephropathy - histologically proven2165 Lead induced nephropathy - no histology2242 Leptospirosis1866 Magnesium ammonium phosphate (struvite) urolithiasis1723 Megacystis-megaureter1639 Multicystic dysplastic kidneys2098 Nephropathy due to aminoglycosides - histologically proven2080 Nephropathy due to aminoglycosides - no histology2112 Nephropathy due to amphotericin - histologically proven2108 Nephropathy due to amphotericin - no histology2033 Nephropathy due to analgesic drugs - histologically proven2022 Nephropathy due to analgesic drugs - no histology2051 Nephropathy due to ciclosporin - histologically proven2046 Nephropathy due to ciclosporin - no histology2131 Nephropathy due to cisplatin - histologically proven2120 Nephropathy due to cisplatin - no histology2154 Nephropathy due to lithium - histologically proven2149 Nephropathy due to lithium - no histology2079 Nephropathy due to tacrolimus - histologically proven2067 Nephropathy due to tacrolimus - no histology2288 Nephropathy related to HIV - histologically proven2274 Nephropathy related to HIV - no histology1799 Obstructive nephropathy due to bladder cancer1809 Obstructive nephropathy due to other malignancies1781 Obstructive nephropathy due to prostate cancer1775 Obstructive nephropathy due to prostatic hypertrophy1734 Oligomeganephronia2300 Other specific infection1687 Posterior urethral valves1602 Primary reflux nephropathy - sporadic2219 Radiation nephritis2226 Renal / perinephric abscess3627 Renal cysts and diabetes syndrome1747 Renal papillary necrosis - cause unknown1976 Renal sarcoidosis - histologically proven1969 Renal sarcoidosis - no histology2235 Renal tuberculosis3689 Retroperitoneal fibrosis secondary to drugs1821 Retroperitoneal fibrosis secondary to malignancies3670 Retroperitoneal fibrosis secondary to peri-aortitis2290 Schistosomiasis1694 Syndrome of agenesis of abdominal muscles - prune belly syndrome1897 Tubulointerstitial nephritis - histologically proven

141
II: TUBULOINTERSTITIAL DISEASE (continued) Code Primary renal disease
1884 Tubulointerstitial nephritis - no histology1930 Tubulointerstitial nephritis associated with autoimmune disease - histologically proven1924 Tubulointerstitial nephritis associated with autoimmune disease - no histology1953 Tubulointerstitial nephritis with uveitis (TINU) - histologically proven1948 Tubulointerstitial nephritis with uveitis (TINU) - no histology1878 Uric acid urolithiasis2261 Xanthogranulomatous pyelonephritis
III: SYSTEMIC DISEASE AFFECTING THE KIDNEY Code Primary renal disease
2513 AA amyloid secondary to chronic inflammation2392 Ageing kidney - no histology2521 AL amyloid secondary to plasma cell dyscrasia2448 Atheroembolic renal disease - histologically proven2430 Atheroembolic renal disease - no histology2623 Atypical haemolytic uraemic syndrome (HUS) - diarrhoea negative2482 Cardiorenal syndrome2363 Chronic hypertensive nephropathy - histologically proven2359 Chronic hypertensive nephropathy - no histology2652 Congenital haemolytic uraemic syndrome (HUS) 2328 Diabetic nephropathy in type I diabetes - histologically proven2316 Diabetic nephropathy in type I diabetes - no histology2344 Diabetic nephropathy in type II diabetes - histologically proven2337 Diabetic nephropathy in type II diabetes - no histology2566 Familial AA amyloid secondary to familial Mediterranean fever / TRAPS (Hibernian fever) - histologically proven2550 Familial AA amyloid secondary to familial Mediterranean fever / TRAPS (Hibernian fever) - no histology2545 Familial amyloid secondary to protein mutations - histologically proven2532 Familial amyloid secondary to protein mutations - no histology2668 Familial haemolytic uraemic syndrome (HUS)2675 Familial thrombotic thrombocytopenic purpura (TTP)2453 Fibromuscular dysplasia of renal artery2610 Haemolytic uraemic syndrome (HUS) - diarrhoea associated2647 Haemolytic uraemic syndrome (HUS) secondary to systemic disease2495 Hepatorenal syndrome2606 Immunotactoid / fibrillary nephropathy2407 Ischaemic nephropathy - no histology2411 Ischaemic nephropathy / microvascular disease - histologically proven2597 Light chain deposition disease2385 Malignant hypertensive nephropathy / accelerated hypertension nephropathy - histologically proven2371 Malignant hypertensive nephropathy / accelerated hypertension nephropathy - no histology2584 Myeloma cast nephropathy - histologically proven2578 Myeloma kidney - no histology2681 Nephropathy due to pre-eclampsia / eclampsia2509 Renal amyloidosis2469 Renal arterial thrombosis / occlusion2424 Renal artery stenosis2476 Renal vein thrombosis2702 Sickle cell nephropathy - histologically proven2699 Sickle cell nephropathy - no histology2634 Thrombotic thrombocytopenic purpura (TTP)
IV: FAMILIAL / HEREDITARY NEPHROPATHIES Code Primary renal disease
3071 Alagille syndrome2760 Alport syndrome - histologically proven2756 Alport syndrome - no histology3118 Apparent mineralocorticoid excess2718 Autosomal dominant (AD) polycystic kidney disease2725 Autosomal dominant (AD) polycystic kidney disease type I2739 Autosomal dominant (AD) polycystic kidney disease type II2741 Autosomal recessive (AR) polycystic kidney disease3085 Bartter syndrome2773 Benign familial haematuria3322 Branchio-oto-renal syndrome2794 Cystic kidney disease2964 Cystinosis

142
IV: FAMILIAL / HEREDITARY NEPHROPATHIES (continued) Code Primary renal disease
2955 Cystinuria2929 Dent disease3028 Distal renal tubular acidosis (RTA) - type I3037 Distal renal tubular acidosis with sensorineural deafness - gene mutations3230 Fabry disease - histologically proven3224 Fabry disease - no histology3173 Familial hypercalciuric hypocalcaemia3160 Familial hypocalciuric hypercalcaemia3187 Familial hypomagnesaemia3379 Familial nephropathy3314 Frasier syndrome3092 Gitelman syndrome3125 Glucocorticoid suppressible hyperaldosteronism3305 Horse-shoe kidney2993 Hypophosphataemic rickets autosomal recessive (AR)2986 Hypophosphataemic rickets X-linked (XL)3139 Inherited / genetic diabetes mellitus type II2940 Inherited aminoaciduria2972 Inherited renal glycosuria3351 Lawrence-Moon-Biedl / Bardet-Biedl syndrome3059 Lesch Nyhan syndrome - hypoxanthine guanine phosphoribosyl transferase deficiency 3102 Liddle syndrome2938 Lowe syndrome (oculocerebrorenal syndrome)2804 Medullary cystic kidney disease type I2815 Medullary cystic kidney disease type II3295 Medullary sponge kidneys3367 Mitochondrial cytopathy3253 Nail-patella syndrome3044 Nephrogenic diabetes insipidus2836 Nephronophthisis2843 Nephronophthisis - type 1 (juvenile type)2858 Nephronophthisis - type 2 (infantile type)2862 Nephronophthisis - type 3 (adolescent type)2870 Nephronophthisis - type 4 (juvenile type)2889 Nephronophthisis - type 52891 Nephronophthisis - type 63063 Phosphoribosyl pyrophosphate synthetase (PRPPS) superactivity2901 Primary Fanconi syndrome3194 Primary hyperoxaluria3207 Primary hyperoxaluria type I3211 Primary hyperoxaluria type II3731 Primary hyperoxaluria type III3000 Primary renal tubular acidosis (RTA)3016 Proximal renal tubular acidosis (RTA) - type II3141 Pseudohypoaldosteronism type 13156 Pseudohypoaldosteronism type 2 (Gordon syndrome)3658 Renal coloboma syndrome3269 Rubinstein-Taybi syndrome2787 Thin basement membrane disease3346 Townes-Brocks syndrome3276 Tuberous sclerosis2917 Tubular disorder as part of inherited metabolic diseases2827 Uromodulin-associated nephropathy (familial juvenile hyperuricaemic nephropathy)3282 von Hippel-Lindau disease3333 Williams syndrome3248 Xanthinuria
V: MISCELLANEOUS RENAL DISORDERS Code Primary renal disease
3442 Acute cortical necrosis3380 Acute kidney injury3403 Acute kidney injury due to circulatory failure3398 Acute kidney injury due to hypovolaemia 3435 Acute kidney injury due to nephrotoxicity3426 Acute kidney injury due to rhabdomyolysis3419 Acute kidney injury due to sepsis3457 Acute pyelonephritis

143
V: MISCELLANEOUS RENAL DISORDERS (continued) Code Primary renal disease
3564 Chronic kidney disease (CKD) / chronic renal failure (CRF) - aetiology uncertain / unknown - histologically proven3555 Chronic kidney disease (CKD) / chronic renal failure (CRF) - aetiology uncertain / unknown - no histology3529 Chronic kidney disease (CKD) / chronic renal failure (CRF) caused by tumour nephrectomy3540 Chronic kidney disease (CKD) / chronic renal failure (CRF) due to donor nephrectomy3538 Chronic kidney disease (CKD) / chronic renal failure (CRF) due to traumatic loss of kidney3708 Chronic renal failure3643 Chronic renal failure due to systemic infection3572 Haematuria and proteinuria - no histology3712 Isolated haematuria - no histology3720 Isolated proteinuria - no histology3461 Kidney tumour3501 Mesoblastic nephroma - histologically proven3474 Renal cell carcinoma - histologically proven3691 Renal failure3517 Single kidney identified in adulthood3488 Transitional cell carcinoma - histologically proven3490 Wilms tumour - histologically proven

144
Appendix 3 - Grouping of causes of death
1994 1995 COD Cause of death code code group
0 0 XI Cause of death uncertain / not determined 11 11 I Myocardial ischaemia and infarction 12 12 X Hyperkalaemia 13 13 X Haemorrhagic pericarditis 14 14 II Other causes of cardiac failure 15 15 III Cardiac arrest / sudden death; other cause or unknown 16 16 II Hypertensive cardiac failure 17 17 X Hypokalaemia 18 18 II Fluid overload / pulmonary oedema 21 21 X Pulmonary embolus 22 22 IV Cerebro-vascular accident, other cause or unspecified 23 23 X Gastro-intestinal haemorrhage 24 24 X Haemorrhage from graft site 25 25 X Haemorrhage from vascular access or dialysis circuit 26 26 X Haemorrhage from ruptured vascular aneurysm (not code 22 or 23) 27 27 X Haemorrhage from surgery (not code 23, 24 or 26) 28 28 X Other haemorrhage (not codes 23-27) 29 29 X Mesenteric infarction 31 31 V Pulmonary infection (bacterial - not code 73) 32 32 V Pulmonary infection (viral) 33 33 V Pulmonary infection (fungal or protozoal; parasitic) 34 V Infections elsewhere except virus hepatitis 35 35 V Septicaemia 36 36 V Tuberculosis (lung) 37 37 V Tuberculosis (elsewhere) 38 38 V Generalized viral infection 39 39 V Peritonitis (all causes except for Peritoneal Dialysis) 41 41 X Liver disease due to hepatitis B virus 42 42 X Liver disease due to other viral hepatitis 43 43 X Liver disease due to drug toxicity 44 44 X Cirrhosis - not viral 45 45 X Cystic liver disease 46 46 X Liver failure - cause unknown 51 51 VI Patient refused further treatment for ESRF 52 52 VI Suicide 53 53 VII ESRF treatment ceased for any other reason 54 VII ESRF treatment withdrawn for medical reasons 61 X Uremia caused by graft failure 62 62 X Pancreatitis 63 63 X Bone marrow depression 64 64 VIII Cachexia 66 66 IX Malignant disease, possibly induced by immunosuppressive therapy 67 67 IX Malignant disease: solid tumors except those of 66 68 IX Malignant disease: lymphoproliferative disorders except those of 66 69 69 X Dementia 70 70 V Peritonitis (sclerosing, with peritoneal dialysis) 71 71 X Perforation of peptic ulcer 72 72 X Perforation of colon 73 73 X Chronic obstructive airways disease 81 81 X Accident related to ESRF treatment (not code 25) 82 82 X Accident unrelated to ESRF treatment 100 V Peritonitis (bacterial, with peritoneal dialysis) 101 V Peritonitis (fungal, with peritoneal dialysis) 102 V Peritonitis (due to other cause, with peritoneal dialysis) 99 99 X Other identified cause of death
COD group: I: myocardial ischaemia and infarction; II: heart failure; III: cardiac arrest, other cause / unknown; IV: cerebrovascular accident;V: infection; VI: suicide / refusal treatment; VII: withdrawal; VIII: cachexia; IX: malignancies; X: miscellaneous; XI: unknown / unavailable

145
Appendix 4 - Event type codes
Event Event code
001 Home haemodialysis 002 Centre haemodialysis 003 Haemofiltration 004 Haemodiafiltration 009 Haemodialysis, type unknown
011 Continuous Ambulatory Peritoneal Dialysis (CAPD) 012 Intermittent Ambulatory Peritoneal Dialysis (CAPD) 013 Continuous Automated Peritoneal Dialysis (APD) 014 Intermittent Automated Peritoneal Dialysis (APD) 019 Peritoneal Dialysis, type unknown
090 Unknown dialysis 020 Transplantation, living donor 021 Transplantation, living related donor 022 Transplantation, living unrelated donor 023 Transplantation, deceased donor 029 Transplantation, donor type unknown 060 Transplantation follow-up (still functioning) 061 Graft failure 031 Treatment type unknown / unavailable 051 Recovery Renal Function 052 Death 053 Transfer out to other registry 054 Transfer in from other registry 055 Lost to follow-up
071 Limited care / stopped treatment (without recovery of renal function)

146
Appendix 5 - Renal registries contributing data for the different types of analyses
Registries providing Registries providing Registries providing individual patient data aggregated data paedriatic data
Incidence Survival Expected Incidence Incidence and remaining and and prevalence lifetimes prevalence prevalence
Albania - - - + -Austria + + + - +Belarus - - - + -Belgium, Dutch-speaking + + + - -Belgium, French-speaking + + + - -Bosnia and Herzegovina + - - - +Bulgaria - - - + -Croatia - - - + -Cyprus - - - + -Czech Republic - - - + -Denmark + + + - +Estonia + - - - +Finland + + + - +France + + + - +Georgia - - - + -Greece + + + - +Iceland + + + - +Israel - - - + -Italy (5 of 20 regions) - - - + -Latvia - - - + -Lithuania - - - + -Macedonia - - - + -Norway + + + - +Poland - - - + -Portugal - - - + -Romania + - - - +Russia - - - + -Serbia + - - - +Slovakia - - - + -Spain, Andalusia + + + + +Spain, Aragon + + + + +Spain, Asturias + + + + +Spain, Balearic Islands - - - + -Spain, Basque country + + + + +Spain, Canary Islands - - - + -Spain, Cantabria + + + + -Spain, Castile and León + + + + -Spain, Castile-La Mancha + + + + -Spain, Catalonia + + + + +Spain, Ceuta - - - + -Spain, Extremadura + + + + +Spain, Galicia + + + + +Spain, Melilla - - - + -Spain, Community of Madrid + + + + +Spain, Region of Murcia + - - + +Spain, Navarre + - - + -Spain, La Rioja - - - + -Spain, Valencian region + + + + +Sweden + + + - +Switzerland + - - - +the Netherlands + + + - +Tunisia, Sfax region - - - + -Turkey - - - + -Ukraine - - - + -United Kingdom, England + + + - -United Kingdom, Northern Ireland + + + - -United Kingdom, Scotland + + + - +United Kingdom, Wales + + + - -


ERA-EDTA RegistryAcademic Medical CenterDepartment of Medical InformaticsPO Box 227001100 DE Amsterdamthe Netherlands
ISBN 978-90-817480-8-7
August 2017
Annual Report 2015
ERA-ED
TA Registry
AnnualReport
2015
ERA-EDTA Registry
www.era-edta-reg.org
The ERA-EDTA Registry is an o� cial body of the ERA-EDTA