Embed Size (px)
DESCRIPTION
Present & Potential Future Contributions of Sulfate, Black & Organic Carbon Aerosols from China to Global Air Quality, Premature Mortality & Radiative Forcing. Eri Saikawa 1 , Vaishali Naik 1 , Larry W. Horowitz 2 , Junfeng Liu 1 , Denise Mauzerall 1 1 Princeton University, Princeton, NJ, USA - PowerPoint PPT Presentation
Citation preview

Present & Potential Future Contributions of Sulfate, Present & Potential Future Contributions of Sulfate, Black & Organic Carbon Aerosols from China to Global Black & Organic Carbon Aerosols from China to Global
Air Quality, Premature Mortality & Radiative ForcingAir Quality, Premature Mortality & Radiative Forcing
Eri SaikawaEri Saikawa11, Vaishali Naik, Vaishali Naik11, Larry W. Horowitz, Larry W. Horowitz22, , Junfeng LiuJunfeng Liu11, Denise Mauzerall, Denise Mauzerall11
11Princeton University, Princeton, NJ, USAPrinceton University, Princeton, NJ, USA22Geophysical Fluid Dynamics Laboratory, Princeton, NJ, USAGeophysical Fluid Dynamics Laboratory, Princeton, NJ, USA
– – Submitted to Submitted to Atmospheric EnvironmentAtmospheric Environment – –
December 19, 2008December 19, 2008AGU A54CAGU A54C
General Contributions: Chemistry and Composition IIIGeneral Contributions: Chemistry and Composition III

BackgroundBackground
• Fine particulate matter PMFine particulate matter PM2.5 2.5 has harmful effects on has harmful effects on
global air quality & human healthglobal air quality & human health
• PMPM2.5 2.5 affects radiative forcing on climateaffects radiative forcing on climate
• China is a major emitter of PMChina is a major emitter of PM2.5 2.5 and its precursorsand its precursors
Beijing, China Beijing, China NYTimes, December 29, 2007NYTimes, December 29, 2007

Adverse Health Impacts of PMAdverse Health Impacts of PM2.52.5
• Association between PMAssociation between PM2.52.5 ambient concentrations and ambient concentrations and
increased risk of adverse health impactsincreased risk of adverse health impacts– Are linearAre linear– Have no thresholdHave no threshold
• Mortality associated with 10 Mortality associated with 10 µg/mµg/m33 increase in increase in PMPM2.52.5 occur occur
within 2 years of exposure – reductions in air pollution can within 2 years of exposure – reductions in air pollution can improve public health almost immediatelyimprove public health almost immediately
[Pope, 2002, Schwartz et al.,2008][Pope, 2002, Schwartz et al.,2008]
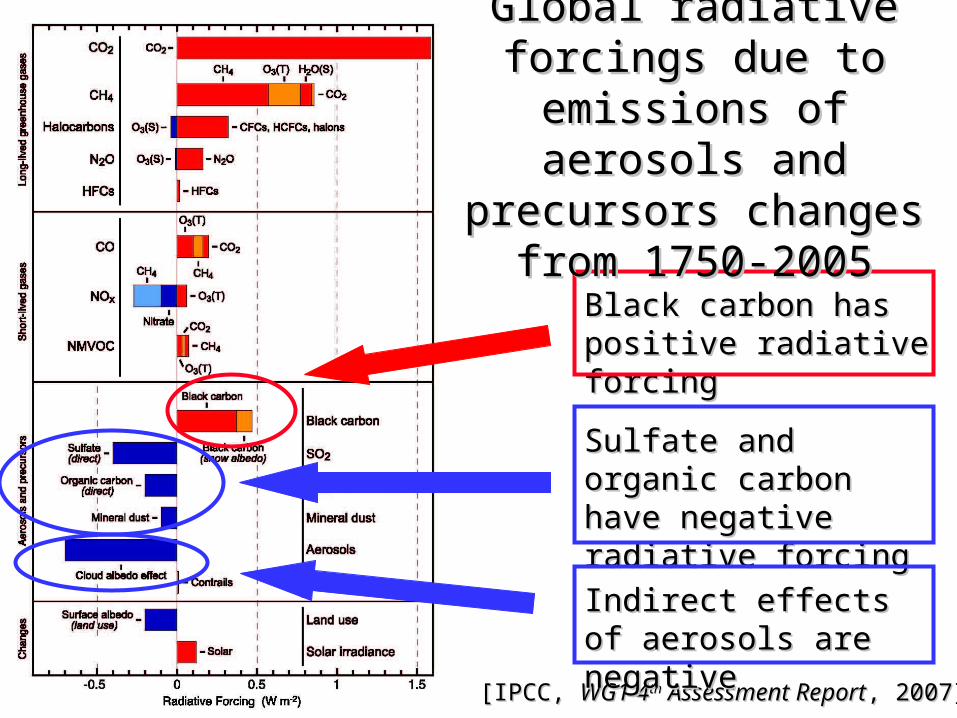
Black carbon has Black carbon has positive radiative forcingpositive radiative forcing
Sulfate and organic Sulfate and organic carbon have negative carbon have negative radiative forcingradiative forcing
Global radiative forcings Global radiative forcings due to emissions of due to emissions of
aerosols and precursors aerosols and precursors changes from 1750-2005changes from 1750-2005
[IPCC, [IPCC, WG1 4WG1 4thth Assessment Report Assessment Report, 2007], 2007]
Indirect effects of Indirect effects of aerosols are negativeaerosols are negative
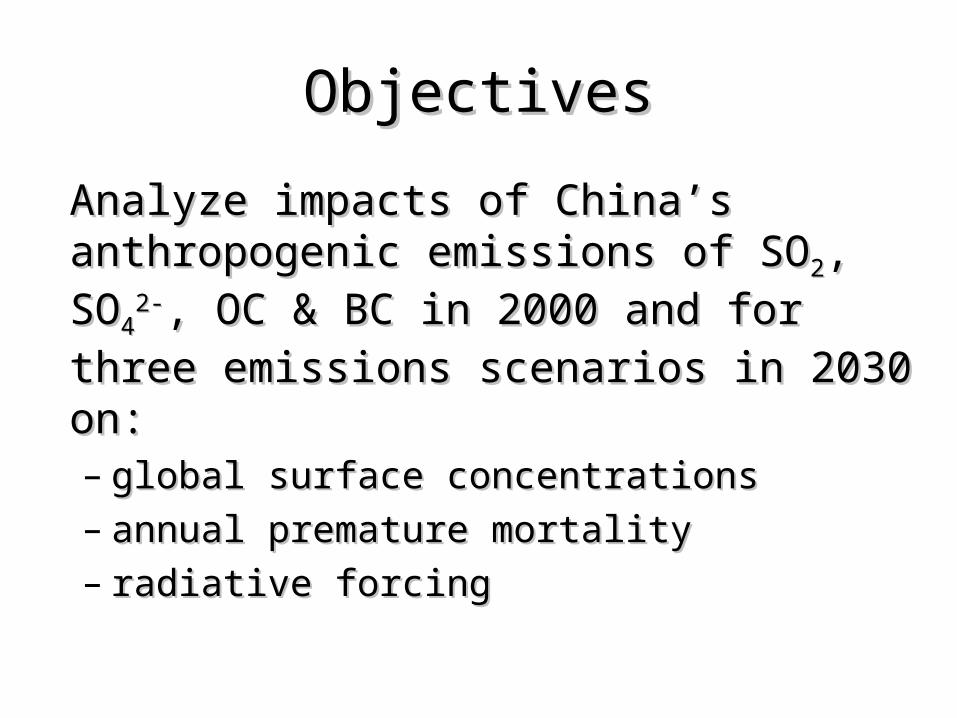
ObjectivesObjectives
Analyze impacts of China’s anthropogenic Analyze impacts of China’s anthropogenic emissions of SOemissions of SO22, SO, SO44
2-2-, OC & BC in 2000 and , OC & BC in 2000 and
for three emissions scenarios in 2030 on:for three emissions scenarios in 2030 on:– global surface concentrationsglobal surface concentrations– annual premature mortality annual premature mortality – radiative forcingradiative forcing
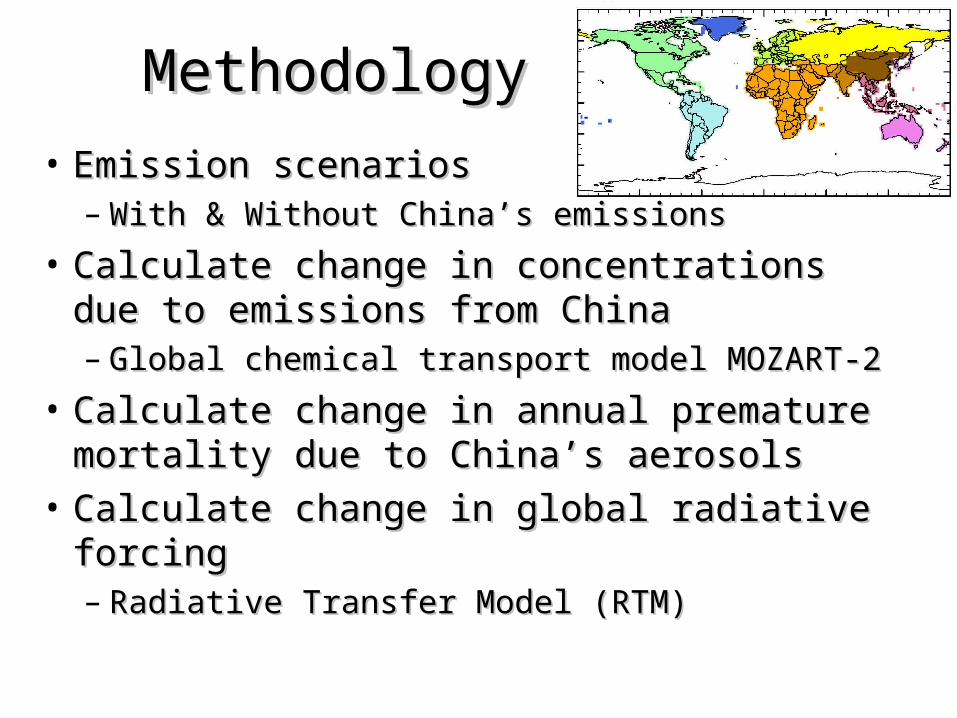
MethodologyMethodology
• Emission scenariosEmission scenarios– With & Without China’s emissionsWith & Without China’s emissions
• Calculate change in concentrations due to Calculate change in concentrations due to emissions from Chinaemissions from China– Global chemical transport model MOZART-2Global chemical transport model MOZART-2
• Calculate change in annual premature Calculate change in annual premature mortality due to China’s aerosolsmortality due to China’s aerosols
• Calculate change in global radiative forcing Calculate change in global radiative forcing – Radiative Transfer Model (RTM)Radiative Transfer Model (RTM)

Emission ScenariosEmission Scenarios
2000: Baseline2000: Baseline
• CLE (Current Legislation, IIASA) CLE (Current Legislation, IIASA)
2030: Future Scenarios2030: Future Scenarios
• BAU (Business-As-Usual, IPCC SRES A2)BAU (Business-As-Usual, IPCC SRES A2)
• CLE (Current Legislation, IIASA)CLE (Current Legislation, IIASA)
• MFR (Maximum Feasible Reduction, IIASA)MFR (Maximum Feasible Reduction, IIASA)
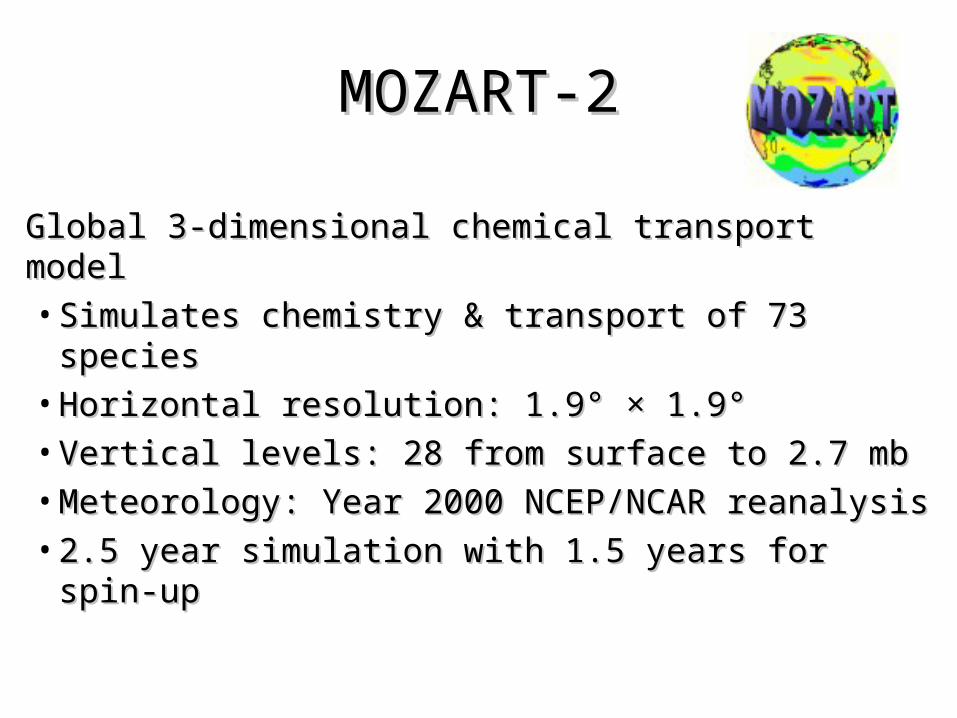
MOZART-2MOZART-2
Global 3-dimensional chemical transport modelGlobal 3-dimensional chemical transport model
• Simulates chemistry & transport of 73 speciesSimulates chemistry & transport of 73 species
• Horizontal resolution: 1.9° × 1.9° Horizontal resolution: 1.9° × 1.9°
• Vertical levels: 28 from surface to 2.7 mbVertical levels: 28 from surface to 2.7 mb
• Meteorology: Year 2000 NCEP/NCAR Meteorology: Year 2000 NCEP/NCAR reanalysis reanalysis
• 2.5 year simulation with 1.5 years for spin-up2.5 year simulation with 1.5 years for spin-up

Premature Mortality CalculationPremature Mortality Calculation
)()()()( RCrRMRPOPRDeaths PWb
[CIESIN, 2000]
Mortality Rate of people Mortality Rate of people 30 years or older30 years or older
Concentration-response relationship Concentration-response relationship (4%) based on adjusted mortality (4%) based on adjusted mortality relative risk associated with a relative risk associated with a 1010µµg/mg/m33 change in PM change in PM2.52.5 for all- for all-
cause mortality.cause mortality. [Pope et al., 2005][Pope et al., 2005]
[WHO, 2000][WHO, 2000]
[µg m[µg m-3-3]]Surface SOSurface SO44
2-2- concentrations resulting from concentrations resulting from
China’s anthro emissions in 2000China’s anthro emissions in 2000
Gridded population of the worldGridded population of the world
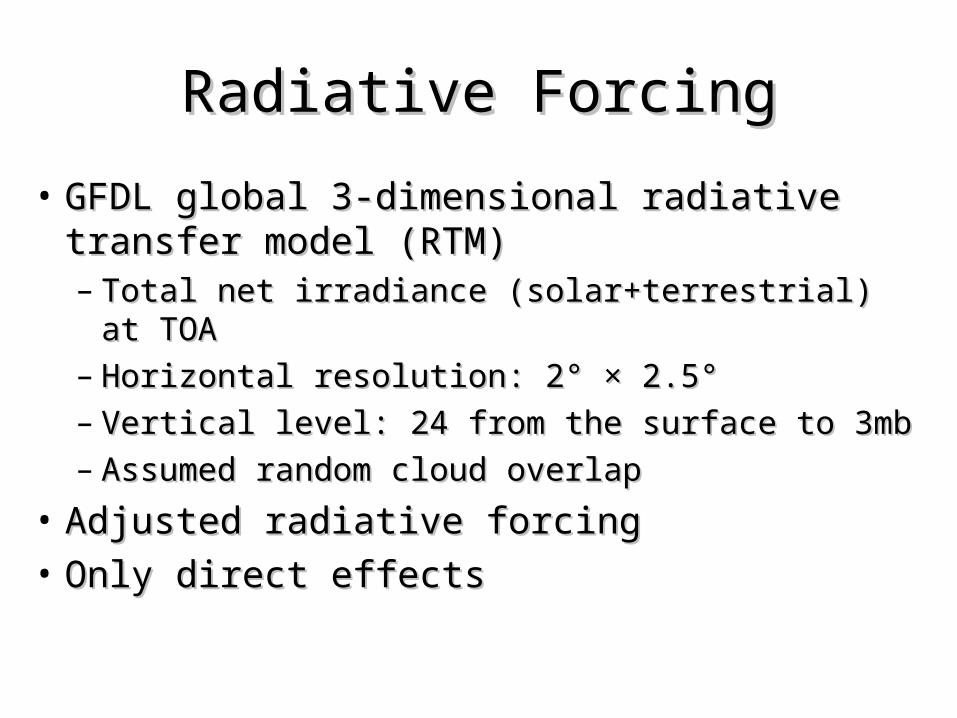
Radiative ForcingRadiative Forcing
• GFDL global 3-dimensional radiative transfer GFDL global 3-dimensional radiative transfer model (RTM)model (RTM)– Total net irradiance (solar+terrestrial) at TOATotal net irradiance (solar+terrestrial) at TOA– Horizontal resolution: 2° × 2.5°Horizontal resolution: 2° × 2.5°– Vertical level: 24 from the surface to 3mbVertical level: 24 from the surface to 3mb– Assumed random cloud overlapAssumed random cloud overlap
• Adjusted radiative forcingAdjusted radiative forcing
• Only direct effectsOnly direct effects
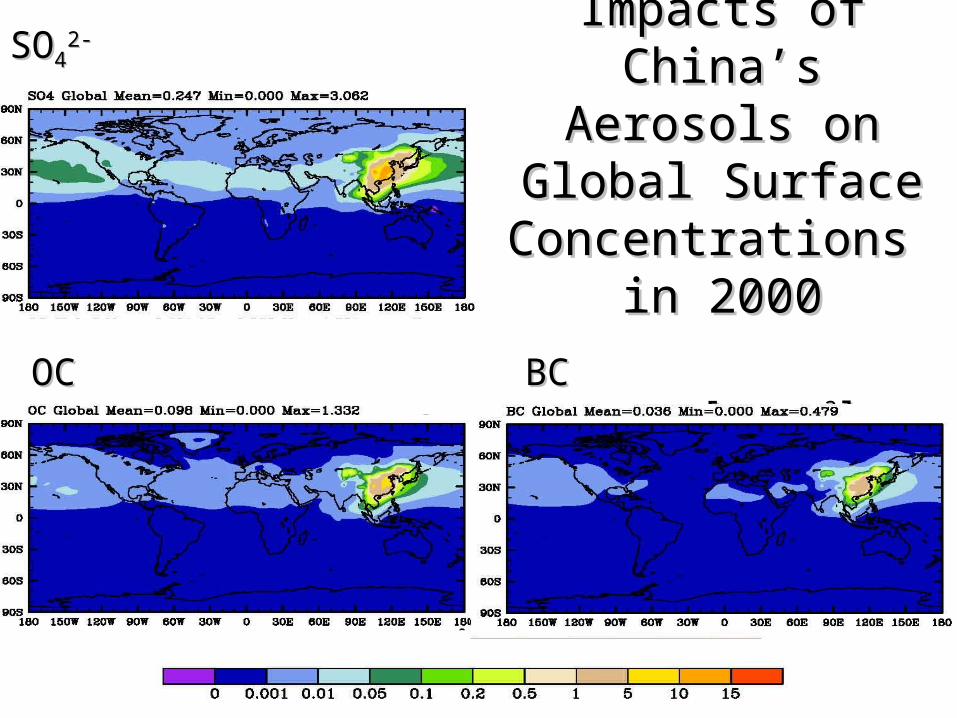
Impacts of China’s Impacts of China’s Aerosols on Global Aerosols on Global
Surface Surface Concentrations Concentrations
in 2000in 2000 [[µg mµg m-3-3]]
SOSO442-2-
OCOC BCBC

Impacts of China’s Aerosols on Impacts of China’s Aerosols on Global Premature MortalityGlobal Premature Mortality
200020002030 2030 2030 2030 2030 2030
BAUBAU CLECLE MFRMFR
ChinaChina 474,250474,250 723,920723,920 495,250495,250 243,050243,050
Korea & JapanKorea & Japan 11,28011,280 13,39013,390 10,24010,240 3,8303,830
S. East AsiaS. East Asia 10,27010,270 20,34020,340 13,14013,140 4,9804,980
South AsiaSouth Asia 830830 1,9801,980 1,1601,160 430430
North AmericaNorth America 320320 590590 400400 120120
Rest of the Rest of the worldworld 690690 1,2901,290 860860 270270

Impacts of China’s Aerosols on Impacts of China’s Aerosols on Global Radiative Forcings in 2000 [Global Radiative Forcings in 2000 [mWmmWm-2-2]]
SOSO442-2- OCOC
BCBC NetNet

Impacts of China’s Aerosols on Impacts of China’s Aerosols on Global Radiative ForcingGlobal Radiative Forcing
Unit: mWmUnit: mWm-2-2
China’s SOChina’s SO442-2-, OC & BC, OC & BC create net create net
NEGATIVE radiative forcingNEGATIVE radiative forcing
2000200020302030 20302030 20302030
BAUBAU CLECLE MFRMFR
SulfateSulfate -108-108 -154-154 -109-109 -33-33OCOC -7-7 -11-11 -5-5 -4-4BCBC 4242 7070 3232 2121NetNet -74-74 -97-97 -83-83 -15-15

Impacts of China’s Aerosols in 2030Impacts of China’s Aerosols in 2030
PessimisticPessimistic OptimisticOptimistic
BAUBAU CLECLE MFRMFR
Premature Premature DeathsDeaths
ChinaChina 723,900723,900 495,300495,300 243,100243,100Rest of Rest of the Worldthe World 37,60037,600 25,80025,800 9,6009,600
Net Global Radiative Net Global Radiative Forcing [mWmForcing [mWm-2-2]] -97-97 -83-83 -15-15

ConclusionConclusion
• China’s aerosols have large impacts on China’s aerosols have large impacts on global air quality and premature mortalityglobal air quality and premature mortality
• China’s sulfate produce large negative China’s sulfate produce large negative forcingforcing
Simultaneously reducing:Simultaneously reducing:1.1. Aerosols – to protect health Aerosols – to protect health 2.2. GHGs – to protect climate GHGs – to protect climate is essential!is essential!

AcknowledgmentsAcknowledgments
• Dr. Arlene Fiore, GFDLDr. Arlene Fiore, GFDL
• Geophysical Fluid Dynamics Laboratory Geophysical Fluid Dynamics Laboratory (GFDL) for computational resources(GFDL) for computational resources
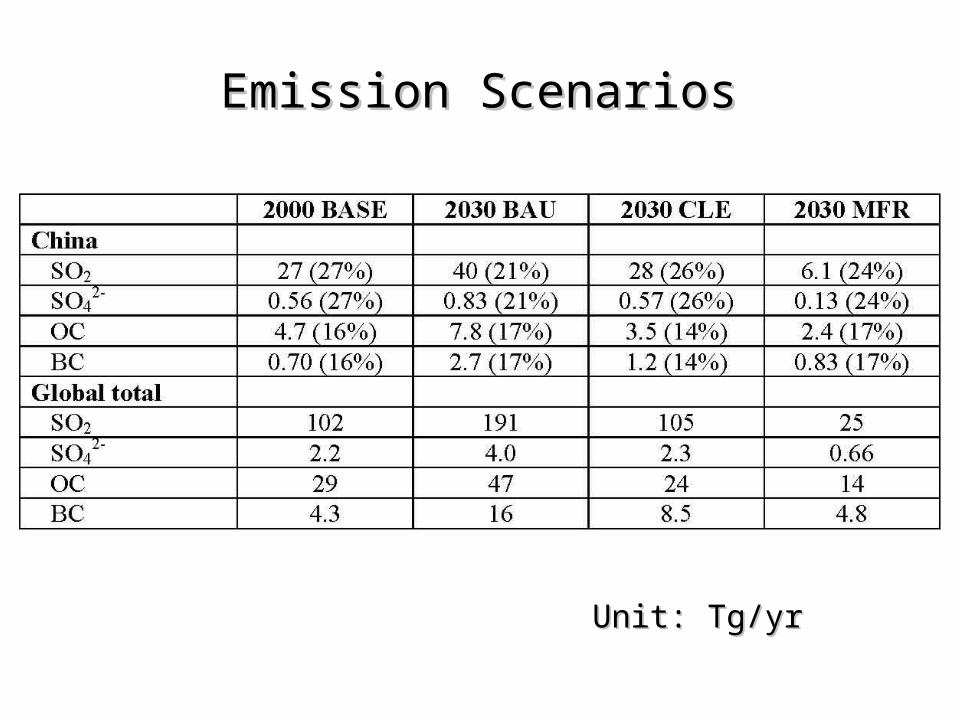
Emission ScenariosEmission Scenarios
Unit: Tg/yrUnit: Tg/yr
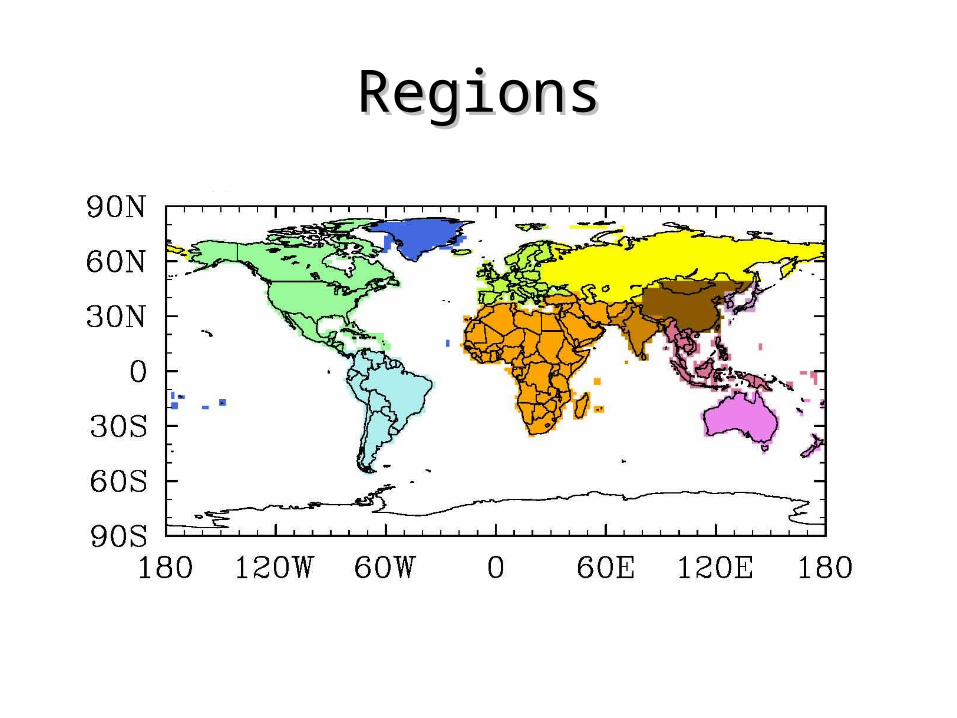
RegionsRegions

Impacts of China’s Impacts of China’s Aerosols on Global Aerosols on Global
Surface Surface Concentrations Concentrations
in 2030 BAUin 2030 BAU
[[µg mµg m-3-3]]
SOSO442-2-
OCOC BCBC

Impacts of China’s Impacts of China’s Aerosols on Global Aerosols on Global
Surface Surface Concentrations Concentrations
in 2030 CLEin 2030 CLE [[µg mµg m-3-3]]
SOSO442-2-
OCOC BCBC

Impacts of China’s Impacts of China’s Aerosols on Global Aerosols on Global
Surface Surface Concentrations Concentrations
in 2030 MFRin 2030 MFR [[µg mµg m-3-3]]
SOSO442-2-
OCOC BCBC

Impacts of China’s Aerosols on Impacts of China’s Aerosols on Global Radiative Forcings in 2030 BAUGlobal Radiative Forcings in 2030 BAU
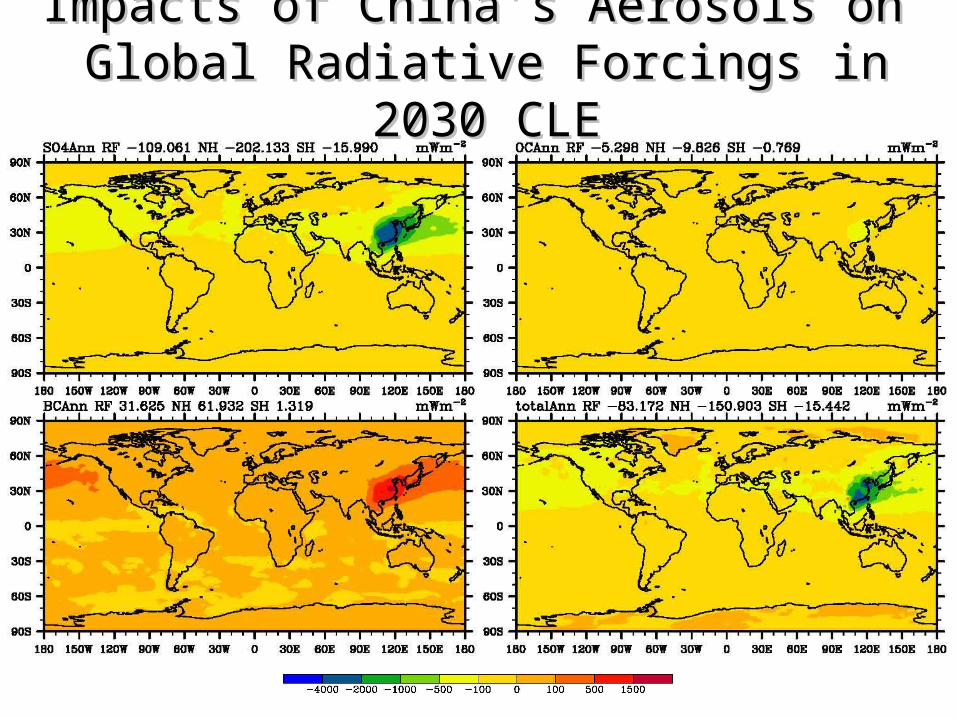
Impacts of China’s Aerosols on Impacts of China’s Aerosols on Global Radiative Forcings in 2030 CLEGlobal Radiative Forcings in 2030 CLE

Impacts of China’s Aerosols on Impacts of China’s Aerosols on Global Radiative Forcings in 2030 MFRGlobal Radiative Forcings in 2030 MFR


![Gastric carcinogenesis and the cancer stem cell hypothesis...2009/12/02 · Y. Saikawa et al.: Review of gastric cancer stem cell hypothesis 13 enhanced by tissue damage [16]. Wright](https://img.pdfslide.net/doc/110x75/6081af66a347316b56093134/gastric-carcinogenesis-and-the-cancer-stem-cell-hypothesis-20091202-y.jpg)