Embed Size (px)
Citation preview
Eriola Zhuri, University of Durresi ’’Aleksander Moisiu‘‘, AlbaniaVeledin Çako, Dep.Physics, University of Vlora ’’Ismail Qemali‘‘,
AlbaniaFatbardha Babani, Biotechnology Department, University of
Tirana, AlbaniaLiri Dinga, Botanical Garden, University of Tirana, Albania
Theodhor Karaja, Physics Department, University of Tirana, Albania
1st Winter Summit at the Anatolian Summit (WISAS)
February 23-26, 2012 Erzurum/Turkey
Chlorophyll (Chlorophyll (ChlChl) fluorescence signatures of leaves ) fluorescence signatures of leaves have been widely applied as non-invasive have been widely applied as non-invasive techniques for the techniques for the in vivoin vivo analysis of plant stress. analysis of plant stress.
The Chl fluorescence provides ample information The Chl fluorescence provides ample information on the photosynthetic apparatus.on the photosynthetic apparatus.
The high resolution multi-colour Chl fluorescence The high resolution multi-colour Chl fluorescence imaging techniques for whole leaves offer the new imaging techniques for whole leaves offer the new possibility to study the distribution and patchiness possibility to study the distribution and patchiness of fluorescence signatures over the whole leaf area. of fluorescence signatures over the whole leaf area.
Various ratios of the Chl fluorescence determined Various ratios of the Chl fluorescence determined from the induction kinetics can be used as from the induction kinetics can be used as indicators of the stress effect to the photosynthetic indicators of the stress effect to the photosynthetic apparatus.apparatus.
IntroductioIntroductionn
To evaluate To evaluate
Efficiency of photosynthetic apparatus of Efficiency of photosynthetic apparatus of analyzed endemic plants grown in different analyzed endemic plants grown in different environmental stress conditions via environmental stress conditions via
chlorophyll fluorescence imaging during chlorophyll fluorescence imaging during induction kinetics and induction kinetics and
various fluorescence ratios various fluorescence ratios
which describe the photosynthetic light which describe the photosynthetic light processes and quantum conversion of light.processes and quantum conversion of light.
ObjectiveObjective
Characterize the effect of environmental Characterize the effect of environmental factors on photosynthetic performance factors on photosynthetic performance
as well as as well as Estimate the variations between endemic Estimate the variations between endemic
plants in stress conditionsplants in stress conditions
by by differences on imaging of chlorophyll differences on imaging of chlorophyll
fluorescence signature and fluorescence signature and photosynthetic pigment metabolism of leavesphotosynthetic pigment metabolism of leaves
AimAim
MATERIALS AND MATERIALS AND METHODSMETHODS
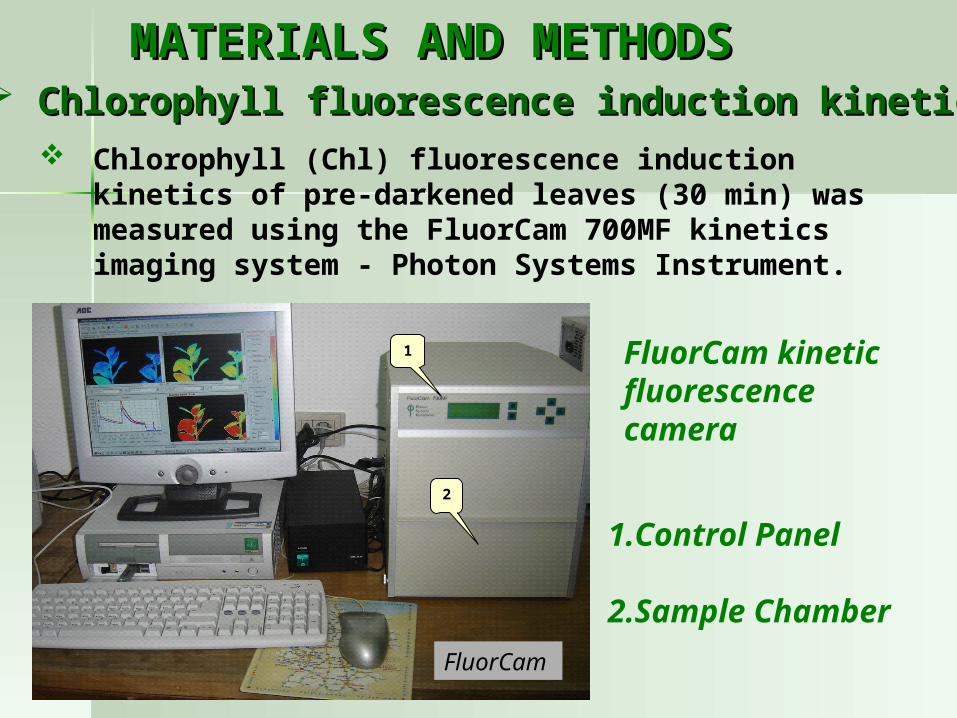
Chlorophyll (Chl) fluorescence induction kinetics of pre-darkened leaves (30 min) was measured using the FluorCam 700MF kinetics imaging system - Photon Systems Instrument.
FluorCam kinetic fluorescence camera
1.Control Panel
2.Sample Chamber
FluorCam
1
2
Chlorophyll fluorescence induction kineticsChlorophyll fluorescence induction kinetics
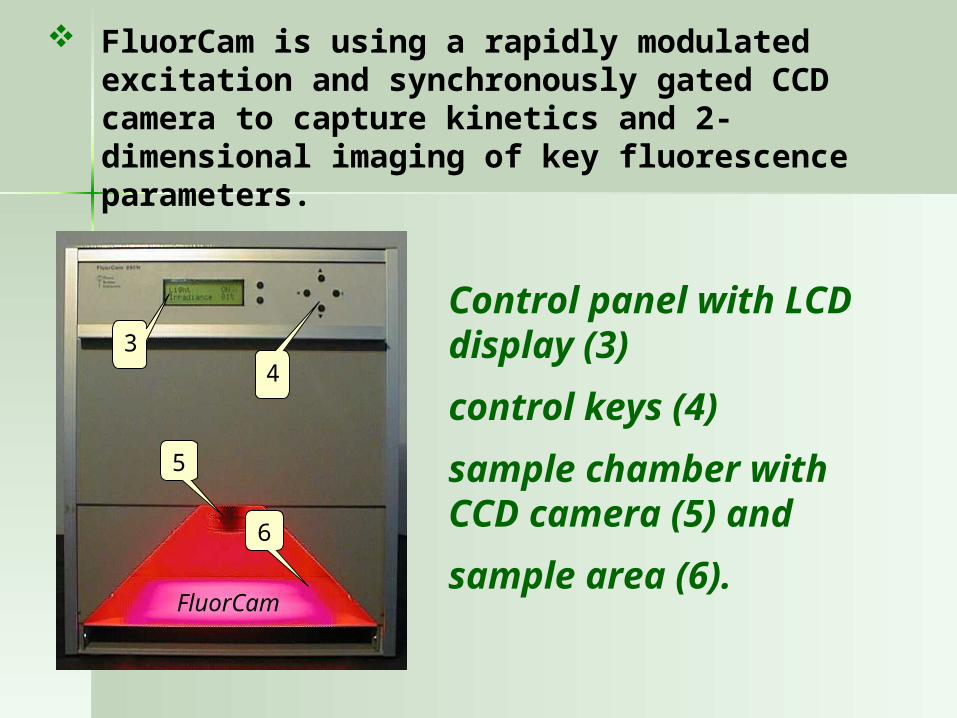
FluorCam is using a rapidly modulated excitation and synchronously gated CCD camera to capture kinetics and 2-dimensional imaging of key fluorescence parameters.
Control panel with LCD display (3)
control keys (4)
sample chamber with CCD camera (5) and
sample area (6).
34
6
5
FluorCam
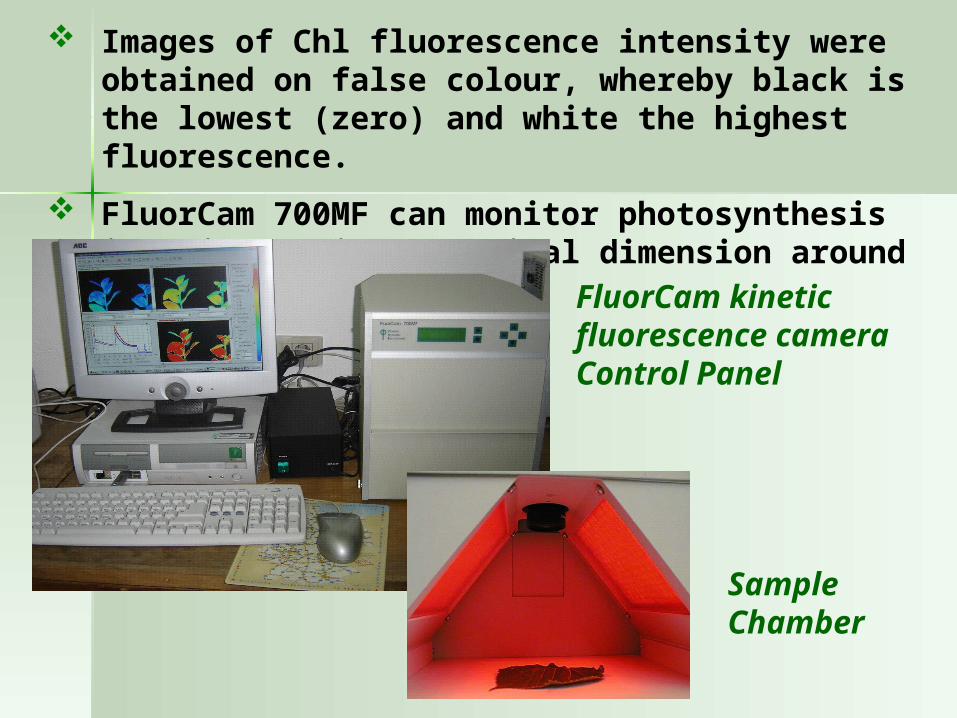
Images of Chl fluorescence intensity were obtained on false colour, whereby black is the lowest (zero) and white the highest fluorescence.
FluorCam 700MF can monitor photosynthesis in objects with a maximal dimension around 10 cm.
FluorCam kinetic fluorescence cameraControl Panel
Sample Chamber
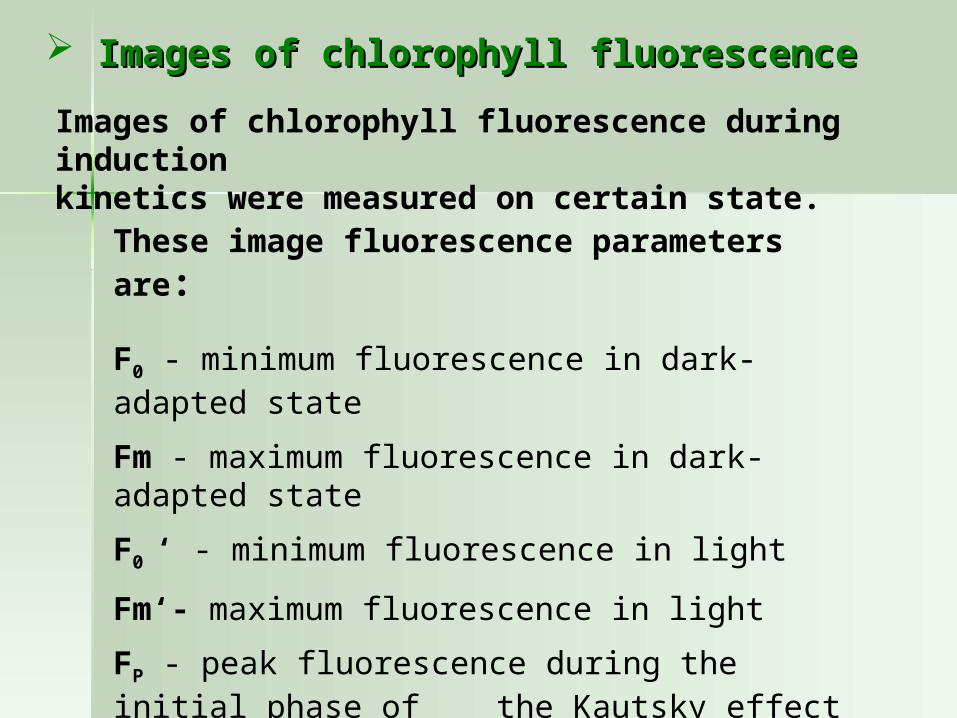
Images of chlorophyll fluorescence during inductionkinetics were measured on certain state.
Images of chlorophyll fluorescence Images of chlorophyll fluorescence
These image fluorescence parameters are:
F0 - minimum fluorescence in dark-adapted state
Fm - maximum fluorescence in dark-adapted state
F0 ‘ - minimum fluorescence in light
Fm‘- maximum fluorescence in light
FP - peak fluorescence during the initial phase of the Kautsky effect
FS - steady-state fluorescence in light
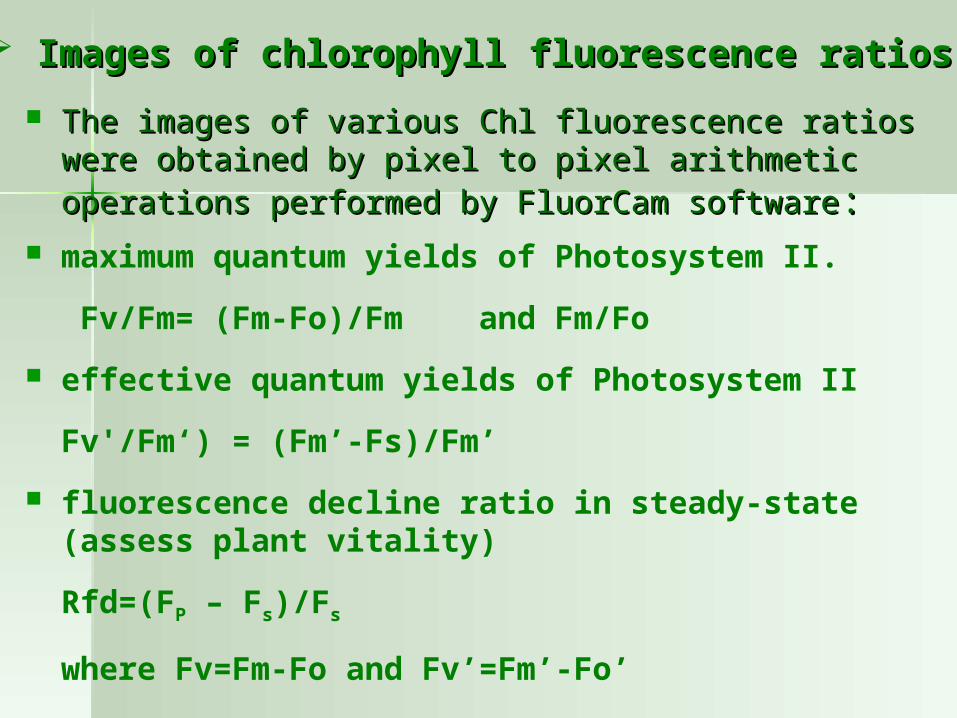
The images of various Chl fluorescence ratios were The images of various Chl fluorescence ratios were obtained by pixel to pixel arithmetic operations obtained by pixel to pixel arithmetic operations performed by FluorCam softwareperformed by FluorCam software: :
maximum quantum yields of Photosystem II.
Fv/Fm= (Fm-Fo)/Fm and Fm/Fo
effective quantum yields of Photosystem II
Fv'/Fm‘) = (Fm’-Fs)/Fm’
fluorescence decline ratio in steady-state (assess plant vitality)
Rfd=(FP – Fs)/Fs
where Fv=Fm-Fo and Fv’=Fm’-Fo’
Images of chlorophyll fluorescence ratiosImages of chlorophyll fluorescence ratios
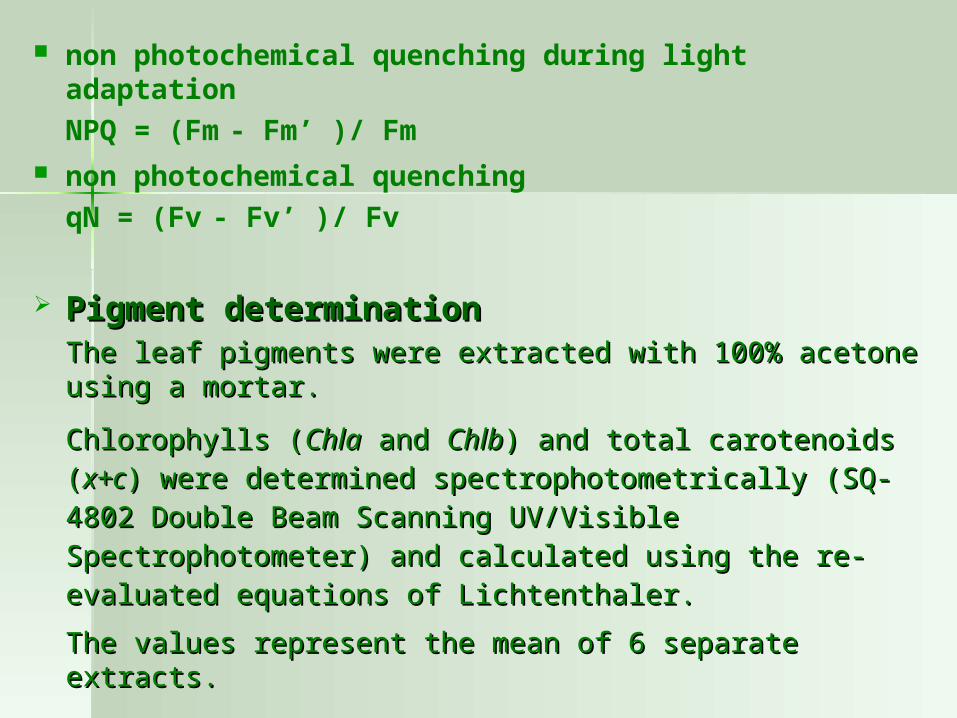
non photochemical quenching during light adaptation
NPQ = (Fm - Fm’ )/ Fm non photochemical quenching
qN = (Fv - Fv’ )/ Fv
Pigment Pigment determinationdeterminationThe leaf pigments were extracted with 100% acetone The leaf pigments were extracted with 100% acetone using a mortar. using a mortar.
Chlorophylls (Chlorophylls (ChlaChla and and ChlbChlb) and total carotenoids () and total carotenoids (x+cx+c) ) were determined spectrophotometrically (SQ-4802 were determined spectrophotometrically (SQ-4802 Double Beam Scanning UV/Visible Spectrophotometer) Double Beam Scanning UV/Visible Spectrophotometer) and calculated using the re-evaluated equations of and calculated using the re-evaluated equations of Lichtenthaler. Lichtenthaler.
The values represent the mean of 6 separate extracts.The values represent the mean of 6 separate extracts.
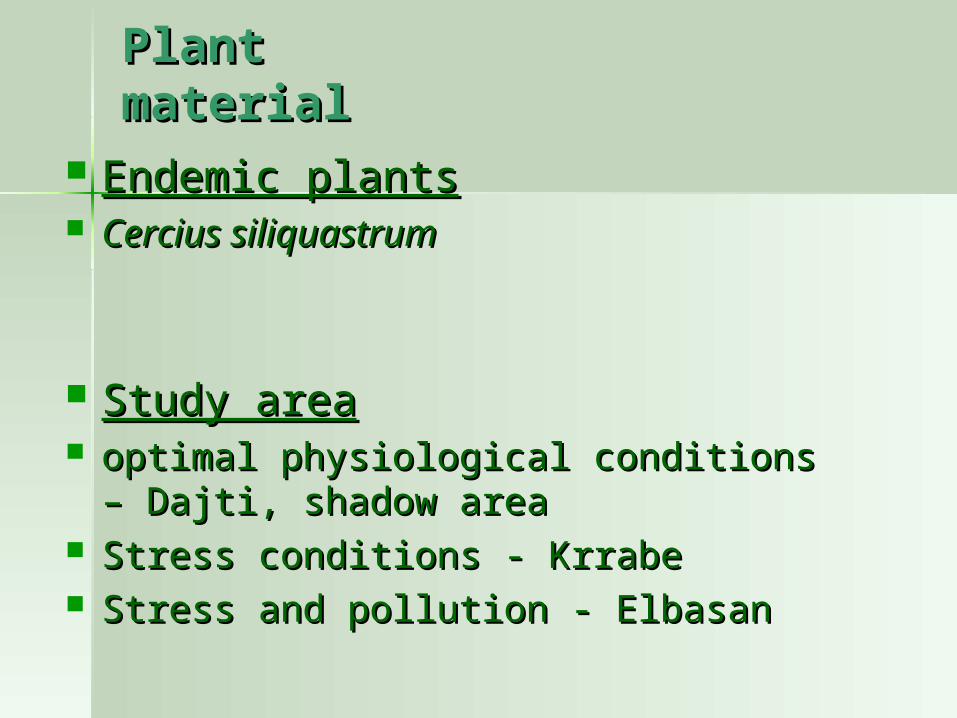
Endemic plantsEndemic plants Cercius siliquastrumCercius siliquastrum
Study areaStudy area optimal physiological conditions – Dajti, optimal physiological conditions – Dajti,
shadow areashadow area Stress conditions - KrrabeStress conditions - Krrabe Stress and pollution - ElbasanStress and pollution - Elbasan
Plant Plant materialmaterial
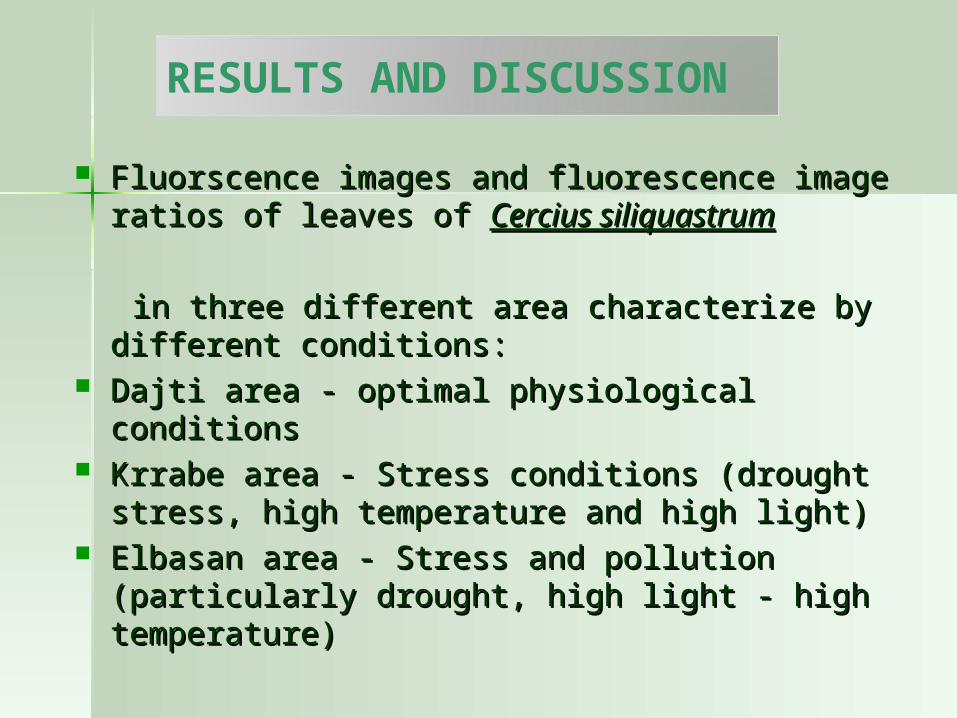
RESULTS AND DISCUSSION
Fluorscence images and fluorescence image Fluorscence images and fluorescence image ratios of leaves of ratios of leaves of Cercius siliquastrumCercius siliquastrum
in three different area characterize by in three different area characterize by different conditions: different conditions:
Dajti area - optimal physiological conditionsDajti area - optimal physiological conditions Krrabe area - Stress conditions (drought Krrabe area - Stress conditions (drought
stress, high temperature and high light)stress, high temperature and high light) Elbasan area - Stress and pollution Elbasan area - Stress and pollution
(particularly drought, high light - high (particularly drought, high light - high temperature)temperature)
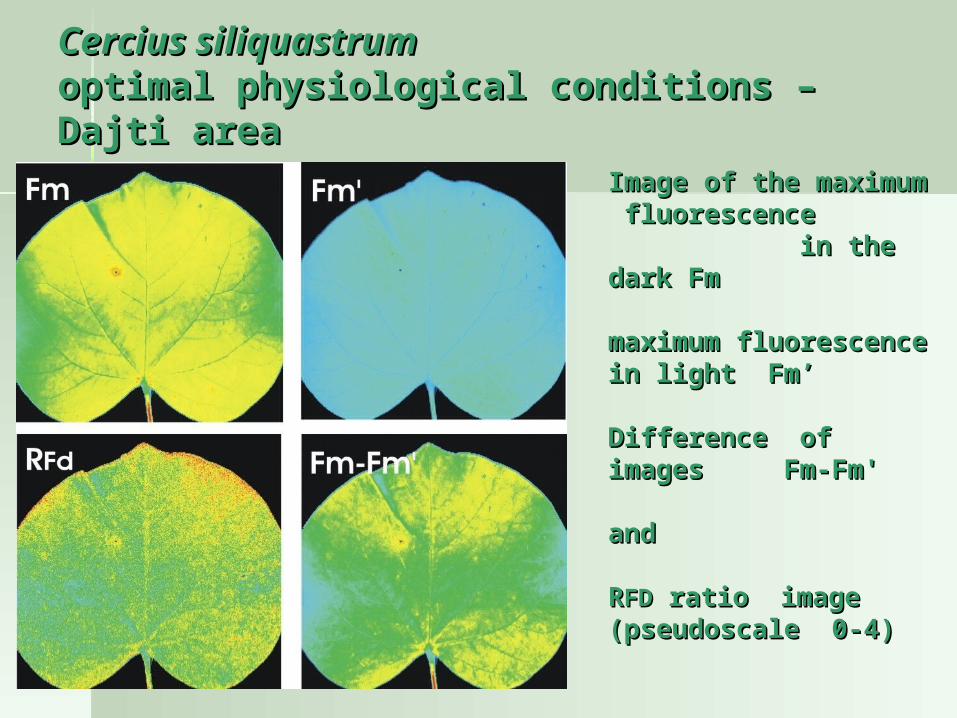
Cercius siliquastrumCercius siliquastrum optimal physiological conditions – Dajti optimal physiological conditions – Dajti areaarea
Image of the Image of the maximum maximum fluorescence fluorescence in the dark Fm in the dark Fm
maximum fluorescenmaximum fluorescence in light Fm’ce in light Fm’ Difference of images Difference of images Fm-Fm' Fm-Fm'
and and
RRFDFD ratio image ratio image(pseudoscale 0-4) (pseudoscale 0-4)
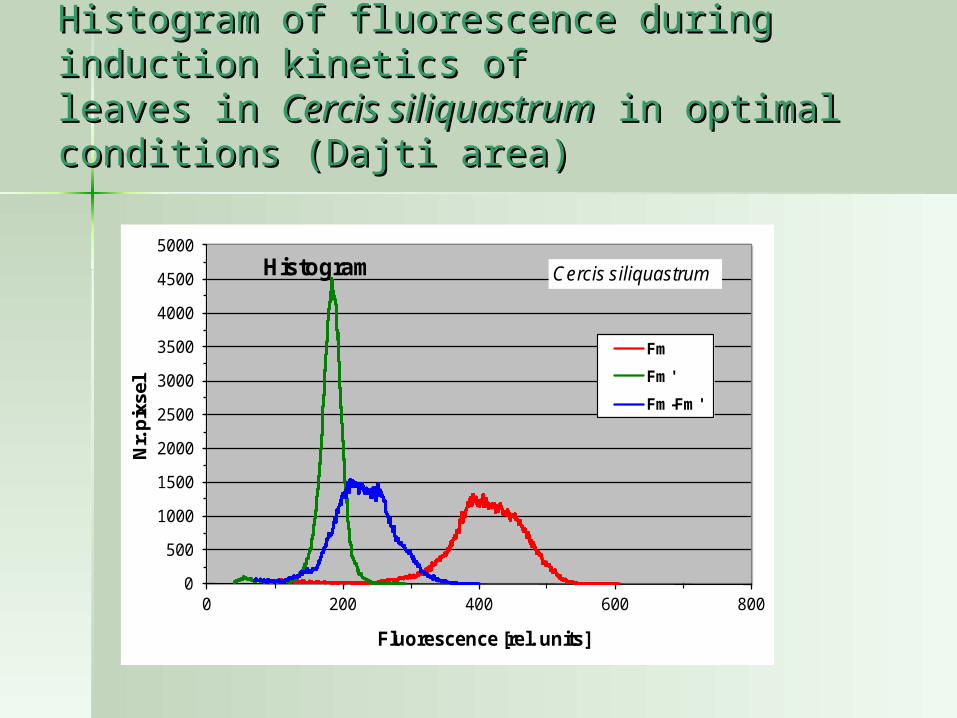
Histogram of fluorescence during Histogram of fluorescence during induction kinetics of induction kinetics of leaves in leaves in Cercis siliquastrumCercis siliquastrum in optimal in optimal conditions (Dajti area) conditions (Dajti area)
0
500
1000
1500
2000
2500
3000
3500
4000
4500
5000
0 200 400 600 800
Nr.
pix
sel
Fluorescence [rel. units]
Histogram
Fm
Fm'
Fm-Fm'
Cercis siliquastrum
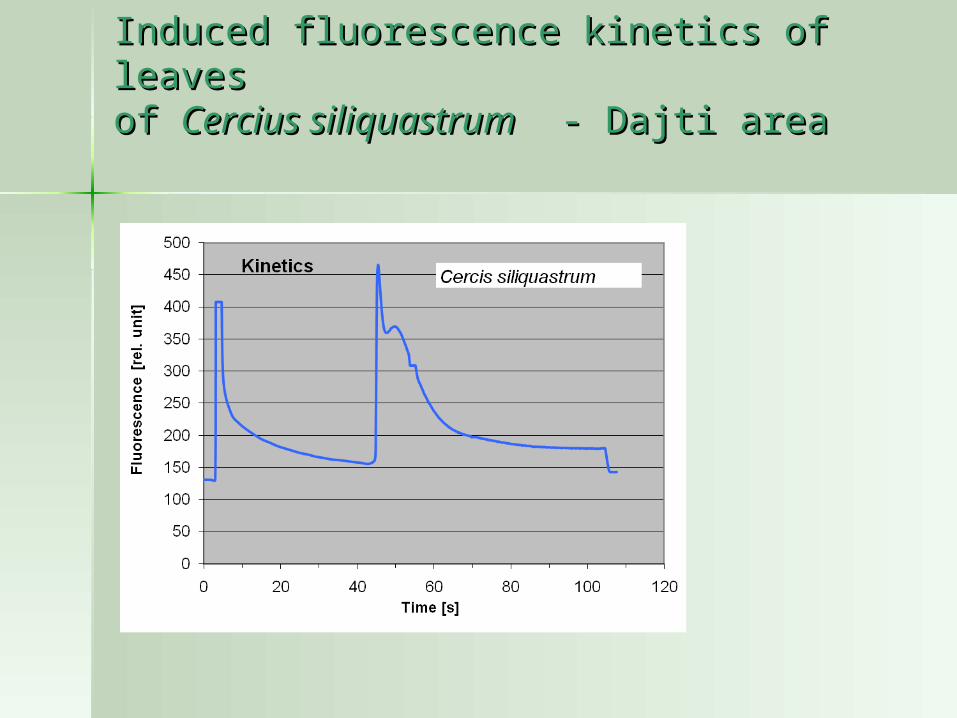
Induced fluorescence kinetics of leaves Induced fluorescence kinetics of leaves of of Cercius siliquastrumCercius siliquastrum - Dajti area - Dajti area
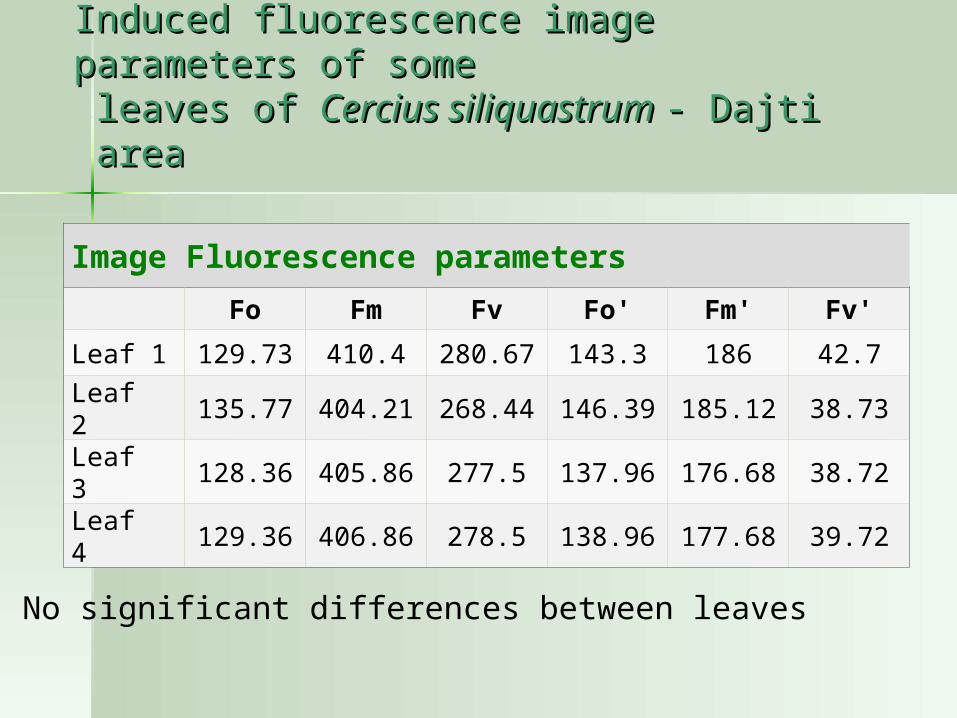
Induced fluorescence image parameters of Induced fluorescence image parameters of some leaves of some leaves of Cercius siliquastrum Cercius siliquastrum - Dajti - Dajti area area
Image Fluorescence parameters
Fo Fm Fv Fo' Fm' Fv'
Leaf 1 129.73 410.4 280.67 143.3 186 42.7
Leaf 2 135.77 404.21 268.44 146.39 185.12 38.73
Leaf 3 128.36 405.86 277.5 137.96 176.68 38.72
Leaf 4 129.36 406.86 278.5 138.96 177.68 39.72
No significant differences between leaves
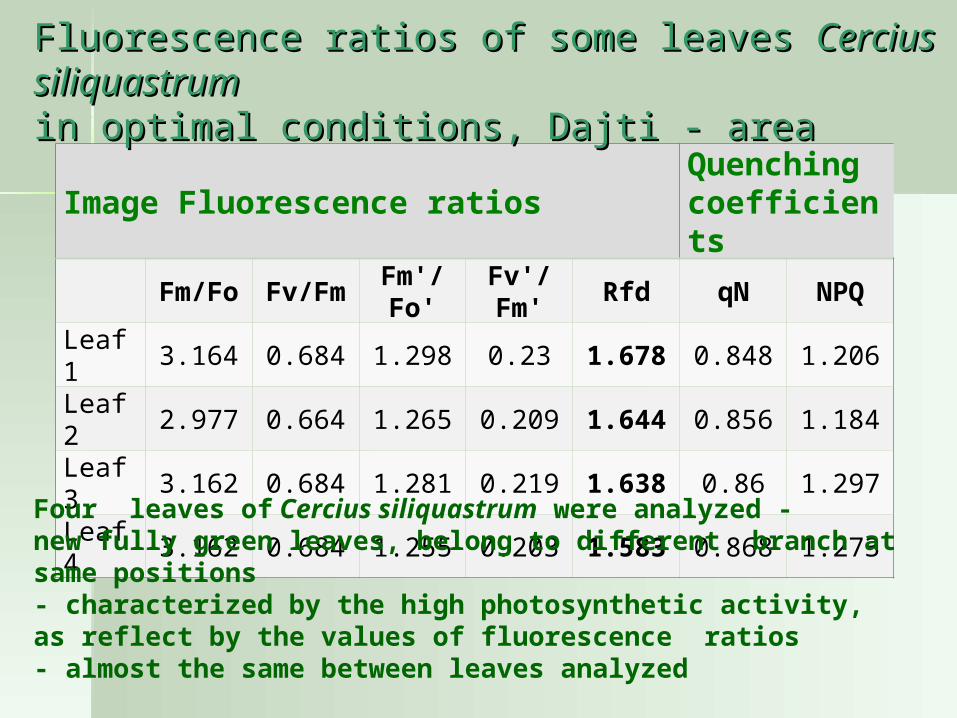
Image Fluorescence ratiosQuenching coefficients
Fm/Fo Fv/FmFm'/Fo'
Fv'/Fm' Rfd qN NPQ
Leaf 1 3.164 0.684 1.298 0.23 1.678 0.848 1.206
Leaf 2 2.977 0.664 1.265 0.209 1.644 0.856 1.184
Leaf 3 3.162 0.684 1.281 0.219 1.638 0.86 1.297
Leaf 4 3.162 0.684 1.255 0.203 1.583 0.868 1.273
Fluorescence ratios of some leaves Fluorescence ratios of some leaves Cercius siliqCercius siliquastrum uastrum in optimal conditions, Dajti - areain optimal conditions, Dajti - area
Four leaves of Cercius siliquastrum were analyzed -new fully green leaves, belong to different branch at same positions - characterized by the high photosynthetic activity, as reflect by the values of fluorescence ratios - almost the same between leaves analyzed

The fluorescence decline ratio image Rfd (pseudoscale 0-3):
Cercius siliquastrumCercius siliquastrum Stress conditions – Krrabe area Stress conditions – Krrabe area
Sun leaves:
(A) green leaf
and
(B) stress leaf
Rfd images presented at the same pseudoscale clearly show
• changes of the values of this indicator between two leaves and
• their distributions over leaves area
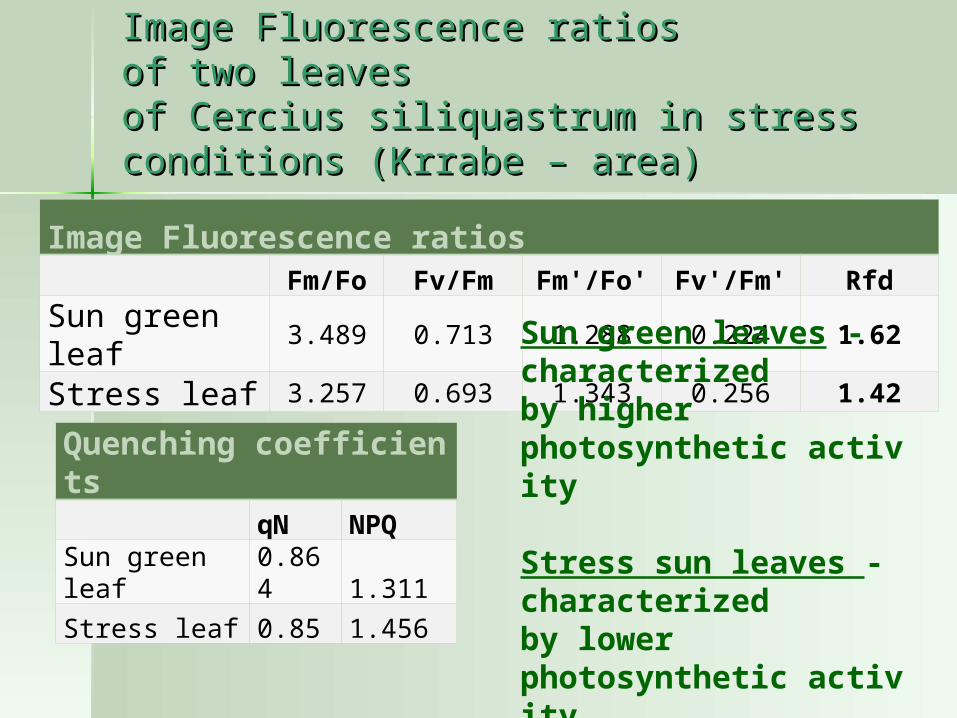
Image Fluorescence ratiosFm/Fo Fv/Fm Fm'/Fo' Fv'/Fm' Rfd
Sun green leaf 3.489 0.713 1.288 0.224 1.62
Stress leaf 3.257 0.693 1.343 0.256 1.42
Quenching coefficients
qN NPQSun green leaf 0.864 1.311
Stress leaf 0.85 1.456
Image Fluorescence ratios Image Fluorescence ratios of two leaves of two leaves of Cercius siliquastrum in stress of Cercius siliquastrum in stress conditions (Krrabe – area) conditions (Krrabe – area)
Sun green leaves - characterized by higher photosynthetic activity
Stress sun leaves - characterized by lower photosynthetic activity
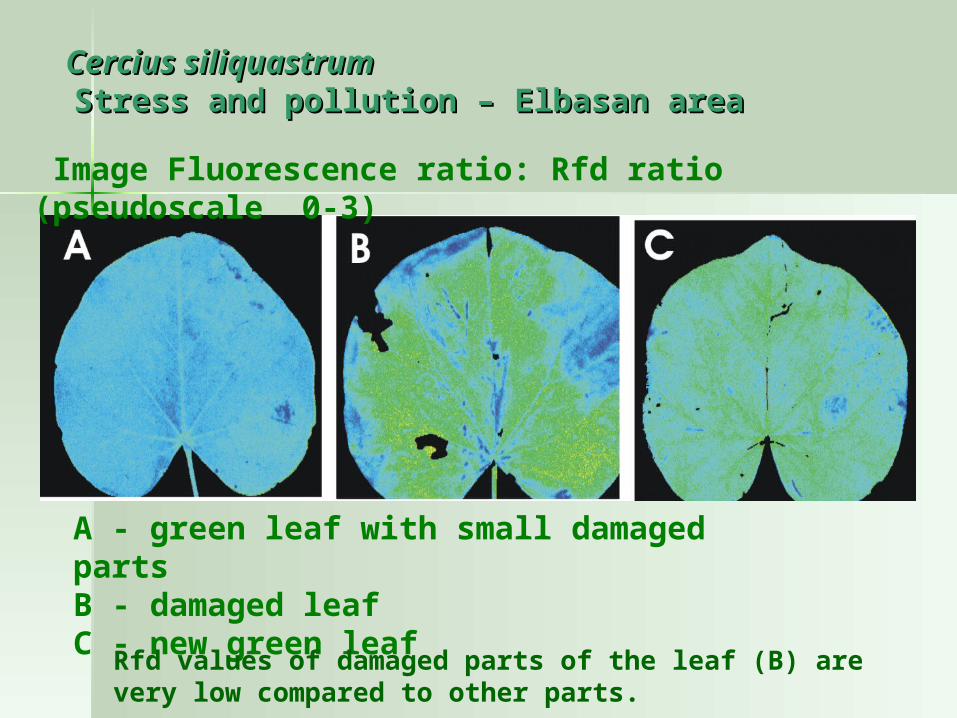
Cercius siliquastrum Cercius siliquastrum Stress and pollution – Elbasan area Stress and pollution – Elbasan area
Image Fluorescence ratio: Rfd ratio (pseudoscale 0-3)
A - green leaf with small damaged parts B - damaged leaf C - new green leaf
Rfd values of damaged parts of the leaf (B) are very low compared to other parts.
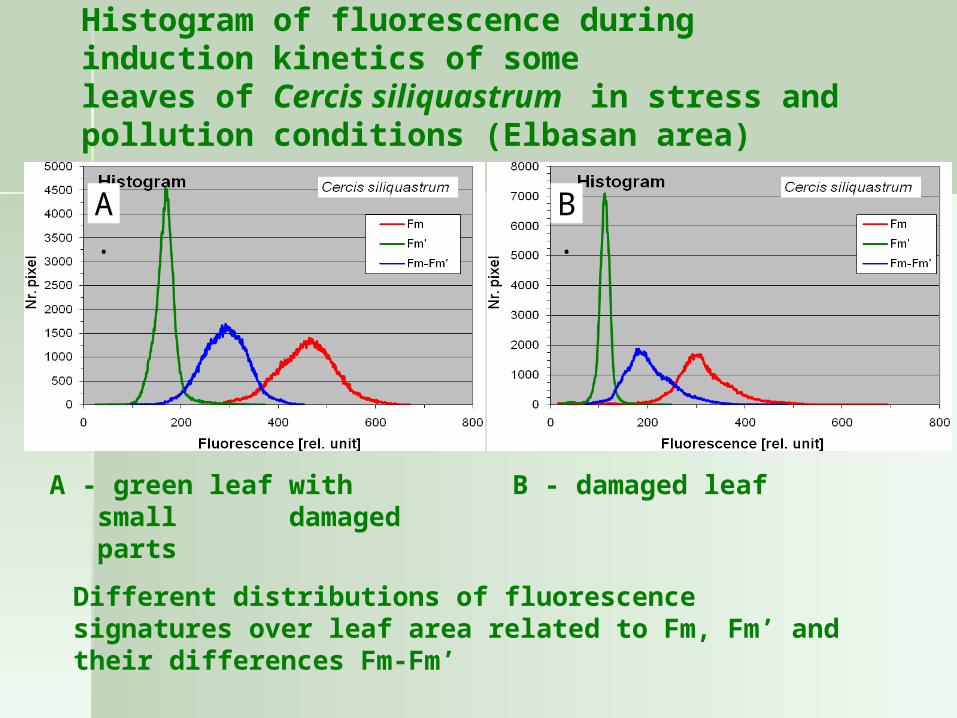
Histogram of fluorescence during induction kinetics of some leaves of Cercis siliquastrum in stress and pollution conditions (Elbasan area)
A. B.
A - green leaf with small damaged parts
B - damaged leaf
Different distributions of fluorescence signatures over leaf area related to Fm, Fm’ and their differences Fm-Fm’
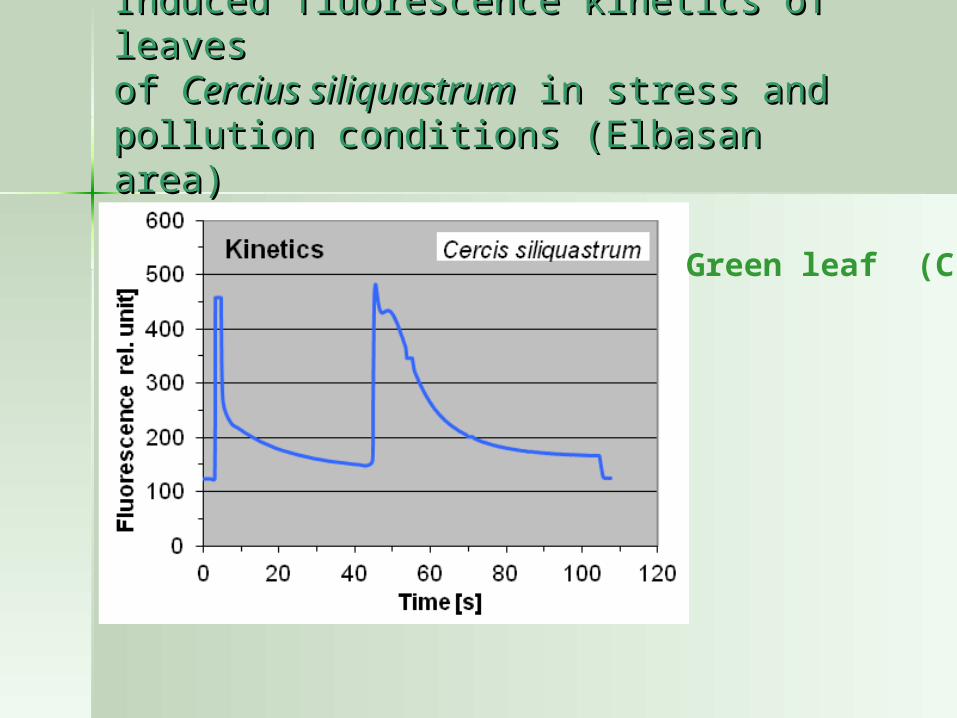
Induced fluorescence kinetics of leaves Induced fluorescence kinetics of leaves of of Cercius siliquastrumCercius siliquastrum in stress and in stress and pollution conditions (Elbasan area) pollution conditions (Elbasan area)
Green leaf (C)
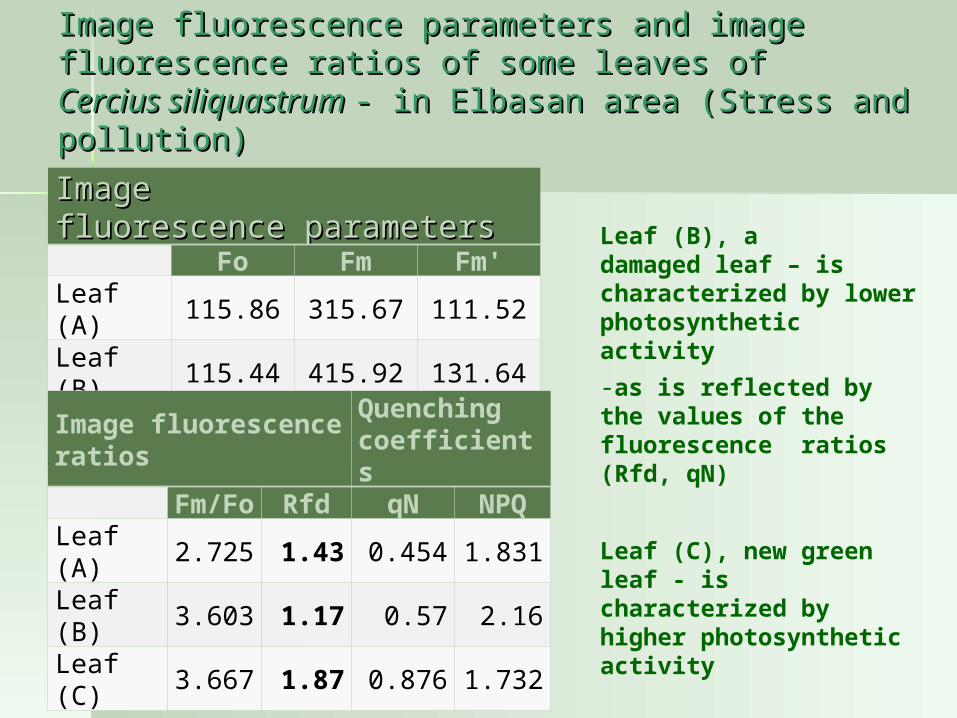
Image fluorescence parameters Image fluorescence parameters Fo Fm Fm'
Leaf (A) 115.86 315.67 111.52Leaf (B) 115.44 415.92 131.64Leaf (C) 124.69 457.28 167.37
Image fluorescence parameters and image Image fluorescence parameters and image fluorescence ratios of some leaves of fluorescence ratios of some leaves of Cercius siliquastrum Cercius siliquastrum - in Elbasan area (Stress and - in Elbasan area (Stress and pollution)pollution)
Image fluorescence ratios
Quenching coefficients
Fm/Fo Rfd qN NPQLeaf (A) 2.725 1.43 0.454 1.831Leaf (B) 3.603 1.17 0.57 2.16Leaf (C) 3.667 1.87 0.876 1.732
Leaf (B), a damaged leaf – is characterized by lower photosynthetic activity
-as is reflected by the values of the fluorescence ratios (Rfd, qN)
Leaf (C), new green leaf - is characterized by higher photosynthetic activity
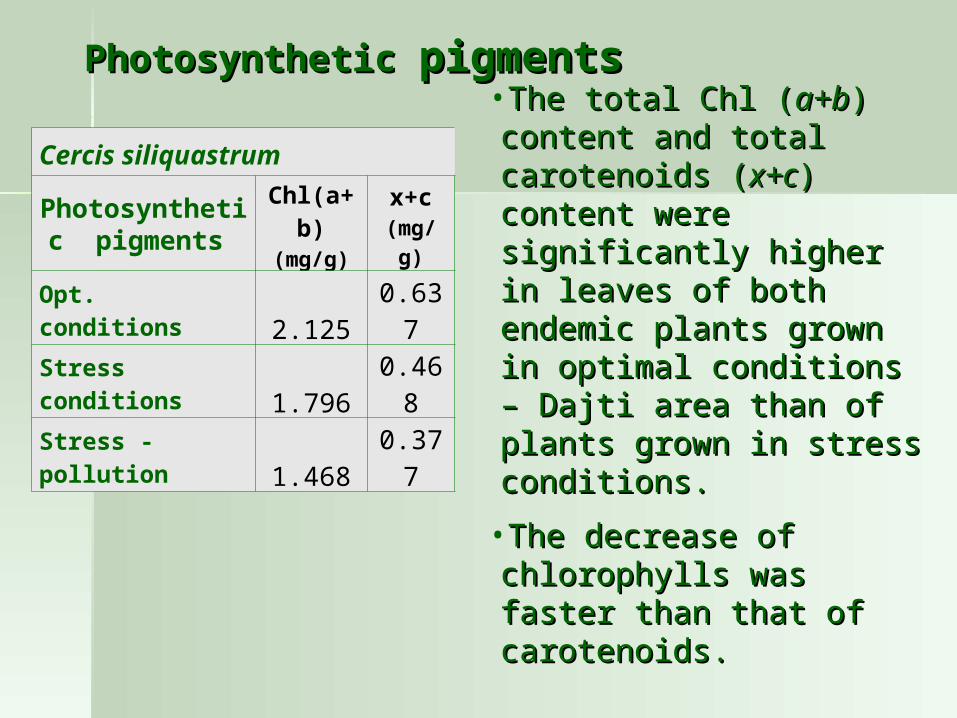
Cercis siliquastrumPhotosynthetic
pigments Chl(a+b)
(mg/g)
x+c(mg/g)
Opt. conditions2.125
0.637
Stress conditions1.796
0.468
Stress - pollution1.468
0.377
Photosynthetic Photosynthetic pigmentspigments
•The total Chl (The total Chl (a+ba+b) ) content and total content and total carotenoids (carotenoids (x+cx+c) content ) content were significantly higher were significantly higher in leaves of both endemic in leaves of both endemic plants grown in optimal plants grown in optimal conditions – Dajti area conditions – Dajti area than of plants grown in than of plants grown in stress conditions.stress conditions.
•The decrease of The decrease of chlorophylls was faster chlorophylls was faster than that of carotenoids.than that of carotenoids.
CONCLUSIONSCONCLUSIONS
Fluorescence images measured at different Fluorescence images measured at different states during induction kinetics, induced states during induction kinetics, induced kinetics of Chl fluorescence and histograms kinetics of Chl fluorescence and histograms of fluorescence distributions in the plants of fluorescence distributions in the plants grown in optimal conditions (grown in optimal conditions (Dajti areaDajti area) show ) show a high photosynthetic activity as is a high photosynthetic activity as is demonstrated by the values of demonstrated by the values of fluorescence ratios which evaluate the fluorescence ratios which evaluate the plant vitality and quantum yield of plant vitality and quantum yield of photosynthetic apparatus.photosynthetic apparatus.
Cercius siliquastrum: Rfd = 1.63, Fm/Fo = 3.12)
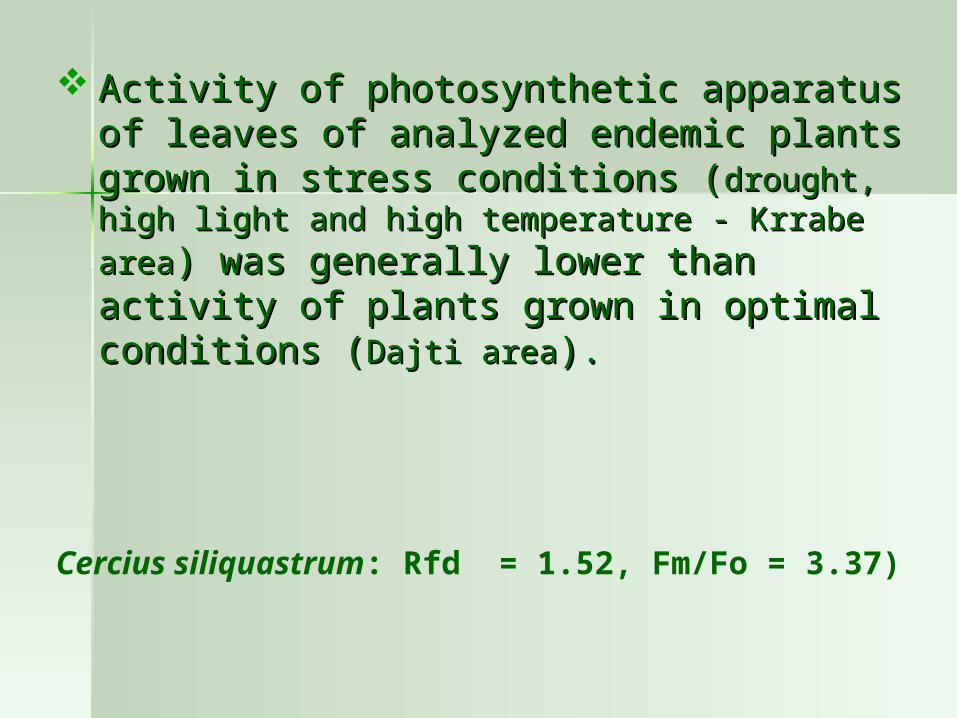
Activity of photosynthetic apparatus of Activity of photosynthetic apparatus of leaves of analyzed endemic plants grown in leaves of analyzed endemic plants grown in stress conditions (stress conditions (drought, high light and high drought, high light and high temperature - Krrabe areatemperature - Krrabe area) was generally ) was generally lower than activity of plants grown in lower than activity of plants grown in optimal conditions (optimal conditions (Dajti areaDajti area).).
Cercius siliquastrum: Rfd = 1.52, Fm/Fo =
3.37)
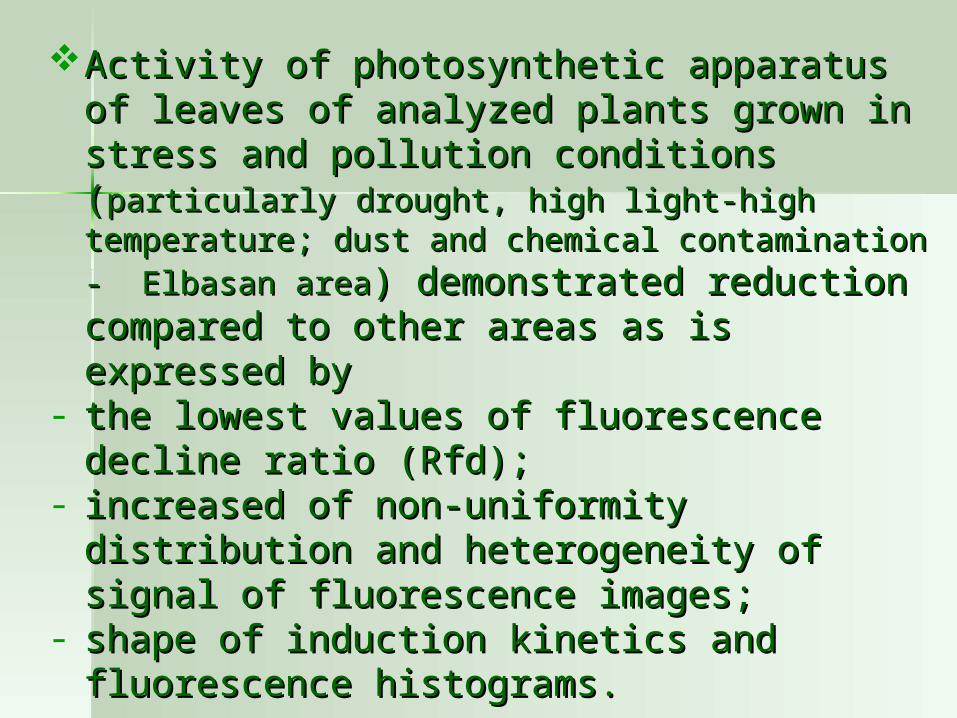
Activity of photosynthetic apparatus of Activity of photosynthetic apparatus of leaves of analyzed plants grown in stress and leaves of analyzed plants grown in stress and pollution conditions (pollution conditions (particularly drought, high particularly drought, high light-high temperature; dust and chemical light-high temperature; dust and chemical contamination - Elbasan areacontamination - Elbasan area) demonstrated ) demonstrated reduction compared to other areas as is reduction compared to other areas as is expressed by expressed by
- the lowest values of fluorescence decline the lowest values of fluorescence decline ratio (Rfd);ratio (Rfd);
- increased of non-uniformity distribution and increased of non-uniformity distribution and heterogeneity of signal of fluorescence heterogeneity of signal of fluorescence images;images;
- shape of induction kinetics and fluorescence shape of induction kinetics and fluorescence histograms.histograms.
Cercius siliquastrum: Rfd=1.3)

The photosynthetic pigments, The photosynthetic pigments, chlorophylls and carotenoids, could be chlorophylls and carotenoids, could be considered functionally organized in considered functionally organized in plants grown in optimal conditions (plants grown in optimal conditions (Dajti Dajti areaarea).).
The reduce of pigment content observed The reduce of pigment content observed in both endemic plants grown in stress in both endemic plants grown in stress conditions (conditions (Krrabe areaKrrabe area) as well as in ) as well as in stress-pollution conditions (stress-pollution conditions (Elbasan areaElbasan area) ) compared to optimal conditions indicated compared to optimal conditions indicated a a possible modifications in pigment possible modifications in pigment composition during stress events.composition during stress events.
REFERENCES• Babani F. and Lichtenthaler H.K. (1996) Light-induced and age-dependent development of chloroplasts in etiolated barley leaves as visualized by determination of photosynthetic pigments, CO2 assimilation rates and different kinds of chlorophyll fluorescence ratios. J Plant Physiol 148: 555-566
• Buschmann C. and Lichtenthaler H.K. (1998). Principles and characteristics of multi-colour fluorescence imaging of plants. - J. Plant Physiol. 152, 297-314
• Krause G.H. and Weis E. (1991). Chlorophyll fluorescence and photosynthesis: the basics. Ann Rev Plant Physiol Plant Mo. Biol 42: 313-349
• Langsdorf G., Buschmann C., Sowinska M., Babani F., Mokry M., Timmermann F., Lichtenthaler H. K., (2000) Measurement of differences in red chlorophyll fluorescence and photosynthetic activity between sun and shade leaves by fluorescence imaging. Photosynthetica 38: 539-551.
• Lichtenthaler H.K. (1987). Chlorophylls and carotenoids, the pigments of photosynthetic biomembranes. In: Douce R, Packer L (eds) Methods Enzymol 148, pp. 350-382. Academic Press Inc, New York
• Lichtenthaler H.K. (1996). Vegetation stress: an introduction to the stress concept in plants. J Plant Physiol 148: 4-14
• Lichtenthaler H.K. and Babani F. (2000) Detection of photosynthetic activity and water stress by imaging the red chlorophyll fluorescence. Plant Physiology Biochemistry 38: 889-895
• Lichtenthaler H.K. and Buschmann C. (2001) Chlorophylls and carotenoids–Measurement and characterisation by UV-VIS. Current Protocols in Food Analytical Chemistry (CPFA), (Supplement 1), pp. F4.3.1 - F 4.3.8. John Wiley, New York
• Lichtenthaler H.K., Babani F., Langsdorf G., Buschmann C. (2000). Measurement of differences in red chlorophyll fluorescence and photosynthetic activity between sun and shade leaves by fluorescence imaging. Photosynthetica38: 521-529.
• Lichtenthaler H.K. and Miehe J.A. (1997) Fluorescence imaging as a diagnostic tool for plant stress. Trends Plant Sci 2: 316-320.

THANK YOUTHANK YOU