Embed Size (px)
Citation preview
Ernst & Young LLP
B A S I C F I N A N C I A L S T A T E M E N T S , R E Q U I R E D
S U P P L E M E N T A R Y I N F O R M A T I O N , A N D
O T H E R F I N A N C I A L I N F O R M A T I O N
West Virginia Public Employees Insurance Agency Years Ended June 30, 2013 and 2012 With Report of Independent Auditors
1304-1069013
West Virginia Public Employees Insurance Agency
Basic Financial Statements, Required Supplementary Information, and Other Financial Information
Years Ended June 30, 2013 and 2012
Table of Contents
Report of Independent Auditors.......................................................................................................1
Management’s Discussion and Analysis .........................................................................................4
Basic Financial Statements
Statements of Net Position .............................................................................................................10 Statements of Revenues, Expenses, and Changes in Net Position ................................................11 Statements of Cash Flows ..............................................................................................................12 Notes to Financial Statements ........................................................................................................13
Required Supplementary Information
Ten-Year Claims Development Information (Unaudited) .............................................................40
Other Financial Information
Form 7, Deposits Disclosure ..........................................................................................................41 Form 8, Investments Disclosure ....................................................................................................42 Form 8-A, Deposits and Investments Disclosure ..........................................................................43 Form 9, Accounts Receivable ........................................................................................................44 Form 10, Due (to) From Primary Government ..............................................................................45 Form 11, Component Unit – A/R Balances ...................................................................................48
Report on Internal Control Over Financial Reporting and on Compliance and Other Matters Based on an Audit of Financial Statements Performed in Accordance With Government Auditing Standards .................................................................................................49
1304-1069013 1
Report of Independent Auditors
The Finance Board and Management West Virginia Public Employees Insurance Agency
We have audited the accompanying basic financial statements of West Virginia Public Employees Insurance Agency (PEIA), an enterprise fund of the State of West Virginia, as of and for the years ended June 30, 2013 and 2012, and the related notes to the financial statements, which collectively comprise the PEIA’s basic financial statements as listed in the table of contents.
Management’s Responsibility for the Financial Statements
Management is responsible for the preparation and fair presentation of these financial statements in conformity with U.S. generally accepted accounting principles; this includes the design, implementation, and maintenance of internal control relevant to the preparation and fair presentation of financial statements that are free of material misstatement, whether due to fraud or error.
Auditor’s Responsibility
Our responsibility is to express an opinion on these financial statements based on our audits. We conducted our audits in accordance with auditing standards generally accepted in the United States and the standards applicable to financial audits contained in Government Auditing Standards, issued by the Comptroller General of the United States. Those standards require that we plan and perform the audit to obtain reasonable assurance about whether the financial statements are free of material misstatement.
An audit involves performing procedures to obtain audit evidence about the amounts and disclosures in the financial statements. The procedures selected depend on the auditor’s judgment, including the assessment of the risks of material misstatement of the financial statements, whether due to fraud or error. In making those risk assessments, the auditor considers internal control relevant to the entity’s preparation and fair presentation of the financial statements in order to design audit procedures that are appropriate in the circumstances, but not for the purpose of expressing an opinion on the effectiveness of the entity’s internal control. Accordingly, we express no such opinion. An audit also includes evaluating the appropriateness of accounting policies used and the reasonableness of significant accounting estimates made by management, as well as evaluating the overall presentation of the financial statements.
A member firm of Ernst & Young Global Limited
Ernst & Young LLP 900 United Center 500 Virginia Street East Charleston, WV 25301 Tel: +1 304 343 8971 Fax: +1 304 357 5994 www.ey.com
1304-1069013 2
We believe that the audit evidence we have obtained is sufficient and appropriate to provide a basis for our audit opinion.
Opinion
In our opinion, the financial statements referred to above present fairly, in all material respects, the net position of PEIA, an enterprise fund of the State of West Virginia, as of June 30, 2013 and 2012, and the revenues, expenses, and changes in its net position and its cash flows for the years then ended in conformity with U.S. generally accepted accounting principles.
Basis of Presentation
As discussed in Note 1 to the financial statements, the financial statements of PEIA are intended to present the net position, the revenues, expenses, and changes in net position, and the cash flows of only that portion of the business-type activities of the State of West Virginia that is attributable to the transactions of the PEIA. They do not purport to, and do not, present fairly the net position of the State of West Virginia as of June 30, 2013 and 2012, and the changes in its net position or, where applicable, its cash flows for the years then ended in conformity with U.S. generally accepted accounting principles.
Required Supplementary Information
U.S. generally accepted accounting principles require that management’s discussion and analysis on pages 4 through 9 and the supplemental schedule of ten-year claims development information (unaudited) on page 40 be presented to supplement the basic financial statements. Such information, although not a part of the basic financial statements, is required by the Governmental Accounting Standards Board, which considers it to be an essential part of financial reporting for placing the basic financial statements in an appropriate operational, economic, or historical context. We have applied certain limited procedures to the required supplementary information in accordance with auditing standards generally accepted in the United States, which consisted of inquiries of management about the methods of preparing the information and comparing the information for consistency with management’s responses to our inquiries, the basic financial statements, and other knowledge we obtained during our audit of the basic financial statements. We do not express an opinion or provide any assurance on the information because the limited procedures do not provide us with sufficient evidence to express an opinion or provide any assurance.
Supplementary Information
Our audit was conducted for the purpose of forming an opinion on the financial statements that collectively comprise the PEIA’s basic financial statements. The Financial Accounting and Reporting section (FARS) closing book forms listed in the table of contents are presented for
A member firm of Ernst & Young Global Limited
1304-1069013 3
purposes of additional analysis and are not a required part of the basic financial statements. Such information is the responsibility of management and was derived from and relates directly to the underlying accounting and other records used to prepare the basic financial statements. Such information has been subjected to the auditing procedures applied in the audit of the basic financial statements and certain additional procedures, including comparing and reconciling such information directly to the underlying accounting and other records used to prepare the basic financial statements or to the basic financial statements themselves, and other additional procedures in accordance with auditing standards generally accepted in the United States. In our opinion, the information is fairly stated, in all material respects, in relation to the basic financial statements as a whole.
Other Reporting Required by Government Auditing Standards
In accordance with Government Auditing Standards, we also have issued our report dated October 15, 2013 on our consideration of the PEIA’s internal control over financial reporting and on our tests of its compliance with certain provisions of laws, regulations, contracts, and grant agreements and other matters. The purpose of that report is to describe the scope of our testing of internal control over financial reporting and compliance and the results of that testing, and not to provide an opinion on the internal control over financial reporting or on compliance. That report is an integral part of an audit performed in accordance with Government Auditing Standards in considering PEIA’s internal control over financial reporting and compliance.
ey October 15, 2013
A member firm of Ernst & Young Global Limited
1304-1069013 4
West Virginia Public Employees Insurance Agency
Management’s Discussion and Analysis
Year Ended June 30, 2013
This section of the annual financial report of the West Virginia Public Employees Insurance Agency (PEIA) presents a discussion and analysis of the financial performance of PEIA for the year ended June 30, 2013. Please read it in conjunction with the basic financial statements, which follow this section.
OVERVIEW OF THE FINANCIAL STATEMENTS
PEIA’s basic financial statements are prepared in accordance with U.S. generally accepted accounting principles for governmental entities. The primary purpose of PEIA is to provide group health and prescription drug insurance for the employees of state agencies, colleges and universities, county school boards, and other governmental units as set forth in the West Virginia Public Employees Insurance Act of 1971 as amended. PEIA operates in a manner similar to any other insurance company. PEIA is an enterprise fund of the State of West Virginia and is combined with other similar funds to comprise the enterprise funds of the State of West Virginia. The basic financial statements are presented on the accrual basis of accounting. The three basic financial statements presented within the financial statements are as follows:
Statement of Net Position – This statement presents information reflecting PEIA’s assets, liabilities, and net position. Net position represents the amount of total assets less total liabilities. The statement of net position is categorized as to current and noncurrent assets and liabilities. For purposes of the basic financial statements, current assets and liabilities are those assets and liabilities with immediate liquidity or are collectible or become due within 12 months of the statement date.
Statement of Revenues, Expenses, and Changes in Net Position – This statement reflects PEIA’s operating revenues and expenses, as well as nonoperating revenues during the fiscal year. The major source of operating revenues is premium income, while major expense areas include medical and prescription drug claims costs. The change in net position for an enterprise fund is similar to net profit or loss for any other insurance company.
Statement of Cash Flows – The statement of cash flows is presented on the direct method of reporting, which reflects cash flows from operating, capital and noncapital financing, and investing activities. Cash collections and payments are reflected in this statement to arrive at net increase or decrease in cash for the fiscal year.
West Virginia Public Employees Insurance Agency
Management’s Discussion and Analysis (continued)
1304-1069013 5
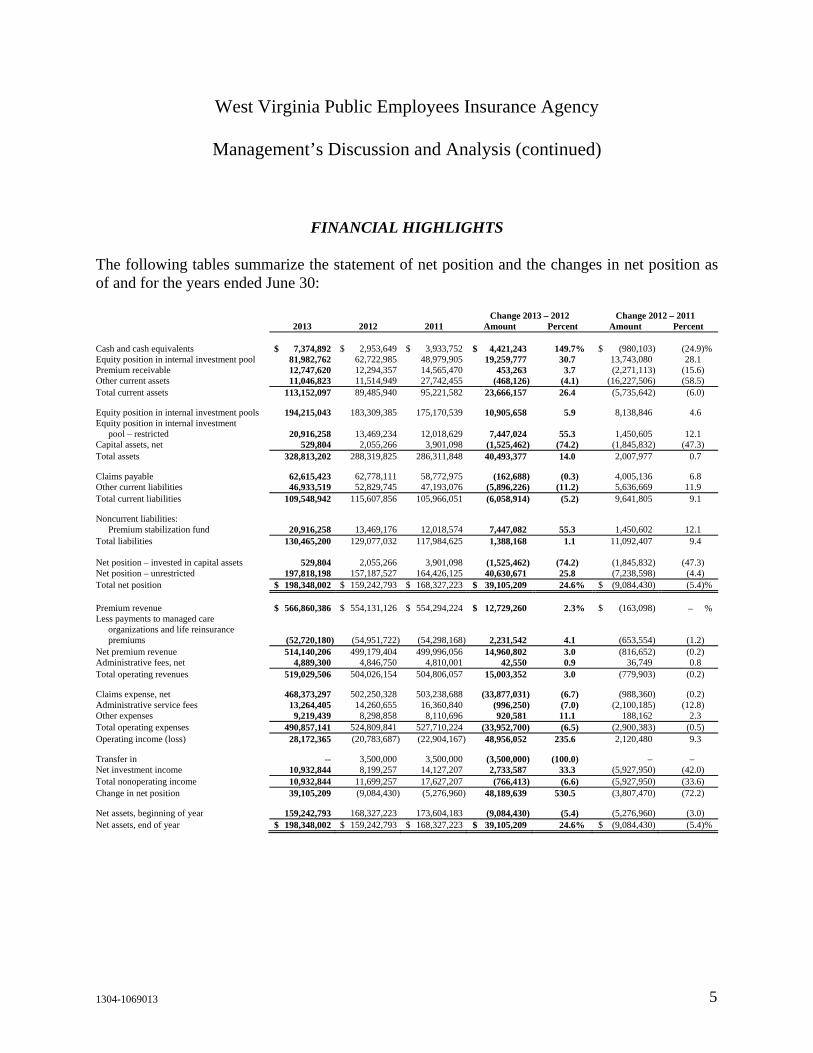
FINANCIAL HIGHLIGHTS
The following tables summarize the statement of net position and the changes in net position as of and for the years ended June 30:
Change 2013 – 2012 Change 2012 – 2011 2013 2012 2011 Amount Percent Amount Percent Cash and cash equivalents $ 7,374,892 $ 2,953,649 $ 3,933,752 $ 4,421,243 149.7% $ (980,103) (24.9)% Equity position in internal investment pool 81,982,762 62,722,985 48,979,905 19,259,777 30.7 13,743,080 28.1 Premium receivable 12,747,620 12,294,357 14,565,470 453,263 3.7 (2,271,113) (15.6) Other current assets 11,046,823 11,514,949 27,742,455 (468,126) (4.1) (16,227,506) (58.5) Total current assets 113,152,097 89,485,940 95,221,582 23,666,157 26.4 (5,735,642) (6.0) Equity position in internal investment pools 194,215,043 183,309,385 175,170,539 10,905,658 5.9 8,138,846 4.6 Equity position in internal investment
pool – restricted 20,916,258 13,469,234 12,018,629 7,447,024 55.3 1,450,605 12.1 Capital assets, net 529,804 2,055,266 3,901,098 (1,525,462) (74.2) (1,845,832) (47.3) Total assets 328,813,202 288,319,825 286,311,848 40,493,377 14.0 2,007,977 0.7 Claims payable 62,615,423 62,778,111 58,772,975 (162,688) (0.3) 4,005,136 6.8 Other current liabilities 46,933,519 52,829,745 47,193,076 (5,896,226) (11.2) 5,636,669 11.9 Total current liabilities 109,548,942 115,607,856 105,966,051 (6,058,914) (5.2) 9,641,805 9.1 Noncurrent liabilities:
Premium stabilization fund 20,916,258 13,469,176 12,018,574 7,447,082 55.3 1,450,602 12.1 Total liabilities 130,465,200 129,077,032 117,984,625 1,388,168 1.1 11,092,407 9.4 Net position – invested in capital assets 529,804 2,055,266 3,901,098 (1,525,462) (74.2) (1,845,832) (47.3) Net position – unrestricted 197,818,198 157,187,527 164,426,125 40,630,671 25.8 (7,238,598) (4.4) Total net position $ 198,348,002 $ 159,242,793 $ 168,327,223 $ 39,105,209 24.6% $ (9,084,430) (5.4)% Premium revenue $ 566,860,386 $ 554,131,126 $ 554,294,224 $ 12,729,260 2.3% $ (163,098) – %Less payments to managed care
organizations and life reinsurance premiums (52,720,180) (54,951,722) (54,298,168) 2,231,542 4.1 (653,554) (1.2)
Net premium revenue 514,140,206 499,179,404 499,996,056 14,960,802 3.0 (816,652) (0.2) Administrative fees, net 4,889,300 4,846,750 4,810,001 42,550 0.9 36,749 0.8 Total operating revenues 519,029,506 504,026,154 504,806,057 15,003,352 3.0 (779,903) (0.2) Claims expense, net 468,373,297 502,250,328 503,238,688 (33,877,031) (6.7) (988,360) (0.2) Administrative service fees 13,264,405 14,260,655 16,360,840 (996,250) (7.0) (2,100,185) (12.8) Other expenses 9,219,439 8,298,858 8,110,696 920,581 11.1 188,162 2.3 Total operating expenses 490,857,141 524,809,841 527,710,224 (33,952,700) (6.5) (2,900,383) (0.5) Operating income (loss) 28,172,365 (20,783,687) (22,904,167) 48,956,052 235.6 2,120,480 9.3 Transfer in -- 3,500,000 3,500,000 (3,500,000) (100.0) – – Net investment income 10,932,844 8,199,257 14,127,207 2,733,587 33.3 (5,927,950) (42.0) Total nonoperating income 10,932,844 11,699,257 17,627,207 (766,413) (6.6) (5,927,950) (33.6) Change in net position 39,105,209 (9,084,430) (5,276,960) 48,189,639 530.5 (3,807,470) (72.2) Net assets, beginning of year 159,242,793 168,327,223 173,604,183 (9,084,430) (5.4) (5,276,960) (3.0) Net assets, end of year $ 198,348,002 $ 159,242,793 $ 168,327,223 $ 39,105,209 24.6% $ (9,084,430) (5.4)%
West Virginia Public Employees Insurance Agency
Management’s Discussion and Analysis (continued)
1304-1069013 6
The current portion of equity position in internal investment pool and cash and cash equivalents increased $23.7 million as the result of $21.4 million provided from operations less $7.4 million increase in the premium stabilization fund and $9.7 million provided from capital and noncapital financing activities.
In the previous year, the current portion of equity position in internal investment pool and cash and cash equivalents increased $12.8 million as the result of $5.1 million used from operations plus $0.06 million provided in investment activities and $19.3 million provided from noncapital financing activities and a $1.5 million increase in the premium stabilization fund.
Premiums receivable at June 30, 2013, was $.5 million more than the prior year due to a decrease in the allowance for doubtful accounts.
As of the previous year-end, premiums receivable was $2.3 million less than the prior year due to increased collection efforts.
Other current assets were down $.5 million as of the end of this year because of a $4.6 million decrease in the amount due from Retiree Health Benefit Trust (RHBT), a $4.3 million increase on a prescription rebate receivable due to a timing difference and other decreases of $0.2 million.
At June 30, 2012, compared to June 30, 2011, other current assets were down $16.2 million as of the end of this year because of a $15.8 million decrease in the amount due from RHBT, a $0.7 million decrease on a prescription rebate receivable due to a change in the drug formulary, and a $0.3 million increase in provider receivables.
Claims payable did not change significantly from June 30, 2012 to June 30, 2013.
At June 30, 2012, compared to June 30, 2011, claims payable decreased $4.0 million due to power outages caused by a derecho storm on June 29, 2012.
At June 30, 2013, compared to June 30, 2012, other current liabilities decreased $6.1 million mainly resulting from a decrease in premium deficiency reserve of $15.2 million due to a smaller anticipated underwriting loss for the 2014 fiscal year, $4.7 million increase in unearned revenue, $0.6 million decrease in accounts payable and contracted liabilities, and $5.2 million increase of amounts due to RHBT.
At June 30, 2012, compared to June 30, 2011, other current liabilities increased $5.6 million mainly resulting from a decrease in premium deficiency reserve of $1.3 million, $8.4 million increase in unearned revenue and $1.5 million decrease in accounts payable and contracted liabilities.

West Virginia Public Employees Insurance Agency
Management’s Discussion and Analysis (continued)
1304-1069013 7
The increase in net position for the 2013 year exceeded the prior year by $48.2 million mainly due to decreased managed care and life insurance expense of $2.2 million, decreased claim expense of $33.9 million, a $1.0 million reduction in administrative service fees, an increase of $0.8 million in other expenses, a $0.8 million decrease of nonoperating income, and a $12.7 million increase in premium revenue.
For the 2012 year, the decline in net position exceeded the prior year by $3.8 million mainly due to increased managed care and life insurance expense of $0.7 million, decreased claim expense of $1.0 million, a $2.1 million reduction in administrative service fees, an increase of $0.2 million in other expenses, and a $5.9 million reduction of investment income.
Comparing 2013 to 2012, fiscal year operating revenues increased $15.0 million mainly due to an increase in employer premiums and a decrease of $2.2 million in managed care and life insurance expenses.
In the prior year, net premiums decreased $0.8 million mainly due to an increase of $0.7 million in managed care and life insurance expenses.
Medical and prescription drug claims were 95.5% of total plan operating expenses for the three- year period. Current year total claim expenses were down $33.9 million mainly due to a reduction of $15.2 million to adjust the premium deficiency reserve, policy benefit reductions of $22.5 million, additional claim costs relating to the West Virginia autism bill of $3.0 million, additional federally mandated coverages through the PPACA legislation of $9.5 million, and the balance of the reduction due to reduced member utilization of covered health care. Additionally, claims experience indicates a 9.0% decrease in medical claims and an 8.0% decrease in drug claims, net of premium deficiency. In fiscal year 2012, claims expense was decreased by $1.3 million to recognize the premium deficiency reserve. Additionally, claims experience indicates a 6.9% increase in medical claims and a 7.1% increase in drug claims, net of premium deficiency.
Current year administrative service fees expense decreased $1.0 million due to a new contract with lower per member charges, which took effect at the beginning of the current year. Other expenses increased $0.9 million due to increased wellness services provided.
West Virginia Public Employees Insurance Agency
Management’s Discussion and Analysis (continued)
1304-1069013 8
During fiscal year 2013, investment income was up $2.7 million from last year due to a larger amount of portfolio appreciation and flat interest and dividend earnings. For the previous year, investment income was down $5.9 million due to a smaller amount of portfolio appreciation and flat interest and dividend earnings.
Also, a $3.5 million transfer that was received in 2012 was not provided in 2013.
Year-end 2013 change in net position amounted to an incline of $39.1 million versus a decline of $9.1 million for the prior year for a positive difference between the two years of $48.2 million. As previously discussed, the improvement resulted from an increase in operating revenue of $15.0 million, a decrease in nonoperating revenue of $0.8 million and a reduction of total operating expenses of $34.0 million. The financial plan for 2013 indicated a decrease in total net assets of $28.0 million. However, it did not include the $15.2 million decrease of claims expense related to the premium deficiency reserve. Total claims costs for the current year were $68.5 million less than plan; however, the plan did not include the $15.2 million premium deficiency adjustment. Investment income was $6.3 million below plan, premium revenues were $5.4 million above plan, direct transfer was $3.5 million below plan, other revenue was $0.3 million below plan, managed care capitations and life insurance expenses were $3.1 million below plan, with administrative service fees and other $0.5 million above plan.
Year-end 2012 change in net position amounted to a decline of $9.1 million versus a decline of $5.3 million for the prior year for a negative difference between the two years of $3.8 million. Managed care and life insurance expenses were up $0.7 million. The effect of the recognition of the 2012 deficiency resulted in a $31.2 million increase in claims expense between the two years. Total claims expense was flat year to year. Investment income was down $5.9 million, and other expenses were up $0.2 million. The financial plan for 2012 indicated a decrease in total net position of $23.4 million. However, it did not include the $1.3 million decrease of claims expense related to the premium deficiency reserve. Total claims costs for the current year were $6.3 million less than plan; however, the plan did not include the $1.3 million premium deficiency adjustment. Investment income was $8.9 million below plan, premium revenues were $11.9 million above plan, managed care capitations and life insurance expenses were $1.7 million below plan, with administrative service fees and other $3.0 million below plan.
West Virginia Public Employees Insurance Agency
Management’s Discussion and Analysis (continued)
1304-1069013 9
ECONOMIC CONDITIONS
After allowing for the contribution to help fund retiree health care costs, which is included in the active policyholder premium amount, PEIA’s average active employee family monthly premium cost is $878 compared to the national average cost of $1,389. It should be noted that PEIA achieved an increase in plan assets of $23,859,883, excluding the effect of the current year premium deficiency reserve.
It has been reported, based on inescapable relevant science, that many high-ticket medical interventions, which account for the majority of the direct cost of health care, either do not advantage patients at all or do so minimally. New U.S. Department of Health and Human Services rules are expected to be completed in 2013, which aim to improve quality of care. The rules require the exchange of patient data in structured formats, the use of “evidence-based medicine,” and the use of standards and best practices for treating patients. It is hoped that the new evidence-based medicine requirement will significantly reduce health care costs and provide better medical outcomes for all.
In 2013, PEIA’s claims costs declined 6.7%.
Premium increases totaling $18.5 million were placed into effect in 2013.
CAPITAL ASSET AND LONG-TERM DEBT ACTIVITY
No computer software costs were capitalized in fiscal year 2013 and PEIA has no long-term debt.
REQUEST FOR INFORMATION
This financial report is designed to provide PEIA’s customers, governing officials, legislators, citizens, and taxpayers with a general overview of PEIA’s accountability for the money it receives. If you have questions about this report or need additional information, contact the Chief Financial Officer at (304) 558-7850.
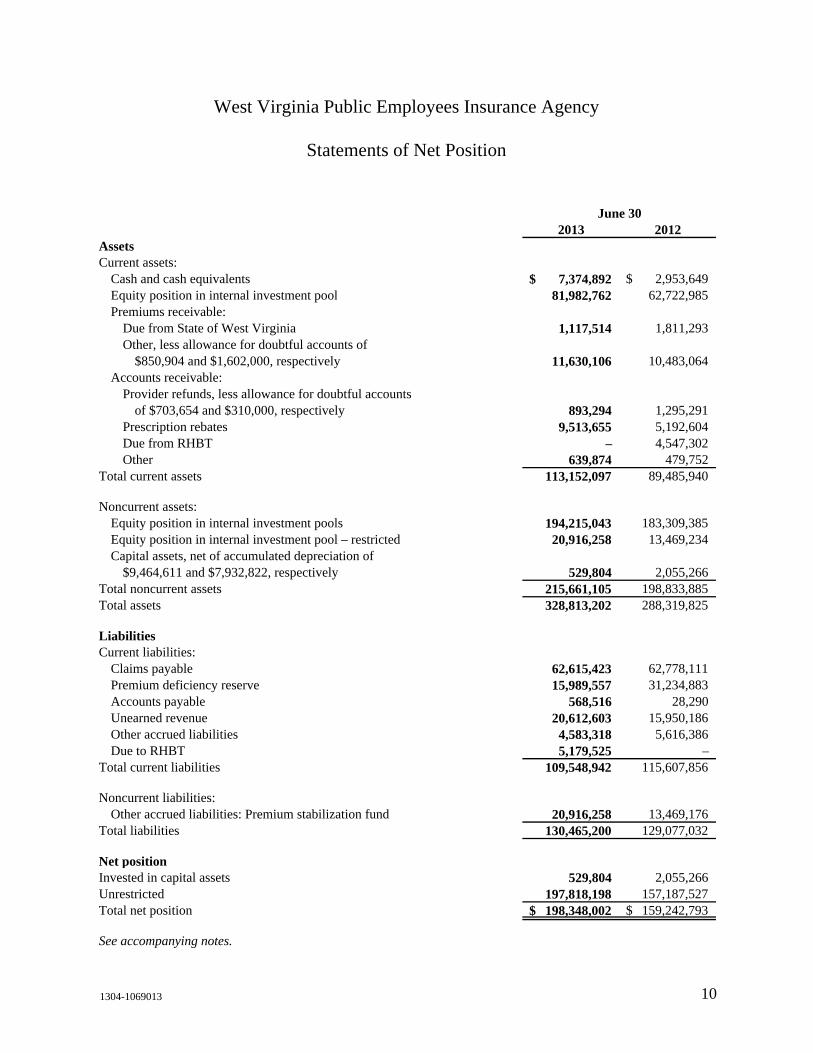
June 302013 2012
AssetsCurrent assets:
Cash and cash equivalents 7,374,892$ 2,953,649$ Equity position in internal investment pool 81,982,762 62,722,985 Premiums receivable:
Due from State of West Virginia 1,117,514 1,811,293 Other, less allowance for doubtful accounts of
$850,904 and $1,602,000, respectively 11,630,106 10,483,064 Accounts receivable:
Provider refunds, less allowance for doubtful accountsof $703,654 and $310,000, respectively 893,294 1,295,291
Prescription rebates 9,513,655 5,192,604 Due from RHBT – 4,547,302 Other 639,874 479,752
Total current assets 113,152,097 89,485,940
Noncurrent assets:Equity position in internal investment pools 194,215,043 183,309,385 Equity position in internal investment pool – restricted 20,916,258 13,469,234 Capital assets, net of accumulated depreciation of
$9,464,611 and $7,932,822, respectively 529,804 2,055,266 Total noncurrent assets 215,661,105 198,833,885 Total assets 328,813,202 288,319,825
LiabilitiesCurrent liabilities:
Claims payable 62,615,423 62,778,111 Premium deficiency reserve 15,989,557 31,234,883 Accounts payable 568,516 28,290 Unearned revenue 20,612,603 15,950,186 Other accrued liabilities 4,583,318 5,616,386 Due to RHBT 5,179,525 –
Total current liabilities 109,548,942 115,607,856
Noncurrent liabilities:Other accrued liabilities: Premium stabilization fund 20,916,258 13,469,176
Total liabilities 130,465,200 129,077,032
Net positionInvested in capital assets 529,804 2,055,266 Unrestricted 197,818,198 157,187,527 Total net position 198,348,002$ 159,242,793$
See accompanying notes.
West Virginia Public Employees Insurance Agency
Statements of Net Position
10 1304-1069013
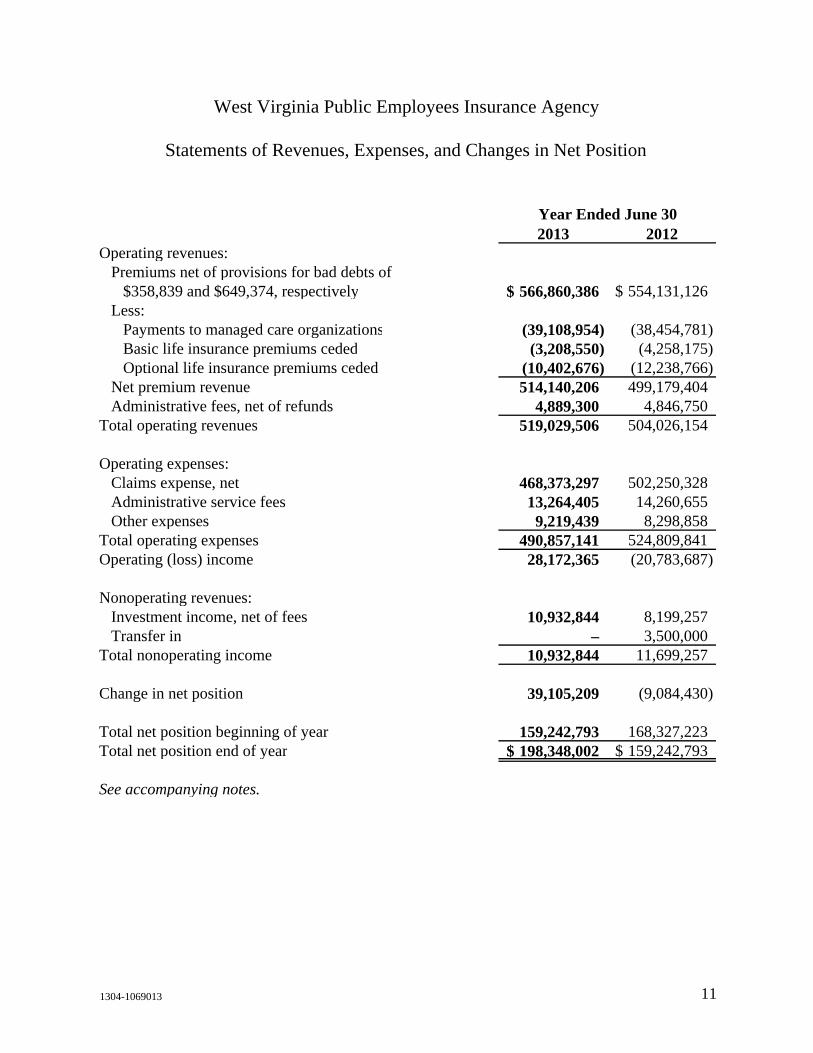
2013 2012Operating revenues:
Premiums net of provisions for bad debts of $358,839 and $649,374, respectively 566,860,386$ 554,131,126$
Less:Payments to managed care organizations (39,108,954) (38,454,781) Basic life insurance premiums ceded (3,208,550) (4,258,175) Optional life insurance premiums ceded (10,402,676) (12,238,766)
Net premium revenue 514,140,206 499,179,404 Administrative fees, net of refunds 4,889,300 4,846,750
Total operating revenues 519,029,506 504,026,154
Operating expenses:Claims expense, net 468,373,297 502,250,328 Administrative service fees 13,264,405 14,260,655 Other expenses 9,219,439 8,298,858
Total operating expenses 490,857,141 524,809,841 Operating (loss) income 28,172,365 (20,783,687)
Nonoperating revenues:Investment income, net of fees 10,932,844 8,199,257 Transfer in – 3,500,000
Total nonoperating income 10,932,844 11,699,257
Change in net position 39,105,209 (9,084,430)
Total net position beginning of year 159,242,793 168,327,223 Total net position end of year 198,348,002$ 159,242,793$
See accompanying notes.
West Virginia Public Employees Insurance Agency
Statements of Revenues, Expenses, and Changes in Net Position
Year Ended June 30
11 1304-1069013
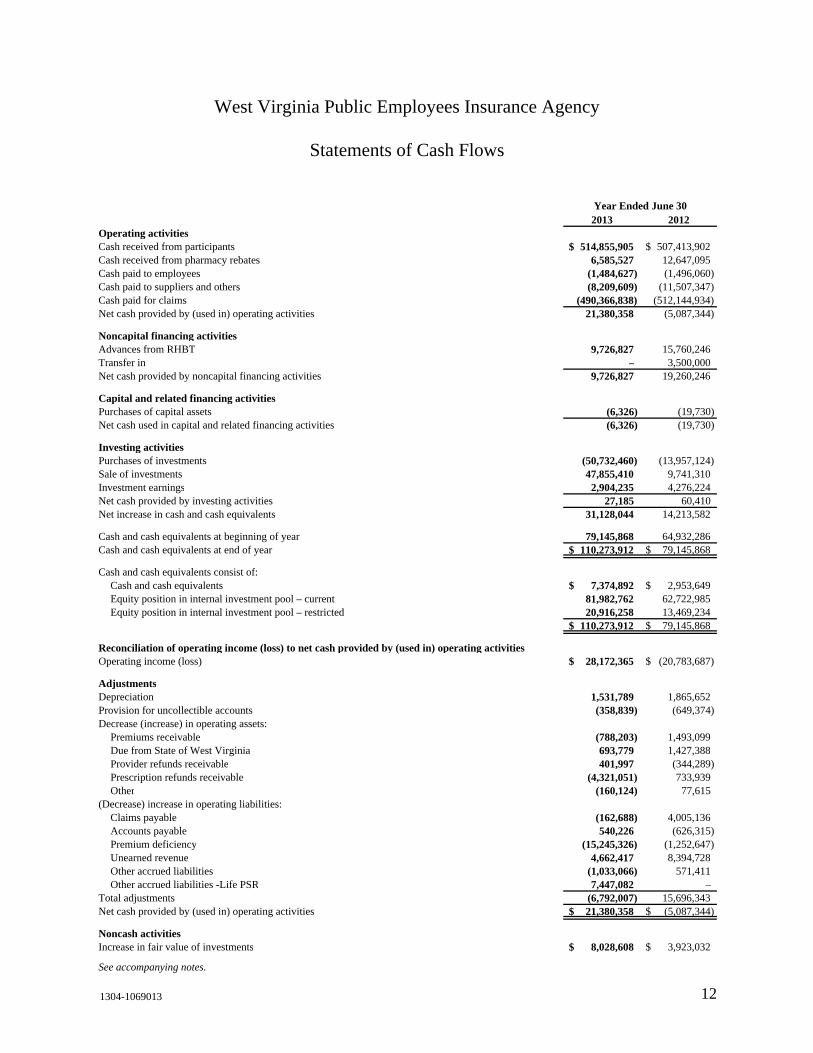
2013 2012Operating activitiesCash received from participants 514,855,905$ 507,413,902$ Cash received from pharmacy rebates 6,585,527 12,647,095 Cash paid to employees (1,484,627) (1,496,060) Cash paid to suppliers and others (8,209,609) (11,507,347) Cash paid for claims (490,366,838) (512,144,934) Net cash provided by (used in) operating activities 21,380,358 (5,087,344)
Noncapital financing activitiesAdvances from RHBT 9,726,827 15,760,246 Transfer in – 3,500,000 Net cash provided by noncapital financing activities 9,726,827 19,260,246
Capital and related financing activitiesPurchases of capital assets (6,326) (19,730) Net cash used in capital and related financing activities (6,326) (19,730)
Investing activitiesPurchases of investments (50,732,460) (13,957,124) Sale of investments 47,855,410 9,741,310 Investment earnings 2,904,235 4,276,224 Net cash provided by investing activities 27,185 60,410 Net increase in cash and cash equivalents 31,128,044 14,213,582
Cash and cash equivalents at beginning of year 79,145,868 64,932,286 Cash and cash equivalents at end of year 110,273,912$ 79,145,868$
Cash and cash equivalents consist of:Cash and cash equivalents 7,374,892$ 2,953,649$ Equity position in internal investment pool – current 81,982,762 62,722,985 Equity position in internal investment pool – restricted 20,916,258 13,469,234
110,273,912$ 79,145,868$
Reconciliation of operating income (loss) to net cash provided by (used in) operating activitiesOperating income (loss) 28,172,365$ (20,783,687)$
AdjustmentsDepreciation 1,531,789 1,865,652 Provision for uncollectible accounts (358,839) (649,374) Decrease (increase) in operating assets:
Premiums receivable (788,203) 1,493,099 Due from State of West Virginia 693,779 1,427,388 Provider refunds receivable 401,997 (344,289) Prescription refunds receivable (4,321,051) 733,939 Other (160,124) 77,615
(Decrease) increase in operating liabilities:Claims payable (162,688) 4,005,136 Accounts payable 540,226 (626,315) Premium deficiency (15,245,326) (1,252,647) Unearned revenue 4,662,417 8,394,728 Other accrued liabilities (1,033,066) 571,411 Other accrued liabilities -Life PSR 7,447,082 –
Total adjustments (6,792,007) 15,696,343 Net cash provided by (used in) operating activities 21,380,358$ (5,087,344)$
Noncash activitiesIncrease in fair value of investments 8,028,608$ 3,923,032$
See accompanying notes.
Year Ended June 30
West Virginia Public Employees Insurance Agency
Statements of Cash Flows
12 1304-1069013
1304-1069013 13
West Virginia Public Employees Insurance Agency
Notes to Financial Statements
June 30, 2013
1. Reporting Entity
The State of West Virginia Public Employees Insurance Agency (PEIA) was established under the Public Employees Insurance Act of 1971 (Act). PEIA is an agency of the State of West Virginia and, accordingly, is reported as an enterprise fund of the primary government in the State’s Comprehensive Annual Financial Report (CAFR).
PEIA provides the following basic employee benefit coverage to all participants: hospital, surgical, group major medical, basic group life, accidental death, and prescription drug coverage for active employees of the State of West Virginia (State) and various related State and non-State agencies. Additionally, all participants may elect to purchase additional life insurance under the optional life insurance policy. All premium rates are established based upon projected coverage costs as reviewed and approved by the Finance Board of PEIA. See “Budgetary Requirements” for further discussion of this process. PEIA’s enrollment consists of approximately 77,000 health and basic life insurance policyholders, and 14,000 policyholders with life insurance only. PEIA insures approximately 172,000 individuals, including participants and dependents.
During the 2006 Regular Session of the West Virginia Legislature, House Bill 4654 was enacted creating the West Virginia Retiree Health Benefit Trust (RHBT) Fund for the purpose of providing for and administering retiree postemployment health care benefits, and the respective revenues and costs of those benefits as a cost-sharing multiple employer plan. As a consequence of the legislation, health insurance policies covering approximately 38,000 retirees and their dependents, along with the related revenues, claims costs, and expenses were transferred to RHBT effective July 1, 2006. RHBT and PEIA jointly share administrative duties relating to the other postemployment benefit (OPEB) operations. Both entities are housed in the same office space and share expenses. Expenses directly attributable to the OPEB plan are charged to RHBT. Other operating expenses, except personnel, are allocated based on policyholder count between PEIA and RHBT. Personnel expenses attributable to three dedicated employees are charged in full to RHBT, while the balance of the combined expense is allocated between the two entities based on estimated time requirements.
The basic financial statements of PEIA are intended to present the financial position, changes in financial position, and cash flows of only that portion of the business-type activities of the State of West Virginia that is attributable to the transactions of PEIA. They do not purport to, and do not, present fairly the net position of the State of West Virginia as of June 30, 2013 and 2012, and the changes in its financial position or, where applicable, its cash flows for the years then ended, in conformity with U.S. generally accepted accounting principles (GAAP).
West Virginia Public Employees Insurance Agency
Notes to Financial Statements (continued)
1304-1069013 14
2. Summary of Significant Accounting Policies
Basis of Reporting
PEIA operates as an enterprise fund. Accordingly, the financial statements of PEIA have been prepared on the accrual basis in conformity with GAAP for governmental entities as prescribed or permitted by the Governmental Accounting Standards Board (GASB). Operating revenues are derived mainly from premiums earned net of related reinsurance premiums, plus administrative fees billed. Operating expenses consist primarily of claims, administrative service fees, and various general and administrative costs. All other items are considered nonoperating.
Annual Financial Plan
The Act requires the Finance Board of PEIA to prepare a proposed annual financial plan. The plan must be designed to generate sufficient revenues to meet all expected expenses, including insurance, administrative expenses, and incurred but not reported claims (IBNR) of PEIA. An independent professional actuary must review the plan and give an opinion stating that the plan may be reasonably expected to generate sufficient revenue to meet estimated insurance claims and administrative expenses. The financial plan must be presented to the governor and the legislature no later than January 1, prior to the beginning of the new plan year.
The PEIA Finance Board establishes PEIA premiums based upon its approved annual financial plan. The financial plan projects the anticipated costs of the program for each fiscal year and the premium levels necessary to meet these costs. Any variances between projected and incurred costs are incorporated into subsequent financial plans and subsequent premiums are adjusted accordingly on a prospective basis. Premiums assessed by PEIA are not subject to retroactive adjustment based upon actual costs incurred.
Cash and Cash Equivalents
Cash and cash equivalents include short-term investments with original maturities of 90 days or less. Cash and cash equivalents principally consist of amounts on deposit with the West Virginia State Treasurer’s office, outside financial institutions, and amounts deposited in an internal investment pool managed by the West Virginia Board of Treasury Investments (BTI) that is reported as part of equity position in internal investment pool – current-unrestricted and noncurrent-restricted, respectively.
West Virginia Public Employees Insurance Agency
Notes to Financial Statements (continued)
1304-1069013 15
2. Summary of Significant Accounting Policies (continued)
Premiums Receivable
All premiums receivable are reported at their gross premium value due from employers and individual subscribers. The gross value is then reduced by the estimated portion that is expected to be uncollectible based upon management’s review of the payment status of the underlying accounts and other economic factors that are deemed necessary in the circumstances.
Accounts Receivable
Accounts receivable include overpayments made by third-party administrators that are due to PEIA, estimated prescription refunds, and rebates that are due PEIA from third-party administrators and other drug companies. The estimated prescription refunds/rebate receivable is based upon estimated prescription claim count and historical average rebate per claim.
Equity Position in Internal Investment Pools
PEIA owns equity positions in state government investment pools managed by the West Virginia Investment Management Board (WVIMB) and the BTI. Some investment pool funds are subject to market risk because of changes in interest rates, bond prices, and stock prices. Investment earnings and losses are allocated to PEIA based on the balance of PEIA’s investments maintained in relation to the total investments of all state agencies participating in the pool. The equity position in internal investment pools is reported at fair value and changes in fair value are included in investment income.
A 13-member Board of Trustees governs the WVIMB. Three members of the Board serve by virtue of their office: the Governor, the Auditor, and the Treasurer. The other ten are appointed by the Governor and confirmed by the State Senate. All appointees must have experience in pension management, institutional management, or financial markets. In addition, one must be an attorney experienced in finance and investment matters and another must be a certified public accountant. Only six of the ten appointed Trustees may be from the same political party. The Governor serves as Chairman of the Board. A Vice-Chairman is elected by the Trustees. A Secretary, who need not be a member of the Board, is also elected by the Trustees to keep a record of the proceedings of the Board. Details regarding these investment pools and a copy of the WVIMB financial report can be obtained by contacting: West Virginia Investment Management Board, 500 Virginia Street, East, Suite 200, Charleston, West Virginia 25301 or by calling (304) 645-5939.
West Virginia Public Employees Insurance Agency
Notes to Financial Statements (continued)
1304-1069013 16
2. Summary of Significant Accounting Policies (continued)
A five-member Board of Directors governs the BTI. The Governor, Treasurer, and Auditor serve as ex-officio members of the Board. The Governor appoints the two remaining members subject to the advice and consent of the State Senate. Of the two members appointed by the Governor, one shall be a certified public accountant and one shall be an attorney, and both shall have experience in finance, investing, and management. The State Treasurer is Chairman of the Board. The BTI prepares separately issued financial statements covering the pooled fund, which can be obtained from its website or a published copy from the West Virginia Board of Treasury Investments, 1900 Kanawha Boulevard, East, Building 1, Room E–122, Charleston, West Virginia 25305.
Capital Assets
Capital assets with an initial cost of $1,000 or greater are recorded at cost. PEIA has assigned a useful life of three to five years for capital assets. Depreciation expense computed using the straight-line method was $1,531,789 and $1,865,562 for the years ended June 30, 2013 and 2012, respectively.
Claims Payable and Expense
The liability for unpaid claims and claims processing costs is based on an actuarial estimate of the ultimate cost of settling such claims incurred as of the statement of net position date (including claims reported and in process of settlement, claims reported but not yet processed for settlement, and claims incurred but not yet reported or processed for settlement). The estimated actuarial liability reflects certain assumptions, which include such factors as enrollment, utilization, inflation, and other societal and economic factors. Adjustments to the estimated actuarial liability for the final settlement of claims will be reflected in the year that the actual results of the settlement of the claims are made and are known. The estimated liability is adjusted annually based on the most current claim incurrence and claim settlement history (see Note 7). Year-end claims payable balances are generally liquidated within the next fiscal year. Claims relating to participants in managed care organizations (MCOs) as well as claims relating to participants covered under the optional life insurance plan are not considered in the liability, as PEIA has no liability for the participants who elect such coverage. Additionally, the estimated liability for unpaid claims and claims processing costs is recorded net of amounts ceded to reinsurers for basic life benefits, as management believes these reinsured risks are fully recoverable. However, in the event a reinsurer is unable financially to satisfy an obligation, PEIA is responsible for such liability. Claims expense is reported net of pharmacy rebate income of $10,906,578 and $11,913,156 for the years ended June 30, 2013 and 2012, respectively.
West Virginia Public Employees Insurance Agency
Notes to Financial Statements (continued)
1304-1069013 17
2. Summary of Significant Accounting Policies (continued)
Premium Deficiency Reserve
Premium deficiency is required when policies in force as of the financial statement date are expected to produce a loss when claims cost (including IBNR), plus expected claims adjustment expenses, are expected to exceed related premiums. Management has recorded a premium deficiency reserve of $15,989,557 and $31,234,883 as of June 30, 2013 and 2012, respectively. In making its determination, management took into consideration anticipated premium revenue and claims costs. PEIA did not include anticipated investment income in determining whether a premium deficiency exists. Adjustments to the estimated premium deficiency liability are reflected as a change in estimate in the year the actual results are known.
PEIA participants are not subject to supplemental assessment in the event of a premium deficiency. At the time of premium payment, the risk of loss due to incurred benefit costs is transferred from the participant to PEIA. If the assets of PEIA were to be exhausted, participants would not be responsible for the liabilities.
Unearned Revenue
Unearned revenue includes premium revenues collected for future contract periods. These revenues will be recognized in the operating periods in which they are earned.
Insurance Programs and Related Premium Revenues
PEIA offers the following types of coverage to its participants: health coverage through a self-insured preferred provider benefit (PPB) plan, health coverage through external MCOs, and life and accidental death and dismemberment (AD&D) insurance benefits under basic and optional plans. PEIA collects premiums for participants in the PPB plan and uses these premiums in the administration of the plan. Additionally, PEIA has the statutory authority to raise additional revenues in the form of premiums without the need for external (legislative) action.
For participants who elect coverage through MCOs, PEIA collects premiums from employers and remits a capitation fee to an MCO carrier. The capitation fees paid by PEIA to each MCO are in accordance with their respective contracts. Benefits are the responsibility of each MCO carrier. The premiums earned by PEIA have been included in gross premium revenue while the capitation fees submitted to each MCO carrier are reflected as expenses to MCOs on the financial statements.
West Virginia Public Employees Insurance Agency
Notes to Financial Statements (continued)
1304-1069013 18
2. Summary of Significant Accounting Policies (continued)
As of the June 2013 coverage month, PEIA provided health coverage to 125 state agency divisions with approximately 22,000 primary participants (not including dependents), 55 county school boards with approximately 32,000 primary participants, 542 local government entities with approximately 12,000 primary participants, and 24 college and university entities with approximately 11,000 primary participants. Approximately 95,000 dependents participated in PEIA health plans as well.
As of the June 2012 coverage month, PEIA provided health coverage to 124 state agency divisions with approximately 22,000 primary participants (not including dependents), 55 county school boards with approximately 32,000 primary participants, 541 local government entities with approximately 12,000 primary participants, and 24 college and university entities with approximately 11,000 primary participants. Approximately 93,000 dependents participated in PEIA health plans as well.
Employees covered through PEIA are eligible to obtain life insurance coverage under basic and optional life insurance plans. Basic life benefits and AD&D benefits of $10,000 are provided to active state employees under the age of 65 at no cost to the employee. Coverage amounts decrease with age. No AD&D benefits are available to retirees. Basic life benefits are available to retirees with coverage ranging from $2,500 to $5,000 depending on age. For these basic life benefits, PEIA collects premiums and submits them to the insurance carrier. PEIA has reinsured 100% of these basic benefits; however, PEIA remains contingently liable in the event the insurer does not honor its obligation. The premiums earned for basic life insurance are reflected in gross premiums and the related amounts ceded to the reinsurer are reflected as life reinsurance premiums on the financial statements.
Active employees may elect to obtain additional optional coverage for both life and AD&D with coverage from $2,250 to $500,000 that decreases with age. Active employees may also elect dependent optional life coverage and AD&D at a level up to $20,000 per spouse and $10,000 per child. Retirees may obtain optional life insurance coverage from $2,500 to $150,000 depending on age; however, optional AD&D insurance is not available to retirees. Retirees may also elect dependent optional life coverage at levels up to $20,000 for a spouse and $10,000 per child. Amounts collected by PEIA from employees for optional coverage totaled $10,366,107 and $12,154,913 during the fiscal years ended June 30, 2013 and 2012, respectively, and were remitted directly to the carrier.
West Virginia Public Employees Insurance Agency
Notes to Financial Statements (continued)
1304-1069013 19
2. Summary of Significant Accounting Policies (continued)
Revenues include an administrative fee that PEIA charges to all participating entities in the plan. The fee is based on the participating entities’ number of employees enrolled in the plan.
Administrative Service Fees
PEIA contracts with and pays administrative service fees to two third-party administrators. Services include processing of insurance claims, precertification reviews, utilization reviews, and various other duties. The majority of related fees are assessed each month based upon the number of covered participants or claims processed at predetermined rates without regard to the period in which a claim is incurred, processed, or settled.
Compensated Absences, Including Postretirement Benefits
Employees fully vest in all earned but unused annual leave and PEIA accrues for obligations that may arise in connection with compensated absences for vacation at the current rate of employee pay. In accordance with state personnel policies, employees vest in any remaining unused sick leave only upon retirement, at which time any unused compensated absence time can be converted into employer paid premiums for postretirement health care coverage through RHBT, or be converted into a greater retirement benefit under the state’s Public Employees’ Retirement System. Employees hired after July 1, 2001, are not eligible to convert unused time to employer paid premiums.
Operating Revenues and Expenses
Balances classified as operating revenues and expenses are those that comprise PEIA’s ongoing operations. Principal operating revenues include health insurance premiums, life insurance premiums, and insurance administration fees, less amounts paid to managed care organizations and life insurance reinsurers. Operating expenses include the cost of medical claims, drug claims, claims adjudication, administration, and depreciation of capital assets. Other revenues and expenses are classified as nonoperating in the financial statements.
West Virginia Public Employees Insurance Agency
Notes to Financial Statements (continued)
1304-1069013 20
2. Summary of Significant Accounting Policies (continued)
Net Position
As required by GASB Statement 34, PEIA displays net position in three components, if applicable: net investment in capital assets, restricted; and unrestricted.
Net Investment in Capital Assets – This component of net position consists of capital assets, net of accumulated depreciation and reduced by the outstanding balances of any bonds, mortgages, notes, or other borrowings that are attributable to the acquisition, construction, or improvement of those assets.
Unrestricted Assets – Unrestricted assets consist of assets that do not meet the definition of “restricted” or “net investment in capital assets.” In the governmental environment, assets are often designated to indicate that management does not consider them to be available for general operations. These types of constraints on resources are internal and management can remove or modify them. Such internal designations are not reported on the face of the statements of net position.
West Virginia Code Section 5-16-25 requires the Finance Board of PEIA to maintain a reserve of 10% of projected plan costs for general operation purposes and provide future plan stability. As of June 30, 2013 and 2012, PEIA has restated net position to comply with this code section. In the event the reserve fund exceeds 15% of the actuarial recommended reserve of 20% to 25% of total projected costs, the excess is required to be transferred to RHBT. There were no excess reserves to be transferred for the years ended June 30, 2013 or 2012.
West Virginia Public Employees Insurance Agency
Notes to Financial Statements (continued)
1304-1069013 21
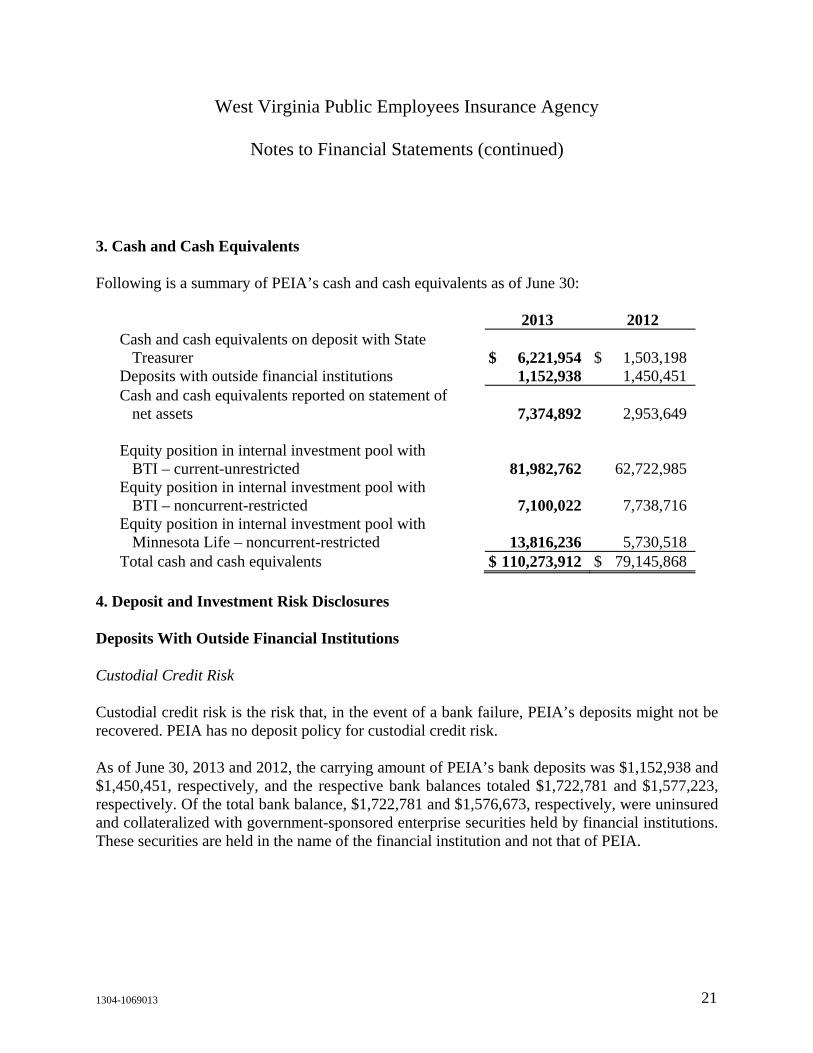
3. Cash and Cash Equivalents
Following is a summary of PEIA’s cash and cash equivalents as of June 30:
2013 2012 Cash and cash equivalents on deposit with State
Treasurer $ 6,221,954 $ 1,503,198 Deposits with outside financial institutions 1,152,938 1,450,451 Cash and cash equivalents reported on statement of
net assets 7,374,892 2,953,649 Equity position in internal investment pool with
BTI – current-unrestricted 81,982,762 62,722,985 Equity position in internal investment pool with
BTI – noncurrent-restricted 7,100,022 7,738,716 Equity position in internal investment pool with
Minnesota Life – noncurrent-restricted 13,816,236 5,730,518 Total cash and cash equivalents $ 110,273,912 $ 79,145,868
4. Deposit and Investment Risk Disclosures
Deposits With Outside Financial Institutions
Custodial Credit Risk
Custodial credit risk is the risk that, in the event of a bank failure, PEIA’s deposits might not be recovered. PEIA has no deposit policy for custodial credit risk.
As of June 30, 2013 and 2012, the carrying amount of PEIA’s bank deposits was $1,152,938 and $1,450,451, respectively, and the respective bank balances totaled $1,722,781 and $1,577,223, respectively. Of the total bank balance, $1,722,781 and $1,576,673, respectively, were uninsured and collateralized with government-sponsored enterprise securities held by financial institutions. These securities are held in the name of the financial institution and not that of PEIA.
West Virginia Public Employees Insurance Agency
Notes to Financial Statements (continued)
1304-1069013 22
4. Deposit and Investment Risk Disclosures (continued)
West Virginia Money Market Pool (Formerly Cash Liquidity Pool) – Equity Position in Internal Investment Pool – Current – Managed by BTI
Credit Risk
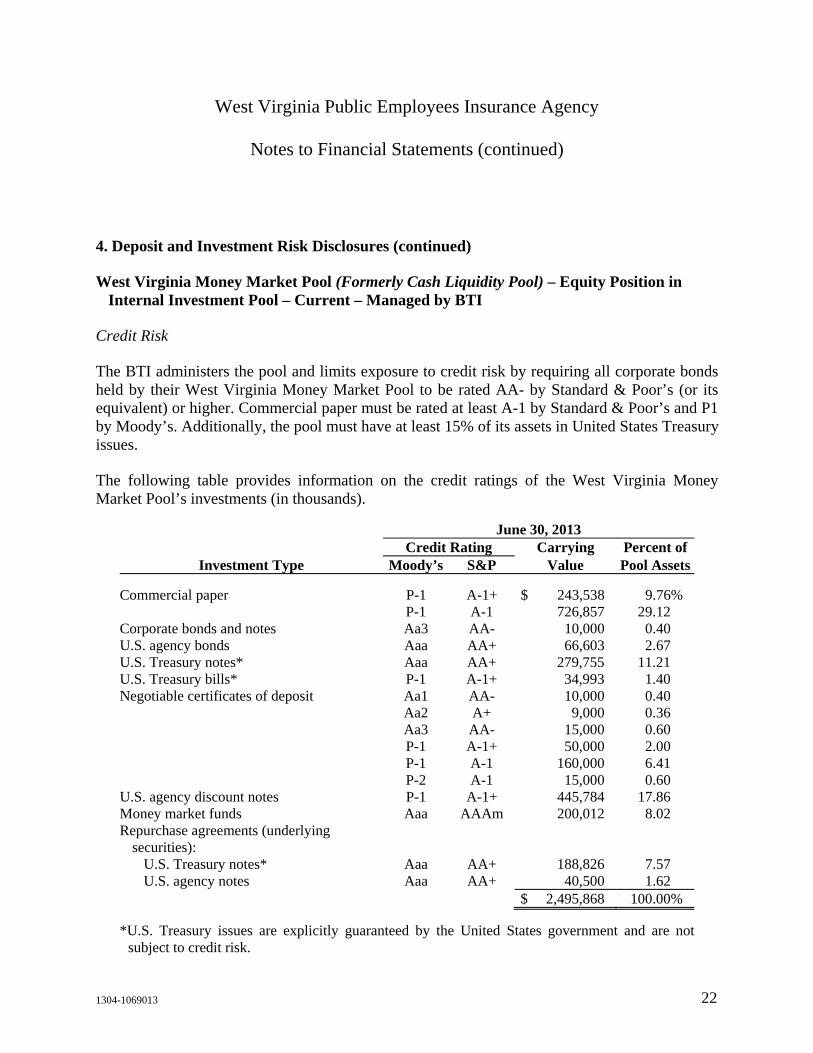
The BTI administers the pool and limits exposure to credit risk by requiring all corporate bonds held by their West Virginia Money Market Pool to be rated AA- by Standard & Poor’s (or its equivalent) or higher. Commercial paper must be rated at least A-1 by Standard & Poor’s and P1 by Moody’s. Additionally, the pool must have at least 15% of its assets in United States Treasury issues.
The following table provides information on the credit ratings of the West Virginia Money Market Pool’s investments (in thousands).
June 30, 2013 Credit Rating Carrying Percent of
Investment Type Moody’s S&P Value Pool Assets Commercial paper P-1 A-1+ $ 243,538 9.76% P-1 A-1 726,857 29.12 Corporate bonds and notes Aa3 AA- 10,000 0.40 U.S. agency bonds Aaa AA+ 66,603 2.67 U.S. Treasury notes* Aaa AA+ 279,755 11.21 U.S. Treasury bills* P-1 A-1+ 34,993 1.40 Negotiable certificates of deposit Aa1 AA- 10,000 0.40 Aa2 A+ 9,000 0.36 Aa3 AA- 15,000 0.60 P-1 A-1+ 50,000 2.00 P-1 A-1 160,000 6.41 P-2 A-1 15,000 0.60 U.S. agency discount notes P-1 A-1+ 445,784 17.86 Money market funds Aaa AAAm 200,012 8.02 Repurchase agreements (underlying
securities): U.S. Treasury notes* Aaa AA+ 188,826 7.57 U.S. agency notes Aaa AA+ 40,500 1.62
$ 2,495,868 100.00%
*U.S. Treasury issues are explicitly guaranteed by the United States government and are not subject to credit risk.
West Virginia Public Employees Insurance Agency
Notes to Financial Statements (continued)
1304-1069013 23
4. Deposit and Investment Risk Disclosures (continued)
Custodial Credit Risk
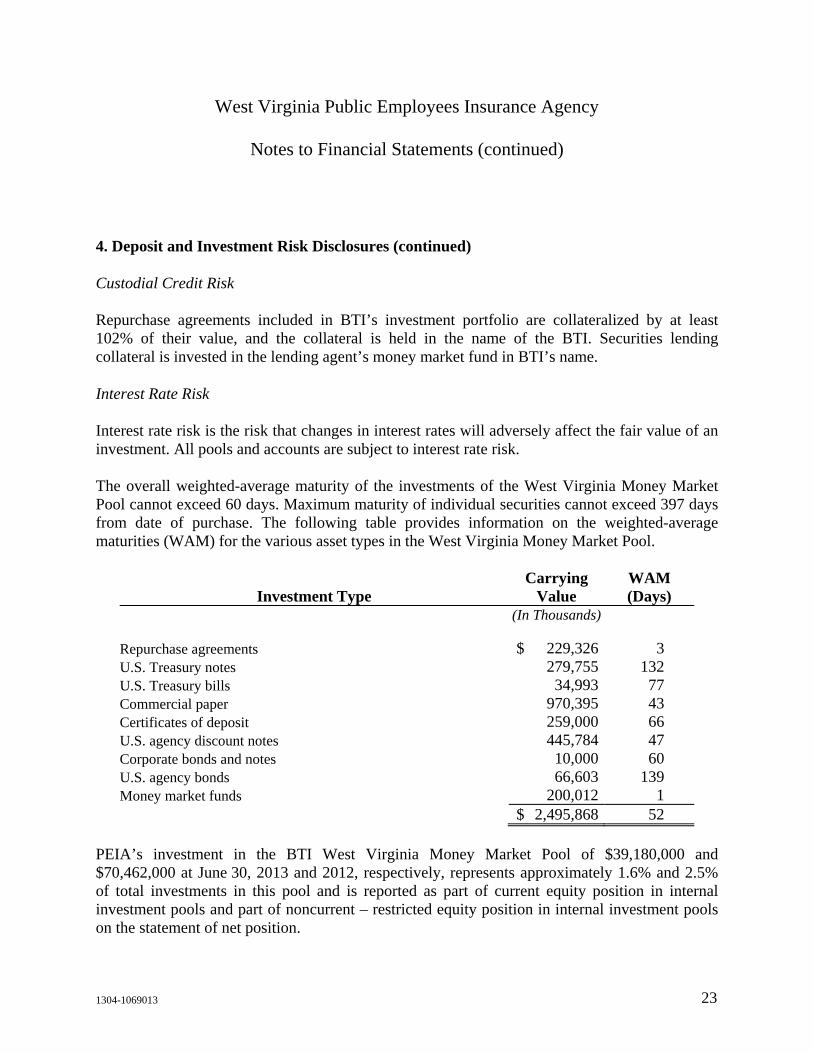
Repurchase agreements included in BTI’s investment portfolio are collateralized by at least 102% of their value, and the collateral is held in the name of the BTI. Securities lending collateral is invested in the lending agent’s money market fund in BTI’s name.
Interest Rate Risk
Interest rate risk is the risk that changes in interest rates will adversely affect the fair value of an investment. All pools and accounts are subject to interest rate risk.
The overall weighted-average maturity of the investments of the West Virginia Money Market Pool cannot exceed 60 days. Maximum maturity of individual securities cannot exceed 397 days from date of purchase. The following table provides information on the weighted-average maturities (WAM) for the various asset types in the West Virginia Money Market Pool.
Carrying WAM Investment Type Value (Days)
(In Thousands)
Repurchase agreements $ 229,326 3 U.S. Treasury notes 279,755 132 U.S. Treasury bills 34,993 77 Commercial paper 970,395 43 Certificates of deposit 259,000 66 U.S. agency discount notes 445,784 47 Corporate bonds and notes 10,000 60 U.S. agency bonds 66,603 139 Money market funds 200,012 1 $ 2,495,868 52
PEIA’s investment in the BTI West Virginia Money Market Pool of $39,180,000 and $70,462,000 at June 30, 2013 and 2012, respectively, represents approximately 1.6% and 2.5% of total investments in this pool and is reported as part of current equity position in internal investment pools and part of noncurrent – restricted equity position in internal investment pools on the statement of net position.
West Virginia Public Employees Insurance Agency
Notes to Financial Statements (continued)
1304-1069013 24
4. Deposit and Investment Risk Disclosures (continued)
PEIA’s investment in the BTI West Virginia Short Term Bond Pool of $49,879,000 at June 30, 2013, represents approximately 2.0% of total investments in this pool and is reported as part of current equity position in internal investment pools on the statement of net position. PEIA acquired the West Virginia Short Term Bond Pool on April 3, 2013.
Equity Position in Internal Investment Pools – Noncurrent-Unrestricted Managed by WVIMB
PEIA Fund
This investment fund was specifically designed for PEIA by WVIMB based on PEIA’s unique cash flow needs. PEIA is the only state agency participating in this fund and owns 100% of the total assets. The fund invests in various pools managed by WVIMB.
West Virginia statute mandates that the PEIA Fund shall be managed by WVIMB.
Investment Objectives
This fund’s investment objective is to provide adequate liquidity to meet cash flow requirements and allow for growth of assets in an amount at least equal to inflation.
Asset Allocation
Based upon the WVIMB’s determination of the appropriate risk tolerance for the fund, the WVIMB has adopted the following broad asset allocation guidelines for the assets managed for the PEIA Fund. (Policy targets have been established on a market value basis.) The asset values of the pools below are reported in equity position in internal investment pools – noncurrent-unrestricted on the statement of net assets.
West Virginia Public Employees Insurance Agency
Notes to Financial Statements (continued)
1304-1069013 25
4. Deposit and Investment Risk Disclosures (continued)
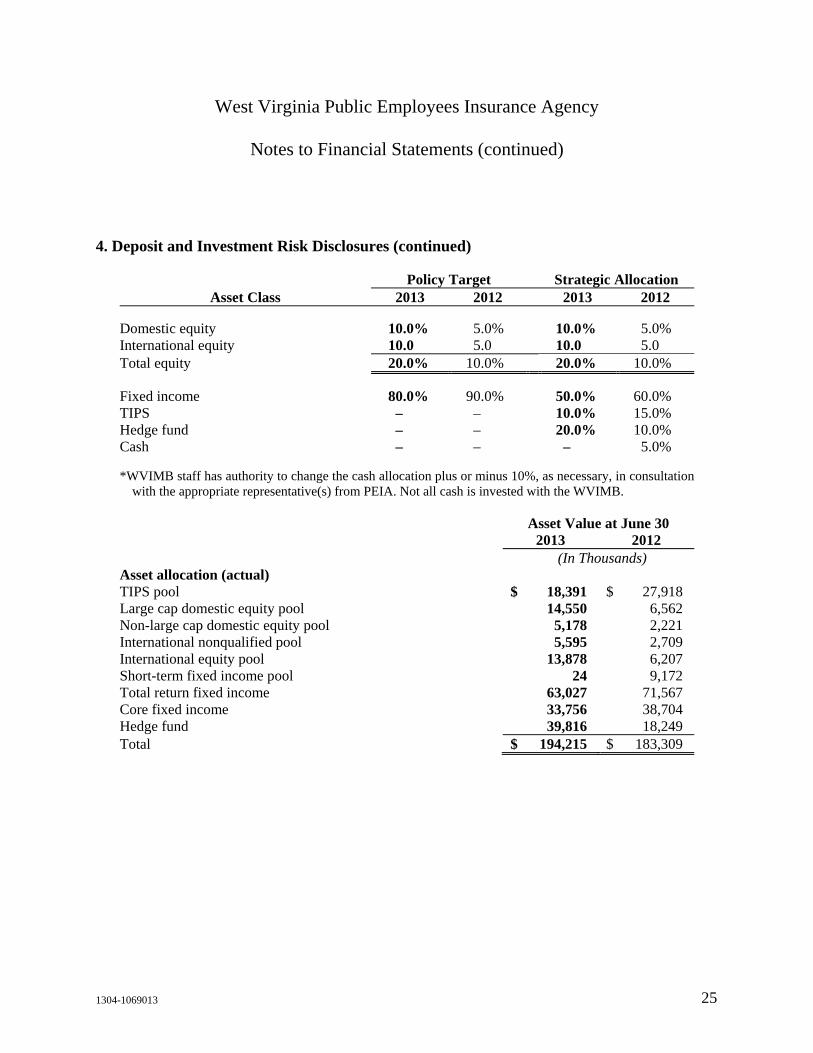
Policy Target Strategic Allocation Asset Class 2013 2012 2013 2012
Domestic equity 10.0% 5.0% 10.0% 5.0% International equity 10.0 5.0 10.0 5.0 Total equity 20.0% 10.0% 20.0% 10.0% Fixed income 80.0% 90.0% 50.0% 60.0% TIPS – – 10.0% 15.0% Hedge fund – – 20.0% 10.0% Cash – – – 5.0%
*WVIMB staff has authority to change the cash allocation plus or minus 10%, as necessary, in consultation with the appropriate representative(s) from PEIA. Not all cash is invested with the WVIMB.
Asset Value at June 30 2013 2012 (In Thousands) Asset allocation (actual) TIPS pool $ 18,391 $ 27,918 Large cap domestic equity pool 14,550 6,562 Non-large cap domestic equity pool 5,178 2,221 International nonqualified pool 5,595 2,709 International equity pool 13,878 6,207 Short-term fixed income pool 24 9,172 Total return fixed income 63,027 71,567 Core fixed income 33,756 38,704 Hedge fund 39,816 18,249 Total $ 194,215 $ 183,309
West Virginia Public Employees Insurance Agency
Notes to Financial Statements (continued)
1304-1069013 26
4. Deposit and Investment Risk Disclosures (continued)
Asset Class Risk Disclosures
U.S. Treasury Inflation Protected Securities (TIPS)
Credit Risk
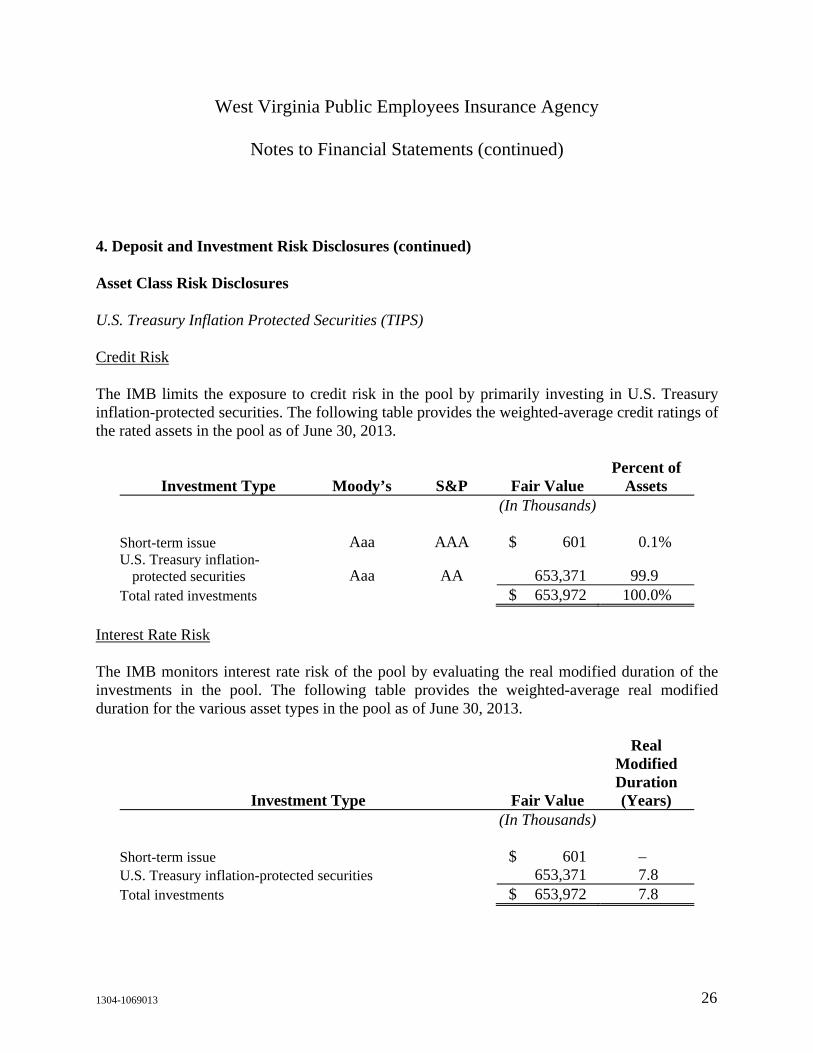
The IMB limits the exposure to credit risk in the pool by primarily investing in U.S. Treasury inflation-protected securities. The following table provides the weighted-average credit ratings of the rated assets in the pool as of June 30, 2013.
Percent of Investment Type Moody’s S&P Fair Value Assets
(In Thousands) Short-term issue Aaa AAA $ 601 0.1% U.S. Treasury inflation-
protected securities Aaa AA 653,371 99.9 Total rated investments $ 653,972 100.0%
Interest Rate Risk
The IMB monitors interest rate risk of the pool by evaluating the real modified duration of the investments in the pool. The following table provides the weighted-average real modified duration for the various asset types in the pool as of June 30, 2013.
Real
Modified Duration
Investment Type Fair Value (Years) (In Thousands)
Short-term issue $ 601 – U.S. Treasury inflation-protected securities 653,371 7.8 Total investments $ 653,972 7.8
West Virginia Public Employees Insurance Agency
Notes to Financial Statements (continued)
1304-1069013 27
4. Deposit and Investment Risk Disclosures (continued)
The pool invests in TIPS, and its objective is to match the performance of the Barclay’s Capital U.S. TIPS Bond Index on an annualized basis over rolling three-year to five-year periods, gross of fees. Assets are managed by State Street Global Advisors. PEIA’s amount invested in the TIPS Pool of $18,391,000 and $27,918,000 at June 30, 2013, and 2012, respectively, represented approximately 2.8% and 3.8% respectively, of total investments in this pool.
Large Cap Domestic Equity Pool
This pool holds equity securities of U.S. companies and money market funds with the highest credit rating. PEIA’s amount invested in the Large Cap Domestic Equity Pool of $14,550,000 and $6,562,000 at June 30, 2013 and 2012, respectively, represents approximately 0.61% and 0.32%, respectively, of total investments in this pool.
Non-Large Cap Domestic Equity Pool
This pool holds equity securities of U.S. companies and money market funds with the highest credit rating. PEIA’s amount invested in the Non-Large Cap Domestic Equity Pool of $5,178,000 and $2,221,000 at June 30, 2013 and 2012, respectively, represents approximately 0.61% and 0.32%, respectively, of total investments in this pool.
International Non-qualified Pool
This pool holds an institutional mutual fund that invests in equities denominated in foreign currencies. West Virginia statute limits the amount of international securities to no more than 30% of the total assets managed by the WVIMB. The value of this investment was $122,091,000 and $87,448,000 at June 30, 2013 and 2012, respectively. This investment, although denominated in U.S. dollars, is exposed to foreign currency risk through underlying investments. The specific currencies of the underlying investments were not available. West Virginia statute limits the amount of international securities to no more than 30% of the total assets managed by the WVIMB. PEIA’s amount invested in the International Non-qualified Pool of $5,595,000 and $2,709,000 at June 30, 2013 and 2012, respectively, represents approximately 4.6% and 3.1%, respectively, of total investments in this pool.
West Virginia Public Employees Insurance Agency
Notes to Financial Statements (continued)
1304-1069013 28
4. Deposit and Investment Risk Disclosures (continued)
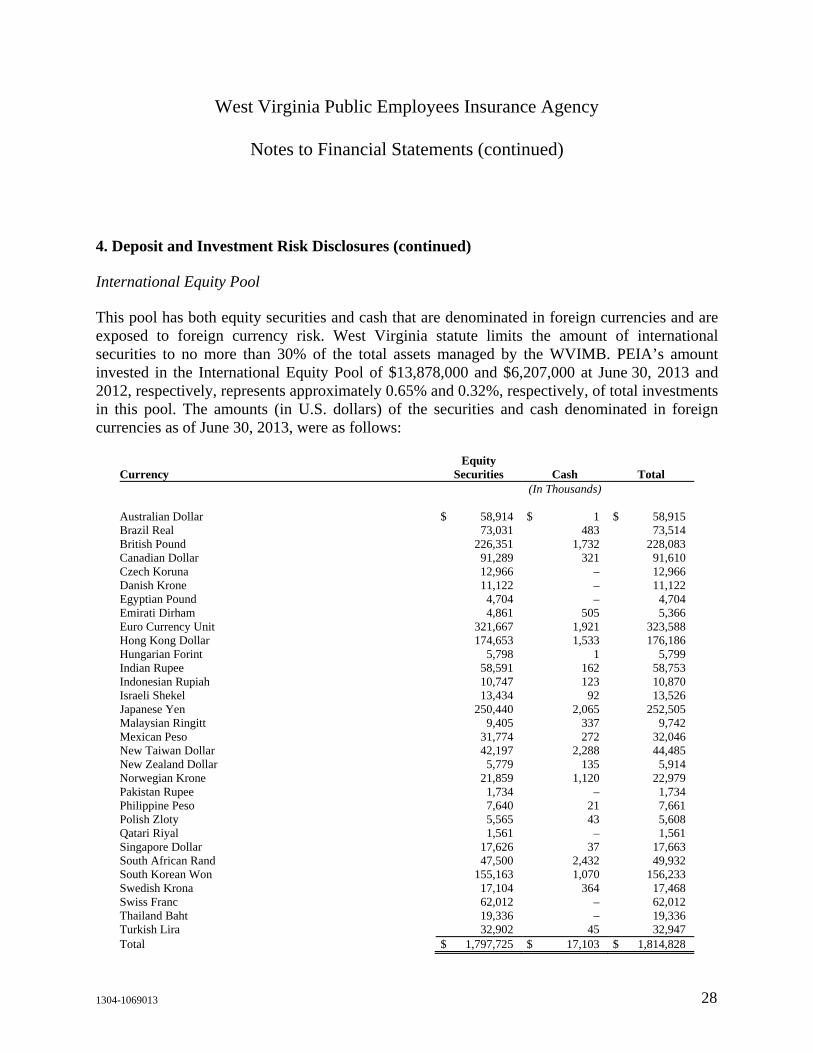
International Equity Pool
This pool has both equity securities and cash that are denominated in foreign currencies and are exposed to foreign currency risk. West Virginia statute limits the amount of international securities to no more than 30% of the total assets managed by the WVIMB. PEIA’s amount invested in the International Equity Pool of $13,878,000 and $6,207,000 at June 30, 2013 and 2012, respectively, represents approximately 0.65% and 0.32%, respectively, of total investments in this pool. The amounts (in U.S. dollars) of the securities and cash denominated in foreign currencies as of June 30, 2013, were as follows:
Equity Currency Securities Cash Total
(In Thousands) Australian Dollar $ 58,914 $ 1 $ 58,915 Brazil Real 73,031 483 73,514 British Pound 226,351 1,732 228,083 Canadian Dollar 91,289 321 91,610 Czech Koruna 12,966 – 12,966 Danish Krone 11,122 – 11,122 Egyptian Pound 4,704 – 4,704 Emirati Dirham 4,861 505 5,366 Euro Currency Unit 321,667 1,921 323,588 Hong Kong Dollar 174,653 1,533 176,186 Hungarian Forint 5,798 1 5,799 Indian Rupee 58,591 162 58,753 Indonesian Rupiah 10,747 123 10,870 Israeli Shekel 13,434 92 13,526 Japanese Yen 250,440 2,065 252,505 Malaysian Ringitt 9,405 337 9,742 Mexican Peso 31,774 272 32,046 New Taiwan Dollar 42,197 2,288 44,485 New Zealand Dollar 5,779 135 5,914 Norwegian Krone 21,859 1,120 22,979 Pakistan Rupee 1,734 – 1,734 Philippine Peso 7,640 21 7,661 Polish Zloty 5,565 43 5,608 Qatari Riyal 1,561 – 1,561 Singapore Dollar 17,626 37 17,663 South African Rand 47,500 2,432 49,932 South Korean Won 155,163 1,070 156,233 Swedish Krona 17,104 364 17,468 Swiss Franc 62,012 – 62,012 Thailand Baht 19,336 – 19,336 Turkish Lira 32,902 45 32,947 Total $ 1,797,725 $ 17,103 $ 1,814,828
West Virginia Public Employees Insurance Agency
Notes to Financial Statements (continued)
1304-1069013 29
4. Deposit and Investment Risk Disclosures (continued)
This table excludes cash and securities held by the pool that are denominated in U.S. dollars. The fair value of the U.S. dollar denominated cash and securities is $417,554,000.
Short-Term Fixed Income Pool
Credit Risk
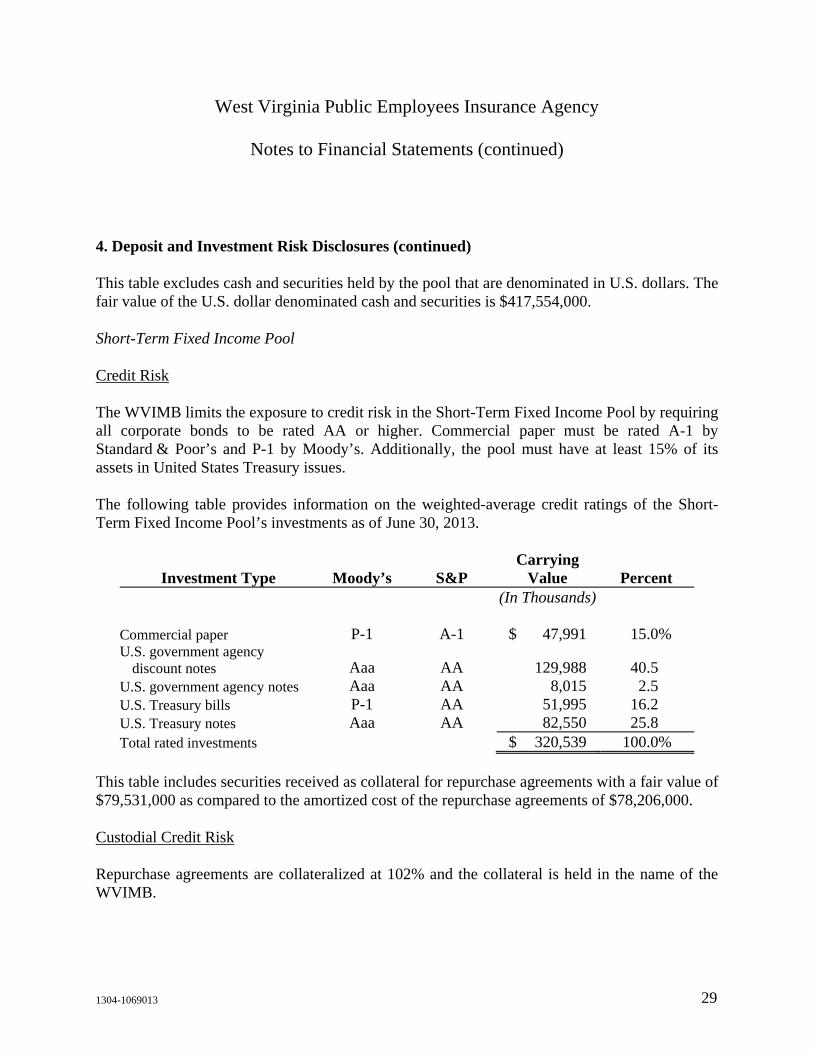
The WVIMB limits the exposure to credit risk in the Short-Term Fixed Income Pool by requiring all corporate bonds to be rated AA or higher. Commercial paper must be rated A-1 by Standard & Poor’s and P-1 by Moody’s. Additionally, the pool must have at least 15% of its assets in United States Treasury issues.
The following table provides information on the weighted-average credit ratings of the Short-Term Fixed Income Pool’s investments as of June 30, 2013.
Carrying Investment Type Moody’s S&P Value Percent
(In Thousands) Commercial paper P-1 A-1 $ 47,991 15.0% U.S. government agency
discount notes Aaa AA 129,988 40.5 U.S. government agency notes Aaa AA 8,015 2.5 U.S. Treasury bills P-1 AA 51,995 16.2 U.S. Treasury notes Aaa AA 82,550 25.8 Total rated investments $ 320,539 100.0%
This table includes securities received as collateral for repurchase agreements with a fair value of $79,531,000 as compared to the amortized cost of the repurchase agreements of $78,206,000.
Custodial Credit Risk
Repurchase agreements are collateralized at 102% and the collateral is held in the name of the WVIMB.
West Virginia Public Employees Insurance Agency
Notes to Financial Statements (continued)
1304-1069013 30
4. Deposit and Investment Risk Disclosures (continued)
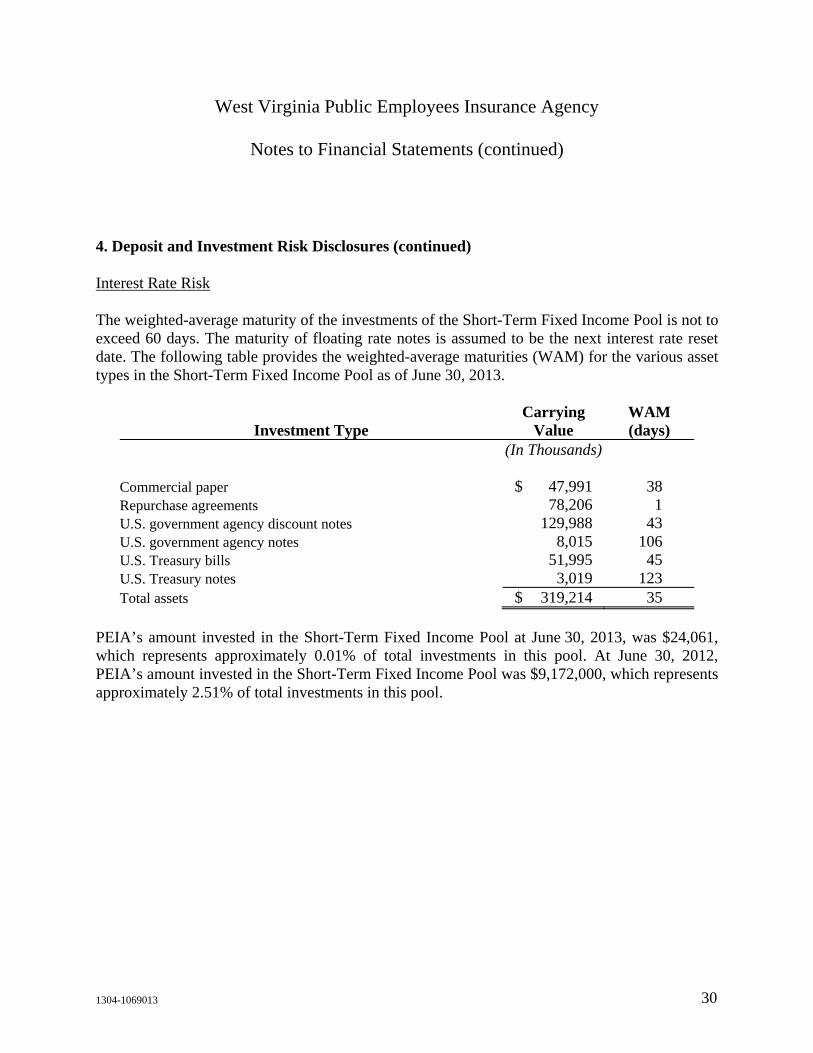
Interest Rate Risk
The weighted-average maturity of the investments of the Short-Term Fixed Income Pool is not to exceed 60 days. The maturity of floating rate notes is assumed to be the next interest rate reset date. The following table provides the weighted-average maturities (WAM) for the various asset types in the Short-Term Fixed Income Pool as of June 30, 2013.
Carrying WAM Investment Type Value (days)
(In Thousands) Commercial paper $ 47,991 38 Repurchase agreements 78,206 1 U.S. government agency discount notes 129,988 43 U.S. government agency notes 8,015 106 U.S. Treasury bills 51,995 45 U.S. Treasury notes 3,019 123 Total assets $ 319,214 35
PEIA’s amount invested in the Short-Term Fixed Income Pool at June 30, 2013, was $24,061, which represents approximately 0.01% of total investments in this pool. At June 30, 2012, PEIA’s amount invested in the Short-Term Fixed Income Pool was $9,172,000, which represents approximately 2.51% of total investments in this pool.
West Virginia Public Employees Insurance Agency
Notes to Financial Statements (continued)
1304-1069013 31
4. Deposit and Investment Risk Disclosures (continued)
Total Return Fixed Income Pool
Credit Risk
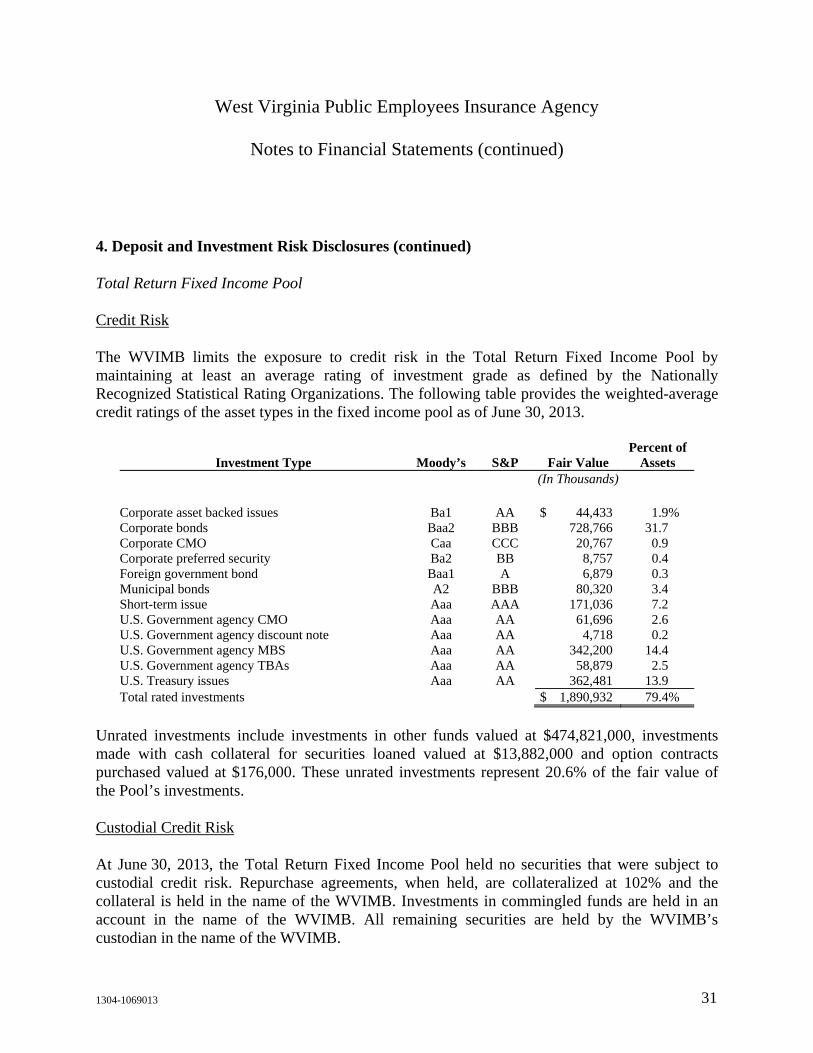
The WVIMB limits the exposure to credit risk in the Total Return Fixed Income Pool by maintaining at least an average rating of investment grade as defined by the Nationally Recognized Statistical Rating Organizations. The following table provides the weighted-average credit ratings of the asset types in the fixed income pool as of June 30, 2013.
Investment Type Moody’s S&P Fair Value Percent of
Assets (In Thousands) Corporate asset backed issues Ba1 AA $ 44,433 1.9% Corporate bonds Baa2 BBB 728,766 31.7 Corporate CMO Caa CCC 20,767 0.9 Corporate preferred security Ba2 BB 8,757 0.4 Foreign government bond Baa1 A 6,879 0.3 Municipal bonds A2 BBB 80,320 3.4 Short-term issue Aaa AAA 171,036 7.2 U.S. Government agency CMO Aaa AA 61,696 2.6 U.S. Government agency discount note Aaa AA 4,718 0.2 U.S. Government agency MBS Aaa AA 342,200 14.4 U.S. Government agency TBAs Aaa AA 58,879 2.5 U.S. Treasury issues Aaa AA 362,481 13.9 Total rated investments $ 1,890,932 79.4%
Unrated investments include investments in other funds valued at $474,821,000, investments made with cash collateral for securities loaned valued at $13,882,000 and option contracts purchased valued at $176,000. These unrated investments represent 20.6% of the fair value of the Pool’s investments.
Custodial Credit Risk
At June 30, 2013, the Total Return Fixed Income Pool held no securities that were subject to custodial credit risk. Repurchase agreements, when held, are collateralized at 102% and the collateral is held in the name of the WVIMB. Investments in commingled funds are held in an account in the name of the WVIMB. All remaining securities are held by the WVIMB’s custodian in the name of the WVIMB.
West Virginia Public Employees Insurance Agency
Notes to Financial Statements (continued)
1304-1069013 32
4. Deposit and Investment Risk Disclosures (continued)
Interest Rate Risk
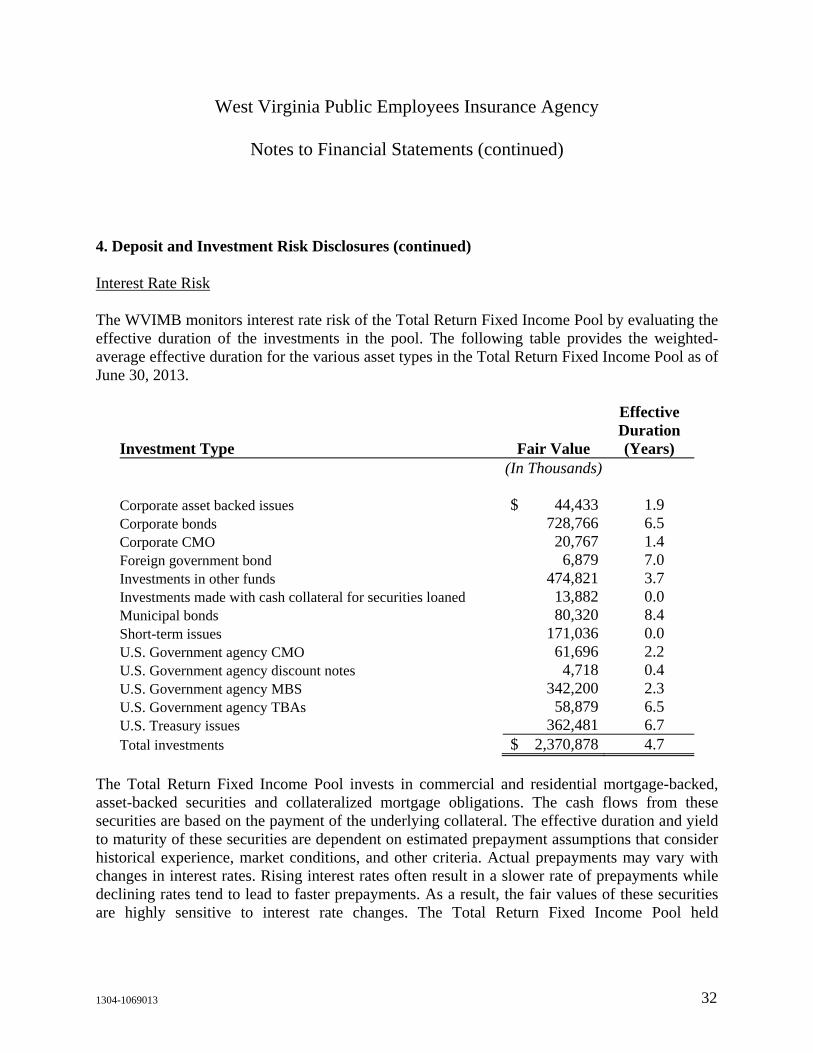
The WVIMB monitors interest rate risk of the Total Return Fixed Income Pool by evaluating the effective duration of the investments in the pool. The following table provides the weighted-average effective duration for the various asset types in the Total Return Fixed Income Pool as of June 30, 2013.
Effective Duration
Investment Type Fair Value (Years) (In Thousands) Corporate asset backed issues $ 44,433 1.9 Corporate bonds 728,766 6.5 Corporate CMO 20,767 1.4 Foreign government bond 6,879 7.0 Investments in other funds 474,821 3.7 Investments made with cash collateral for securities loaned 13,882 0.0 Municipal bonds 80,320 8.4 Short-term issues 171,036 0.0 U.S. Government agency CMO 61,696 2.2 U.S. Government agency discount notes 4,718 0.4 U.S. Government agency MBS 342,200 2.3 U.S. Government agency TBAs 58,879 6.5 U.S. Treasury issues 362,481 6.7 Total investments $ 2,370,878 4.7
The Total Return Fixed Income Pool invests in commercial and residential mortgage-backed, asset-backed securities and collateralized mortgage obligations. The cash flows from these securities are based on the payment of the underlying collateral. The effective duration and yield to maturity of these securities are dependent on estimated prepayment assumptions that consider historical experience, market conditions, and other criteria. Actual prepayments may vary with changes in interest rates. Rising interest rates often result in a slower rate of prepayments while declining rates tend to lead to faster prepayments. As a result, the fair values of these securities are highly sensitive to interest rate changes. The Total Return Fixed Income Pool held
West Virginia Public Employees Insurance Agency
Notes to Financial Statements (continued)
1304-1069013 33
4. Deposit and Investment Risk Disclosures (continued)
$527,975,000 and $432,847,000 of these securities at June 30, 2013 and 2012, respectively, which represented approximately 22.0% and 20.0%, respectively, of the value of the Total Return Fixed Income Pool.
PEIA’s amount invested in the Total Return Fixed Income Pool of $63,027,000 and $71,567,000 at June 30, 2013 and 2012, respectively, represented approximately 2.7% and 3.22%, respectively, of total investments in the pool.
Core Fixed Income Pool
Credit Risk
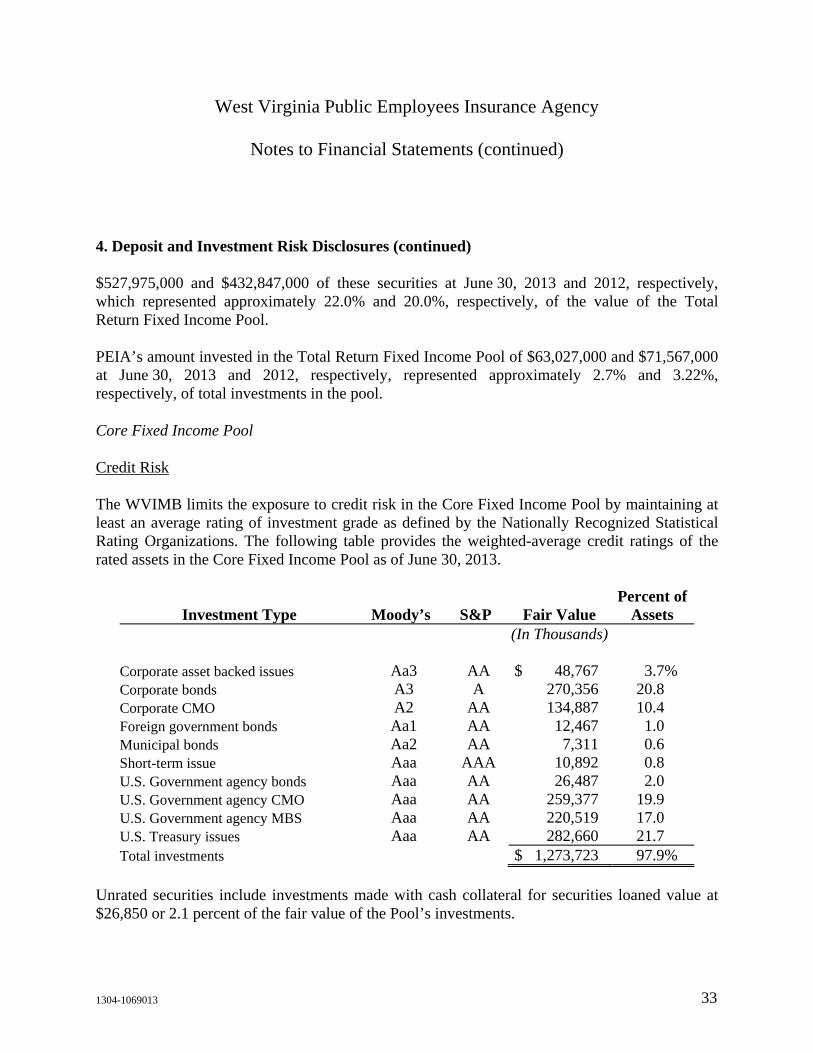
The WVIMB limits the exposure to credit risk in the Core Fixed Income Pool by maintaining at least an average rating of investment grade as defined by the Nationally Recognized Statistical Rating Organizations. The following table provides the weighted-average credit ratings of the rated assets in the Core Fixed Income Pool as of June 30, 2013.
Investment Type Moody’s S&P Fair Value Percent of
Assets (In Thousands)
Corporate asset backed issues Aa3 AA $ 48,767 3.7% Corporate bonds A3 A 270,356 20.8 Corporate CMO A2 AA 134,887 10.4 Foreign government bonds Aa1 AA 12,467 1.0 Municipal bonds Aa2 AA 7,311 0.6 Short-term issue Aaa AAA 10,892 0.8 U.S. Government agency bonds Aaa AA 26,487 2.0 U.S. Government agency CMO Aaa AA 259,377 19.9 U.S. Government agency MBS Aaa AA 220,519 17.0 U.S. Treasury issues Aaa AA 282,660 21.7 Total investments $ 1,273,723 97.9%
Unrated securities include investments made with cash collateral for securities loaned value at $26,850 or 2.1 percent of the fair value of the Pool’s investments.
West Virginia Public Employees Insurance Agency
Notes to Financial Statements (continued)
1304-1069013 34
4. Deposit and Investment Risk Disclosures (continued)
Interest Rate Risk
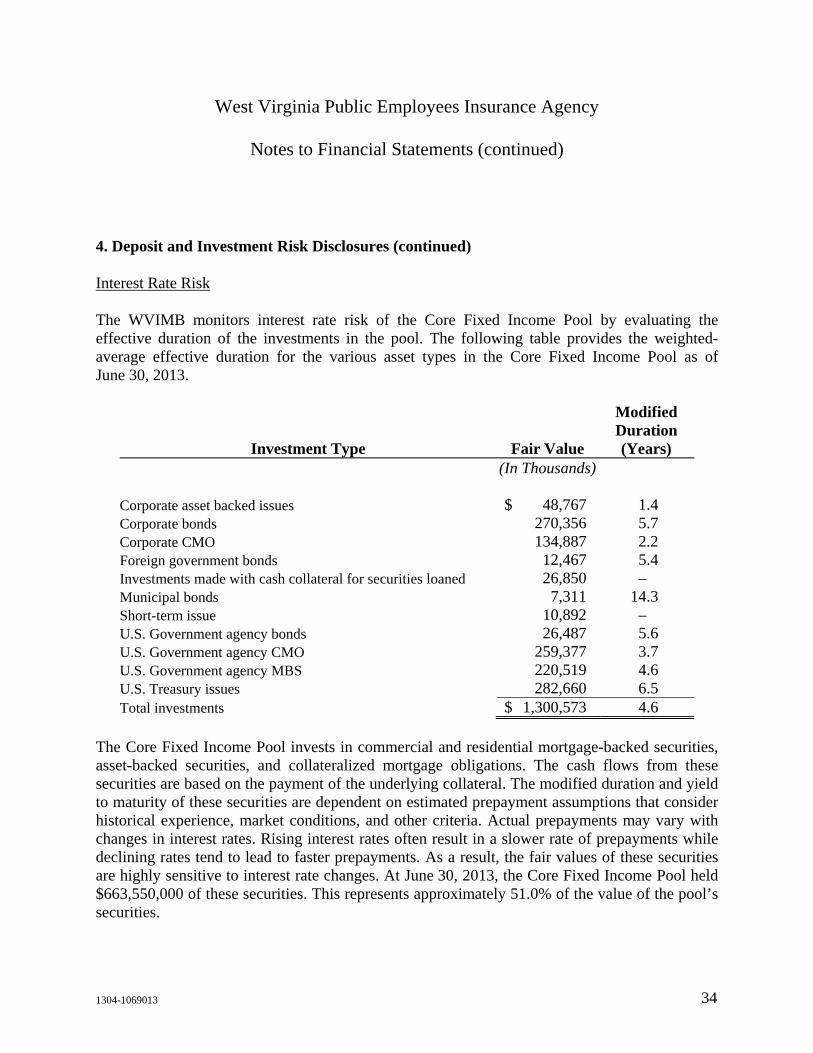
The WVIMB monitors interest rate risk of the Core Fixed Income Pool by evaluating the effective duration of the investments in the pool. The following table provides the weighted-average effective duration for the various asset types in the Core Fixed Income Pool as of June 30, 2013.
Modified Duration
Investment Type Fair Value (Years) (In Thousands)
Corporate asset backed issues $ 48,767 1.4 Corporate bonds 270,356 5.7 Corporate CMO 134,887 2.2 Foreign government bonds 12,467 5.4 Investments made with cash collateral for securities loaned 26,850 – Municipal bonds 7,311 14.3 Short-term issue 10,892 – U.S. Government agency bonds 26,487 5.6 U.S. Government agency CMO 259,377 3.7 U.S. Government agency MBS 220,519 4.6 U.S. Treasury issues 282,660 6.5 Total investments $ 1,300,573 4.6
The Core Fixed Income Pool invests in commercial and residential mortgage-backed securities, asset-backed securities, and collateralized mortgage obligations. The cash flows from these securities are based on the payment of the underlying collateral. The modified duration and yield to maturity of these securities are dependent on estimated prepayment assumptions that consider historical experience, market conditions, and other criteria. Actual prepayments may vary with changes in interest rates. Rising interest rates often result in a slower rate of prepayments while declining rates tend to lead to faster prepayments. As a result, the fair values of these securities are highly sensitive to interest rate changes. At June 30, 2013, the Core Fixed Income Pool held $663,550,000 of these securities. This represents approximately 51.0% of the value of the pool’s securities.
West Virginia Public Employees Insurance Agency
Notes to Financial Statements (continued)
1304-1069013 35
4. Deposit and Investment Risk Disclosures (continued)
PEIA’s amount invested in the Core Fixed Income Pool of $33,756,000 at June 30, 2013, represented approximately 2.6% of total investments in this pool. At June 30, 2012, PEIA had $38,704,000, which represented approximately 3.22% of total investments in this pool.
Hedge Fund Pool
The pool holds shares in hedge funds and shares of a money market fund with the highest credit rating. The investments in hedge funds might be indirectly exposed to foreign currency risk, credit risk, interest rate risk, and/or custodial credit risk. At June 30, 2013, the Pool, in accordance with West Virginia statutes, did not hold securities of any one issuer in excess of 5% of the value of the Pool and is not exposed to concentration of credit risk.
PEIA’s amount invested in the Hedge Fund Pool of $39,816,000 and $18,249,000 at June 30, 2013 and 2012, respectively, represented approximately 3.0% and 1.5%, respectively, of total investments in this pool.
5. Equity Position in Internal Investment Pool – Restricted (Premium Stabilization Fund) Managed by BTI and Minnesota Life
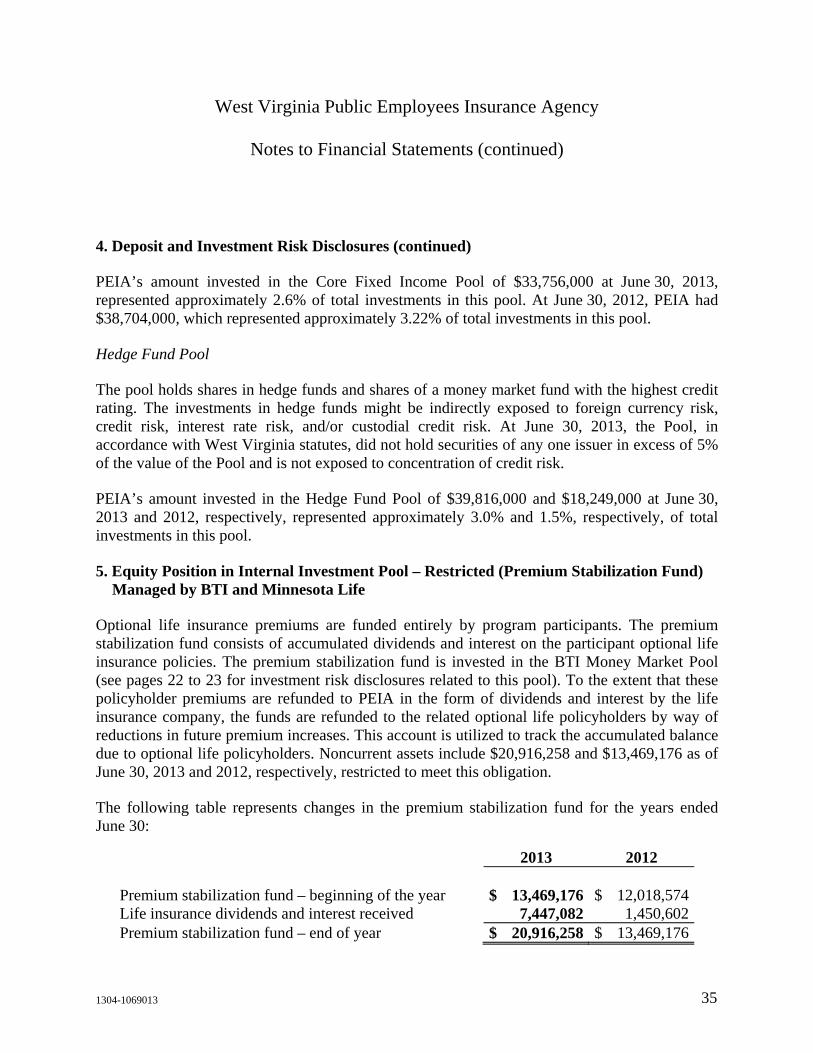
Optional life insurance premiums are funded entirely by program participants. The premium stabilization fund consists of accumulated dividends and interest on the participant optional life insurance policies. The premium stabilization fund is invested in the BTI Money Market Pool (see pages 22 to 23 for investment risk disclosures related to this pool). To the extent that these policyholder premiums are refunded to PEIA in the form of dividends and interest by the life insurance company, the funds are refunded to the related optional life policyholders by way of reductions in future premium increases. This account is utilized to track the accumulated balance due to optional life policyholders. Noncurrent assets include $20,916,258 and $13,469,176 as of June 30, 2013 and 2012, respectively, restricted to meet this obligation.
The following table represents changes in the premium stabilization fund for the years ended June 30:
2013 2012 Premium stabilization fund – beginning of the year $ 13,469,176 $ 12,018,574Life insurance dividends and interest received 7,447,082 1,450,602Premium stabilization fund – end of year $ 20,916,258 $ 13,469,176
West Virginia Public Employees Insurance Agency
Notes to Financial Statements (continued)
1304-1069013 36
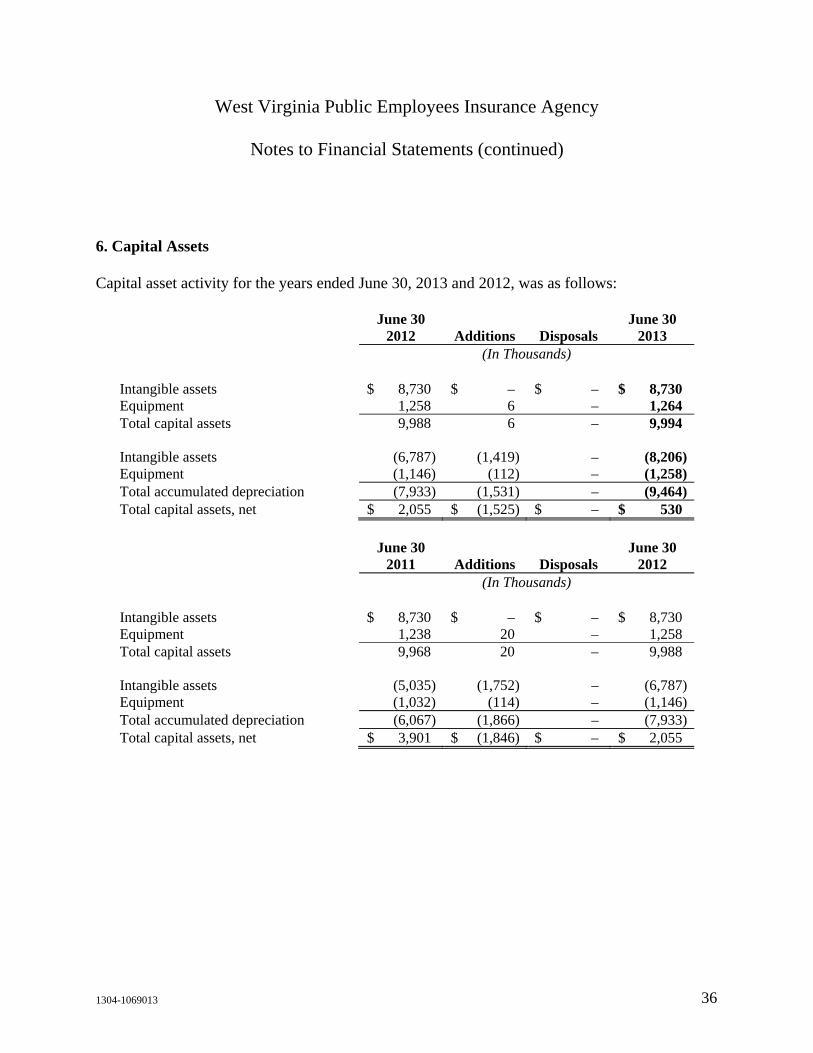
6. Capital Assets
Capital asset activity for the years ended June 30, 2013 and 2012, was as follows:
June 30 June 30 2012 Additions Disposals 2013
(In Thousands) Intangible assets $ 8,730 $ – $ – $ 8,730 Equipment 1,258 6 – 1,264 Total capital assets 9,988 6 – 9,994 Intangible assets (6,787) (1,419) – (8,206)Equipment (1,146) (112) – (1,258)Total accumulated depreciation (7,933) (1,531) – (9,464)Total capital assets, net $ 2,055 $ (1,525) $ – $ 530
June 30 June 30 2011 Additions Disposals 2012
(In Thousands) Intangible assets $ 8,730 $ – $ – $ 8,730 Equipment 1,238 20 – 1,258 Total capital assets 9,968 20 – 9,988 Intangible assets (5,035) (1,752) – (6,787)Equipment (1,032) (114) – (1,146)Total accumulated depreciation (6,067) (1,866) – (7,933)Total capital assets, net $ 3,901 $ (1,846) $ – $ 2,055
West Virginia Public Employees Insurance Agency
Notes to Financial Statements (continued)
1304-1069013 37
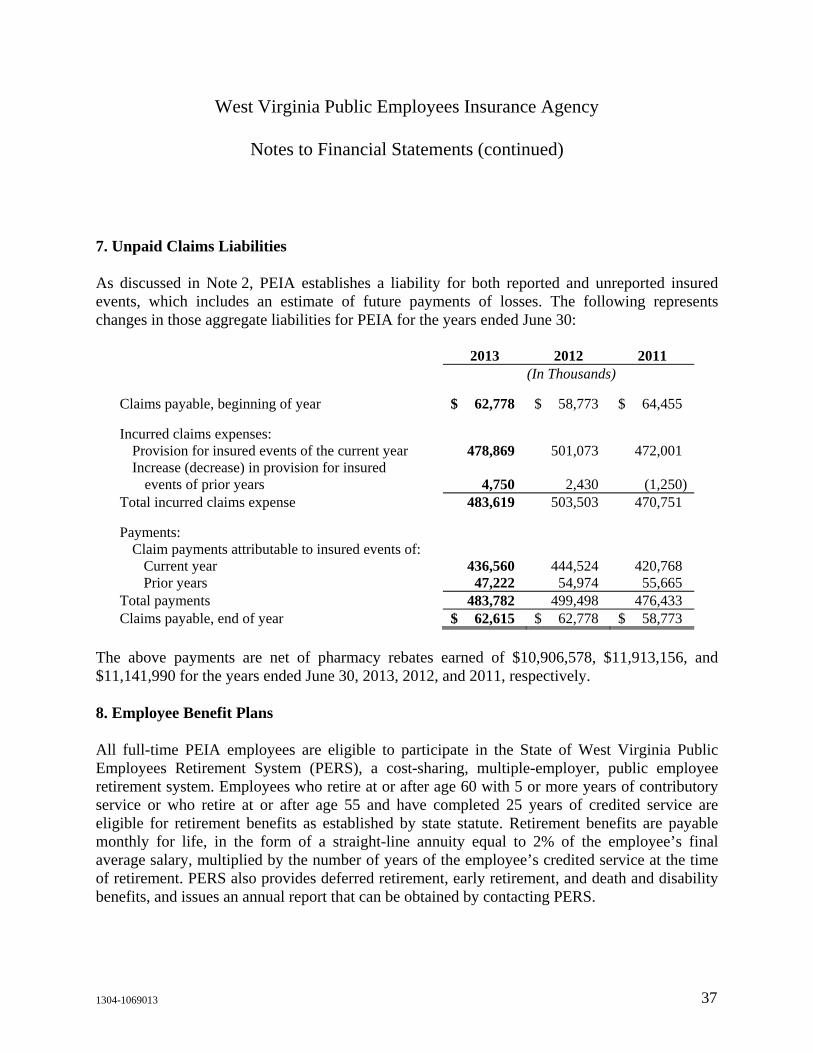
7. Unpaid Claims Liabilities
As discussed in Note 2, PEIA establishes a liability for both reported and unreported insured events, which includes an estimate of future payments of losses. The following represents changes in those aggregate liabilities for PEIA for the years ended June 30:
2013 2012 2011 (In Thousands) Claims payable, beginning of year $ 62,778 $ 58,773 $ 64,455 Incurred claims expenses:
Provision for insured events of the current year 478,869 501,073 472,001 Increase (decrease) in provision for insured
events of prior years 4,750 2,430 (1,250)Total incurred claims expense 483,619 503,503 470,751 Payments:
Claim payments attributable to insured events of: Current year 436,560 444,524 420,768 Prior years 47,222 54,974 55,665
Total payments 483,782 499,498 476,433 Claims payable, end of year $ 62,615 $ 62,778 $ 58,773
The above payments are net of pharmacy rebates earned of $10,906,578, $11,913,156, and $11,141,990 for the years ended June 30, 2013, 2012, and 2011, respectively.
8. Employee Benefit Plans
All full-time PEIA employees are eligible to participate in the State of West Virginia Public Employees Retirement System (PERS), a cost-sharing, multiple-employer, public employee retirement system. Employees who retire at or after age 60 with 5 or more years of contributory service or who retire at or after age 55 and have completed 25 years of credited service are eligible for retirement benefits as established by state statute. Retirement benefits are payable monthly for life, in the form of a straight-line annuity equal to 2% of the employee’s final average salary, multiplied by the number of years of the employee’s credited service at the time of retirement. PERS also provides deferred retirement, early retirement, and death and disability benefits, and issues an annual report that can be obtained by contacting PERS.
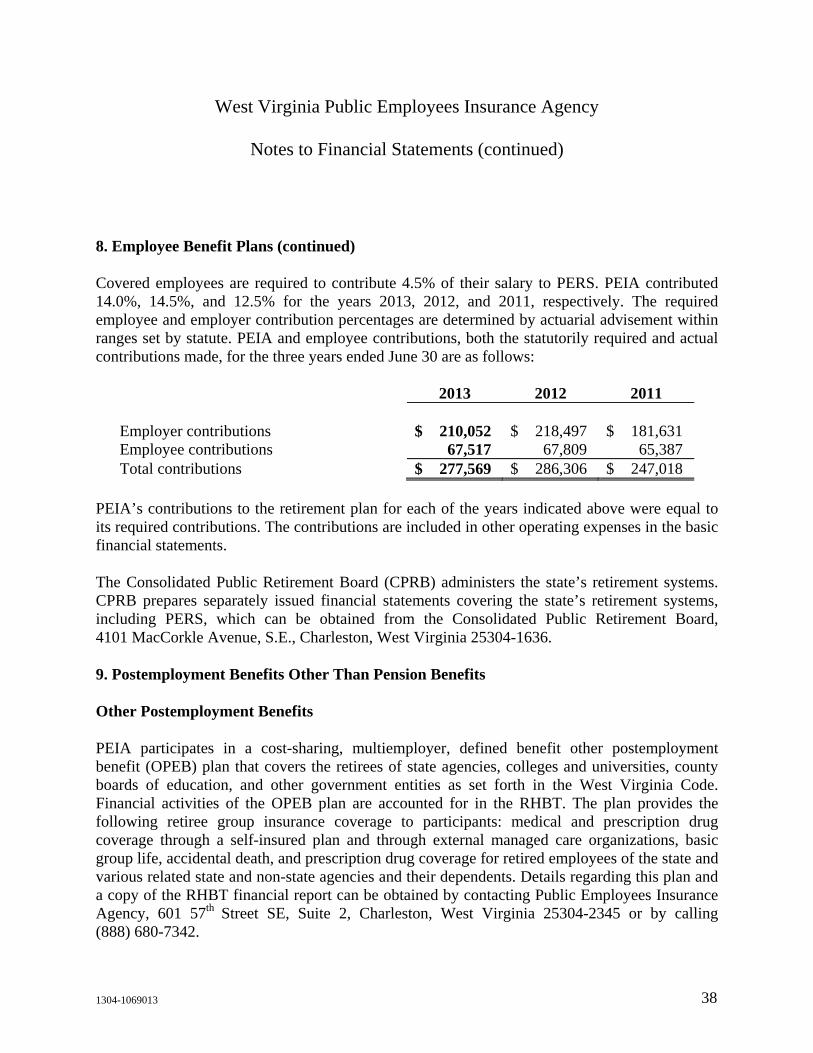
West Virginia Public Employees Insurance Agency
Notes to Financial Statements (continued)
1304-1069013 38
8. Employee Benefit Plans (continued)
Covered employees are required to contribute 4.5% of their salary to PERS. PEIA contributed 14.0%, 14.5%, and 12.5% for the years 2013, 2012, and 2011, respectively. The required employee and employer contribution percentages are determined by actuarial advisement within ranges set by statute. PEIA and employee contributions, both the statutorily required and actual contributions made, for the three years ended June 30 are as follows:
2013 2012 2011 Employer contributions $ 210,052 $ 218,497 $ 181,631 Employee contributions 67,517 67,809 65,387 Total contributions $ 277,569 $ 286,306 $ 247,018
PEIA’s contributions to the retirement plan for each of the years indicated above were equal to its required contributions. The contributions are included in other operating expenses in the basic financial statements.
The Consolidated Public Retirement Board (CPRB) administers the state’s retirement systems. CPRB prepares separately issued financial statements covering the state’s retirement systems, including PERS, which can be obtained from the Consolidated Public Retirement Board, 4101 MacCorkle Avenue, S.E., Charleston, West Virginia 25304-1636.
9. Postemployment Benefits Other Than Pension Benefits
Other Postemployment Benefits
PEIA participates in a cost-sharing, multiemployer, defined benefit other postemployment benefit (OPEB) plan that covers the retirees of state agencies, colleges and universities, county boards of education, and other government entities as set forth in the West Virginia Code. Financial activities of the OPEB plan are accounted for in the RHBT. The plan provides the following retiree group insurance coverage to participants: medical and prescription drug coverage through a self-insured plan and through external managed care organizations, basic group life, accidental death, and prescription drug coverage for retired employees of the state and various related state and non-state agencies and their dependents. Details regarding this plan and a copy of the RHBT financial report can be obtained by contacting Public Employees Insurance Agency, 601 57th Street SE, Suite 2, Charleston, West Virginia 25304-2345 or by calling (888) 680-7342.
West Virginia Public Employees Insurance Agency
Notes to Financial Statements (continued)
1304-1069013 39
9. Postemployment Benefits Other Than Pension Benefits (continued)
Upon retirement, an employee may apply unused sick leave and/or annual leave to reduce their future insurance premiums paid to RHBT. Substantially all employees hired prior to July 1, 2001, may become eligible for these benefits if they reach normal retirement age while working for PEIA. According to West Virginia State Code, employees hired prior to June 30, 1988, can receive health care credit against 100% of their health care coverage. Employees hired between June 30, 1988 and June 30, 2001, can receive health care credit against 50% of their health care cost. Employees hired July 1, 2001, or later, may not convert sick leave into a health care benefit.
Legislation requires RHBT to determine through an actuarial study, the contractually required contribution (CRC) that shall be sufficient to maintain the RHBT in an actuarially sound manner. The CRC is allocated to respective cost-sharing employers, including PEIA, who are required by law to fund at least the minimum annual premium component of the CRC. Revenues collected by RHBT shall be used to fund current OPEB health care claims and administrative expenses with residual funds held in trust for future OPEB costs. Based on the actuarial studies completed, the contractually required contribution rates were determined for the fiscal years ended June 30, 2013, 2012, and 2011. PEIA’s contributions to the RHBT were $70,415, $68,976, and $67,006 for fiscal years 2013, 2012, and 2011, respectively, which represent 88.0%, 20.6%, and 20.9%, respectively, of the contractually required contributions. The cumulative unpaid balances of $913,210, $903,646, and $638,504 for fiscal years 2013, 2012, and 2011, respectively, is recorded in other accrued liabilities in the statements of net assets. The State, on PEIA’s behalf, paid $43,000 toward the annual required contribution for fiscal year 2008.
The West Virginia State Code provides that contribution requirements of the members and the participating employers are established and may be amended by the RHBT Finance Board. A non-Medicare plan member or beneficiaries receiving benefits contribute monthly premiums ranging from $264 to $845 per month for retiree-only coverage, and from $529 to $2,009 per month for retiree and spouse coverage. Medicare-covered retirees are charged premiums ranging from $84 to $398 per month for retiree-only coverage, and from $342 to $1,331 per month for retiree and spouse coverage. Monthly premiums vary based on years of service and choice of coverage.
10. Litigation
PEIA is engaged in various legal actions that it deems to be in the ordinary course of business. PEIA believes that it has adequately provided for probable costs of current litigation, as these legal actions are resolved; however, PEIA could realize positive and/or negative impact to its financial performance in the period in which these legal actions are ultimately decided.

1304-1069013
Required Supplementary Information
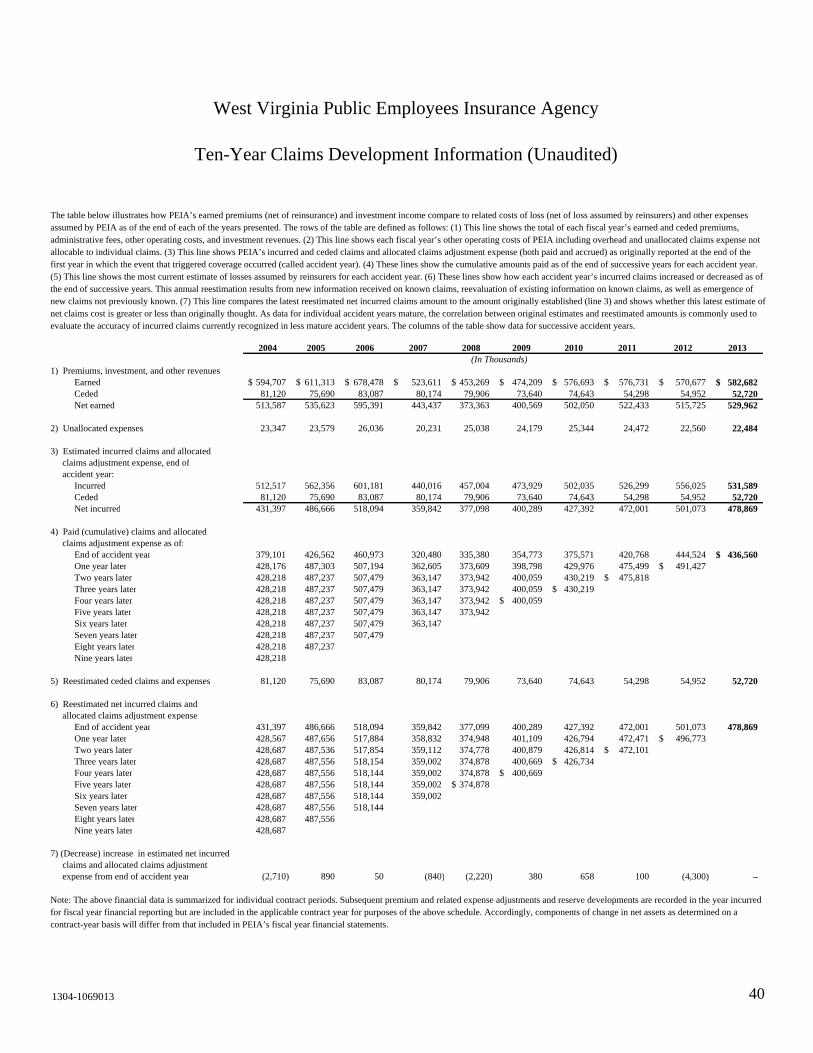
2004 2005 2006 2007 2008 2009 2010 2011 2012 2013(In Thousands)
1) Premiums, investment, and other revenuesEarned 594,707$ 611,313$ 678,478$ 523,611$ 453,269$ 474,209$ 576,693$ 576,731$ 570,677$ 582,682$ Ceded 81,120 75,690 83,087 80,174 79,906 73,640 74,643 54,298 54,952 52,720 Net earned 513,587 535,623 595,391 443,437 373,363 400,569 502,050 522,433 515,725 529,962
2) Unallocated expenses 23,347 23,579 26,036 20,231 25,038 24,179 25,344 24,472 22,560 22,484
3) Estimated incurred claims and allocated claims adjustment expense, end ofaccident year:
Incurred 512,517 562,356 601,181 440,016 457,004 473,929 502,035 526,299 556,025 531,589 Ceded 81,120 75,690 83,087 80,174 79,906 73,640 74,643 54,298 54,952 52,720 Net incurred 431,397 486,666 518,094 359,842 377,098 400,289 427,392 472,001 501,073 478,869
4) Paid (cumulative) claims and allocated claims adjustment expense as of:
End of accident year 379,101 426,562 460,973 320,480 335,380 354,773 375,571 420,768 444,524 436,560$ One year later 428,176 487,303 507,194 362,605 373,609 398,798 429,976 475,499 491,427$ Two years later 428,218 487,237 507,479 363,147 373,942 400,059 430,219 475,818$ Three years later 428,218 487,237 507,479 363,147 373,942 400,059 430,219$ Four years later 428,218 487,237 507,479 363,147 373,942 400,059$ Five years later 428,218 487,237 507,479 363,147 373,942 Six years later 428,218 487,237 507,479 363,147 Seven years later 428,218 487,237 507,479 Eight years later 428,218 487,237 Nine years later 428,218
5) Reestimated ceded claims and expenses 81,120 75,690 83,087 80,174 79,906 73,640 74,643 54,298 54,952 52,720
6) Reestimated net incurred claims and allocated claims adjustment expense:
End of accident year 431,397 486,666 518,094 359,842 377,099 400,289 427,392 472,001 501,073 478,869 One year later 428,567 487,656 517,884 358,832 374,948 401,109 426,794 472,471 496,773$ Two years later 428,687 487,536 517,854 359,112 374,778 400,879 426,814 472,101$ Three years later 428,687 487,556 518,154 359,002 374,878 400,669 426,734$ Four years later 428,687 487,556 518,144 359,002 374,878 400,669$ Five years later 428,687 487,556 518,144 359,002 374,878$ Six years later 428,687 487,556 518,144 359,002 Seven years later 428,687 487,556 518,144 Eight years later 428,687 487,556 Nine years later 428,687
7) (Decrease) increase in estimated net incurred claims and allocated claims adjustment expense from end of accident year (2,710) 890 50 (840) (2,220) 380 658 100 (4,300) –
The table below illustrates how PEIA’s earned premiums (net of reinsurance) and investment income compare to related costs of loss (net of loss assumed by reinsurers) and other expenses assumed by PEIA as of the end of each of the years presented. The rows of the table are defined as follows: (1) This line shows the total of each fiscal year’s earned and ceded premiums, administrative fees, other operating costs, and investment revenues. (2) This line shows each fiscal year’s other operating costs of PEIA including overhead and unallocated claims expense not allocable to individual claims. (3) This line shows PEIA’s incurred and ceded claims and allocated claims adjustment expense (both paid and accrued) as originally reported at the end of the first year in which the event that triggered coverage occurred (called accident year). (4) These lines show the cumulative amounts paid as of the end of successive years for each accident year. (5) This line shows the most current estimate of losses assumed by reinsurers for each accident year. (6) These lines show how each accident year’s incurred claims increased or decreased as of the end of successive years. This annual reestimation results from new information received on known claims, reevaluation of existing information on known claims, as well as emergence of new claims not previously known. (7) This line compares the latest reestimated net incurred claims amount to the amount originally established (line 3) and shows whether this latest estimate of net claims cost is greater or less than originally thought. As data for individual accident years mature, the correlation between original estimates and reestimated amounts is commonly used to evaluate the accuracy of incurred claims currently recognized in less mature accident years. The columns of the table show data for successive accident years.
Ten-Year Claims Development Information (Unaudited)
West Virginia Public Employees Insurance Agency
Note: The above financial data is summarized for individual contract periods. Subsequent premium and related expense adjustments and reserve developments are recorded in the year incurred for fiscal year financial reporting but are included in the applicable contract year for purposes of the above schedule. Accordingly, components of change in net assets as determined on a contract-year basis will differ from that included in PEIA’s fiscal year financial statements.
40 1304-1069013

1304-1069013
Other Financial Information
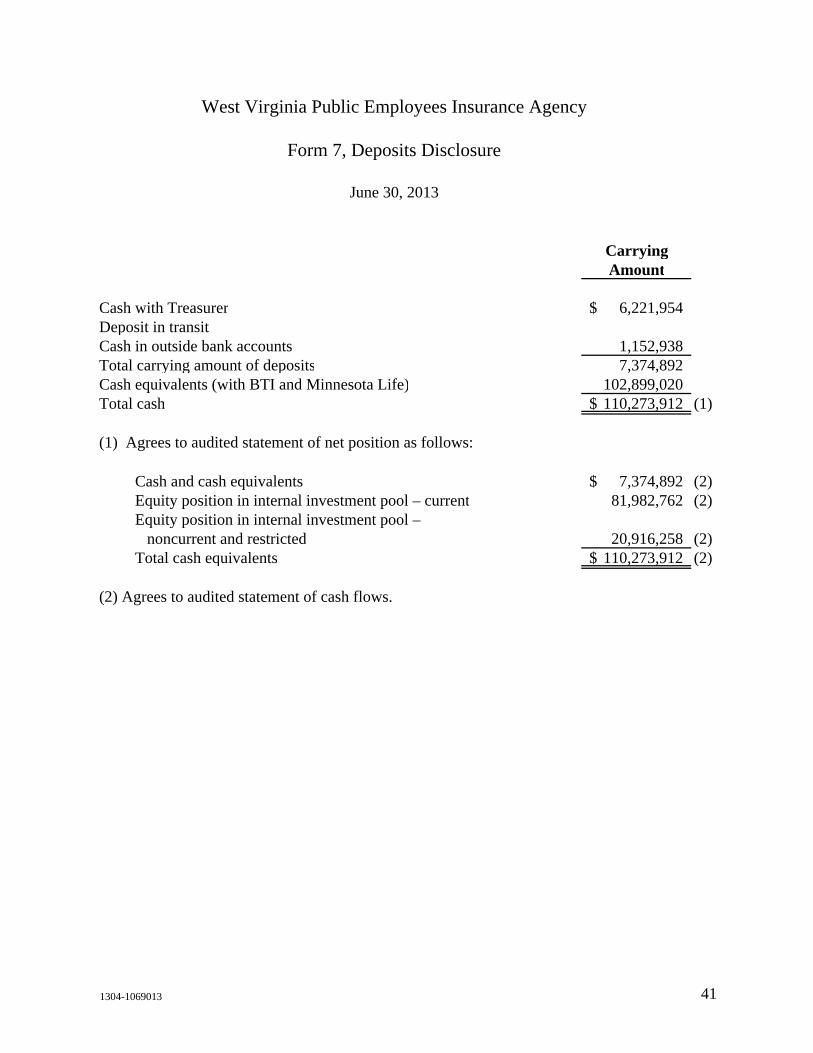
CarryingAmount
Cash with Treasurer 6,221,954$ Deposit in transitCash in outside bank accounts 1,152,938 Total carrying amount of deposits 7,374,892 Cash equivalents (with BTI and Minnesota Life) 102,899,020Total cash 110,273,912$ (1)
(1) Agrees to audited statement of net position as follows:
Cash and cash equivalents 7,374,892$ (2)Equity position in internal investment pool – current 81,982,762 (2)Equity position in internal investment pool –
noncurrent and restricted 20,916,258 (2)Total cash equivalents 110,273,912$ (2)
(2) Agrees to audited statement of cash flows.
June 30, 2013
Form 7, Deposits Disclosure
West Virginia Public Employees Insurance Agency
41 1304-1069013
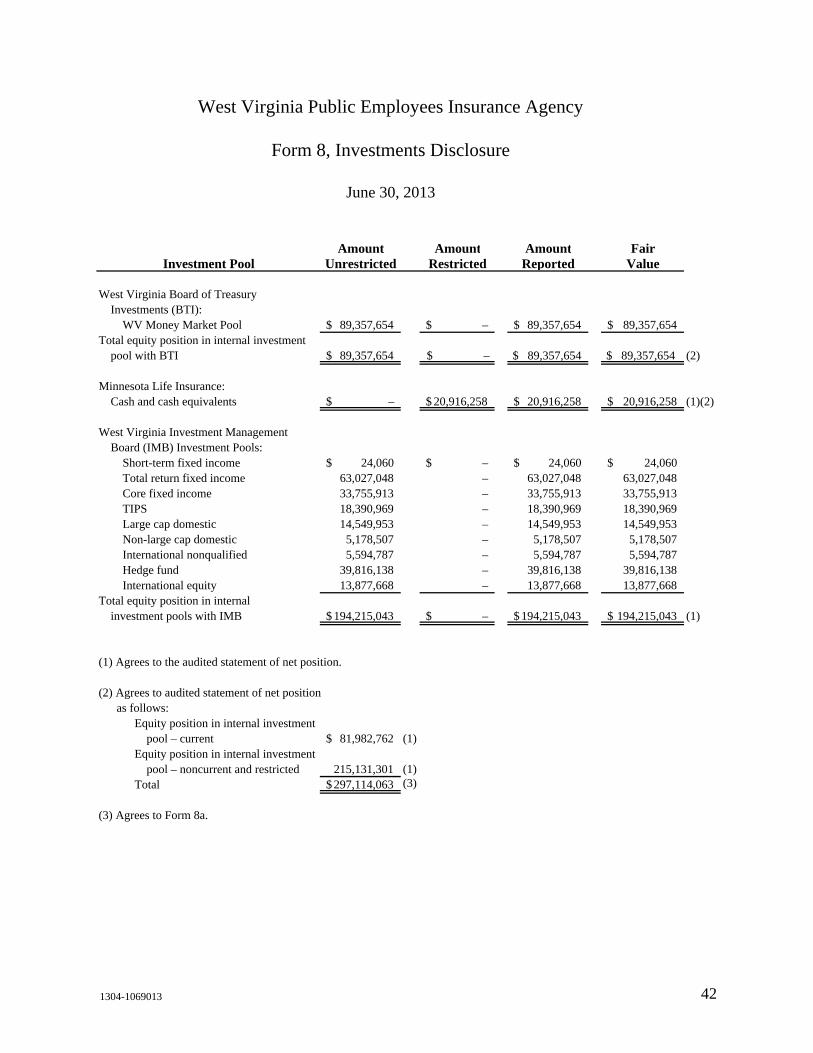
Amount Amount Amount FairInvestment Pool Unrestricted Restricted Reported Value
West Virginia Board of TreasuryInvestments (BTI):
WV Money Market Pool 89,357,654$ –$ 89,357,654$ 89,357,654$ Total equity position in internal investment
pool with BTI 89,357,654$ $ – $ 89,357,654 $ 89,357,654 (2)
Minnesota Life Insurance:Cash and cash equivalents –$ 20,916,258$ 20,916,258$ 20,916,258$ (1)(2)
West Virginia Investment ManagementBoard (IMB) Investment Pools:
Short-term fixed income 24,060$ –$ 24,060$ 24,060$ Total return fixed income 63,027,048 – 63,027,048 63,027,048 Core fixed income 33,755,913 – 33,755,913 33,755,913 TIPS 18,390,969 – 18,390,969 18,390,969 Large cap domestic 14,549,953 – 14,549,953 14,549,953 Non-large cap domestic 5,178,507 – 5,178,507 5,178,507 International nonqualified 5,594,787 – 5,594,787 5,594,787 Hedge fund 39,816,138 – 39,816,138 39,816,138 International equity 13,877,668 – 13,877,668 13,877,668
Total equity position in internal investment pools with IMB 194,215,043$ –$ 194,215,043$ 194,215,043$ (1)
(1) Agrees to the audited statement of net position.
(2) Agrees to audited statement of net position as follows:
Equity position in internal investmentpool – current 81,982,762$ (1)
Equity position in internal investmentpool – noncurrent and restricted 215,131,301 (1)
Total 297,114,063$ (3)
(3) Agrees to Form 8a.
West Virginia Public Employees Insurance Agency
Form 8, Investments Disclosure
June 30, 2013
42 1304-1069013
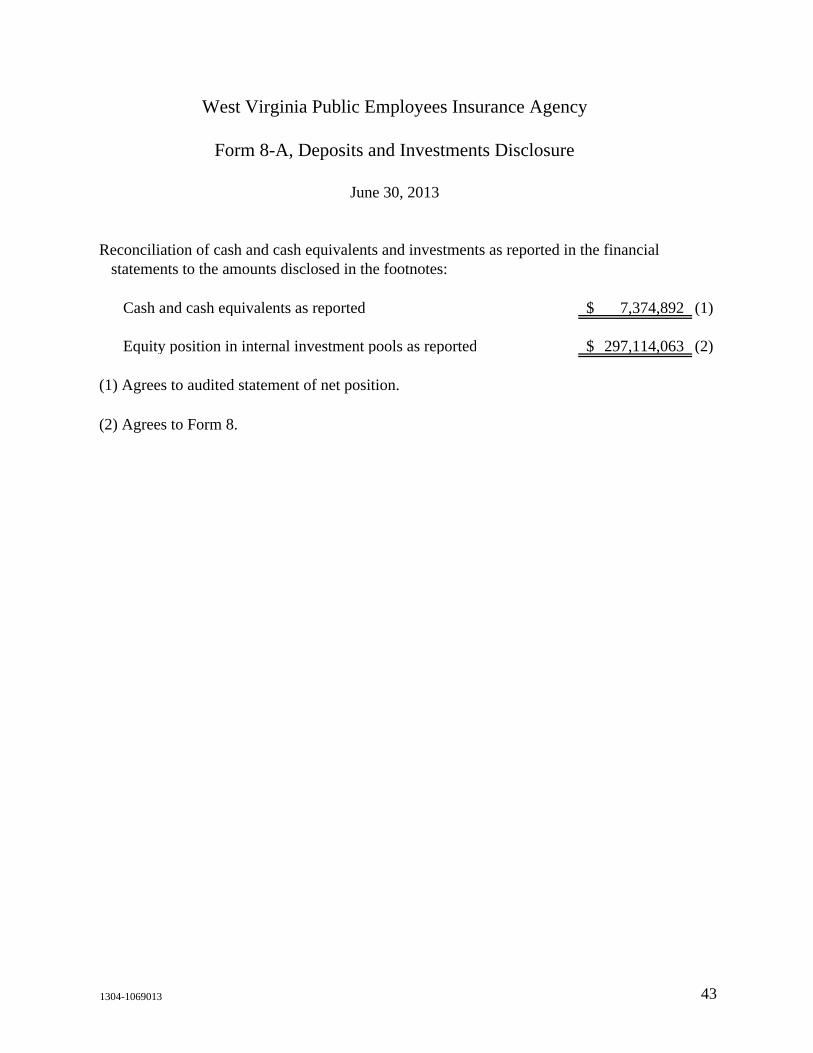
Cash and cash equivalents as reported 7,374,892$ (1)
Equity position in internal investment pools as reported 297,114,063$ (2)
(1) Agrees to audited statement of net position.
(2) Agrees to Form 8.
Reconciliation of cash and cash equivalents and investments as reported in the financial statements to the amounts disclosed in the footnotes:
West Virginia Public Employees Insurance Agency
Form 8-A, Deposits and Investments Disclosure
June 30, 2013
43 1304-1069013
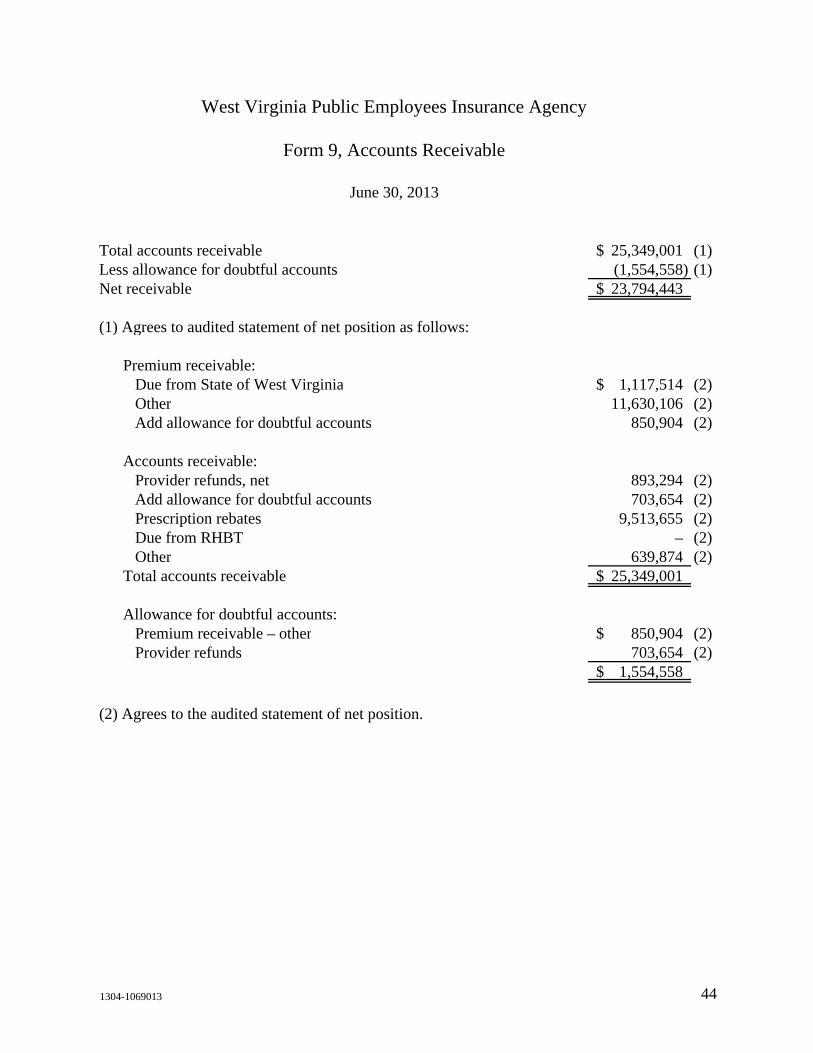
Total accounts receivable 25,349,001$ (1)Less allowance for doubtful accounts (1,554,558) (1)Net receivable 23,794,443$
(1) Agrees to audited statement of net position as follows:
Premium receivable:Due from State of West Virginia 1,117,514$ (2)Other 11,630,106 (2)Add allowance for doubtful accounts 850,904 (2)
Accounts receivable:Provider refunds, net 893,294 (2)Add allowance for doubtful accounts 703,654 (2)Prescription rebates 9,513,655 (2)Due from RHBT – (2)Other 639,874 (2)
Total accounts receivable 25,349,001$
Allowance for doubtful accounts:Premium receivable – other 850,904$ (2)Provider refunds 703,654 (2)
1,554,558$
(2) Agrees to the audited statement of net position.
West Virginia Public Employees Insurance Agency
Form 9, Accounts Receivable
June 30, 2013
44 1304-1069013
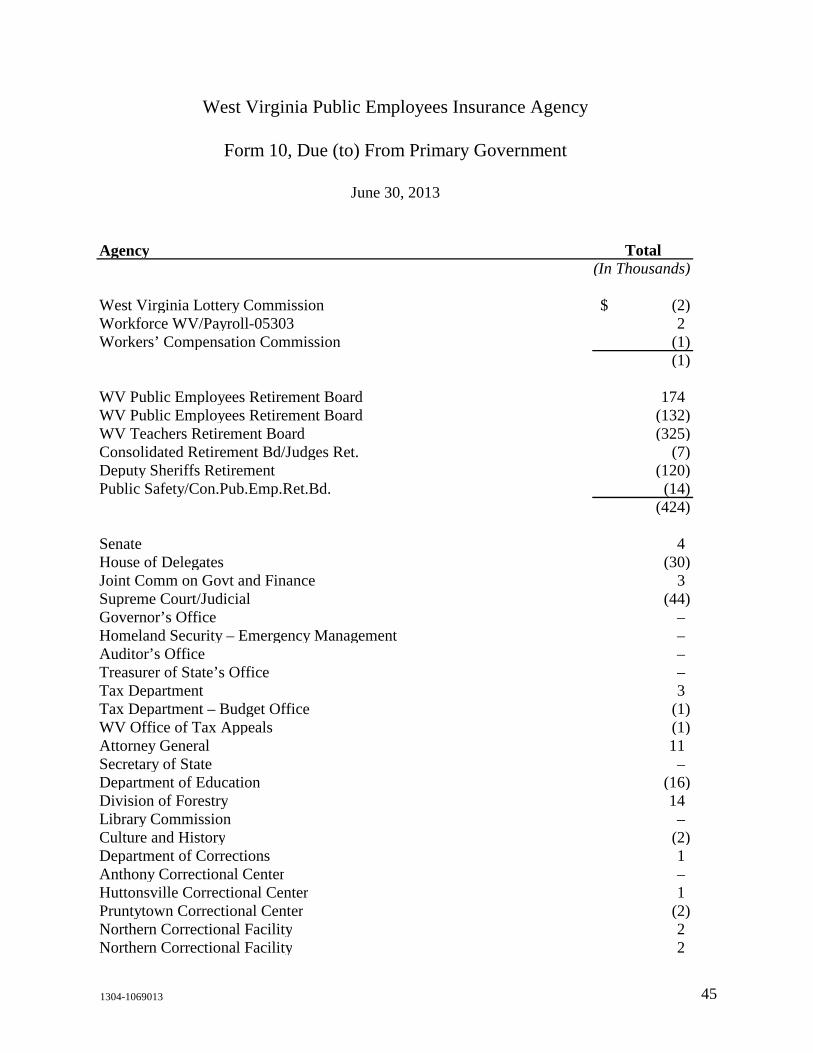
Agency Total(In Thousands)
West Virginia Lottery Commission (2)$ Workforce WV/Payroll-05303 2 Workers’ Compensation Commission (1)
(1)
WV Public Employees Retirement Board 174 WV Public Employees Retirement Board (132) WV Teachers Retirement Board (325) Consolidated Retirement Bd/Judges Ret. (7) Deputy Sheriffs Retirement (120) Public Safety/Con.Pub.Emp.Ret.Bd. (14)
(424)
Senate 4 House of Delegates (30) Joint Comm on Govt and Finance 3 Supreme Court/Judicial (44) Governor’s Office – Homeland Security – Emergency Management – Auditor’s Office – Treasurer of State’s Office – Tax Department 3 Tax Department – Budget Office (1) WV Office of Tax Appeals (1) Attorney General 11 Secretary of State – Department of Education (16) Division of Forestry 14 Library Commission – Culture and History (2) Department of Corrections 1 Anthony Correctional Center – Huttonsville Correctional Center 1 Pruntytown Correctional Center (2) Northern Correctional Facility 2 Northern Correctional Facility 2
West Virginia Public Employees Insurance Agency
Form 10, Due (to) From Primary Government
June 30, 2013
45 1304-1069013
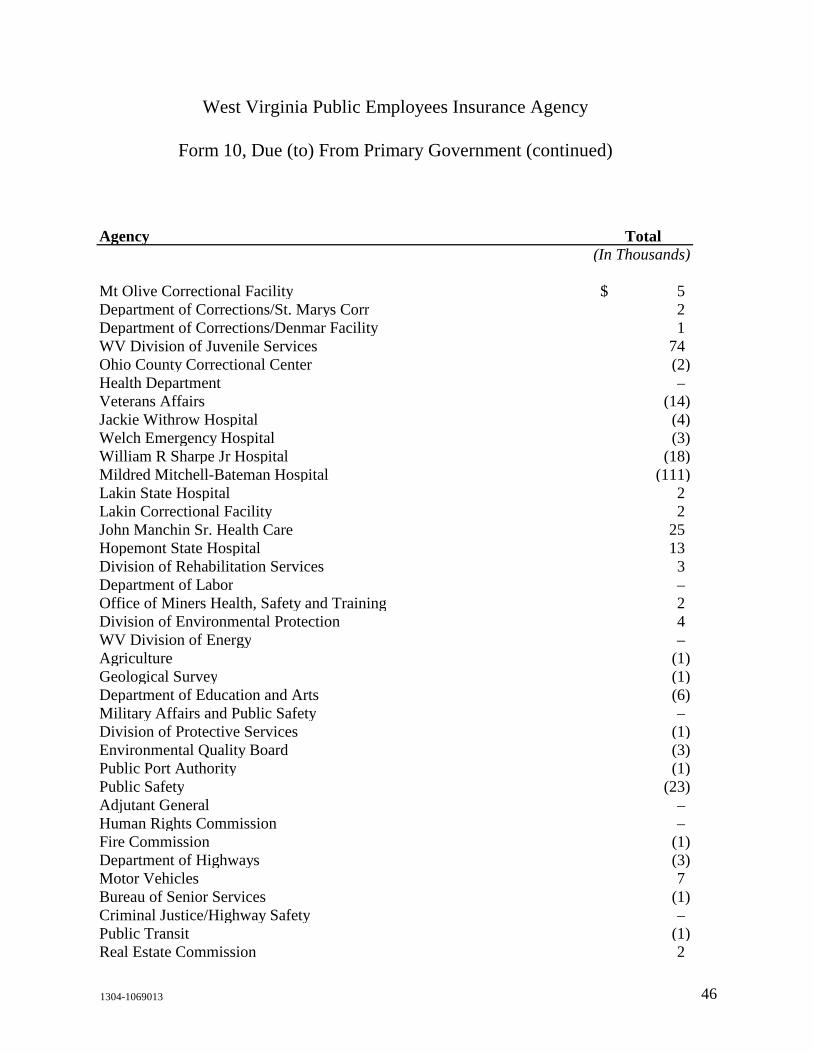
Agency Total(In Thousands)
Mt Olive Correctional Facility 5$ Department of Corrections/St. Marys Corr 2 Department of Corrections/Denmar Facility 1 WV Division of Juvenile Services 74 Ohio County Correctional Center (2) Health Department – Veterans Affairs (14) Jackie Withrow Hospital (4) Welch Emergency Hospital (3) William R Sharpe Jr Hospital (18) Mildred Mitchell-Bateman Hospital (111) Lakin State Hospital 2 Lakin Correctional Facility 2 John Manchin Sr. Health Care 25 Hopemont State Hospital 13 Division of Rehabilitation Services 3 Department of Labor – Office of Miners Health, Safety and Training 2 Division of Environmental Protection 4 WV Division of Energy – Agriculture (1) Geological Survey (1) Department of Education and Arts (6) Military Affairs and Public Safety – Division of Protective Services (1) Environmental Quality Board (3) Public Port Authority (1) Public Safety (23) Adjutant General – Human Rights Commission – Fire Commission (1) Department of Highways (3) Motor Vehicles 7 Bureau of Senior Services (1) Criminal Justice/Highway Safety – Public Transit (1) Real Estate Commission 2
West Virginia Public Employees Insurance Agency
Form 10, Due (to) From Primary Government (continued)
46 1304-1069013
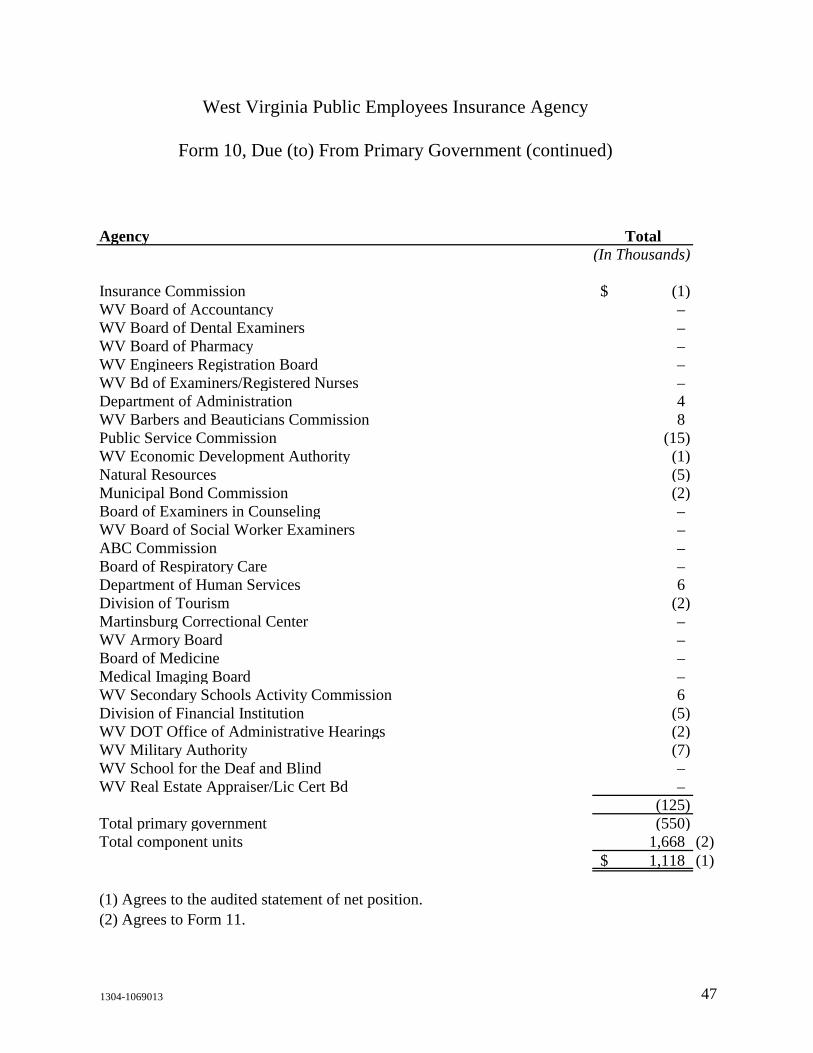
Agency Total(In Thousands)
West Virginia Public Employees Insurance Agency
Form 10, Due (to) From Primary Government (continued)
Insurance Commission (1)$ WV Board of Accountancy – WV Board of Dental Examiners – WV Board of Pharmacy – WV Engineers Registration Board – WV Bd of Examiners/Registered Nurses – Department of Administration 4 WV Barbers and Beauticians Commission 8 Public Service Commission (15) WV Economic Development Authority (1) Natural Resources (5) Municipal Bond Commission (2) Board of Examiners in Counseling – WV Board of Social Worker Examiners – ABC Commission – Board of Respiratory Care – Department of Human Services 6 Division of Tourism (2) Martinsburg Correctional Center – WV Armory Board – Board of Medicine – Medical Imaging Board – WV Secondary Schools Activity Commission 6 Division of Financial Institution (5) WV DOT Office of Administrative Hearings (2) WV Military Authority (7) WV School for the Deaf and Blind – WV Real Estate Appraiser/Lic Cert Bd –
(125) Total primary government (550) Total component units 1,668 (2)
1,118$ (1)
(1) Agrees to the audited statement of net position.(2) Agrees to Form 11.
47 1304-1069013
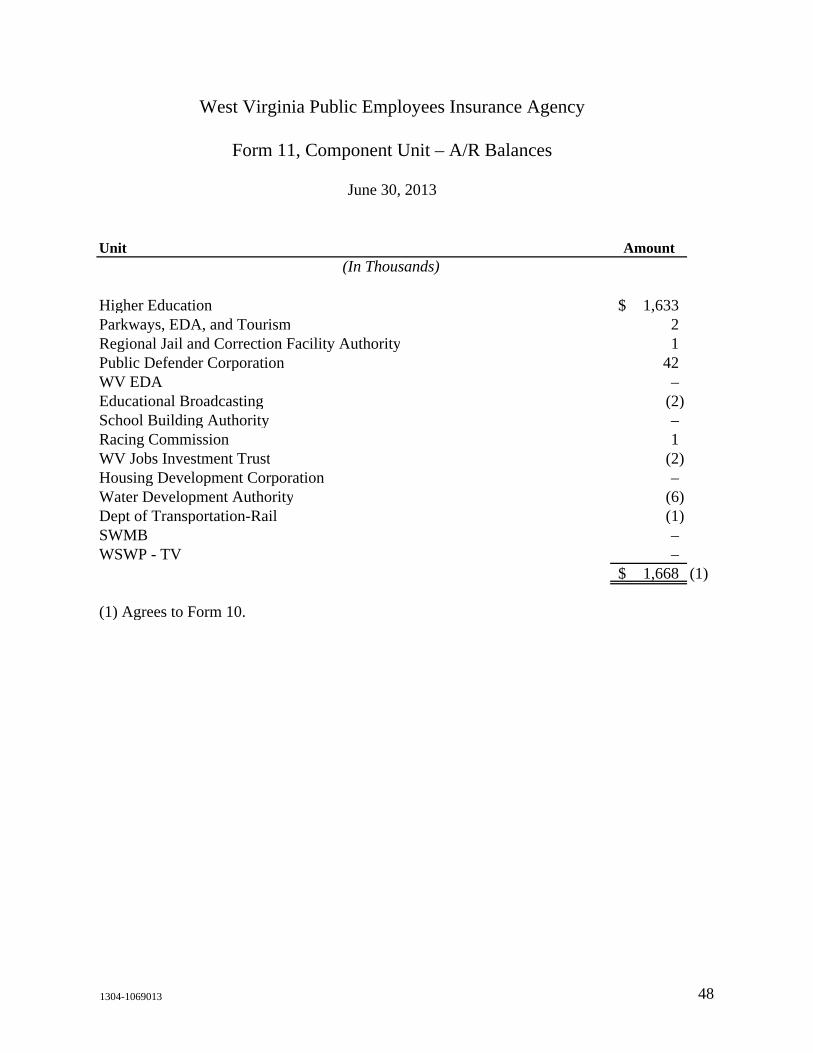
Unit Amount
Higher Education 1,633$ Parkways, EDA, and Tourism 2 Regional Jail and Correction Facility Authority 1 Public Defender Corporation 42 WV EDA – Educational Broadcasting (2) School Building Authority – Racing Commission 1 WV Jobs Investment Trust (2) Housing Development Corporation – Water Development Authority (6) Dept of Transportation-Rail (1) SWMB – WSWP - TV –
1,668$ (1)
(1) Agrees to Form 10.
June 30, 2013
West Virginia Public Employees Insurance Agency
Form 11, Component Unit – A/R Balances
(In Thousands)
48 1304-1069013
1304-1069013 49
Report on Internal Control Over Financial Reporting and on Compliance and Other Matters Based on an Audit of Financial Statements
Performed in Accordance With Government Auditing Standards
The Finance Board and Management West Virginia Public Employees Insurance Agency
We have audited, in accordance with auditing standards generally accepted in the United States and the standards applicable to financial audits contained in Government Auditing Standards issued by the Comptroller General of the United States, the financial statements of the West Virginia Public Employees Insurance Agency (PEIA), which comprise the statement of net position as of June 30, 2013, and the related statements of revenues, expenses and changes in position and cash flows for the year then ended, and the related notes to the financial statements, and have issued our report thereon dated October 15, 2013.
Internal Control Over Financial Reporting
In planning and performing our audit, we considered PEIA’s internal control over financial reporting (internal control) to determine the audit procedures that are appropriate in the circumstances for the purpose of expressing our opinion on the financial statements, but not for the purpose of expressing an opinion on the effectiveness of PEIA’s internal control. Accordingly, we do not express an opinion on the effectiveness of PEIA’s internal control.
A deficiency in internal control exists when the design or operation of a control does not allow management or employees, in the normal course of performing their assigned functions, to prevent, or detect and correct misstatements on a timely basis. A material weakness is a deficiency, or combination of deficiencies, in internal control, such that there is a reasonable possibility that a material misstatement of the entity’s financial statements will not be prevented, or detected and corrected, on a timely basis. A significant deficiency is a deficiency, or a combination of deficiencies, in internal control that is less severe than a material weakness, yet important enough to merit attention by those charged with governance.
Our consideration of internal control was for the limited purpose described in the first paragraph of this section and was not designed to identify all deficiencies in internal control that might be material weaknesses or significant deficiencies. Given these limitations, during our audit we did not identify any deficiencies in internal control that we consider to be material weaknesses. However, material weaknesses may exist that have not been identified.
A member firm of Ernst & Young Global Limited
Ernst & Young LLP 900 United Center 500 Virginia Street East Charleston, WV 25301 Tel: +1 304 343 8971 Fax: +1 304 357 5994 www.ey.com
1304-1069013 50
Compliance and Other Matters
As part of obtaining reasonable assurance about whether PEIA’s financial statements are free of material misstatement, we performed tests of its compliance with certain provisions of laws, regulations, contracts, and grant agreements, noncompliance with which could have a direct and material effect on the determination of financial statement amounts. However, providing an opinion on compliance with those provisions was not an objective of our audit and, accordingly, we do not express such an opinion. The results of our tests disclosed no instances of noncompliance or other matters that are required to be reported under Government Auditing Standards.
Purpose of This Report
The purpose of this report is solely to describe the scope of our testing of internal control and compliance and the result of that testing, and not to provide an opinion on the entity’s internal control or on compliance. This report is an integral part of an audit performed in accordance with Government Auditing Standards in considering the entity’s internal control and compliance. Accordingly, this communication is not suitable for any other purpose.
ey October 15, 2013
A member firm of Ernst & Young Global Limited

Ernst & Young LLP
Assurance | Tax | Transactions | Advisory
About Ernst & YoungErnst & Young is a global leader in assurance, tax, transaction and advisory services. Worldwide, our 167,000 people are united by our shared values and an unwavering commitment to quality. We make a difference by helping our people, our clients and our wider communities achieve their potential.
For more information, please visit www.ey.com
Ernst & Young refers to the global organization of member firms of Ernst & Young Global Limited, each of which is a separate legal entity. Ernst & Young Global Limited, a UK company limited by guarantee, does not provide services to clients. This Report has been prepared by Ernst & Young LLP, a client serving member firm located in the United States.