Embed Size (px)
Citation preview
Shale Gas and Global Gas Geopolitics Jim Franks, Ernst & Young LLP Alex Fleming, Ernst & Young LLP
Page 1 Shale Gas and Global Geopolitics
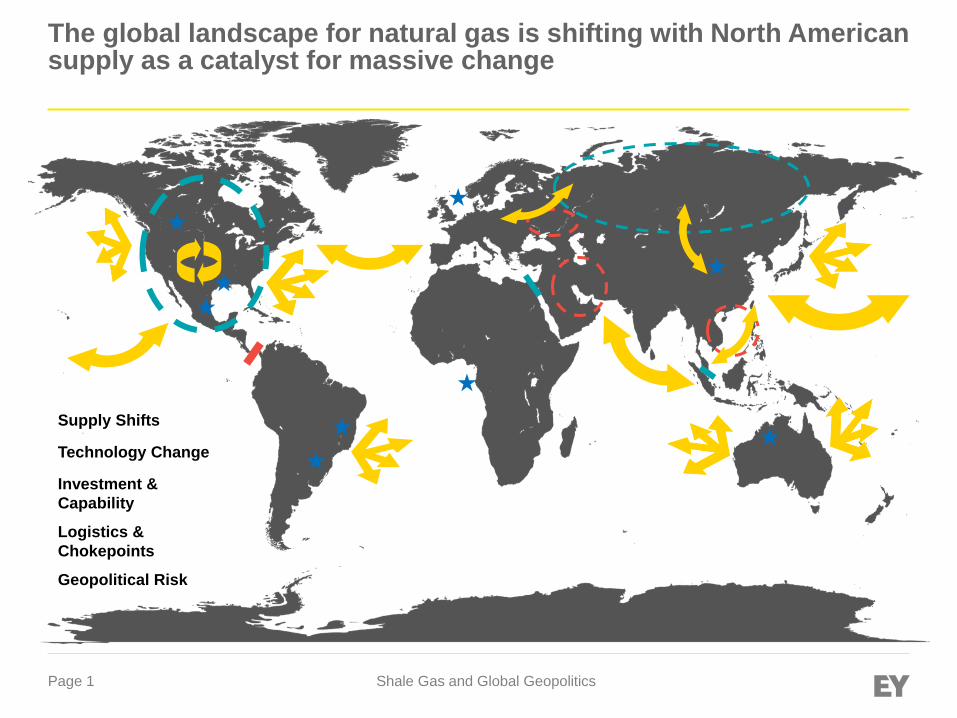
The global landscape for natural gas is shifting with North American supply as a catalyst for massive change
Supply Shifts
Technology Change
Investment &
Capability
Logistics &
Chokepoints
Geopolitical Risk
Page 2 Shale Gas and Global Geopolitics
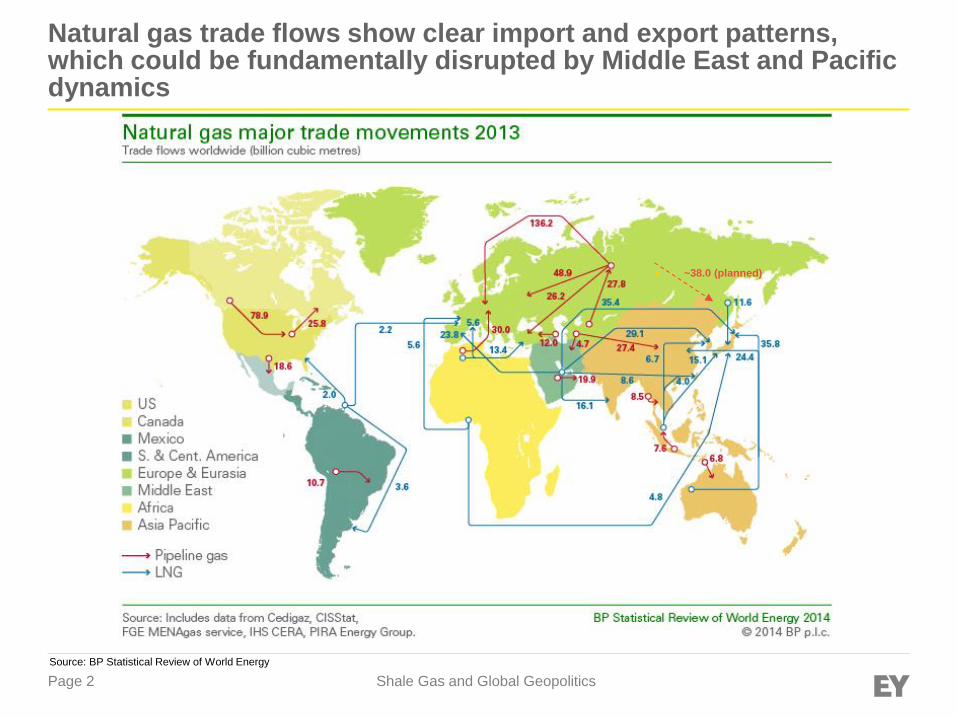
Natural gas trade flows show clear import and export patterns, which could be fundamentally disrupted by Middle East and Pacific dynamics
Source: BP Statistical Review of World Energy
► ~38.0 (planned)
Page 3 Shale Gas and Global Geopolitics
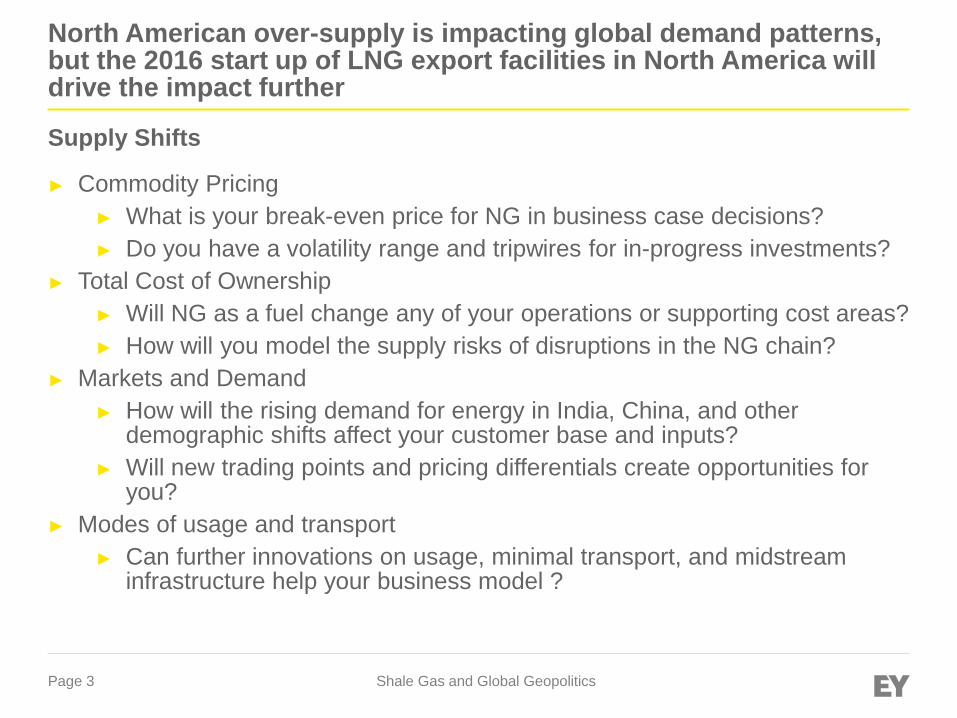
North American over-supply is impacting global demand patterns, but the 2016 start up of LNG export facilities in North America will drive the impact further
► Commodity Pricing
► What is your break-even price for NG in business case decisions?
► Do you have a volatility range and tripwires for in-progress investments?
► Total Cost of Ownership
► Will NG as a fuel change any of your operations or supporting cost areas?
► How will you model the supply risks of disruptions in the NG chain?
► Markets and Demand
► How will the rising demand for energy in India, China, and other demographic shifts affect your customer base and inputs?
► Will new trading points and pricing differentials create opportunities for you?
► Modes of usage and transport
► Can further innovations on usage, minimal transport, and midstream infrastructure help your business model ?
Supply Shifts
Page 4 Shale Gas and Global Geopolitics
The technological applications that led to the US shale revolution are spreading, and are leading to a number of other innovations to capitalize on the abundance of gas
► Horizontal Drilling/Fracturing
► Are the fundamentals of the US revolution repeatable and able to be made operational?
► LNG/CNG
► What kind of advances will be integrated into new build terminals?
► What is the role of CNG vs. LNG in the balance?
► FLNG (Floating LNG Ships)
► Is the floating model economical or simply a way to bypass limitations?
► Micro LNG Plants
► What is the future of smaller scale facilities to access the global market?
► Water & Shale Supply Chain
► How will different global infrastructure patterns respond to the constraints and possible drive new well designs or R&D investments?
Technology Changes
Page 5 Shale Gas and Global Geopolitics
Global players are driving for a share of the growth as well as gaining access to knowledge and capabilities for future markets
► Capital flows ► Will the East to West investments continue or maintain after there is
sufficient ‘learning’ achieved? ► Investment Decision Making
► Can North America maintain the pace of exports with a ‘withdrawal’ of foreign capital?
► Training and Knowledge Transfer ► How fast will global investors realistically be able to replicate US
capabilities? ► How much financial impact will IP and knowledge transfers have on
companies trying to ‘export’ from North America? ► Global Mobility
► Will relocation and global management be able to be mobile to the level needed to maintain operations in new areas?
► Change Management ► How will local management and employees respond to the pace and
agility required to compete in new markets?
Investment and Capability Patterns
Page 6 Shale Gas and Global Geopolitics
Post-Panamax capabilities combined with supply demand balance changes in several countries will alter supporting trade patterns and hubs
► Malacca Straight and the Role of Singapore
► How fast will Singapore develop as a trading hub and what will its level of independence realistically maintain?
► Middle East and OPEC with the Suez Canal
► As OPEC influence wanes, which players will be the ‘market makers’ for natural gas pricing?
► How will market power manifest itself in a heavy West to East LNG world?
► Panama Canal scenarios and Atlantic/Pacific Trade
► Will the development of larger footprint vessels change trade patterns or supplement existing balances?
► How fast will investors push to utilize the new canal capacity?
► What will be the long term viability of Nuclear Power in Japan?
► Shipping capacity and flexibility
► How will shipyard constraints impact the ability to ramp up these activities?
Logistics and Chokepoints
Page 7 Shale Gas and Global Geopolitics
Geopolitical risks are rising from a 20 year ‘hiatus’ and need to be managed proactively to maintain visibility, control volatility of portfolios, and prevent irrecoverable losses
► South China Sea Dynamics
► If a flashpoint develops that stops all non-China flagged commercial shipping – do you have a contingency?
► Middle East and further OPEC destabilization
► Is there a role for OPEC in gas pricing in the post-2016 world?
► Are there any emerging cartels and how do you put yourself on the right side of them?
► European – Russian relationship evolution
► Is the European status quo sustainable? What further dynamics will arise from US supply of natural gas and FLNG for European supply?
► Terrorism targeting and disruptions
► What is the contingency for selected targeting of offshore NG platforms by pirates or terrorists? How will you manage these disruptions?
► US isolationist tendencies
► US self-sufficiency will change intervention criteria and create the need for new alliances? How will these balance imperatives?
Geopolitical Risks
Page 8 Shale Gas and Global Geopolitics
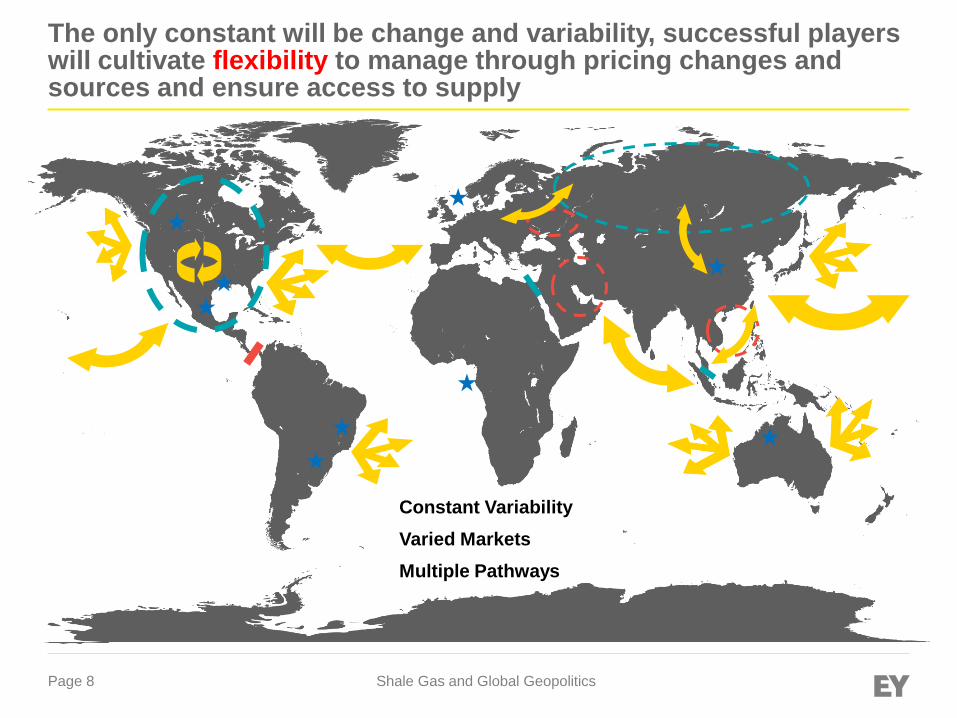
The only constant will be change and variability, successful players will cultivate flexibility to manage through pricing changes and sources and ensure access to supply
Constant Variability
Varied Markets
Multiple Pathways
Page 9 Shale Gas and Global Geopolitics
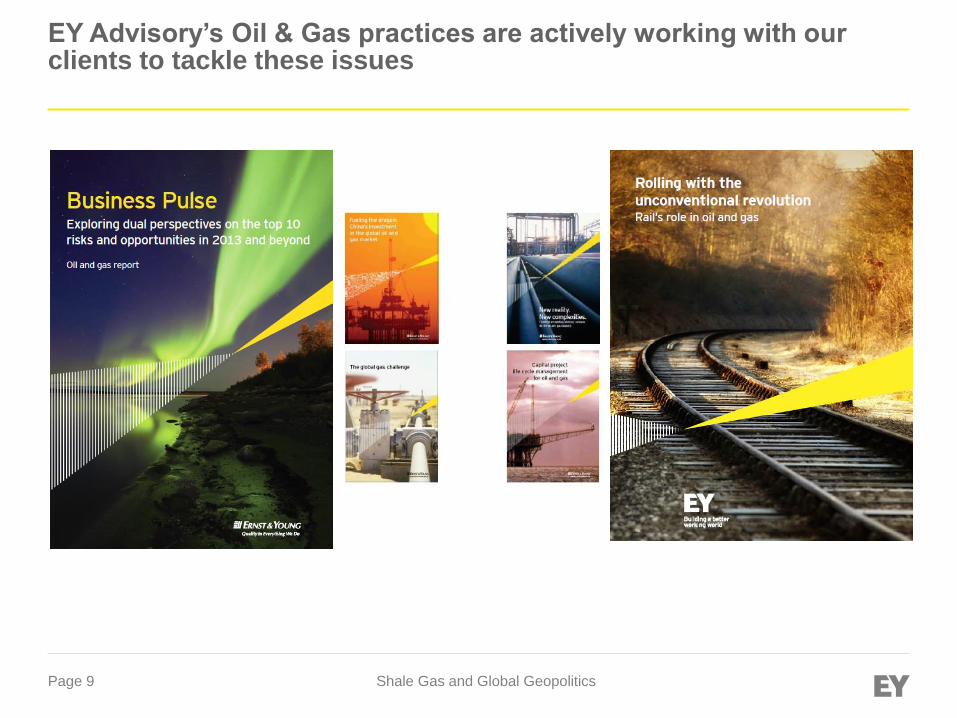
EY Advisory’s Oil & Gas practices are actively working with our clients to tackle these issues
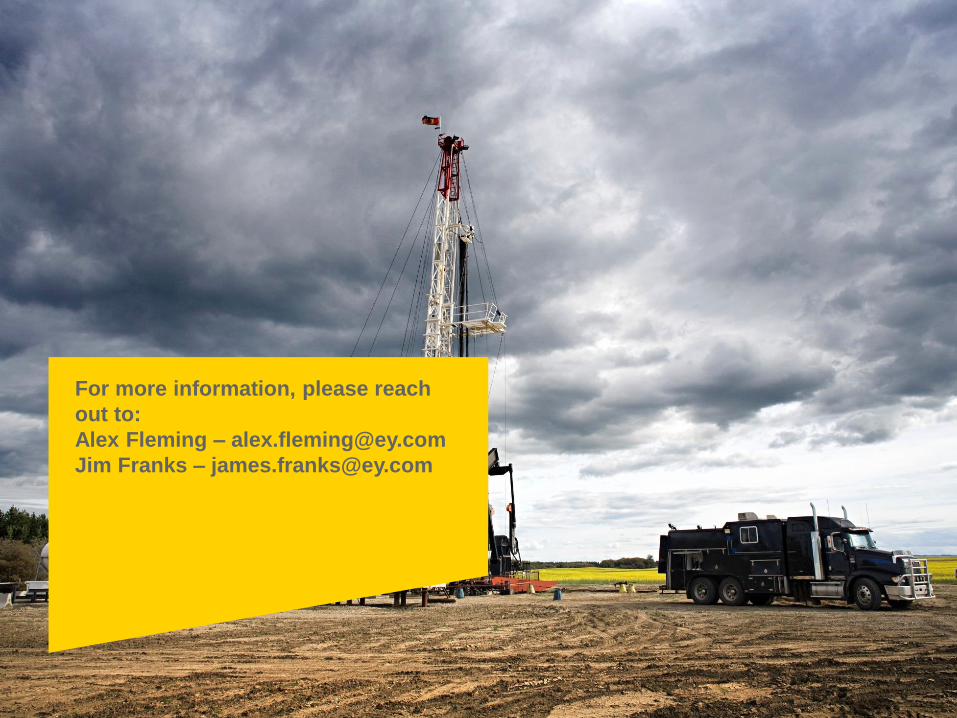
For more information, please reach
out to:
Alex Fleming – [email protected]
Jim Franks – [email protected]

EY | Assurance | Tax | Transactions | Advisory
About EY
EY is a global leader in assurance, tax, transaction and advisory
services. The insights and quality services we deliver help build trust
and confidence in the capital markets and in economies the world over.
We develop outstanding leaders who team to deliver on our promises
to all of our stakeholders. In so doing, we play a critical role in building
a better working world for our people, for our clients and for our
communities.
EY refers to the global organization, and may refer to one or more, of
the member firms of Ernst & Young Global Limited, each of which is a
separate legal entity. Ernst & Young Global Limited, a UK company
limited by guarantee, does not provide services to clients. For more
information about our organization, please visit ey.com.
How EY’s Global Oil & Gas Center can help your business
The oil and gas sector is constantly changing. Increasingly uncertain
energy policies, geopolitical complexities, cost management and
climate change all present significant challenges. EY’s Global Oil & Gas
Center supports a global network of more than 9,600 oil and gas
professionals with extensive experience in providing assurance, tax,
transaction and advisory services across the upstream, midstream,
downstream and oilfield service sub-sectors. The Center works to
anticipate market trends, execute the mobility of our global resources
and articulate points of view on relevant key sector issues. With our
deep sector focus, we can help your organization drive down costs and
compete more effectively.
© 2014 EYGM Limited.
All Rights Reserved.
BSC no.
ED 1114
This material has been prepared for general informational purposes only and is not intended to
be relied upon as accounting, tax, or other professional advice. Please refer to your advisors for
specific advice.
Page 12 Shale Gas and Global Geopolitics
Seminário de
Gás Natural
Page 13 Shale Gas and Global Geopolitics
Page 13 Seminário de Gás Natural
Asian natural gas market
Page 14 Shale Gas and Global Geopolitics
Page 14 Seminário de Gás Natural
► The region has three separate markets which have their
distinct dynamics.
► First, the mature, well‐established markets of Japan, Korea and
Chinese Taipei, which are isolated, mainly supplied by LNG and
have limited scope for further growth.
► Second, the “emerging giants”, China and India, which will develop
considerable natural gas demand supplied through both pipeline
and LNG.
► Third, the area of South‐East Asia, which consists of several large
LNG producers (Malaysia, Indonesia and Brunei) and rapidly
growing economies interconnected to a limited extent by pipelines.
The Asian‐Pacific natural gas market is complex and fragmented
Page 15 Shale Gas and Global Geopolitics
Page 15 Seminário de Gás Natural
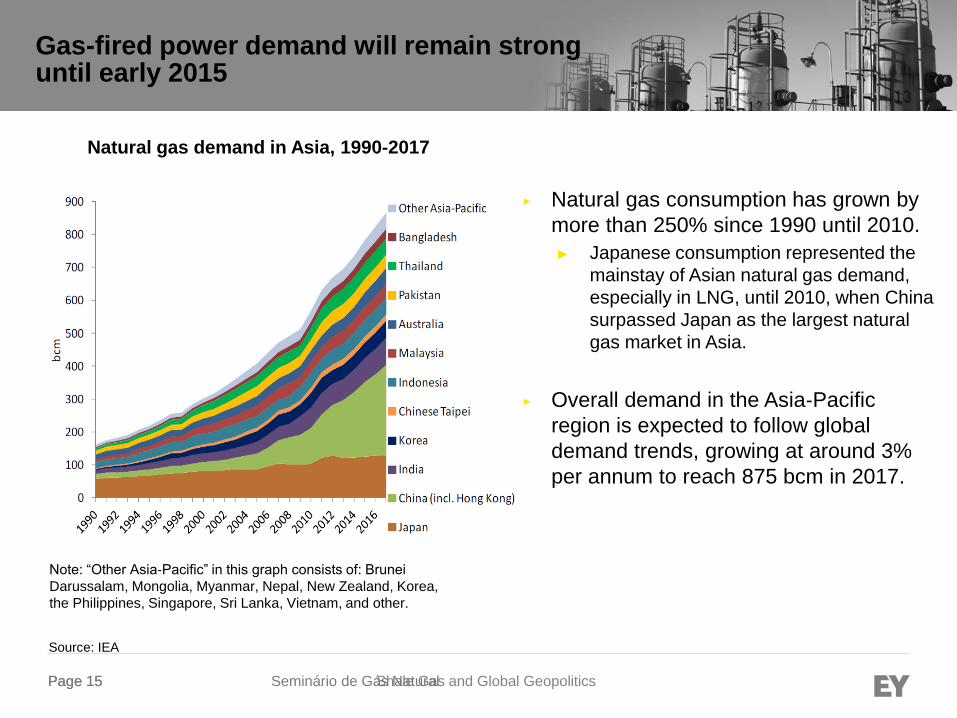
► Natural gas consumption has grown by
more than 250% since 1990 until 2010.
► Japanese consumption represented the
mainstay of Asian natural gas demand,
especially in LNG, until 2010, when China
surpassed Japan as the largest natural
gas market in Asia.
► Overall demand in the Asia‐Pacific
region is expected to follow global
demand trends, growing at around 3%
per annum to reach 875 bcm in 2017.
Source: IEA
Natural gas demand in Asia, 1990‐2017
Note: “Other Asia‐Pacific” in this graph consists of: Brunei
Darussalam, Mongolia, Myanmar, Nepal, New Zealand, Korea,
the Philippines, Singapore, Sri Lanka, Vietnam, and other.
Gas-fired power demand will remain strong until early 2015
Page 16 Shale Gas and Global Geopolitics
Page 16 Seminário de Gás Natural
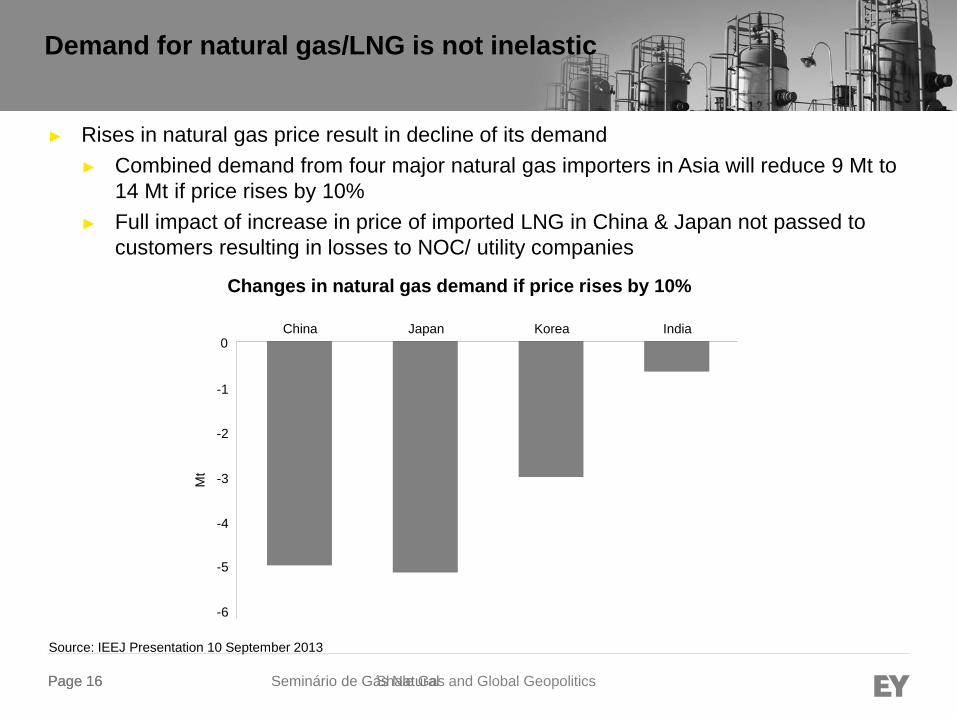
► Rises in natural gas price result in decline of its demand
► Combined demand from four major natural gas importers in Asia will reduce 9 Mt to
14 Mt if price rises by 10%
► Full impact of increase in price of imported LNG in China & Japan not passed to
customers resulting in losses to NOC/ utility companies
Changes in natural gas demand if price rises by 10%
Mt
0 China Japan Korea India
-1
-2
-3
-4
-5
-6
Source: IEEJ Presentation 10 September 2013
Demand for natural gas/LNG is not inelastic
Page 17 Shale Gas and Global Geopolitics
Page 17 Seminário de Gás Natural
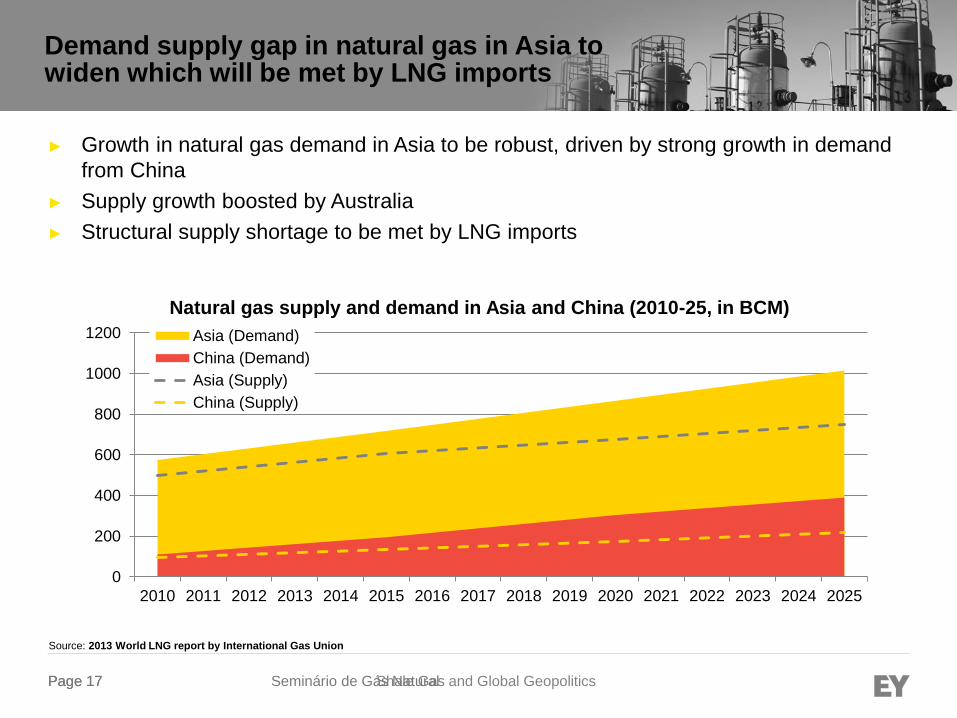
► Growth in natural gas demand in Asia to be robust, driven by strong growth in demand
from China
► Supply growth boosted by Australia
► Structural supply shortage to be met by LNG imports
Source: 2013 World LNG report by International Gas Union
0
200
400
600
800
1000
1200
2010 2011 2012 2013 2014 2015 2016 2017 2018 2019 2020 2021 2022 2023 2024 2025
Natural gas supply and demand in Asia and China (2010-25, in BCM)
Asia (Demand)
China (Demand)
Asia (Supply)
China (Supply)
Demand supply gap in natural gas in Asia to widen which will be met by LNG imports
Page 18 Shale Gas and Global Geopolitics
Page 18 Seminário de Gás Natural
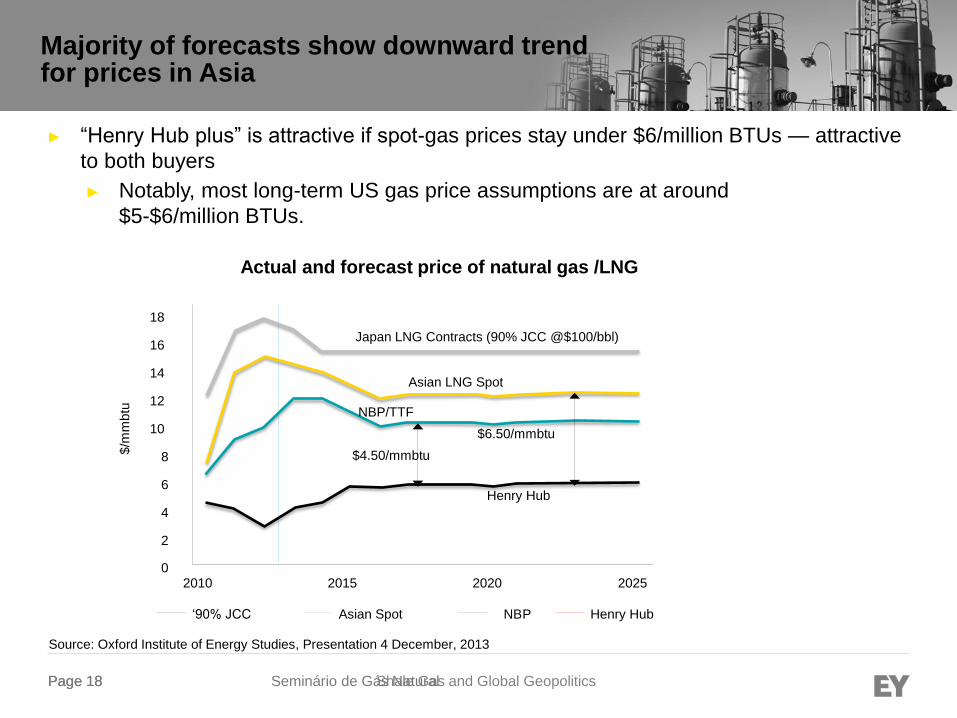
► “Henry Hub plus” is attractive if spot-gas prices stay under $6/million BTUs — attractive
to both buyers
► Notably, most long-term US gas price assumptions are at around
$5-$6/million BTUs.
18
16
14
12
10
8
6
4
2
0 2010 2015 2020 2025
‘90% JCC Asian Spot NB P Henry Hub
Japan LNG Contracts (90% JCC @$100/bbl)
Asian LNG Spot
NBP/TTF
Henry Hub
$/m
mbtu
$4.50/mmbtu
$6.50/mmbtu
Source: Oxford Institute of Energy Studies, Presentation 4 December, 2013
Actual and forecast price of natural gas /LNG
Majority of forecasts show downward trend for prices in Asia
Page 19 Shale Gas and Global Geopolitics
Page 19 Seminário de Gás Natural
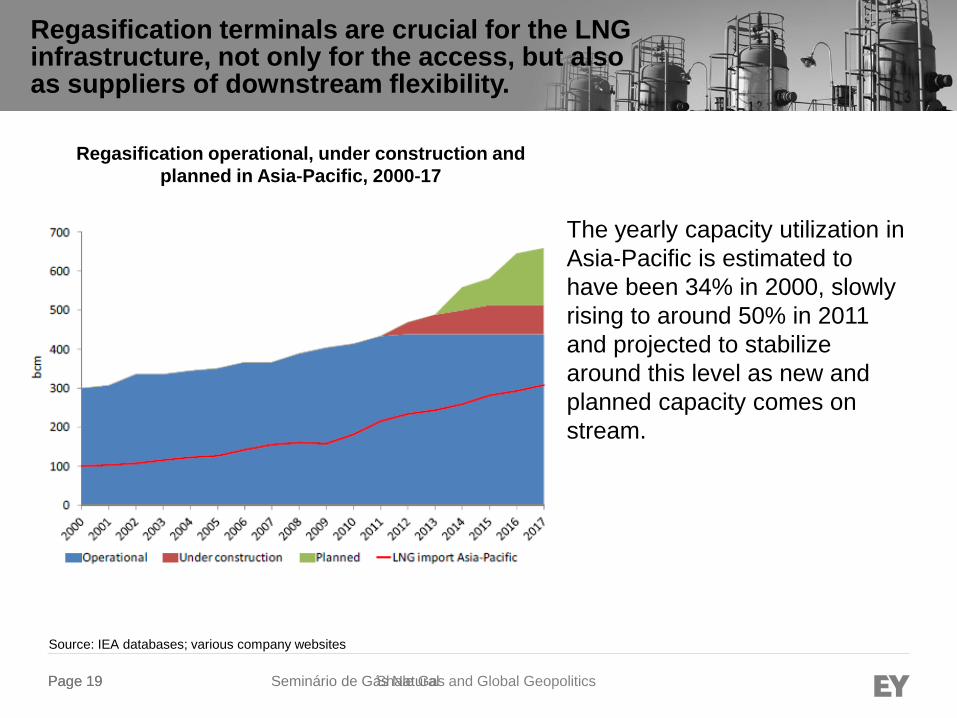
Source: IEA databases; various company websites
The yearly capacity utilization in
Asia‐Pacific is estimated to
have been 34% in 2000, slowly
rising to around 50% in 2011
and projected to stabilize
around this level as new and
planned capacity comes on
stream.
Regasification operational, under construction and
planned in Asia‐Pacific, 2000‐17
Regasification terminals are crucial for the LNG infrastructure, not only for the access, but also as suppliers of downstream flexibility.
Page 20 Shale Gas and Global Geopolitics
Page 20 Seminário de Gás Natural
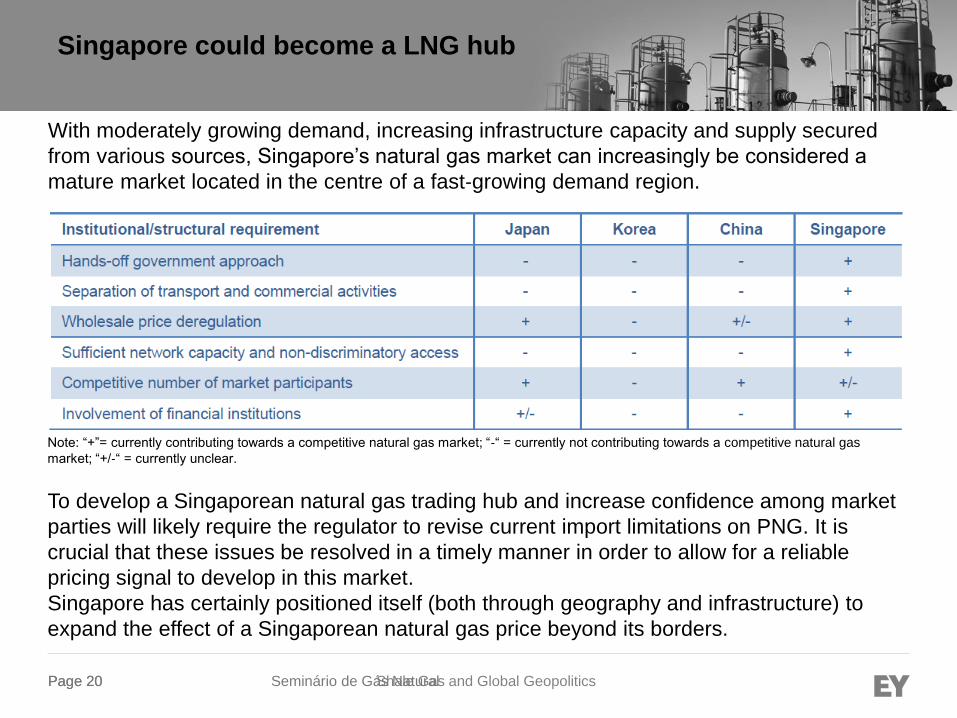
Note: “+”= currently contributing towards a competitive natural gas market; “‐“ = currently not contributing towards a competitive natural gas
market; “+/‐“ = currently unclear.
With moderately growing demand, increasing infrastructure capacity and supply secured
from various sources, Singapore’s natural gas market can increasingly be considered a
mature market located in the centre of a fast‐growing demand region.
To develop a Singaporean natural gas trading hub and increase confidence among market
parties will likely require the regulator to revise current import limitations on PNG. It is
crucial that these issues be resolved in a timely manner in order to allow for a reliable
pricing signal to develop in this market.
Singapore has certainly positioned itself (both through geography and infrastructure) to
expand the effect of a Singaporean natural gas price beyond its borders.
Singapore could become a LNG hub
Page 21 Shale Gas and Global Geopolitics
Page 21 Seminário de Gás Natural
► The rigidity of the LNG supply chain has traditionally provided considerable impetus to
governments to secure long‐term security of supply through state owned natural gas
companies.
► These organizations can match supply and demand for LNG through the vertical integration of
their activities along the value chain.
► Regasification terminals are generally developed to accommodate long‐term supply
contracts concluded by state‐owned enterprises and, without unbiased third party
access, further limit LNG supply flexibility to consumers.
► The natural gas market structure in most Asian economies limits competition as a result
of strong national organizations, which are generally regulated monopolies.
► Objective: to maximize revenues on their long‐term, oil‐indexed LNG contracts in their
respective home markets.
► Nearly 79% of the terminals in operation, under construction or planned until 2017 are
owned and operated by vertically integrated, government‐owned entities.
The impact of government policies on market structure
Page 22 Shale Gas and Global Geopolitics
Page 22 Seminário de Gás Natural
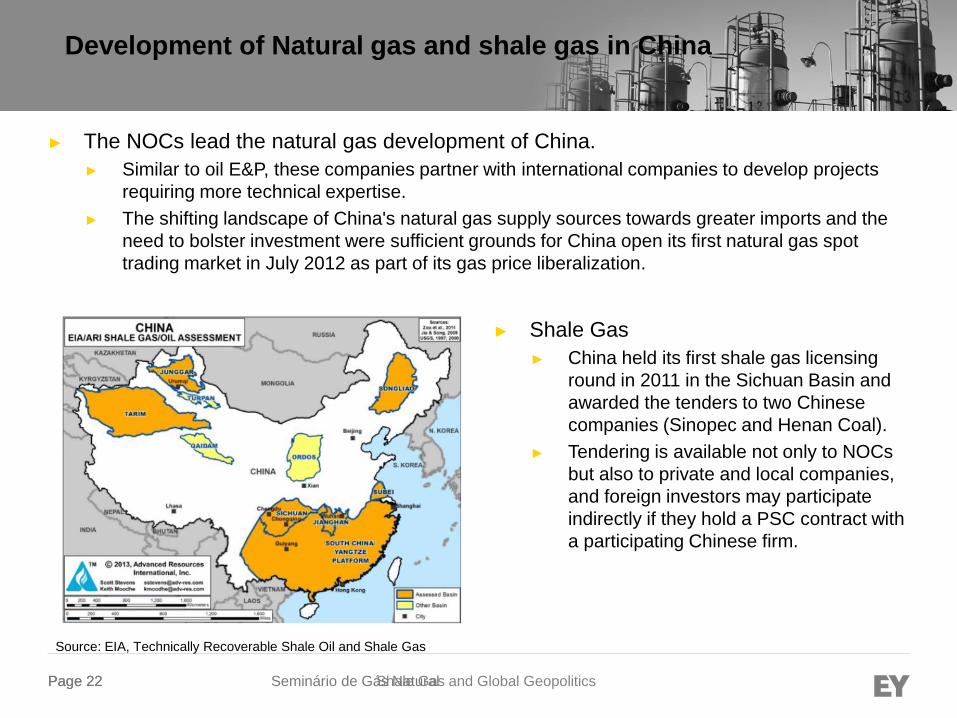
Development of Natural gas and shale gas in China
Source: EIA, Technically Recoverable Shale Oil and Shale Gas
► The NOCs lead the natural gas development of China.
► Similar to oil E&P, these companies partner with international companies to develop projects
requiring more technical expertise.
► The shifting landscape of China's natural gas supply sources towards greater imports and the
need to bolster investment were sufficient grounds for China open its first natural gas spot
trading market in July 2012 as part of its gas price liberalization.
► Shale Gas
► China held its first shale gas licensing
round in 2011 in the Sichuan Basin and
awarded the tenders to two Chinese
companies (Sinopec and Henan Coal).
► Tendering is available not only to NOCs
but also to private and local companies,
and foreign investors may participate
indirectly if they hold a PSC contract with
a participating Chinese firm.

Page 23 Shale Gas and Global Geopolitics
Page 23 Seminário de Gás Natural
Russian natural gas market
Page 24 Shale Gas and Global Geopolitics
Page 24 Seminário de Gás Natural
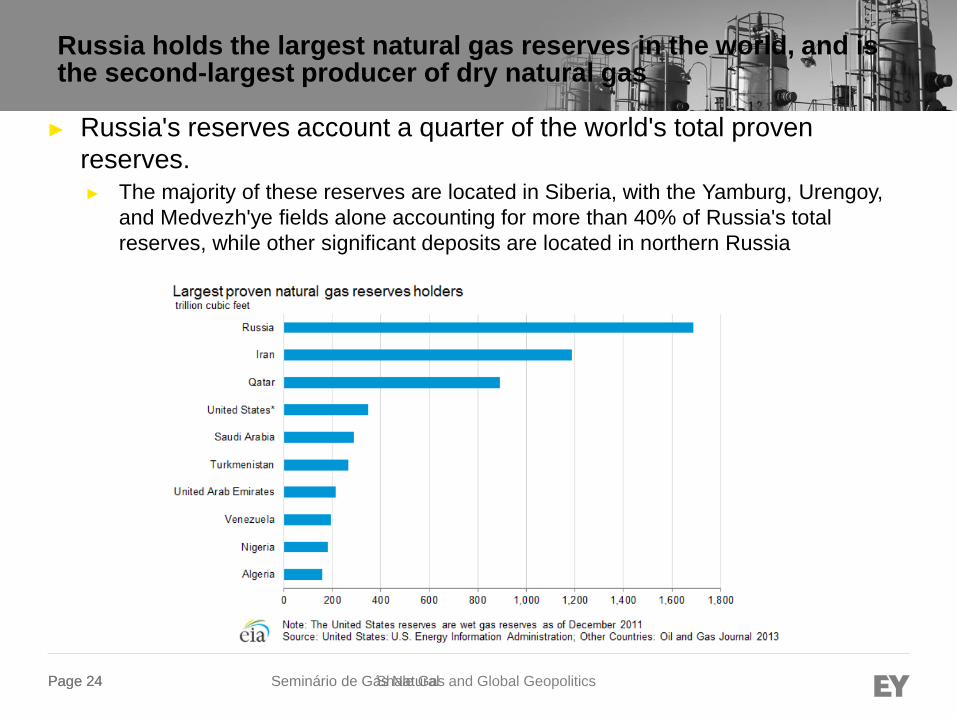
Russia holds the largest natural gas reserves in the world, and is the second-largest producer of dry natural gas
► Russia's reserves account a quarter of the world's total proven
reserves. ► The majority of these reserves are located in Siberia, with the Yamburg, Urengoy,
and Medvezh'ye fields alone accounting for more than 40% of Russia's total
reserves, while other significant deposits are located in northern Russia
Page 25 Shale Gas and Global Geopolitics
Page 25 Seminário de Gás Natural
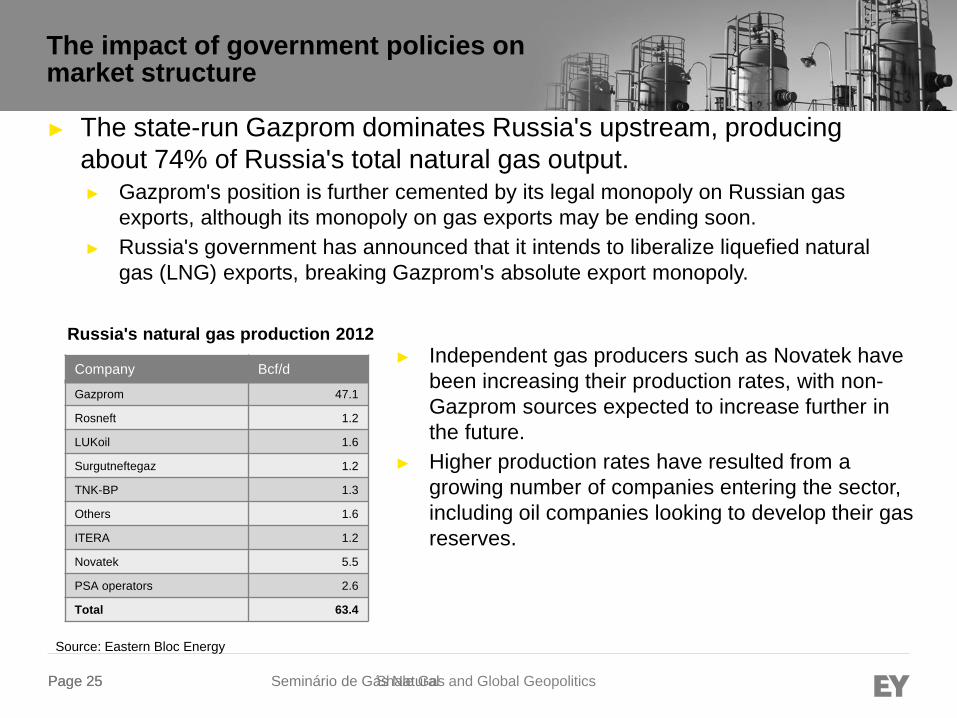
The impact of government policies on market structure
Russia's natural gas production 2012
Company Bcf/d
Gazprom 47.1
Rosneft 1.2
LUKoil 1.6
Surgutneftegaz 1.2
TNK-BP 1.3
Others 1.6
ITERA 1.2
Novatek 5.5
PSA operators 2.6
Total 63.4
Source: Eastern Bloc Energy
► The state-run Gazprom dominates Russia's upstream, producing
about 74% of Russia's total natural gas output. ► Gazprom's position is further cemented by its legal monopoly on Russian gas
exports, although its monopoly on gas exports may be ending soon.
► Russia's government has announced that it intends to liberalize liquefied natural
gas (LNG) exports, breaking Gazprom's absolute export monopoly.
► Independent gas producers such as Novatek have
been increasing their production rates, with non-
Gazprom sources expected to increase further in
the future.
► Higher production rates have resulted from a
growing number of companies entering the sector,
including oil companies looking to develop their gas
reserves.
Page 26 Shale Gas and Global Geopolitics
Page 26 Seminário de Gás Natural
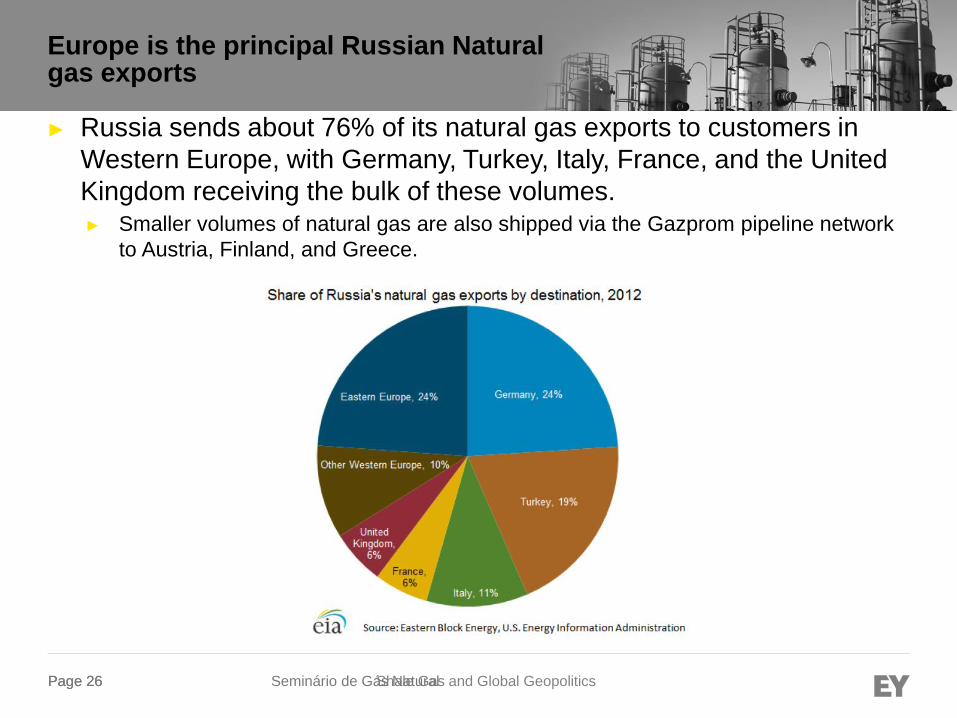
Europe is the principal Russian Natural gas exports
► Russia sends about 76% of its natural gas exports to customers in
Western Europe, with Germany, Turkey, Italy, France, and the United
Kingdom receiving the bulk of these volumes. ► Smaller volumes of natural gas are also shipped via the Gazprom pipeline network
to Austria, Finland, and Greece.
Page 27 Shale Gas and Global Geopolitics
Page 27 Seminário de Gás Natural
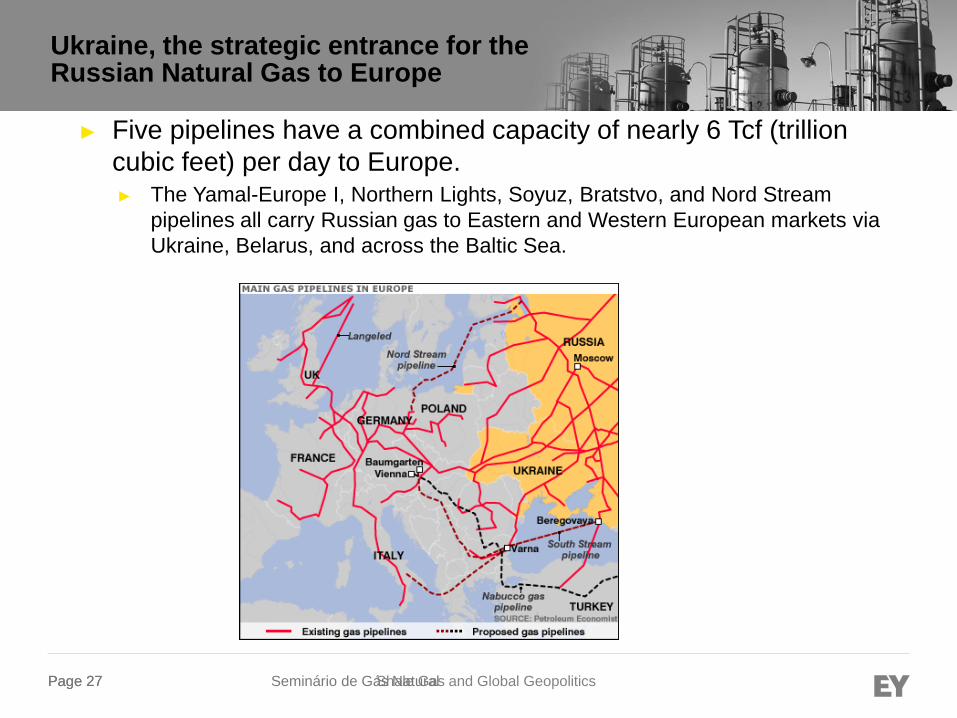
Ukraine, the strategic entrance for the Russian Natural Gas to Europe
► Five pipelines have a combined capacity of nearly 6 Tcf (trillion
cubic feet) per day to Europe. ► The Yamal-Europe I, Northern Lights, Soyuz, Bratstvo, and Nord Stream
pipelines all carry Russian gas to Eastern and Western European markets via
Ukraine, Belarus, and across the Baltic Sea.
Page 28 Shale Gas and Global Geopolitics
Page 28 Seminário de Gás Natural
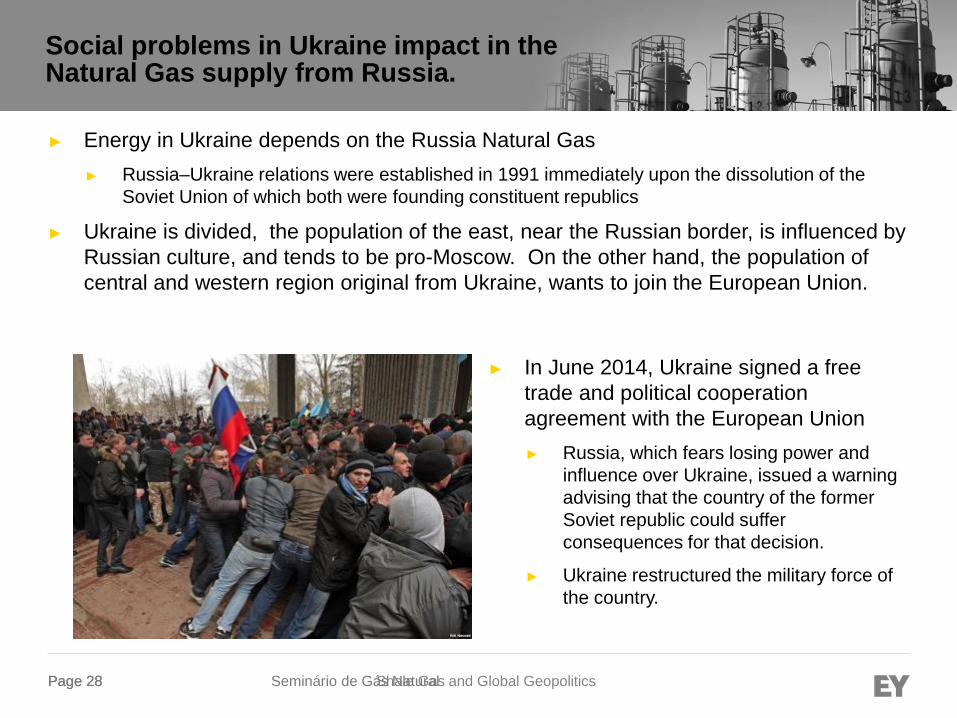
Social problems in Ukraine impact in the Natural Gas supply from Russia.
► Energy in Ukraine depends on the Russia Natural Gas
► Russia–Ukraine relations were established in 1991 immediately upon the dissolution of the
Soviet Union of which both were founding constituent republics
► Ukraine is divided, the population of the east, near the Russian border, is influenced by
Russian culture, and tends to be pro-Moscow. On the other hand, the population of
central and western region original from Ukraine, wants to join the European Union.
► In June 2014, Ukraine signed a free
trade and political cooperation
agreement with the European Union
► Russia, which fears losing power and
influence over Ukraine, issued a warning
advising that the country of the former
Soviet republic could suffer
consequences for that decision.
► Ukraine restructured the military force of
the country.
Page 29 Shale Gas and Global Geopolitics
Page 29 Seminário de Gás Natural
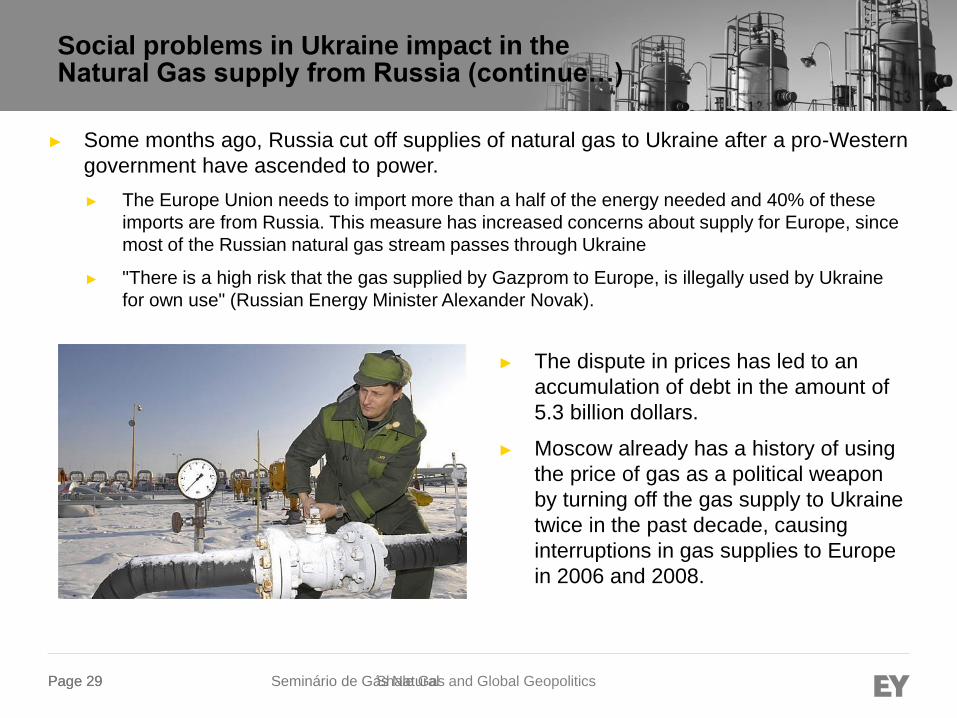
Social problems in Ukraine impact in the Natural Gas supply from Russia (continue…)
► Some months ago, Russia cut off supplies of natural gas to Ukraine after a pro-Western
government have ascended to power.
► The Europe Union needs to import more than a half of the energy needed and 40% of these
imports are from Russia. This measure has increased concerns about supply for Europe, since
most of the Russian natural gas stream passes through Ukraine
► "There is a high risk that the gas supplied by Gazprom to Europe, is illegally used by Ukraine
for own use" (Russian Energy Minister Alexander Novak).
► The dispute in prices has led to an
accumulation of debt in the amount of
5.3 billion dollars.
► Moscow already has a history of using
the price of gas as a political weapon
by turning off the gas supply to Ukraine
twice in the past decade, causing
interruptions in gas supplies to Europe
in 2006 and 2008.
Page 30 Shale Gas and Global Geopolitics
Page 30 Seminário de Gás Natural
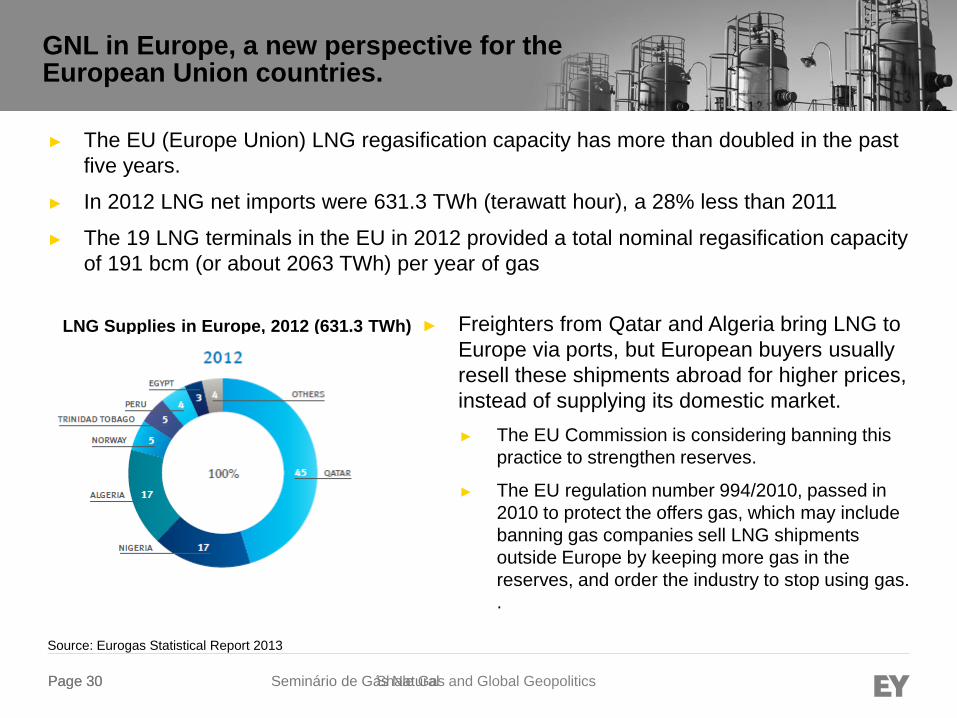
GNL in Europe, a new perspective for the European Union countries.
Source: Eurogas Statistical Report 2013
► The EU (Europe Union) LNG regasification capacity has more than doubled in the past
five years.
► In 2012 LNG net imports were 631.3 TWh (terawatt hour), a 28% less than 2011
► The 19 LNG terminals in the EU in 2012 provided a total nominal regasification capacity
of 191 bcm (or about 2063 TWh) per year of gas
LNG Supplies in Europe, 2012 (631.3 TWh) ► Freighters from Qatar and Algeria bring LNG to
Europe via ports, but European buyers usually
resell these shipments abroad for higher prices,
instead of supplying its domestic market.
► The EU Commission is considering banning this
practice to strengthen reserves.
► The EU regulation number 994/2010, passed in
2010 to protect the offers gas, which may include
banning gas companies sell LNG shipments
outside Europe by keeping more gas in the
reserves, and order the industry to stop using gas.
.
Page 31 Shale Gas and Global Geopolitics
Page 31 Seminário de Gás Natural
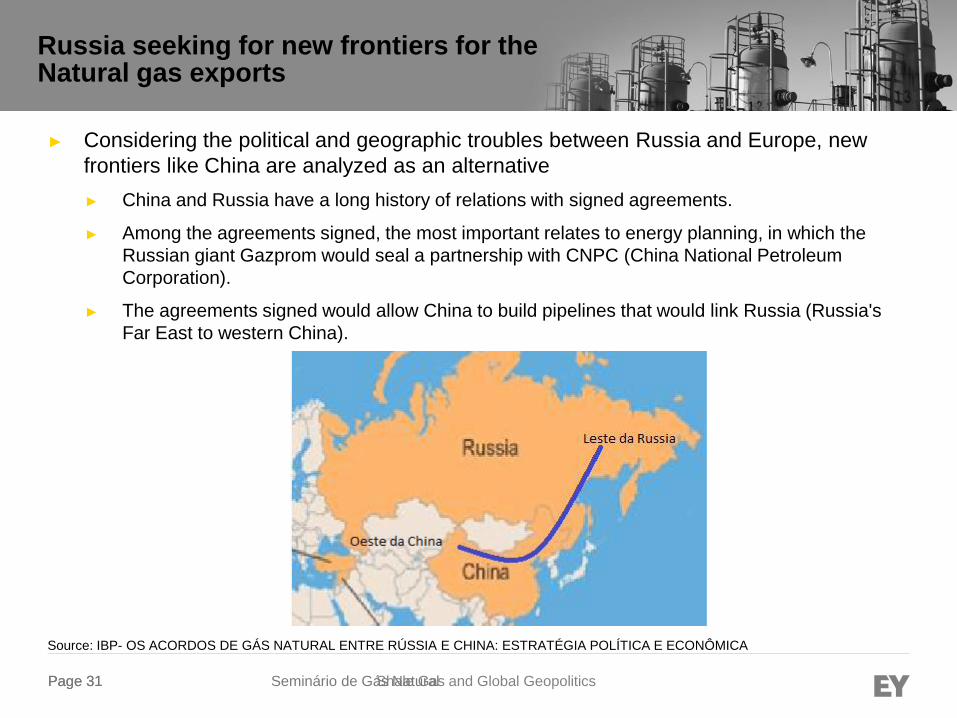
Russia seeking for new frontiers for the Natural gas exports
Source: IBP- OS ACORDOS DE GÁS NATURAL ENTRE RÚSSIA E CHINA: ESTRATÉGIA POLÍTICA E ECONÔMICA
► Considering the political and geographic troubles between Russia and Europe, new
frontiers like China are analyzed as an alternative
► China and Russia have a long history of relations with signed agreements.
► Among the agreements signed, the most important relates to energy planning, in which the
Russian giant Gazprom would seal a partnership with CNPC (China National Petroleum
Corporation).
► The agreements signed would allow China to build pipelines that would link Russia (Russia's
Far East to western China).
Page 32 Shale Gas and Global Geopolitics
Page 32 Seminário de Gás Natural
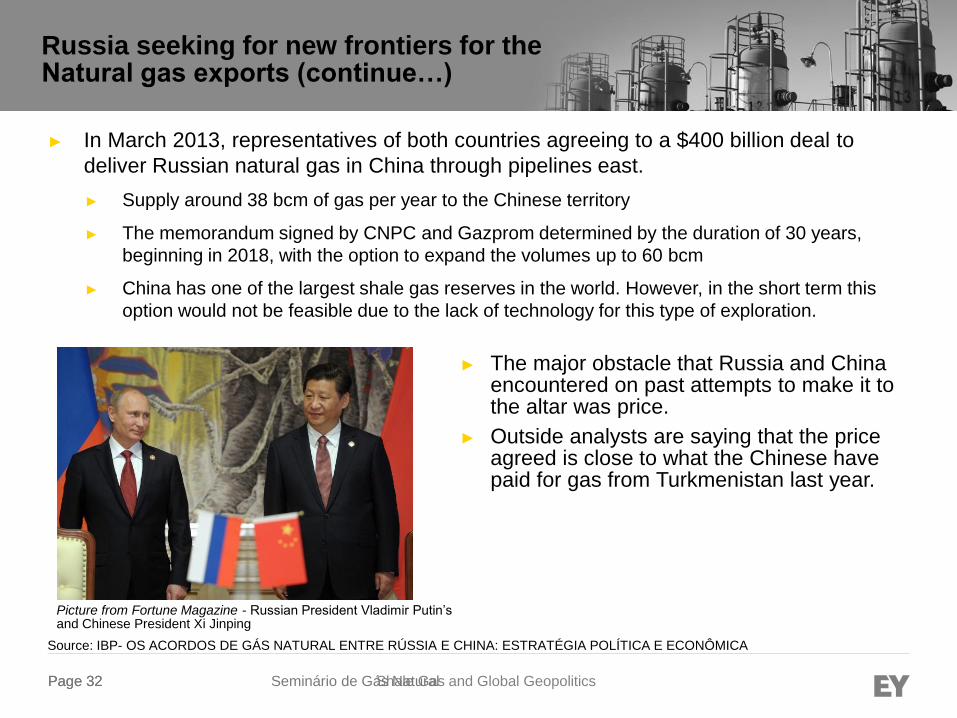
Russia seeking for new frontiers for the Natural gas exports (continue…)
Source: IBP- OS ACORDOS DE GÁS NATURAL ENTRE RÚSSIA E CHINA: ESTRATÉGIA POLÍTICA E ECONÔMICA
► In March 2013, representatives of both countries agreeing to a $400 billion deal to
deliver Russian natural gas in China through pipelines east.
► Supply around 38 bcm of gas per year to the Chinese territory
► The memorandum signed by CNPC and Gazprom determined by the duration of 30 years,
beginning in 2018, with the option to expand the volumes up to 60 bcm
► China has one of the largest shale gas reserves in the world. However, in the short term this
option would not be feasible due to the lack of technology for this type of exploration.
Picture from Fortune Magazine - Russian President Vladimir Putin’s and Chinese President Xi Jinping
► The major obstacle that Russia and China encountered on past attempts to make it to the altar was price.
► Outside analysts are saying that the price agreed is close to what the Chinese have paid for gas from Turkmenistan last year.
Page 33 Shale Gas and Global Geopolitics
Page 33 Seminário de Gás Natural
Middle East natural gas market
Page 34 Shale Gas and Global Geopolitics
Page 34 Seminário de Gás Natural
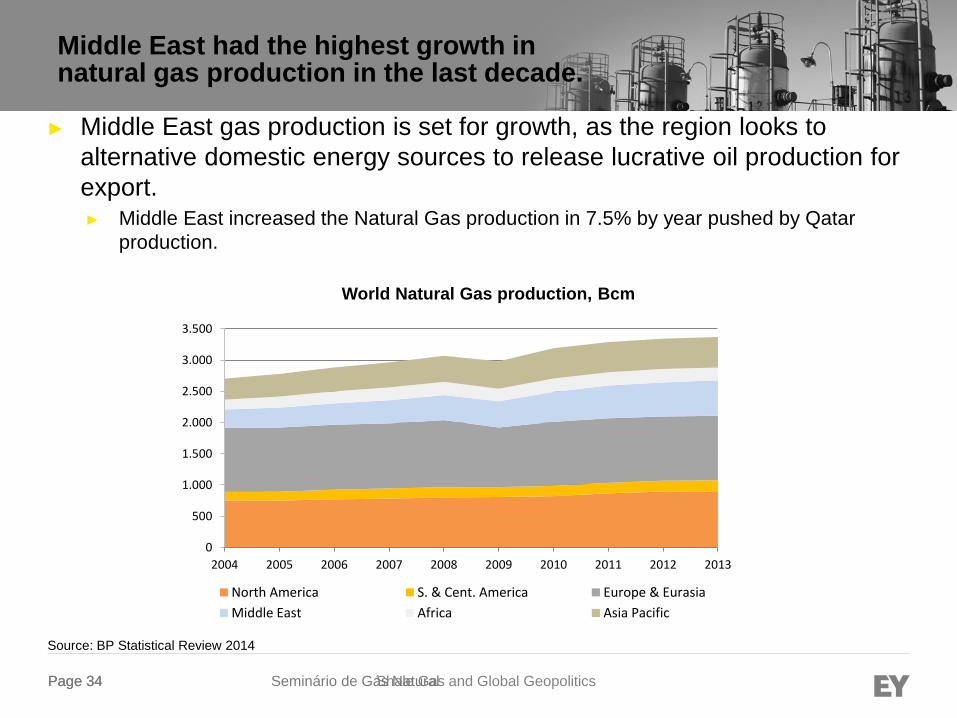
Middle East had the highest growth in natural gas production in the last decade.
► Middle East gas production is set for growth, as the region looks to
alternative domestic energy sources to release lucrative oil production for
export. ► Middle East increased the Natural Gas production in 7.5% by year pushed by Qatar
production.
Source: BP Statistical Review 2014
0
500
1.000
1.500
2.000
2.500
3.000
3.500
2004 2005 2006 2007 2008 2009 2010 2011 2012 2013
North America S. & Cent. America Europe & Eurasia
Middle East Africa Asia Pacific
World Natural Gas production, Bcm
Page 35 Shale Gas and Global Geopolitics
Page 35 Seminário de Gás Natural
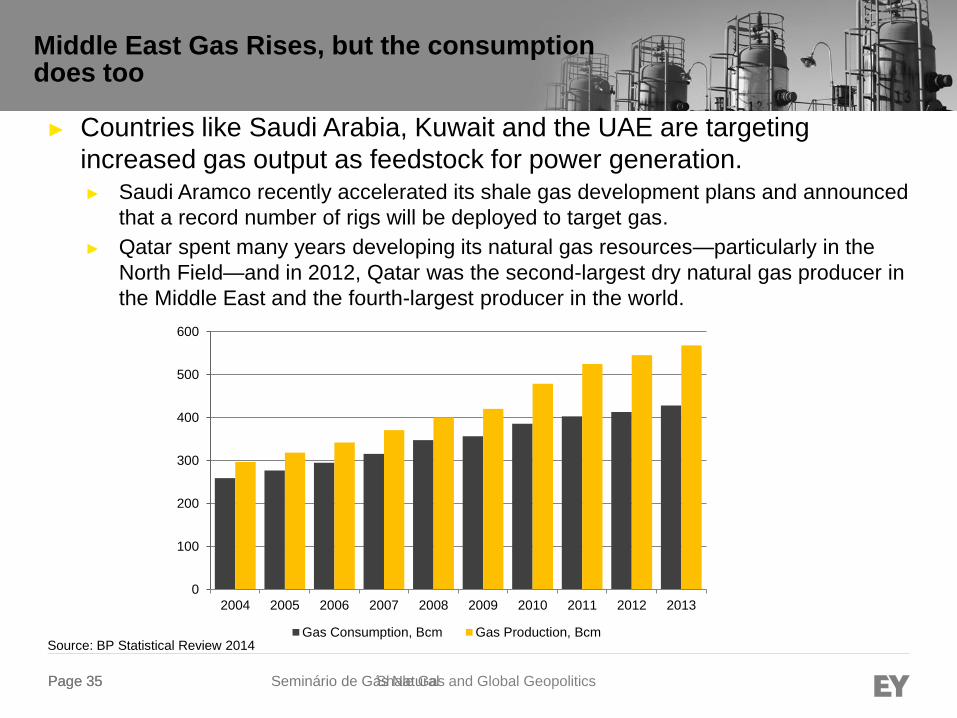
Middle East Gas Rises, but the consumption does too
► Countries like Saudi Arabia, Kuwait and the UAE are targeting
increased gas output as feedstock for power generation. ► Saudi Aramco recently accelerated its shale gas development plans and announced
that a record number of rigs will be deployed to target gas.
► Qatar spent many years developing its natural gas resources—particularly in the
North Field—and in 2012, Qatar was the second-largest dry natural gas producer in
the Middle East and the fourth-largest producer in the world.
0
100
200
300
400
500
600
2004 2005 2006 2007 2008 2009 2010 2011 2012 2013
Gas Consumption, Bcm Gas Production, BcmSource: BP Statistical Review 2014
Page 36 Shale Gas and Global Geopolitics
Page 36 Seminário de Gás Natural
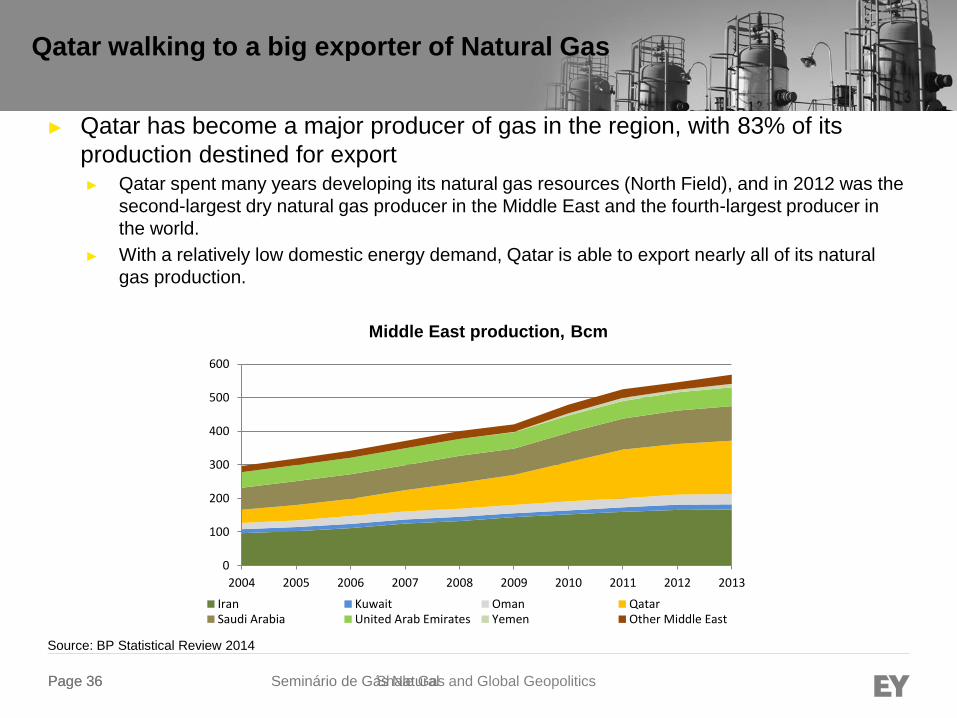
Qatar walking to a big exporter of Natural Gas
► Qatar has become a major producer of gas in the region, with 83% of its
production destined for export ► Qatar spent many years developing its natural gas resources (North Field), and in 2012 was the
second-largest dry natural gas producer in the Middle East and the fourth-largest producer in
the world.
► With a relatively low domestic energy demand, Qatar is able to export nearly all of its natural
gas production.
Source: BP Statistical Review 2014
0
100
200
300
400
500
600
2004 2005 2006 2007 2008 2009 2010 2011 2012 2013
Iran Kuwait Oman QatarSaudi Arabia United Arab Emirates Yemen Other Middle East
Middle East production, Bcm
Page 37 Shale Gas and Global Geopolitics
Page 37 Seminário de Gás Natural
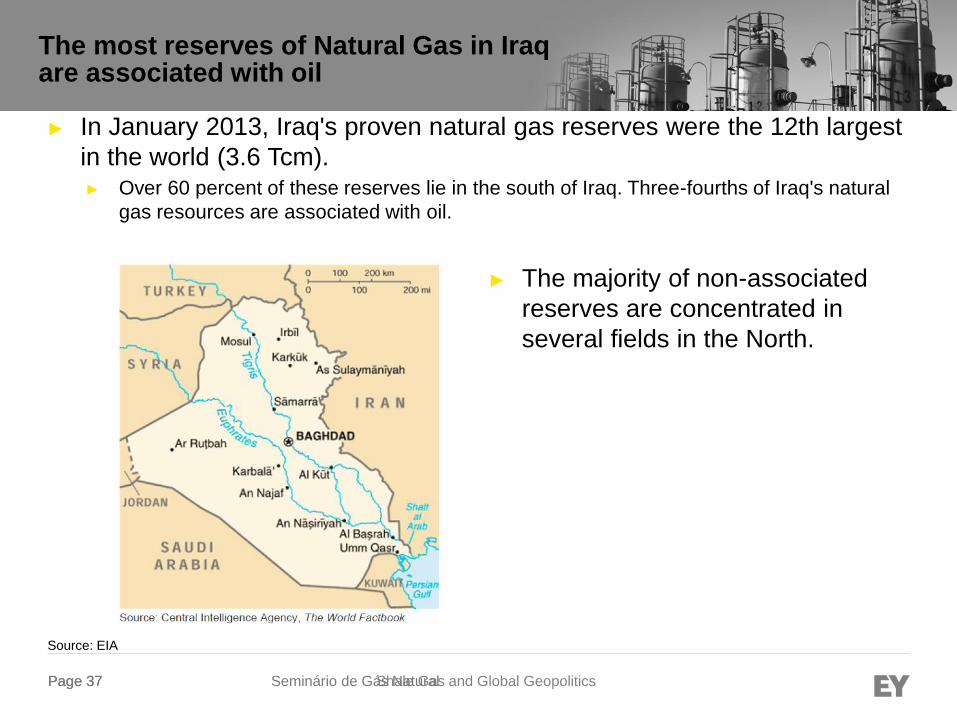
The most reserves of Natural Gas in Iraq are associated with oil
► In January 2013, Iraq's proven natural gas reserves were the 12th largest
in the world (3.6 Tcm). ► Over 60 percent of these reserves lie in the south of Iraq. Three-fourths of Iraq's natural
gas resources are associated with oil.
Source: EIA
► The majority of non-associated
reserves are concentrated in
several fields in the North.
Page 38 Shale Gas and Global Geopolitics
Page 38 Seminário de Gás Natural
The majority of Iraqi natural gas production is flared ► Some of the natural gas is used as fuel for power generation, while a
portion of it is re-injected to enhance oil recovery.
► However, the majority of Iraqi natural gas production is flared. Flaring
losses in some months have exceeded 60 percent of production, due to a
lack of sufficient pipelines and other infrastructure to transport it for
consumption and export. As a result, Iraq's five natural gas processing
plants, which can process over 21.6 Bcm per year, sit mostly idle.
► Iraq is taking steps to reduce flaring and to use its natural gas resources
in power generation and for re-injection to increase oil recovery. ► To reduce flaring, Iraq signed an agreement with Royal Dutch Shell to create a new joint
venture, Basrah Gas Company, to capture flared gas in Basrah Province.
► The 25-year project costing $17 billion has a planned production capacity of up to 56
Mcm per day. Under the agreement, processed gas would go to the state-owned South
Gas company for domestic use. Any gas not bought for use by Iraqi power plants could
be exported as LNG.
Source: EIA
Page 39 Shale Gas and Global Geopolitics
Page 39 Seminário de Gás Natural
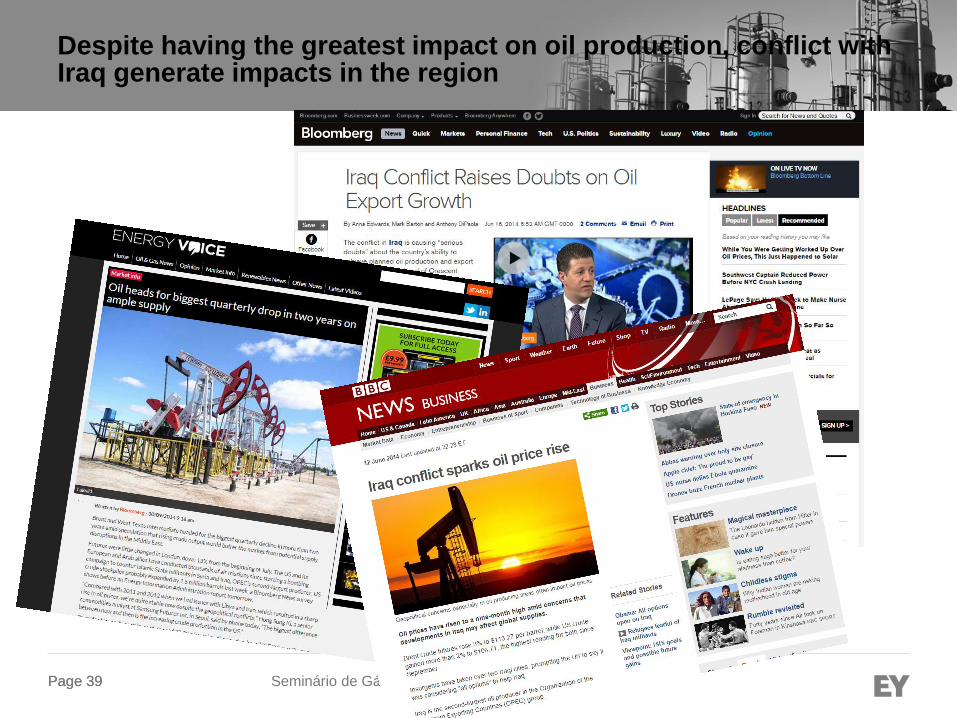
Despite having the greatest impact on oil production, conflict with Iraq generate impacts in the region

Page 40 Shale Gas and Global Geopolitics
Page 40 Seminário de Gás Natural
THANK YOU!!
Page 41
Backup Slides
Optimize
Protect Grow
Innovate
Page 42
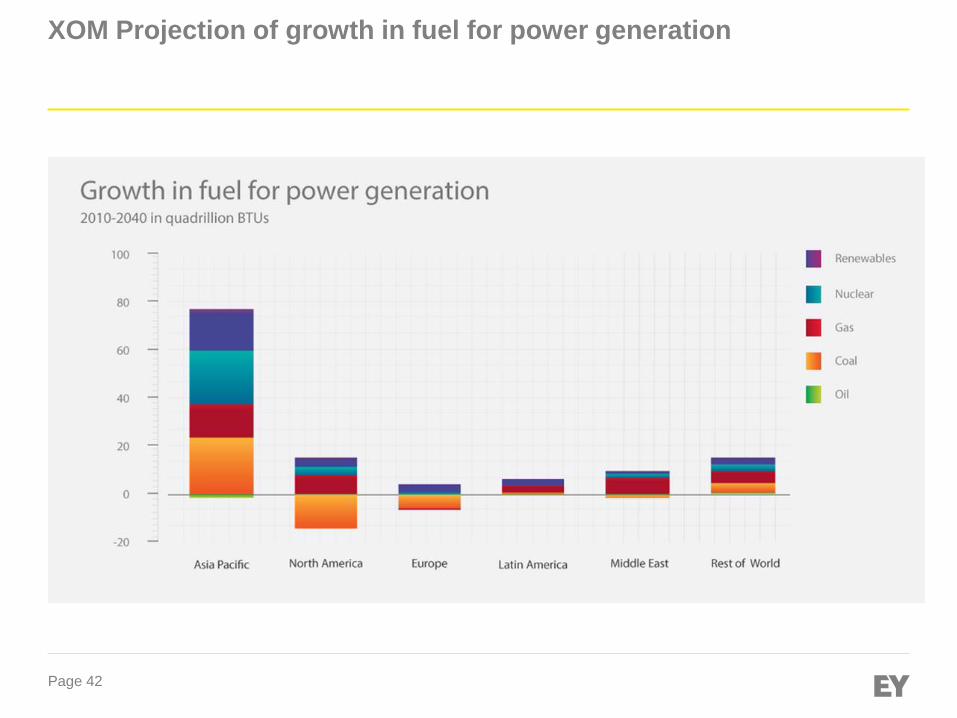
XOM Projection of growth in fuel for power generation
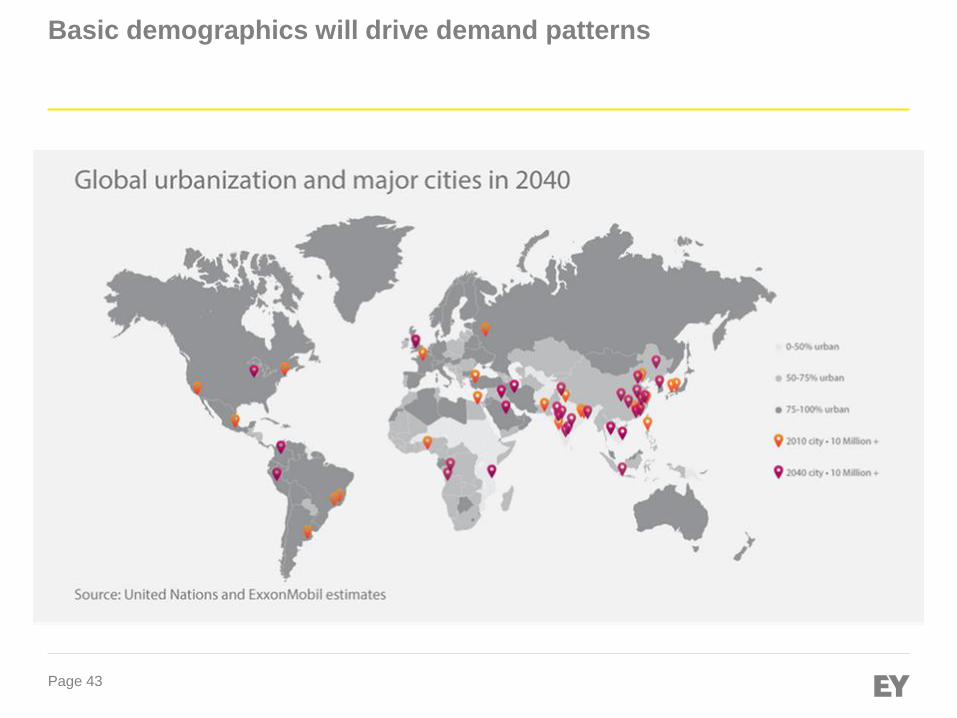
Page 43
Basic demographics will drive demand patterns
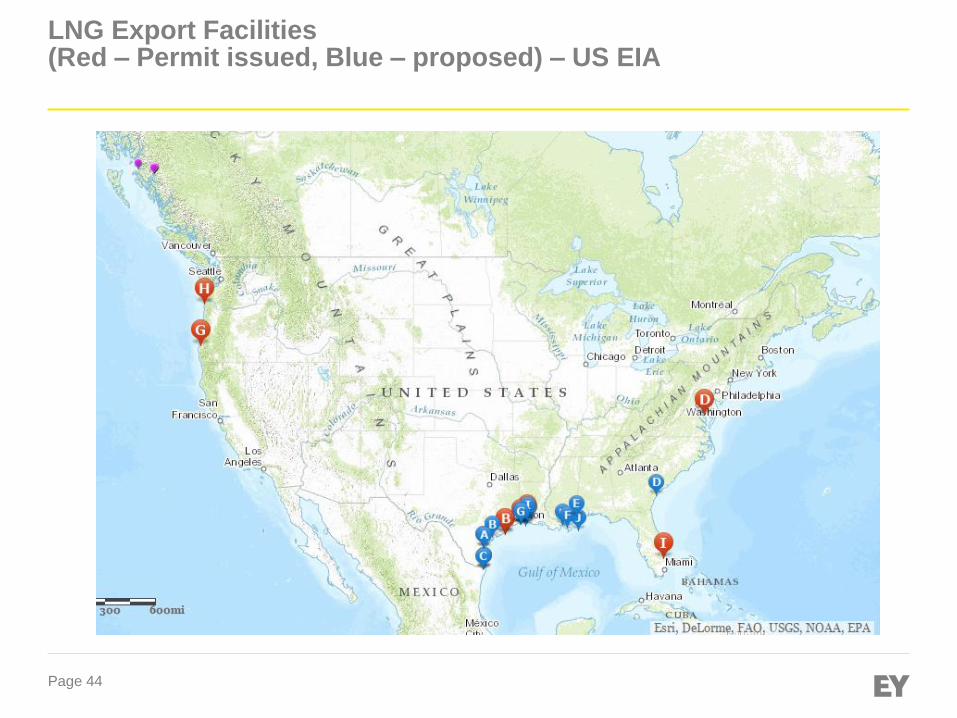
Page 44
LNG Export Facilities (Red – Permit issued, Blue – proposed) – US EIA
Page 45
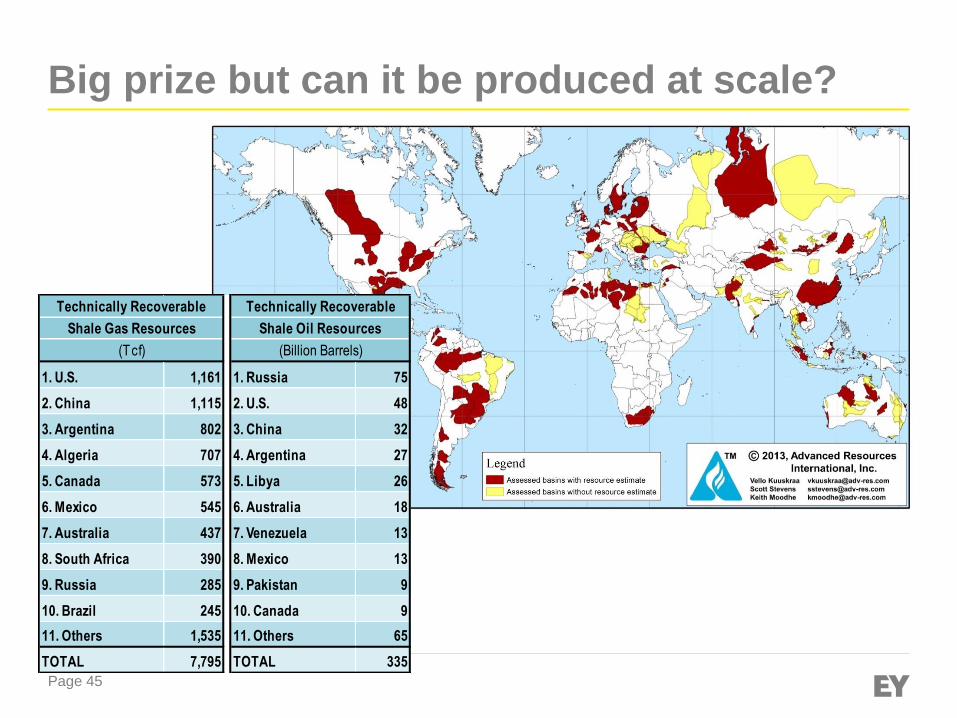
Big prize but can it be produced at scale?
1. U.S. 1,161 1. Russia 75
2. China 1,115 2. U.S. 48
3. Argentina 802 3. China 32
4. Algeria 707 4. Argentina 27
5. Canada 573 5. Libya 26
6. Mexico 545 6. Australia 18
7. Australia 437 7. Venezuela 13
8. South Africa 390 8. Mexico 13
9. Russia 285 9. Pakistan 9
10. Brazil 245 10. Canada 9
11. Others 1,535 11. Others 65
TOTAL 7,795 TOTAL 335
Shale Gas Resources
(Tcf) (Billion Barrels)
Technically Recoverable Technically Recoverable
Shale Oil Resources
Page 46
EY | Assurance | Tax | Transactions | Advisory
About EY
EY is a global leader in assurance, tax, transaction and
advisory services. The insights and quality services we
deliver help build trust and confidence in the capital
markets and in economies the world over. We develop
outstanding leaders who team to deliver on our
promises to all of our stakeholders. In so doing, we play
a critical role in building a better working world for our
people, for our clients and for our communities.
EY refers to the global organization, and may refer to
one or more, of the member firms of Ernst & Young
Global Limited, each of which is a separate legal entity.
Ernst & Young Global Limited, a UK company limited by
guarantee, does not provide services to clients. For more
information about our organization, please visit ey.com.
Ernst & Young LLP is a client-serving member firm of
Ernst & Young Global Limited operating in the US.
© 2014 Ernst & Young LLP.
All Rights Reserved.
1403-1224792
ED None
This material has been prepared for general informational purposes
only and is not intended to be relied upon as accounting, tax, or other
professional advice. Please refer to your advisors for specific advice.
ey.com