Embed Size (px)
Citation preview

Eroding Australia: rates and processes from Bega Valley
to Arnhem Land
ARJUN M. HEIMSATH1*, JOHN CHAPPELL2 & KEITH FIFIELD3
1School of Earth and Space Exploration, Arizona State University, Tempe, AZ 85287, USA2Research School of Earth Sciences, Australian National University, Canberra,
ACT 0200, Australia3Research School of Physical Sciences and Engineering, Australian National University,
Canberra, ACT 0200, Australia
*Corresponding author (e-mail: [email protected])
Abstract: We report erosion rates determined from in situ produced cosmogenic 10Be across aspectrum of Australian climatic zones, from the soil-mantled SE Australian escarpment throughsemi-arid bedrock ranges of southern and central Australia, to soil-mantled ridges at a monsoonaltropical site near the Arnhem escarpment. Climate has a major effect on the balance betweenerosion and transport and also on erosion rate: the highest rates, averaging 35 m Ma21, werefrom soil-mantled, transport-limited spurs in the humid temperate region around the base of theSE escarpment; the lowest, averaging about 1.5 m Ma21, were from the steep, weathering-limited, rocky slopes of Kings Canyon and Mt Sonder in semi-arid central Australia. Betweenthese extremes, other factors come into play including rock-type, slope, and recruitment ofvegetation. We measured intermediate average erosion rates from rocky slopes in the semi-aridFlinders and MacDonnell ranges, and from soil-mantled sites at both semi-arid Tyler Pass incentral Australia and the tropical monsoonal site. At soil-mantled sites in both the SE and tropicalnorth, soil production generally declines exponentially with increasing soil thickness, although atthe tropical site this relationship does not persist under thin soil thicknesses and the relationshiphere is ‘humped’. Results from Tyler Pass show uniform soil thicknesses and soil productionrates of about 6.5 m Ma21, supporting a longstanding hypothesis that equilibrium, soil-mantledhillslopes erode in concert with stream incision and form convex-up spurs of constant curvature.Moreover, weathering-limited slopes and spurs also occur in the same region: the averageerosion rate for rocky sandstone spurs at Glen Helen is 7 m Ma21, similar to the Tyler Passsoil-mantled slopes, whereas the average rate for high, quartzite spurs at Mount Sonder is1.8 m Ma21. The extremely low rates measured across bedrock-dominated landscapes suggestthat the ridge–valley topography observed today is likely to have been shaped as long ago asthe Late Miocene. These rates and processes quantified across different, undisturbed landscapesprovide critical data for landscape evolution models.
It is widely held that different climatic regions arecharacterized by different geomorphological pro-cesses and landforms. Being a tectonically quietcontinent, Australia might be expected to express,almost purely, the effect of climate on landscapeevolution, modulated only by lithology and ancientstructures. From the temperate eastern highlandsthrough the monsoonal north to the arid centre, thecontinent presents a broad suite of climatic zonesand associated landforms, ranging from soil-mantled ranges to stony mesas and inselbergs.However, the climate of Australia changed greatlyduring its northward drift over the last few tens ofmillions of years (e.g. see Fujioka & Chappell2010), and whether the landforms seen today wereformed under climates like those of today dependson their rates of geomorphological change, governed
by the erosional processes acting upon them. Erosionrates determined from in situ cosmogenic nuclides atsome sites in Australia are very low (c. 1 m Ma21),such as from residual hills in the semi-arid zone(Bierman & Caffee 2002). If such rates were wide-spread, landscapes with local relief of tens to hun-dreds of metres would be unlikely to have evolvedunder climates similar to those of today.
We explore relationships between erosion rateand geomorphological form using cosmogenicnuclide measurements of erosion rates in undis-turbed hilly landscapes with local relief rangingto several hundred metres, in several climatic pro-vinces across Australia, including the temperateSE, the monsoonal tropics and the semi-arid centre.We determined erosion rates using cosmogenic10Be and 26Al in samples collected across spurs
From: Bishop, P. & Pillans, B. (eds) Australian Landscapes. Geological Society, London, Special Publications,346, 225–241. DOI: 10.1144/SP346.12 0305-8719/10/$15.00 # The Geological Society of London 2010.
and slopes, as well as average erosion rates fromsamples of stream and river sediments.
Concepts and methods
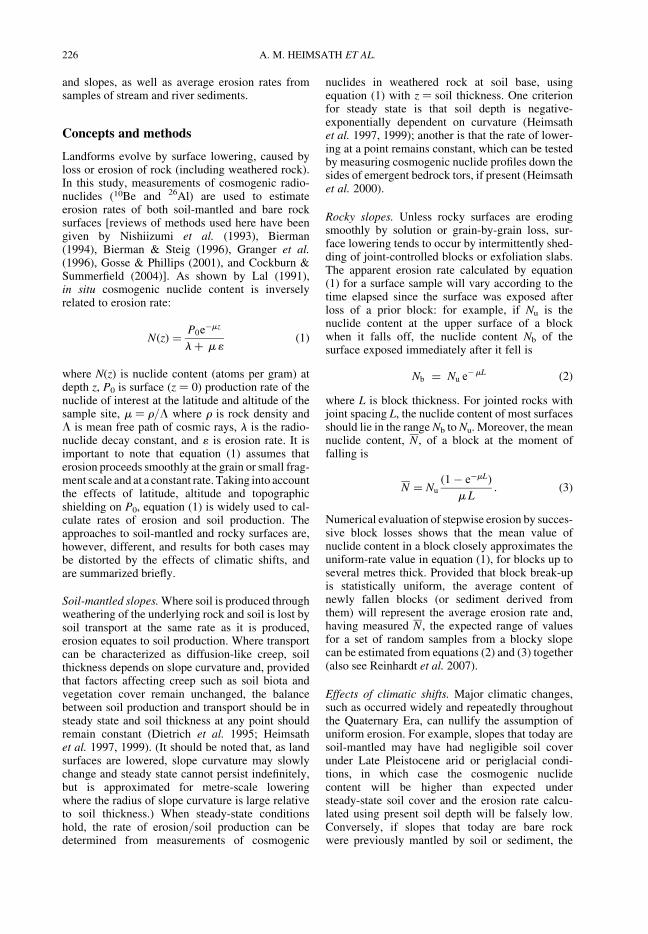
Landforms evolve by surface lowering, caused byloss or erosion of rock (including weathered rock).In this study, measurements of cosmogenic radio-nuclides (10Be and 26Al) are used to estimateerosion rates of both soil-mantled and bare rocksurfaces [reviews of methods used here have beengiven by Nishiizumi et al. (1993), Bierman(1994), Bierman & Steig (1996), Granger et al.(1996), Gosse & Phillips (2001), and Cockburn &Summerfield (2004)]. As shown by Lal (1991),in situ cosmogenic nuclide content is inverselyrelated to erosion rate:
N(z) ¼P0e�mz
lþ m1(1)
where N(z) is nuclide content (atoms per gram) atdepth z, P0 is surface (z ¼ 0) production rate of thenuclide of interest at the latitude and altitude of thesample site, m ¼ r/L where r is rock density andL is mean free path of cosmic rays, l is the radio-nuclide decay constant, and 1 is erosion rate. It isimportant to note that equation (1) assumes thaterosion proceeds smoothly at the grain or small frag-ment scale and at a constant rate. Taking into accountthe effects of latitude, altitude and topographicshielding on P0, equation (1) is widely used to cal-culate rates of erosion and soil production. Theapproaches to soil-mantled and rocky surfaces are,however, different, and results for both cases maybe distorted by the effects of climatic shifts, andare summarized briefly.
Soil-mantled slopes. Where soil is produced throughweathering of the underlying rock and soil is lost bysoil transport at the same rate as it is produced,erosion equates to soil production. Where transportcan be characterized as diffusion-like creep, soilthickness depends on slope curvature and, providedthat factors affecting creep such as soil biota andvegetation cover remain unchanged, the balancebetween soil production and transport should be insteady state and soil thickness at any point shouldremain constant (Dietrich et al. 1995; Heimsathet al. 1997, 1999). (It should be noted that, as landsurfaces are lowered, slope curvature may slowlychange and steady state cannot persist indefinitely,but is approximated for metre-scale loweringwhere the radius of slope curvature is large relativeto soil thickness.) When steady-state conditionshold, the rate of erosion/soil production can bedetermined from measurements of cosmogenic
nuclides in weathered rock at soil base, usingequation (1) with z ¼ soil thickness. One criterionfor steady state is that soil depth is negative-exponentially dependent on curvature (Heimsathet al. 1997, 1999); another is that the rate of lower-ing at a point remains constant, which can be testedby measuring cosmogenic nuclide profiles down thesides of emergent bedrock tors, if present (Heimsathet al. 2000).
Rocky slopes. Unless rocky surfaces are erodingsmoothly by solution or grain-by-grain loss, sur-face lowering tends to occur by intermittently shed-ding of joint-controlled blocks or exfoliation slabs.The apparent erosion rate calculated by equation(1) for a surface sample will vary according to thetime elapsed since the surface was exposed afterloss of a prior block: for example, if Nu is thenuclide content at the upper surface of a blockwhen it falls off, the nuclide content Nb of thesurface exposed immediately after it fell is
Nb ¼ Nu e�mL (2)
where L is block thickness. For jointed rocks withjoint spacing L, the nuclide content of most surfacesshould lie in the range Nb to Nu. Moreover, the meannuclide content, N, of a block at the moment offalling is
N ¼ Nu
(1� e�mL)
mL: (3)
Numerical evaluation of stepwise erosion by succes-sive block losses shows that the mean value ofnuclide content in a block closely approximates theuniform-rate value in equation (1), for blocks up toseveral metres thick. Provided that block break-upis statistically uniform, the average content ofnewly fallen blocks (or sediment derived fromthem) will represent the average erosion rate and,having measured N, the expected range of valuesfor a set of random samples from a blocky slopecan be estimated from equations (2) and (3) together(also see Reinhardt et al. 2007).
Effects of climatic shifts. Major climatic changes,such as occurred widely and repeatedly throughoutthe Quaternary Era, can nullify the assumption ofuniform erosion. For example, slopes that today aresoil-mantled may have had negligible soil coverunder Late Pleistocene arid or periglacial condi-tions, in which case the cosmogenic nuclidecontent will be higher than expected understeady-state soil cover and the erosion rate calcu-lated using present soil depth will be falsely low.Conversely, if slopes that today are bare rockwere previously mantled by soil or sediment, the
A. M. HEIMSATH ET AL.226

erosion rate calculated for a bare surface will be toohigh. In short, where these scenarios are likely,apparent erosion rates for soil-mantled slopesshould be taken as minimum estimates, and thosefor bare rocky surfaces as maximum estimates.
Field samples. We collected three types of samplefor evaluating erosion rates: rock samples a fewcentimetres thick from exposed bedrock surfaces;saprolite from immediately beneath soil base in soil-mantled landforms; and sediment samples fromboth low-order channels and slope-foot colluvium.Only quartz-bearing rocks were sampled, fromwhich purified quartz was prepared for measure-ments of 10Be and 26Al, following standard methods.Unless otherwise stated, cosmogenic nuclides weremeasured with the ANU 14UD Pelletron acceleratoras described by Fifield (1999). 9Be carrier blanksgave 10Be ,3 � 10215 atoms g21, ,0.1% of theconcentrations in our field samples. Separate ali-quots of purified quartz from the same specimenshowed good reproducibility (Table 1, sampleP199), and field reproducibility also was good:samples taken 1.5 m apart at a waterfall crest gavestatistically equivalent results (Table 1, Br299Uand Br299L), as did two samples taken 7 m apartat a low granite dome, eroding by centimetre-scaleexfoliation (MD1 and MD3). Field sampling pat-terns varied with site, and are outlined in sitedescriptions, below.
Field sites
We sampled moderate to steep ranges in differentAustralian climatic zones, including the humidsoutheastern escarpment and highlands, the semi-arid Flinders Ranges in southern Australia andMacDonnell Ranges in central Australia, togetherwith the Arnhem escarpment in the tropical mon-soonal north. Those in the SE and Arnhem Land
have previously been described in detail whereasresults from the remainder are reported here forthe first time, some of which will be the subjectof later, more detailed papers. No major post-Palaeozoic orogenic movements have occurred inany of these regions, although the SE is subject toslow isostatic uplift (Lambeck & Stephenson1985; Persano et al. 2002, 2005) together with lateCretaceous uplift associated with Tasman Searifting (Hayes & Ringis 1973). Evidence for lateCenozoic thrusting and uplift has been reportedfrom the Flinders Ranges (Quigley et al. 2007a,b). However, the time and depth scales recordedby cosmogenic nuclide concentrations are smallcompared with long-term landscape evolution ofthe Australian interior, which is more fruitfullyaddressed by thermochronological and palaeomag-netic methods [Stewart et al. 1986; Belton et al.2004; Pillans 2007; and see reviews by Kohn et al.(2002) and Vasconcelos et al. (2008)].
Our field sites fall into two broad groups: soil-mantled, transport-limited slopes, which wereexamined across all climatic zones, and bedrock-dominated, weathering-limited slopes, which weresampled only in the semi-arid ranges.
Soil-mantled sites
Southeastern Australia: Bega–Bredbo region. Wesummarize here results reported previously indetailed studies at two soil-mantled sites in SENSW, one from spurs beside Nunnock River (NR)at the base of the passive-margin escarpment,inland from the town of Bega (Heimsath et al.2000) and the other from Frogs Hollow (FH) ontablelands above the escarpment, c. 900 m abovesea level (asl) (Heimsath et al. 2001a). Twofurther sites near NR have since been studied (seeFig. 1): one lies in lowlands c. 25 km SE of NR,200 m asl (‘Snug’ site), and the other is a spur onthe escarpment above NR that rises to the crest at
Table 1. Repeatability tests
Sample Material Prod.rate
Exp.factor
10Be(106 atoms g21)
E(m Ma21)
(a) Same sample, different aliquots of quartzP199 Hard sandstone slope 6.89 0.95 0.22 + 0.02 16.35 + 1.46P199 (repeat) 6.89 0.95 0.21 + 0.02 17.06 + 1.68
(b) Paired samples from same field siteBr229U Quartzite knickpoint 6.22 0.8 0.24 + 0.03 11.17 + 1.44Br299L Quartzite knickpoint 6.22 0.8 0.19 + 0.02 14.07 + 1.51MD1 Exfoliating granite 7 1 1.56 + 0.15 2.21 + 0.24MD3 Exfoliating granite 7 1 1.69 + 0.14 2.01 + 0.18
All errors propagated to erosion rate, E. Production factor scales nuclide prodution for slope, soil cover, elevation and latitude. Exp. factoris the correction factor applied for local exposure.
ERODING AUSTRALIA 227
Brown Mountain (BM site). Cosmogenic nuclidedeterminations from all four sites together with anaccount of landscape evolution have been reviewedby Heimsath et al. (2006). Chemical weatheringacross the escarpment has been examined byBurke et al. (2009), whereas Braun et al. (2001),
Heimsath et al. (2002, 2005) and Kaste et al. (2007)examined the physical mixing processes at NR.
In summary, the physiography of these sites isas follows. The NR site comprises convex spurs atNunnock River, a bedrock channel that risesc. 1000 m above sea level in the tablelands and
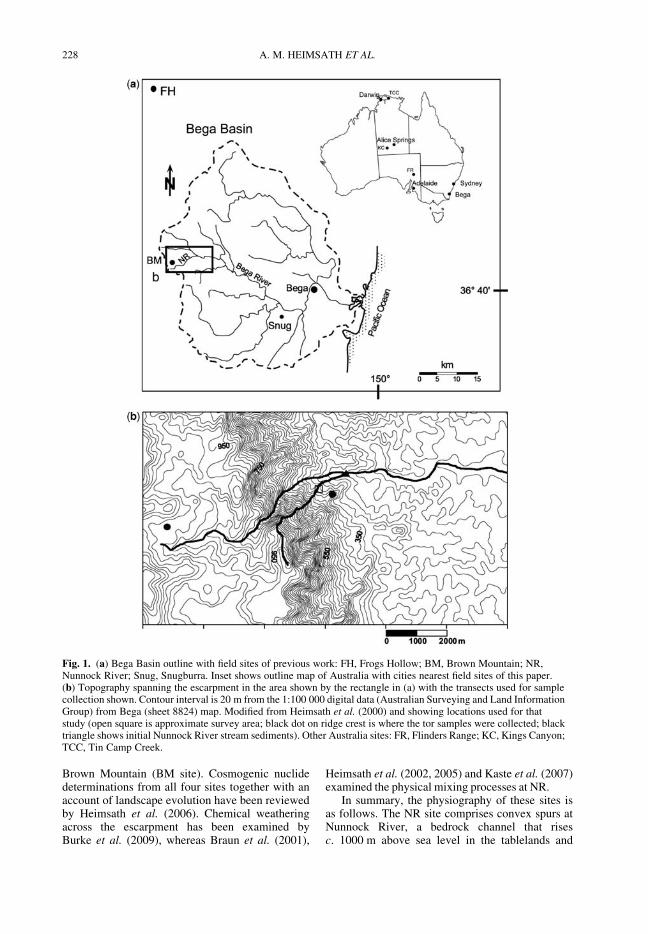
Fig. 1. (a) Bega Basin outline with field sites of previous work: FH, Frogs Hollow; BM, Brown Mountain; NR,Nunnock River; Snug, Snugburra. Inset shows outline map of Australia with cities nearest field sites of this paper.(b) Topography spanning the escarpment in the area shown by the rectangle in (a) with the transects used for samplecollection shown. Contour interval is 20 m from the 1:100 000 digital data (Australian Surveying and Land InformationGroup) from Bega (sheet 8824) map. Modified from Heimsath et al. (2000) and showing locations used for thatstudy (open square is approximate survey area; black dot on ridge crest is where the tor samples were collected; blacktriangle shows initial Nunnock River stream sediments). Other Australia sites: FR, Flinders Range; KC, Kings Canyon;TCC, Tin Camp Creek.
A. M. HEIMSATH ET AL.228
steeply descends the escarpment (Fig. 1a and b). Theconvex spurs are soil mantled and steepen down-slope to intervening channels, which pass throughvery coarse, consolidated debris-flow deposits. Bed-rock cliffs are prominent near the escarpment top,although they are less dramatic than those to thenorth in the New England Fold Belt described byWeissel & Seidl (1997, 1998), and are eroding byblock failure on the escarpment face and by thinexfoliation and sheet erosion on top. Little sedimenthas accumulated beneath the cliffs and it appears thatthe upper region of the escarpment is weatheringlimited. From the escarpment base to the coast, thelandscape is dominated by rolling hills of LateSilurian–Early Devonian granodiorite. Inland, table-land and ranges, dominated by Ordovician–Silurianmetasediments and Devonian granites with exten-sive Tertiary basalt flows (Richardson 1976), liec. 800–1500 m asl and typically have relativelygentle, soil-mantled slopes (,258), punctuated byfrequent tors. Rainfall at the coastal lowlands site(Snug: 200 m asl, c. 900 mm a21) and at escarpmentbase (NR: c. 400 m; c. 1200 mm a21), is higher thanon the highlands (FH: c. 900 m; c. 700 mm a21), andis distributed throughout the year (Richardson 1976;Australian Bureau of Meteorology: www.bom.gov.au/climate/averages). We refer to these areas ashumid, temperate lowlands (NR and Snug) and coolhighlands (FH and Brown Mt).
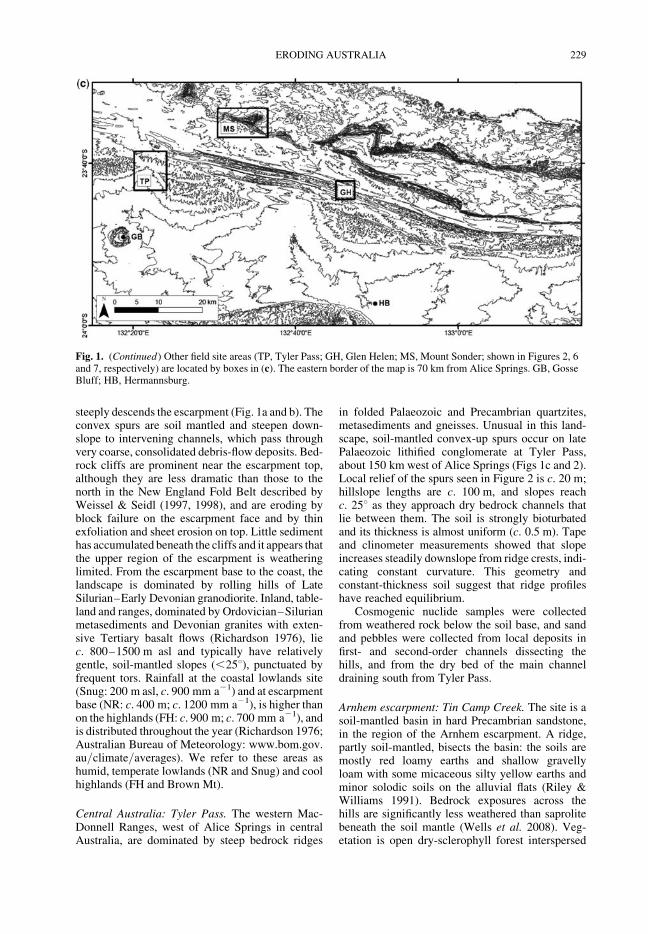
Central Australia: Tyler Pass. The western Mac-Donnell Ranges, west of Alice Springs in centralAustralia, are dominated by steep bedrock ridges
in folded Palaeozoic and Precambrian quartzites,metasediments and gneisses. Unusual in this land-scape, soil-mantled convex-up spurs occur on latePalaeozoic lithified conglomerate at Tyler Pass,about 150 km west of Alice Springs (Figs 1c and 2).Local relief of the spurs seen in Figure 2 is c. 20 m;hillslope lengths are c. 100 m, and slopes reachc. 258 as they approach dry bedrock channels thatlie between them. The soil is strongly bioturbatedand its thickness is almost uniform (c. 0.5 m). Tapeand clinometer measurements showed that slopeincreases steadily downslope from ridge crests, indi-cating constant curvature. This geometry andconstant-thickness soil suggest that ridge profileshave reached equilibrium.
Cosmogenic nuclide samples were collectedfrom weathered rock below the soil base, and sandand pebbles were collected from local deposits infirst- and second-order channels dissecting thehills, and from the dry bed of the main channeldraining south from Tyler Pass.
Arnhem escarpment: Tin Camp Creek. The site is asoil-mantled basin in hard Precambrian sandstone,in the region of the Arnhem escarpment. A ridge,partly soil-mantled, bisects the basin: the soils aremostly red loamy earths and shallow gravellyloam with some micaceous silty yellow earths andminor solodic soils on the alluvial flats (Riley &Williams 1991). Bedrock exposures across thehills are significantly less weathered than saprolitebeneath the soil mantle (Wells et al. 2008). Veg-etation is open dry-sclerophyll forest interspersed
Fig. 1. (Continued) Other field site areas (TP, Tyler Pass; GH, Glen Helen; MS, Mount Sonder; shown in Figures 2, 6and 7, respectively) are located by boxes in (c). The eastern border of the map is 70 km from Alice Springs. GB, GosseBluff; HB, Hermannsburg.
ERODING AUSTRALIA 229

with seasonal tall grassland; tree-throw and burrow-ing animals contribute to soil transport, and feralwater-buffalo and pigs have caused local erosion(Riley & Williams 1991; Hancock et al. 2000;Townsend & Douglas 2000; Saynor et al. 2004,2009; Staben & Evans 2008). Rainfall isc. 1400 mm a21, falling almost entirely betweenOctober and April, typically in short, high-intensitystorms. The climate is classed as monsoon–tropical.
Tin Camp Creek is undisturbed by colonialland use and, as it closely resembles the terrane atEnergy Resources Australia Ranger uranium Mine(ERARM), where geomorphological processes andrates are of high interest, is a site of intensivestudy. Fieldwork was carried out by A.H. in col-laboration with G. Hancock of the Office of theSupervising Scientist, Jabiru, and D. Fink of theAustralian Nuclear Science and Technology Organ-isation (Heimsath et al. 2009). Our sampling tra-versed the central ridge, with samples of bothexposed and unweathered bedrock as well as weath-ered rock from below a range of soil depths, togetherwith catchment sediment samples, to assess thespatial variability of erosion rates across a landscapethat is used as a reference site by the uranium miningindustry (Hancock & Evans 2006; Hancock et al.2008a, b; Fig. 3).
Bedrock-dominated landscapes
Flinders Ranges. The Flinders Ranges in SouthAustralia, flanked by the great salt playas of lakesFrome, Eyre and Torrens, are dominated by LateProterozoic rocks, moderately to steeply dipping,
from very hard quartzites through sandstones andlimestones to comparatively friable quartzose mud-stones. The Ranges rise to over 600 m and are struc-turally controlled, varying from high quartziteridges to rounded hills and cuestas in cyclic sand-stone–shale–limestone sequences. Seismic activityand evidence of late Cenozoic thrusting suggestcontinuing tectonic uplift (Quigley et al. 2007a, b),although the rate has yet to be determined andprobably is slow. Regional climate is semi-arid,with mean annual precipitation ranging from250 mm a21 at Port Augusta to over 400 mm a21 inthe Ranges.
Our study area centres on Brachina and Para-chilna Creeks, bedrock channels that flow westwardfrom the diapiric core of the Ranges through cuestasand rounded ridges of cyclic sandstone and mud-stone, and then pass through deep, steep-sidedgorges cut in hard sandstone and quartzite. Slopeerosion is dominated by shedding of joint-controlledblocks. There is no continuous detrital cover, andthe slopes are weathering-limited. Rock surfacesare reddened by iron oxides, suggesting relativelyslow slope retreat, and falling blocks tend to disinte-grate during their downslope passage. West of thegorge, the wide, boulder-strewn channels formfans and dwindle as they head towards playa-lakeTorrens.
We collected samples around the gorges of Bra-china and Parachilna Creeks (Fig. 4), from steep toprecipitous slopes in jointed quartzite (Brachinagorge) and sandstone (both gorges), to determineerosion rates of weathering-limited slopes and alsoto assess the variation of cosmogenic nuclides in
Fig. 2. (a) Tyler Pass field area. Contours and ephemeral streams extracted from Australian Surveying and LandInformation Group (AUSLIG) draft map, 5350: Gosse Bluff. Elevation at pass is 815 m; 20 m contour intervals. MDsample numbers label approximate sample locations. MD-119 is at 23841.7950S, 132821.2460E. (b) Photograph of thesoil-mantled hills of Tyler Pass.
A. M. HEIMSATH ET AL.230

point samples from joint-controlled rocky slopes.We also sampled quartzite gravel and bedrockknickpoints in low-order channels.
Central Australia: Kings Canyon. Carved in gentlydipping Late Palaeozoic sandstone (Bagas 1988),the bedrock-dominated inner drainage basins inKings Canyon National Park include regularlyspaced, convex-up bedrock ridges with relativelysteep slopes (Fig. 5) that are remarkably similar inform to steep, soil-mantled landscapes of coastalOregon (Heimsath et al. 2001b; Roering et al.2001), despite the fact that Kings Canyon lies inarid, tropical central Australia and receives onlyc. 260 mm a21 of rainfall.
The regularly spaced convex ridges pose ageomorphological puzzle. Evolution of convexridges under a soil mantle is expected with diffusivesoil creep and depth-dependent soil production(Heimsath et al. 1997, 2000), but it is unclear howthese forms could develop in weathering-limitedbedrock landscapes, eroding by processes actingon steep rectilinear and concave slopes of theFlinders Ranges. Conjecturing that the convexridges may have formed under a soil mantleduring wetter climate in the past, we hypothesize
that present-day erosion rates are inconsistent withevolution of the observed topography, and collectedsamples downslope as shown in Figure 5.
Central Australia: Mt Sonder and westernMacDonnell Ranges. The MacDonnell Ranges aredominated by steep, structurally controlled bedrockranges: quartzites form high, precipitous rectilinearslopes, whereas sandstone and other rocks tend to bedissected in parallel, convex-up rounded spurssimilar to those of Kings Canyon. The climate issemi-arid, similar to that of Kings Canyon, withc. 2–300 mm a21 highly variable rainfall. Spinifex(Triodea) and other grasses together with intermit-tent acacia and eucalyptus shrubs and trees mantlethe stony landscape. In addition to Tyler Pass,described above, we selected two other field sitesto assess the effect of lithology on erosion rates:one at Glen Helen in Hermannsburg Sandstone(Figs 1c and 6) and the other on Mt Sonder inHeavitree Quartzite (Figs 1c and 7). Both arebedrock-dominated; erosion processes are similarto those in the Flinders Ranges, outlined above, andboth are characterized by rounded bedrock ridgeswith no soil mantle. Despite the clear differencesin rock hardness, the two sites are morphologically
Fig. 3. Contour map and sample locations for Tin Camp Creek (TCC) field area of Heimsath et al. (2009). Topographyextracted from regional digital elevation model (e.g. Hancock & Evans 2006); 10 m contour intervals. Samplelocations shown with black dots and (TC) number of Heimsath et al. (2009). Samples 22 and 23 mark the maindrainage of TCC.
ERODING AUSTRALIA 231

similar, with maximum spur-crest slopes of c. 358.Local relief is c. 200 m at the Glen Helen site(Fig. 6) and ranges from 250 m to .500 m atMt Sonder (Fig. 7).
Results
Soil-mantled landscapes
Rates of soil production. Soil production and trans-port are considered to be in steady state at the NRand Snug sites in humid southeastern Australia. Intheir intensive study at the NR site, Heimsathet al. (2000) showed that soil thickness isnegative-exponentially dependent on slope curva-ture, and we have confirmed a similar relationshipat Snug. Moreover, cosmogenic nuclide concen-trations in granite tors at NR reveal uniform-ratelowering of the surrounding soil (Heimsath et al.2000). Cosmogenic measurements from beneathsoil base robustly define an exponential decline of
the soil production with increasing soil thickness;as reported previously
1(H) ¼ 53 + 2e�(0:022+0:001)H (4)
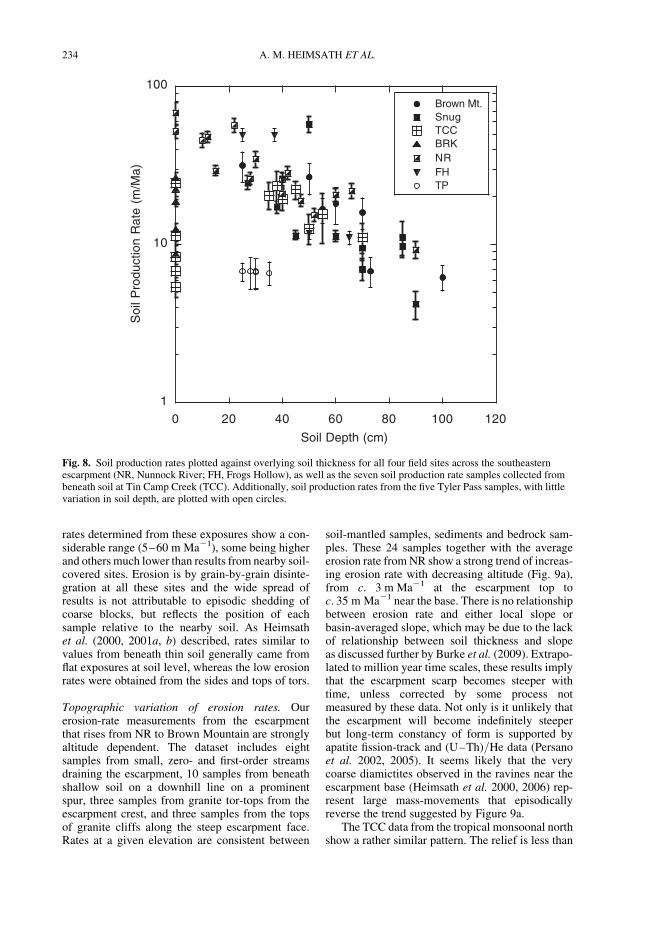
where 1(H ) is soil production rate (m Ma21) and His soil thickness (cm). Results from Brown Moun-tain and FH also accord with this relationship(Fig. 8a), although it must be noted that the FHsite at 900 m asl probably is not in steady state,having almost certainly been affected by periglacialsolifluction (Heimsath et al. 2001a).
Turning to tropical Australia, measurementsof soil production and soil thickness at Tin CanCreek (TCC) in the monsoonal far north (Heimsathet al. 2009) overlap completely with those fromour southeastern sites, as Figure 8 shows, exceptthat the TCC rates are lower where soil thicknessapproaches zero and suggest a ‘humped’ productionfunction; Wilkinson et al. (2005) proposed a similar
Fig. 5. Photograph of the bedrock ridge–valleytopography of Kings Canyon with approximate samplelocations shown with black filled circles. Sampleswere collected from the ‘beehive’-shaped features of theMereenie Sandstone at the top of the ridge, down theaxis of the central ridge of the photograph, with somesamples from the active channels.
Fig. 4. Photograph of the Flinders Range blocky cliffexposure used to calibrate a bedrock erosion model.Samples collected from above and below the bedrocksteps shown in the photograph were compared withaverage erosion rates from low-order stream sandsdraining catchments adjacent to this ridge.
A. M. HEIMSATH ET AL.232
relationship in the Blue Mountains, SE Australia.That landscapes with such different climates showsuch similar soil production functions seemssurprising but suggests that similar processes, pre-sumably dominantly biotic, are instrumental in pro-ducing and transporting soil. Measurements of ratesof soil-particle migration would be informative,similar to those reported from NR by Heimsathet al. (2002). In contrast, soil production on spursat Tyler Pass in semi-arid central Australia is sig-nificantly lower: rates of 6.6–6.7 m Ma21 wereobtained at five pits, under soil thicknesses of28–35 cm (Table 1; Fig. 8). For comparable thick-nesses at both the monsoonal and southern sites,the rate is 30–35 m Ma21. Moreover, the mean
erosion rate at Tyler Pass, determined from sandand pebble samples from nearby channels, is also6–7 m Ma21 (Table 2). We presume the differencebetween semi-arid Tyler Pass and both the monsoo-nal and the southeastern sites reflects the effect ofsoil moisture on both chemical weathering andbiotic activity.
Exposed rock at soil-mantled sites. Local exposuresof bedrock occur at our granitic soil-mantled sites inSE Australia, and at the monsoonal tropical sand-stone site (TCC), either as upstanding tors (emer-gent corestones) or as flat exposures that passbeneath soil at their edges: the data are representedin Figure 8 as points at zero soil thickness. Erosion
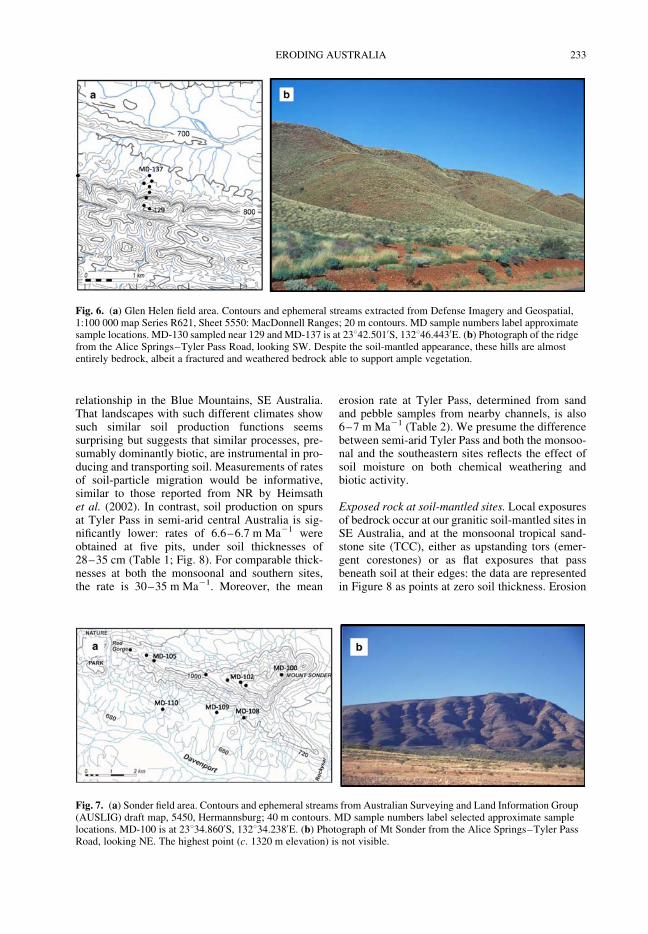
Fig. 7. (a) Sonder field area. Contours and ephemeral streams from Australian Surveying and Land Information Group(AUSLIG) draft map, 5450, Hermannsburg; 40 m contours. MD sample numbers label selected approximate samplelocations. MD-100 is at 23834.8600S, 132834.2380E. (b) Photograph of Mt Sonder from the Alice Springs–Tyler PassRoad, looking NE. The highest point (c. 1320 m elevation) is not visible.
Fig. 6. (a) Glen Helen field area. Contours and ephemeral streams extracted from Defense Imagery and Geospatial,1:100 000 map Series R621, Sheet 5550: MacDonnell Ranges; 20 m contours. MD sample numbers label approximatesample locations. MD-130 sampled near 129 and MD-137 is at 23842.5010S, 132846.4430E. (b) Photograph of the ridgefrom the Alice Springs–Tyler Pass Road, looking SW. Despite the soil-mantled appearance, these hills are almostentirely bedrock, albeit a fractured and weathered bedrock able to support ample vegetation.
ERODING AUSTRALIA 233
rates determined from these exposures show a con-siderable range (5–60 m Ma21), some being higherand others much lower than results from nearby soil-covered sites. Erosion is by grain-by-grain disinte-gration at all these sites and the wide spread ofresults is not attributable to episodic shedding ofcoarse blocks, but reflects the position of eachsample relative to the nearby soil. As Heimsathet al. (2000, 2001a, b) described, rates similar tovalues from beneath thin soil generally came fromflat exposures at soil level, whereas the low erosionrates were obtained from the sides and tops of tors.
Topographic variation of erosion rates. Ourerosion-rate measurements from the escarpmentthat rises from NR to Brown Mountain are stronglyaltitude dependent. The dataset includes eightsamples from small, zero- and first-order streamsdraining the escarpment, 10 samples from beneathshallow soil on a downhill line on a prominentspur, three samples from granite tor-tops from theescarpment crest, and three samples from the topsof granite cliffs along the steep escarpment face.Rates at a given elevation are consistent between
soil-mantled samples, sediments and bedrock sam-ples. These 24 samples together with the averageerosion rate from NR show a strong trend of increas-ing erosion rate with decreasing altitude (Fig. 9a),from c. 3 m Ma21 at the escarpment top toc. 35 m Ma21 near the base. There is no relationshipbetween erosion rate and either local slope orbasin-averaged slope, which may be due to the lackof relationship between soil thickness and slopeas discussed further by Burke et al. (2009). Extrapo-lated to million year time scales, these results implythat the escarpment scarp becomes steeper withtime, unless corrected by some process notmeasured by these data. Not only is it unlikely thatthe escarpment will become indefinitely steeperbut long-term constancy of form is supported byapatite fission-track and (U–Th)/He data (Persanoet al. 2002, 2005). It seems likely that the verycoarse diamictites observed in the ravines near theescarpment base (Heimsath et al. 2000, 2006) rep-resent large mass-movements that episodicallyreverse the trend suggested by Figure 9a.
The TCC data from the tropical monsoonal northshow a rather similar pattern. The relief is less than
1
10
100
0 20 40 60 80 100 120
Brown Mt.SnugTCCBRK
TP
NRFH
Soi
l Pro
duct
ion
Rat
e (m
/Ma)
Soil Depth (cm)
Fig. 8. Soil production rates plotted against overlying soil thickness for all four field sites across the southeasternescarpment (NR, Nunnock River; FH, Frogs Hollow), as well as the seven soil production rate samples collected frombeneath soil at Tin Camp Creek (TCC). Additionally, soil production rates from the five Tyler Pass samples, with littlevariation in soil depth, are plotted with open circles.
A. M. HEIMSATH ET AL.234
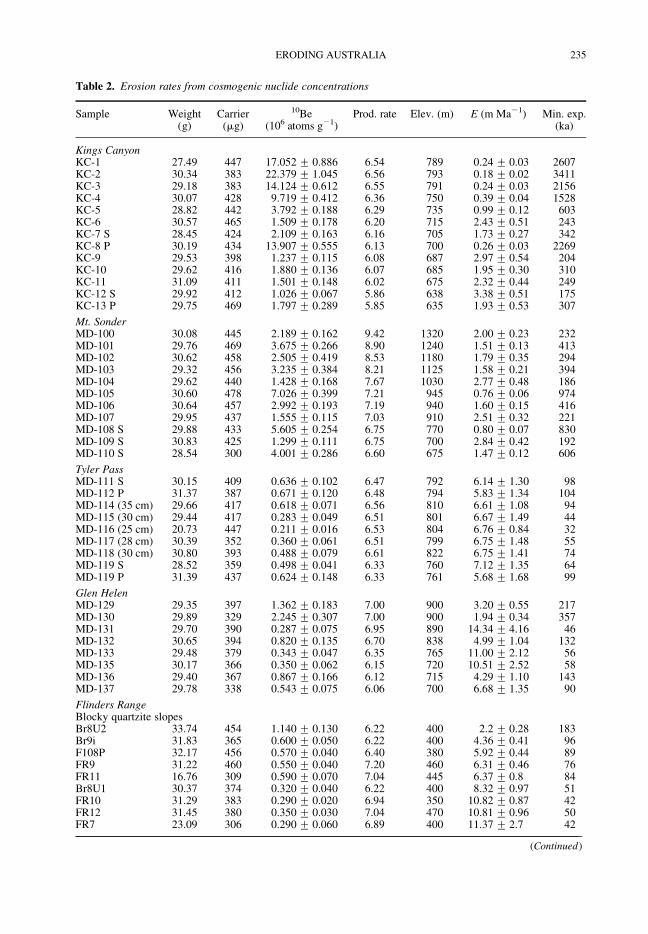
Table 2. Erosion rates from cosmogenic nuclide concentrations
Sample Weight(g)
Carrier(mg)
10Be(106 atoms g21)
Prod. rate Elev. (m) E (m Ma21) Min. exp.(ka)
Kings CanyonKC-1 27.49 447 17.052 + 0.886 6.54 789 0.24 + 0.03 2607KC-2 30.34 383 22.379 + 1.045 6.56 793 0.18 + 0.02 3411KC-3 29.18 383 14.124 + 0.612 6.55 791 0.24 + 0.03 2156KC-4 30.07 428 9.719 + 0.412 6.36 750 0.39 + 0.04 1528KC-5 28.82 442 3.792 + 0.188 6.29 735 0.99 + 0.12 603KC-6 30.57 465 1.509 + 0.178 6.20 715 2.43 + 0.51 243KC-7 S 28.45 424 2.109 + 0.163 6.16 705 1.73 + 0.27 342KC-8 P 30.19 434 13.907 + 0.555 6.13 700 0.26 + 0.03 2269KC-9 29.53 398 1.237 + 0.115 6.08 687 2.97 + 0.54 204KC-10 29.62 416 1.880 + 0.136 6.07 685 1.95 + 0.30 310KC-11 31.09 411 1.501 + 0.148 6.02 675 2.32 + 0.44 249KC-12 S 29.92 412 1.026 + 0.067 5.86 638 3.38 + 0.51 175KC-13 P 29.75 469 1.797 + 0.289 5.85 635 1.93 + 0.53 307
Mt. SonderMD-100 30.08 445 2.189 + 0.162 9.42 1320 2.00 + 0.23 232MD-101 29.76 469 3.675 + 0.266 8.90 1240 1.51 + 0.13 413MD-102 30.62 458 2.505 + 0.419 8.53 1180 1.79 + 0.35 294MD-103 29.32 456 3.235 + 0.384 8.21 1125 1.58 + 0.21 394MD-104 29.62 440 1.428 + 0.168 7.67 1030 2.77 + 0.48 186MD-105 30.60 478 7.026 + 0.399 7.21 945 0.76 + 0.06 974MD-106 30.64 457 2.992 + 0.193 7.19 940 1.60 + 0.15 416MD-107 29.95 437 1.555 + 0.115 7.03 910 2.51 + 0.32 221MD-108 S 29.88 433 5.605 + 0.254 6.75 770 0.80 + 0.07 830MD-109 S 30.83 425 1.299 + 0.111 6.75 700 2.84 + 0.42 192MD-110 S 28.54 300 4.001 + 0.286 6.60 675 1.47 + 0.12 606
Tyler PassMD-111 S 30.15 409 0.636 + 0.102 6.47 792 6.14 + 1.30 98MD-112 P 31.37 387 0.671 + 0.120 6.48 794 5.83 + 1.34 104MD-114 (35 cm) 29.66 417 0.618 + 0.071 6.56 810 6.61 + 1.08 94MD-115 (30 cm) 29.44 417 0.283 + 0.049 6.51 801 6.67 + 1.49 44MD-116 (25 cm) 20.73 447 0.211 + 0.016 6.53 804 6.76 + 0.84 32MD-117 (28 cm) 30.39 352 0.360 + 0.061 6.51 799 6.75 + 1.48 55MD-118 (30 cm) 30.80 393 0.488 + 0.079 6.61 822 6.75 + 1.41 74MD-119 S 28.52 359 0.498 + 0.041 6.33 760 7.12 + 1.35 64MD-119 P 31.39 437 0.624 + 0.148 6.33 761 5.68 + 1.68 99
Glen HelenMD-129 29.35 397 1.362 + 0.183 7.00 900 3.20 + 0.55 217MD-130 29.89 329 2.245 + 0.307 7.00 900 1.94 + 0.34 357MD-131 29.70 390 0.287 + 0.075 6.95 890 14.34 + 4.16 46MD-132 30.65 394 0.820 + 0.135 6.70 838 4.99 + 1.04 132MD-133 29.48 379 0.343 + 0.047 6.35 765 11.00 + 2.12 56MD-135 30.17 366 0.350 + 0.062 6.15 720 10.51 + 2.52 58MD-136 29.40 367 0.867 + 0.166 6.12 715 4.29 + 1.10 143MD-137 29.78 338 0.543 + 0.075 6.06 700 6.68 + 1.35 90
Flinders RangeBlocky quartzite slopesBr8U2 33.74 454 1.140 + 0.130 6.22 400 2.2 + 0.28 183Br9i 31.83 365 0.600 + 0.050 6.22 400 4.36 + 0.41 96F108P 32.17 456 0.570 + 0.040 6.40 380 5.92 + 0.44 89FR9 31.22 460 0.550 + 0.040 7.20 460 6.31 + 0.46 76FR11 16.76 309 0.590 + 0.070 7.04 445 6.37 + 0.8 84Br8U1 30.37 374 0.320 + 0.040 6.22 400 8.32 + 0.97 51FR10 31.29 383 0.290 + 0.020 6.94 350 10.82 + 0.87 42FR12 31.45 380 0.350 + 0.030 7.04 470 10.81 + 0.96 50FR7 23.09 306 0.290 + 0.060 6.89 400 11.37 + 2.7 42
(Continued)
ERODING AUSTRALIA 235

that of the southeastern escarpment (200 m v. 800 m)but the physiography is similar, with soil-mantledconvex spurs below rocky cliffs, topped byridge-and-plateau terrain. Figure 9b plots erosionrates v. altitude, determined from soil-mantledspurs, exposed bedrock, and sediments from smallchannels. Excepting two sediment samples from
the lowlands, the results suggest decreasingerosion rate with increasing elevation, fromc. 20 m Ma21 at 80 m asl to c. 5 m Ma21 at 230 masl. As with the southeastern escarpment, the pat-tern implies that slopes around TCC become pro-gressively steeper through time, unless the trend isreversed by processes not apparent today.
Table 2. Continued
Sample Weight(g)
Carrier(mg)
10Be(106 atoms g21)
Prod. rate Elev. (m) E (m Ma21) Min. exp.(ka)
Quartzite sedimentsF109s 21.25 316 0.900 + 0.050 6.40 350 3.66 + 0.22 141P499 31.10 356 0.790 + 0.050 7.04 380 5.12 + 0.31 112Br399 30.11 457 0.660 + 0.040 7.14 375 5.15 + 0.33 92F109P 23.32 300 0.540 + 0.040 6.40 350 6.27 + 0.49 84F110s 30.51 366 0.530 + 0.050 7.96 325 7.6 + 0.75 67
Rocky sandstone slopesP399 30.62 312 0.520 + 0.024 7.14 390 7.31 + 0.35 73FR4 29.98 350 0.410 + 0.060 6.89 400 9.1 + 1.39 60P299 31.58 353 0.270 + 0.040 7.14 375 14.07 + 2.37 38P199 31.28 354 0.220 + 0.020 6.89 350 16.35 + 1.46 32P199 31.10 356 0.210 + 0.020 6.89 350 17.06 + 1.68 30FR5 30.55 344 0.150 + 0.020 6.89 400 21.91 + 3.54 22
All errors propagated to erosion rate, E; Min. exp. is the minimum exposure age to cosmic-ray flux. Production factor scales nuclideprodution for slope, soil cover, elevation and latitude. Calculated using Cronus online calculator (http://hess.ess.washington.edu/math/). S and P, sand and pebbles, respectively, referring to catchment-averaged detrital sediment samples. [For Tin Camp Creek datasee Heimsath et al. (2009)]. For Bega Valley data see Heimsath et al. (2000, 2001a, 2006).
0
10
20
30
40
50
200 400 600 800 1000 1200
Ridge CrestBasin SedimentTor Top
Ero
sion
Rat
e, m
/Ma
Elevation, m
Southeastern Escarpment
0
10
20
30
40
50
0 50 100 150 200 250
E (m/Ma)SPR (m/Ma)Avg E (m/Ma)
Ero
sion
Rat
e (m
/Ma)
Elevation (m)
Tin Camp Creek
(a) (b)
Fig. 9. (a) Erosion rates from ridge crest (filled black circles), small catchment (open squares) and tor top (opendiamonds) samples plotted as a function of elevation across the southeastern escarpment face. For most of the samples,the ridge-crest and small catchment samples were adjacent for similar elevations. Average values for the soil productionrates at the scarp base (NR) and the coastal lowland (Snug) sites are included. (b) Soil production (filled black circles),average erosion (half-filled squares) and point-specific bedrock erosion (open squares with crosses) plotted againstelevation for the Tin Camp Creek field site. Lowest elevation samples are from the Tin Camp Creek, draining the entirefield area, as well as the extensive stony highlands. Adapted from Heimsath et al. (2009).
A. M. HEIMSATH ET AL.236

Bedrock-dominated landscapes
Erosion in the steep, weathering-limited bedrockslopes and ridges that we examined in the Flindersand MacDonnell Ranges is dominated by joint-controlled break-up on stratified and schistose rocksurfaces, and by exfoliation and granular disinte-gration on massive, coarsely crystalline plutonicrocks. Clasts and grains drift downslope, disinte-grating further as they go and lodging temporar-ily in joint-angle pockets but, on the slopes wesampled, not in sufficient quantities to form talusslopes or colluvial mantles. Vegetation patches ofherbs, grasses and shrubs pattern the slopes, rootedin loose gravelly sand. Drainage is focused bysteep bedrock channels, with discontinuous allu-vial deposits of mixed sand, gravel and angularboulders, interrupted by knickpoints. Althoughphysiographically similar, the Flinders and Mac-Donnell Ranges yielded somewhat different results,and are summarized separately.
Erosion rates on different rock-types. (i) FlindersRanges. We sampled in situ rock surfaces onsteep, coarsely jointed quartzite slopes (jointspacing 60 cm) (nine samples), sediments derivedfrom these slopes (five samples), and rocky sand-stone slopes (five samples). Results are listed inTable 2. Erosion rates calculated from 10Be mea-surements for quartzite samples varied: surfacesthat appeared to have been exposed by slip-off ofoverlying blocks gave the highest apparent rates(FR7, FR10, and FR12) whereas surfaces judgedto have been long exposed, from their state ofred-weathering, gave the lowest apparent rates(Br8U2, BR9i). The mean of the measurementsfrom rock surfaces is 7.4 m Ma21; the range (2.2–11.4 m Ma21) is similar to that predicted usingequations (2) and (3) with block size L ¼ 60 cm(1.8–9.5 m Ma21). Standard deviation and standarderrors are +3.2 and +1.1, respectively. The meanrate from quartzite sand and gravel channel sedi-ments is 5.6 m Ma21 (standard error +0.7 m), stat-istically similar to the average for the in situsamples, suggesting that (1) the average erosionrate obtained from the in situ samples is a reasonableestimate, and (2) exposure to cosmic rays as weath-ered clasts move from the rocky slopes into streamsediments is minor, relative to in situ exposurebefore break-out from the slope; that is, the traveltime is relatively short for these landscapes.
Erosion rates from in situ sandstone samples aresignificantly higher than from the quartzite, rangingfrom 7.3 to 21.9 m Ma21 with a mean of 14 +2 m Ma21. Extrapolation back over tens of millionsof years suggests that sandstone ridge-crests shouldbe substantially lower than quartzite crests. Althoughthis is locally the case in the neighbourhood of
Brachina and Parachilna gorges, it is not so through-out the Flinders Ranges as a whole, suggesting con-tinuing, slow differential uplift. Quigley et al.(2007a, b) reached a similar conclusion at faultedterrain in the central Flinders Ranges.
(ii) MacDonnell Ranges and Kings Canyon.Long, convex-up spurs in jointed bedrock weresampled in the western MacDonnell Ranges, inquartzite at Mt Sonder and sandstone at GlenHelen, and in sandstone at Kings Canyon. Surfaceerosion rates measured at Mount Sonder are con-sistently low, ranging from 0.7 to 2.8 m Ma21
(eight samples: Table 2) with a mean of 1.8 +0.2 m Ma21. Three sediment samples from smallbedrock channels give essentially the same result:1.7 + 0.6 m Ma21. Surface erosion rates from theGlen Helen sandstone site are both higher andmore scattered, ranging from 1.9 to 14.3 m Ma21
(six samples) with a mean of 6.6 + 2.0 m Ma21.In contrast, erosion rate measurements from KingsCanyon sandstone site are low, ranging from 0.18to 2.97 m Ma21 (nine samples), with a mean of1.3 + 0.4 m Ma21. Four sediment samples fromsmall bedrock channels give a similar result:1.8 + 0.6 m Ma21.
Topographic variation of erosion rate
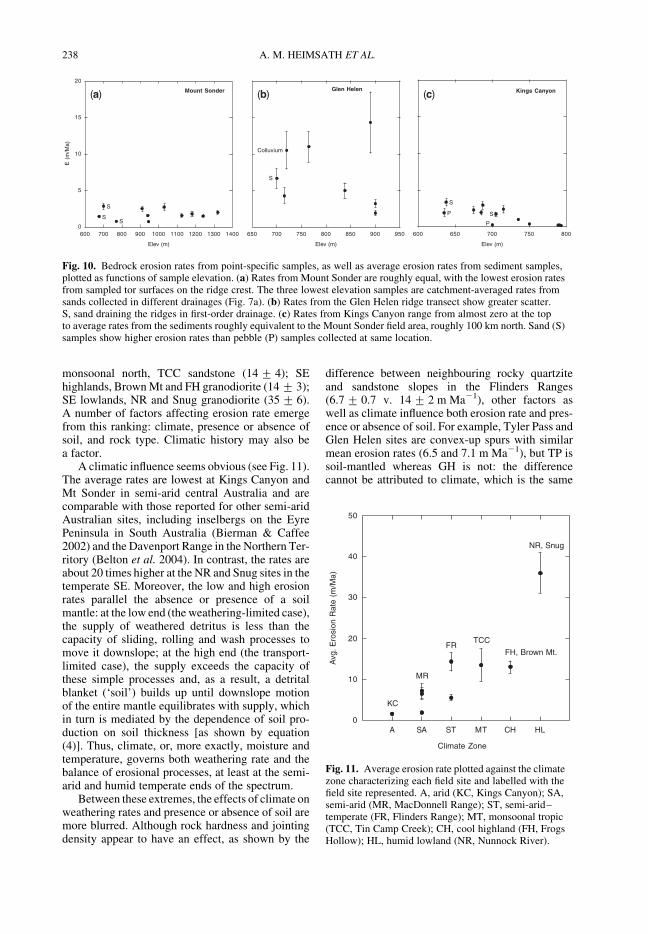
In contrast with the high, soil-mantled escarpmentin humid SE Australia, where erosion rate declinesmarkedly with increasing altitude, we found noregular variation of erosion rate with altitude atour sites in semi-arid central Australia. Althoughthe variability inherent in point measurementsfrom coarsely jointed surfaces will tend to masktrends, we consider that overall there are sufficientmeasurements for any trends to be apparent, ifpresent. Allowing for inherent scatter, erosion ratesat Mt Sonder, which has both the greatest reliefand the most measurements, effectively are thesame at all altitudes, from the base at c. 700 m aslto the top at 1350 m asl (Fig. 10a). Results fromGlen Helen are too scattered for any trend to berevealed (Fig. 10b), whereas at Kings Canyon, ero-sion rates appear to drop in a step-like manner, fromc. 2 m Ma21 below c. 720 m asl to ,0.5 mMa21
above 720 m (Fig. 10c).
Discussion
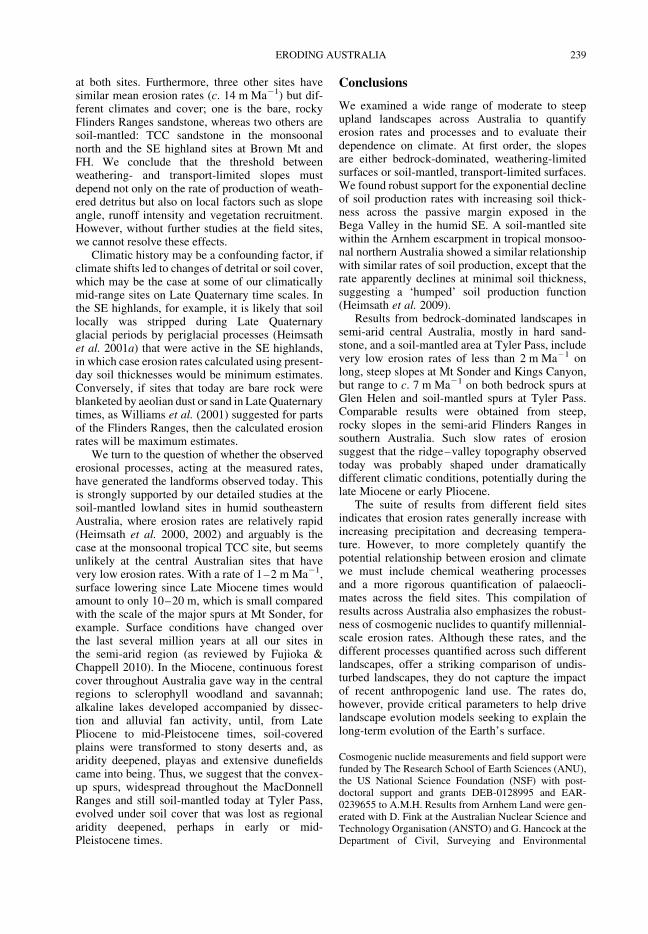
Ranking the sites in ascending order in terms oferosion rates (means and standard errors inm Ma21), we have: Kings Canyon sandstone(1.5 + 0.3); Mt Sonder quartzite (1.8 + 0.2);Tyler Pass conglomerate (6.5 + 0.2); FlindersRanges quartzite (6.7 + 0.7); Glen Helen sandstone(7.1 + 1.5); Flinders Ranges sandstone (14 + 2);
ERODING AUSTRALIA 237
monsoonal north, TCC sandstone (14 + 4); SEhighlands, Brown Mt and FH granodiorite (14 + 3);SE lowlands, NR and Snug granodiorite (35 + 6).A number of factors affecting erosion rate emergefrom this ranking: climate, presence or absence ofsoil, and rock type. Climatic history may also bea factor.
A climatic influence seems obvious (see Fig. 11).The average rates are lowest at Kings Canyon andMt Sonder in semi-arid central Australia and arecomparable with those reported for other semi-aridAustralian sites, including inselbergs on the EyrePeninsula in South Australia (Bierman & Caffee2002) and the Davenport Range in the Northern Ter-ritory (Belton et al. 2004). In contrast, the rates areabout 20 times higher at the NR and Snug sites in thetemperate SE. Moreover, the low and high erosionrates parallel the absence or presence of a soilmantle: at the low end (the weathering-limited case),the supply of weathered detritus is less than thecapacity of sliding, rolling and wash processes tomove it downslope; at the high end (the transport-limited case), the supply exceeds the capacity ofthese simple processes and, as a result, a detritalblanket (‘soil’) builds up until downslope motionof the entire mantle equilibrates with supply, whichin turn is mediated by the dependence of soil pro-duction on soil thickness [as shown by equation(4)]. Thus, climate, or, more exactly, moisture andtemperature, governs both weathering rate and thebalance of erosional processes, at least at the semi-arid and humid temperate ends of the spectrum.
Between these extremes, the effects of climate onweathering rates and presence or absence of soil aremore blurred. Although rock hardness and jointingdensity appear to have an effect, as shown by the
difference between neighbouring rocky quartziteand sandstone slopes in the Flinders Ranges(6.7 + 0.7 v. 14 + 2 m Ma21), other factors aswell as climate influence both erosion rate and pres-ence or absence of soil. For example, Tyler Pass andGlen Helen sites are convex-up spurs with similarmean erosion rates (6.5 and 7.1 m Ma21), but TP issoil-mantled whereas GH is not: the differencecannot be attributed to climate, which is the same
0
5
10
15
20
600 700 800 900 1000 1100 1200 1300 1400
E (
m/M
a)
Elev (m)
Mount Sonder
S
SS
650 700 750 800 850 900 950
Elev (m)
Glen Helen
S
Colluvium
600 650 700 750 800
Elev (m)
Kings Canyon
S
P
P
S
(a) (b) (c)
Fig. 10. Bedrock erosion rates from point-specific samples, as well as average erosion rates from sediment samples,plotted as functions of sample elevation. (a) Rates from Mount Sonder are roughly equal, with the lowest erosion ratesfrom sampled tor surfaces on the ridge crest. The three lowest elevation samples are catchment-averaged rates fromsands collected in different drainages (Fig. 7a). (b) Rates from the Glen Helen ridge transect show greater scatter.S, sand draining the ridges in first-order drainage. (c) Rates from Kings Canyon range from almost zero at the topto average rates from the sediments roughly equivalent to the Mount Sonder field area, roughly 100 km north. Sand (S)samples show higher erosion rates than pebble (P) samples collected at same location.
0
10
20
30
40
50
HLCHMTSTSAA
Avg
. Ero
sion
Rat
e (m
/Ma)
Climate Zone
NR, Snug
FH, Brown Mt.
TCCFR
MR
KC
Fig. 11. Average erosion rate plotted against the climatezone characterizing each field site and labelled with thefield site represented. A, arid (KC, Kings Canyon); SA,semi-arid (MR, MacDonnell Range); ST, semi-arid–temperate (FR, Flinders Range); MT, monsoonal tropic(TCC, Tin Camp Creek); CH, cool highland (FH, FrogsHollow); HL, humid lowland (NR, Nunnock River).
A. M. HEIMSATH ET AL.238
at both sites. Furthermore, three other sites havesimilar mean erosion rates (c. 14 m Ma21) but dif-ferent climates and cover; one is the bare, rockyFlinders Ranges sandstone, whereas two others aresoil-mantled: TCC sandstone in the monsoonalnorth and the SE highland sites at Brown Mt andFH. We conclude that the threshold betweenweathering- and transport-limited slopes mustdepend not only on the rate of production of weath-ered detritus but also on local factors such as slopeangle, runoff intensity and vegetation recruitment.However, without further studies at the field sites,we cannot resolve these effects.
Climatic history may be a confounding factor, ifclimate shifts led to changes of detrital or soil cover,which may be the case at some of our climaticallymid-range sites on Late Quaternary time scales. Inthe SE highlands, for example, it is likely that soillocally was stripped during Late Quaternaryglacial periods by periglacial processes (Heimsathet al. 2001a) that were active in the SE highlands,in which case erosion rates calculated using present-day soil thicknesses would be minimum estimates.Conversely, if sites that today are bare rock wereblanketed by aeolian dust or sand in Late Quaternarytimes, as Williams et al. (2001) suggested for partsof the Flinders Ranges, then the calculated erosionrates will be maximum estimates.
We turn to the question of whether the observederosional processes, acting at the measured rates,have generated the landforms observed today. Thisis strongly supported by our detailed studies at thesoil-mantled lowland sites in humid southeasternAustralia, where erosion rates are relatively rapid(Heimsath et al. 2000, 2002) and arguably is thecase at the monsoonal tropical TCC site, but seemsunlikely at the central Australian sites that havevery low erosion rates. With a rate of 1–2 m Ma21,surface lowering since Late Miocene times wouldamount to only 10–20 m, which is small comparedwith the scale of the major spurs at Mt Sonder, forexample. Surface conditions have changed overthe last several million years at all our sites inthe semi-arid region (as reviewed by Fujioka &Chappell 2010). In the Miocene, continuous forestcover throughout Australia gave way in the centralregions to sclerophyll woodland and savannah;alkaline lakes developed accompanied by dissec-tion and alluvial fan activity, until, from LatePliocene to mid-Pleistocene times, soil-coveredplains were transformed to stony deserts and, asaridity deepened, playas and extensive dunefieldscame into being. Thus, we suggest that the convex-up spurs, widespread throughout the MacDonnellRanges and still soil-mantled today at Tyler Pass,evolved under soil cover that was lost as regionalaridity deepened, perhaps in early or mid-Pleistocene times.
Conclusions
We examined a wide range of moderate to steepupland landscapes across Australia to quantifyerosion rates and processes and to evaluate theirdependence on climate. At first order, the slopesare either bedrock-dominated, weathering-limitedsurfaces or soil-mantled, transport-limited surfaces.We found robust support for the exponential declineof soil production rates with increasing soil thick-ness across the passive margin exposed in theBega Valley in the humid SE. A soil-mantled sitewithin the Arnhem escarpment in tropical monsoo-nal northern Australia showed a similar relationshipwith similar rates of soil production, except that therate apparently declines at minimal soil thickness,suggesting a ‘humped’ soil production function(Heimsath et al. 2009).
Results from bedrock-dominated landscapes insemi-arid central Australia, mostly in hard sand-stone, and a soil-mantled area at Tyler Pass, includevery low erosion rates of less than 2 m Ma21 onlong, steep slopes at Mt Sonder and Kings Canyon,but range to c. 7 m Ma21 on both bedrock spurs atGlen Helen and soil-mantled spurs at Tyler Pass.Comparable results were obtained from steep,rocky slopes in the semi-arid Flinders Ranges insouthern Australia. Such slow rates of erosionsuggest that the ridge–valley topography observedtoday was probably shaped under dramaticallydifferent climatic conditions, potentially during thelate Miocene or early Pliocene.
The suite of results from different field sitesindicates that erosion rates generally increase withincreasing precipitation and decreasing tempera-ture. However, to more completely quantify thepotential relationship between erosion and climatewe must include chemical weathering processesand a more rigorous quantification of palaeocli-mates across the field sites. This compilation ofresults across Australia also emphasizes the robust-ness of cosmogenic nuclides to quantify millennial-scale erosion rates. Although these rates, and thedifferent processes quantified across such differentlandscapes, offer a striking comparison of undis-turbed landscapes, they do not capture the impactof recent anthropogenic land use. The rates do,however, provide critical parameters to help drivelandscape evolution models seeking to explain thelong-term evolution of the Earth’s surface.
Cosmogenic nuclide measurements and field support werefunded by The Research School of Earth Sciences (ANU),the US National Science Foundation (NSF) with post-doctoral support and grants DEB-0128995 and EAR-0239655 to A.M.H. Results from Arnhem Land were gen-erated with D. Fink at the Australian Nuclear Science andTechnology Organisation (ANSTO) and G. Hancock at theDepartment of Civil, Surveying and Environmental
ERODING AUSTRALIA 239

Engineering, University of Newcastle. S. Selkirk used hermagic wand to turn illegible ‘blue line’ 1:100 000 mapsinto the field maps for the MacDonnell Ranges fieldsites, and M. Zoldak made the regional topographicmap. P. Bishop and an anonymous reviewer helpedimprove the manuscript with their comments.
References
Bagas, L. 1988. Geology of Kings Canyon National Park.Northern Territory Department of Mines and Energy,Report, 4.
Belton, D. X., Brown, R. W., Kohn, B. P., Fink, D. &Farley, K. A. 2004. Quantitative resolution of thedebate over antiquity of the central Australian land-scape: implications for the tectonic and geomorphicstability of cratonic interiors. Earth and PlanetaryScience Letters, 219, 21–34.
Bierman, P. R. 1994. Using in situ produced cosmogenicisotopes to estimate rates of landscape evolution; areview from the geomorphic perspective. Journal ofGeophysical Research, B, Solid Earth and Planets,99, 13 885–13 896.
Bierman, P. R. & Caffee, M. 2002. Cosmogenicexposure and erosion history of Australian bedrocklandforms. Geological Society of America Bulletin,114, 787–803.
Bierman, P. & Steig, E. J. 1996. Estimating rates of denu-dation using cosmogenic isotope abundances in sedi-ment. Earth Surface Processes and Landforms, 21,125–139.
Braun, J., Heimsath, A. M. & Chappell, J. 2001. Sedi-ment transport mechanisms on soil-mantled hillslopes.Geology, 29, 683–686.
Burke, B. C., Heimsath, A. M., Chappell, J. & Yoo, K.2009. Weathering the escarpment: chemical and phys-ical rates and processes, southeastern Australia. EarthSurface Processes and Landforms, doi: 10.1002/esp.1764.
Cockburn, H. A. P. & Summerfield, M. A. 2004. Geo-morphological applications of cosmogenic isotopeanalysis. Progress in Physical Geography, 28, 1–42.
Dietrich, W. E., Reiss, R., Hsu, M.-L. & Montgomery,D. R. 1995. A process-based model for colluvial soildepth and shallow landsliding using digital elevationdata. Hydrological Processes, 9, 383–400.
Fujioka, T. & Chappell, J. 2010. History of Australianaridity: chronology in the evolution of arid landscapes.In: Bishop, P. & Pillans, B. (eds) Australian Land-scapes. Geological Society, London, Special Publi-cations, 346, 121–139.
Gosse, J. C. & Phillips, F. M. 2001. Terrestrial in situ cos-mogenic nuclides: theory and application. QuaternaryScience Reviews, 20, 1475–1560.
Granger, D. E., Kirchner, J. W. & Finkel, R. 1996.Spatially averaged long-term erosion rates measuredfrom in situ-produced cosmogenic nuclides in alluvialsediment. Journal of Geology, 104, 249–257.
Hancock, G. R. & Evans, K. G. 2006. Gully position,characteristics and geomorphic thresholds in an undis-turbed catchment in northern Australia. HydrologicalProcesses, 20, 2935–2951.
Hancock, G. R., Willgoose, G. R., Evans, K. G.,Moliere, D. R. & Saynor, M. J. 2000. Mediumterm erosion simulation of an abandoned mine siteusing the SIBERIA landscape evolution model.Australian Journal of Soil Research, 38, 249–263.
Hancock, G. R., Loughran, R. J., Evans, K. G. &Balog, R. M. 2008a. Estimation of soil erosionusing field and modelling approaches in an undisturbedArnhem Land catchment, Northern Territory, Austra-lia. Geographical Research, 46, 333–349.
Hancock, G. R., Lowry, J. B. C., Moliere, D. R. &Evans, K. G. 2008b. An evaluation of an enhancedsoil erosion and landscape evolution model: a casestudy assessment of the former Nabarlek uraniummine, Northern Territory, Australia. Earth SurfaceProcesses and Landforms, 33, 2045–2063.
Hayes, D. E. & Ringis, J. 1973. Seafloor spreading in theTasman Sea. Nature, 243, 454–458.
Heimsath, A. M., Dietrich, W. E., Nishiizumi, K. &Finkel, R. C. 1997. The soil production function andlandscape equilibrium. Nature, 388, 358–361.
Heimsath, A. M., Dietrich, W. E., Nishiizumi, K. &Finkel, R. C. 1999. Cosmogenic nuclides, topogra-phy, and the spatial variation of soil depth. Geomor-phology, 27, 151–172.
Heimsath, A. M., Chappell, J., Dietrich, W. E.,Nishiizumi, K. & Finkel, R. C. 2000. Soil productionon a retreating escarpment in southeastern Australia.Geology, 28, 787–790.
Heimsath, A. M., Chappell, J., Dietrich, W. E.,Nishiizumi, K. & Finkel, R. C. 2001a. Late Quatern-ary erosion in southeastern Australia: a field exampleusing cosmogenic nuclides. Quaternary International,83–85, 169–185.
Heimsath, A. M., Dietrich, W. E., Nishiizumi, K. &Finkel, R. C. 2001b. Stochastic processes of soil pro-duction and transport: erosion rates, topographic vari-ation, and cosmogenic nuclides in the Oregon CoastRange. Earth Surface Processes and Landforms, 26,531–552.
Heimsath, A. M., Chappell, J., Spooner, N. A. &Questiaux, D. G. 2002. Creeping soil. Geology, 30,111–114.
Heimsath, A. M., Furbish, D. J. & Dietrich, W. E.2005. The illusion of diffusion: field evidence fordepth-dependent sediment transport. Geology, 33,949–952.
Heimsath, A. M., Chappell, J., Finkel, R. C., Fifield,L. K. & Alimanovic, A. 2006. Escarpment erosionand landscape evolution in southeastern Australia. In:Willett, S. D., Hovius, N., Brandon, M. T. &Fisher, D. M. (eds) Tectonics, Climate and LandscapeEvolution. Geological Society of America, SpecialPapers, 398, 173–190, doi: 10.1130/2006.2398(10).
Heimsath, A. M., Fink, D. & Hancock, G. R. 2009. The‘humped’ soil production function: eroding ArnhemLand, Australia. Earth Surface Processes and Land-forms, doi: 10.1002/esp.1859.
Kaste, J., Heimsath, A. M. & Bostick, B. C. 2007. Short-term soil mixing quantified with fallout radionuclides.Geology, 35, 243–246.
Kohn, B. P., Gleadow, A. J. W., Brown, R. W.,Gallagher, K., O’Sullivan, P. B. & Foster, D. A.
A. M. HEIMSATH ET AL.240

2002. Shaping the Australian crust over the last300 million years: insights from fission track thermo-tectonic imaging and denudation studies of key ter-ranes. Australian Journal of Earth Sciences, 49,697–717.
Lal, D. 1991. Cosmic ray labeling of erosion surfaces: insitu nuclide production rates and erosion models. Earthand Planetary Science Letters, 104, 424–439.
Lambeck, K. & Stephenson, R. 1985. Post-orogenic evo-lution of a mountain range; south-eastern Australianhighlands. Geophysical Research Letters, 12, 801–804.
Nishiizumi, K., Kohl, C. P. et al. 1993. Role of in situcosmogenic nuclides 10Be and 26Al in the study ofdiverse geomorphic processes. Earth Surface Pro-cesses and Landforms, 18, 407–425.
Persano, C., Stuart, F. M., Bishop, P. & Barfod, D. N.2002. Apatite (U–Th)/He age constraints on thedevelopment of the great escarpment on the southeast-ern Australian passive margin. Earth and PlanetaryScience Letters, 200, 79–90.
Persano, C., Stuart, F. M., Bishop, P. & Dempster, T. J.2005. Deciphering continental breakup in easternAustralia using low-temperature thermochronometers.Journal of Geophysical Research, 110, B12405,doi: 10.1029/2004JB003325.
Pillans, B. 2007. Pre-Quaternary landscape inheritancein Australia. Journal of Quaternary Science, 22,439–447.
Quigley, M., Sandiford, M., Fifield, K. &Alimanovic, A. 2007a. Bedrock erosion and reliefproduction in the northern Flinders Ranges, Australia.Earth Surface Processes and Landforms, 32,929–944.
Quigley, M., Sandiford, M., Fifield, K. &Alimanovic, A. 2007b. Landscape responses to intra-plate tectonism: quantitative constraints from 10Benuclide abundances. Earth and Planetary ScienceLetters, 261, 120–133.
Reinhardt, L. J., Hoey, T. B., Barrows, T. T.,Dempster, T. J., Bishop, P. & Fifield, L. K. 2007.Interpreting erosion rates from cosmogenic radio-nuclide concentrations measured in rapidly erodingterrain. Earth Surface Processes and Landforms, 32,390–406.
Richardson, S. J. 1976. Geology of the Michelago1:100 000 sheet 8726. Geological Survey of NewSouth Wales, Department of Mineral Resources andDevelopment, Canberra.
Riley, S. J. & Williams, D. K. 1991. Thresholds of gully-ing, Arnhem Land, Northern Territory. MalaysianJournal of Tropical Agriculture, 22, 133–143.
Roering, J. J., Kirchner, J. W. & Dietrich, W. E. 2001.Hillslope evolution by nonlinear, slope-dependenttransport: steady state morphology and equilibrium
adjustment timescales. Journal of GeophysicalResearch—Solid Earth, 106, 16 499–16 513.
Saynor, M. J., Erskine, W. D., Evans, K. G. & Eliot, I.2004. Gully initiation and implications for manage-ment of scour holes in the vicinity of Jabiluka mine,Northern Territory, Australia. Geografiska AnnalerSeries A—Physical Geography, 86, 191–203.
Saynor, M. J., Staben, G. et al. 2009. Impact of CycloneMonica on catchments within the Alligator RiversRegion. Field Survey Data. Supervising Scientist,Darwin, Internal Report, 557.
Staben, G. & Evans, K. G. 2008. Estimates of tree canopyloss as a result of Cyclone Monica, in the Magela Creekcatchment, northern Australia. Austral Ecology, 33,562–569.
Stewart, A. J., Blake, D. H. & Ollier, C. D. 1986.Cambrian river terraces and ridgetops in centralAustralia: oldest peristing landforms? Science, 233,758–761.
Townsend, S. A. & Douglas, D. D. 2000. The effect ofthree fire regimes on stream water quality, wateryield and export coefficients in a tropical savanna(northern Australia). Journal of Hydrology, 229,118–137.
Vasconcelos, P. M., Knesel, K. M., Cohen, B. E. &Heim, J. A. 2008. Geochronology of the AustralianCenozoic: a history of tectonic and igneous activity,weathering, erosion, and sedimentation. AustralianJournal of Earth Sciences, 55, 865–914.
Weissel, J. K. & Seidl, M. A. 1997. Influence of rockstrength properties on escarpment retreat acrosspassive continental margins. Geology, 25, 631–634.
Weissel, J. K. & Seidl, M. A. 1998. Inland propagation oferosional escarpments and river profile evolutionacross the southeast Australian passive continentalmargin. In: Tinkler, K. J. & Wohl, E. E. (eds)Rivers Over Rock: Fluvial Processes in Bedrock Chan-nels. Geophysical Monograph, American GeophysicalUnion, 107, 189–206.
Wells, T., Willgoose, G. R. & Hancock, G. R. 2008.Modeling weathering pathways and processes of thefragmentation of salt weathered quartz–chloriteschist. Journal of Geophysical Research—EarthSurface, 113, F01014, doi: 10.1029/2006JF000714.
Wilkinson, M. T., Chappell, J., Humphreys, G. S.,Fifield, K., Smith, B. & Hesse, P. 2005. Soil pro-duction in heath and forest, Blue Mountains, Australia:influence of lithology and palaeoclimate. EarthSurface Processes and Landforms, 30, 923–934.
Williams, M., Prescott, J., Chappell, J., Adamson, D.,Cock, B., Walker, K. & Gell, P. 2001. The enigmaof a late Pleistocene wetland in the Flinders Ranges,South Australia. Quaternary International, 83–85,129–144.
ERODING AUSTRALIA 241