Embed Size (px)
Citation preview

1
ESA Climate Change Initiative Plus Soil Moisture
Soil Moisture ECV Product User Guide (PUG)
Supporting Product Version v05.2
Deliverable ID: D4.2 Version 1
29-05-2020
Prepared by
Earth Observation Data Centre for Water Resources Monitoring (EODC) GmbH
in cooperation with
TU Wien, VanderSat, CESBIO and ETH Zürich

Soil Moisture ECV Product User Guide (PUG)
Product Version v05.2
Doc Issue 1.0
Date 29-05-2020
i
This document forms the deliverable D4.2 Version 1, Product Users Guide (PUG) and was compiled for the European Space Agency (ESA) Climate Change Initiative Plus Soil Moisture Project (ESRIN Contract No: 4000126684/19/I-NB: ”ESA CCI+ Phase 1 New R&D on CCI ECVS Soil Moisture”). For more information on the CCI programme of ESA see http://www.esa-cci.org/.
Number of pages: 88
Authors: R. van der Schalie, W. Preimesberger, A. Pasik, T. Scanlon, R. Kidd
Circulation: ESA, Project Internal
Public Release ONLY after review completed by ESA
Issue Date Details Editor
0.1 28/11/2018 Document created based on PUG supporting product version v04.2 (Deliverable D3.3.1 from ESA CCI SM Phase 2.)
P. Buttinger, T. Scanlon (TU Wien)
R. Kidd (EODC)
0.2 2/10/2019 Updated for release of Version 4.5 of product under CCI + R&D, Revision of [RD-10]
A. Pasik, T. Scanlon
0.3 07/04/2020 Updated for release of Version 5.2 of the product (incl. SMAP). Updated Acronyms List (RFI), revised Exec Summary to include Gruber et al (2019), provided clarification of development of Active product under HSAF activities. Revision of Reference Documents to point to latest versions. Modified section 5.1 to include SMAP and included reference to development of Active product under H-SAF. Revision of Figure 6 to reflect data flow for v05.2, and clarification of current merging processing in section 5.4. Revision of Figure 7 for August 2019, Update of Table 2 to show current product data volume.. Revision of tables for Global NetCDF attributes, Table 3, Table 4, and Table 5. Variable Sensor Table 17 revised
Shortened descriptions of ACTIVE products, section 8.2 and added references to H SAF. Provided update in section 8.5 for intercalibration of AMSR-E and AMSR2. Revised references as applicable.
R. van der Schalie, (VanderSat)
W. Preimesberger (TU Wien)
0.4 23/04/2020 Revised deliverable ID, product version ID and Issue number, Revision of document change history to provide full trace of changes from previous issue. To ESA for review
R. Kidd (EODC)
0.5 04/05/2020 Updated header pg i. Revised deliverable considering RID’s provided in: CCI2_Soil_Moisture_D4.2_v1_Product_Users_Guide_v05.2_issue_0.4_RID
Revised filename (RID 001). Updated Exec Summary and provided link to CCI open data portal (RID 003). To VdS for revision of other open RIDs
R. Kidd (EODC)
0.6 27/05/2020 [RID 002], revised exec summary, provided corrected reference to Gruber et al., 2019 [RID 004] corrected reference to Dorigo et al., 2017 in section 2.1 and section 7 [RID 006] Clarification on units provided for Figure 7. [RID 007] Clarification provided on Table 20 by inclusion of references. Response on [RID 005], will add more recent references in Section 4 and
R. van der Schalie, (VanderSat), R. Kidd (EODC)

Soil Moisture ECV Product User Guide (PUG)
Product Version v05.2
Doc Issue 1.0
Date 29-05-2020
ii
section 7 for next version of PUG. Revised Figure 1 with figure from ATBD v1.
1.0 29/05/2020 Accepted all reviewers comments. Closed document. Prepared to pdf for delivery
R. Kidd
For any clarifications please contact Richard Kidd ([email protected]).

Soil Moisture ECV Product User Guide (PUG)
Product Version v05.2
Doc Issue 1.0
Date 29-05-2020
iii
Project Partners
Prime Contractor and project management
EODC, Earth Observation Data Centre for Water Resources Monitoring (Austria)
Earth Observation Partners TU Wien, Vienna University of Technology (Austria) VanderSat, The Netherlands
CESBIO, France
Climate Research Partners ETH, Institute for Atmospheric and Climate Science, (Switzerland)

Soil Moisture ECV Product User Guide (PUG)
Product Version v05.2
Doc Issue 1.0
Date 29-05-2020
iv
1 Table of Content
LIST OF FIGURES .............................................................................................................................................. VI
LIST OF TABLES ................................................................................................................................................ VI
DEFINITIONS, ACRONYMS AND ABBREVIATIONS .......................................................................................... VIII
1 EXECUTIVE SUMMARY ............................................................................................................................. 1
2 INTRODUCTION ........................................................................................................................................ 2
2.1 PURPOSE AND STRUCTURE OF THE DOCUMENT .................................................................................................... 2
2.2 TARGET AUDIENCE ......................................................................................................................................... 3
3 REFERENCE DOCUMENTS ......................................................................................................................... 3
4 SOIL MOISTURE WITHIN THE ENVIRONMENT........................................................................................... 5
5 SOIL MOISTURE DATA FROM EARTH OBSERVATION SATELLITES .............................................................. 7
5.1 MICROWAVE INSTRUMENTS ONBOARD EARTH OBSERVATION SATELLITES ................................................................. 7
5.2 DATA PROCESSING CHAIN ............................................................................................................................. 10
5.3 GRID TYPES ................................................................................................................................................ 12
5.4 DATA FLOW AND SOIL MOISTURE DATA PROCESSING MODULES .......................................................................... 15
5.5 SOIL MOISTURE DATA PRODUCTS ................................................................................................................... 18
6 SPECIFICATION OF THE PRODUCTS ......................................................................................................... 19
6.1 GEOPHYSICAL PARAMETERS ........................................................................................................................... 19
6.2 PRODUCT DATA VOLUME .............................................................................................................................. 19
6.3 STRUCTURE AND FORMAT OF THE PRODUCT ...................................................................................................... 19
6.3.1 Data file format and file naming ................................................................................................... 19
6.3.2 NetCDF file structure ..................................................................................................................... 20
6.4 ANNOTATION DATASETS ................................................................................................................................ 35
6.4.1 sm_uncertainty ............................................................................................................................. 35
6.4.2 dnflag ............................................................................................................................................ 36
6.4.3 flag ................................................................................................................................................ 36
6.4.4 freqbandID .................................................................................................................................... 36
6.4.5 mode ............................................................................................................................................. 36
6.4.6 sensor ............................................................................................................................................ 37
6.4.7 t0 ................................................................................................................................................... 37
6.4.8 time ............................................................................................................................................... 37
6.5 PRODUCT GRID AND PROJECTION ................................................................................................................... 37
7 ESA CCI SM IN EARTH SYSTEM APPLICATIONS ........................................................................................ 38

Soil Moisture ECV Product User Guide (PUG)
Product Version v05.2
Doc Issue 1.0
Date 29-05-2020
v
7.1 ASSESSING CLIMATE VARIABILITY AND CHANGE................................................................................................... 40
7.2 LAND-ATMOSPHERE INTERACTIONS ................................................................................................................. 41
7.3 GLOBAL BIOGEOCHEMICAL CYCLES ................................................................................................................... 43
7.4 HYDROLOGICAL AND LAND SURFACE MODELLING ................................................................................................ 45
7.5 DROUGHT APPLICATIONS ............................................................................................................................... 47
7.6 METEOROLOGICAL APPLICATIONS .................................................................................................................... 48
8 KNOWN ISSUES AND LIMITATIONS ........................................................................................................ 49
8.1 PASSIVE ECV PRODUCT ................................................................................................................................. 50
8.1.1 Vegetation ..................................................................................................................................... 50
8.1.2 Frozen surfaces and snow ............................................................................................................. 52
8.1.3 Water bodies ................................................................................................................................. 52
8.1.4 Rainfall .......................................................................................................................................... 52
8.1.5 Radio Frequency interference ........................................................................................................ 53
8.2 ACTIVE ECV PRODUCT .................................................................................................................................. 53
8.3 COMBINED ACTIVE + PASSIVE ECV PRODUCT ................................................................................................... 53
8.4 PASSIVE MERGED CCI PRODUCT ...................................................................................................................... 54
8.4.1 Using night-time observations only ............................................................................................... 54
8.5 INTERCALIBRATION OF AMSR-E AND AMSR2 .................................................................................................. 54
8.6 ACTIVE PRODUCT ......................................................................................................................................... 55
8.6.1 Intercalibration of ERS and ASCAT ................................................................................................ 55
8.6.2 Data gaps ...................................................................................................................................... 55
9 DATA ACCESS AND ACKNOWLEDGEMENTS ............................................................................................ 55
9.1 DATA ACCESS .............................................................................................................................................. 55
9.2 DATA READER ............................................................................................................................................. 55
9.3 CONTACT ................................................................................................................................................... 56
9.4 SCIENTIFIC USE ONLY .................................................................................................................................... 56
9.5 NO ONWARD DISTRIBUTION ........................................................................................................................... 56
9.6 INTELLECTUAL PROPERTY RIGHTS .................................................................................................................... 56
9.7 ACKNOWLEDGEMENT AND CITATION ................................................................................................................ 56
9.8 USER FEEDBACK ........................................................................................................................................... 57
10 TERMINOLOGY OF REMOTE SENSING AND EARTH OBSERVATION ......................................................... 57
11 GENERAL REFERENCES ........................................................................................................................... 62
12 REFERENCES SECTION 7 .......................................................................................................................... 65

Soil Moisture ECV Product User Guide (PUG)
Product Version v05.2
Doc Issue 1.0
Date 29-05-2020
vi
List of Figures
Figure 1: Microwave Instruments used for the generation of Soil Moisture ECV Data Products
(version v05.2) ............................................................................................................................ 8
Figure 2: Beams and Wide Swaths of AMI-WS and ASCAT Instruments ................................... 9
Figure 3: Wide Swaths and Daily Global Coverage of AMI-WS (left) and ASCAT (right)............ 9
Figure 4: Construction of the WARP 5 Global Grid used for ASCAT L2 Data ........................... 13
Figure 5: a) Geodesic ISEA4H grid of SMOS; b) regular latitude-longitude grid used for SM
ECV............................................................................................................................................ 14
Figure 6: Principle Data Flow for the generation of Soil Moisture ECV Data Products, an
overview of the processing steps in the ESA CCI SM product generation (v05.2). For more
information see the ATBD. ....................................................................................................... 16
Figure 7: Soil Moisture Anomaly for August 2019 ................................................................... 18
Figure 8: Land mask used for the merged product. The 0.25° grid starts indexing from “lower
left” to the “upper right”. Note that not every grid points are available for all sensors, e.g.
ASCAT retrievals are available between Latitude degrees 80° and –60°. ................................ 38
Figure 9: Mean Pearson correlation coefficient R between ESA CCI soil moisture v03.1 and
GIMMS NDVI3g for the period 1991 to 2013 for a lag time of soil moisture preceding NDVI by
16 days...................................................................................................................................... 45
Figure 10 : Differences in correlations of absolute soil moisture values (left) and anomalies
(right) differences between ESA CCI SM and soil moisture from the first layer of soil of two
offline experiments over 1979-2014. Experiment GE8F has a first layer of soil of 1 cm depth
(0-1cm), GA89 of 7 cm depth (0-7cm). .................................................................................... 49
Figure 11: Error of soil moisture as related to the vegetation optical depth for 3 different
frequency bands (from Parinussa et al. (2011)). ...................................................................... 51
Figure 12: Triple Collocation Analysis (TCA: top) and Rvalue results (bottom) for several soil
moisture datasets, including SMOS LPRM and AMSR-E LPRM, for changing vegetation density
(NDVI). Based on van der Schalie et al. (2018)......................................................................... 52
List of Tables
Table 1: Grid Systems used for Calibrated Measurement Data and SSM Geophysical Parameter
Data .......................................................................................................................................... 14
Table 2 Temporal coverage and volume size of the products. ................................................ 19
Table 3 Global NetCDF Attributes for the ACTIVE product ...................................................... 21
Table 4 Global NetCDF Attributes for the PASSIVE product .................................................... 23
Table 5 Global NetCDF Attributes for the COMBINED product ............................................... 26

Soil Moisture ECV Product User Guide (PUG)
Product Version v05.2
Doc Issue 1.0
Date 29-05-2020
vii
Table 6 Attribute Table for Variable lon ................................................................................... 29
Table 7 Attribute Table for Variable Lat ................................................................................... 29
Table 8 Attribute Table for Variable time (reference time). The type of this variable is double.
.................................................................................................................................................. 29
Table 9 Attribute Table for Variable sm for the ACTIVE product ............................................. 30
Table 10 Attribute Table for Variable sm for the PASSIVE and COMBINED products ............. 30
Table 11 Attribute Table for Variable sm_noise ...................................................................... 30
Table 12 Attribute Table for Variable sm_uncertainty for the PASSIVE and COMBINED products
.................................................................................................................................................. 31
Table 13 Attribute Table for Variable dnflag ........................................................................... 31
Table 14 Attribute Table for Variable flag ................................................................................ 32
Table 15 Attribute Table for Variable freqbandID ................................................................... 33
Table 16 Attribute Table for Variable mode ............................................................................ 34
Table 17 Attribute Table for Variable sensor ........................................................................... 34
Table 18 Attribute Table for Variable t0 .................................................................................. 35
Table 19 sm_uncertainty data provided in the ESA CCI SM Products .................................... 36
Table 20: Applications where ESA CCI SM has been used to improve our Earth system
understanding. Modified from Dorigo and De Jeu (2016). ...................................................... 38
Table 21: Business Domain Terminology: Remote Sensing, Earth Observation, Soil Moisture
.................................................................................................................................................. 57

Soil Moisture ECV Product User Guide (PUG)
Product Version v05.2
Doc Issue 1.0
Date 29-05-2020
viii
Definitions, acronyms and abbreviations
Acronym Full Name
AMI-WS Active Microwave Instrument - Windscat (ERS-1 & 2)
AMSR-E Advanced Microwave Scanning Radiometer-Earth Observing System
ASCAT Advanced Scatterometer (Metop)
ATBD Algorithm Theoretical Basis Document
CCI Climate Change Initiative
CECR Comprehensive Error Characterization Report
DARD Data Access Requirement Document
DMSP Defense Meteorological Satellite Program
DPM Data Processing Model
EASE Equal-Area Scalable Earth
ECV Essential Climate Variable
ERA-Interim ECMWF Reanalysis Interim
ERA-Land ECMWF Reanalysis land water resources dataset
ERS European Remote Sensing Satellite (ESA)
ESA European Space Agency
EUMETSAT European Organisation for the Exploitation of Meteorological Satellites
FTP File Transfer Protocol
GCOS Global Climate Observing System
GLDAS Global Land Data Assimilation System
IODD Input Output Data Description
ISEA Icosahedron Snyder Equal Area
ISEA4H Icosahedron Snyder Equal Area (ISEA) Aperture 4 Hexagonal
JAXA Dokuritsu-gyosei-hojin Uchu Koku Kenkyu Kaihatsu Kiko, (Japan Aerospace Exploration Agency)
JULES Joint UK Land Environment Simulator
LDAS Land Data Assimilation System
MERRA Modern-Era Retrospective Analysis for Research and Applications
METOP Meteorological Operational Satellite (EUMETSAT)
MIRAS Microwave Imaging Radiometer using Aperture Synthesis
NaN Not A Number
NASA National Aeronautics and Space Administration
NetCDF Network Common Data Form

Soil Moisture ECV Product User Guide (PUG)
Product Version v05.2
Doc Issue 1.0
Date 29-05-2020
ix
NWP Numerical Weather Prediction
PDF Probability Distribution Function
PSD Product Specification Document
PUG Product User Guide
RFI Radio Frequency Interference
SAR Synthetic Aperture Radar
SM Soil Moisture
SMMR Scanning Multichannel Microwave Radiometer
SMOS Soil Moisture and Ocean Salinity
SRD System Requirements Document
SSD System Specification Document
SSM Surface Soil Moisture
SSM/I Special Sensor Microwave Imager
SURFEX SURFace EXternalized module
SWI Soil Water Index
TBD to be determined
TMI TRMM Microwave Imager
TRMM Tropical Rainfall Measuring Mission
UTC Coordinated Universal Time

Soil Moisture ECV Product User Guide (PUG)
Product Version v05.2
Doc Issue 1.0
Date 29-05-2020
1
1 Executive Summary
The ESA CCI SM v05.2 product consists of three surface soil moisture data sets: The “ACTIVE
Product” and the “PASSIVE Product” were created by fusing scatterometer and radiometer
soil moisture products, respectively; The “COMBINED Product” is a blended product based on
the former two data sets. Data files are provided as NetCDF-4 classic format and comprise
global merged surface soil moisture datasets at daily temporal resolution. The data set spans
over 40 years covering the period from November 1978 to December 31st 2019.
The theoretical and algorithmic base of the product is described in [RD-3], and reported by
Wagner et al. (2012). The SNR (signal-to-noise-ratio) merging algorithm introduced for the
first time in version 3.2 is described in Gruber et al. (2017), and later updated in Gruber et al.
(2019), and include an overview of the errors of the soil moisture datasets. Further
documentation relating to the product, and reference documents are provided in Section 3
and can be found on the CCI Soil Moisture project web site (http://www.esa-soilmoisture-
cci.org).
The location and full access details to the product are provided to users after completion and
verification of a user registration form. Users can either register to access the product from
the User Registration form on the CCI Soil Moisture Website, or can directly access the
product, without requirement for registration from ESA’s CCI Open Data Portal1.
The product is provided in a format that currently complies with the minimum standard
format requirements as detailed by the CCI data standards working group (DSWG) [RD-11].
For this reason ESA CCI SM v05.2 is provided in NetCDF-4 classic format and is also compliant
with the NetCDF Climate and Forecasting group best practice2 [RD-12].
The ACTIVE product of ESA CCI SM (consisting of soil moisture from the ERS and ASCAT
sensors) uses the latest available version of the H SAF ASCAT SSM product (HSAF 2018).
Improvement of the ACTIVE product of ESA CCI SM is therefore largely dependent from
developments carried out by H SAF. Descriptions of ASCAT Soil Moisture in this document are
just to highlight the differences between Scatterometer/Radiometer derived soil moisture
products and should help the users of ESA CCI SM understand which products fits best for
their purpose.
1 http://cci.esa.int/data 2http://cf-pcmdi.llnl.gov/documents/cf-conventions/latest-cf-conventions-document-1

Soil Moisture ECV Product User Guide (PUG)
Product Version v05.2
Doc Issue 1.0
Date 29-05-2020
2
2 Introduction
2.1 Purpose and structure of the Document
The purpose of the Product User Guide (PUG) is to describe the ECV data product in a manner that is understood by the product user with focus on:
• the geophysical data product content • the product flags and metadata • the data format • the product grid and geographic projection • how people use the product and the tools available, and • known limitations of the product.
Since the users of the soil moisture product come from a wide and varied audience, with
differing levels of knowledge in the field of retrieval of soil moisture information from satellite
observations, this document provides some relevant background aiming to enable a common
understanding. Section 4 provides an overview of the pivotal role that soil moisture plays
within the environment and section 5 provides an overview of its retrieval from earth
observation satellites.
In section 6 the product characteristics are introduced including the geophysical parameters
that are available in the products, their respective data volumes, and the physical structure
and format of the product and associated quality flags and indicators.
Section 7 is largely taken from (Dorigo et al. 2017) and it presents the broadest review, to
date, of the current use and application of the ESA CCI SM product by the wider scientific
community. In this section it is shown how ESA CCI SM has contributed to improved process
understanding in the following Earth system domains: climate variability and change, land-
atmosphere interactions, global biogeochemical cycles, hydrological and land surface
modelling, drought applications, and meteorology. The exhaustive list of references for this
section are presented in Section 12.
Known issues and product limitations, for the data producers point of view, are provided in
Section 8 and picks up on such points as the spatial availability of the data and provides
information on the fraction of days with valid observations over the different periods of the
data set and show fractional observation density across the globe. In Section 9 the opportunity
is taken to provide an overview of key points relating to data access, team contact, and
restates the acknowledgement to be cited in the use of the ECV SM products. Reflecting on
the broad and varied backgrounds of the users Section 10 concludes the PUG with the
provision of some common terminology used within the earth observation domain.

Soil Moisture ECV Product User Guide (PUG)
Product Version v05.2
Doc Issue 1.0
Date 29-05-2020
3
2.2 Target Audience
This document targets users of remotely sensed soil moisture data sets across the various user
domains.
3 Reference Documents
The following references are of relevance to this document.
[RD-1] ESA Climate Change Initiative Plus, Statement of Work, European Space Agency,
ESA_CCI-EOPS-PRGM-SOW-18-0118.
[RD-2] Technical Proposal (Part 3) in response to ESA Climate Change Initiative Plus
AO/1-9322.18/I-NB , Vienna University of Technology.
[RD-3] ATBD, Algorithm Theoretical Baseline Document, D2.1 Version 1, (product
version v05.2) 23trd April 2020, ESA Climate Change Initiative Plus Soil
Moisture Project, http://www.esa-soilmoisture-cci.org
[RD-4] M. Ertl, A. Boresch,(2013) System Specification Document (SSD v2), Version 2.0,
06 December 2013
[RD-5] R. Kidd, D. Chung, W. Dorigo, R. De Jeu, (2013) Input/Output Data Definition
Document (IODD v2), Version 2.0, 19 December 2013
[RD-6] CECR, Comprehensive Error Characterisation Report, Version 0.5, 21 April 2015,
ESA Climate Change Initiative Phase 2 Soil Moisture Project, http://www.esa-
soilmoisture-
cci.org/sites/default/files/documents/public/Deliverables/CCI2_Soil_Moisture
_D2.2.0_CECR_v0.6.pdf
[RD-7] DARD, Data Access Requirements Document, Version 4.4, 11th November 2018,
ESA Climate Change Initiative Phase 2 Soil Moisture Project, http://www.esa-
soilmoisture-
cci.org/sites/default/files/documents/public/Deliverables/CCI2_Soil_Moisture
_D1.3.0_DARD_v04.4.pdf
[RD-8] SRD, System Requirements Document, Version 2.0, 9th June 2015, ESA Climate
Change Initiative Phase 2 Soil Moisture Project
[RD-9] R. Kidd, D. Chung, W. Dorigo, R. De Jeu, (2013), Detailed Processing Model
(DPM), Version 2.2, 18 December 2013

Soil Moisture ECV Product User Guide (PUG)
Product Version v05.2
Doc Issue 1.0
Date 29-05-2020
4
[RD-10] PSD, Product Specification Document, Version 4.5, 2 October 2019, ESA Climate
Change Initiative Plus Soil Moisture Project
[RD-11] ESA, Guidelines for Data Producers - Climate Change Initiative Phase 1, CCI-
PRGM-EOPS-TN-13-0009, Issue 1, Revision 1, Victoria Bennett and Sarah James,
24/05/2013
[RD-12] NetCDF Climate and Forecast (CF) Metadata Conventions: Version 1.7, 10
August 2017, Brian Eaton, Jonathan Gregory, Bob Drach, Karl Taylor, Steve
Hankin, Jon Blower, John Caron, Rich Signell, Phil Bentley, Greg Rappa, Heinke
Höck, Alison Pamment, Martin Juckes, Martin Raspaud
Soil Moisture ECV Product User Guide (PUG)
Product Version v05.2
Doc Issue 1.0
Date 29-05-2020
5
4 Soil Moisture within the environment
The central role of soil moisture for the environment is well known. Its contribution e.g. to
hydrological and agricultural processes, linked to e.g. runoff generation, drought
development, and irrigation, respectively, is evident. Moreover, it significantly impacts the
climate system through feedbacks to the atmosphere. As a source of water for
evapotranspiration over the continents, soil moisture is involved not only in the water but also
in the energy cycle. Approximately 60% of precipitation over land is returned to the
atmosphere as evapotranspiration (Oki and Kanae 2006), and this flux also uses up more than
50% of all net radiation over land (Dirmeyer et al. 2006). The investigations of possible effects
of soil moisture on the climate date back to the 70s and 80s (Shukla and Mintz 1982). In the
recent years soil moisture-climate interactions received an increasing attention (Seneviratne
et al. 2010). Moreover, in 2004 soil moisture was recognised as an essential climate variable
(ECV) and finally added in 2010 to the list of terrestrial ECV by the Global Climate Observation
System (GCOS).
A number of numerical experiments have established the sensitivity of atmospheric fields to
soil moisture dynamics (Diffenbaugh et al. 2007; Fischer et al. 2007a; Jaeger and Seneviratne
2011; Koster et al. 2004a; Seneviratne et al. 2006b). On short time scales, which are relevant
for numerical weather prediction, soil moisture variations seem to have a more significant
influence on the surface energy budget and on the planetary boundary layer structure than
changes in other terrestrial variables such as roughness or albedo (Mahfouf 1991). The
importance of soil moisture for sub-seasonal and seasonal forecasting is also well established
(Koster et al. 2004a; Koster et al. 2010), and is additionally impacted by the memory
associated with soil moisture (Entin et al. 2000; Seneviratne et al. 2006b; Vinnikov et al. 1996;
Wu and Dickinson 2004).
Most of the impacts of soil moisture on the climate system are induced by its coupling to
evapotranspiration, and resulting impacts on temperature and precipitation (Seneviratne et
al. 2010). Strongest feedbacks between land and atmosphere are expected in regions with soil
moisture-limited evapotranspiration regimes, given by the control of soil moisture on
evapotranspiration (Hirschi et al. 2011). Mostly affected are transitional zones located
between wet and dry climates (Koster et al. 2004a; Seneviratne et al. 2006b), where soil
moisture is limiting for evapotranspiration and can strongly vary on both intra-annual and
inter-annual time scales. This coupling has been shown to be of strong relevance for climate
variability in mid-latitude regions, in particular for the occurrence of heat waves (Fischer et al.
2007c). Impacts on precipitation are less consistent across studies, but are found to include a
number of direct and indirect feedbacks (Findell and Eltahir 2003). In the context of climate
change, regions with transitional climate regimes are expected to be shifted poleward, with a
possible increase in climate variability induced by soil moisture feedbacks in regions with
Soil Moisture ECV Product User Guide (PUG)
Product Version v05.2
Doc Issue 1.0
Date 29-05-2020
6
currently wet climate regimes. Supporting numerical studies, recent observational studies
have shown evidence for soil moisture impacts on hot extremes (Hirschi et al. 2011) as well as
global evapotranspiration (Jung et al. 2010).
Furthermore, it is possible that soil moisture anomalies may also affect large-scale circulation
patterns. For the United States, the study of Pal and Eltahir (2003) has suggested that soil
moisture anomalies over relatively small regions may induce floods and droughts not only
locally, but also over distant areas. A relationship between the depletion of early summer soil
moisture and the development of heat lows over the Mediterranean region in late summer
has also been noticed in Haarmsa et al. (2009).
A factor influencing soil moisture-climate interaction is the vegetation. Transpiration is the
evaporation through the plant stomata, which is regulated by several factors including soil
moisture. Therefore, land cover and its variation in time are expected to play a crucial role for
soil moisture-climate interactions. A possible impact of vegetation cover during the European
heat wave 2003 was shown in Zaitchik et al. (2006) by comparing temperature anomalies over
pastures and forests, showing higher heat anomalies over the pastures during the August peak
of the 2003 European summer drought and heat wave. The study by Teuling et al. (2010),
based on measurements from the Fluxnet network, also identified differences in the energy
fluxes over grassland and forest sites during heat wave days, although the results were in
partial contrast to those of Zaitchick et al. (2006). For typical heat wave days, it was found that
the forest led to a higher warming of the atmosphere than grassland, because the former used
less energy for evapotranspiration than the latter. However, the implications are that in the
long term the soil moisture depletion over grassland is faster than over forest, and
consequently grassland would lead to higher warming after long dry and hot periods. This
study highlighted the time-scale dependence of feedbacks between land surface processes
and the climate, and its strong relation to soil moisture dynamics.
All of the mentioned feedbacks and interactions are particularly relevant for drought
development, and especially agricultural (or soil moisture) drought. This is another area where
the increasing availability of soil moisture observations can help investigate and diagnose the
underlying driving processes, e.g. the respective role of large-scale circulation patterns versus
land-atmosphere feedbacks for drought development (Rowell and Jones 2006; Schubert et al.
2004).

Soil Moisture ECV Product User Guide (PUG)
Product Version v05.2
Doc Issue 1.0
Date 29-05-2020
7
5 Soil Moisture Data from Earth Observation Satellites
This section provides a general overview of the different types of data and the methods,
technologies and processes employed to generate the Soil Moisture Data Products from the
measurement to their application/analysis.
5.1 Microwave Instruments onboard Earth Observation Satellites
There are two principal types of remote sensing, corresponding to the following types of
microwave instruments: (a) scatterometers and radars which measure the radar
backscattering coefficient σ0 in physical units [dB] or [m2/m2], and (b) radiometers which
measure the brightness temperature TB in physical unit [K]. Instruments in group (a) are called
active because they use their sown source of electromagnetic energy for the measurement,
while the ones in group (b) are referred to as passive instruments because they measure
energy that is reflected or emitted from the earth surface.
Figure 1 identifies the active (at the bottom) and the passive (at the top) microwave
instruments that are used for the production of the Soil Moisture ECV Data Products, their
hosting satellites, and their times of operation.
• AMI-WS and ASCAT are (active) C-band scatterometer instruments onboard the ERS
and METOP satellites, respectively. Note that AMI-WS is still labelled “SCAT” in the
picture, though the former name is nowadays preferred.
• SMMR, SSM/I, TMI, AMSR-E, AMSR-2, MIRAS, SMAP L-band Radiometer and WindSat
are (passive) multi-frequency radiometer instruments onboard the Nimbus-7, DMSP,
TRMM, Aqua, GCOM-W1, SMOS, SMAP and Coriolis satellites, respectively.
These instruments are characterized by their high suitability for Soil Moisture retrieval and
their technological maturity.
Soil Moisture ECV Product User Guide (PUG)
Product Version v05.2
Doc Issue 1.0
Date 29-05-2020
8
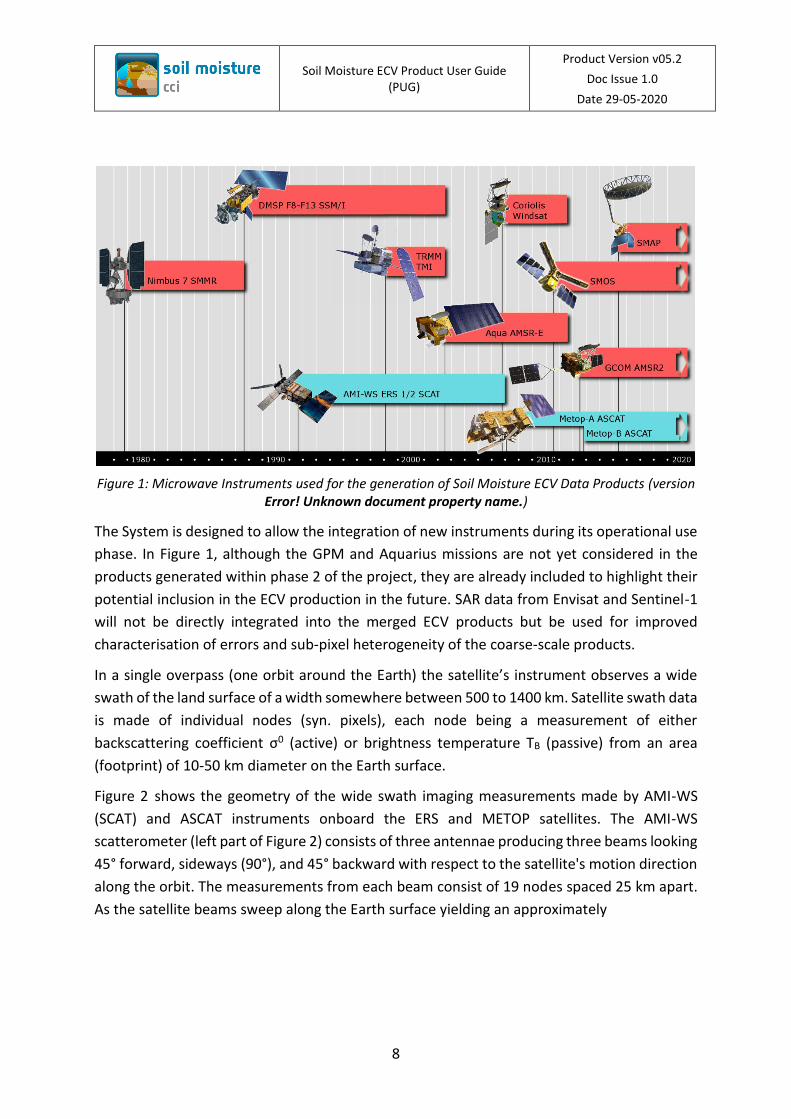
Figure 1: Microwave Instruments used for the generation of Soil Moisture ECV Data Products (version Error! Unknown document property name.)
The System is designed to allow the integration of new instruments during its operational use
phase. In Figure 1, although the GPM and Aquarius missions are not yet considered in the
products generated within phase 2 of the project, they are already included to highlight their
potential inclusion in the ECV production in the future. SAR data from Envisat and Sentinel-1
will not be directly integrated into the merged ECV products but be used for improved
characterisation of errors and sub-pixel heterogeneity of the coarse-scale products.
In a single overpass (one orbit around the Earth) the satellite’s instrument observes a wide
swath of the land surface of a width somewhere between 500 to 1400 km. Satellite swath data
is made of individual nodes (syn. pixels), each node being a measurement of either
backscattering coefficient σ0 (active) or brightness temperature TB (passive) from an area
(footprint) of 10-50 km diameter on the Earth surface.
Figure 2 shows the geometry of the wide swath imaging measurements made by AMI-WS
(SCAT) and ASCAT instruments onboard the ERS and METOP satellites. The AMI-WS
scatterometer (left part of Figure 2) consists of three antennae producing three beams looking
45° forward, sideways (90°), and 45° backward with respect to the satellite's motion direction
along the orbit. The measurements from each beam consist of 19 nodes spaced 25 km apart.
As the satellite beams sweep along the Earth surface yielding an approximately

Soil Moisture ECV Product User Guide (PUG)
Product Version v05.2
Doc Issue 1.0
Date 29-05-2020
9
Figure 2: Beams and Wide Swaths of AMI-WS and ASCAT Instruments
500 km wide swath, each node produces its own σ0 backscatter measurement, integrated over
an area around 50 km in diameter. The three measurements originating from the three beams
during the single satellite overpass are called triplets.
Figure 3: Wide Swaths and Daily Global Coverage of AMI-WS (left) and ASCAT (right)
The ASCAT scatterometer (right part of Figure 2) is similar but consists of three antennae on
either side, producing six beams. The measurements from each beam consists of 21 nodes

Soil Moisture ECV Product User Guide (PUG)
Product Version v05.2
Doc Issue 1.0
Date 29-05-2020
10
spaced 25 km apart (lo-res) or 41 notes spaced 12.5 km apart (hi-res). While the satellite
beams sweep along the earth surface a wide swath is observed on either side.
Figure 3 shows the orbits made by a single ERS satellite (left) and a single METOP satellite
(right) and the wide swaths captured by AMI-WS and ASCAT instruments, respectively, during
one day of observation time. The wide swaths of ASCAT have near-global revisiting times of
2–3 days.
Development of soil moisture retrieval algorithms from active MRS sensors is not part of the
ESA CCI SM project. The latest available H SAF ASCAT SSM CDRs are used as input in ESA CCI
SM. For a detailed description and the latest available products visit http://hsaf.meteoam.it/.
5.2 Data Processing Chain
The payload data received from a satellite passes through a chain of processing which has the
following principal steps:
• Level 0: Reconstructing the raw instrument data from a satellite’s payload data
transmissions received at satellite ground stations, and archiving them at a data
centre.
• Level 1: Converting the raw instrument data of a single overpass swath to calibrated
measurements (observations) of radar backscattering coefficient σ0 in [dB] or [m2/m2]
(in case of active instrument), or brightness temperature TB in [K] (in case of passive
instrument).
• Level 2: Retrieving the Surface Soil Moisture (SSM) geophysical parameter – in physical
units [%] or [m3/m3] – from the calibrated measurements of a single overpass swath.
• Level 3: Generating the consistent and global Soil Moisture ECV Data Products by
merging the SSM timeseries acquired from many satellites over many years – this is
the objective of the system specified herein.
• Level 4: Analysing the lower level data to determine the state or change of state
(events, processes) of regional or global climate systems.
The following section provides a brief survey of the different processing levels tailored to Soil
Moisture. There is also a fine-grained organization within the levels, in terms of sublevels or
product categories, but these are suppressed in the first survey. A full specification of data
processing levels is available in IODD [RD-5].
Levels 0-1:
The steps up to Level 1, from the instrument to the calibrated measurement result, follow the
principles of measurement as outlined in (JCGM 2008), and (JCGM 2012). Note that a
Soil Moisture ECV Product User Guide (PUG)
Product Version v05.2
Doc Issue 1.0
Date 29-05-2020
11
measurement (syn. observation) is not necessarily made with a single antenna, instrument, or
even a single satellite. Crucial is that the individual measurement devices contributing to the
measurement result are synchronized (with sufficient accuracy in space and time) to the
spatial-temporal coherency characteristics of the observed source. Therefore, the calibrated
measurement may be summed from many antennas (e.g. in case of the SMOS MIRAS
instrument, which uses aperture synthesis) or even summed from satellites in formation
flying. In any case, because the observations made at different orbits do not satisfy the
coherency criteria, Level 1 data are observations from a single overpass.
Levels 2-3:
The situation changes for the Levels 2 and 3, which are about the art of estimating values of
quantities that cannot be directly measured with remote sensing instruments. The
mathematical-physical basis for this process is that there is a functional relation between
object parameters X and instrument observables Y. Symbolically, the relation may be written
as Y = f(X) (forward model) or X = g(Y) (inversion). It is known that at any time object
parameters X and observables Y have definite values. Once sufficient information is obtained
from measurements of Y, estimates of X can be determined under certain conditions, if there
is sufficient knowledge of a suitable model or inversion. To indicate this radical difference, this
process is no longer called measurement but “retrieval”.
In the case of the ECV Production System the observed object is an area of the top soil surface
layer (of approx. 25x25 km size and < 2 cm thickness), and the retrieved geophysical parameter
is Soil Moisture, expressed in the physical unit [%] or [m3/m3].
Depending if the measurement was made with an active or a passive microwave instrument,
respectively, either a change detection approach or a forward modelling method is utilized.
Both methods, like geophysical parameter retrieval in general, require use of additional
ancillary data, which can be long-term reference data (historical data, climate data) or model
parameters.
Levels 2 and 3 have in common that the retrieved parameters are local state variables: they
characterize the state of a local and compact object in space (i.e. a local physical system), at a
moment or period in time. They are thus distributions in space (over the land surface in case
of Soil Moisture) and time. The difference between Level 2 and 3 is that the parameter
retrieved by a process of Level 2 adheres to the locality condition of a single Level 1
measurement, while this condition is relaxed at Level 3. In practice, Level 3 is about merging
Level 2 data from different observation times, orbits or instruments.
For full descriptions of the retrieval and merging methods cf. ATBD [RD-3] and (Wagner 2012).
Level 4:
Soil Moisture ECV Product User Guide (PUG)
Product Version v05.2
Doc Issue 1.0
Date 29-05-2020
12
At Level 4 analyses of data from Levels 3, 2 or 1 are performed in order to determine the state
or the change of state of specific geo-physical systems of interest, in particular regional and
global climate systems. Detection of change of state typically involves statistical analysis
methods (e.g. trend analysis) and process model calculations (simulations) using lower level
data as input.
Present at all Levels of the data processing chain (but omitted in the discussion so far) are
processes to determine measures for the degree of definiteness of the resulting data. At Levels
0 and 1 an adequate measure is the measurement uncertainty as described e.g. in (JCGM
2008), and at Levels 2 and 3 the error characterization as described in CECR [RD-6]. We do not
know what measures are used at Level 4 but we note that results of analyses and simulations
may be in the range of evidentiary to indicative.
5.3 Grid Types
The data acquired by a satellite instrument constitute individual measurements per swath
node (actually one measurement result per beam, overpass and swath node) and are spatially
arranged in the geometry of a swath grid, as illustrated in Figure 2. Swath grids are dynamical
(with respect to the Earth surface) because they are a projection made by the moving satellite.
The Level 0 data are necessarily raster data from a swath grid. Typically, Level 1 and 2 data
provided by ESA, EUMETSAT, NASA and JAXA are still in the geometry of swath grids, and
annotated with time- and geo-referencing information to allow inference of time and geo-
location of each swath node. Data in swath grid geometry are usually distributed as one raster
per half-orbit i.e. one raster for the ascending orbit direction and a second raster for the
descending orbit direction. The format of geo-referencing information varies; it may be given
per raster as a whole or even as (latitude, longitude) coordinates per grid node.
Technically, it can be of advantage to map the swath grid nodes, onto a (spatial) global grid3
which is uniformly and statically covering the Earth surface. Cases where mapping to a global
grid is already performed at Level 1 are Nimbus-7 SSMR, DMSP SSM/I and SMOS MIRAS, and
at Level 2 METOP ASCAT. Note that a global grid maps the space dimensions only, while time-
referencing annotation is still maintained for the individual measurements.
Figure 4 shows the equally spaced, equal area WARP 5 global grid used for the ASCAT Level 2
SSM. The principle of construction (indicated in the upper part of Figure 4) is as follows: a)
create equally spaced latitude small circles at distances a, and b) on each latitude circle create
grid points at discrete longitudes, again with a fixed spacing of a. Due to the construction the
3 The technical term is Discrete Global Grid (DGG), however, as we do not know how a non-discrete (i.e. continuous) grid would look like, we do not use this term herein.

Soil Moisture ECV Product User Guide (PUG)
Product Version v05.2
Doc Issue 1.0
Date 29-05-2020
13
global grid has areas with irregularities. The lower part of Figure 4 shows: a) the regularity at
origin, b) the divergence at the North Pole, and c) the dislocation at the 180° meridian.
Figure 4: Construction of the WARP 5 Global Grid used for ASCAT L2 Data
Figure 5 a) shows the geodesic grid used for the SMOS Level 1 and Level 2 data, known as
Icosahedron Snyder Equal Area (ISEA) Aperture 4 Hexagonal (ISEA4H) global grid. This grid is
constructed by a subdivision method. Creating the grid involves subdividing the 20 equilateral
triangles forming the faces of the regular icosahedron into more triangles, yielding 20
hexagons and 12 pentagons on the surface of the sphere (the so-called resolution 1 grid).
Higher resolution grids are formed iteratively by tessellating the obtained shapes.

Soil Moisture ECV Product User Guide (PUG)
Product Version v05.2
Doc Issue 1.0
Date 29-05-2020
14
a)
b)
Figure 5: a) Geodesic ISEA4H grid of SMOS; b) regular latitude-longitude grid used for SM ECV
Figure 5 b) shows a regular latitude-longitude grid. Grid points are equally spaced in the
latitude-longitude coordinate system, however, as can be readily seen in Figure 5, they are
not equally spaced / equal area on the earth surface. This grid type is utilized for the Soil
Moisture ECV Data Products.
Still for technical reason, it can be of advantage to proceed further and to map the value
distributions onto a global space-time grid. This happens usually at Level 3 because it
facilitates combining data from many orbits and satellites. Satellite data mapped to a space-
time grid can be viewed in two ways: For a given time index we have a raster image that can
be projected to and visualized on a geographic map; for a given spatial grid point we have a
timeseries that can be visualized as a graph.
Table 1: Grid Systems used for Calibrated Measurement Data and SSM Geophysical Parameter Data
Active Passive
ERS AMI-
WS
METOP
ASCAT
Nimb.7
SMMR
DMSP
SSM/I
TRMM
TMI
Aqua
AMSR-E
Coriolis
WindSat
SMOS
MIRAS
GCOM-W1
AMSR-2
σ0/TB L1 swath swath EASE EASE swath swath4 swath ISEA4H swath
SSM L2 WARP5 WARP5 lat-lon lat-lon swath swath swath EASE2 swath
4 Product name given in [DARD] is “AMSR-E/Aqua L2A Global Swath Spatially-Resampled Brightness Temperatures“, but we count it as a L1 product. The product is in swath geometry although the name seems to indicate a global grid.

Soil Moisture ECV Product User Guide (PUG)
Product Version v05.2
Doc Issue 1.0
Date 29-05-2020
15
Table 1 lists the grid types used for the Level 1 calibrated measurements of radar
backscattering coefficient σ0 and brightness temperature TB, and the SSM geophysical
parameter data.
In the process of generating the Level 3 Soil Moisture ECV Data Products, the SSM geo-
parameter data available in the different grid types are converted into a common space-time
grid: a latitude-longitude grid (spatial resampling) and a reference time of 0:00 UTC (temporal
resampling). This is the first step to produce a merged and harmonized ECV Data Product on
a global and uniform space-time grid with a spatial resolution of 0.25 degree and a temporal
resolution of one day.
A web-based tool to visualize and search for grid point information (e.g. geo-location, grid
index, surface type) is available here: http://rs.geo.tuwien.ac.at/dv/dgg/
For more information about global grid systems cf. (Kidd 2005) and (Bartalis 2009).
5.4 Data Flow and Soil Moisture Data Processing Modules
Figure 6 shows the Soil Moisture data processing modules of Level 2 and Level 3, the latter
constituting the Soil Moisture ECV Production System (ECVPS, the System). Level 1 input data
are shown at the top, the produced Level 3 ECV Data Products on the bottom. The arrows
indicate the data flow between processing modules.

Soil Moisture ECV Product User Guide (PUG)
Product Version v05.2
Doc Issue 1.0
Date 29-05-2020
16
Figure 6: Principle Data Flow for the generation of Soil Moisture ECV Data Products, an overview of the processing steps in the ESA CCI SM product generation (v05.2). For more information see the ATBD.
The overall setup of systems follows a modular design to make best use of existing European
and international services, and to ensure that new satellites and instruments can be
integrated. As of v05.2, SMAP has also been integrated.
Level 1 calibrated measurements of (active) radar backscattering coefficient and (passive)
brightness temperature, the outputs from the Level 1 processing step, are shown in Figure 6
as items in the section labelled “Level 2” and are available from the major providers of satellite
data ESA, EUMETSAT, NASA and JAXA. A complete listing of the required Level 1 data is
available in DARD [RD-7].
The conversion of the Level 1 calibrated measurements to the Level 2 Surface Soil Moisture
(SSM) geo-parameter is performed individually per instrument:

Soil Moisture ECV Product User Guide (PUG)
Product Version v05.2
Doc Issue 1.0
Date 29-05-2020
17
• SSM parameter retrieval from the calibrated measurements of each (active)
microwave scatterometer instrument is performed with the WARP change detection
algorithm of TUW.
• SSM parameter retrieval from the calibrated measurements of each (passive)
microwave radiometer instrument is performed with the LPRM algorithm of VUA and
NASA.
SSM parameter retrieval is implemented using the established Level 2 services of EUMETSAT,
NASA and JAXA that they provide for the different satellites and instruments. Descriptions of
the processes can be found in DPM [RD-9] sections 4.1 and 4.2 for the active and passive cases,
respectively.
The Soil Moisture ECVPS performs the final processing step, accomplished by three major
modules according to Figure 6:
• Active Merging5: (1.) The full Level 2 SSM data set from each active instrument is
resampled to a global space-time grid, (2.) each timeseries at each grid point is rescaled
to the reference climatology of ASCAT, and (3.) all timeseries at each grid point are
merged to a homogenised “Merged Active-only ECV Data Product”.
• Passive Merging: In principle, follows the same pattern of the Active Merging, but has
some extra complications (pre-processing to convert swath data into timeseries,
decomposition of the AMSR-E and SSM/I timeseries into their seasonality and
anomalies, incremental merging), and the rescaling is made to the reference
climatology of AMSR2, yielding a homogenised “Merged Passive-only ECV Data
Product”. AMSR2 and AMSRE are currently scaled using a linear merging of the last
three years of AMSRE and first three years of AMSR2 to cover the gap, for future
versions this will be replaced and improved using the integration of FengYun 3B data.
• Active-Passive Merging: Instead of using the Active-only and Passive-only ECV Data
Products (v04.x), this in between step is now removed by directly merging all individual
sensor based SSM data into an homogenised “Merged Active-Passive ECV Data
Product”.
For detailed listings and descriptions of the required Level 1 and Level 2 data cf. DARD [RD-7],
for Level 2 see also SRD [RD-8] section 5 and IODD [RD-5]. The internal data flows of the Level
3 ECV generation are specified in IODD. The descriptions of the merging algorithms are in
ATBD [RD-3]. Full process descriptions of the Level 2 active and passive parameter retrieval
modules and the Level 3 ECV generation modules are available in DPM [RD-9].
5 Note that terms ‘merging‘, ‘blending‘ and ‘fusion’ appear in the literature, sometimes synonymously and sometimes with diversified meanings. We do not make a distinction herein and just call it ‘merging’.
Soil Moisture ECV Product User Guide (PUG)
Product Version v05.2
Doc Issue 1.0
Date 29-05-2020
18
5.5 Soil Moisture Data Products
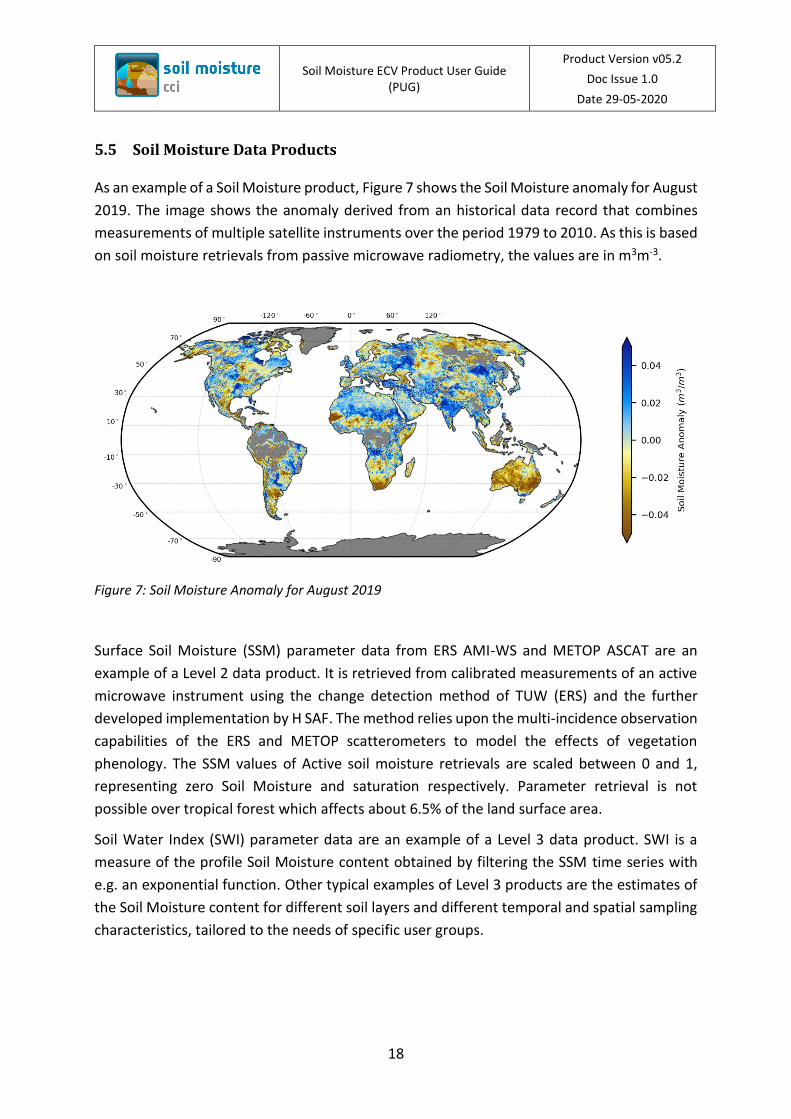
As an example of a Soil Moisture product, Figure 7 shows the Soil Moisture anomaly for August
2019. The image shows the anomaly derived from an historical data record that combines
measurements of multiple satellite instruments over the period 1979 to 2010. As this is based
on soil moisture retrievals from passive microwave radiometry, the values are in m3m-3.
Figure 7: Soil Moisture Anomaly for August 2019
Surface Soil Moisture (SSM) parameter data from ERS AMI-WS and METOP ASCAT are an
example of a Level 2 data product. It is retrieved from calibrated measurements of an active
microwave instrument using the change detection method of TUW (ERS) and the further
developed implementation by H SAF. The method relies upon the multi-incidence observation
capabilities of the ERS and METOP scatterometers to model the effects of vegetation
phenology. The SSM values of Active soil moisture retrievals are scaled between 0 and 1,
representing zero Soil Moisture and saturation respectively. Parameter retrieval is not
possible over tropical forest which affects about 6.5% of the land surface area.
Soil Water Index (SWI) parameter data are an example of a Level 3 data product. SWI is a
measure of the profile Soil Moisture content obtained by filtering the SSM time series with
e.g. an exponential function. Other typical examples of Level 3 products are the estimates of
the Soil Moisture content for different soil layers and different temporal and spatial sampling
characteristics, tailored to the needs of specific user groups.
Soil Moisture ECV Product User Guide (PUG)
Product Version v05.2
Doc Issue 1.0
Date 29-05-2020
19
6 Specification of the products
6.1 Geophysical Parameters
The ACTIVE product is the output of merging scatterometer-based soil moisture data, which
were derived from AMI-WS and ASCAT. The PASSIVE product merges data from SMMR, SSM/I,
TMI, AMSR-E, WindSat, AMSR2, SMOS and SMAP. The COMBINED is directly generated from
the Level 2 products used in both the ACTIVE and PASSIVE products. The data sets have been
produced following the method as described by (Gruber et al. 2017; Liu et al. 2011; Wagner
2012). The SNR blending method first introduced in v03.2 of the dataset is described in
(Gruber et al. 2017). The homogenised and merged products present surface soil moisture
with a global coverage and a spatial resolution of 0.25°, and a temporal resolution of 1 day
with a reference time at 0:00 UTC. The soil moisture data for the PASSIVE and the COMBINED
product are provided in volumetric units [m3m-3], while the ACTIVE soil moisture data are
expressed in percent of saturation [%].
6.2 Product Data Volume
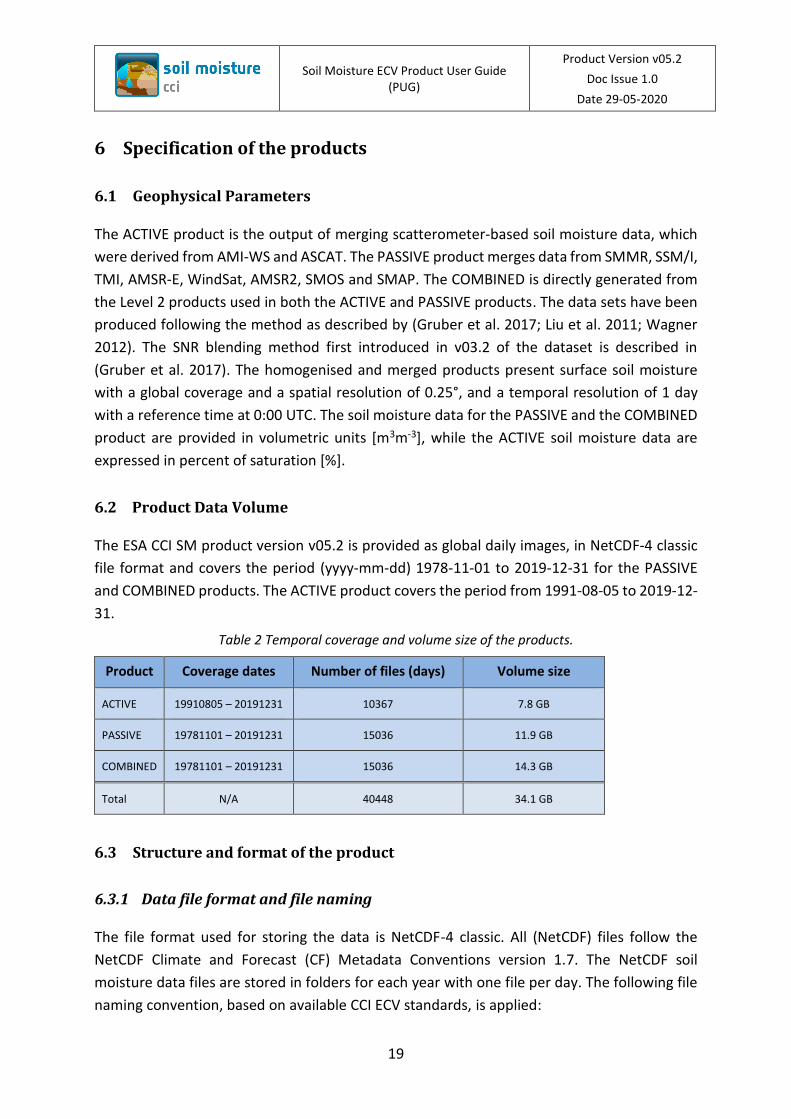
The ESA CCI SM product version v05.2 is provided as global daily images, in NetCDF-4 classic
file format and covers the period (yyyy-mm-dd) 1978-11-01 to 2019-12-31 for the PASSIVE
and COMBINED products. The ACTIVE product covers the period from 1991-08-05 to 2019-12-
31.
Table 2 Temporal coverage and volume size of the products.
Product Coverage dates Number of files (days) Volume size
ACTIVE 19910805 – 20191231 10367 7.8 GB
PASSIVE 19781101 – 20191231 15036 11.9 GB
COMBINED 19781101 – 20191231 15036 14.3 GB
Total N/A 40448 34.1 GB
6.3 Structure and format of the product
6.3.1 Data file format and file naming
The file format used for storing the data is NetCDF-4 classic. All (NetCDF) files follow the
NetCDF Climate and Forecast (CF) Metadata Conventions version 1.7. The NetCDF soil
moisture data files are stored in folders for each year with one file per day. The following file
naming convention, based on available CCI ECV standards, is applied:
Soil Moisture ECV Product User Guide (PUG)
Product Version v05.2
Doc Issue 1.0
Date 29-05-2020
20
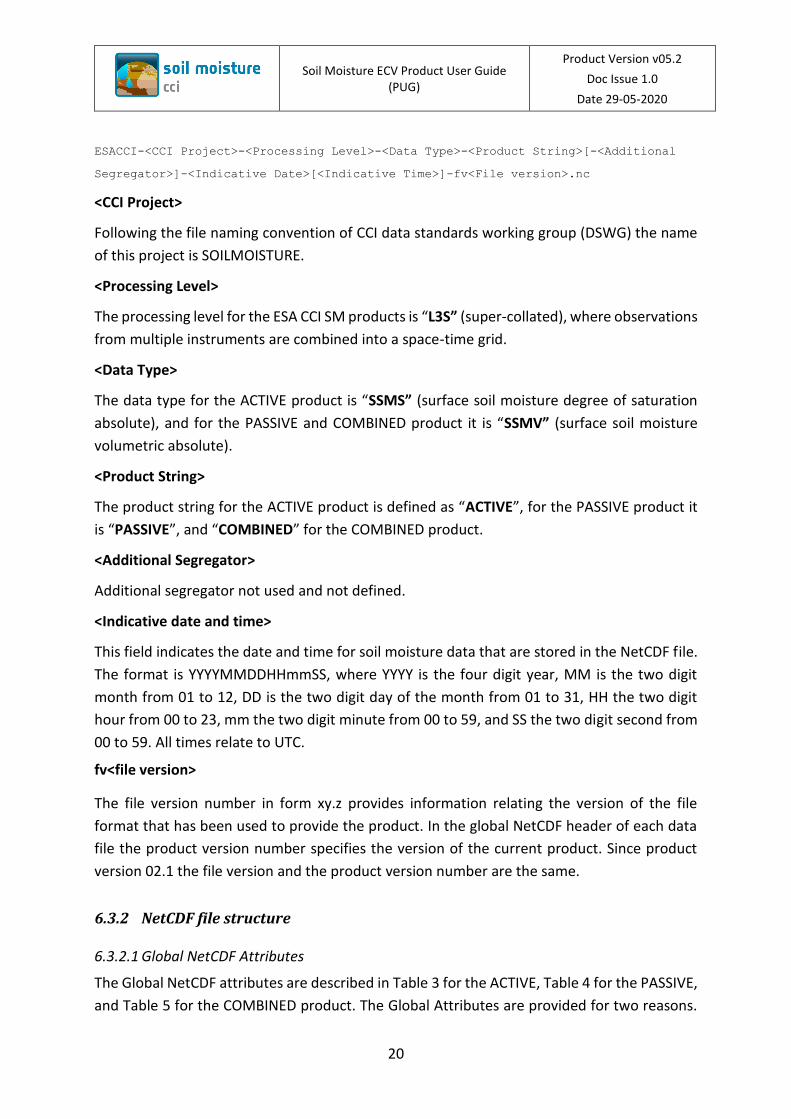
ESACCI-<CCI Project>-<Processing Level>-<Data Type>-<Product String>[-<Additional
Segregator>]-<Indicative Date>[<Indicative Time>]-fv<File version>.nc
<CCI Project>
Following the file naming convention of CCI data standards working group (DSWG) the name
of this project is SOILMOISTURE.
<Processing Level>
The processing level for the ESA CCI SM products is “L3S” (super-collated), where observations
from multiple instruments are combined into a space-time grid.
<Data Type>
The data type for the ACTIVE product is “SSMS” (surface soil moisture degree of saturation
absolute), and for the PASSIVE and COMBINED product it is “SSMV” (surface soil moisture
volumetric absolute).
<Product String>
The product string for the ACTIVE product is defined as “ACTIVE”, for the PASSIVE product it
is “PASSIVE”, and “COMBINED” for the COMBINED product.
<Additional Segregator>
Additional segregator not used and not defined.
<Indicative date and time>
This field indicates the date and time for soil moisture data that are stored in the NetCDF file.
The format is YYYYMMDDHHmmSS, where YYYY is the four digit year, MM is the two digit
month from 01 to 12, DD is the two digit day of the month from 01 to 31, HH the two digit
hour from 00 to 23, mm the two digit minute from 00 to 59, and SS the two digit second from
00 to 59. All times relate to UTC.
fv<file version>
The file version number in form xy.z provides information relating the version of the file
format that has been used to provide the product. In the global NetCDF header of each data
file the product version number specifies the version of the current product. Since product
version 02.1 the file version and the product version number are the same.
6.3.2 NetCDF file structure
6.3.2.1 Global NetCDF Attributes
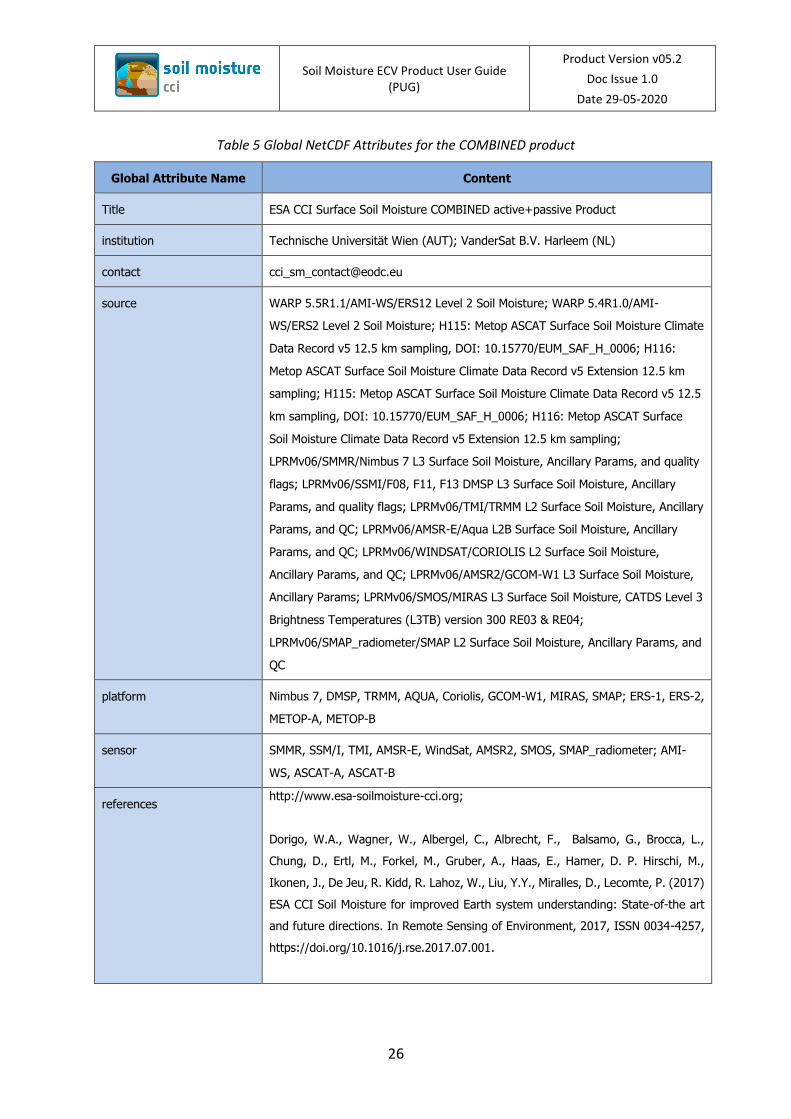
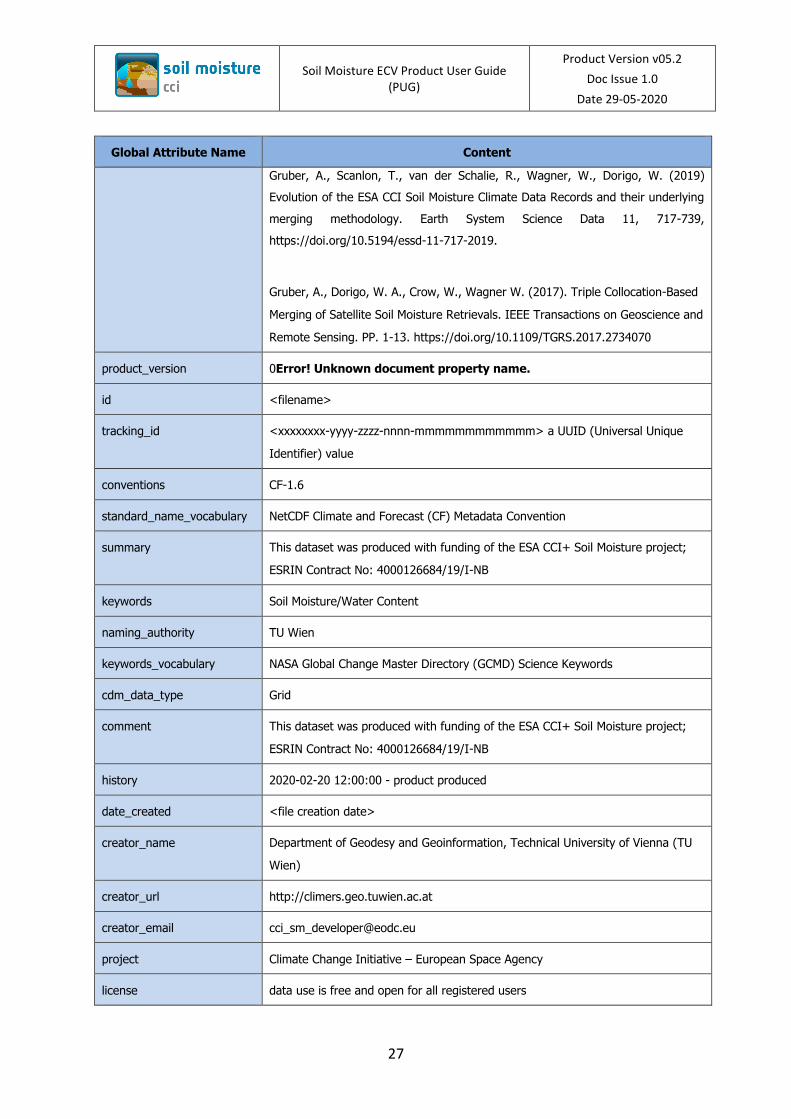
The Global NetCDF attributes are described in Table 3 for the ACTIVE, Table 4 for the PASSIVE,
and Table 5 for the COMBINED product. The Global Attributes are provided for two reasons.
Soil Moisture ECV Product User Guide (PUG)
Product Version v05.2
Doc Issue 1.0
Date 29-05-2020
21
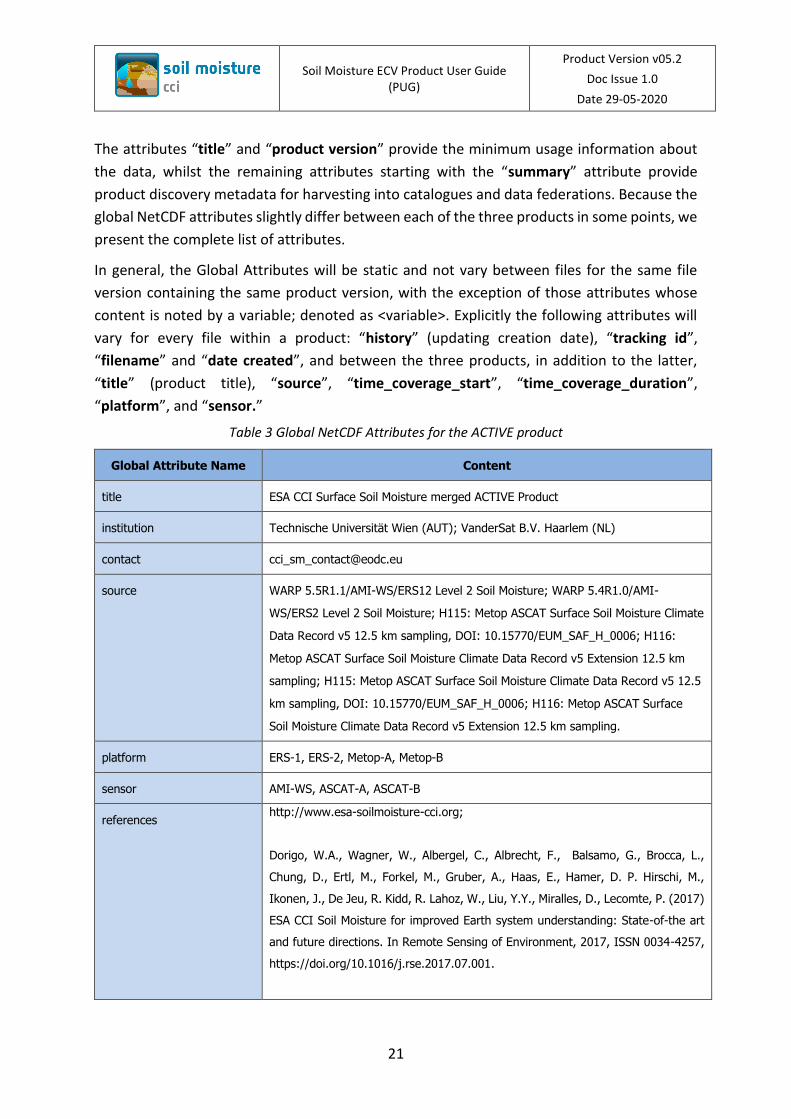
The attributes “title” and “product version” provide the minimum usage information about
the data, whilst the remaining attributes starting with the “summary” attribute provide
product discovery metadata for harvesting into catalogues and data federations. Because the
global NetCDF attributes slightly differ between each of the three products in some points, we
present the complete list of attributes.
In general, the Global Attributes will be static and not vary between files for the same file
version containing the same product version, with the exception of those attributes whose
content is noted by a variable; denoted as <variable>. Explicitly the following attributes will
vary for every file within a product: “history” (updating creation date), “tracking id”,
“filename” and “date created”, and between the three products, in addition to the latter,
“title” (product title), “source”, “time_coverage_start”, “time_coverage_duration”,
“platform”, and “sensor.”
Table 3 Global NetCDF Attributes for the ACTIVE product
Global Attribute Name Content
title ESA CCI Surface Soil Moisture merged ACTIVE Product
institution Technische Universität Wien (AUT); VanderSat B.V. Haarlem (NL)
contact [email protected]
source WARP 5.5R1.1/AMI-WS/ERS12 Level 2 Soil Moisture; WARP 5.4R1.0/AMI-
WS/ERS2 Level 2 Soil Moisture; H115: Metop ASCAT Surface Soil Moisture Climate
Data Record v5 12.5 km sampling, DOI: 10.15770/EUM_SAF_H_0006; H116:
Metop ASCAT Surface Soil Moisture Climate Data Record v5 Extension 12.5 km
sampling; H115: Metop ASCAT Surface Soil Moisture Climate Data Record v5 12.5
km sampling, DOI: 10.15770/EUM_SAF_H_0006; H116: Metop ASCAT Surface
Soil Moisture Climate Data Record v5 Extension 12.5 km sampling.
platform ERS-1, ERS-2, Metop-A, Metop-B
sensor AMI-WS, ASCAT-A, ASCAT-B
references http://www.esa-soilmoisture-cci.org;
Dorigo, W.A., Wagner, W., Albergel, C., Albrecht, F., Balsamo, G., Brocca, L.,
Chung, D., Ertl, M., Forkel, M., Gruber, A., Haas, E., Hamer, D. P. Hirschi, M.,
Ikonen, J., De Jeu, R. Kidd, R. Lahoz, W., Liu, Y.Y., Miralles, D., Lecomte, P. (2017)
ESA CCI Soil Moisture for improved Earth system understanding: State-of-the art
and future directions. In Remote Sensing of Environment, 2017, ISSN 0034-4257,
https://doi.org/10.1016/j.rse.2017.07.001.

Soil Moisture ECV Product User Guide (PUG)
Product Version v05.2
Doc Issue 1.0
Date 29-05-2020
22
Global Attribute Name Content
Gruber, A., Scanlon, T., van der Schalie, R., Wagner, W., Dorigo, W. (2019)
Evolution of the ESA CCI Soil Moisture Climate Data Records and their underlying
merging methodology. Earth System Science Data 11, 717-739,
https://doi.org/10.5194/essd-11-717-2019.
Gruber, A., Dorigo, W. A., Crow, W., Wagner W. (2017). Triple Collocation-Based
Merging of Satellite Soil Moisture Retrievals. IEEE Transactions on Geoscience and
Remote Sensing. PP. 1-13. https://doi.org/10.1109/TGRS.2017.2734070
product_version v05.2
id <filename>
tracking_id <xxxxxxxx-yyyy-zzzz-nnnn-mmmmmmmmmmmm> a UUID (Universal Unique
Identifier) value
conventions CF-1.6
standard_name_vocabulary NetCDF Climate and Forecast (CF) Metadata Convention
summary This dataset was produced with funding of the ESA CCI+ Soil Moisture project;
ESRIN Contract No: 4000126684/19/I-NB
keywords Soil Moisture/Water Content
naming_authority TU Wien
keywords_vocabulary NASA Global Change Master Directory (GCMD) Science Keywords
cdm_data_type Grid
comment This dataset was produced with funding of the ESA CCI+ Soil Moisture project;
ESRIN Contract No: 4000126684/19/I-NB
history 2020-02-20 12:00:00 - product produced
date_created <file creation date>
creator_name Department of Geodesy and Geoinformation, Technical University of Vienna (TU
Wien)
creator_url http://climers.geo.tuwien.ac.at
creator_email [email protected]
project Climate Change Initiative – European Space Agency
license data use is free and open for all registered users

Soil Moisture ECV Product User Guide (PUG)
Product Version v05.2
Doc Issue 1.0
Date 29-05-2020
23
Global Attribute Name Content
time_coverage_start 19910805T000000Z
time_coverage_ed 20191231T235959Z
time_coverage_duration P28Y
time_coverage_resolution P1D
geospatial_lat_min -90.0
geospatial_lat_max 90.0
geospatial_lon_min -180.0
geospatial_lon_max 180.0
geospatial_vertical_min 0.0
geospatial_vertical_max 0.0
geospatial_lat_units degrees_north
geospatial_lon_units degrees_east
geospatial_lat_resolution 0.25 degree
geospatial_lon_resolution 0.25 degree
spatial_resolution 25km
Table 4 Global NetCDF Attributes for the PASSIVE product
Global Attribute Name Content
title ESA CCI Surface Soil Moisture merged PASSIVE Product
institution Technische Universität Wien (AUT); VanderSat B.V. Harleem (NL)
contact [email protected]
source LPRMv06/SMMR/Nimbus 7 L3 Surface Soil Moisture, Ancillary Params, and quality
flags; LPRMv06/SSMI/F08, F11, F13 DMSP L3 Surface Soil Moisture, Ancillary
Params, and quality flags; LPRMv06/TMI/TRMM L2 Surface Soil Moisture, Ancillary
Params, and QC; LPRMv06/AMSR-E/Aqua L2B Surface Soil Moisture, Ancillary
Params, and QC; LPRMv06/WINDSAT/CORIOLIS L2 Surface Soil Moisture,
Ancillary Params, and QC; LPRMv06/AMSR2/GCOM-W1 L3 Surface Soil Moisture,
Ancillary Params; LPRMv06/SMOS/MIRAS L3 Surface Soil Moisture, CATDS Level 3
Brightness Temperatures (L3TB) version 300 RE03 & RE04;

Soil Moisture ECV Product User Guide (PUG)
Product Version v05.2
Doc Issue 1.0
Date 29-05-2020
24
Global Attribute Name Content
LPRMv06/SMAP_radiometer/SMAP L2 Surface Soil Moisture, Ancillary Params, and
QC.
platform Nimbus 7, DMSP, TRMM, AQUA, Coriolis, GCOM-W1, MIRAS, SMAP
sensor SMMR, SSM/I, TMI, AMSR-E, WindSat, AMSR2, SMOS, SMAP_radiometer
references http://www.esa-soilmoisture-cci.org;
Dorigo, W.A., Wagner, W., Albergel, C., Albrecht, F., Balsamo, G., Brocca, L.,
Chung, D., Ertl, M., Forkel, M., Gruber, A., Haas, E., Hamer, D. P. Hirschi, M.,
Ikonen, J., De Jeu, R. Kidd, R. Lahoz, W., Liu, Y.Y., Miralles, D., Lecomte, P. (2017)
ESA CCI Soil Moisture for improved Earth system understanding: State-of-the art
and future directions. In Remote Sensing of Environment, 2017, ISSN 0034-4257,
https://doi.org/10.1016/j.rse.2017.07.001.
Gruber, A., Scanlon, T., van der Schalie, R., Wagner, W., Dorigo, W. (2019)
Evolution of the ESA CCI Soil Moisture Climate Data Records and their underlying
merging methodology. Earth System Science Data 11, 717-739,
https://doi.org/10.5194/essd-11-717-2019.
Gruber, A., Dorigo, W. A., Crow, W., Wagner W. (2017). Triple Collocation-Based
Merging of Satellite Soil Moisture Retrievals. IEEE Transactions on Geoscience and
Remote Sensing. PP. 1-13. https://doi.org/10.1109/TGRS.2017.2734070
product_version 0Error! Unknown document property name.
id <filename>
tracking_id <xxxxxxxx-yyyy-zzzz-nnnn-mmmmmmmmmmmm> a UUID (Universal Unique
Identifier) value
conventions CF-1.6
standard_name_vocabulary NetCDF Climate and Forecast (CF) Metadata Convention
summary This dataset was produced with funding of the ESA CCI+ Soil Moisture project;
ESRIN Contract No: 4000126684/19/I-NB
keywords Soil Moisture/Water Content
naming_authority TU Wien
keywords_vocabulary NASA Global Change Master Directory (GCMD) Science Keywords
cdm_data_type Grid

Soil Moisture ECV Product User Guide (PUG)
Product Version v05.2
Doc Issue 1.0
Date 29-05-2020
25
Global Attribute Name Content
comment This dataset was produced with funding of the ESA CCI+ Soil Moisture project;
ESRIN Contract No: 4000126684/19/I-NB
history 2020-02-20 12:00:00 - product produced
date_created <file creation date>
creator_name Department of Geodesy and Geoinformation, Technical University of Vienna (TU
Wien)
creator_url http://climers.geo.tuwien.ac.at
creator_email [email protected]
project Climate Change Initiative – European Space Agency
license data use is free and open for all registered users
time_coverage_start 19781101T000000Z
time_coverage_end 20191231T235959Z
time_coverage_duration P41Y
time_coverage_resolution P1D
geospatial_lat_min -90.0
geospatial_lat_max 90.0
geospatial_lon_min -180.0
geospatial_lon_max 180.0
geospatial_vertical_min 0.0
geospatial_vertical_max 0.0
geospatial_lat_units degrees_north
geospatial_lon_units degrees_east
geospatial_lat_resolution 0.25 degree
geospatial_lon_resolution 0.25 degree
spatial_resolution 25km
Soil Moisture ECV Product User Guide (PUG)
Product Version v05.2
Doc Issue 1.0
Date 29-05-2020
26
Table 5 Global NetCDF Attributes for the COMBINED product
Global Attribute Name Content
Title ESA CCI Surface Soil Moisture COMBINED active+passive Product
institution Technische Universität Wien (AUT); VanderSat B.V. Harleem (NL)
contact [email protected]
source WARP 5.5R1.1/AMI-WS/ERS12 Level 2 Soil Moisture; WARP 5.4R1.0/AMI-
WS/ERS2 Level 2 Soil Moisture; H115: Metop ASCAT Surface Soil Moisture Climate
Data Record v5 12.5 km sampling, DOI: 10.15770/EUM_SAF_H_0006; H116:
Metop ASCAT Surface Soil Moisture Climate Data Record v5 Extension 12.5 km
sampling; H115: Metop ASCAT Surface Soil Moisture Climate Data Record v5 12.5
km sampling, DOI: 10.15770/EUM_SAF_H_0006; H116: Metop ASCAT Surface
Soil Moisture Climate Data Record v5 Extension 12.5 km sampling;
LPRMv06/SMMR/Nimbus 7 L3 Surface Soil Moisture, Ancillary Params, and quality
flags; LPRMv06/SSMI/F08, F11, F13 DMSP L3 Surface Soil Moisture, Ancillary
Params, and quality flags; LPRMv06/TMI/TRMM L2 Surface Soil Moisture, Ancillary
Params, and QC; LPRMv06/AMSR-E/Aqua L2B Surface Soil Moisture, Ancillary
Params, and QC; LPRMv06/WINDSAT/CORIOLIS L2 Surface Soil Moisture,
Ancillary Params, and QC; LPRMv06/AMSR2/GCOM-W1 L3 Surface Soil Moisture,
Ancillary Params; LPRMv06/SMOS/MIRAS L3 Surface Soil Moisture, CATDS Level 3
Brightness Temperatures (L3TB) version 300 RE03 & RE04;
LPRMv06/SMAP_radiometer/SMAP L2 Surface Soil Moisture, Ancillary Params, and
QC
platform Nimbus 7, DMSP, TRMM, AQUA, Coriolis, GCOM-W1, MIRAS, SMAP; ERS-1, ERS-2,
METOP-A, METOP-B
sensor SMMR, SSM/I, TMI, AMSR-E, WindSat, AMSR2, SMOS, SMAP_radiometer; AMI-
WS, ASCAT-A, ASCAT-B
references http://www.esa-soilmoisture-cci.org;
Dorigo, W.A., Wagner, W., Albergel, C., Albrecht, F., Balsamo, G., Brocca, L.,
Chung, D., Ertl, M., Forkel, M., Gruber, A., Haas, E., Hamer, D. P. Hirschi, M.,
Ikonen, J., De Jeu, R. Kidd, R. Lahoz, W., Liu, Y.Y., Miralles, D., Lecomte, P. (2017)
ESA CCI Soil Moisture for improved Earth system understanding: State-of-the art
and future directions. In Remote Sensing of Environment, 2017, ISSN 0034-4257,
https://doi.org/10.1016/j.rse.2017.07.001.
Soil Moisture ECV Product User Guide (PUG)
Product Version v05.2
Doc Issue 1.0
Date 29-05-2020
27
Global Attribute Name Content
Gruber, A., Scanlon, T., van der Schalie, R., Wagner, W., Dorigo, W. (2019)
Evolution of the ESA CCI Soil Moisture Climate Data Records and their underlying
merging methodology. Earth System Science Data 11, 717-739,
https://doi.org/10.5194/essd-11-717-2019.
Gruber, A., Dorigo, W. A., Crow, W., Wagner W. (2017). Triple Collocation-Based
Merging of Satellite Soil Moisture Retrievals. IEEE Transactions on Geoscience and
Remote Sensing. PP. 1-13. https://doi.org/10.1109/TGRS.2017.2734070
product_version 0Error! Unknown document property name.
id <filename>
tracking_id <xxxxxxxx-yyyy-zzzz-nnnn-mmmmmmmmmmmm> a UUID (Universal Unique
Identifier) value
conventions CF-1.6
standard_name_vocabulary NetCDF Climate and Forecast (CF) Metadata Convention
summary This dataset was produced with funding of the ESA CCI+ Soil Moisture project;
ESRIN Contract No: 4000126684/19/I-NB
keywords Soil Moisture/Water Content
naming_authority TU Wien
keywords_vocabulary NASA Global Change Master Directory (GCMD) Science Keywords
cdm_data_type Grid
comment This dataset was produced with funding of the ESA CCI+ Soil Moisture project;
ESRIN Contract No: 4000126684/19/I-NB
history 2020-02-20 12:00:00 - product produced
date_created <file creation date>
creator_name Department of Geodesy and Geoinformation, Technical University of Vienna (TU
Wien)
creator_url http://climers.geo.tuwien.ac.at
creator_email [email protected]
project Climate Change Initiative – European Space Agency
license data use is free and open for all registered users

Soil Moisture ECV Product User Guide (PUG)
Product Version v05.2
Doc Issue 1.0
Date 29-05-2020
28
Global Attribute Name Content
time_coverage_start 19781101T000000Z
time_coverage_ed 20191231T235959Z
time_coverage_duration P41Y
time_coverage_resolution P1D
geospatial_lat_min -90.0
geospatial_lat_max 90.0
geospatial_lon_min -180.0
geospatial_lon_max 180.0
geospatial_vertical_min 0.0
geospatial_vertical_max 0.0
geospatial_lat_units degrees_north
geospatial_lon_units degrees_east
geospatial_lat_resolution 0.25 degree
geospatial_lon_resolution 0.25 degree
spatial_resolution 25km

Soil Moisture ECV Product User Guide (PUG)
Product Version v05.2
Doc Issue 1.0
Date 29-05-2020
29
6.3.2.2 NetCDF Data File Variables and Attributes
lon
Table 6 Attribute Table for Variable lon
NetCDF Attribute Description
standard_name longitude
units degrees_east
valid_range [-180.0, 180.0]
_CoordinateAxisType Lon
lat
Table 7 Attribute Table for Variable Lat
NetCDF Attribute Description
standard_name latitude
units degrees_north
valid_range [-90.0, 90.0]
_CoordinateAxisType Lat
time
Table 8 Attribute Table for Variable time (reference time). The type of this variable is double.
NetCDF Attribute Description
standard_name Time
units days since 1970-01-01 00:00:00 UTC
calendar Standard
_CoordinateAxisType Time

Soil Moisture ECV Product User Guide (PUG)
Product Version v05.2
Doc Issue 1.0
Date 29-05-2020
30
sm (ACTIVE product)
Table 9 Attribute Table for Variable sm for the ACTIVE product
NetCDF Attribute Description
long_name Percent of Saturation Soil Moisture
units percent
_CoordinateAxes lat lon time
_FillValue -9999.0 (NaN); type: float32 (4 bytes)
sm (PASSIVE and COMBINED product)
Table 10 Attribute Table for Variable sm for the PASSIVE and COMBINED products
NetCDF Attribute Description
long_name Volumetric Soil Moisture
units m3m-3
_CoordinateAxes lat lon time
_FillValue -9999.0 (NaN); type: float32 (4 bytes)
sm_uncertainty (ACTIVE product)
Table 11 Attribute Table for Variable sm_noise
NetCDF Attribute Description
long_name Percent of Saturation Soil Moisture Uncertainty
Units percent
_CoordinateAxes lat lon time
_FillValue -9999.0 (NaN); type: float32 (4 bytes)

Soil Moisture ECV Product User Guide (PUG)
Product Version v05.2
Doc Issue 1.0
Date 29-05-2020
31
sm_uncertainty (PASSIVE and COMBINED product)
Table 12 Attribute Table for Variable sm_uncertainty for the PASSIVE and COMBINED products
NetCDF Attribute Description
long_name Volumetric Soil Moisture Uncertainty
Units m3 m-3
_CoordinateAxes lat lon time
_FillValue -9999.0 (NaN); type: float32 (4 bytes)
dnflag
Table 13 Attribute Table for Variable dnflag
NetCDF Attribute Description
long_name Day / Night Flag
flag_values [0, 1, 2, 3]
flag_meanings 0 = NaN
1 = day
2 = night
3 = combination of day and night
_CoordinateAxes lat lon time
_FillValue 0 (NaN); type: signed byte
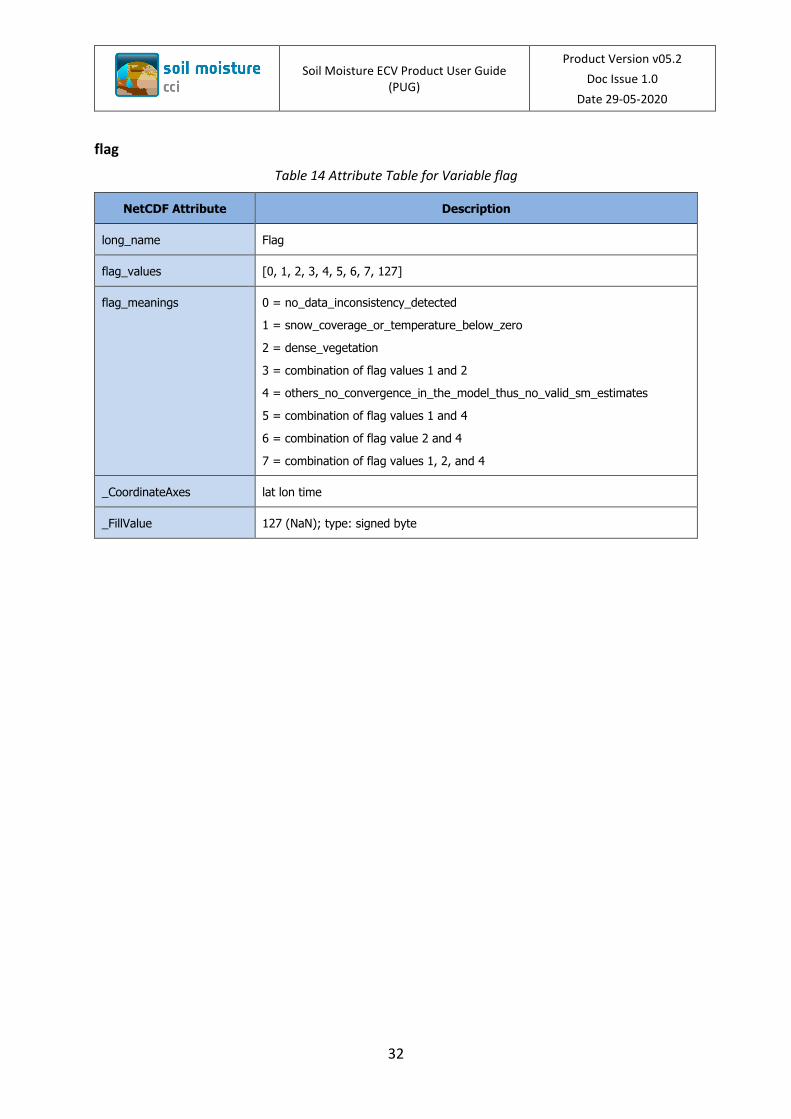
Soil Moisture ECV Product User Guide (PUG)
Product Version v05.2
Doc Issue 1.0
Date 29-05-2020
32
flag
Table 14 Attribute Table for Variable flag
NetCDF Attribute Description
long_name Flag
flag_values [0, 1, 2, 3, 4, 5, 6, 7, 127]
flag_meanings 0 = no_data_inconsistency_detected
1 = snow_coverage_or_temperature_below_zero
2 = dense_vegetation
3 = combination of flag values 1 and 2
4 = others_no_convergence_in_the_model_thus_no_valid_sm_estimates
5 = combination of flag values 1 and 4
6 = combination of flag value 2 and 4
7 = combination of flag values 1, 2, and 4
_CoordinateAxes lat lon time
_FillValue 127 (NaN); type: signed byte

Soil Moisture ECV Product User Guide (PUG)
Product Version v05.2
Doc Issue 1.0
Date 29-05-2020
33
freqbandID
Table 15 Attribute Table for Variable freqbandID
NetCDF Attribute Description
long_name Frequency Band Identification
flag_values [0, 1, 2, 3, 4, 8, 9, 10, 11, 16, 17, 18, 19, 24, 25, 26, 27, 32, 33, 34, 35, 64, 65,
66, 67, 72, 73, 74, 75, 80, 81, 82, 83, 128, 130]
flag_meanings Flag values and their meaning
Value Meaning Value Meaning Value Meaning 0 NaN 19 L14+C53+C69 67 L14+C53+X107
1 L14 24 C68+C69 72 C68+X107
2 C53 25 L14+C68+C69 73 L14+C68+X107
3 L14+C53 26 C53+C68+C69 74 C53+C68+X107
4 C66 27 L14+C53+C68+C69 75 L14+C53+C68+X107
8 C68 32 C73 80 C69+X107
9 L14+C68 33 L14+C73 81 L14+C69+X107
10 C53+C68 34 C53+C73 82 C53+C69+X107
11 L14+C53+C68 35 L14+C53+C73 83 L14+C53+C69+X107
16 C69 64 X107 128 K194
17 L14+C69 65 L14+X107 130 C53+K194
18 C53+C69 66 C53+X107
List of major codes and the corresponding frequency bands
Binary Decimal Frequency [GHz] BandID 00000000 0 NaN N/A
00000001 1 1.4 L14
00000010 2 5.3 / 5.255 C53
00000100 4 6.6 C66
00001000 8 6.8 C68
00010000 16 6.9 / 6.93 C69
00100000 32 7.3 C73
01000000 64 10.65 / 10.7 X10⁷
10000000 128 19.35 / 19.4 K194
Sensors and their operating frequencies:
Sensor Operating Frequency [GHz] SMMR 6.6 / 10.7
SSM/I 19.35
TMI 10.65
AMSR-E 6.93 / 10.65
AMSR2 6.93 / 7.3 / 10.65
WindSat 6.8 / 10.7
SMOS 1.4
SMAP 1.4
AMI-WS 5.3
ASCAT-A/B 5.255
_CoordinateAxes lat lon time
_FillValue 0 (NaN); type: signed integer
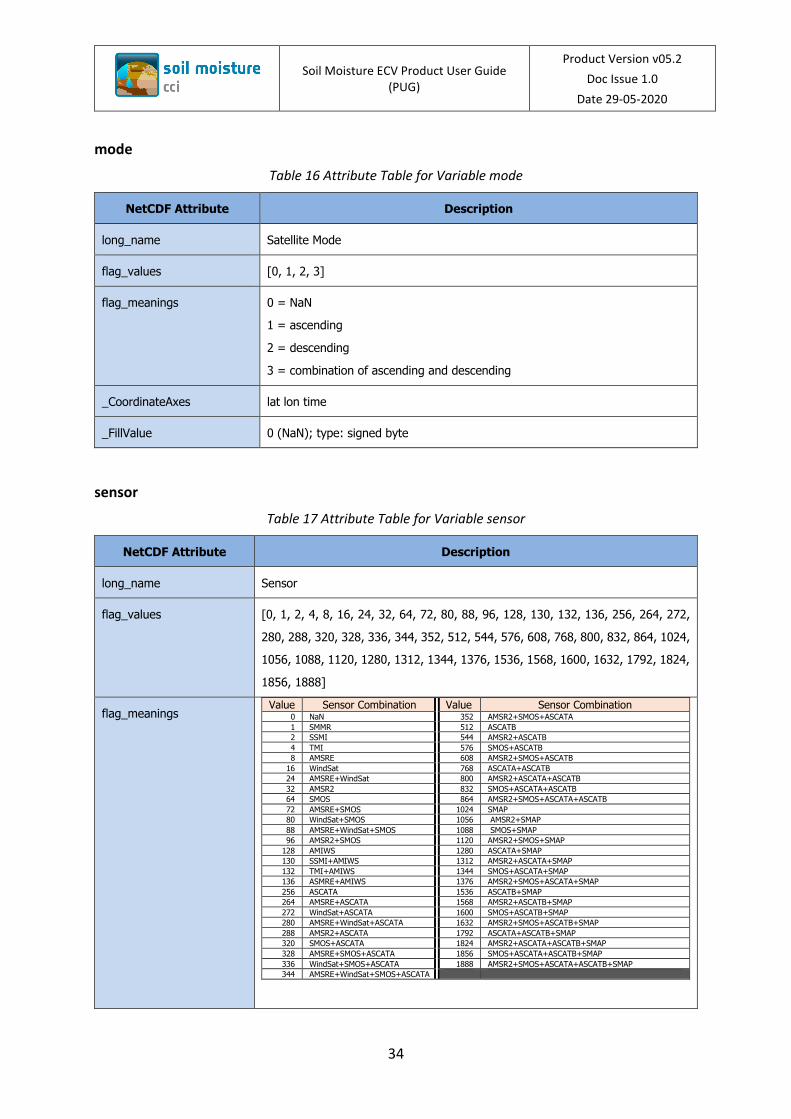
Soil Moisture ECV Product User Guide (PUG)
Product Version v05.2
Doc Issue 1.0
Date 29-05-2020
34
mode
Table 16 Attribute Table for Variable mode
NetCDF Attribute Description
long_name Satellite Mode
flag_values [0, 1, 2, 3]
flag_meanings 0 = NaN
1 = ascending
2 = descending
3 = combination of ascending and descending
_CoordinateAxes lat lon time
_FillValue 0 (NaN); type: signed byte
sensor
Table 17 Attribute Table for Variable sensor
NetCDF Attribute Description
long_name Sensor
flag_values [0, 1, 2, 4, 8, 16, 24, 32, 64, 72, 80, 88, 96, 128, 130, 132, 136, 256, 264, 272,
280, 288, 320, 328, 336, 344, 352, 512, 544, 576, 608, 768, 800, 832, 864, 1024,
1056, 1088, 1120, 1280, 1312, 1344, 1376, 1536, 1568, 1600, 1632, 1792, 1824,
1856, 1888]
flag_meanings Value Sensor Combination Value Sensor Combination
0 NaN 352 AMSR2+SMOS+ASCATA
1 SMMR 512 ASCATB
2 SSMI 544 AMSR2+ASCATB
4 TMI 576 SMOS+ASCATB
8 AMSRE 608 AMSR2+SMOS+ASCATB
16 WindSat 768 ASCATA+ASCATB
24 AMSRE+WindSat 800 AMSR2+ASCATA+ASCATB
32 AMSR2 832 SMOS+ASCATA+ASCATB
64 SMOS 864 AMSR2+SMOS+ASCATA+ASCATB
72 AMSRE+SMOS 1024 SMAP
80 WindSat+SMOS 1056 AMSR2+SMAP
88 AMSRE+WindSat+SMOS 1088 SMOS+SMAP
96 AMSR2+SMOS 1120 AMSR2+SMOS+SMAP
128 AMIWS 1280 ASCATA+SMAP
130 SSMI+AMIWS 1312 AMSR2+ASCATA+SMAP
132 TMI+AMIWS 1344 SMOS+ASCATA+SMAP
136 ASMRE+AMIWS 1376 AMSR2+SMOS+ASCATA+SMAP
256 ASCATA 1536 ASCATB+SMAP
264 AMSRE+ASCATA 1568 AMSR2+ASCATB+SMAP
272 WindSat+ASCATA 1600 SMOS+ASCATB+SMAP
280 AMSRE+WindSat+ASCATA 1632 AMSR2+SMOS+ASCATB+SMAP
288 AMSR2+ASCATA 1792 ASCATA+ASCATB+SMAP
320 SMOS+ASCATA 1824 AMSR2+ASCATA+ASCATB+SMAP
328 AMSRE+SMOS+ASCATA 1856 SMOS+ASCATA+ASCATB+SMAP
336 WindSat+SMOS+ASCATA 1888 AMSR2+SMOS+ASCATA+ASCATB+SMAP
344 AMSRE+WindSat+SMOS+ASCATA

Soil Moisture ECV Product User Guide (PUG)
Product Version v05.2
Doc Issue 1.0
Date 29-05-2020
35
_CoordinateAxes lat lon time
_FillValue 0 (NaN); type: signed integer
t0
Table 18 Attribute Table for Variable t0
NetCDF Attribute Description
long_name Observation Time Stamp
units days since 1970-01-01 00:00:00 UTC
valid_range <individual decimal numbers depending on observation timestamp>
_CoordinateAxes lat lon time
_FillValue -9999.0; type: double
6.4 Annotation datasets
The surface soil moisture data (sm) are generated by blending passive and active microwave
soil moisture retrievals. The data provided are in percentage of saturation [%] units for the
ACTIVE product, and volumetric [m3m-3] units for the PASSIVE and COMBINED products.
Quality Flags and Indicators.
6.4.1 sm_uncertainty
The merging of soil moisture data from different sensors requires a harmonization of the data.
The data need to be brought into a common climatology by running them through several
scaling procedures performing the cumulative distribution function (CDF-) matching
technique. The provided “sm_uncertainty” parameter represents the error variance of the
data sets (in the respective climatology of the dataset), estimated through triple collocation
(TC) analysis. In periods where TC cannot be applied, or in cases where the TC-based error
variance estimates do not converge, sm_uncertainty is set to NaN. The unit of sm_uncertainty
for the ACTIVE product is percentage of saturation [%]. For the PASSIVE and the COMBINED
product the unit is volumetric [m3m-3]. For the ACTIVE and the PASSIVE products, the error
variance is directly estimated using TC analysis. For the COMBINED product, these estimates
are propagated through the SNR blending model using a standard error propagation scheme.
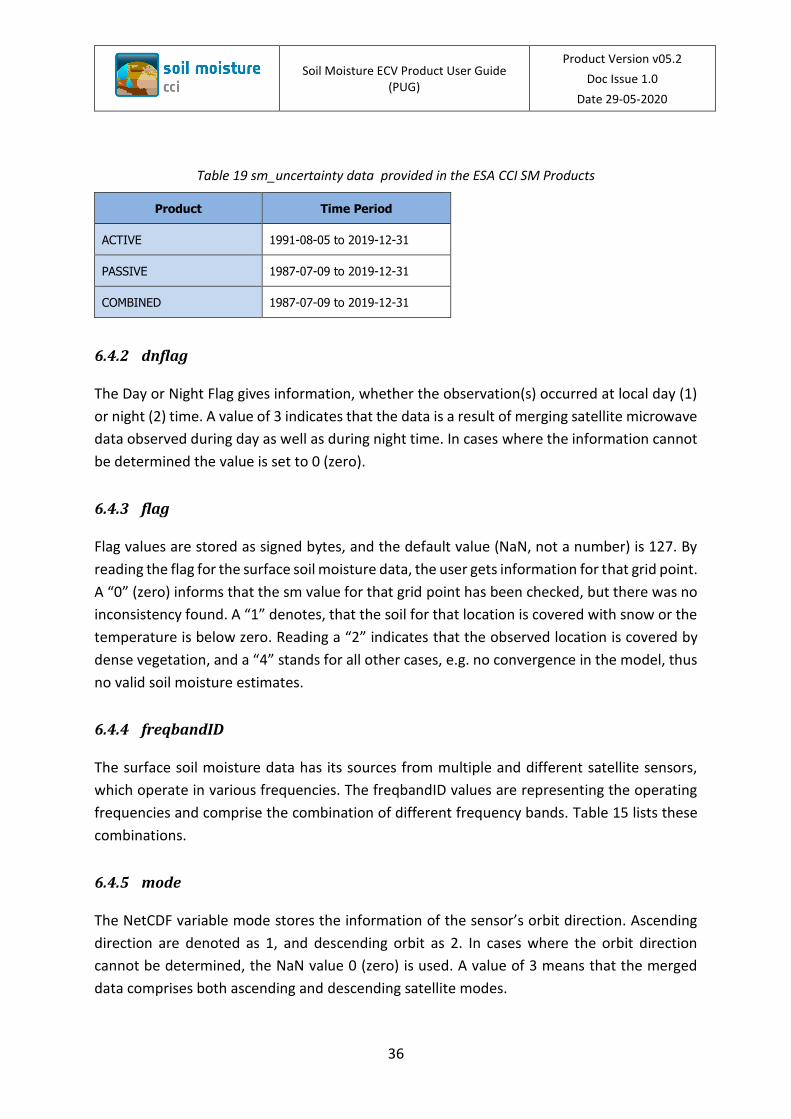
Soil Moisture ECV Product User Guide (PUG)
Product Version v05.2
Doc Issue 1.0
Date 29-05-2020
36
Table 19 sm_uncertainty data provided in the ESA CCI SM Products
Product Time Period
ACTIVE 1991-08-05 to 2019-12-31
PASSIVE 1987-07-09 to 2019-12-31
COMBINED 1987-07-09 to 2019-12-31
6.4.2 dnflag
The Day or Night Flag gives information, whether the observation(s) occurred at local day (1)
or night (2) time. A value of 3 indicates that the data is a result of merging satellite microwave
data observed during day as well as during night time. In cases where the information cannot
be determined the value is set to 0 (zero).
6.4.3 flag
Flag values are stored as signed bytes, and the default value (NaN, not a number) is 127. By
reading the flag for the surface soil moisture data, the user gets information for that grid point.
A “0” (zero) informs that the sm value for that grid point has been checked, but there was no
inconsistency found. A “1” denotes, that the soil for that location is covered with snow or the
temperature is below zero. Reading a “2” indicates that the observed location is covered by
dense vegetation, and a “4” stands for all other cases, e.g. no convergence in the model, thus
no valid soil moisture estimates.
6.4.4 freqbandID
The surface soil moisture data has its sources from multiple and different satellite sensors,
which operate in various frequencies. The freqbandID values are representing the operating
frequencies and comprise the combination of different frequency bands. Table 15 lists these
combinations.
6.4.5 mode
The NetCDF variable mode stores the information of the sensor’s orbit direction. Ascending
direction are denoted as 1, and descending orbit as 2. In cases where the orbit direction
cannot be determined, the NaN value 0 (zero) is used. A value of 3 means that the merged
data comprises both ascending and descending satellite modes.

Soil Moisture ECV Product User Guide (PUG)
Product Version v05.2
Doc Issue 1.0
Date 29-05-2020
37
6.4.6 sensor
The values for sensor are stored as signed integer, with NaN as 0 (zero). These values indicate
the satellite sensors that have been used for a specific grid point. Valid values range from 1 to
864. Table 17 list all available sensor combinations.
6.4.7 t0
The original observation timestamp is stored within the NetCDF variable t0 (t-naught). Time
values coming from two different sensors are averaged. Values of -9999.0 are used as NaN
values. t0 data values are stored as number of “days since 1970-01-01 00:00:00 UTC” (see
Table 18).
6.4.8 time
The reference timestamp of the day is saved in the “time” variable. The data values for the
reference time are stored as number of “days since 1970-01-01 00:00:00 UTC”
6.5 Product Grid and Projection
The grid is a 0.25° x 0.25° longitude-latitude global array of points, based on the World
Geodetic System 1984 (WGS 84) reference system. Its dimension is 1440 x 720, where the first
dimension, X (longitude) is incrementing most rapidly West (-180°) to East (180°), and the
second dimension, Y (latitude) is incrementing South (-90°) to North (90°). Grid edges are at
multiple of quarter-degree values (e.g. 90, 89.75, 89.5, 89.25, …), and the grid centers are
exactly between two grid edges:
First point centre = (–89.875°S, –179.875°W) = Grid Point Index = 0
Second point centre = (–89.875°S, –179.625°W) = Grid Point Index = 1
1441st point centre = (–89.625°S, –179.875°W) = Grid Point Index = 1440
Last point centre = (89.875°N, 179.875°E) = Grid Point Index = 1036799
In total, there are 1440 x 720 = 1036800 grid points, where 244243 points are land points.
Figure 8 shows the land points that are used for the merged product.

Soil Moisture ECV Product User Guide (PUG)
Product Version v05.2
Doc Issue 1.0
Date 29-05-2020
38
Figure 8: Land mask used for the merged product. The 0.25° grid starts indexing from “lower left” to the “upper right”. Note that not every grid points are available for all sensors, e.g. ASCAT retrievals are available between Latitude degrees 80° and –60°.
7 ESA CCI SM in Earth system applications
The following section is taken from (Dorigo et al. 2017) as is presents the broadest review to
date of the current use and application of the ESA CCI SM product by the wider scientific
community. The exhaustive list of references for this section are presented in Section 12.
The use of ESA CCI SM products in a wide variety of studies helps improve our understanding
of Earth system processes (Table 20), in particular with respect to climate variability and
change. Even though the application fields are seemingly different, in all of them ESA CCI SM
plays a central role in benchmarking, calibrating, or providing an alternative to the land surface
hydrology in dedicated models. The following sections will provide an extensive synthesis of
how ESA CCI SM has been used so far in the different application areas and what potential still
remains unexploited.
Table 20: Applications where ESA CCI SM has been used to improve our Earth system understanding.
Modified from Dorigo and De Jeu (2016).
Application
area
Main purpose References
Climate
variability and
change
Long-term trends in soil moisture (Albergel et al. 2013; An et al. 2016; Dorigo et al.
2012; Qiu et al. 2016b; Rahmani et al. 2016; Su et al.
2016)
Assessment of drivers of soil moisture trends (Feng 2016; Liu et al. 2015)

Soil Moisture ECV Product User Guide (PUG)
Product Version v05.2
Doc Issue 1.0
Date 29-05-2020
39
Soil moisture as driver of multi-annual variability in
land evaporation
(Miralles et al. 2014b)
Impact of ocean atmosphere system on soil moisture
variability
(Bauer-Marschallinger et al. 2013; Miralles et al.
2014b; Nicolai-Shaw et al. 2016)
Soil moisture as indicator of global climate variability
and change
(De Jeu et al. 2011; De Jeu et al. 2012; Dorigo et al.
2014; Dorigo et al. 2015a; Dorigo et al. 2016;
Parinussa et al. 2013)
Impact of soil moisture trends on atmospheric
composition
(Klingmüller et al. 2016)
Validation of climate model runs (Du et al. 2016; Lauer et al. 2017; Pieczka et al. 2016)
Land
atmosphere
interactions
Improved understanding of soil moisture feedbacks
on precipitation
(Guillod et al. 2014; Guillod et al. 2015) (indirectly,
through assimilation of ESA CCI SM into GLEAM)
Identifying role of soil moisture on temperature
variability and heatwaves
(Casagrande et al. 2015; Hirschi et al. 2014; Miralles
et al. 2014a)
Improved modelling of land evaporation (Martens et al. 2017; Miralles et al. 2014b)
Impact of soil moisture on dust and aerosols (Klingmüller et al. 2016)
Global
biogeochemical
cycles
Benchmarking and calibrating global vegetation
models
(Szczypta et al. 2014; Traore et al. 2014)
Impact of soil moisture dynamics on vegetation
productivity
Barichivich et al. (2014); Chen et al. (2014); McNally
et al. (2016); Muñoz et al. (2014); Nicolai-Shaw et al.
(2016); Papagiannopoulou et al. (2017a);
Papagiannopoulou et al. (2017b); Szczypta et al.
(2014)
Connecting trends in soil moisture and vegetation
productivity
(Dorigo et al. 2012; Feng 2016)
Improved crop modelling (Qiu et al. 2016b; Sakai et al.)
Assessing drivers of fire activity (Charles et al. 2016; Forkel et al. 2016)
Hydrology and
land surface
modelling
Benchmarking model states in hydrological and land
surface models
(Du et al. 2016; Fang et al. 2016; Lauer et al. 2017;
Loew et al. 2013; Schellekens et al. 2017;
Spennemann et al. 2015; Szczypta et al. 2014)
Benchmarking model processes in hydrological and
land surface models (e.g. dry down)
(Chen et al. 2016)

Soil Moisture ECV Product User Guide (PUG)
Product Version v05.2
Doc Issue 1.0
Date 29-05-2020
40
Persistence and prediction of soil moisture anomalies
in land surface models
(Nicolai-Shaw et al. 2016)
Improving runoff predictions and flood (risk)
modelling
(Massari et al. 2015; Tramblay et al. 2014)
Improved water budget modelling (Abera et al. 2016; Allam et al. 2016)
Assessing irrigation (Kumar et al. 2015; Qiu et al. 2016b)
Assessing the impact of agricultural intensification on
soil moisture
(Liu et al. 2015)
Computing cumulative precipitation amounts (Ciabatta et al. 2016)
Drought
applications
Validation of drought indices (van der Schrier et al. 2013)
Development of new drought index (Carrão et al. 2016; Enenkel et al. 2016; Rahmani et al.
2016)
Improved detection of agricultural droughts (Liu et al. 2015; Yuan et al. 2015)
Soil moisture for integrated drought monitoring (Enenkel et al. 2016; McNally et al. 2016; Nicolai-Shaw
et al. 2016; Rahmani et al. 2016)
Meteorological
applications
Improving NWP land surface scheme (Arnault et al., 2015 and Zhan et al., 2016) and see
Section 7.6 of this PUG
7.1 Assessing climate variability and change
As soil moisture is an integrative component of the Earth system, any large scale variability or
change in our climate should manifest itself in globally observed patterns. In this role, ESA CCI
SM has made a significant contribution to the body of evidence of natural and human-induced
climate variability and change. Emblematic for this is the contribution of ESA CCI SM to the
State of the Climate Reports that are issued every year by National Oceanic and Atmospheric
Administration (e.g., Blunden and Arndt 2016).
Several studies have shown a clear relationship between major oceanic-atmospheric modes
of variability in the climate system, e.g. El Niño Southern Oscillation (ENSO), and variations in
ESA CCI SM (Bauer-Marschallinger et al. 2013; Dorigo et al. 2016; Miralles et al. 2014b; Nicolai-
Shaw et al. 2016). By applying enhanced statistical methods to the multi-decadal ESA CCI SM
v0.1 dataset over Australia, Bauer-Marschallinger et al. (2013) were able to disentangle the
portion of soil moisture variability that is driven by the major climate oscillations affecting this
continent, i.e., ENSO, the Indian Ocean Dipole and the Antarctic Oscillation, from other modes

Soil Moisture ECV Product User Guide (PUG)
Product Version v05.2
Doc Issue 1.0
Date 29-05-2020
41
of short-term and long-term variability. Miralles et al. (2014b) showed that inter-annual soil
moisture variability as observed by ESA CCI SM COMBINED v02.2 largely drives the observed
large-scale variability in continental evaporation.
ESA CCI SM has been widely used to assess global trends in soil moisture, mostly in
combination with LSMs. Based on ESA CCI SM v0.1 (Dorigo et al. 2012) computed that for the
period 1988–2010 27% of the area covered by the dataset showed significant trends, of which
almost three quarters were drying trends. The strong tendency towards drying were largely
confirmed by trends computed for the same period from ERA-Interim and GLDAS-Noah
(Dorigo et al. 2012), and ERA-Interim/Land and MERRA-Land (Albergel et al. 2013), although
the spatial trend patterns were not everywhere congruent between datasets. The agreement
in trends between a newer version of ESA CCI SM (v02.2) and MERRA-Land were recently
confirmed by Su et al. (2016). Trend analyses performed on a more regional scale, but for
different time periods (An et al. 2016; Qiu et al. 2016b; Rahmani et al. 2016) generally
confirmed the results obtained at the global scale while providing a more detailed view on the
impact of local land management practices, e.g. irrigation, on observed trends (Qiu et al.
2016b), and the impact of soil moisture trends in regional climate (Klingmüller et al. 2016).
Feng (2016) made an assessment of the drivers of trends in ESA CCI SM COMBINED v02.2 soil
moisture and concluded that at the global scale climate change is by far the most important
driver of changes in soil moisture, although at the regional level vegetation change may play
a significant role. Nevertheless, given the limitations in record lengths, the impact of low-
frequency climate oscillations on trends should first be carefully addressed before any robust
conclusion about the sign and magnitude of the trend can be drawn (Miralles et al. 2014b).
Likewise, the potential impact of dataset artefacts should be carefully quantified and
corrected for (Su et al. 2016).
7.2 Land-atmosphere interactions
As soil moisture is essential in partitioning the fluxes of water and energy at the land surface,
it can affect the dynamics of humidity and temperature in the lower troposphere. This control
of soil moisture on evapotranspiration is important for the intensity and persistence of
heatwaves, as the depletion of soil moisture and the resulting reduction in evaporative cooling
may trigger an amplified increase in air temperature (Fischer et al. 2007b; Hirschi et al. 2011;
Miralles et al. 2014a; Seneviratne et al. 2006c). While many studies on soil moisture–
evapotranspiration and soil moisture–temperature coupling are based on modelling results or
use precipitation-based drought indices as a proxy for soil moisture, ESA CCI SM enables
analyses based on long-term soil moisture estimates (Hirschi et al. 2014; Miralles et al. 2014a).
The 2003 heatwave in Europe and the 2010 heatwave in Russia both showed distinct negative
anomalies in ESA CCI SM v02.1 during the heatwaves, amplifying the lack of evaporative
cooling and favouring the progressive build-up of atmospheric heat in the atmospheric

Soil Moisture ECV Product User Guide (PUG)
Product Version v05.2
Doc Issue 1.0
Date 29-05-2020
42
boundary layer (Miralles et al. 2014a). Moreover, the temporal evolution and timing of periods
of extreme dry soil moisture conditions in ESA CCI SM COMBINED v02.2 coincide well with
anomalies in evapotranspiration, temperature, and fAPAR (Nicolai-Shaw et al. 2016).
Limitations with respect to the depth of the soil moisture retrievals (i.e., reporting the content
of moisture in the first few centimetres as opposed to the entire root depth affecting
transpiration) have triggered some debate about its appropriateness to investigate
evapotranspiration dynamics and atmospheric feedbacks (Hirschi et al. 2014). Hirschi et al.
(2014) showed that the strength of the relationship between soil moisture and temperature
extremes appears underestimated with ESA CCI SM remote sensing-based surface soil
moisture compared to estimates based on the Standardized Precipitation Index (SPI; McKee
et al. 1993; Stagge et al. 2015). This is related to an underestimation of the temporal dynamics
and of large dry/wet anomalies within ESA CCI SM. This effect is enhanced under extreme dry
conditions and may lead to a decoupling of the surface layer from deeper layers and from
atmospheric fluxes (and resulting temperatures). Thus the added value of root-zone soil
moisture is likely more important for applications dealing with extreme conditions, while for
mean climatological applications the information content in the surface layer appears
adequate. In addition, the importance of having root-zone soil moisture information also
seems to depend on the application. For example, (Qiu et al. 2016a) showed that the
prediction of near-future vegetation anomalies profits from vertically integrated soil moisture
(as an approximation of root-zone soil moisture) as opposed to surface soil moisture alone. In
a later study however they found no clear evidence that using vertically extrapolated soil
moisture as opposed to surface soil moisture observations enhances the estimation of surface
energy fluxes (Qiu et al. 2016a). The assimilation of remote sensing surface soil moisture into
a land surface model (e.g., Lannoy and Reichle 2016) provides a possible alternative here. In
fact, root zone soil moisture estimates by the satellite-based Global Land Evaporation
Amsterdam Model (GLEAM; Miralles et al. 2011) are already improved by the assimilation of
ESA CCI SM, while the overall quality of evaporation estimates remains similar after
assimilation (Martens et al. 2017). Also, the assimilation of ESA CCI SM COMBINED v02.1
helped interpreting global land evaporation patterns and multi-annual variability in response
to the El Niño Southern Oscillation (Miralles et al. 2014b).
Soil moisture also affects precipitation through evapotranspiration. Yet, the effect of soil
moisture on precipitation is much more debated than for air temperature. Studies report both
positive or negative feedbacks, and even no feedback. Using a precursor of ESA CCI SM, Taylor
et al. (2012) identified a spatially negative feedback of soil moisture on convective
precipitation regarding the location, i.e., that afternoon rain is more likely over relatively dry
soils due to mesoscale circulation effects. Guillod et al. (2015) revisited the soil moisture effect
on precipitation using GLEAM root-zone soil moisture with ESA CCI SM COMBINED v02.1
assimilated, and showed that spatial and temporal correlations with opposite signs may

Soil Moisture ECV Product User Guide (PUG)
Product Version v05.2
Doc Issue 1.0
Date 29-05-2020
43
coexist within the same region: precipitation events take place preferentially during wet
periods (moisture recycling), but within the area have a preference to fall over comparatively
drier patches (local, spatially negative feedbacks).
A more indirect but potentially strong soil moisture – atmosphere feedback was found by
Klingmüller et al. (2016), who were able to link an observed positive trend in Aerosol Optical
Depth (AOD) in the Middle East to a negative trend in ESA CCI SM COMBINED v02.1. As lower
soil moisture translates into enhanced dust emissions, their results suggested that increasing
temperature and decreasing relative humidity in the last decade have promoted soil drying,
leading to increased dust emissions and AOD. These changes in atmospheric composition
again may have considerable impact on radiative forcing and precipitation initiation
(Ramanathan et al. 2001) and as such impact the energy and water cycles in the area.
7.3 Global biogeochemical cycles
Soil moisture is a regulator for various processes in terrestrial ecosystems such as plant
phenology, photosynthesis, biomass allocation, turnover, and mortality; and the accumulation
and decomposition of carbon in soils (Carvalhais et al. 2014; Nemani et al. 2003; Reichstein et
al. 2013; Richardson et al. 2013). Low soil moisture during drought reduces photosynthesis,
enhances ecosystem disturbances such as insect infestations or fires, and thus causes plant
mortality and accumulation of dead biomass in litter and soils (Allen et al. 2010; McDowell et
al. 2011; Thurner et al. 2016). The release of carbon from soils to the atmosphere through
respiration is also controlled by soil moisture (Reichstein and Beer, 2008). Consequently, soil
moisture is a strong control on variations in the global carbon cycle (Ahlström et al. 2013;
Poulter et al. 2014; van der Molen et al. 2012).
Despite the importance of soil moisture for the global carbon cycle, satellite-derived soil
moisture data is currently under-explored in carbon cycle and ecosystem research. Because
long-term soil moisture observations were lacking until recently, most studies on the effects
of soil moisture on vegetation relied on precipitation estimates (Du et al. 2013; Poulter et al.
2013), indirect drought indices (Hogg et al. 2013; Ji and Peters 2003), or soil moisture
estimates from land surface models (Forkel et al. 2015; Rahmani et al. 2016). More recently,
authors used ESA CCI SM to assess impacts of water availability and droughts on plant
phenology and productivity based on satellite-derived vegetation indices such as the
Normalized Difference Vegetation Index (NDVI) or the Leaf Area Index (LAI). For example,
Szczypta et al. (2014) used ESA CCI SM v0.1, modelled soil moisture, and LAI over the Euro-
Mediterranean zone to evaluate two land surface models and to predict LAI anomalies over
cropland. LAI was predictable from ESA CCI SM in large homogeneous cropland regions, e.g.
in Southern Russia (Szczypta et al. 2014). Strong positive relationships between ESA CCI SM
COMBINED and NDVI were also found for Australia (Chen et al. 2014; v0.1), for croplands in
Soil Moisture ECV Product User Guide (PUG)
Product Version v05.2
Doc Issue 1.0
Date 29-05-2020
44
the North China plains (Qiu et al. 2016b; v0.1), and for East Africa (McNally et al. 2016; v02.1).
Generally, many regions with positive (greening) or negative (browning) trends in NDVI show
also positive and negative trends in ESA CCI SM v0.1, respectively (Dorigo et al. 2012). This co-
occurrence of soil moisture and NDVI trends reflects the strong water control on vegetation
phenology and productivity. Interestingly, soil moisture from ESA CCI SM v0.1 was also
correlated with NDVI in some boreal forests which are primarily temperature-controlled
(Barichivich et al. 2014). In these regions, soil moisture and vegetation productivity were
controlled by variations in the accumulation and thawing of winter snow packs (Barichivich et
al. 2014). However, some water-limited regions had negative EAA CCI SM v0.1 soil moisture
trends with no corresponding trend in NDVI (Dorigo et al. 2012). In these cases, the positive
relation between surface soil moisture and vegetation is likely modified by vegetation type
and vegetation density (Feng, 2016; McNally et al., 2016). For example, densely vegetated
areas in East Africa show stronger correlations between ESA CCI SM COMBINED v02.1 soil
moisture and NDVI than sparsely vegetated areas (McNally et al., 2016). Novel data-driven
approaches allow to assess the share of ESA CCI SM in controlling NDVI variability as opposed
to other water and climate drivers (Papagiannopoulou et al. (2017a); Papagiannopoulou et al.
(2017b)). Figure 9 shows the correlation between the latest ESA CCI SM COMBINED (v03.2)
product and NDVI GIMMS 3G (Tucker et al. 2005) with a lag time of soil moisture preceding
NDVI of 16 days. In most regions and especially in water-limited areas such as the Sahel, there
is a strong and direct response of NDVI to soil moisture. On the other hand, correlations are
negative in many temperate regions. This is likely due to the fact that NDVI is highest in
summer months when soil moisture decreases. This demonstrates that vegetation
productivity in temperate regions is primarily temperature-controlled and strongly affected
by human activities through agriculture or forest management (Forkel et al. (2015);
Papagiannopoulou et al. (2017b)).
Apart from the analysis of relations with vegetation indices, the ESA CCI SM datasets have
been occasionally used in other ecosystem studies. For example, Muñoz et al. (2014)
investigated tree ring chronologies of Conifers in the Andeans in conjunction with soil
moisture variability from ESA CCI SM v0.1. The study revealed a previously unobserved
relation between tree growth and summer soil moisture (Muñoz et al., 2014). Furthermore,
ESA CCI SM v0.1 and vegetation data were used to evaluate ecosystem models (Szczypta et al.
2014; Traore et al. 2014). Thereby, the results of Traore et al. (2014) demonstrate that a model
that best performs for soil moisture does not necessarily best perform for plant productivity.
This demonstrates the need to jointly use soil moisture and vegetation or carbon cycle
observations to improve global ecosystem/carbon cycle models (Kaminski et al. 2013). For
example, SMOS soil moisture data and observations of atmospheric CO2 have been used to
estimate parameters of a global vegetation model within a carbon cycle data assimilation
system (Scholze et al. 2016). The use of the ESA CCI SM in such an analysis could potentially

Soil Moisture ECV Product User Guide (PUG)
Product Version v05.2
Doc Issue 1.0
Date 29-05-2020
45
constrain model uncertainties regarding the long-term hydrological control on vegetation
productivity and ecosystem respiration. However, a major source of uncertainty about the
future terrestrial carbon cycle is related to how global ecosystem models represent carbon
turnover, vegetation dynamics, and disturbances such as fires (Friend et al. 2014). It was
previously shown that variations in satellite-derived soil moisture are related to extreme fire
events in boreal forests (Bartsch et al. 2009; Forkel et al. 2012). Consequently, the ESA CCI SM
COMBINED dataset has been used together with climate, vegetation, and socio-economic data
to assess controls on fire activity globally and to identify appropriate structures for global fire
models (Charles et al. 2016; Forkel et al. 2016).
Figure 9: Mean Pearson correlation coefficient R between ESA CCI soil moisture v03.1 and GIMMS NDVI3g for the period 1991 to 2013 for a lag time of soil moisture preceding NDVI by 16 days.
7.4 Hydrological and land surface modelling
As soil moisture drives processes like runoff, flooding, evaporation, infiltration, and ground
water recharge, it is important for hydrological models to accurately map soil moisture states.
The potential of using ESA CCI SM to validate surface soil moisture fields in state-of-the-art
LSMs, reanalysis products, and large-scale hydrological models has been largely recognized
(Fang et al. 2016; Loew et al. 2013; Spennemann et al. 2015; Szczypta et al. 2014). Schellekens
et al. (2017) exploited the long-term availability of ESA CCI SM COMBINED v02.2 to validate
according to a standardised protocol the soil moisture fields of ten global hydrological and
land surface models, all forced with the same meteorological forcing dataset for the period
1979-2012. In a similar systematic way, ESA CCI SM COMBINED (v0.1 and v02.2, respectively)
was used to evaluate the model outputs of CMIP (Du et al. 2016; Lauer et al. 2017). New
insights in the model representation of hydrological processes like infiltration have been
offered by comparing the memory length (Chen et al. 2016) and the frequency domains
(Polcher et al. 2016) between LSMs and remote sensing products, including ESA CCI SM
COMBINED v02.3.

Soil Moisture ECV Product User Guide (PUG)
Product Version v05.2
Doc Issue 1.0
Date 29-05-2020
46
Satellite soil moisture data can bring important benefits in run-off modelling and forecasting
both through an improved initialisation of rainfall-runoff models and through data
assimilation techniques that allow for updating the soil moisture states. Several studies have
shown the positive impact on flood and runoff prediction through assimilation of single sensor
soil moisture products, e.g. obtained from ASCAT (Brocca et al. 2010), AMSR-E (Sahoo et al.
2013), and SMOS (Lievens et al. 2015). Wanders et al. (2014) and Alvarez-Garreton et al.
(2015) showed the improved skill when jointly assimilating multiple soil moisture products
(SMOS, ASCAT and AMSR-E), resulting mainly from improved temporal sampling. Long-term
homogeneous soil moisture products like ESA CCI SM become important in flood modelling
studies that require a multi-year period for the calibration and validation of model
parameters. Assimilating the ESA CCI SM COMBINED v02.2 product over the Upper Niger River
basin improved run-off predictions even though the simulation of the rainfall-runoff model
was already good (Massari et al. 2015). Tramblay et al. (2014) used the ESA CCI SM product to
better constrain model parameters, and hence reduce uncertainties, of a parsimonious
hydrological model in the Mono River basin (Africa), with the goal to evaluate the impact of
climate change on extreme events. Further studies are clearly needed to assess the full
potential of ESA CCI SM product for run-off modelling and forecasting. For example, even a
simple model based only on persistence allows for the prediction of soil moisture (Nicolai-
Shaw et al. 2016), and exploiting this characteristic could contibute to improved early warning
systems.
ESA CCI SM and its Level 2 input products have been used for improving the quantification of
the different components of the hydrological cycle, i.e. evaporation (Allam et al. 2016;
Martens et al. 2017; Miralles et al. 2014b), groundwater storage (Abelen and Seitz 2013), and
rainfall (Ciabatta et al. 2016). Due to its ability to serve as a temporary water reservoir, soil
moisture contains information on antecedent precipitation. This principle is being exploited
by the SM2RAIN method (Brocca et al. 2014; Brocca et al. 2013), which uses an inversion of
the soil-water balance equation to obtain a simple analytical relationship for estimating
precipitation accumulations from the knowledge of a soil moisture time-series. The method
has been tested on a wide range of Level 2 satellite soil moisture products and ESA CCI SM
COMBINED v02.2 (Brocca et al. 2014; Ciabatta et al. 2016). SM2RAIN realistically reproduces
daily precipitation amounts when compared to gauge observations and in certain regions may
even perform better than state-of-the-art direct satellite observations of precipitation, even
though its performance hinges on the quality of the soil moisture product used as input
(Brocca et al. 2014; Ciabatta et al. 2016). Its application to ESA CCI SM COMBINED provides an
independent global climatology of precipitation from 1979 onwards. Abera et al. (2016) used
the SM2RAIN precipitation product from ESA CCI SM (Ciabatta et al. 2016) to quantify the
space-time variability of rainfall, evaporation, runoff and water storage for the Upper Blue
Nile river basin in Africa.
Soil Moisture ECV Product User Guide (PUG)
Product Version v05.2
Doc Issue 1.0
Date 29-05-2020
47
ESA CCI SM has also been used to map irrigation, which, is largely unquantified on a global
scale and, consequently, not included in most large scale hydrological and/or land surface
models (Qiu et al. 2016b). Kumar et al. (2015) used satellite soil moisture observations from
ESA CCI SM COMBINED v02.1, ASCAT, AMSR-E, SMOS, and Windsat for the detection of
irrigation over United States. By comparing modelled and satellite soil moisture data, irrigated
areas can be detected when satellite data and modelled data (the latter do not include
irrigation) show different temporal dynamics. Similarly, Qiu et al. (2016b) detected irrigated
areas in China by evaluating the differences in trends between ESA CCI SM COMBINED v02.1
and precipitation, and Liu et al. (2015) use ESA CCI SM v0.1 to support the attribution of the
aggravating droughts in Northern China to an increase in fertilizer application.
7.5 Drought applications
Soil moisture or agricultural droughts are related to periods of water deficits, and can be
driven by a lack of precipitation and/or increased evapotranspiration (Seneviratne et al. 2012).
In addition to natural causes, human influences such as poor water management and bad land
practices can initiate or exacerbate drought conditions (Liu et al. 2015; Van Loon et al. 2016).
Until recently, global soil moisture observations were scarce, which favoured the use of
available meteorological observations, such as precipitation and temperature, to develop
indices for drought monitoring. Well-known examples, although primarily indicative of
meteorological drought rather than soil moisture or agricultural drought, are the SPI and the
Palmer Drought Severity Index (PDSI; Palmer 1965).
ESA CCI SM can be used to directly monitor soil moisture or agricultural drought, or help to
set up alternative drought indicators. For example, Carrão et al. (2016) and Rahmani et al.
(2016) used ESA CCI SM COMBINED (v02.0 and v02.1, respectively) to develop a drought index
comparable to SPI but based on actual soil moisture observations instead of precipitation,
naming them the Empirical Standardized Soil Moisture Index (ESSMI) and Standardized Soil
Moisture Index (SSI), respectively. Carrão et al. (2016) found high correlations between ESSMI
and maize, soybean and wheat crop yields in South-Central America and with this index could
accurately describe the severe and extreme drought intensities in north-eastern Brazil in 1993,
2012, and 2013. Based on SSI, Rahmani et al. (2016) were able to identify a severe drought
event that started in December 2012 in the northern part of the Iran. The Enhanced Combined
Drought Index (ECDI) as proposed by Enenkel et al. (2016) combines ESA CCI SM COMBINED
v02.2 with satellite-derived observations of rainfall, land surface temperature and vegetation
vigour for the detection of drought events, and has been successfully used to detect large-
scale drought events in Ethiopia between the years 1992-2014.
McNally et al. (2016) specifically evaluated the use of ESA CCI SM COMBINED v02.2 for
agricultural drought and food security monitoring in East Africa, and found that remotely

Soil Moisture ECV Product User Guide (PUG)
Product Version v05.2
Doc Issue 1.0
Date 29-05-2020
48
sensed soil moisture is a valuable addition to a ‘convergence of evidence’ framework for
drought monitoring. Like Dorigo et al. (2015b) they emphasize that users should be aware of
the spatial and temporal differences in data quality caused for example by significant data
gaps prior to 1992, the lack of overlap between sensors, or difficulties with soil moisture
retrievals over certain terrains such as heavily vegetated areas. Post 1992 McNally et al. (2016)
generally found good agreement between ESA CCI SM and other soil moisture products as
well as with NDVI in East Africa. (Yuan et al. 2015) assessed the skill of ESA CCI SM v02.1 in
capturing short-term soil moisture droughts over China. They found that the PASSIVE and
COMBINED products have better drought detection skills over the sparsely vegetated regions
in north-western China while ACTIVE worked best in eastern China. At the global scale Miralles
et al. (2014b) identified the effect of El Niño-driven droughts in soil moisture, NDVI and
evaporation, using GLEAM and ESA CCI SM COMBINED v02.1. Relationships between extreme
dry soil conditions, derived from the ESA CCI SM COMBINED v02.2 dataset, and temperature,
precipitation, evapotranspiration and vegetation activity were also found by Nicolai-Shaw et
al. (2016). This in combination with the high persistence of soil moisture (Nicolai-Shaw et al.
2016; Seneviratne et al. 2006a) makes the ESA CCI SM dataset valuable for the prediction and
monitoring of drought events.
7.6 Meteorological applications
Numerical Weather Prediction (NWP) involves the use of computer models of the Earth
system to simulate how the state of the Earth system is likely to evolve over a period of few
hours up to 1-2 weeks ahead. It also considers longer timescales (seasonal and climate)
through the notion of seamless prediction (Palmer et al. 2008). A number of studies provide
strong support for the notion that high skill in short- and medium-range forecasts of air
temperature and humidity over land requires proper initialization of soil moisture (Beljaars et
al. 1996; Douville et al. 2000; Drusch and Viterbo 2007; van den Hurk et al. 2012). There is
evidence also of a similar impact from soil moisture on seasonal forecasts (Koster et al. 2011;
Koster et al. 2004b; Weisheimer et al. 2011).
Remotely sensed soil moisture datasets like ESA CCI SM can serve NWP in two ways. First, they
can offer a long-term, consistent, and independent reference against which NWP output fields
can be evaluated. This may eventually improve meteorological forecasts through a better
representation of the land surface, and improved representation of the fluxes between the
land surface and the atmosphere in the NWP (see Section 7.2). Recently, ECMWF made an
offline development in its Land Surface Model HTESSEL (Balsamo et al. 2015; Balsamo et al.
2009), making it possible to add extra layers of soil as well as changing their thickness. An
experiment was run which increases the number of soil layers from four to nine and reduces
the thickness of the upper soil layer from seven (0-7 cm) to one (0-1) centimetre. One of the
rationales for having this thin topsoil layer is having a surface layer that is closer to the depth
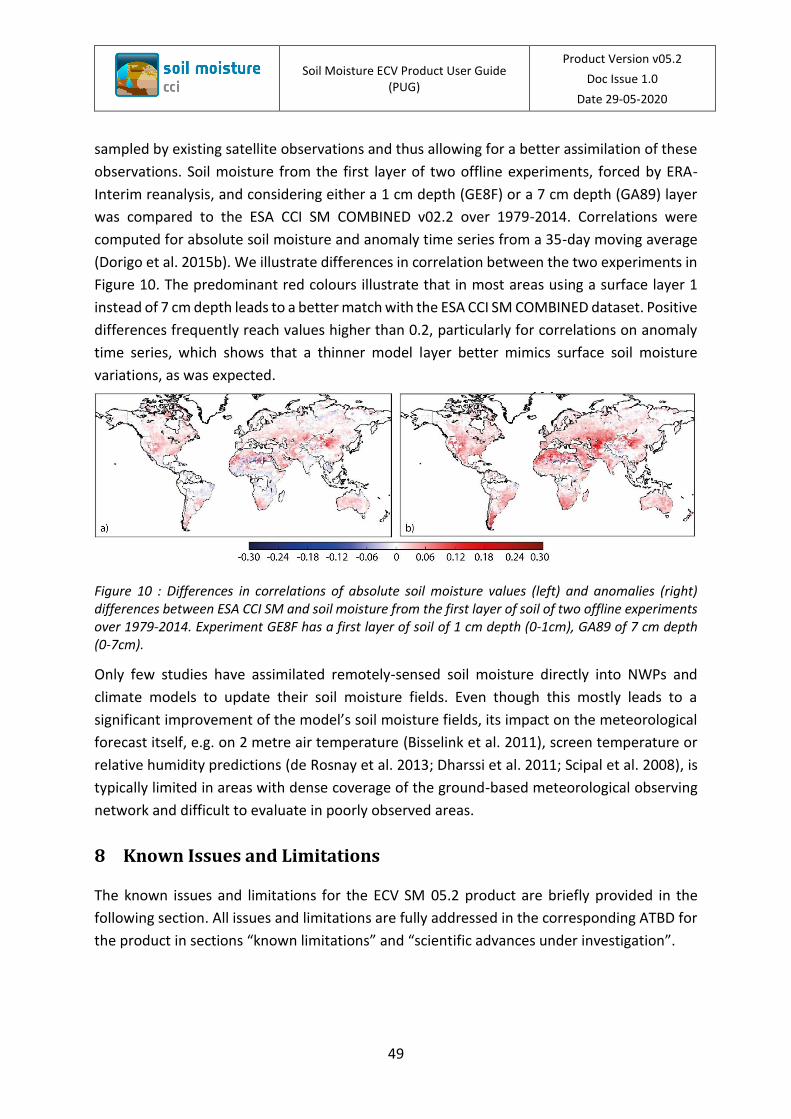
Soil Moisture ECV Product User Guide (PUG)
Product Version v05.2
Doc Issue 1.0
Date 29-05-2020
49
sampled by existing satellite observations and thus allowing for a better assimilation of these
observations. Soil moisture from the first layer of two offline experiments, forced by ERA-
Interim reanalysis, and considering either a 1 cm depth (GE8F) or a 7 cm depth (GA89) layer
was compared to the ESA CCI SM COMBINED v02.2 over 1979-2014. Correlations were
computed for absolute soil moisture and anomaly time series from a 35-day moving average
(Dorigo et al. 2015b). We illustrate differences in correlation between the two experiments in
Figure 10. The predominant red colours illustrate that in most areas using a surface layer 1
instead of 7 cm depth leads to a better match with the ESA CCI SM COMBINED dataset. Positive
differences frequently reach values higher than 0.2, particularly for correlations on anomaly
time series, which shows that a thinner model layer better mimics surface soil moisture
variations, as was expected.
Figure 10 : Differences in correlations of absolute soil moisture values (left) and anomalies (right) differences between ESA CCI SM and soil moisture from the first layer of soil of two offline experiments over 1979-2014. Experiment GE8F has a first layer of soil of 1 cm depth (0-1cm), GA89 of 7 cm depth (0-7cm).
Only few studies have assimilated remotely-sensed soil moisture directly into NWPs and
climate models to update their soil moisture fields. Even though this mostly leads to a
significant improvement of the model’s soil moisture fields, its impact on the meteorological
forecast itself, e.g. on 2 metre air temperature (Bisselink et al. 2011), screen temperature or
relative humidity predictions (de Rosnay et al. 2013; Dharssi et al. 2011; Scipal et al. 2008), is
typically limited in areas with dense coverage of the ground-based meteorological observing
network and difficult to evaluate in poorly observed areas.
8 Known Issues and Limitations
The known issues and limitations for the ECV SM 05.2 product are briefly provided in the
following section. All issues and limitations are fully addressed in the corresponding ATBD for
the product in sections “known limitations” and “scientific advances under investigation”.
Soil Moisture ECV Product User Guide (PUG)
Product Version v05.2
Doc Issue 1.0
Date 29-05-2020
50
8.1 Passive ECV product
The known limitations in deriving soil moisture from passive microwave observations are
listed and described in detail in this section. These issue do not only apply to the current CCI
soil moisture dataset release but also to soil moisture retrieval from passive microwave
observations in general.
8.1.1 Vegetation
Vegetation affects the microwave emission, and under a sufficiently dense canopy the emitted
soil radiation will become completely masked by the overlaying vegetation. The
simultaneously derived vegetation optical depth can be used to detect areas with excessive
vegetation, of which the boundary varies with observation frequency. Figure 11 gives an
example of the relationship between the analytical error estimate in soil moisture as described
in the previous section and vegetation optical depth. This figure shows larger error values in
the retrieved soil moisture product for higher frequencies at similar vegetation optical depth
values. For example, for a specific agricultural crop (VOD=0.5), the error estimate for the soil
moisture retrieval in the C-band is around 0.07 m3·m−3; in the X-band, this is around 0.11
m3·m−3, and in the Ku-band, this is around 0.16 m3·m−3. All relevant frequency bands show an
increasing error with increasing vegetation optical depth. This is consistent with theoretical
predictions, which indicate that, as the vegetation biomass increases, the observed soil
emission decreases, and therefore, the soil moisture information contained in the microwave
signal decreases Owe et al. (2001). In addition, retrievals from the higher frequency
observations (i.e., X- and Ku-bands) show adverse influence by a much thinner vegetation
cover. Soil Moisture retrievals with a soil moisture error estimates beyond 0.2 m3m-3 are
considered to be unreliable and are masked out

Soil Moisture ECV Product User Guide (PUG)
Product Version v05.2
Doc Issue 1.0
Date 29-05-2020
51
Figure 11: Error of soil moisture as related to the vegetation optical depth for 3 different frequency bands (from Parinussa et al. (2011)).
For the new L-band based retrievals from SMOS, the vegetation influence is less as compared
to the C-, X- and Ku-band retrievals, which can be seen from the Rvalue and Triple Collocation
Analysis (TCA) results in Figure 12. In Figure 12, the SMOS LPRM and AMSR-E LPRM (based on
C-band) are included and shows more stable results over dense vegetation, i.e. NDVI values
of over 0.45. A complete analysis on the error for L-band soil moisture, comparable to the
results from Figure 11, are planned in the future.

Soil Moisture ECV Product User Guide (PUG)
Product Version v05.2
Doc Issue 1.0
Date 29-05-2020
52
Figure 12: Triple Collocation Analysis (TCA: top) and Rvalue results (bottom) for several soil moisture datasets, including SMOS LPRM and AMSR-E LPRM, for changing vegetation density (NDVI). Based on van der Schalie et al. (2018).
8.1.2 Frozen surfaces and snow
Under frozen surface conditions the dielectric properties of the water changes dramatically
and therefore all pixels where the surface temperature is observed to be at or below 273 K
are assigned with an appropriate data flag, this was determined using the method of Holmes
et al. (2009).
8.1.3 Water bodies
Water bodies within the satellite footprint can strongly affect the observed brightness
temperature due to the high dielectric properties of water. Especially when the size of a water
body changes over time they can dominate the signal. LPRM uses a 5 % water body threshold
based on MODIS observations and pixels with more than 5 % surface water are masked.
8.1.4 Rainfall
Rainstorms during the satellite overpass affect the brightness temperature observation, and
are therefore flagged in LPRM. The flagging system for active rain is based on the rainfall index
of Seto et al. (2005). This method makes use of the vertical polarized 36.5 GHz and 19 GHz
observations to detect a rain event. Index values of 5 and beyond are used to identify an active
rainstorm. Soil moisture retrievals with these index values are flagged.

Soil Moisture ECV Product User Guide (PUG)
Product Version v05.2
Doc Issue 1.0
Date 29-05-2020
53
8.1.5 Radio Frequency interference
Natural emission in several low frequency bands are affected by artificial sources, so called
Radio Frequency Interference (RFI). As a diagnostic for possible errors an RFI index is
calculated according to Nijs et al. (2015). Most passive microwave sensors that are used for
soil moisture retrieval observe in several frequencies. This allows LPRM to switch to higher
frequencies in areas affected by RFI. The new methodology that is now used for RFI detection
uses the estimation of the standard error between two different frequencies. It uses both the
correlation coefficient between two observations and the individual standard deviation to
determine the standard error in Kelvin. A threshold value of 3 Kelvin is used to detect RFI. This
method does not produce false positives in extreme environments and is more sensitive to
weak RFI signals in relation to the traditional methods (e.g. Li et al. (2004)).
As the currently integrated SMOS mission does not have multiple frequencies to apply this
method, here we base the filtering on the RFI probability information that is supplied by in the
SMOS Level 3 data.
8.2 Active ECV Product
Development of SM retrieval algorithms for currently operating active sensors (i.e. Metop-A
and Metop-B ASCAT) are not part of ESA CCI SM. Changes in the ACTIVE product depend on
improvements made to the latest available versions of H SAF ASCAT SSM CDRs. Known issues
and potential improvements in the ACTIVE product include the correction of artificial wetting
trends (most likely caused by RFI) in ASCAT backscatter observations, the optimisation of
dry/wet backscatter references and the respective computation of cross-over-angles and the
investigation of sub-surface backscatter in dry regions. For a detailed description on
improvements that are planned and will affect future versions of ESA CCI SM, we refer to
http://hsaf.meteoam.it/ and HSAF (2018).
8.3 Combined Active + Passive ECV Product
The current product version combining the active and passive ECVs into a merged
active/passive ECV is based on data availability (at a daily time step) and their sensitivity to
vegetation. For most locations, either only the rescaled passive merged data set or the
rescaled active merged data set is used, based on a threshold in vegetation optical depth
obtained from LPRM retrievals. Despite the growing number of satellites available for soil
moisture retrieval, data gaps or lower observation densities arise over large parts of Eurasia,
South America, and Africa. The static merging framework adopted for CCI SM production,
which either uses passive products (over sparsely vegetated areas), active products
(moderately vegetated areas) or both (intermediately vegetated areas), does currently not

Soil Moisture ECV Product User Guide (PUG)
Product Version v05.2
Doc Issue 1.0
Date 29-05-2020
54
allow for filling such gaps with lower quality observations. It is currently being investigated
how the static merging scheme can be alleviated to fill such gaps without making compromise
with respect to the overall product quality. Using a weighted merging scheme based on triple
collocation based signal-to-noise estimates is the most likely candidate to follow up the static
merging scheme (Gruber et al. 2017) .
In order to verify if the quality of the merged product is comparable to or better than that of
the individual input products, (Gruber et al. 2017) validated the version 0.1 over 596 in-situ
stations of the ISMN and compared these results with the evaluation results obtained for the
individual contributing products. It was observed that for the active products there is not as
much of an improvement in correlation as that observed for most of the passive data sets. The
cause of this is still not entirely clear, but is most likely related to the higher spatial resolution
of the ASCAT product and the non-optimal scaling resulting from this discrepancy in scale.
8.4 Passive merged CCI product
8.4.1 Using night-time observations only
For the current version of the merged passive product only descending overpasses,
corresponding to night-time / early morning observations, were considered. This is because
near surface land surface temperature gradients are regarded to be reduced at night leading
to more robust retrievals (Owe et al. 2008). However, recent studies (Brocca et al. 2011)
suggest that for specific land cover types day-time observations may provide more robust
retrievals than night-time observations, although the exact causes are still unknown. If day-
time observations could be introduced to the blended product, this would significantly
increase the observation density.
8.5 Intercalibration of AMSR-E and AMSR2
As AMSR-E stopped delivering data on 04 October 2011, the continuity of the passive
radiometer data is prolonged by using the WindSat and AMSR2 data sets. The Passive product
is extended by using WindSat to bridge the time gap between AMSR-E and AMSR2. A
intercalibration technique was developed to adjust WindSat soil moisture to AMSR-E and
AMSR2 to the adjusted Windsat data (Nijs et al. 2015). However, the overlapping period use
to compute the calibration constants was very short and need to be updated using a larger
time window. This proved to insufficient in the internal evaluations. Therefore, in this current
version the calibration between AMSRE and AMSR2 was done using a statistical fit between
the last three years of AMSRE and first three years of AMSR2. In future versions this gap is
expected to be solved using the integration of FengYun-3B data.
Soil Moisture ECV Product User Guide (PUG)
Product Version v05.2
Doc Issue 1.0
Date 29-05-2020
55
8.6 Active Product
8.6.1 Intercalibration of ERS and ASCAT
The generation of the ERS and ASCAT products is still based on their individual time series. The
merged ERS + ASCAT could significantly profit from an appropriate Level 1 inter-calibration.
Besides improving the quality of the individual measurements this would improve the
robustness of the calculation of the dry and wet references.
8.6.2 Data gaps
Similar as for the passive products, merging ERS and ASCAT into a merged dataset is based on
a strict separation in time. Gaps in ASCAT time series can be potentially filled with ERS
observations, although the spatial and temporal overlap between both sensors is limited.
9 Data Access and Acknowledgements
9.1 Data Access
The active, passive and merged products are freely available for download after the
completion of a simple user registration and the users approval by the CCI SM team data
administrators. User registration is available at:
http://www.esa-soilmoisture-cci.org/dataregistration
Registration is required to deter automated systems having direct access to the product. Data
downloaded by the registered user can be used by the user and the associated organisation,
no onward distribution is permitted.
The current product version is ECV SM v0Error! Unknown document property name.. If you
are interested in previous product versions, please send us a request. Our contact details are
provided in Section 9.3.
The data set is also available via ESA’s open data portal: http://cci.esa.int/data
9.2 Data Reader
The esa_cci_sm Python package available on the TU Wien GEO GitHub repository
(https://github.com/TUW-GEO/esa_cci_sm) provides readers for the ESA CCI soil moisture
datasets (images and time series within the “interface” module). It also allows conversion of
daily images to gridded time series via the “reshuffle” module. The README.rst file contains

Soil Moisture ECV Product User Guide (PUG)
Product Version v05.2
Doc Issue 1.0
Date 29-05-2020
56
information about installation of the package. Please contact the CCI SM team for advice on
using the reader.
9.3 Contact
The CCI SM team can be contact directly via [email protected].
E-mails sent to this address reaches both data managers and key project scientists.
9.4 Scientific use only
The ECV SM product is intended for scientific purposes only.
9.5 No onward distribution
Re-export or transfer of the original data (as received from the ECV SM sftp) by the data users
to a third party is prohibited. This is in the best interest of both the individual data providers
and the potential users as unrestricted copying of the original data by multiple, independent
users may lead to errors in the data.
9.6 Intellectual Property Rights
User acknowledges the respective data owner's full title and ownership of the data and
nothing in these terms and conditions shall be construed as granting or implying any rights to,
or interest in copyrights or intellectual property rights of the respective data owners.
9.7 Acknowledgement and citation
Whenever the product, made available by the CCI SM project, is used for publication, the
data's origin (i.e. the CCI SM project) must be acknowledged and referenced.
The data set should be cited using the complete references as follows:
• Gruber, A. Scanlon, T., van der Schalie, R., Wagner, W., Dorigo, W. (2019) Evolution of
the ESA CCI Soil Moisture Climate Data Records and their underlying merging
methodology. Earth System Science Data 11, 717-739, https://doi.org/10.5194/essd-
11-717-2019
• Gruber, A., Dorigo, W. Crow, W., & Wagner, W. (2017). Triple collocation-based
merging of satellite soil moisture retrievals. IEEE Transactions on Geoscience and
Remote Sensing, 1-13. https://doi.org/10.1109/TGRS.2017.2734070.
• Dorigo, W.A., Wagner, W., Albergel, C., Albrecht, F., Balsamo, G., Brocca, L., Chung, D.,
Ertl, M., Forkel, M., Gruber, A., Haas, E., Hamer, P. D., Hirschi, M., Ikonen, J., de Jeu, R.,
Soil Moisture ECV Product User Guide (PUG)
Product Version v05.2
Doc Issue 1.0
Date 29-05-2020
57
Kidd, R., Lahoz, W., Liu, Y. Y., Miralles, D., Mistelbauer, T., Nicolai-Shaw, N., Parinussa,
R., Pratola, C., Reimer, C., van der Schalie, R., Seneviratne, S. I. Smolander, T., Lecomte,
P. (2017). ESA CCI Soil Moisture for improved Earth system understanding: State-of-
the art and future directions, Remote Sensing of Environment.
https://doi.org/10.1016/j.rse.2017.07.001.
9.8 User feedback
Use feedback is warmly welcomed and encouraged. All questions and remarks concerning the
product can be addressed to our contact e-mail address provided in Section 9.3.
10 Terminology of Remote Sensing and Earth Observation
Table 21 lists the prime business domain terms from the scientific and technological domains
of remote sensing, satellite-based Earth Observation and Soil Moisture retrieval.
Table 21: Business Domain Terminology: Remote Sensing, Earth Observation, Soil Moisture
Term (Acronym) Description Synonyms
Remote sensing Is the acquisition of information about an object or phenomenon without making physical contact with the object. There are two main types of remote sensing: passive remote sensing and active remote sensing, corresponding to active and passive instruments, respectively (see below).
Sensed object The object subject of a remote sensing activity. Sensed target
Sensed system
Instrument In the given context: An imaging microwave instrument flying onboard of an earth observation satellite. The instrument is a payload of the satellite.
In a wide sense: Any device that can be used to perform a measurement.
Sensor
Measurement device
Active instrument
An instrument that uses its own source of electromagnetic energy for the measurement.
Scatterometer An active microwave instrument, measuring the radar backscattering coefficient σ0 in physical units [dB] or [m2/m2].
Radar
Passive instrument
An instrument that measures energy that is reflected or emitted from the sensed object.
Radiometer A passive microwave instrument, measuring the brightness temperature TB in physical unit [K].

Soil Moisture ECV Product User Guide (PUG)
Product Version v05.2
Doc Issue 1.0
Date 29-05-2020
58
Term (Acronym) Description Synonyms
Beam The direction sensed by single antennae; used to express the fact that a satellite instrument may have several antennas each with its own field of view (FOV).
Satellite In the given context always means Earth Observation (EO) satellite.
Orbit The path of a satellite on its way around the earth.
Single overpass
Single orbit
The term is used to stress the fact that a satellite instrument scans only once across the earth surface and makes a single or a tuple of measurements per swath node.
Implies that individual beams contributing to a measurement result are synchronized to the sensed object.
Single scan
Revisiting orbit The term is used to stress the fact that measurements of a satellite instrument were not made in a single overpass.
Overlapping orbits
Multi-pass orbits
Swath The area of the earth surface along the ground track of a satellite that is sensed by the instrument in a single overpass; has a definite width but indefinite begin an end; made of an explicit number of nodes in the width-dimension that repeat in regular intervals along the direction of the ground track; each node is the sensed object of a single or a tuple of measurements.
L<n>
Level
Processing Level
Processing levels L0 to L4 are an organization of the chain of data processing performed on the payload data from EO satellites.
Merging Process of combining the measurements or retrievals from revisiting orbits of a satellite or from many satellites with the aim to reach an improved coverage of the observed domain in space or time.
Terms ‘merging‘, ‘blending‘ and ‘fusion’ appear in the literature sometimes synonymously and sometimes with diversified meanings.
Blending
Fusion
Grid Narrow: A set of nodes, lines or areas in a two-dimensional space that are arranged in a repeated pattern; may result from a construction principle or an actual process that repeats in regular intervals.
Wide: Extended to n-dimensional space, and to space-time.
Node One point (or area) out of a set of similar points (areas) that together form a grid.
Grid type Classification of grids by construction principle.

Soil Moisture ECV Product User Guide (PUG)
Product Version v05.2
Doc Issue 1.0
Date 29-05-2020
59
Term (Acronym) Description Synonyms
Swath grid The grid originating from a satellite instrument when it senses the individual areas of the earth surface in a repetitive pattern during a single overpass; each grid node represents a single or a tuple of measurements.
A swath grid is the result of the projection made by the instrument’s beams; images in swath grid are in the perspective of the instrument’s point of view (POV).
Nodes of revisiting orbits do not coincide, thus swath grids are dynamic and not statically linked to the earth surface.
Data in orbit geometry.
Data in instrument projection.
Image in the perspective of the instrument’s point of view (POV).
Global grid A spatial grid that is uniformly and statically covering the earth surface.
Some global grids use a geoid model (e.g. WGS84 reference ellipsoid) to account for the earth’s oblateness.
Swath grids can be mapped onto global rids by means of a spatial resampling.
Discrete Global Grid (DGG)
(Global) grid system
Global space-time grid
The Cartesian product of a global grid and a timeseries index.
Geo-referencing Linkage of grid nodes to points of the earth surface; expressed in latitude and longitude coordinates. Geo-referencing parameters (e.g. satellite ephemeris) allow linking measurement results with the remotely sensed objects on the land surface.
Time referencing Linkage of a timeseries index (e.g. swath nodes) to UTC time.
Measurement The process of experimentally obtaining one or more quantity values that can reasonably be attributed to a quantity.
Observation
Quantity A property of a phenomenon, body, or substance, where the property can take on a value that can be expressed as a number and a reference.
Observable
Variable
Quantity value A pair of number and reference, together expressing the value of a quantity.
Reference A reference can be a measurement unit, a measurement procedure, a reference material, or a combination of such.
Scale
Measurand A quantity that is intended to be measured.
Calibration An operation performed for an instrument that establishes a relation between measurement standards and the quantity values and uncertainties indicated by the instrument.
In case of L1 data, radiometric and geometric calibration coefficients may be either attached (L1a) or applied (L1b).
Distribution A function that assigns values to the points of a space, time or space-time domain; the assignment may be continuous or discrete, e.g. to the points of a grid.

Soil Moisture ECV Product User Guide (PUG)
Product Version v05.2
Doc Issue 1.0
Date 29-05-2020
60
Term (Acronym) Description Synonyms
Domain The range in space, time or space-time that is designated for value assignment.
Coverage The fraction of the domain where values have been actually assigned.
Raster A two-dimensional array; every element is accessible by the pair of row and column index, is called a pixel, and contains a single or a tuple of values.
Image
Raster image
Pixel An element of a raster.
Timeseries A one-dimensional vector; every element is accessible by an index and contains a single or a tuple of values; the index represents points or periods in time that are sampled in equal (or near-equal) intervals.
Physical system A part of nature chosen for analysis. The part outside the system is its environment. Effects of the environment on the system are taken into account by an abstraction, and vice-versa. The cut between system and environment is a free choice, generally made to simplify analysis. An isolated system is one which has negligible interaction with its environment.
Geo-physical system
Parameter A measurable quantity suited to express the state of a physical system.
In the given context synonymous for “geophysical parameter”.
Sate variable
Geophysical parameter
Environmental Variable
Local parameter Characterizes the state of a local and compact object in space (i.e. a local physical system).
A Local parameter may be measureable with remote sensing instruments, while others may not be measurable with such instruments, but can still be inferred from direct measurements and additional knowledge about the sensed system (retrieval by an inversion or modelling approach).
Local state variable
Model A relation between parameters of a physical system, expressed in a mathematical or computable manner. E.g. as an equation system, Y = f(X), where X and Y being tuples of system parameters; or as a computer simulation.
Mathematical model
Simulation

Soil Moisture ECV Product User Guide (PUG)
Product Version v05.2
Doc Issue 1.0
Date 29-05-2020
61
Term (Acronym) Description Synonyms
Retrieval The process of obtaining parameter values of a physical system from remote sensing measurements, although the parameters cannot be directly measured (observed) with the used remote sensing instruments.
A retrieval is made on a mathematical-physical basis as follows: (1) It is known that at any time quantities X and quantities Y have definite values; (2) it is known that there exists a functional relation between system parameters X and instrument observables Y; (3) there is partial knowledge about the functional relation, e.g. in the form of a forward model Y = f(X) or an inversion X = g(Y); and (4) under certain conditions the knowledge of the functional relation is sufficient to determine X from the measurements of Y.
Parameter retrieval
Retrieval algorithm
The algorithm (or approach, or method) used to retrieve a parameter value from remote sensing measurements.
Retrieval approach or method
Surface Soil Moisture
(SSM)
A local geophysical parameter expressing the content of water in the top soil surface layer (of < 2 cm thickness), in physical units [%] or [m3/m3].
Typical SSM data products from global satellite observations have a spatial resolution of 25x25 km. Regional products downscaled with use of SAR data are available in a resolution of 1x1 km.
TUW change detection algorithm
The algorithm used to retrieve the SSM parameter from calibrated measurements of the radar backscattering coefficient σ0 made by an (active) scatterometer microwave instrument.
Uses climate data timeseries of seasonally varying dry and wet reference values. Developed at TUW; implemented by the WARP processing module.
Land Parameter Retrieval Model
(LPRM)
An iterative forward modelling approach used to retrieve the SSM parameter from calibrated measurements of the brightness temperature TB made by a (passive) radiometer microwave instrument.
Uses a global database of physical soil properties. Developed by NASA and VUA.
Soil Water Index
(SWI)
A measure of the profile Soil Moisture content of soil surface layers within 2-100 cm obtained by using an infiltration model (filtering the SSM timeseries with an exponential function).
Climate Climate is a measure of the average pattern of variation of meteorological variables (e.g. temperature, humidity, atmospheric pressure, wind, precipitation, atmospheric particle count, etc.) in a given region over long periods of time.
A region's climate is generated by the climate system, which has five components: atmosphere, hydrosphere, cryosphere, land surface, and biosphere.

Soil Moisture ECV Product User Guide (PUG)
Product Version v05.2
Doc Issue 1.0
Date 29-05-2020
62
Term (Acronym) Description Synonyms
Essential Climate Variable
(ECV)
Essential Climate Variables are geophysical parameters that are required to support the work of the United Nations Framework Convention on Climate Change (UNFCCC), and that are technically and economically feasible for systematic observation.
An ECV Data Product combines observations from multiple remote-sensing instruments into a space-time grid; is complete and consistent, with a global and continuing coverage; and is intended for use in climate modeling.
Synonyms are Super-collated (L3S) Data and TCDR.
L3S
Thematic Climate Data Record (TCDR)
Climatology Average of a geophysical parameter for a given region; obtained from long-term (many year) observation.
Seasonality Seasonal variation of a parameter’s climatology, e.g. variation over the months of a year.
11 General References
Bartalis, Z. (2009). Spaceborne Scatterometers for Change Detection over Land. In, Institute for Photogrammetry and Remote Sensing (p. 148). Vienna: Vienna University of Technology
Diffenbaugh, N.S., Pal, J.S., Giorgi, F., & Gao, X.J. (2007). Heat stress intensification in the Mediterranean climate change hotspot. Geophysical Research Letters, 34
Dirmeyer, P.A., Gao, X.A., Zhao, M., Guo, Z.C., Oki, T.K., & Hanasaki, N. (2006). GSWP-2 - Multimodel anlysis and implications for our perception of the land surface. Bulletin of the American Meteorological Society, 87, 1381-+
Dorigo, W., Wagner, W., Albergel, C., Albrecht, F., Balsamo, G., Brocca, L., Chung, D., Ertl, M., Forkel, M., Gruber, A., Haas, E., Hamer, P., Hirschi, M., Ikonen, J., Jeu, R.d., Kidd, R., Lahoz, W., Liu, Y.Y., Miralles, D., Mistelbauer, T., Nicolai-Shaw, N., Parinussa, R., Pratola, C., Reimer, C., Schalie, R.v.d., Seneviratne, S.I., Smolander, T., & Lecomte, P. (2017). ESA CCI Soil Moisture for improved Earth system understanding: state-of-the art and future directions. Remote Sensing of Environement
Entin, J.K., Robock, A., Vinnikov, K.Y., Hollinger, S.E., Liu, S., & Namkhai, A. (2000). Temporal and spatial scales of observed soil moisture variations in the extratropics. Journal of Geophysical Research, 105, 11865-11877
Findell, K.L., & Eltahir, E.A.B. (2003a). Atmospheric controls on soil moisture-boundary layer interactions. Part I: Framework development. Journal of Hydrometeorology, 4, 552-569
Findell, K.L., & Eltahir, E.A.B. (2003b). Atmospheric controls on soil moisture-boundary layer interactions. Part II: Feedbacks within the continental United States. Journal of Hydrometeorology, 4, 570-583
Fischer, E.M., Seneviratne, S.I., Luthi, D., & Schar, C. (2007a). Contribution of land-atmosphere coupling to recent European summer heat waves. Geophysical Research Letters, 34
Soil Moisture ECV Product User Guide (PUG)
Product Version v05.2
Doc Issue 1.0
Date 29-05-2020
63
Fischer, E.M., Seneviratne, S.I., Vidale, P.L., Luthi, D., & Schar, C. (2007b). Soil moisture - Atmosphere interactions during the 2003 European summer heat wave. Journal of Climate, 20, 5081-5099
Gruber, A., Scanlon, T., van der Schalie, R., Wagner, W., Dorigo, W. (2019) Evolution of the ESA
CCI Soil Moisture Climate Data Records and their underlying merging methodology. Earth
System Science Data 11, 717-739, https://doi.org/10.5194/essd-11-717-2019
Haarsma, R.J., Selten, F., Hurk, B.V., Hazeleger, W., & Wang, X.L. (2009). Drier Mediterranean soils due to greenhouse warming bring easterly winds over summertime central Europe. Geophysical Research Letters, 36
Hirschi, M., Seneviratne, S.I., Alexandrov, V., Boberg, F., Boroneant, C., Christensen, O.B., Formayer, H., Orlowsky, B., & Stepanek, P. (2011). Observational evidence for soil-moisture impact on hot extremes in southeastern Europe. Nature Geoscience, 4, 17-21
Jaeger, E.B., & Seneviratne, S.I. (2011). Impact of soil moisture-atmosphere coupling on European climate extremes and trends in a regional climate model. Climate Dynamics, 36, 1919-1939
JCGM (2008). Evaluation of measurement data – Guide to the expression of uncertainty in measurement (GUM). JCGM
JCGM (2012). International vocabulary of metrology – Basic and general concepts and assocated terms (VIM). JCGM
Jung, M., Reichstein, M., Ciais, P., Seneviratne, S.I., Sheffield, J., Goulden, M.L., Bonan, G., Cescatti, A., Chen, J., de Jeu, R., Dolman, A.J., Eugster, W., Gerten, D., Gianelle, D., Gobron, N., Heinke, J., Kimball, J., Law, B.E., Montagnani, L., Mu, Q., Mueller, B., Oleson, K., Papale, D., Richardson, A.D., Roupsard, O., Running, S., Tomelleri, E., Viovy, N., Weber, U., Williams, C., Wood, E., Zaehle, S., & Zhang, K. (2010). Recent decline in the global land evapotranspiration trend due to limited moisture supply. Nature, 467, 951-954
Kidd, R.A. (2005). Discrete Global Grid Systems. In, ASCAT Soil Moisture Report Series: Institute of Photogrammetry and Remote Sensing
Koster, R.D., Dirmeyer, P.A., Guo, Z.C., Bonan, G., Chan, E., Cox, P., Gordon, C.T., Kanae, S., Kowalczyk, E., Lawrence, D., Liu, P., Lu, C.H., Malyshev, S., McAvaney, B., Mitchell, K., Mocko, D., Oki, T., Oleson, K., Pitman, A., Sud, Y.C., Taylor, C.M., Verseghy, D., Vasic, R., Xue, Y.K., Yamada, T., & Team, G. (2004). Regions of strong coupling between soil moisture and precipitation. Science, 305, 1138-1140
Koster, R.D., Mahanama, S.P.P., Yamada, T.J., Balsamo, G., Berg, A.A., Boisserie, M., Dirmeyer, P.A., Doblas-Reyes, F.J., Drewitt, G., Gordon, C.T., Guo, Z., Jeong, J.H., Lawrence, D.M., Lee, W.S., Li, Z., Luo, L., Malyshev, S., Merryfield, W.J., Seneviratne, S.I., Stanelle, T., van den Hurk, B., Vitart, F., & Wood, E.F. (2010). Contribution of land surface initialization to subseasonal forecast skill: First results from a multi-model experiment. Geophysical Research Letters, 37
Liu, Y.Y., Dorigo, W.A., Parinussa, R.M., De Jeu, R.A.M., Wagner, W., McCabe, M.F., Evans, J.P., & Van Dijk, A.I.J.M. (2012). Trend-preserving blending of passive and active microwave soil moisture retrievals. Remote Sensing of Environment, 123, 280-297
Soil Moisture ECV Product User Guide (PUG)
Product Version v05.2
Doc Issue 1.0
Date 29-05-2020
64
Liu, Y.Y., Parinussa, R.M., Dorigo, W.A., de Jeu, R.A.M., Wagner, W., van Dijk, A., McCabe, F.M., & Evans, J.P. (2011). Developing an improved soil moisture dataset by blending passive and active microwave satellite-based retrievals. Hydrology and Earth System Sciences, 15, 425-436
Mahfouf, J.F. (1991). Analysis of soil moisture from near surface parameters - A feasibility study. Journal of Applied Meteorology, 30, 1534-1547
Oki, T., & Kanae, S. (2006). Global hydrological cycles and world water resources. Science, 313, 1068-1072
Owe, M., de jeu, R., & Holmes, T. (2008). Multisensor historical climatology of satellite-derived global land surface moisture. Journal of Geophysical Research-Earth Surface, 113, F01002
Pal, J.S., & Eltahir, E.A.B. (2003). A feedback mechanism between soil-moisture distribution and storm tracks. Quarterly Journal of the Royal Meteorological Society, 129, 2279-2297
Rowell, D.P., & Jones, R.G. (2006). Causes and uncertainty of future summer drying over Europe. Climate Dynamics, 27, 281-299
Schubert, S.D., Suarez, M.J., Pegion, P.J., Koster, R.D., & Bacmeister, J.T. (2004). On the cause of the 1930s Dust Bowl. Science, 303, 1855-1859
Seneviratne, S.I., Corti, T., Davin, E.L., Hirschi, M., Jaeger, E.B., Lehner, I., Orlowsky, B., & Teuling, A.J. (2010). Investigating soil moisture-climate interactions in a changing climate - a review. Earth-Science Reviews, 99, 125-161
Seneviratne, S.I., Luthi, D., Litschi, M., & Schar, C. (2006). Land-atmosphere coupling and climate change in Europe. Nature, 443, 205-209
Shukla, J., & Mintz, Y. (1982). Influence of land-surface evapo-transpiration on the earths climate. Science, 215, 1498-1501
Teuling, A.J., Seneviratne, S.I., Stockli, R., Reichstein, M., Moors, E., Ciais, P., Luyssaert, S., van den Hurk, B., Ammann, C., Bernhofer, C., Dellwik, E., Gianelle, D., Gielen, B., Grunwald, T., Klumpp, K., Montagnani, L., Moureaux, C., Sottocornola, M., & Wohlfahrt, G. (2010). Contrasting response of European forest and grassland energy exchange to heatwaves. Nature Geoscience, 3, 722-727
Vinnikov, K.Y., Robock, A., Speranskaya, N.A., & Schlosser, C.A. (1996). Scales of temporal and spatial variability of mitlatitude soil moisture. J. Geophys. Res., 101, 7163-7174
Wagner, W., W. Dorigo, R. de Jeu, D. Fernandez, J. Benveniste, E. Haas, M. Ertl (2012). Fusion of active and passive microwave observations to create an Essential Climate Variable data record on soil moisture. In, XXII ISPRS Congress. Melbourne,Australia
Wu, W.R., & Dickinson, R.E. (2004). Time scales of layered soil moisture memory in the context of land-atmosphere interaction. Journal of Climate, 17, 2752-2764
Zaitchik, B.F., Macalady, A.K., Bonneau, L.R., & Smith, R.B. (2006). Europe's 2003 heat wave: A satellite view of impacts and land-atmosphere feedbacks. International Journal of Climatology, 26, 743-769

Soil Moisture ECV Product User Guide (PUG)
Product Version v05.2
Doc Issue 1.0
Date 29-05-2020
65
12 References Section 7
Abelen, S., & Seitz, F. (2013). Relating satellite gravimetry data to global soil moisture products via data harmonization and correlation analysis. Remote Sensing of Environment, 136, 89-98
Abera, W., Formetta, G., Brocca, L., & Rigon, R. (2016). Water budget modelling of the Upper Blue Nile basin using the JGrass-NewAge model system and satellite data. Hydrol. Earth Syst. Sci. Discuss., 2016, 1-28
Ahlström, A., Smith, B., Lindström, J., Rummukainen, M., & Uvo, C.B. (2013). GCM characteristics explain the majority of uncertainty in projected 21st century terrestrial ecosystem carbon balance. Biogeosciences, 10, 1517-1528
Albergel, C., Dorigo, W., Reichle, R., Balsamo, G., Rosnay, P.d., Muñoz-Sabater, J., Isaksen, L., Jeu, R.d., & Wagner, W. (2013). Skill and global trend analysis of soil moisture from reanalyses and microwave remote sensing. Journal Of Hydrometeorology, 14, 1259–1277
Allam, M.M., Jain Figueroa, A., McLaughlin, D.B., & Eltahir, E.A.B. (2016). Estimation of evaporation over the upper Blue Nile basin by combining observations from satellites and river flow gauges. Water Resources Research, n/a-n/a
Allen, C.D., Macalady, A.K., Chenchouni, H., Bachelet, D., McDowell, N., Vennetier, M., Kitzberger, T., Rigling, A., Breshears, D.D., Hogg, E.H., Gonzalez, P., Fensham, R., Zhang, Z., Castro, J., Demidova, N., Lim, J.-H., Allard, G., Running, S.W., Semerci, A., & Cobb, N. (2010). A global overview of drought and heat-induced tree mortality reveals emerging climate change risks for forests. Forest Ecology and Management, 259, 660-684
Alvarez-Garreton, C., Ryu, D., Western, A.W., Su, C.H., Crow, W.T., Robertson, D.E., & Leahy, C. (2015). Improving operational flood ensemble prediction by the assimilation of satellite soil moisture: comparison between lumped and semi-distributed schemes. Hydrol. Earth Syst. Sci., 19, 1659-1676
An, R., Zhang, L., Wang, Z., Quaye-Ballard, J.A., You, J., Shen, X., Gao, W., Huang, L., Zhao, Y., & Ke, Z. (2016). Validation of the ESA CCI soil moisture product in China. International Journal of Applied Earth Observation and Geoinformation, 48, 28-36
Arnault, J., Wagner, S., Rummler, T., Fersch, B., Bliefernicht, J., Andresen, S., Kunstmann, H. (2015). Role of runoff–infiltration partitioning and resolved overland flow on land–atmosphere feedbacks: a case study with the WRF-hydro coupled modeling system for West Africa. J. Hydrometeorol. 17, 1489–1516.
Balsamo, G., Albergel, C., Beljaars, A., Boussetta, S., Brun, E., Cloke, H., Dee, D., Dutra, E., Muñoz-Sabater, J., Pappenberger, F., de Rosnay, P., Stockdale, T., & Vitart, F. (2015). ERA-Interim/Land: a global land surface reanalysis data set. Hydrol. Earth Syst. Sci., 19, 389-407
Balsamo, G., Viterbo, P., Beljaars, A., van den Hurk, B., Hirschi, M., Betts, A.K., & Scipal, K. (2009). A Revised Hydrology for the ECMWF Model: Verification from Field Site to Terrestrial
Soil Moisture ECV Product User Guide (PUG)
Product Version v05.2
Doc Issue 1.0
Date 29-05-2020
66
Water Storage and Impact in the Integrated Forecast System. Journal Of Hydrometeorology, 10, 623-643
Barichivich, J., Briffa, K.R., Myneni, R., Van der Schrier, G., Dorigo, W., Tucker, C.J., Osborn, T., & Melvin, T. (2014). Temperature and Snow-Mediated Moisture Controls of Summer Photosynthetic Activity in Northern Terrestrial Ecosystems between 1982 and 2011. Remote Sensing, 6, 1390-1431
Bartalis, Z. (2009). Spaceborne Scatterometers for Change Detection over Land. In, Institute for Photogrammetry and Remote Sensing (p. 148). Vienna: Vienna University of Technology
Bartsch, A., Baltzer, H., & George, C. (2009). The influence of regional surface soil moisture anomalies on forest fires in Siberia observed from satellites. Environmental Research Letters, 4, 45021-45021
Bauer-Marschallinger, B., Dorigo, W.A., Wagner, W., & van Dijk, A.I.J.M. (2013). How oceanic oscillation drives soil moisture variations over mainland Australia: An analysis of 32 years of satellite observations. Journal of Climate, 26, 10159–10173
Beljaars, A.C.M., Viterbo, P., Miller, M.J., & Betts, A.K. (1996). The Anomalous Rainfall over the United States during July 1993: Sensitivity to Land Surface Parameterization and Soil Moisture Anomalies. Monthly Weather Review, 124, 362-383
Bisselink, B., Van Meijgaard, E., Dolman, A.J., & De Jeu, R.A.M. (2011). Initializing a regional climate model with satellite-derived soil moisture. Journal of Geophysical Research D: Atmospheres, 116
Blunden, J., & Arndt, D.S. (2016). State of the Climate in 2015. Bulletin of the American Meteorological Society, 97, S1–S27
Brocca, L., Ciabatta, L., Massari, C., Moramarco, T., Hahn, S., Hasenauer, S., Kidd, R., Dorigo, W., Wagner, W., & Levizzani, V. (2014). Soil as a natural raingauge: estimating global rainfall from satellite soil moisture data. Journal of Geophysical Research D: Atmospheres, 119, 5128–5141
Brocca, L., Hasenauer, S., Lacava, T., Melone, F., Moramarco, T., Wagner, W., Dorigo, W., Matgen, P., Martínez-Fernández, J., Llorens, P., Latron, J., Martin, C., & Bittelli, M. (2011). Soil moisture estimation through ASCAT and AMSR-E sensors: An intercomparison and validation study accross Europe. Remote Sensing of Environment, submitted
Brocca, L., Melone, F., Moramarco, T., Wagner, W., Naeimi, V., Bartalis, Z., & Hasenauer, S. (2010). Improving runoff prediction through the assimilation of the ASCAT soil moisture product. Hydrol. Earth Syst. Sci., 14, 1881-1893
Brocca, L., Moramarco, T., Melone, F., & Wagner, W. (2013). A new method for rainfall estimation through soil moisture observations. Geophysical Research Letters, 40, 853-858

Soil Moisture ECV Product User Guide (PUG)
Product Version v05.2
Doc Issue 1.0
Date 29-05-2020
67
Carrão, H., Russo, S., Sepulcre-Canto, G., & Barbosa, P. (2016). An empirical standardized soil moisture index for agricultural drought assessment from remotely sensed data. International Journal of Applied Earth Observation and Geoinformation, 48, 74-84
Carvalhais, N., Forkel, M., Khomik, M., Bellarby, J., Jung, M., Migliavacca, M., Μu, M., Saatchi, S., Santoro, M., Thurner, M., Weber, U., Ahrens, B., Beer, C., Cescatti, A., Randerson, J.T., & Reichstein, M. (2014). Global covariation of carbon turnover times with climate in terrestrial ecosystems. Nature, 514, 213-217
Casagrande, E., Mueller, B., Miralles, D.G., Entekhabi, D., & Molini, A. (2015). Wavelet correlations to reveal multiscale coupling in geophysical systems. Journal of Geophysical Research: Atmospheres, 120, 7555-7572
Charles, I., Luke, T.E., Willmot, K.E., Toshihisa, M., Amin, K.D., Charles, K.G., Jun, W., Eric, M.W., Jejung, L., Jimmy, A., Churchill, O., John, B., Frederick, S.P., & Shahid, H. (2016). Biomass burning, land-cover change, and the hydrological cycle in Northern sub-Saharan Africa. Environmental Research Letters, 11, 095005
Chen, T., de Jeu, R.A.M., Liu, Y.Y., van der Werf, G.R., & Dolman, A.J. (2014). Using satellite based soil moisture to quantify the water driven variability in NDVI: A case study over mainland Australia. Remote Sensing of Environment, 140, 330-338
Chen, T., McVicar, T., Wang, G., Chen, X., de Jeu, R., Liu, Y., Shen, H., Zhang, F., & Dolman, A. (2016). Advantages of Using Microwave Satellite Soil Moisture over Gridded Precipitation Products and Land Surface Model Output in Assessing Regional Vegetation Water Availability and Growth Dynamics for a Lateral Inflow Receiving Landscape. Remote Sensing, 8, 428
Ciabatta, L., Massari, C., Brocca, L., Reimer, C., Hann, S., Paulik, C., Dorigo, W., & Wagner, W. (2016). Using Python® language for the validation of the CCI soil moisture products via SM2RAIN. PeerJ Preprints, 4, e2131v2134
De Jeu, R., Dorigo, W., Wagner, W., & Liu, Y. (2011). [Global Climate] Soil Moisture [in: State of the Climate in 2010]. Bulletin of the American Meteorological Society, 92, S52-S53
De Jeu, R.A.M., Dorigo, W.A., Parinussa, R.M., Wagner, W., & Chung, D. (2012). [Global Climate] Sol Moisture [in: State of the Climate in 2011]. Bulletin of the American Meteorological Society, 93, S30-S34
de Rosnay, P., Drusch, M., Vasiljevic, D., Balsamo, G., Albergel, C., & Isaksen, L. (2013). A simplified Extended Kalman Filter for the global operational soil moisture analysis at ECMWF. Quarterly Journal of the Royal Meteorological Society, 139, 1199-1213
Dharssi, I., Bovis, K.J., Macpherson, B., & Jones, C.P. (2011). Operational assimilation of ASCAT surface soil wetness at the Met Office. Hydrology and Earth System Sciences, 15, 2729-2746
Diffenbaugh, N.S., Pal, J.S., Giorgi, F., & Gao, X.J. (2007). Heat stress intensification in the Mediterranean climate change hotspot. Geophysical Research Letters, 34

Soil Moisture ECV Product User Guide (PUG)
Product Version v05.2
Doc Issue 1.0
Date 29-05-2020
68
Dirmeyer, P.A., Gao, X.A., Zhao, M., Guo, Z.C., Oki, T.K., & Hanasaki, N. (2006). GSWP-2 - Multimodel anlysis and implications for our perception of the land surface. Bulletin of the American Meteorological Society, 87, 1381-+
Dorigo, W., Chung, D., Parinussa, R.M., Reimer, C., Hahn, S., Liu, Y.Y., Wagner, W., de Jeu, R.A.M., Paulik, C., & Wang, G. (2014). [Global Climate] Soil Moisture [in: “State of the Climate in 2013”]. Bulletin American Meteorological Society, 95, S25-S26
Dorigo, W., & De Jeu, R. (2016). Satellite soil moisture for advancing our understanding of earth system processes and climate change. International Journal of Applied Earth Observation and Geoinformation, 48, 1-4
Dorigo, W., De Jeu, R., Chung, D., Parinussa, R., Liu, Y., Wagner, W., & Fernandez-Prieto, D. (2012). Evaluating global trends (1988-2010) in homogenized remotely sensed surface soil moisture. Geophysical Research Letters, 39, L18405
Dorigo, W., Reimer, C., Chung, D., Parinussa, R.M., Melzer, T., Wagner, W., de Jeu, R.A.M., & Kidd, R. (2015a). [Hydrological cyce] Soil Moisture [in: “State of the Climate in 2014”]. Bulletin American Meteorological Society, 96, S28-S29
Dorigo, W.A., Chung, D., Gruber, A., Hahn, S., Mistelbauer, T., Parinussa, R.M., Paulik, C., Reimer, C., van der Schalie, R., de Jeu, R.A.M., & Wagner, W. (2016). Soil Moisture [in: “State of the Climate in 2015”]. Bulletin American Meteorological Society, 97, S31-S32
Dorigo, W.A., Gruber, A., De Jeu, R.A.M., Wagner, W., Stacke, T., Loew, A., Albergel, C., Brocca, L., Chung, D., Parinussa, R.M., & Kidd, R. (2015b). Evaluation of the ESA CCI soil moisture product using ground-based observations. Remote Sensing of Environment, 162, 380-395
Douville, H., Viterbo, P., Mahfouf, J.-F., & Beljaars, A.C.M. (2000). Evaluation of the Optimum Interpolation and Nudging Techniques for Soil Moisture Analysis Using FIFE Data. Monthly Weather Review, 128, 1733-1756
Drusch, M., & Viterbo, P. (2007). Assimilation of screen-level variables in ECMWF's integrated forecast system: A study on the impact on the forecast quality and analyzed soil moisture. Monthly Weather Review, 135, 300-314
Du, E., Vittorio, A.D., & Collins, W.D. (2016). Evaluation of hydrologic components of community land model 4 and bias identification. International Journal of Applied Earth Observation and Geoinformation, 48, 5-16
Du, L., Tian, Q., Yu, T., Meng, Q., Jancso, T., Udvardy, P., & Huang, Y. (2013). A comprehensive drought monitoring method integrating MODIS and TRMM data. International Journal of Applied Earth Observation and Geoinformation, 23, 245-253
Enenkel, M., Steiner, C., Mistelbauer, T., Dorigo, W., Wagner, W., See, L., Atzberger, C., Schneider, S., & Rogenhofer, E. (2016). A Combined Satellite-Derived Drought Indicator to Support Humanitarian Aid Organizations. Remote Sensing, 8, 340
Soil Moisture ECV Product User Guide (PUG)
Product Version v05.2
Doc Issue 1.0
Date 29-05-2020
69
Entin, J.K., Robock, A., Vinnikov, K.Y., Hollinger, S.E., Liu, S., & Namkhai, A. (2000). Temporal and spatial scales of observed soil moisture variations in the extratropics. Journal of Geophysical Research, 105, 11865-11877
Fang, L., Hain, C.R., Zhan, X., & Anderson, M.C. (2016). An inter-comparison of soil moisture data products from satellite remote sensing and a land surface model. International Journal of Applied Earth Observation and Geoinformation, 48, 37-50
Feng, H. (2016). Individual contributions of climate and vegetation change to soil moisture trends across multiple spatial scales. Scientific Reports, 6, 32782
Findell, K.L., & Eltahir, E.A.B. (2003). Atmospheric controls on soil moisture-boundary layer interactions. Part I: Framework development. Journal Of Hydrometeorology, 4, 552-569
Fischer, E.M., Seneviratne, S.I., Luthi, D., & Schar, C. (2007a). Contribution of land-atmosphere coupling to recent European summer heat waves. Geophysical Research Letters, 34
Fischer, E.M., Seneviratne, S.I., Lüthi, D., & Schär, C. (2007b). Contribution of land-atmosphere coupling to recent European summer heat waves. Geophysical Research Letters, 34, n/a-n/a
Fischer, E.M., Seneviratne, S.I., Vidale, P.L., Luthi, D., & Schar, C. (2007c). Soil moisture - Atmosphere interactions during the 2003 European summer heat wave. Journal of Climate, 20, 5081-5099
Forkel, M., Dorigo, W., Lasslop, G., Teubner, I., Chuvieco, E., & Thonicke, K. (2016). Identifying required model structures to predict global fire activity from satellite and climate data. Geosci. Model Dev. Discuss., 2016, 1-35
Forkel, M., Migliavacca, M., Thonicke, K., Reichstein, M., Schaphoff, S., Weber, U., & Carvalhais, N. (2015). Co-dominant water control on global inter-annual variability and trends in land surface phenology and greenness. Global Change Biology, n/a-n/a
Forkel, M., Thonicke, K., Beer, C., Cramer, W., Bartalev, S., & Schmullius, C. (2012). Extreme fire events are related to previous-year surface moisture conditions in permafrost-underlain larch forests of Siberia. Environmental Research Letters, 7, 044021
Friend, A.D., Lucht, W., Rademacher, T.T., Keribin, R., Betts, R., Cadule, P., Ciais, P., Clark, D.B., Dankers, R., Falloon, P.D., Ito, A., Kahana, R., Kleidon, A., Lomas, M.R., Nishina, K., Ostberg, S., Pavlick, R., Peylin, P., Schaphoff, S., Vuichard, N., Warszawski, L., Wiltshire, A., & Woodward, F.I. (2014). Carbon residence time dominates uncertainty in terrestrial vegetation responses to future climate and atmospheric CO2. Proceedings of the National Academy of Sciences, 111, 3280-3285
Gruber, A., Dorigo, W., Crow, W., & Wagner, W. (2017). Triple Collocation-Based Merging of Satellite Soil Moisture Retrievals. IEEE Transactions of Geoscience and Remote Sensing

Soil Moisture ECV Product User Guide (PUG)
Product Version v05.2
Doc Issue 1.0
Date 29-05-2020
70
Gruber, A., Scanlon, T., van der Schalie, R., Wagner, W., & Dorigo, W. (2019). Evolution of the ESA CCI Soil Moisture Climate Data Records and their underlying merging methodology. Earth System Science Data, 11, 717-739
Guillod, B.P., Orlowsky, B., Miralles, D., Teuling, A.J., Blanken, P.D., Buchmann, N., Ciais, P., Ek, M., Findell, K.L., Gentine, P., Lintner, B.R., Scott, R.L., Van den Hurk, B., & I. Seneviratne, S. (2014). Land-surface controls on afternoon precipitation diagnosed from observational data: uncertainties and confounding factors. Atmos. Chem. Phys., 14, 8343-8367
Guillod, B.P., Orlowsky, B., Miralles, D.G., Teuling, A.J., & Seneviratne, S.I. (2015). Reconciling spatial and temporal soil moisture effects on afternoon rainfall. Nature Communications, 6
Haarsma, R.J., Selten, F., Hurk, B.V., Hazeleger, W., & Wang, X.L. (2009). Drier Mediterranean soils due to greenhouse warming bring easterly winds over summertime central Europe. Geophysical Research Letters, 36
Hirschi, M., Mueller, B., Dorigo, W., & Seneviratne, S.I. (2014). Using remotely sensed soil moisture for land–atmosphere coupling diagnostics: The role of surface vs. root-zone soil moisture variability. Remote Sensing of Environment, 154, 246-252
Hirschi, M., Seneviratne, S.I., Alexandrov, V., Boberg, F., Boroneant, C., Christensen, O.B., Formayer, H., Orlowsky, B., & Stepanek, P. (2011). Observational evidence for soil-moisture impact on hot extremes in southeastern Europe. Nature Geoscience, 4, 17-21
Hogg, E.H., Barr, A.G., & Black, T.A. (2013). A simple soil moisture index for representing multi-year drought impacts on aspen productivity in the western Canadian interior. Agricultural and Forest Meteorology, 178–179, 173-182
Holmes, T.R.H., De Jeu, R.A.M., Owe, M., & Dolman, A.J. (2009). Land surface temperature from Ka band (37 GHz) passive microwave observations. Journal of Geophysical Research-Atmospheres, 114
HSAF (2018). Algorithm Theoretical Baseline Document (ATBD), Metop ASCAT Soil Moisture Data Records v0.7. In
Jaeger, E.B., & Seneviratne, S.I. (2011). Impact of soil moisture-atmosphere coupling on European climate extremes and trends in a regional climate model. Climate Dynamics, 36, 1919-1939
JCGM (2008). Evaluation of measurement data – Guide to the expression of uncertainty in measurement (GUM). JCGM
JCGM (2012). International vocabulary of metrology – Basic and general concepts and assocated terms (VIM). JCGM
Ji, L., & Peters, A.J. (2003). Assessing vegetation response to drought in the northern Great Plains using vegetation and drought indices. Remote Sensing of Environment, 87, 85-98

Soil Moisture ECV Product User Guide (PUG)
Product Version v05.2
Doc Issue 1.0
Date 29-05-2020
71
Jung, M., Reichstein, M., Ciais, P., Seneviratne, S.I., Sheffield, J., Goulden, M.L., Bonan, G., Cescatti, A., Chen, J., de Jeu, R., Dolman, A.J., Eugster, W., Gerten, D., Gianelle, D., Gobron, N., Heinke, J., Kimball, J., Law, B.E., Montagnani, L., Mu, Q., Mueller, B., Oleson, K., Papale, D., Richardson, A.D., Roupsard, O., Running, S., Tomelleri, E., Viovy, N., Weber, U., Williams, C., Wood, E., Zaehle, S., & Zhang, K. (2010). Recent decline in the global land evapotranspiration trend due to limited moisture supply. Nature, 467, 951-954
Kaminski, T., Knorr, W., Schürmann, G., Scholze, M., Rayner, P.J., Zaehle, S., Blessing, S., Dorigo, W., Gayler, V., Giering, R., Gobron, N., Grant, J., Heimann, M., Hooker-Strout, A., Houweling, S., Kato, T., Kattge, J., Kelley, D., Kemp, S., Koffi, E.N., Kostler, C., Mathieu, P.P., Pinty, B., Reick, C., Rödenbeck, C., Schnur, R., Scipal, K., Sebald, C., Stacke, T., Terwisscha van Scheltinga, A., Vossbeck, M., Widmann, H., & Ziehn, T. (2013). The BETHY/JSBACH Carbon Cycle Data Assimilation System: experiences and challenges. Journal of Geophysical Research: Biogeosciences, 118, 1414-1426
Kidd, R.A. (2005). Discrete Global Grid Systems. In, ASCAT Soil Moisture Report Series: Institute of Photogrammetry and Remote Sensing
Klingmüller, K., Pozzer, A., Metzger, S., Stenchikov, G.L., & Lelieveld, J. (2016). Aerosol optical depth trend over the Middle East. Atmospheric Chemistry and Physics, 16, 5063-5073
Koster, R.D., Dirmeyer, P.A., Guo, Z.C., Bonan, G., Chan, E., Cox, P., Gordon, C.T., Kanae, S., Kowalczyk, E., Lawrence, D., Liu, P., Lu, C.H., Malyshev, S., McAvaney, B., Mitchell, K., Mocko, D., Oki, T., Oleson, K., Pitman, A., Sud, Y.C., Taylor, C.M., Verseghy, D., Vasic, R., Xue, Y.K., Yamada, T., & Team, G. (2004a). Regions of strong coupling between soil moisture and precipitation. Science, 305, 1138-1140
Koster, R.D., Mahanama, S.P.P., Yamada, T.J., Balsamo, G., Berg, A.A., Boisserie, M., Dirmeyer, P.A., Doblas-Reyes, F.J., Drewitt, G., Gordon, C.T., Guo, Z., Jeong, J.H., Lawrence, D.M., Lee, W.S., Li, Z., Luo, L., Malyshev, S., Merryfield, W.J., Seneviratne, S.I., Stanelle, T., van den Hurk, B., Vitart, F., & Wood, E.F. (2010). Contribution of land surface initialization to subseasonal forecast skill: First results from a multi-model experiment. Geophysical Research Letters, 37
Koster, R.D., Mahanama, S.P.P., Yamada, T.J., Balsamo, G., Berg, A.A., Boisserie, M., Dirmeyer, P.A., Doblas-Reyes, F.J., Drewitt, G., Gordon, C.T., Guo, Z., Jeong, J.H., Lee, W.S., Li, Z., Luo, L., Malyshev, S., Merryfield, W.J., Seneviratne, S.I., Stanelle, T., van den Hurk, B.J.J.M., Vitart, F., & Wood, E.F. (2011). The Second Phase of the Global Land–Atmosphere Coupling Experiment: Soil Moisture Contributions to Subseasonal Forecast Skill. Journal Of Hydrometeorology, 12, 805-822
Koster, R.D., Suarez, M.J., Liu, P., Jambor, U., Berg, A., Kistler, M., Reichle, R., Rodell, M., & Famiglietti, J. (2004b). Realistic Initialization of Land Surface States: Impacts on Subseasonal Forecast Skill. Journal Of Hydrometeorology, 5, 1049-1063
Kumar, S.V., Peters-Lidard, C.D., Santanello, J.A., Reichle, R.H., Draper, C.S., Koster, R.D., Nearing, G., & Jasinski, M.F. (2015). Evaluating the utility of satellite soil moisture retrievals

Soil Moisture ECV Product User Guide (PUG)
Product Version v05.2
Doc Issue 1.0
Date 29-05-2020
72
over irrigated areas and the ability of land data assimilation methods to correct for unmodeled processes. Hydrol. Earth Syst. Sci., 19, 4463-4478
Lannoy, G.J.M.D., & Reichle, R.H. (2016). Global Assimilation of Multiangle and Multipolarization SMOS Brightness Temperature Observations into the GEOS-5 Catchment Land Surface Model for Soil Moisture Estimation. Journal Of Hydrometeorology, 17, 669-691
Lauer, A., Eyring, V., Righi, M., Buchwitz, M., Defourny, P., Evaldsson, M., Friedlingstein, P., de Jeu, R., de Leeuw, G., Loew, A., Merchant, C.J., Müller, B., Popp, T., Reuter, M., Sandven, S., Senftleben, D., Stengel, M., Van Roozendael, M., Wenzel, S., & Willén, U. (2017). Benchmarking CMIP5 models with a subset of ESA CCI Phase 2 data using the ESMValTool. Remote Sensing of Environment
Li, L., Njoku, E.G., Im, E., Chang, P.S., & Germain, K.S. (2004). A preliminary survey of radio-frequency interference over the US in Aqua AMSR-E data. IEEE Transactions on Geoscience and Remote Sensing, 42, 380-390
Lievens, H., Tomer, S.K., Al Bitar, A., De Lannoy, G.J.M., Drusch, M., Dumedah, G., Hendricks Franssen, H.J., Kerr, Y.H., Martens, B., Pan, M., Roundy, J.K., Vereecken, H., Walker, J.P., Wood, E.F., Verhoest, N.E.C., & Pauwels, V.R.N. (2015). SMOS soil moisture assimilation for improved hydrologic simulation in the Murray Darling Basin, Australia. Remote Sensing of Environment, 168, 146-162
Liu, Y., Pan, Z., Zhuang, Q., Miralles, D.G., Teuling, A.J., Zhang, T., An, P., Dong, Z., Zhang, J., He, D., Wang, L., Pan, X., Bai, W., & Niyogi, D. (2015). Agriculture intensifies soil moisture decline in Northern China. Scientific Reports, 5, 11261
Liu, Y.Y., Parinussa, R.M., Dorigo, W.A., de Jeu, R.A.M., Wagner, W., van Dijk, A., McCabe, F.M., & Evans, J.P. (2011). Developing an improved soil moisture dataset by blending passive and active microwave satellite-based retrievals. Hydrology and Earth System Sciences, 15, 425-436
Loew, A., Stacke, T., Dorigo, W., de Jeu, R., & Hagemann, S. (2013). Potential and limitations of multidecadal satellite soil moisture observations for selected climate model evaluation studies. Hydrol. Earth Syst. Sci., 17, 3523-3542
Mahfouf, J.F. (1991). Analysis of soil moisture from near surface parameters - A feasibility study. Journal of Applied Meteorology, 30, 1534-1547
Martens, B., Miralles, D.G., Lievens, H., van der Schalie, R., de Jeu, R.A.M., Fernandez-Prieto, D., Beck, H.E., Dorigo, W.A., & Verhoest, N.E.C. (2017). GLEAM v3: satellite-based land evaporation and root-zone soil moisture. Geoscientific Model Development, 10, 1903-1925
Massari, C., Brocca, L., Tarpanelli, A., Ciabatta, L., Camici, S., Moramarco, T., Dorigo, W., & Wagner, W. (2015). Assessing the Potential of CCI Soil Moisture Products for data assimilation in rainfall-runoff modelling: A Case Study for the Niger River. In, Earth Observation for Water Cycle Science 2015. Frascati, Italy

Soil Moisture ECV Product User Guide (PUG)
Product Version v05.2
Doc Issue 1.0
Date 29-05-2020
73
McDowell, N.G., Beerling, D.J., Breshears, D.D., Fisher, R.A., Raffa, K.F., & Stitt, M. (2011). The interdependence of mechanisms underlying climate-driven vegetation mortality. Trends in Ecology & Evolution, 26, 523-532
McKee, T.B., Doesken, N.J., & Kleist, J. (1993). The Relationship of Drought Frequency and Duration to Time Scales. In, Eighth Conference on Applied Climatology. Anaheim, California
McNally, A., Shukla, S., Arsenault, K.R., Wang, S., Peters-Lidard, C.D., & Verdin, J.P. (2016). Evaluating ESA CCI soil moisture in East Africa. International Journal of Applied Earth Observation and Geoinformation, 48, 96-109
Miralles, D.G., Holmes, T.R.H., De Jeu, R.A.M., Gash, J.H., Meesters, A.G.C.A., & Dolman, A.J. (2011). Global land-surface evaporation estimated from satellite-based observations. Hydrology and Earth System Sciences, 15, 453-469
Miralles, D.G., Teuling, A.J., van Heerwaarden, C.C., & Vila-Guerau de Arellano, J. (2014a). Mega-heatwave temperatures due to combined soil desiccation and atmospheric heat accumulation. Nature Geosci, 7, 345-349
Miralles, D.G., Van den Berg, M.J., Gash, J.H., Parinussa, R.M., De Jeu, R.A.M., Beck, H.E., Holmes, D.J., Jimenez, C., Verhoest, N.E.C., Dorigo, W.A., Teuling, A.J., & Dolman, A.J. (2014b). El Niño–La Niña cycle and recent trends in continental evaporation. Nature Climate Change, 4, 122-126
Muñoz, A.A., Barichivich, J., Christie, D.A., Dorigo, W., Sauchyn, D., González-Reyes, Á., Villalba, R., Lara, A., Riquelme, N., & González, M.E. (2014). Patterns and drivers of Araucaria araucana forest growth along a biophysical gradient in the northern Patagonian Andes: Linking tree rings with satellite observations of soil moisture. Austral Ecology, 39, 158-169
Nemani, R.R., Keeling, C.D., Hashimoto, H., Jolly, W.M., Piper, S.C., Tucker, C.J., Myneni, R.B., & Running, S.W. (2003). Climate-driven increases in global terrestrial net primary production from 1982 to 1999. Science, 300, 1560-1563
Nicolai-Shaw, N., Gudmundsson, L., Hirschi, M., & Seneviratne, S.I. (2016). Long-term predictability of soil moisture dynamics at the global scale: Persistence versus large-scale drivers. Geophysical Research Letters, 43, 8554-8562
Nijs, A.H.A.d., Parinussa, R.M., Jeu, R.A.M.d., Schellekens, J., & Holmes, T.R.H. (2015). A Methodology to Determine Radio-Frequency Interference in AMSR2 Observations. IEEE Transactions on Geoscience and Remote Sensing, 53, 5148-5159
Oki, T., & Kanae, S. (2006). Global hydrological cycles and world water resources. Science, 313, 1068-1072
Owe, M., de Jeu, R., & Holmes, T. (2008). Multisensor historical climatology of satellite-derived global land surface moisture. Journal of Geophysical Research-Earth Surface, 113, F01002

Soil Moisture ECV Product User Guide (PUG)
Product Version v05.2
Doc Issue 1.0
Date 29-05-2020
74
Owe, M., Jeu, R.d., & Walker, J. (2001). A methodology for surface soil moisture and vegetation optical depth retrieval using the microwave polarization difference index. IEEE Transactions on Geoscience and Remote Sensing, 39, 1643-1654
Pal, J.S., & Eltahir, E.A.B. (2003). A feedback mechanism between soil-moisture distribution and storm tracks. Quarterly Journal of the Royal Meteorological Society, 129, 2279-2297
Palmer, T.N., Doblas-Reyes, F.J., Weisheimer, A., & Rodwell, M.J. (2008). Toward Seamless Prediction: Calibration of Climate Change Projections Using Seasonal Forecasts. Bulletin of the American Meteorological Society, 89, 459-470
Palmer, W.C. (1965). Meteorological drought. U.S. Weather Bureau Research Paper 45, Washington, DC.
Papagiannopoulou, C., Miralles, D.G., Decubber, S., Demuzere, M., Verhoest, N.E.C., Dorigo, W.A., & Waegeman, W. (2017a). A non-linear Granger-causality framework to investigate climate–vegetation dynamics. Geosci. Model Dev., 10, 1945-1960
Papagiannopoulou, C., Miralles, D.G., Dorigo, W.A., Verhoest, N.E.C., Depoorter, M., & Waegeman, W. (2017b). Vegetation anomalies caused by antecedent precipitation in most of the world. Environmental Research Letters, 12, 074016
Parinussa, R.M., De Jeu, R., Wagner, W., Dorigo, W., Fang, F., Teng, W., & Liu, Y.Y. (2013). [Global Climate] Soil Moisture [in: State of the Climate in 2012]. Bulletin of the American Meteorological Society, 94, S24-S25
Parinussa, R.M., Holmes, T.R.H., Yilmaz, M.T., & Crow, W.T. (2011). The impact of land surface temperature on soil moisture anomaly detection from passive microwave observations. Hydrol. Earth Syst. Sci., 15, 3135-3151
Pieczka, I., Pongrácz, R., Szabóné André, K., Kelemen, F.D., & Bartholy, J. (2016). Sensitivity analysis of different parameterization schemes using RegCM4.3 for the Carpathian region. Theoretical and Applied Climatology, 1-14
Polcher, J., Piles, M., Gelati, E., Barella-Ortiz, A., & Tello, M. (2016). Comparing surface-soil moisture from the SMOS mission and the ORCHIDEE land-surface model over the Iberian Peninsula. Remote Sensing of Environment, 174, 69-81
Poulter, B., Frank, D., Ciais, P., Myneni, R.B., Andela, N., Bi, J., Broquet, G., Canadell, J.G., Chevallier, F., Liu, Y.Y., Running, S.W., Sitch, S., & van der Werf, G.R. (2014). Contribution of semi-arid ecosystems to interannual variability of the global carbon cycle. Nature, 509, 600-603
Poulter, B., Pederson, N., Liu, H., Zhu, Z., D’Arrigo, R., Ciais, P., Davi, N., Frank, D., Leland, C., Myneni, R., Piao, S., & Wang, T. (2013). Recent trends in Inner Asian forest dynamics to temperature and precipitation indicate high sensitivity to climate change. Agricultural and Forest Meteorology, 178–179, 31-45

Soil Moisture ECV Product User Guide (PUG)
Product Version v05.2
Doc Issue 1.0
Date 29-05-2020
75
Qiu, J., Crow, W.T., & Nearing, G.S. (2016a). The Impact of Vertical Measurement Depth on the Information Content of Soil Moisture for Latent Heat Flux Estimation. Journal Of Hydrometeorology, 17, 2419-2430
Qiu, J., Gao, Q., Wang, S., & Su, Z. (2016b). Comparison of temporal trends from multiple soil moisture data sets and precipitation: The implication of irrigation on regional soil moisture trend. International Journal of Applied Earth Observation and Geoinformation, 48, 17-27
Rahmani, A., Golian, S., & Brocca, L. (2016). Multiyear monitoring of soil moisture over Iran through satellite and reanalysis soil moisture products. International Journal of Applied Earth Observation and Geoinformation, 48, 85-95
Ramanathan, V., Crutzen, P.J., Kiehl, J.T., & Rosenfeld, D. (2001). Aerosols, Climate, and the Hydrological Cycle. Science, 294, 2119-2124
Reichstein, M., Bahn, M., Ciais, P., Frank, D., Mahecha, M.D., Seneviratne, S.I., Zscheischler, J., Beer, C., Buchmann, N., Frank, D.C., Papale, D., Rammig, A., Smith, P., Thonicke, K., van der Velde, M., Vicca, S., Walz, A., & Wattenbach, M. (2013). Climate extremes and the carbon cycle. Nature, 500, 287-295
Richardson, A.D., Keenan, T.F., Migliavacca, M., Ryu, Y., Sonnentag, O., & Toomey, M. (2013). Climate change, phenology, and phenological control of vegetation feedbacks to the climate system. Agricultural and Forest Meteorology, 169, 156-173
Rowell, D.P., & Jones, R.G. (2006). Causes and uncertainty of future summer drying over Europe. Climate Dynamics, 27, 281-299
Sahoo, A.K., De Lannoy, G.J.M., Reichle, R.H., & Houser, P.R. (2013). Assimilation and downscaling of satellite observed soil moisture over the Little River Experimental Watershed in Georgia, USA. Advances in Water Resources, 52, 19-33
Sakai, T., Iizumi, T., Okada, M., Nishimori, M., Grünwald, T., Prueger, J., Cescatti, A., Korres, W., Schmidt, M., Carrara, A., Loubet, B., & Ceschia, E. (this issue). Varying applicability of four different satellite-derived soil moisture products to global gridded crop model evaluation. International Journal of Applied Earth Observation and Geoinformation
Schellekens, J., Dutra, E., Martinez-de la Torre, A., Balsamo, G., van Dijk, A., Weiland, F.S., Minvielle, M., Calvet, J.C., Decharme, B., Eisner, S., Fink, G., Florke, M., Pessenteiner, S., van Beek, R., Polcher, J., Beck, H., Orth, R., Calton, B., Burke, S., Dorigo, W., & Weedon, G.P. (2017). A global water resources ensemble of hydrological models: the eartH2Observe Tier-1 dataset. Earth System Science Data, 9, 389-413
Scholze, M., Kaminski, T., Knorr, W., Blessing, S., Vossbeck, M., Grant, J.P., & Scipal, K. (2016). Simultaneous assimilation of SMOS soil moisture and atmospheric CO2 in-situ observations to constrain the global terrestrial carbon cycle. Remote Sensing of Environment, 180, 334-345

Soil Moisture ECV Product User Guide (PUG)
Product Version v05.2
Doc Issue 1.0
Date 29-05-2020
76
Schubert, S.D., Suarez, M.J., Pegion, P.J., Koster, R.D., & Bacmeister, J.T. (2004). On the cause of the 1930s Dust Bowl. Science, 303, 1855-1859
Scipal, K., Drusch, M., & Wagner, W. (2008). Assimilation of a ERS scatterometer derived soil moisture index in the ECMWF numerical weather prediction system. Advances in Water Resources, 31, 1101-1112
Seneviratne, S.I., Corti, T., Davin, E.L., Hirschi, M., Jaeger, E.B., Lehner, I., Orlowsky, B., & Teuling, A.J. (2010). Investigating soil moisture-climate interactions in a changing climate - a review. Earth-Science Reviews, 99, 125-161
Seneviratne, S.I., Koster, R.D., Guo, Z., Dirmeyer, P.A., Kowalczyk, E., Lawrence, D., Liu, P., Mocko, D., Lu, C.-H., Oleson, K.W., & Verseghy, D. (2006a). Soil Moisture Memory in AGCM Simulations: Analysis of Global Land–Atmosphere Coupling Experiment (GLACE) Data. Journal Of Hydrometeorology, 7, 1090-1112
Seneviratne, S.I., Luthi, D., Litschi, M., & Schar, C. (2006b). Land-atmosphere coupling and climate change in Europe. Nature, 443, 205-209
Seneviratne, S.I., Lüthi, D., Litschi, M., & Schär, C. (2006c). Land-atmosphere coupling and climate change in Europe. Nature, 443, 205-209
Seneviratne, S.I., Nicholls, N., Easterling, D., Goodess, C.M., Kanae, S., Kossin, J., Luo, Y., Marengo, J., McInnes, K., Rahimi, M., Reichstein, M., Sorteberg, A., Vera, C., & Zhang, X. (2012). Managing the Risks of Extreme Events and Disasters to Advance Climate Change Adaptation. A Special Report of Working Groups I and II of the Intergovernmental Panel on Climate Change. In C.B. Field, V. Barros, T.F. Stocker, D. Qin, D.J. Dokken, K.L. Ebi, M.D. Mastrandrea, K.J. Mach, G.-K. Plattner, S.K. Allen, M. Tignor, and P.M. Midgley (Ed.): Cambridge University Press, Cambridge, UK, and New York, NY, USA, pp. 109-230.
Seto, S., Takahashi, N., & Iguchi, T. (2005). Rain/No-Rain Classification Methods for Microwave Radiometer Observations over Land Using Statistical Information for Brightness Temperatures under No-Rain Conditions. Journal of Applied Meteorology
Shukla, J., & Mintz, Y. (1982). Influence of land-surface evapo-transpiration on the earths climate. Science, 215, 1498-1501
Spennemann, P.C., Rivera, J.A., Saulo, A.C., & Penalba, O.C. (2015). A Comparison of GLDAS Soil Moisture Anomalies against Standardized Precipitation Index and Multisatellite Estimations over South America. Journal Of Hydrometeorology, 16, 158-171
Stagge, J.H., Tallaksen, L.M., Gudmundsson, L., Van Loon, A.F., & Stahl, K. (2015). Candidate Distributions for Climatological Drought Indices (SPI and SPEI). International Journal of Climatology, 35, 4027-4040

Soil Moisture ECV Product User Guide (PUG)
Product Version v05.2
Doc Issue 1.0
Date 29-05-2020
77
Su, C.H., Ryu, D., Dorigo, W., Zwieback, S., Gruber, A., Albergel, C., Reichle, R., & Wagner, W. (2016). Homogeneity of a global multi-satellite Climate Data Record on soil moisture. Geophysical Research Letters, accepted
Szczypta, C., Calvet, J.C., Maignan, F., Dorigo, W., Baret, F., & Ciais, P. (2014). Suitability of modelled and remotely sensed essential climate variables for monitoring Euro-Mediterranean droughts. Geosci. Model Dev., 7, 931-946
Taylor, C.M., De Jeu, R.A.M., Guichard, F., Harris, P.P., & Dorigo, W.A. (2012). Afternoon rain more likely over drier soils. Nature, 489, 282–286
Teuling, A.J., Seneviratne, S.I., Stockli, R., Reichstein, M., Moors, E., Ciais, P., Luyssaert, S., van den Hurk, B., Ammann, C., Bernhofer, C., Dellwik, E., Gianelle, D., Gielen, B., Grunwald, T., Klumpp, K., Montagnani, L., Moureaux, C., Sottocornola, M., & Wohlfahrt, G. (2010). Contrasting response of European forest and grassland energy exchange to heatwaves. Nature Geoscience, 3, 722-727
Thurner, M., Beer, C., Carvalhais, N., Forkel, M., Santoro, M., Tum, M., & Schmullius, C. (2016). Large‐scale variation in boreal and temperate forest carbon turnover rate is related to climate. Geophysical Research Letters
Tramblay, Y., Amoussou, E., Dorigo, W., & Mahé, G. (2014). Flood risk under future climate in data sparse regions: linking extreme value models and flood generating processes. Journal of Hydrology, 519, 549-558
Traore, A.K., Ciais, P., Vuichard, N., Poulter, B., Viovy, N., Guimberteau, M., Jung, M., Myneni, R., & Fisher, J.B. (2014). Evaluation of the ORCHIDEE ecosystem model over Africa against 25 years of satellite-based water and carbon measurements. Journal of Geophysical Research: Biogeosciences, 119, 2014JG002638
Tucker, C.J., Pinzon, J.E., Brown, M.E., Slayback, D.A., Pak, E.W., Mahoney, R., Vermote, E.F., & El Saleous, N. (2005). An extended AVHRR 8‐km NDVI dataset compatible with MODIS and SPOT vegetation NDVI data. International Journal of Remote Sensing, 26, 4485-4498
van den Hurk, B., Doblas-Reyes, F., Balsamo, G., Koster, R.D., Seneviratne, S.I., & Camargo, H. (2012). Soil moisture effects on seasonal temperature and precipitation forecast scores in Europe. Climate Dynamics, 38, 349-362
van der Molen, M.K., Dolman, A.J., Ciais, P., Eglin, T., Gobron, N., Law, B.E., Meir, P., Peters, W., Phillips, O.L., Reichstein, M., Chen, T., Dekker, S.C., Doubková, M., Friedl, M.A., Jung, M., van den Hurk, B.J.J.M., de Jeu, R.A.M., Kruijt, B., Ohta, T., Rebel, K.T., Plummer, S., Seneviratne, S.I., Sitch, S., Teuling, A.J., van der Werf, G.R., & Wang, G. (2012). Drought and ecosystem carbon cycling. Agricultural and Forest Meteorology, 151, 765-773
van der Schalie, R., De Jeu, R., Rodriguez-Fernandez, N., Al-Yaari, A., Kerr, Y., Wigneron, J.-P., Parinussa, R., & Drusch, M. (2018). The Effect of Three Different Data Fusion Approaches on

Soil Moisture ECV Product User Guide (PUG)
Product Version v05.2
Doc Issue 1.0
Date 29-05-2020
78
the Quality of Soil Moisture Retrievals from Multiple Passive Microwave Sensors. Remote Sensing
van der Schrier, G., Barichivich, J., Briffa, K.R., & Jones, P.D. (2013). A scPDSI-based global data set of dry and wet spells for 1901–2009. Journal of Geophysical Research: Atmospheres, 118, 4025-4048
Van Loon, A.F., Stahl, K., Di Baldassarre, G., Clark, J., Rangecroft, S., Wanders, N., Gleeson, T., Van Dijk, A.I.J.M., Tallaksen, L.M., Hannaford, J., Uijlenhoet, R., Teuling, A.J., Hannah, D.M., Sheffield, J., Svoboda, M., Verbeiren, B., Wagener, T., & Van Lanen, H.A.J. (2016). Drought in a human-modified world: reframing drought definitions, understanding, and analysis approaches. Hydrol. Earth Syst. Sci., 20, 3631-3650
Vinnikov, K.Y., Robock, A., Speranskaya, N.A., & Schlosser, C.A. (1996). Scales of temporal and spatial variability of mitlatitude soil moisture. J. Geophys. Res., 101, 7163-7174
Wagner, W., W. Dorigo, R. de Jeu, D. Fernandez-Prieto, J. Benveniste, E. Haas, & Ertl, M. (2012). Fusion of active and passive microwave observations to create an Essential Climate Variable data record on soil moisture. In, XXII ISPRS Congress. Melbourne,Australia
Wagner, W., W. Dorigo, R. de Jeu, D. Fernandez, J. Benveniste, E. Haas, M. Ertl (2012). Fusion of active and passive microwave observations to create an Essential Climate Variable data record on soil moisture. In, XXII ISPRS Congress. Melbourne,Australia
Wanders, N., Karssenberg, D., de Roo, A., de Jong, S.M., & Bierkens, M.F.P. (2014). The suitability of remotely sensed soil moisture for improving operational flood forecasting. Hydrol. Earth Syst. Sci., 18, 2343-2357
Weisheimer, A., Doblas-Reyes, F.J., Jung, T., & Palmer, T.N. (2011). On the predictability of the extreme summer 2003 over Europe. Geophysical Research Letters, 38, n/a-n/a
Wu, W.R., & Dickinson, R.E. (2004). Time scales of layered soil moisture memory in the context of land-atmosphere interaction. Journal of Climate, 17, 2752-2764
Yuan, X., Ma, Z., Pan, M., & Shi, C. (2015). Microwave remote sensing of short-term droughts during crop growing seasons. Geophysical Research Letters, 2015GL064125
Zaitchik, B.F., Macalady, A.K., Bonneau, L.R., & Smith, R.B. (2006). Europe's 2003 heat wave: A satellite view of impacts and land-atmosphere feedbacks. International Journal of Climatology, 26, 743-769
Zhan, X., Zheng, W., Fang, L., Liu, J., Hain, C., Yin, J., Ek, M., 2016. A preliminary assessment of
the impact of SMAP Soil Moisture on numerical weather Forecasts from GFS and NUWRF
models. 2016 IEEE International Geoscience and Remote Sensing Symposium (IGARSS), pp.
5229–5232