Embed Size (px)
Citation preview
a
NEXT-LL-LES-ESA(HME)-0001
prepared by/préparé par ESA – NEXT Team reference/réference NEXT-LL-LES-ESA(HME)-0001 issue/édition 1 revision/révision 0 date of issue/date d’édition 20 February 2008
NEXT - Lunar Environment Specification NEXT-LL-LES-ESA(HME)-0001
Issue 1 revision 0 page ii of v
s
A P P R O V A L
Title Titre
NEXT Lunar Lander with in-situ science and mobility: Lunar Environment Specification
issue issue
1 revision revision
0
author auteur
ESA – NEXT Team date date
20/02/2008
approved by approuvé par
date date
C H A N G E L O G
reason for change /raison du changement issue/issue revision/revision date/date
C H A N G E R E C O R D
Issue: 1 Revision: 0
reason for change/raison du changement page(s)/page(s) paragraph(s)/paragraph(s)
NEXT - Lunar Environment Specification NEXT-LL-LES-ESA(HME)-0001
Issue 1 revision 0 page iii of v
s
T A B L E O F C O N T E N T S
1 SCOPE ......................................................................................................................................6
2 REFERENCE DOCUMENTS ....................................................................................................7
3 MOON DESCRIPTION AND GENERAL FACTS .....................................................................9
4 LIGHT, THERMAL AND RADIATIVE FLUXES DURING CRUISE AND LUNAR ORBIT.....10 4.1 Space Environment.......................................................................................................................10 4.2 Solar Flux........................................................................................................................................10 4.3 Albedo .............................................................................................................................................10 4.4 Lunar IR Emissivity .......................................................................................................................11
5 SURFACE ENVIRONMENTAL CONDITIONS AT THE LUNAR SOUTH POLE...................12 5.1 Illumination Conditions .................................................................................................................12
5.1.1 Introduction..............................................................................................................................12 5.1.2 Highly illuminated sites at the South Pole ...............................................................................13 5.1.3 Detailed illumination/darkness patterns...................................................................................14 5.1.4 Modelisation of the impact of topography on illumination conditions....................................16 5.1.5 Seasonal cycle of illumination conditions ...............................................................................17 5.1.6 Limitations ...............................................................................................................................18
5.2 Craters.............................................................................................................................................19 5.2.1 General features of the South Pole Area..................................................................................19 5.2.2 Types of craters ........................................................................................................................20 5.2.3 Shackleton crater......................................................................................................................22
5.3 Temperatures.................................................................................................................................24 5.3.1 General temperature features of the Moon ..............................................................................24 5.3.2 Temperatures of flat terrain in the South Pole Area ................................................................25 5.3.3 Modelisation of the impact of topography on temperatures ....................................................27 5.3.4 Temperatures in the permanently shaded areas .......................................................................30 5.3.5 Seasonal variation ....................................................................................................................30 5.3.6 Depth profile ............................................................................................................................30 5.3.7 Conclusion on temperature ......................................................................................................31
5.4 Topography ....................................................................................................................................32 5.4.1 Introduction..............................................................................................................................32 5.4.2 Digital elevation models ..........................................................................................................32 5.4.3 Lunar Control Network............................................................................................................35 5.4.4 Local slopes..............................................................................................................................36 5.4.5 Surface roughness ....................................................................................................................37 5.4.6 Boulders size and distribution..................................................................................................38
NEXT - Lunar Environment Specification NEXT-LL-LES-ESA(HME)-0001
Issue 1 revision 0 page iv of v
s 5.4.7 Crater size-frequency distribution............................................................................................40
5.5 Lunar Soil Characteristics ............................................................................................................41 5.5.1 General properties ....................................................................................................................41 5.5.2 Bearing capacity.......................................................................................................................43 5.5.3 Shear strength...........................................................................................................................45 5.5.4 Trafficability parameters and traction calculation ...................................................................46
5.6 Lunar Dust ......................................................................................................................................48 5.7 Atmosphere ....................................................................................................................................49 5.8 Surface Radiation Environment ..................................................................................................50
ANNEX A: ACRONYMS AND ABBREVIATIONS..........................................................................52
LIST OF FIGURES Figure 3-1: The Earth-Moon System as seen from Voyager 1 ..........................................................................9 Figure 3-2: Angles In the Earth-Moon System..................................................................................................9 Figure 4-1: Lunar Albedo Map ........................................................................................................................10 Figure 5-1: Winter Illumination Map of the South Pole Area .........................................................................13 Figure 5-2: Highly Illuminated Sites ...............................................................................................................13 Figure 5-3: Alternative Highly Illuminated Sites ............................................................................................13 Figure 5-4: Detailed Illumination/Darkness Pattern for Sites A, B and C.......................................................15 Figure 5-5: Site A1 Sun and Horizon Elevation Profile ..................................................................................16 Figure 5-6: Site A1 Annual Average Illumination Fraction Per Lunar Day....................................................18 Figure 5-7: Aitken Basin..................................................................................................................................19 Figure 5-8: Simple Crater Picture ....................................................................................................................20 Figure 5-9: Complex Crater Picture.................................................................................................................20 Figure 5-10: Schematic Views of Lunar Impact Structures.............................................................................21 Figure 5-11: Rim of Shackleton Crater as seen from SMART-1 ....................................................................22 Figure 5-12: Rim of Shackleton Details ..........................................................................................................23 Figure 5-13: Steady-state Lunar Surface Temperature as a Function of the Latitude on the Near Side .........25 Figure 5-14: Maximum Surface Temperature as a Function of the Latitude...................................................26 Figure 5-15: Surface Temperature as a Function of Local Time .....................................................................26 Figure 5-16: Diurnal Maximal (left column) and Average (right column) Surface Temperature within a
40km Flat Floored Crater .........................................................................................................................27 Figure 5-17: Maximum and Average Temperature Patterns in South Pole Craters ........................................27 Figure 5-18: Diurnal Maximum Temperature Distribution within a Crater ....................................................28 Figure 5-19: Temperature Along a Crater Over a Whole Seasonal Cycle.......................................................29 Figure 5-20: Temperature Depth Profile..........................................................................................................31 Figure 5-21: 3D Shaded Elevation Image of the South Pole Area ..................................................................32 Figure 5-22: Digital Elevation Data - Matrix Description ...............................................................................33 Figure 5-23: Topographic Map of the South Pole Area...................................................................................34 Figure 5-24: Slope-Probability Distribution in Lunar Highlands ....................................................................36
NEXT - Lunar Environment Specification NEXT-LL-LES-ESA(HME)-0001
Issue 1 revision 0 page v of v
s Figure 5-25: Slope-Probability Distribution in Kant Plateau...........................................................................36 Figure 5-26: Variation of the Mean Lunar Slope with Slope Length ..............................................................37 Figure 5-27: Lunar Surface Roughness Diagram ............................................................................................37 Figure 5-28: Cumulative Plot of Boulders from a Lunar Crater......................................................................38 Figure 5-29: Cumulative Boulder Distribution between Crater Rim and Two Crater Radii ...........................38 Figure 5-30: Boulders Distribution - Distance from the Crater Centre versus Boulder Radius ......................39 Figure 5-31: Fraction of Areas Covered by Blocks .........................................................................................39 Figure 5-32: Crater Size-Frequency Distribution ............................................................................................40 Figure 5-33: Ultimate Bearing Capacity of the Lunar Surface ........................................................................43 Figure 5-34: Maximum Allowable Bearing Capacity......................................................................................44 Figure 5-35: Depths of Settlement for Structures on the Lunar Surface .........................................................45 Figure 5-36: Measured Shear Strength: Friction Angle as a Function of Cohesion ........................................46 Figure 5-37: Lunar Dust Effect on Radiator Performance...............................................................................49 Figure 5-38: Major Forms of Ionizing Radiation on the Moon .......................................................................50 Figure 5-39: Differential Energy Spectra during Solar Minimum and Solar Maximum.................................51 Figure 5-40: Solar Activity and Cycles............................................................................................................51
LIST OF TABLES Table 5-1: Highly Illuminated Sites Locations ................................................................................................14 Table 5-2: Main Illumination Pattern Features ................................................................................................15 Table 5-3: Highly Illuminated Sites Illumination Features .............................................................................17 Table 5-4: Named Craters in the South Pole Area...........................................................................................19 Table 5-5: Theoretical Main Features of Shackleton Crater............................................................................22 Table 5-6: Lunar Soils General Properties.......................................................................................................41 Table 5-7: Best Estimates of Lunar Soil Bulk Density, Porosity, and Void Ratio, and Relative Density.......42 Table 5-8: Best Estimates of Cohesion and Friction Angle Values.................................................................45 Table 5-9: Shear Strength Soil Parameters Depth Profile................................................................................46 Table 5-10: Mean Trafficability Soil Parameters.............................................................................................46 Table 5-11: Physical and Mechanical Properties of the Lunar Soil at Various Locations ..............................47
NEXT - Lunar Environment Specifications NEXT-LL-LES-ESA(HME)-0001
Issue 1 revision 0 page 6 of 52
s
1 SCOPE This document intends to provide the necessary Lunar Environment Specifications to be taken into account in the design of the NEXT Lunar Lander Mission Study, which targets the Moon South Pole. Although the Moon has already been the subject of several in-situ investigations, both human and robotic, the Apollo missions as well as all the former lunar landing missions were focused on the near-side equatorial regions of the Moon (between 40°S and 40°N about), leaving the poles little better known than in the pre-Apollo era. Remote-sensing data of the South Pole from orbiting missions are limited so far. However, the lunar poles are highly attractive sites for space exploration: in addition to scientific research and anticipated in situ material resources, a critical rationale for deployment at the lunar poles is the favourable illumination conditions at specific locations.
In this context, the NEXT Lunar Lander Mission offers the opportunity to perform important scientific investigations in a region of the Moon that has never been explored before, namely the South Pole. The NEXT Lunar Lander Mission can also be envisaged in the broader frame of human exploration, conducting a site survey of a potential future site for an inhabited lunar base. In addition, to safely reach a highly illuminated landing site in such an hazardous area requires the use of soft precision landing with hazard avoidance, a technological step essential in view of the MSR mission and any other exploration landing missions. The environmental conditions at the Moon South Pole are key drivers for the design of such a mission. Thus this document focuses on the surface environmental conditions at the lunar South Pole, in terms of illumination patterns, temperatures, regional and local topography, soil characteristics and lunar dust, whenever possible concerning particularly the above mentioned south polar highly illuminated areas.
The purpose of this document is to provide a self-standing source for the lunar environmental conditions with a strong emphasis on the South Pole surface environment, to be used in the NEXT Lunar Lander Mission Study. This document provides only the most important facts, data and descriptions. The user is strongly advised to consult the references for more information.
NEXT - Lunar Environment Specifications NEXT-LL-LES-ESA(HME)-0001
Issue 1 revision 0 page 7 of 52
s
2 REFERENCE DOCUMENTS [RD1] Lunar Sourcebook, a User’s Guide to the Moon, Cambridge University Press,
Heiken, D. Vaniman, B.M French, 1991 [RD2] Lunar Constants and Models Document, JPL, JPL D-32296, September 2005. [RD3] Lunar Surface Models, R. E. Hutton et al., NASA SP-8023, May 1969. [RD4] Lunar Planetary Institute: http://www.lpi.usra.edu/lunar/surface [RD5] Space Engineering – Space Environment, ECSS-E-10-04A, 21 January 2000. [RD6] Lunar South Pole Illumination: Review, Reassessment, and Power System
Implications, James Fincannon, AIAA 2007-4700, June 2007 [RD7] Areas of Favourable Illumination at the Lunar Poles calculated from Topography,
I. Garrick-Bethell et al., Lunar and Planetary Science XXXVI, 2005. [RD8] The Peaks of Eternal Light on the Lunar South Pole: How They Were Found and
What They Look Like, Michiel Kruijff, Dela-Utec. [RD9] Illumination Conditions at the Lunar South Pole, D. B. J. Bussey, P. D. Spudis, M.
S. Robinson, Geophysical Research Letters, Vol. 26, No. 9, pp 1187-1190, May 1999.
[RD10] Video animations of illumination and surrounding topography for Shackleton Crater: http://spaceflightsystems.grc.nasa.gov/articles/Lunar-Topographic.php
[RD11] Lunar Craters Nomenclature and Description: http://planetarynames.wr.usgs.gov/jsp/FeatureTypesData2.jsp?systemID=3&bodyID=11&typeID=9&system=Earth&body=Moon&type=Crater,%20craters&sort=ALat&show=Fname&show=Lat&show=Long&show=Diam&show=Stat&show=Orig
[RD12] Exploration Lunar Architecture, D. Cooke, February 2007 [RD13] Near-Surface temperatures on Mercury and the Moon and the Stability of Polar Ice
Deposits, A.R. Vasavada, D.A. Page, S.E. Wood, Icarus 141, pp. 179-193, February 1999.
[RD14] Moon Surface Thermal Characteristics for Moon Orbiting Spacecraft Thermal Analysis, G.D. Racca, Planet. Space Sci., Vol 43, No. 6, pp. 835-842, March 1995.
[RD15] Near-Surface Ice on Mercury and the Moon: A topographic Thermal Model, James R. Salvail, Fraser P. Fanale, Icarus 111, pp 441-455, July 1994.
[RD16] USGS Lunar Topography Website: http://astrogeology.usgs.gov/Teams/Geomatics/photogrammetry/topography_lunar.html
[RD17] Digital Elevation Data from the USGS ftp server: ftp://ftpflag.wr.usgs.gov/dist/pigpen/moon/usgs/topo
[RD18] Digital Elevation Models Derived from Small Format Lunar Images, Mark Rosiek, Randy Kirk, Annie Howington-Kraus, USGS.
[RD19] Color-coded Topography and Shaded Relief Maps of the Lunar Hemispheres, M.R. Rosiek, R. Kirk, E. Howington-Kraus, Abstract 1792, Lunar and Planetary Science XXXIII, 2002
[RD20] Space and Planetary Environment Criteria Guidelines for Use in Space Vehicle Development, Robert E. Smith, Georges S. West, NASA-TM-82478, Volume 1, 1982.
[RD21] Experimental Photogrammetry of Lunar Images, Sherman S. C. Wu, H. J. Moore, USGS Professional Paper 1046-D, 1980.
NEXT - Lunar Environment Specifications NEXT-LL-LES-ESA(HME)-0001
Issue 1 revision 0 page 8 of 52
s [RD22] Ejected Boulders: Implication for Secondary Craters and the Age Dating of
Surfaces, G. D. Bart, H. J. Melosh, Lunar and Planetary Science XXXVI, Abstract 2022, 2005.
[RD23] Reconsideration of Crater Size-Frequency Distribution on the Moon: Effect of Projectile Population and Secondary Craters, Koichiro Nagumo, Akiko M. Nakamura, Advanced Space Research, Volume 28, No. 8, pp 1181-1186, 2001.
[RD24] Digging and Pushing Lunar Regolith: Classical Soil Mechanics and the Forces Needed for Excavation and Traction, A. Wilkinson, A. DeGennaro, Journal of Terramechanics 44, pp. 133-152, 2007.
[RD25] Mechanical Properties of Lunar Soil: Density, Porosity, Cohesion, and Angle of Internal Friction, J.K. Mitchell et al, Proceedings of the Lunar Science Conference, Vol. 3, pp. 3235-3253, MIT Press, 1972.
[RD26] Physical and Mechanical Properties of Lunar Soil, V. Gromov. [RD27] Adhesion of Lunar Dust, Otis R. Walton, NASA/CR-2007-214685, 2007. [RD28] A Dynamic Fountain Model for Lunar Dust, T. J. Stubbs et al, Advances in Space
research, Vol.37, pp.59-66, April 2005. [RD29] Lunar Dust Transport and Potential Interactions with Power System Components,
C.M. Katzan, J.L. Edwards, NASA Contractor Report 4404, Contract NAS3-25266, November 1991.
[RD30] The Ionizing Radiation Environment on the Moon, J. H. Adam et al., Advances in Space research, Vol.40, pp.338-341, May 2007.
[RD31] A Characterization of the Moon Radiation Environment for Radiation Analysis, R. K. Tripathi et al., Advances in Space research, Vol.37, pp.1749-1758, March 2006.
[RD32] NEXT Lunar Landing Mission: Mission Analysis Guidelines, NEXT-LL-MAG-ESA(HME)-0001, November 2007.
[RD33] NEXT Lunar Lander with In-Situ Science and Mobility: Mission Requirements Document, NEXT-LL-MRD-ESA(HME)-0001, November 2007.
NEXT - Lunar Environment Specifications NEXT-LL-LES-ESA(HME)-0001
Issue 1 revision 0 page 9 of 52
s
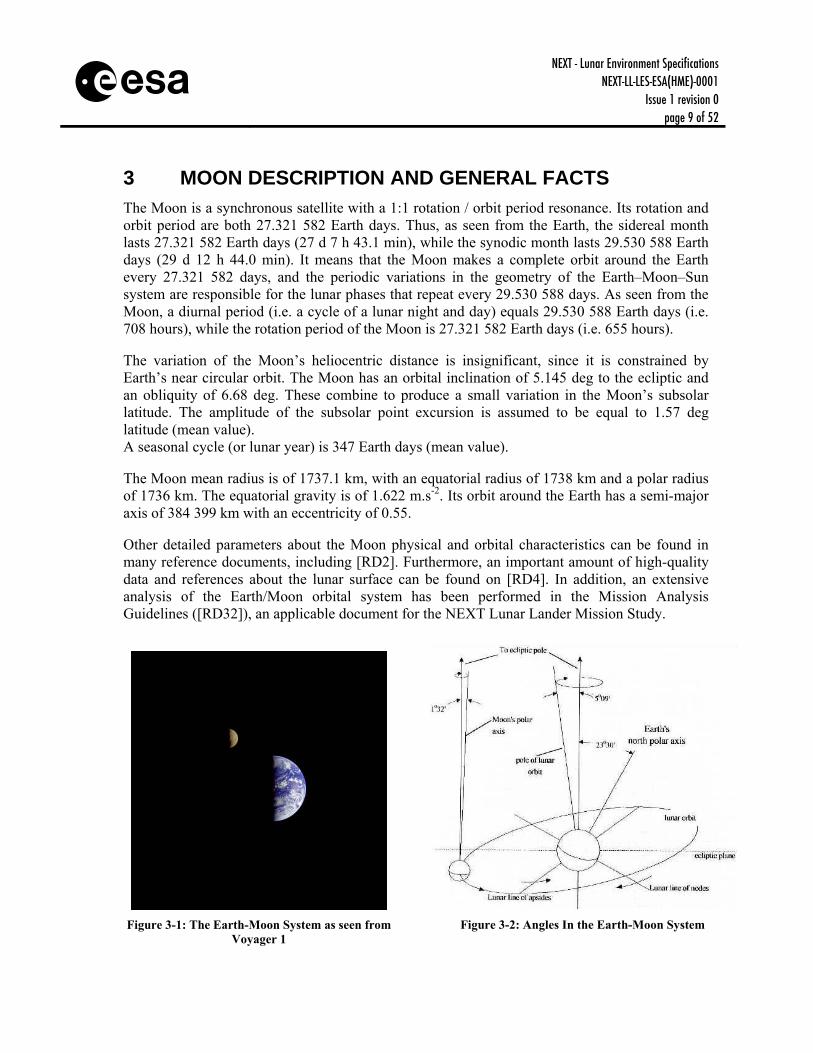
3 MOON DESCRIPTION AND GENERAL FACTS The Moon is a synchronous satellite with a 1:1 rotation / orbit period resonance. Its rotation and orbit period are both 27.321 582 Earth days. Thus, as seen from the Earth, the sidereal month lasts 27.321 582 Earth days (27 d 7 h 43.1 min), while the synodic month lasts 29.530 588 Earth days (29 d 12 h 44.0 min). It means that the Moon makes a complete orbit around the Earth every 27.321 582 days, and the periodic variations in the geometry of the Earth–Moon–Sun system are responsible for the lunar phases that repeat every 29.530 588 days. As seen from the Moon, a diurnal period (i.e. a cycle of a lunar night and day) equals 29.530 588 Earth days (i.e. 708 hours), while the rotation period of the Moon is 27.321 582 Earth days (i.e. 655 hours). The variation of the Moon’s heliocentric distance is insignificant, since it is constrained by Earth’s near circular orbit. The Moon has an orbital inclination of 5.145 deg to the ecliptic and an obliquity of 6.68 deg. These combine to produce a small variation in the Moon’s subsolar latitude. The amplitude of the subsolar point excursion is assumed to be equal to 1.57 deg latitude (mean value). A seasonal cycle (or lunar year) is 347 Earth days (mean value). The Moon mean radius is of 1737.1 km, with an equatorial radius of 1738 km and a polar radius of 1736 km. The equatorial gravity is of 1.622 m.s-2. Its orbit around the Earth has a semi-major axis of 384 399 km with an eccentricity of 0.55. Other detailed parameters about the Moon physical and orbital characteristics can be found in many reference documents, including [RD2]. Furthermore, an important amount of high-quality data and references about the lunar surface can be found on [RD4]. In addition, an extensive analysis of the Earth/Moon orbital system has been performed in the Mission Analysis Guidelines ([RD32]), an applicable document for the NEXT Lunar Lander Mission Study.
Figure 3-1: The Earth-Moon System as seen from
Voyager 1
Figure 3-2: Angles In the Earth-Moon System
NEXT - Lunar Environment Specifications NEXT-LL-LES-ESA(HME)-0001
Issue 1 revision 0 page 10 of 52
s
4 LIGHT, THERMAL AND RADIATIVE FLUXES DURING CRUISE AND LUNAR ORBIT
4.1 Space Environment Radiation and thermal fluxes, gravitational and magnetic fields as well as other space environment characteristics are very extensively described in [RD5]: this ESA reference document should be referred to for any necessary information related to space environment, from launch to lunar orbit. Specific information concerning the S/C trajectory from launch to lunar orbit can be found in the MAG ([RD32]). Additional information related to the thermal environment can also be found in [RD14], which was the thermal reference document for the ESA SMART-1 mission.
4.2 Solar Flux The solar flux received in space depends on the distance to the Sun. The variation of the Moon heliocentric distance is nearly insignificant since it is constrained by Earth’s near circular orbit, and the following values ([RD14]) should be used as reference values for any relevant analysis during cruise and lunar orbit:
Solar Minimum = 1326 W.m-2 Solar Maximum = 1418 W.m-2 Solar Nominal = 1371 W.m-2
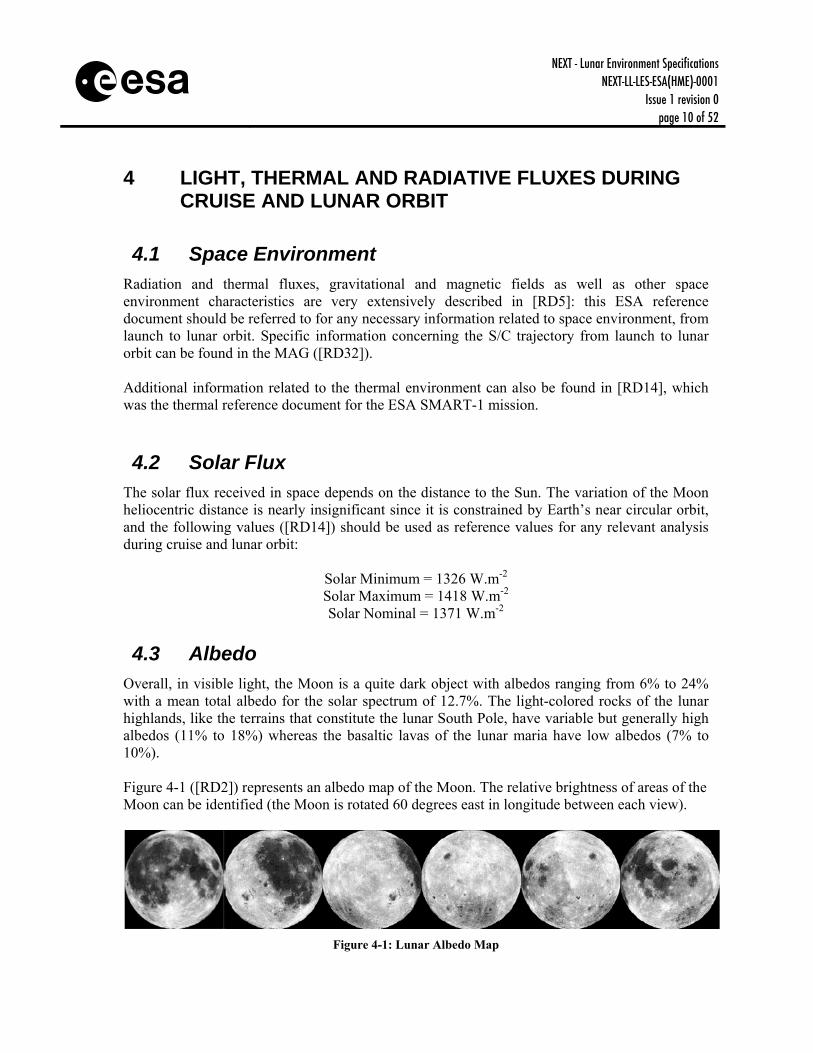
4.3 Albedo Overall, in visible light, the Moon is a quite dark object with albedos ranging from 6% to 24% with a mean total albedo for the solar spectrum of 12.7%. The light-colored rocks of the lunar highlands, like the terrains that constitute the lunar South Pole, have variable but generally high albedos (11% to 18%) whereas the basaltic lavas of the lunar maria have low albedos (7% to 10%). Figure 4-1 ([RD2]) represents an albedo map of the Moon. The relative brightness of areas of the Moon can be identified (the Moon is rotated 60 degrees east in longitude between each view).
Figure 4-1: Lunar Albedo Map
NEXT - Lunar Environment Specifications NEXT-LL-LES-ESA(HME)-0001
Issue 1 revision 0 page 11 of 52
s 4.4 Lunar IR Emissivity
The lunar emitted IR flux depends on different parameters such as the albedo, the local temperature, the IR emissivity, etc. The IR emissivity is defined as the ratio of the surface emitted radiation to the black-body emission at the temperature of interest. Although it varies among the lunar surface, an IR emissivity of 97% can be assumed as a nominal value ([RD1]). References values for the other parameters relevant to the lunar emitted IR flux can be found in the relevant later sections of this document.
NEXT - Lunar Environment Specifications NEXT-LL-LES-ESA(HME)-0001
Issue 1 revision 0 page 12 of 52
s
5 SURFACE ENVIRONMENTAL CONDITIONS AT THE LUNAR SOUTH POLE
5.1 Illumination Conditions
5.1.1 INTRODUCTION Measurements (mainly from Clementine and more and more from Smart-1) have shown that the vicinity of the lunar South Pole seems to offer extremely favourable illumination conditions at some specific locations. The fact that the Moon’s poles are nearly perpendicular to the ecliptic plane with an inclination of 1.5º from the vertical directly implies that the Sun will always appear close to the horizon near the poles as the Moon rotates on its axis. Thus, it is possible to have areas in the vicinity of the poles that can have more than half a lunar day (i.e. more than about 15 Earth days) of illumination, up to a very high percentage of illumination during a whole lunar day. Furthermore, due to local topography, terrain elevation and the low Sun elevation angle, a subdivided illumination-darkness pattern may happen. Such subdivided illumination-darkness periods modify the longest duration of darkness, and consequently the energy storage capacity required onboard the lunar elements. For a given site, the illumination-darkness pattern varies significantly with the seasonal cycle, with the illumination being nearly continuous in certain summer lunar days and highly variable for some other lunar days in the winter. It should be noted that the illumination-darkness pattern is fairly repetitive each year. Quantifying the illumination/darkness conditions of certain specific lunar South Pole areas is of great importance for the selection of a landing site and for the entire design of a mission. Different parameters have to be considered (e.g. total illumination fraction over one lunar day, detailed illumination/darkness profile) as well as the influence of the topography.
NEXT - Lunar Environment Specifications NEXT-LL-LES-ESA(HME)-0001
Issue 1 revision 0 page 13 of 52
s
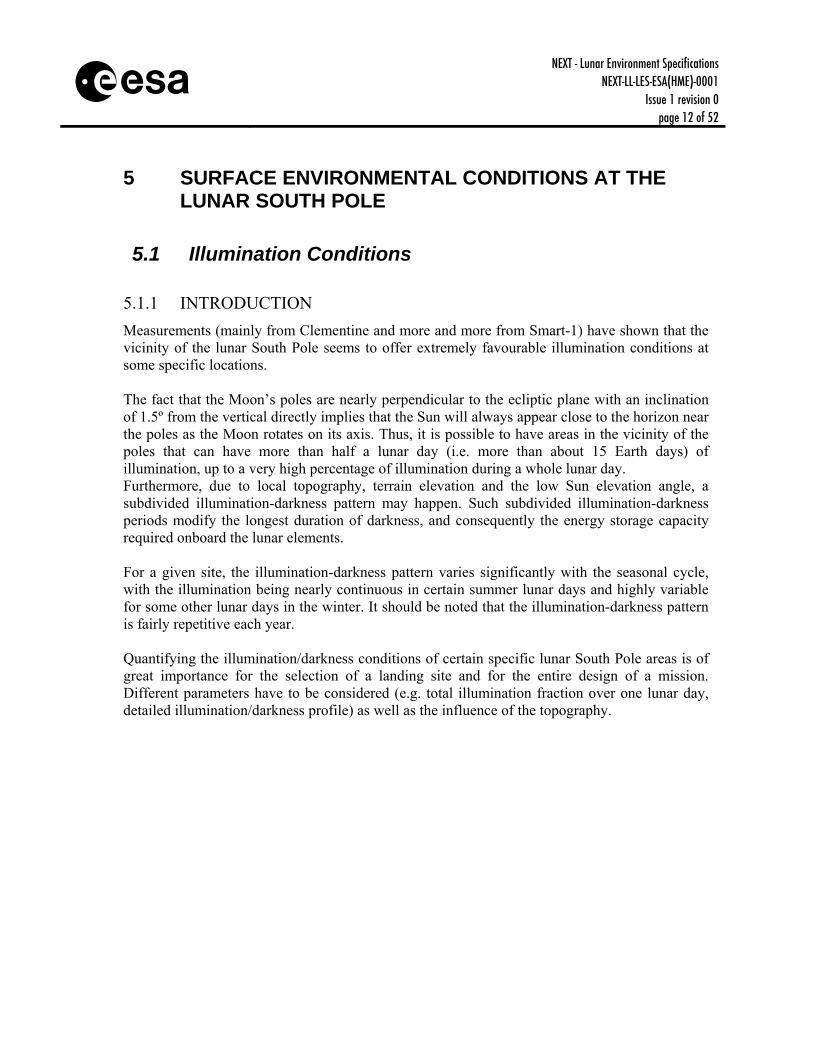
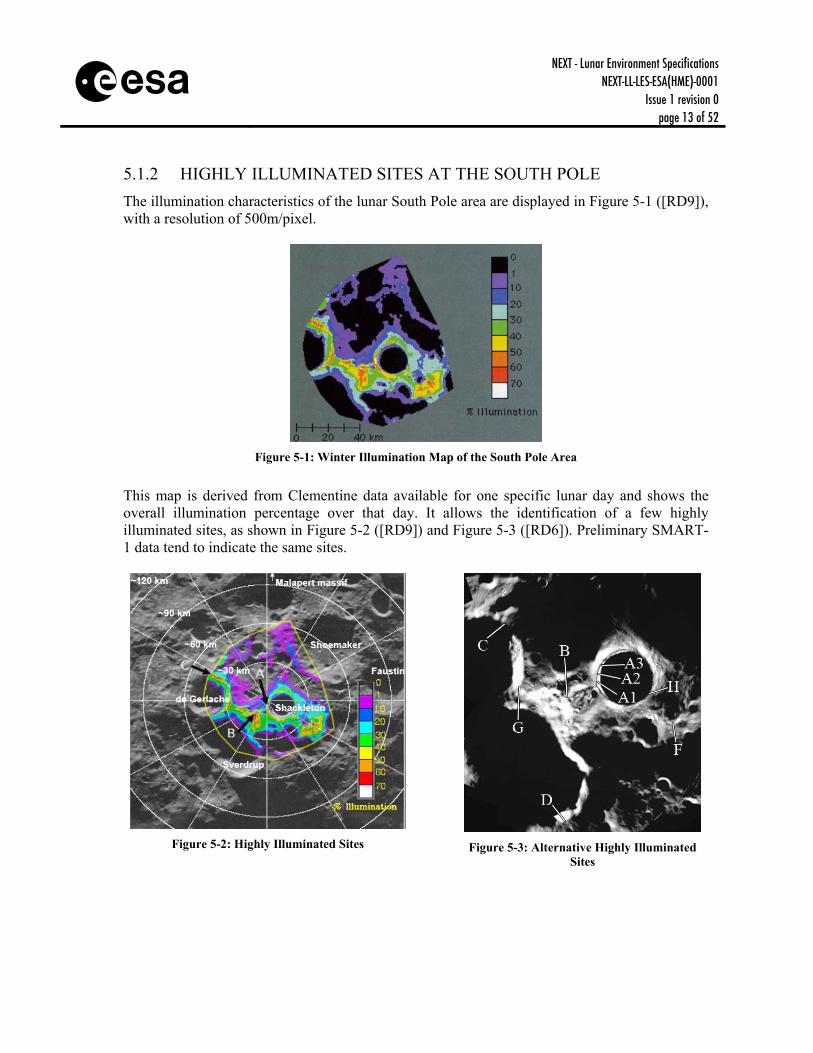
5.1.2 HIGHLY ILLUMINATED SITES AT THE SOUTH POLE The illumination characteristics of the lunar South Pole area are displayed in Figure 5-1 ([RD9]), with a resolution of 500m/pixel.
Figure 5-1: Winter Illumination Map of the South Pole Area
This map is derived from Clementine data available for one specific lunar day and shows the overall illumination percentage over that day. It allows the identification of a few highly illuminated sites, as shown in Figure 5-2 ([RD9]) and Figure 5-3 ([RD6]). Preliminary SMART-1 data tend to indicate the same sites.
Figure 5-2: Highly Illuminated Sites
Figure 5-3: Alternative Highly Illuminated
Sites
NEXT - Lunar Environment Specifications NEXT-LL-LES-ESA(HME)-0001
Issue 1 revision 0 page 14 of 52
s The precise locations of those highly illuminated sites are given in Table 5-1. For further details about their features, refer to Sections 5.2 and 5.4. Detailed illumination patterns for those sites are provided in the Section 5.1.3.
Site Name Latitude (º) Longitude (º) Height (km) A-A1 Rim of Shackleton Crater 89.8 S 213 E 1.9 A2 Rim of Shackleton Crater 89.9 S 237 E 1.7 A3 Rim of Shackleton Crater 89.9 S 301 E 1.7 B Connecting Ridge 89.4 233 E 1.9 C Rim of de Gerlache Crater 88.6 S 293 E 2.1 D Rim of Sverdrup Crater 88.0 S 195 E 3.2 E Malapert Mountain 86 S 4 E 4.8 F Site F 88.9 S 129 E 2.2 G Site G 88.9 S 258 E 3.1 H Site H 89.4 S 121 E 1.5
Table 5-1: Highly Illuminated Sites Locations
Since those sites offer the most favourable average illumination conditions in the vicinity of the South Pole, they should be primarily considered as possible landing site candidates. However, other characteristics will also need to be taken into account, among others:
- local topography features, including roughness, boulders and slope, to ensure that a safe landing site compatible with the spacecraft landing performance can be found,
- overall topography of the surroundings, - total surface of the illuminated surface of the sites: for example, Site D (constituted of 22
pixels in Figure 5-3) is assumed to have a surface of roughly 8 km2, - scientific and exploration interest of the site
It should be noted that some of the most illuminated areas are expected to be found at the top of ridges that separate two opposite slopes [RD8]. Thus it should be carefully investigated whether or not a specific highly illuminated site is safe enough for landing, according to the above mentioned items.
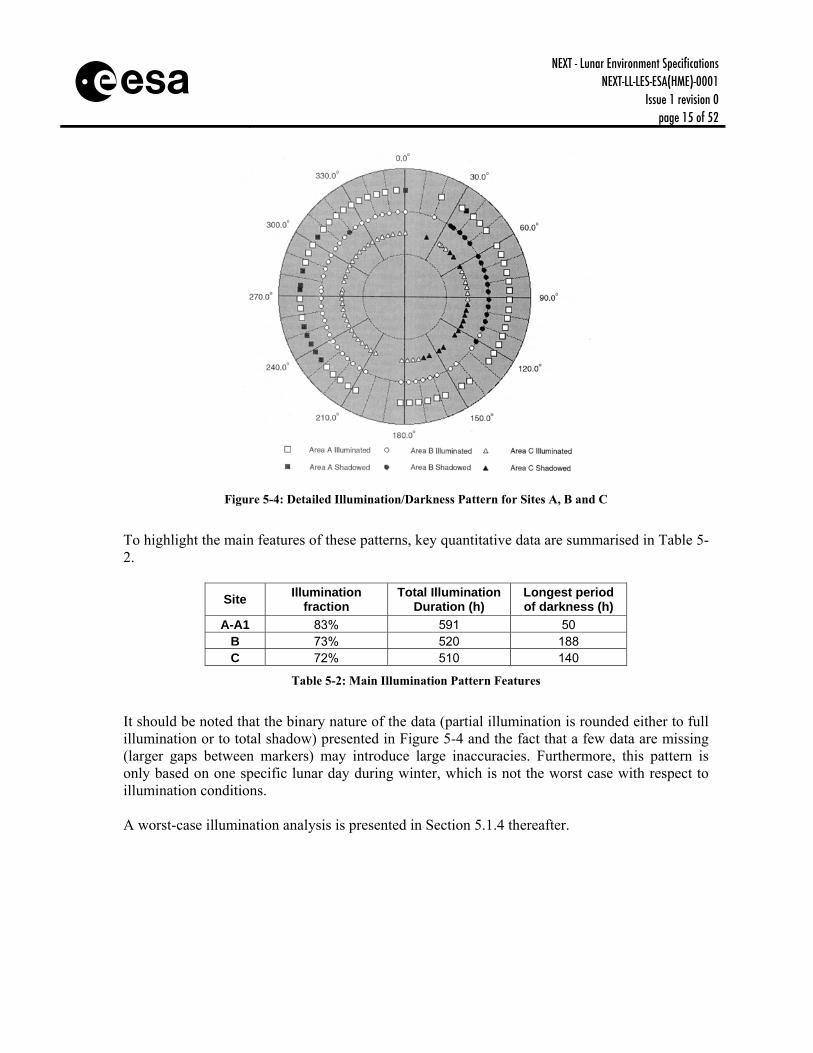
5.1.3 DETAILED ILLUMINATION/DARKNESS PATTERNS This section provide detailed illumination-darkness patterns during one southern winter lunar day for the three sites that receive the largest amount of sunlight, namely the sites referred as A, B, C in Figure 5-2. It should be understood that those sites would be illuminated even more during southern lunar summer. Figure 5-4 ([RD9]) indicates whether the area receives sunlight (white symbol) or not (black symbol) as a function of illumination direction during the entire lunar day (every marks are separated by a roughly 10 hour gap). This data comes from Clementine images and it should be noted that, due to the lack of available data, certain points are missing.
NEXT - Lunar Environment Specifications NEXT-LL-LES-ESA(HME)-0001
Issue 1 revision 0 page 15 of 52
s
Figure 5-4: Detailed Illumination/Darkness Pattern for Sites A, B and C
To highlight the main features of these patterns, key quantitative data are summarised in Table 5-2.
Site Illumination fraction
Total Illumination Duration (h)
Longest period of darkness (h)
A-A1 83% 591 50 B 73% 520 188 C 72% 510 140
Table 5-2: Main Illumination Pattern Features
It should be noted that the binary nature of the data (partial illumination is rounded either to full illumination or to total shadow) presented in Figure 5-4 and the fact that a few data are missing (larger gaps between markers) may introduce large inaccuracies. Furthermore, this pattern is only based on one specific lunar day during winter, which is not the worst case with respect to illumination conditions. A worst-case illumination analysis is presented in Section 5.1.4 thereafter.
NEXT - Lunar Environment Specifications NEXT-LL-LES-ESA(HME)-0001
Issue 1 revision 0 page 16 of 52
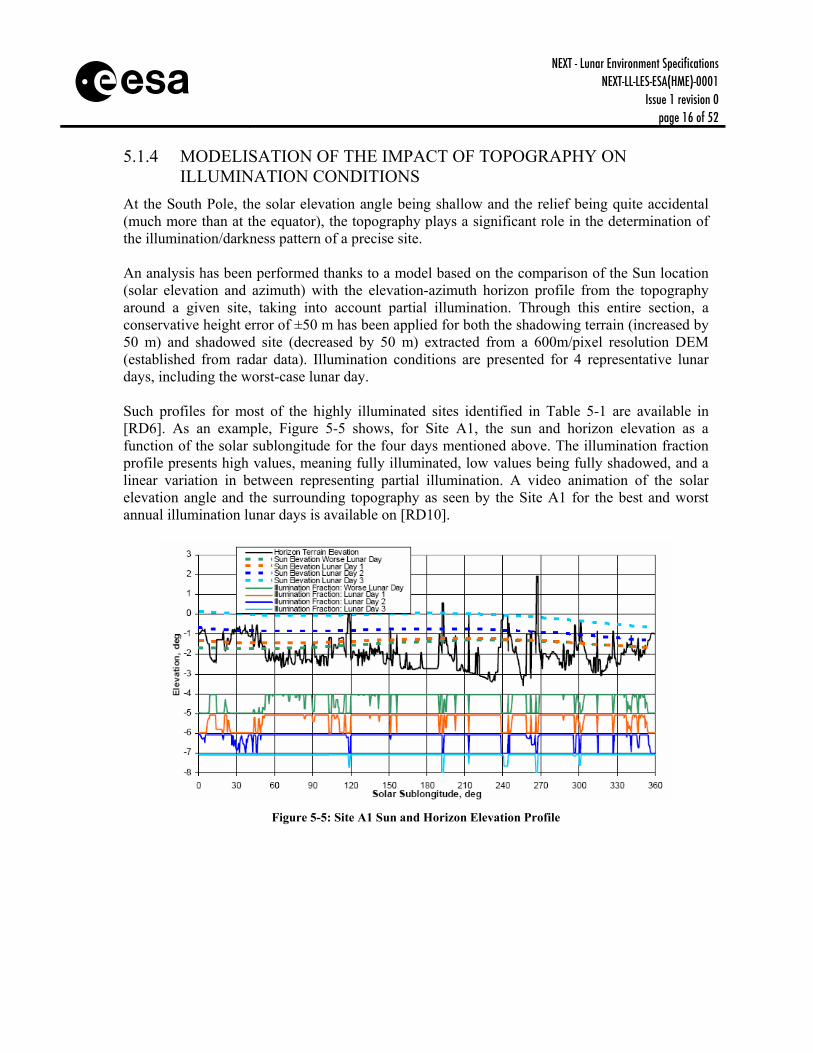
s 5.1.4 MODELISATION OF THE IMPACT OF TOPOGRAPHY ON
ILLUMINATION CONDITIONS At the South Pole, the solar elevation angle being shallow and the relief being quite accidental (much more than at the equator), the topography plays a significant role in the determination of the illumination/darkness pattern of a precise site. An analysis has been performed thanks to a model based on the comparison of the Sun location (solar elevation and azimuth) with the elevation-azimuth horizon profile from the topography around a given site, taking into account partial illumination. Through this entire section, a conservative height error of ±50 m has been applied for both the shadowing terrain (increased by 50 m) and shadowed site (decreased by 50 m) extracted from a 600m/pixel resolution DEM (established from radar data). Illumination conditions are presented for 4 representative lunar days, including the worst-case lunar day. Such profiles for most of the highly illuminated sites identified in Table 5-1 are available in [RD6]. As an example, Figure 5-5 shows, for Site A1, the sun and horizon elevation as a function of the solar sublongitude for the four days mentioned above. The illumination fraction profile presents high values, meaning fully illuminated, low values being fully shadowed, and a linear variation in between representing partial illumination. A video animation of the solar elevation angle and the surrounding topography as seen by the Site A1 for the best and worst annual illumination lunar days is available on [RD10].
Figure 5-5: Site A1 Sun and Horizon Elevation Profile
NEXT - Lunar Environment Specifications NEXT-LL-LES-ESA(HME)-0001
Issue 1 revision 0 page 17 of 52
s In Table 5-3, the illumination percentage is given for some representative lunar days, including the worst-case lunar day. In addition, the worst-case longest duration of darkness is provided, which is a critical feature to design the power subsystem of the spacecraft.
Illumination Percentage Site Worst Case
Lunar Day Lunar Day 1 Lunar Day 2 Lunar Day 3
Longest Darkness
Duration (h) A1 71% 75% 90% 98% 94 A2 57% 62% 77% 89% 86 A3 55% 60% 77% 91% 86 B 63% 67% 87% 97% 172 C 60% 67% 81% 93% 249 D 77% 80% 91% 99% 148 E 54% 55% 65% 86% 273 F 70% 72% 83% 96% 145
G (*) 53% 57% 75% 88% 297 H 66% 52% 63% 82% 167
Table 5-3: Highly Illuminated Sites Illumination Features
(*) Due to DEM offset corrections, Site G has been reduced by 1500 m. For more details, see [RD6]. One can notice that Site D offers the best overall illumination percentage. However the longest duration of darkness is significantly smaller for the Sites A, which can then be assumed to provide less stringent illumination conditions even though having a smaller average illumination percentage.
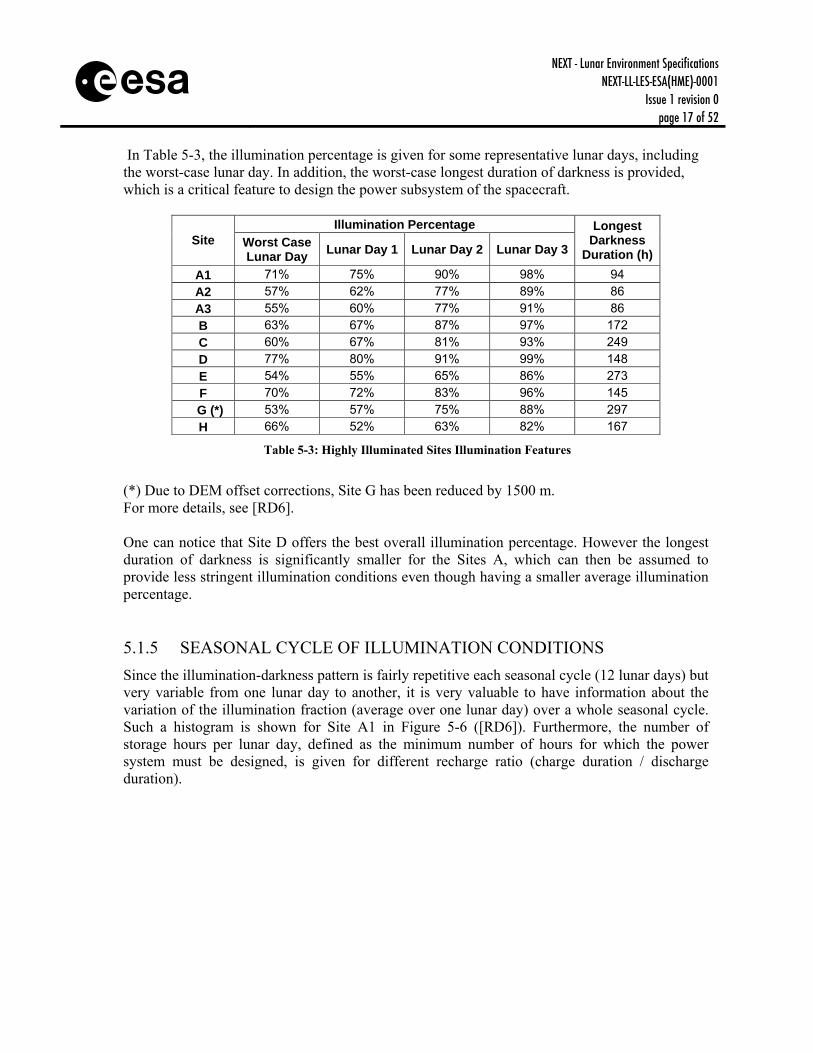
5.1.5 SEASONAL CYCLE OF ILLUMINATION CONDITIONS Since the illumination-darkness pattern is fairly repetitive each seasonal cycle (12 lunar days) but very variable from one lunar day to another, it is very valuable to have information about the variation of the illumination fraction (average over one lunar day) over a whole seasonal cycle. Such a histogram is shown for Site A1 in Figure 5-6 ([RD6]). Furthermore, the number of storage hours per lunar day, defined as the minimum number of hours for which the power system must be designed, is given for different recharge ratio (charge duration / discharge duration).
NEXT - Lunar Environment Specifications NEXT-LL-LES-ESA(HME)-0001
Issue 1 revision 0 page 18 of 52
s
Figure 5-6: Site A1 Annual Average Illumination Fraction Per Lunar Day
5.1.6 LIMITATIONS The illumination maps and the DEMs available until now present a low resolution, which may introduce significant errors, difficult to quantify. For example the exact sizes of the highly illuminated sites are not known with high precision. Furthermore, it has been modelled [RD8] that a shift of 30% in elevation may result in a 20% increase of the monthly illumination. Consequently, all the values presented above are to be used carefully and are subject to change when more accurate data will become available (e.g. from SMART-1 data exploitation and from on-going and planned missions). The low resolution of the available data also prevents from obtaining reliable information concerning the shadowing effects of local topographic features such as large boulders and rocks, steep slopes, hills, etc., which could be of importance for the navigation function of a rover: due to the low sun elevation angle, the local surface roughness will cast many long shadows over the area.
NEXT - Lunar Environment Specifications NEXT-LL-LES-ESA(HME)-0001
Issue 1 revision 0 page 19 of 52
s
5.2 Craters
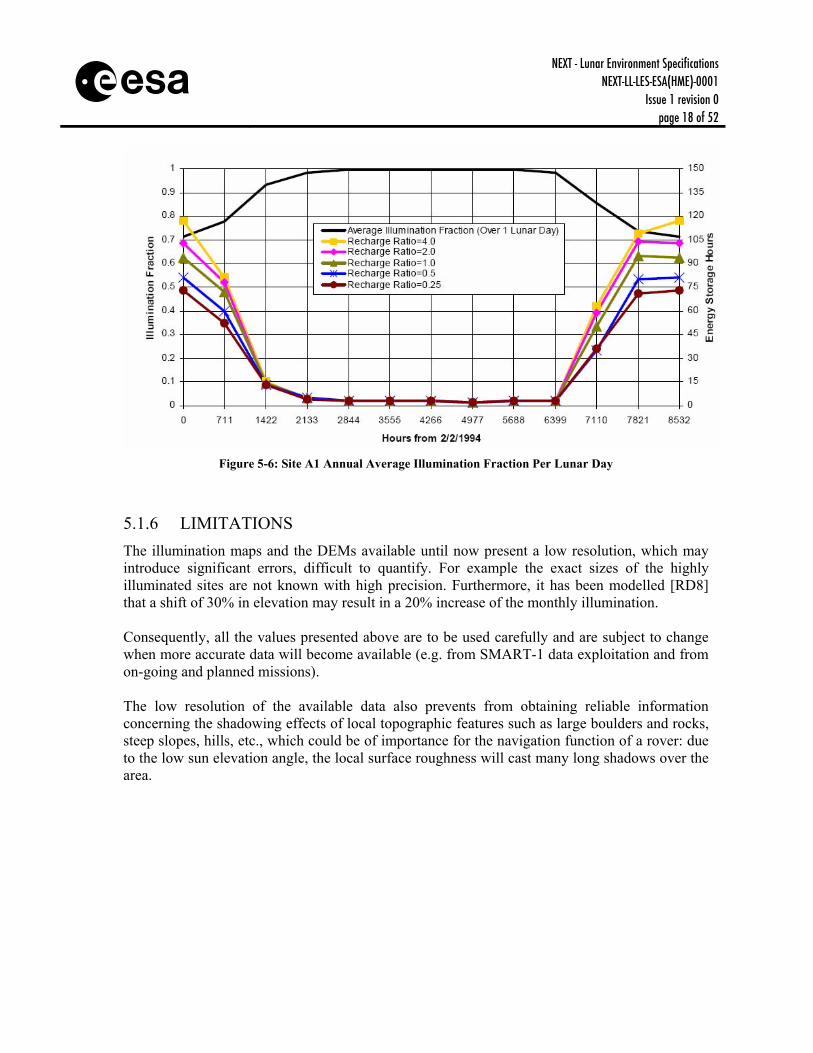
5.2.1 GENERAL FEATURES OF THE SOUTH POLE AREA The surface of the Moon is not affected by atmosphere, water, life or altered by recent geological activity. Consequently it recorded most of the alterations from bombardment by external objects and is thus heavily cratered. The largest impact crater of the Moon is the Aitken basin, which encompasses all the South Pole area. This impact crater is roughly 2500 kilometres in diameter and 13 kilometres deep. Figure 5-7 shows the Aitken basin circled with black dashes. The South Pole is located within the white-grey bottom area inside the circle.
Figure 5-7: Aitken Basin
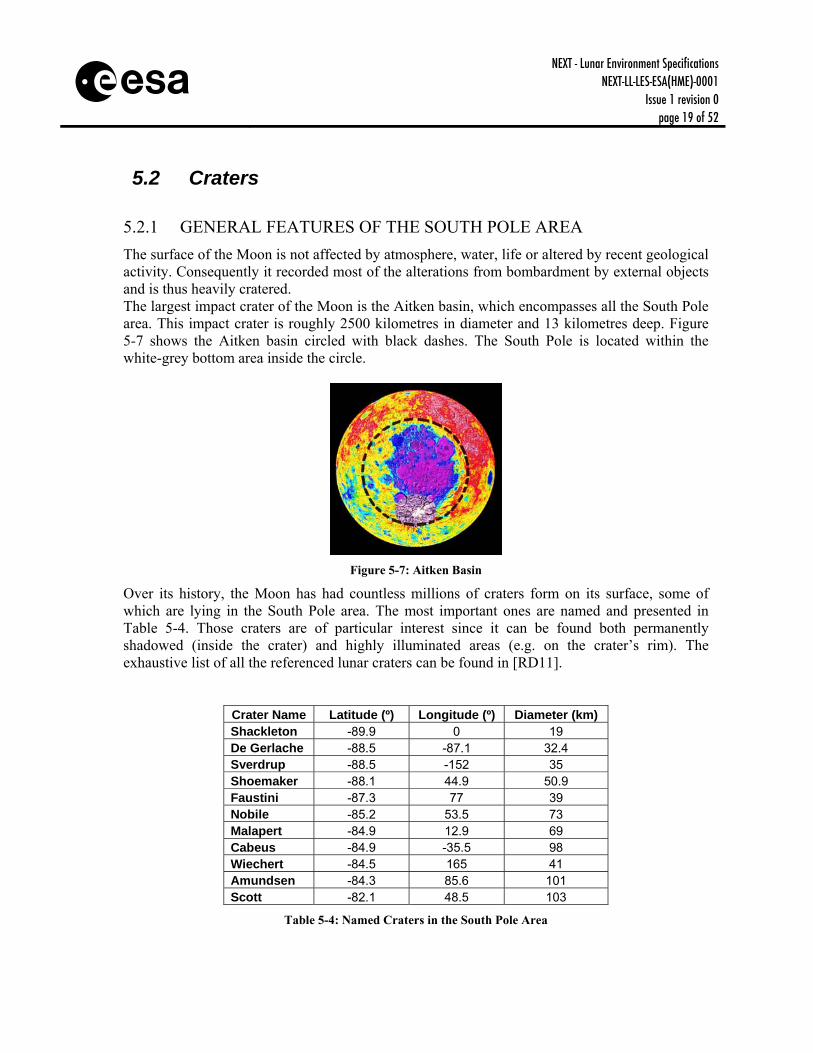
Over its history, the Moon has had countless millions of craters form on its surface, some of which are lying in the South Pole area. The most important ones are named and presented in Table 5-4. Those craters are of particular interest since it can be found both permanently shadowed (inside the crater) and highly illuminated areas (e.g. on the crater’s rim). The exhaustive list of all the referenced lunar craters can be found in [RD11].
Crater Name Latitude (º) Longitude (º) Diameter (km) Shackleton -89.9 0 19 De Gerlache -88.5 -87.1 32.4 Sverdrup -88.5 -152 35 Shoemaker -88.1 44.9 50.9 Faustini -87.3 77 39 Nobile -85.2 53.5 73 Malapert -84.9 12.9 69 Cabeus -84.9 -35.5 98 Wiechert -84.5 165 41 Amundsen -84.3 85.6 101 Scott -82.1 48.5 103
Table 5-4: Named Craters in the South Pole Area
NEXT - Lunar Environment Specifications NEXT-LL-LES-ESA(HME)-0001
Issue 1 revision 0 page 20 of 52
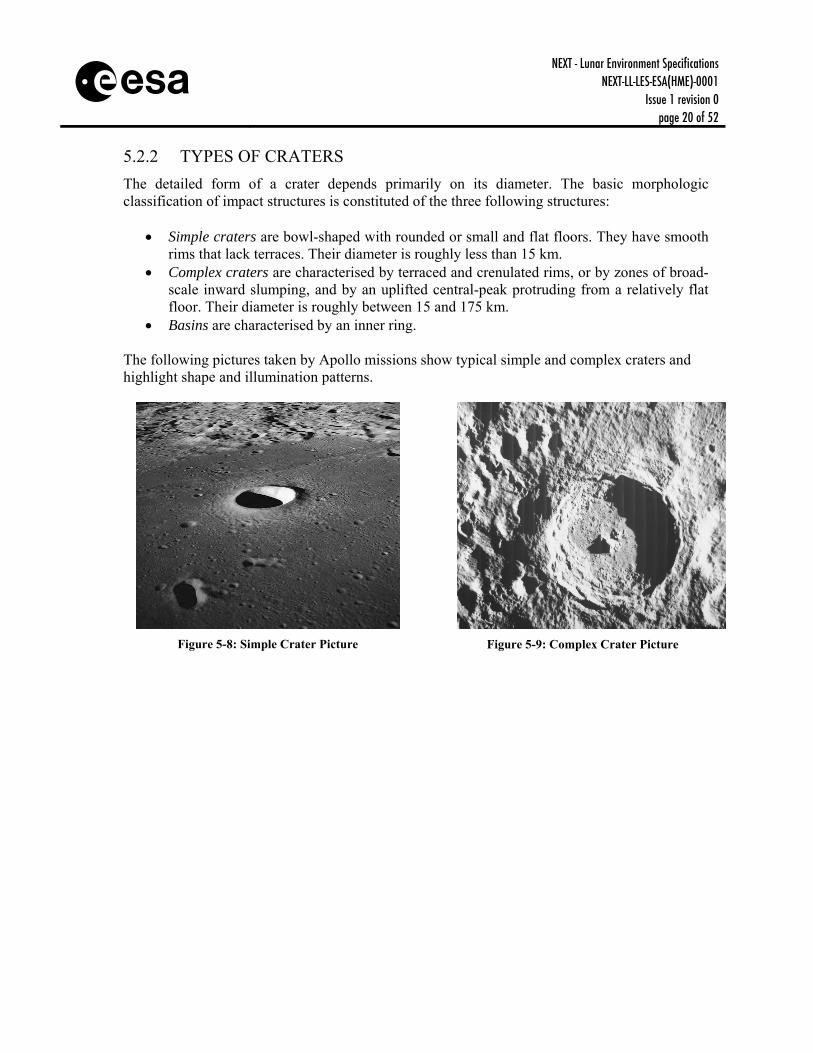
s 5.2.2 TYPES OF CRATERS The detailed form of a crater depends primarily on its diameter. The basic morphologic classification of impact structures is constituted of the three following structures:
• Simple craters are bowl-shaped with rounded or small and flat floors. They have smooth rims that lack terraces. Their diameter is roughly less than 15 km.
• Complex craters are characterised by terraced and crenulated rims, or by zones of broad-scale inward slumping, and by an uplifted central-peak protruding from a relatively flat floor. Their diameter is roughly between 15 and 175 km.
• Basins are characterised by an inner ring. The following pictures taken by Apollo missions show typical simple and complex craters and highlight shape and illumination patterns.
Figure 5-8: Simple Crater Picture
Figure 5-9: Complex Crater Picture
NEXT - Lunar Environment Specifications NEXT-LL-LES-ESA(HME)-0001
Issue 1 revision 0 page 21 of 52
s
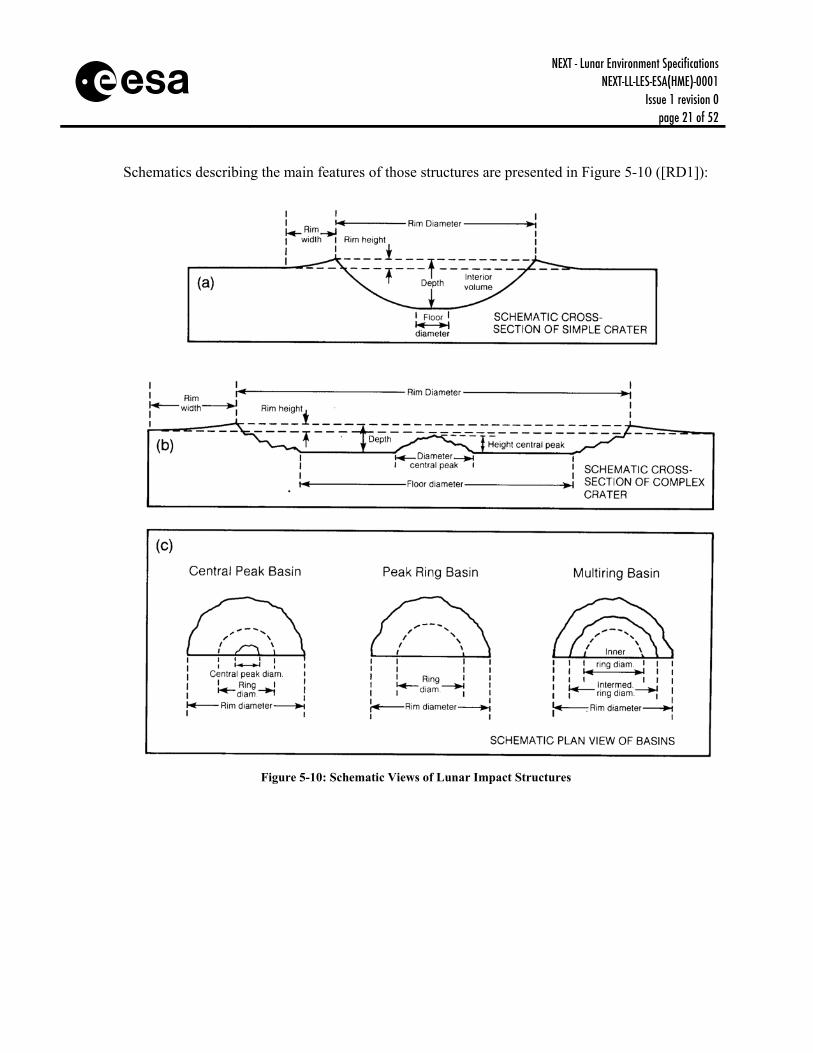
Schematics describing the main features of those structures are presented in Figure 5-10 ([RD1]):
Figure 5-10: Schematic Views of Lunar Impact Structures
NEXT - Lunar Environment Specifications NEXT-LL-LES-ESA(HME)-0001
Issue 1 revision 0 page 22 of 52
s
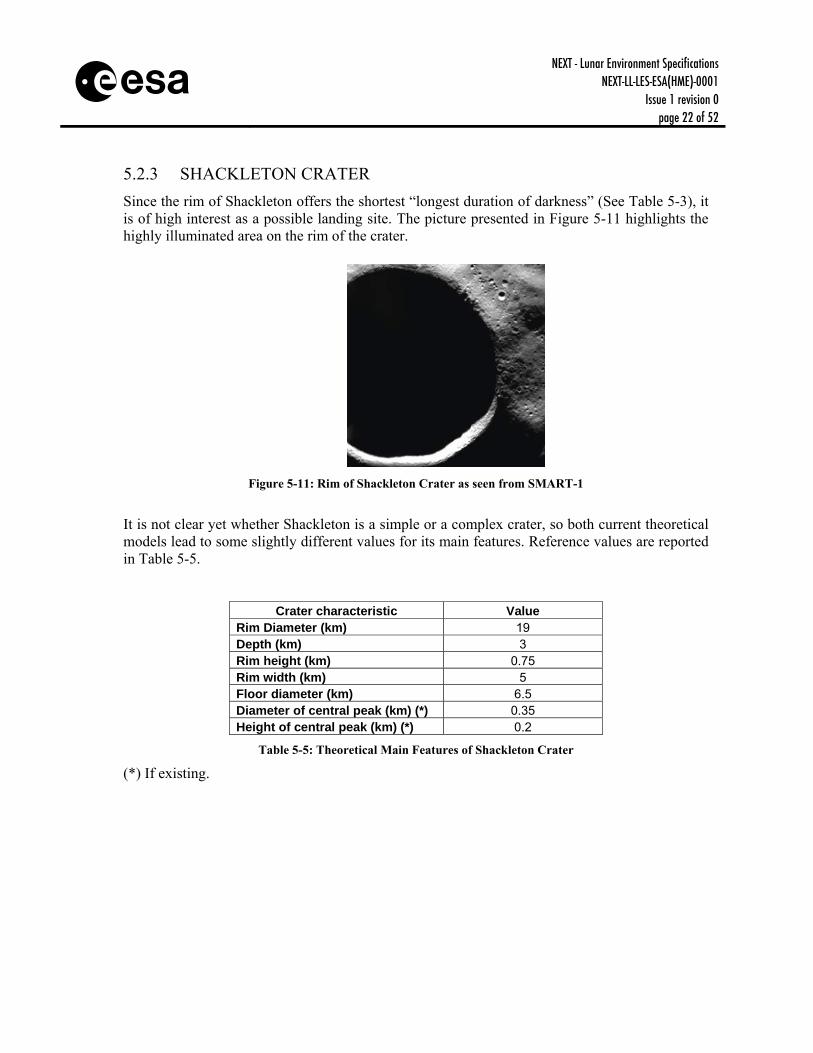
5.2.3 SHACKLETON CRATER Since the rim of Shackleton offers the shortest “longest duration of darkness” (See Table 5-3), it is of high interest as a possible landing site. The picture presented in Figure 5-11 highlights the highly illuminated area on the rim of the crater.
Figure 5-11: Rim of Shackleton Crater as seen from SMART-1
It is not clear yet whether Shackleton is a simple or a complex crater, so both current theoretical models lead to some slightly different values for its main features. Reference values are reported in Table 5-5.
Crater characteristic Value Rim Diameter (km) 19 Depth (km) 3 Rim height (km) 0.75 Rim width (km) 5 Floor diameter (km) 6.5 Diameter of central peak (km) (*) 0.35 Height of central peak (km) (*) 0.2
Table 5-5: Theoretical Main Features of Shackleton Crater
(*) If existing.
NEXT - Lunar Environment Specifications NEXT-LL-LES-ESA(HME)-0001
Issue 1 revision 0 page 23 of 52
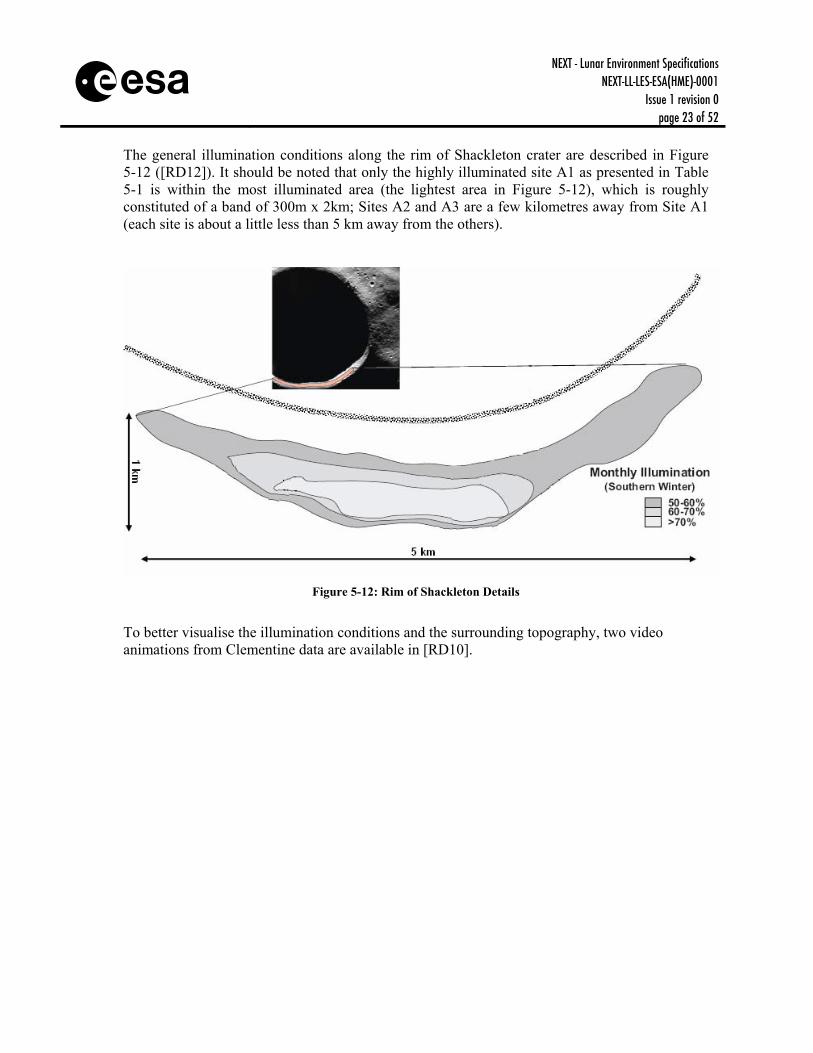
s The general illumination conditions along the rim of Shackleton crater are described in Figure 5-12 ([RD12]). It should be noted that only the highly illuminated site A1 as presented in Table 5-1 is within the most illuminated area (the lightest area in Figure 5-12), which is roughly constituted of a band of 300m x 2km; Sites A2 and A3 are a few kilometres away from Site A1 (each site is about a little less than 5 km away from the others).
Figure 5-12: Rim of Shackleton Details
To better visualise the illumination conditions and the surrounding topography, two video animations from Clementine data are available in [RD10].
NEXT - Lunar Environment Specifications NEXT-LL-LES-ESA(HME)-0001
Issue 1 revision 0 page 24 of 52
s
5.3 Temperatures
5.3.1 GENERAL TEMPERATURE FEATURES OF THE MOON The lunar surface undergoes very high temperatures variations, and temperature values differ significantly from one region to another: the lunar surface temperature may be as low as 40 K in some permanently shaded craters (and even lower, up to only a few Kelvin, in some double-ringed craters) and as high as 400 K (at solar noon at the equator). Data on temperature values and daily excursions at low and mid-latitudes are available from in-situ measurements performed during the Apollo missions. For example, at Apollo 15 landing site (26.1ºN, 3.6ºE) the maximum observed temperature was 374K and the minimum temperature 92K ([RD1]). Low and mid-latitude areas can undergo an overall temperature excursion (from noon to sunrise) of up to 300K through a lunar day. This data could be correlated with various models considering flat areas and a diurnal cycle divided equally between day and night. However temperatures at high-latitudes, and specifically in polar areas, were never measured in-situ, and are difficult to predict. The poles present certain specificities that prevent from extrapolating the data from the low and mid-latitudes temperatures. That is why only the results of different models of the Moon thermal environment at the South Pole are available. Many parameters need to be taken into account for those thermal analyses, among others:
- the diurnal cycle and its day/night distribution (illumination pattern during one day, see Section 5.1)
- the seasonal cycle - the local topography, particularly the altitude and the slope, as well as the topography of
the surroundings - the possible partial obscuration of the solar disk - the roughness - the lunar soil properties (density, conductivity, etc.) and their variation with depth - the Moon internal heat dissipation - the crater type and geometry (if applicable) - the latitude and the longitude
Concerning the South Pole, their precise values and specific impact on surface temperature are not well-known yet. One must note that the temperatures presented below for the South Pole area and for the Shackleton crater in particular rely on many assumptions and thus that the level of uncertainty is significant. Each model found in the literature focuses on one or several parameters and effects. However, none seems to take into account a realistic and detailed illumination/shadow pattern associated with highly illuminated sites (see Section 5.1.4). Moreover, since the accuracy of the model results depends of the accuracy of the inputs and that many of them are still quite unknown and uncertain for the South Pole of the Moon, the data presented below have to be handled with care and may be subject to change.
NEXT - Lunar Environment Specifications NEXT-LL-LES-ESA(HME)-0001
Issue 1 revision 0 page 25 of 52
s Various thermal processes take place, i.e. direct irradiation, indirect irradiation, internal heating, heat conduction, IR emission, that determine the thermal behaviour (transient and at steady state) of the lunar surface.
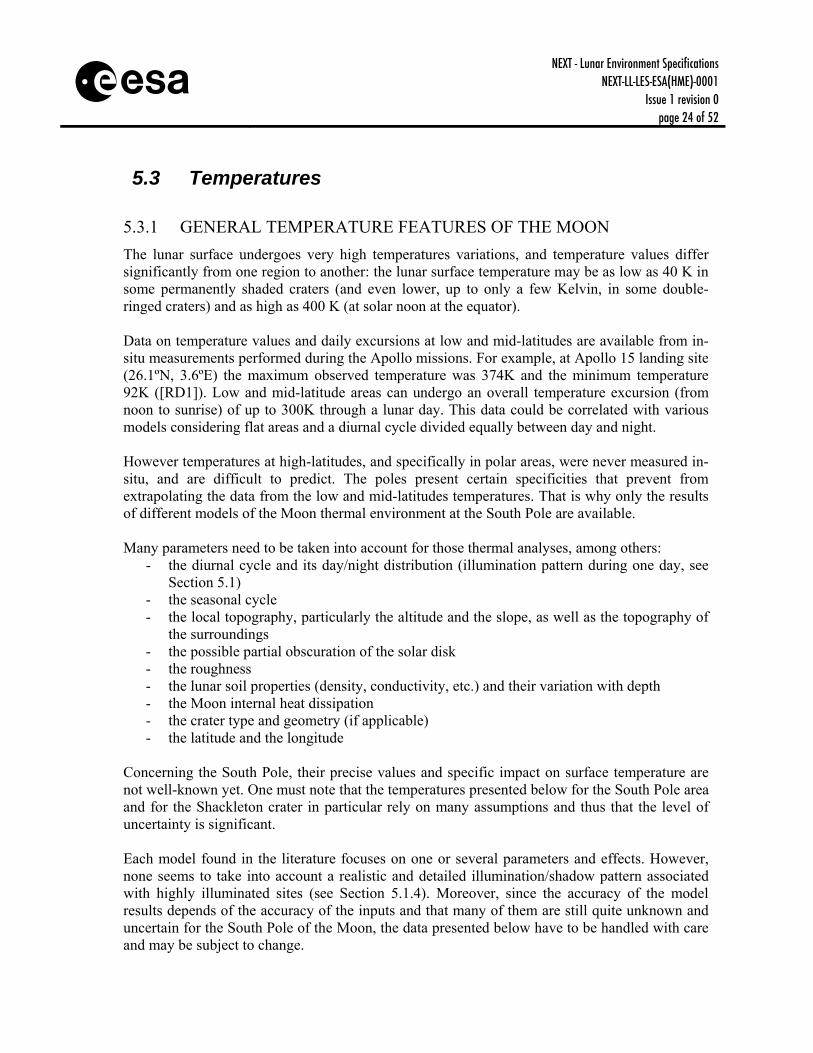
5.3.2 TEMPERATURES OF FLAT TERRAIN IN THE SOUTH POLE AREA Flat surfaces temperatures are driven by the latitude. Different models are described in the literature, but certain are not applied for very high latitudes. Thus, results vary from one to the other. The model presented in [RD14] introduces a subsurface cooling flux equal to 6 W.m-2 to reproduce a temperature at sunrise of approximately 100K, which agrees with the observations. The resulting Lunar surface temperature as a function of the latitude ([RD14]), for the Near Side, is presented in Figure 5-13:
Figure 5-13: Steady-state Lunar Surface Temperature as a Function of the Latitude on the Near Side
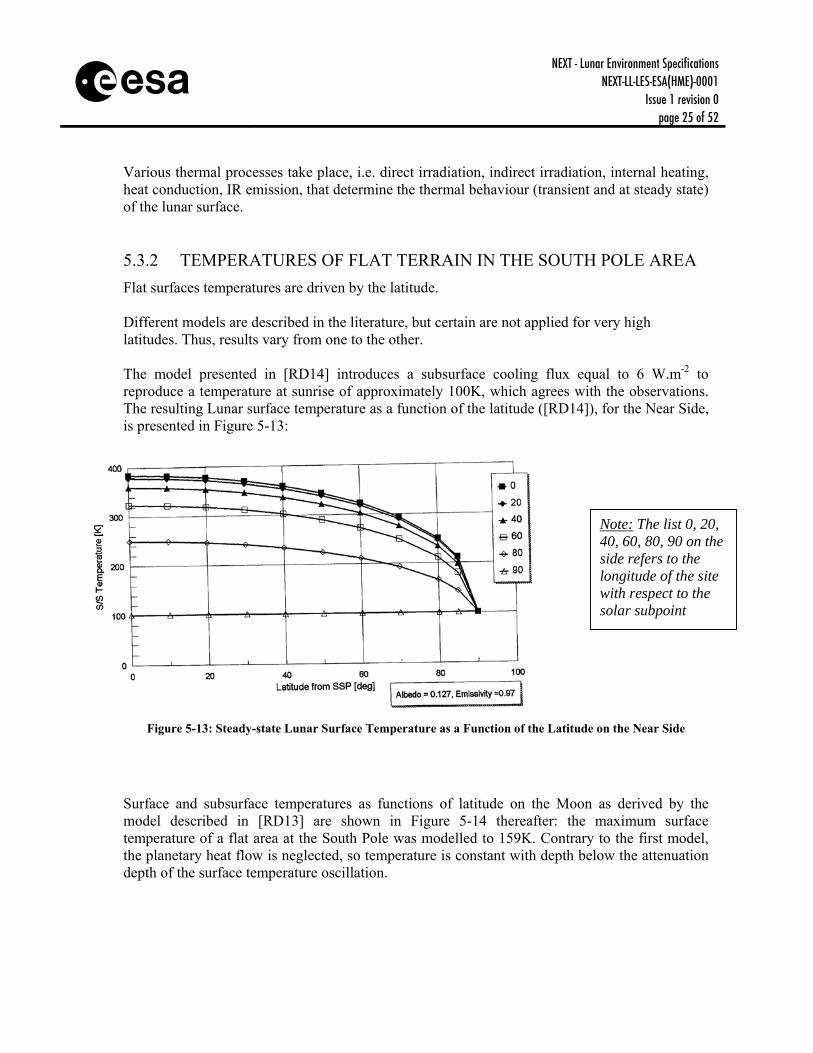
Surface and subsurface temperatures as functions of latitude on the Moon as derived by the model described in [RD13] are shown in Figure 5-14 thereafter: the maximum surface temperature of a flat area at the South Pole was modelled to 159K. Contrary to the first model, the planetary heat flow is neglected, so temperature is constant with depth below the attenuation depth of the surface temperature oscillation.
Note: The list 0, 20, 40, 60, 80, 90 on the side refers to the longitude of the site with respect to the solar subpoint
NEXT - Lunar Environment Specifications NEXT-LL-LES-ESA(HME)-0001
Issue 1 revision 0 page 26 of 52
s
Figure 5-14: Maximum Surface Temperature as a
Function of the Latitude
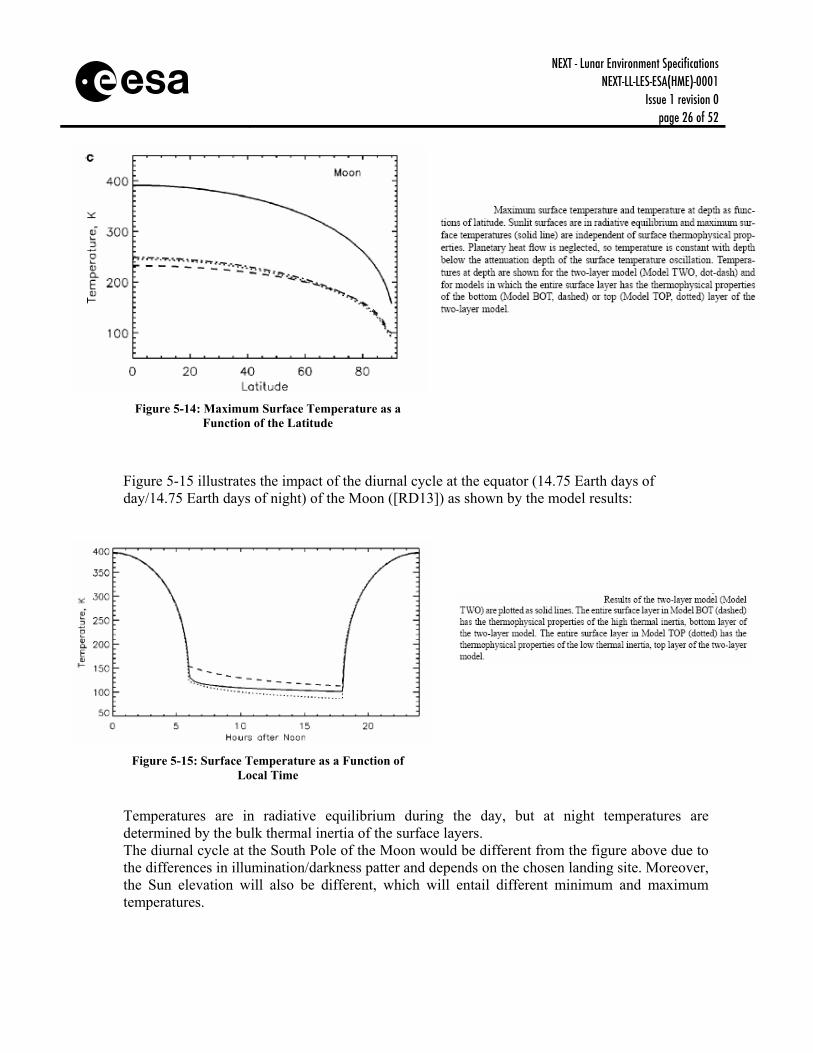
Figure 5-15 illustrates the impact of the diurnal cycle at the equator (14.75 Earth days of day/14.75 Earth days of night) of the Moon ([RD13]) as shown by the model results:
Figure 5-15: Surface Temperature as a Function of
Local Time
Temperatures are in radiative equilibrium during the day, but at night temperatures are determined by the bulk thermal inertia of the surface layers. The diurnal cycle at the South Pole of the Moon would be different from the figure above due to the differences in illumination/darkness patter and depends on the chosen landing site. Moreover, the Sun elevation will also be different, which will entail different minimum and maximum temperatures.
NEXT - Lunar Environment Specifications NEXT-LL-LES-ESA(HME)-0001
Issue 1 revision 0 page 27 of 52
s 5.3.3 MODELISATION OF THE IMPACT OF TOPOGRAPHY ON
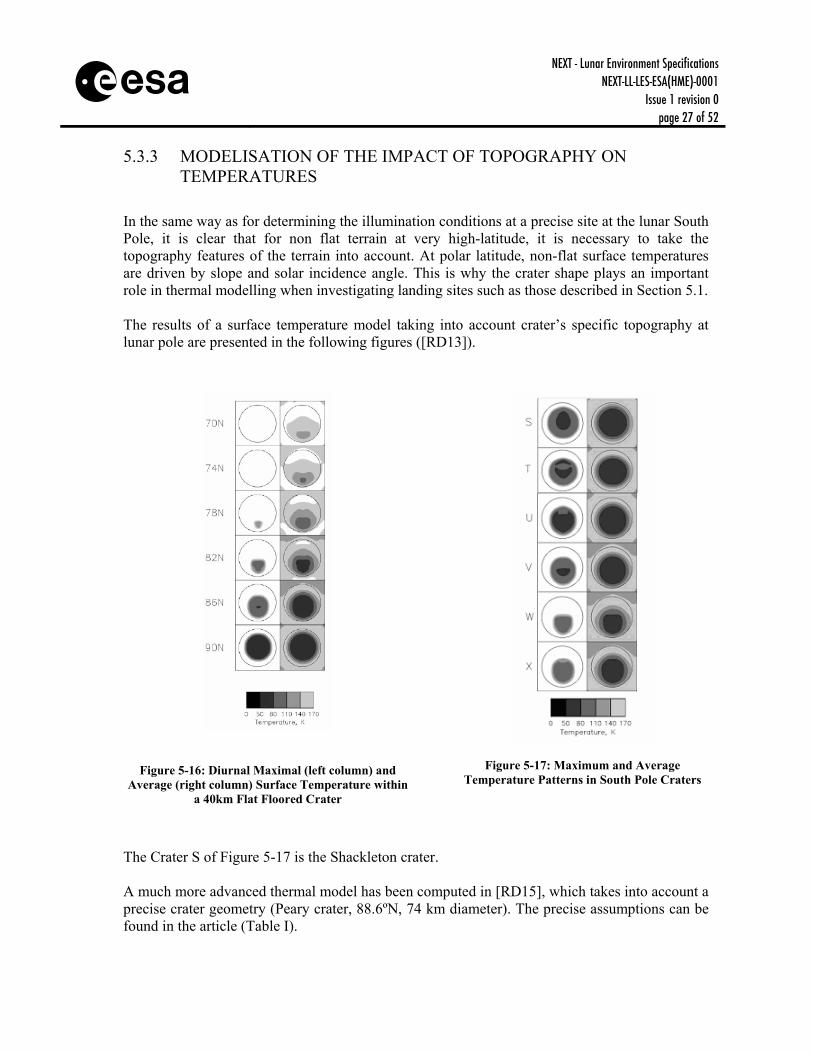
TEMPERATURES In the same way as for determining the illumination conditions at a precise site at the lunar South Pole, it is clear that for non flat terrain at very high-latitude, it is necessary to take the topography features of the terrain into account. At polar latitude, non-flat surface temperatures are driven by slope and solar incidence angle. This is why the crater shape plays an important role in thermal modelling when investigating landing sites such as those described in Section 5.1. The results of a surface temperature model taking into account crater’s specific topography at lunar pole are presented in the following figures ([RD13]).
Figure 5-16: Diurnal Maximal (left column) and Average (right column) Surface Temperature within
a 40km Flat Floored Crater
Figure 5-17: Maximum and Average Temperature Patterns in South Pole Craters
The Crater S of Figure 5-17 is the Shackleton crater. A much more advanced thermal model has been computed in [RD15], which takes into account a precise crater geometry (Peary crater, 88.6ºN, 74 km diameter). The precise assumptions can be found in the article (Table I).
NEXT - Lunar Environment Specifications NEXT-LL-LES-ESA(HME)-0001
Issue 1 revision 0 page 28 of 52
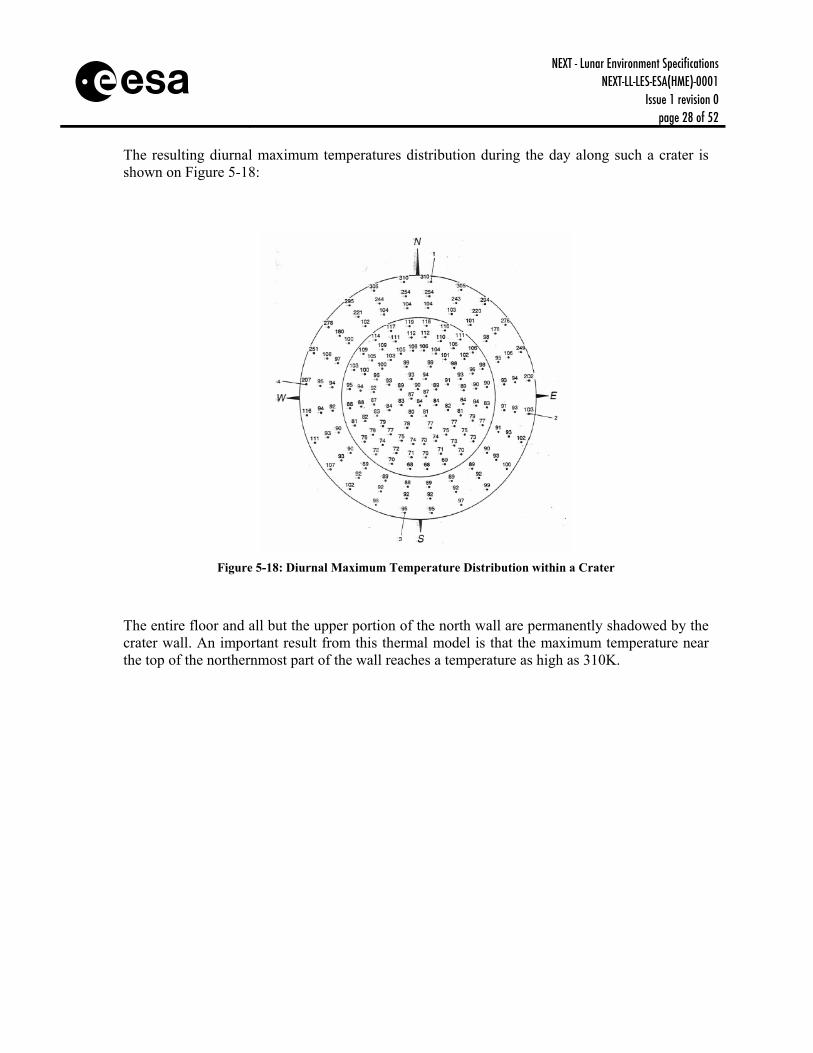
s The resulting diurnal maximum temperatures distribution during the day along such a crater is shown on Figure 5-18:
Figure 5-18: Diurnal Maximum Temperature Distribution within a Crater
The entire floor and all but the upper portion of the north wall are permanently shadowed by the crater wall. An important result from this thermal model is that the maximum temperature near the top of the northernmost part of the wall reaches a temperature as high as 310K.
NEXT - Lunar Environment Specifications NEXT-LL-LES-ESA(HME)-0001
Issue 1 revision 0 page 29 of 52
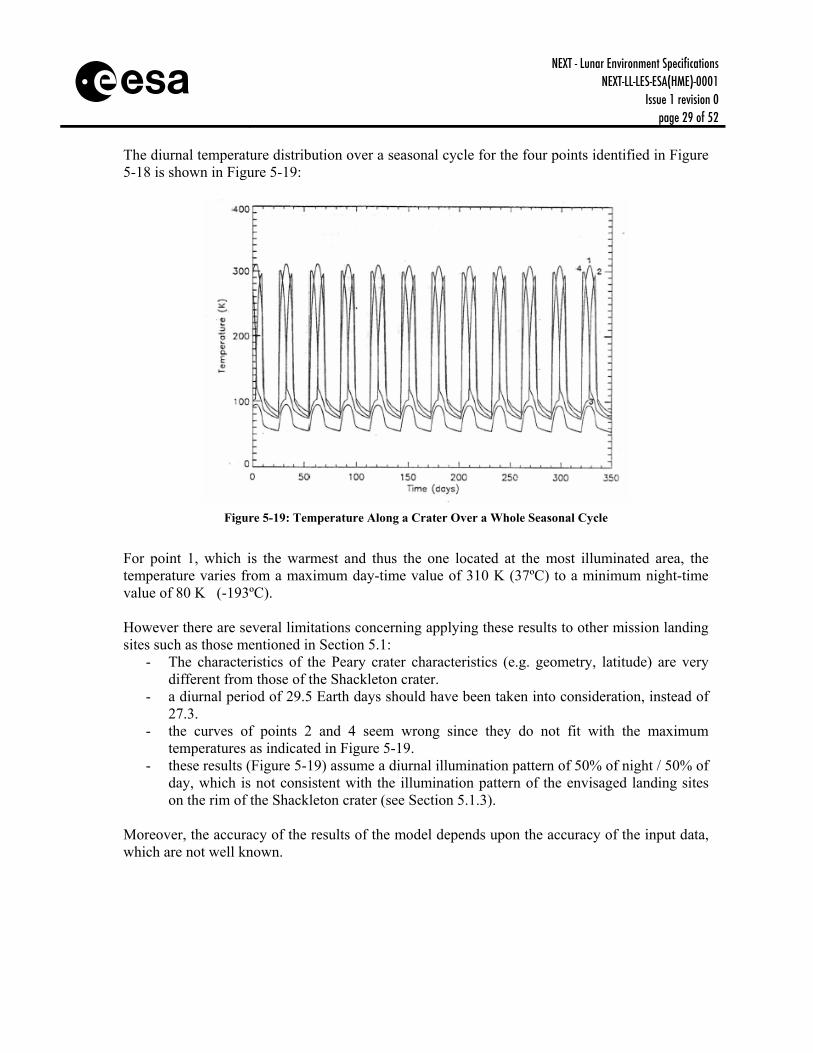
s The diurnal temperature distribution over a seasonal cycle for the four points identified in Figure 5-18 is shown in Figure 5-19:
Figure 5-19: Temperature Along a Crater Over a Whole Seasonal Cycle
For point 1, which is the warmest and thus the one located at the most illuminated area, the temperature varies from a maximum day-time value of 310 K (37ºC) to a minimum night-time value of 80 K (-193ºC). However there are several limitations concerning applying these results to other mission landing sites such as those mentioned in Section 5.1:
- The characteristics of the Peary crater characteristics (e.g. geometry, latitude) are very different from those of the Shackleton crater.
- a diurnal period of 29.5 Earth days should have been taken into consideration, instead of 27.3.
- the curves of points 2 and 4 seem wrong since they do not fit with the maximum temperatures as indicated in Figure 5-19.
- these results (Figure 5-19) assume a diurnal illumination pattern of 50% of night / 50% of day, which is not consistent with the illumination pattern of the envisaged landing sites on the rim of the Shackleton crater (see Section 5.1.3).
Moreover, the accuracy of the results of the model depends upon the accuracy of the input data, which are not well known.
NEXT - Lunar Environment Specifications NEXT-LL-LES-ESA(HME)-0001
Issue 1 revision 0 page 30 of 52
s 5.3.4 TEMPERATURES IN THE PERMANENTLY SHADED AREAS Permanently shaded craters offer the lowest temperatures of the Moon, and their floor may go from 40K to 110K. In the case of a double shaded area, it can be even colder, with temperatures below 10 K.
5.3.5 SEASONAL VARIATION The literature shows contradicting results concerning the importance of the temperature variation through a seasonal cycle. [RD13] states that because the Moon solar obliquity is only 1.54 deg, temperatures at low latitudes are determined predominantly by the diurnal period and vary little with season. Temperatures of surface very close to the poles have a large seasonal variation. In [RD15], according to the results from the model, the seasonal cycle of the Moon is hardly noticeable in its affect on the surface temperatures in Peary crater.
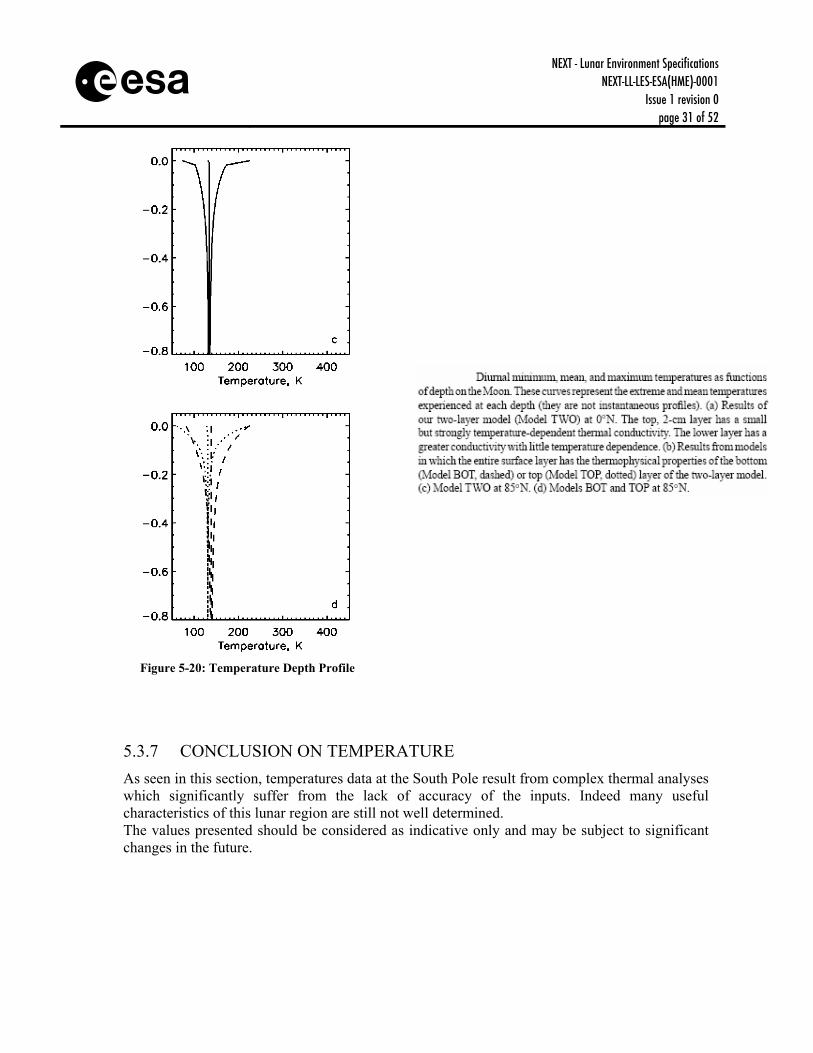
5.3.6 DEPTH PROFILE Lunar regolith has very good thermal insulation properties (see Section 5.5.1) with a thermal conductivity more than ten times lower than earthly insulation materials. For this reason, the temperature reaches a quite stable temperature very fast with depth, thus not undergoing the same temperature excursions as the lunar surface. Lateral heat transfer can be neglected in many cases since the length scales for lateral heat transfer are greater than those for vertical heat transfer. An exception occurs near the boundaries between shadowed and illuminated regions, where lateral temperature gradients are very large. Patterns of the temperature evolution with depth at high-latitude (85º) considering flat areas are provided in Figure 5-20 ([RD14]) thereafter.
NEXT - Lunar Environment Specifications NEXT-LL-LES-ESA(HME)-0001
Issue 1 revision 0 page 31 of 52
s
Figure 5-20: Temperature Depth Profile
5.3.7 CONCLUSION ON TEMPERATURE As seen in this section, temperatures data at the South Pole result from complex thermal analyses which significantly suffer from the lack of accuracy of the inputs. Indeed many useful characteristics of this lunar region are still not well determined. The values presented should be considered as indicative only and may be subject to significant changes in the future.
NEXT - Lunar Environment Specifications NEXT-LL-LES-ESA(HME)-0001
Issue 1 revision 0 page 32 of 52
s
5.4 Topography
5.4.1 INTRODUCTION The deviations from the overall spherical shape of the Moon due to local topography can be significant. The maximum and minimum surface elevations, with respect to a reference sphere with a radius of 1737.4 km, are approximately from -9 km to +8 km, with both extremes occurring on the far-side of the Moon. The maximum surface elevations occur in the region surrounding the Korolev crater while the minimum elevations occur in the geographically nearby SPA basin.
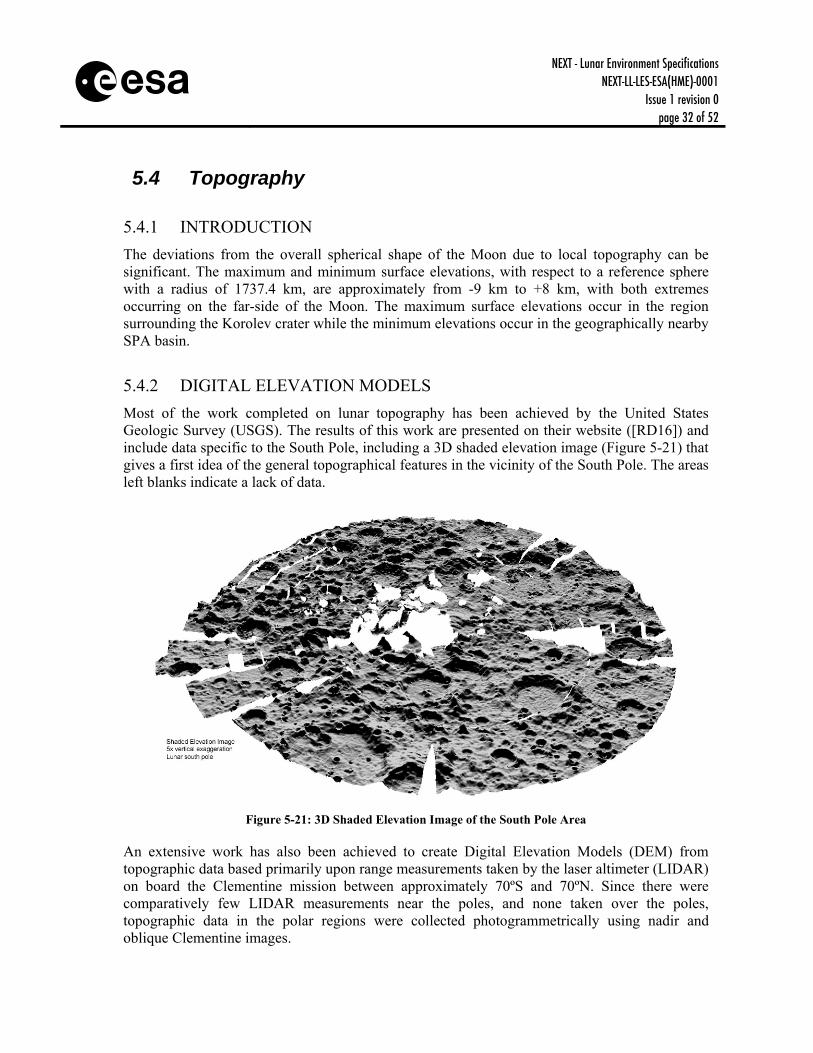
5.4.2 DIGITAL ELEVATION MODELS Most of the work completed on lunar topography has been achieved by the United States Geologic Survey (USGS). The results of this work are presented on their website ([RD16]) and include data specific to the South Pole, including a 3D shaded elevation image (Figure 5-21) that gives a first idea of the general topographical features in the vicinity of the South Pole. The areas left blanks indicate a lack of data.
Figure 5-21: 3D Shaded Elevation Image of the South Pole Area
An extensive work has also been achieved to create Digital Elevation Models (DEM) from topographic data based primarily upon range measurements taken by the laser altimeter (LIDAR) on board the Clementine mission between approximately 70ºS and 70ºN. Since there were comparatively few LIDAR measurements near the poles, and none taken over the poles, topographic data in the polar regions were collected photogrammetrically using nadir and oblique Clementine images.
NEXT - Lunar Environment Specifications NEXT-LL-LES-ESA(HME)-0001
Issue 1 revision 0 page 33 of 52
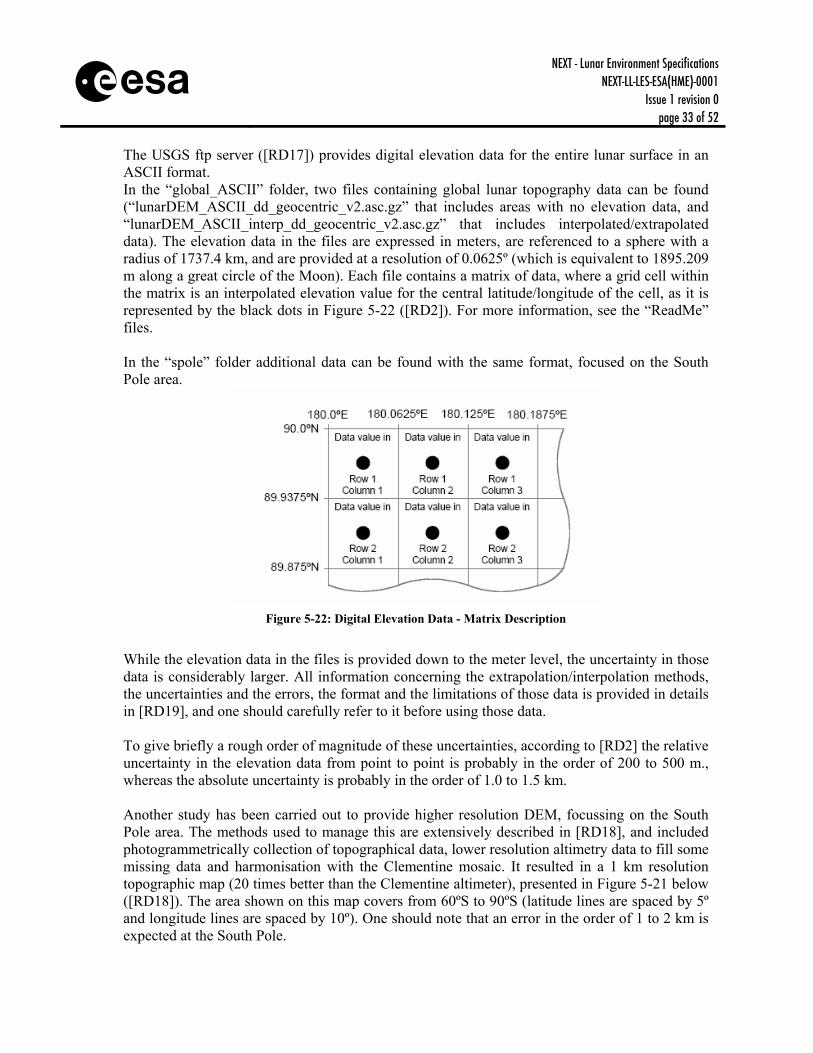
s The USGS ftp server ([RD17]) provides digital elevation data for the entire lunar surface in an ASCII format. In the “global_ASCII” folder, two files containing global lunar topography data can be found (“lunarDEM_ASCII_dd_geocentric_v2.asc.gz” that includes areas with no elevation data, and “lunarDEM_ASCII_interp_dd_geocentric_v2.asc.gz” that includes interpolated/extrapolated data). The elevation data in the files are expressed in meters, are referenced to a sphere with a radius of 1737.4 km, and are provided at a resolution of 0.0625º (which is equivalent to 1895.209 m along a great circle of the Moon). Each file contains a matrix of data, where a grid cell within the matrix is an interpolated elevation value for the central latitude/longitude of the cell, as it is represented by the black dots in Figure 5-22 ([RD2]). For more information, see the “ReadMe” files. In the “spole” folder additional data can be found with the same format, focused on the South Pole area.
Figure 5-22: Digital Elevation Data - Matrix Description
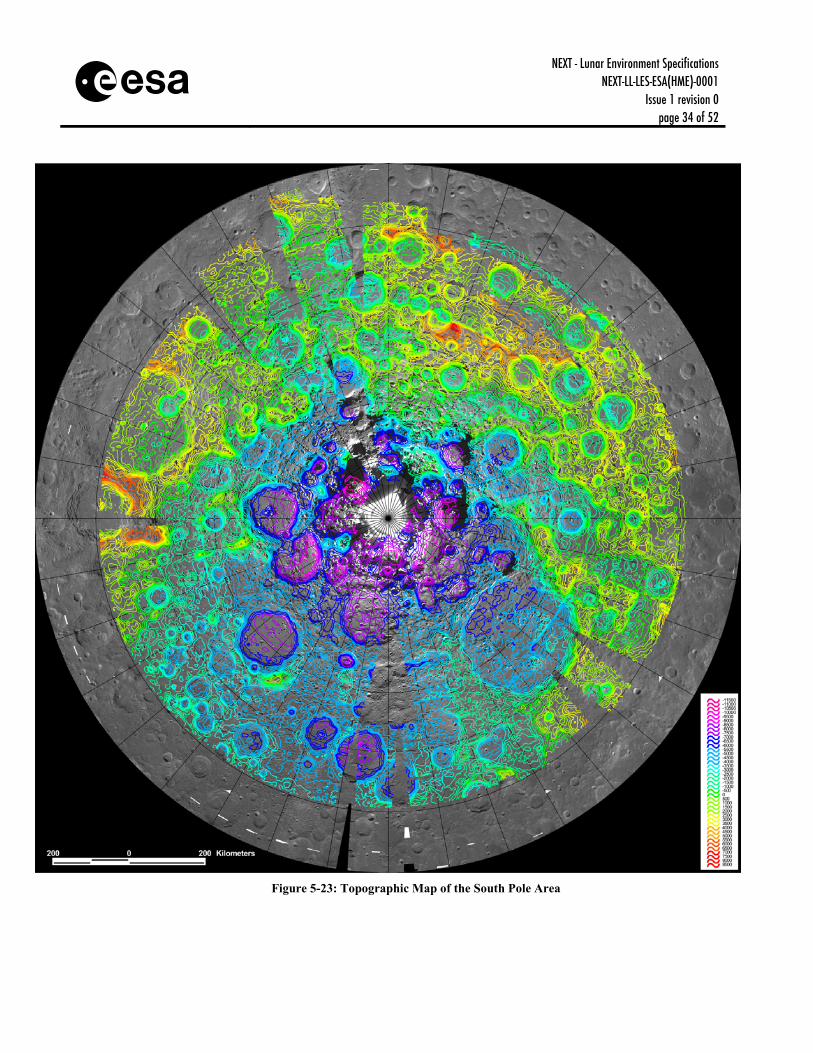
While the elevation data in the files is provided down to the meter level, the uncertainty in those data is considerably larger. All information concerning the extrapolation/interpolation methods, the uncertainties and the errors, the format and the limitations of those data is provided in details in [RD19], and one should carefully refer to it before using those data. To give briefly a rough order of magnitude of these uncertainties, according to [RD2] the relative uncertainty in the elevation data from point to point is probably in the order of 200 to 500 m., whereas the absolute uncertainty is probably in the order of 1.0 to 1.5 km. Another study has been carried out to provide higher resolution DEM, focussing on the South Pole area. The methods used to manage this are extensively described in [RD18], and included photogrammetrically collection of topographical data, lower resolution altimetry data to fill some missing data and harmonisation with the Clementine mosaic. It resulted in a 1 km resolution topographic map (20 times better than the Clementine altimeter), presented in Figure 5-21 below ([RD18]). The area shown on this map covers from 60ºS to 90ºS (latitude lines are spaced by 5º and longitude lines are spaced by 10º). One should note that an error in the order of 1 to 2 km is expected at the South Pole.
NEXT - Lunar Environment Specifications NEXT-LL-LES-ESA(HME)-0001
Issue 1 revision 0 page 34 of 52
s
Figure 5-23: Topographic Map of the South Pole Area
NEXT - Lunar Environment Specifications NEXT-LL-LES-ESA(HME)-0001
Issue 1 revision 0 page 35 of 52
s
5.4.3 LUNAR CONTROL NETWORK Section 5.4.2 described the current state of knowledge regarding the “vertical accuracy” of the lunar topography data. While not strictly a physical property of the Moon, this section provides the current state of knowledge regarding the “horizontal accuracy” of the placement of lunar images (i.e. surface features) on to a well-defined lunar coordinate system. This process is known as establishing a “lunar control network” and usually involves taking image data from a variety of sources and selecting “control points”, also known as landmarks (e.g. craters or imaged spacecraft hardware) for which good position estimates are known and transforming their coordinates into a common coordinate system. The uncertainty or error in the placement of these images on to the lunar body-fixed coordinate system is often called the “map-tie error”. This uncertainty must be accounted for when attempting to land precisely on the Moon or to precisely image a particular spot or feature from lunar orbit. A reference that describes an analysis that produced a Unified Lunar Control Network (ULCN) using images from Apollo, Mariner 10, Galileo, and Earth-based telescopes can be found in [RD2]. The estimated horizontal accuracies of the ULCN range from 100 m to 3 km – with the smaller numbers near the Apollo sites and the larger numbers on the lunar far-side and near the poles. Another reference of [RD2] also describes an activity in progress (in 2005) to update the ULCN by merging the existing ULCN (developed in 1994) with a control network based on the image data set collected during the Clementine mission. For further details and references, one can refer to Section 2.6.2. of [RD2].
NEXT - Lunar Environment Specifications NEXT-LL-LES-ESA(HME)-0001
Issue 1 revision 0 page 36 of 52
s
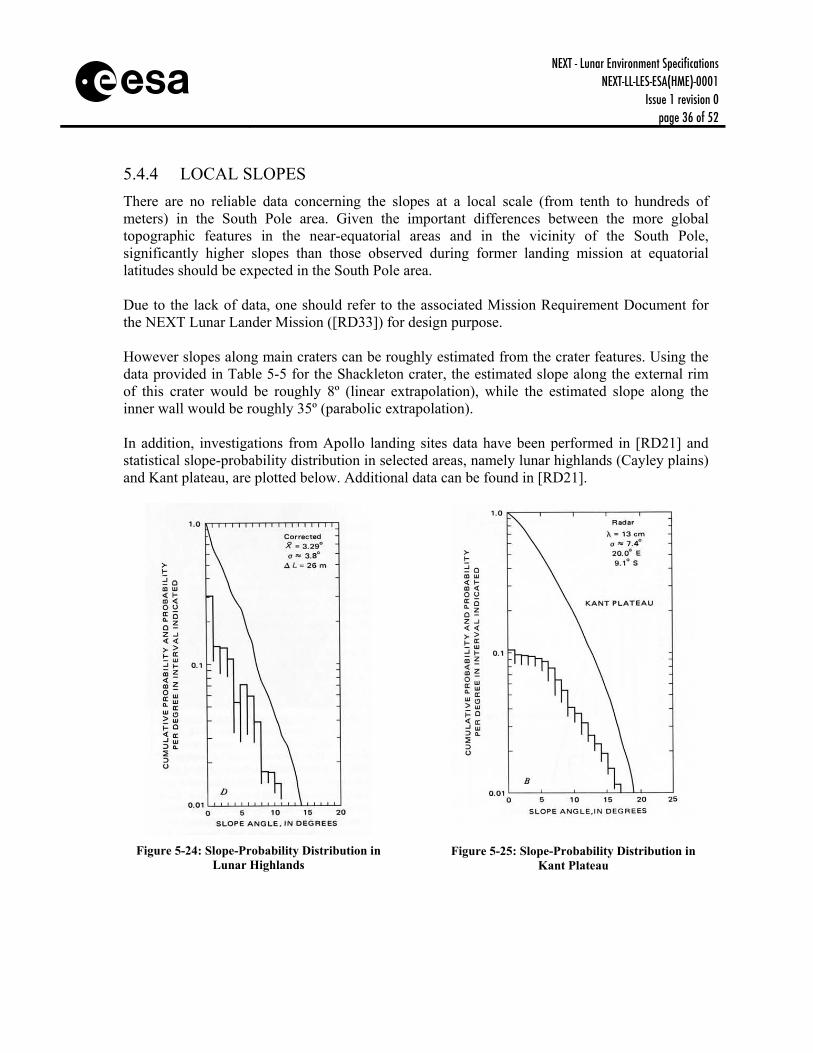
5.4.4 LOCAL SLOPES There are no reliable data concerning the slopes at a local scale (from tenth to hundreds of meters) in the South Pole area. Given the important differences between the more global topographic features in the near-equatorial areas and in the vicinity of the South Pole, significantly higher slopes than those observed during former landing mission at equatorial latitudes should be expected in the South Pole area. Due to the lack of data, one should refer to the associated Mission Requirement Document for the NEXT Lunar Lander Mission ([RD33]) for design purpose. However slopes along main craters can be roughly estimated from the crater features. Using the data provided in Table 5-5 for the Shackleton crater, the estimated slope along the external rim of this crater would be roughly 8º (linear extrapolation), while the estimated slope along the inner wall would be roughly 35º (parabolic extrapolation). In addition, investigations from Apollo landing sites data have been performed in [RD21] and statistical slope-probability distribution in selected areas, namely lunar highlands (Cayley plains) and Kant plateau, are plotted below. Additional data can be found in [RD21].
Figure 5-24: Slope-Probability Distribution in
Lunar Highlands
Figure 5-25: Slope-Probability Distribution in Kant Plateau
NEXT - Lunar Environment Specifications NEXT-LL-LES-ESA(HME)-0001
Issue 1 revision 0 page 37 of 52
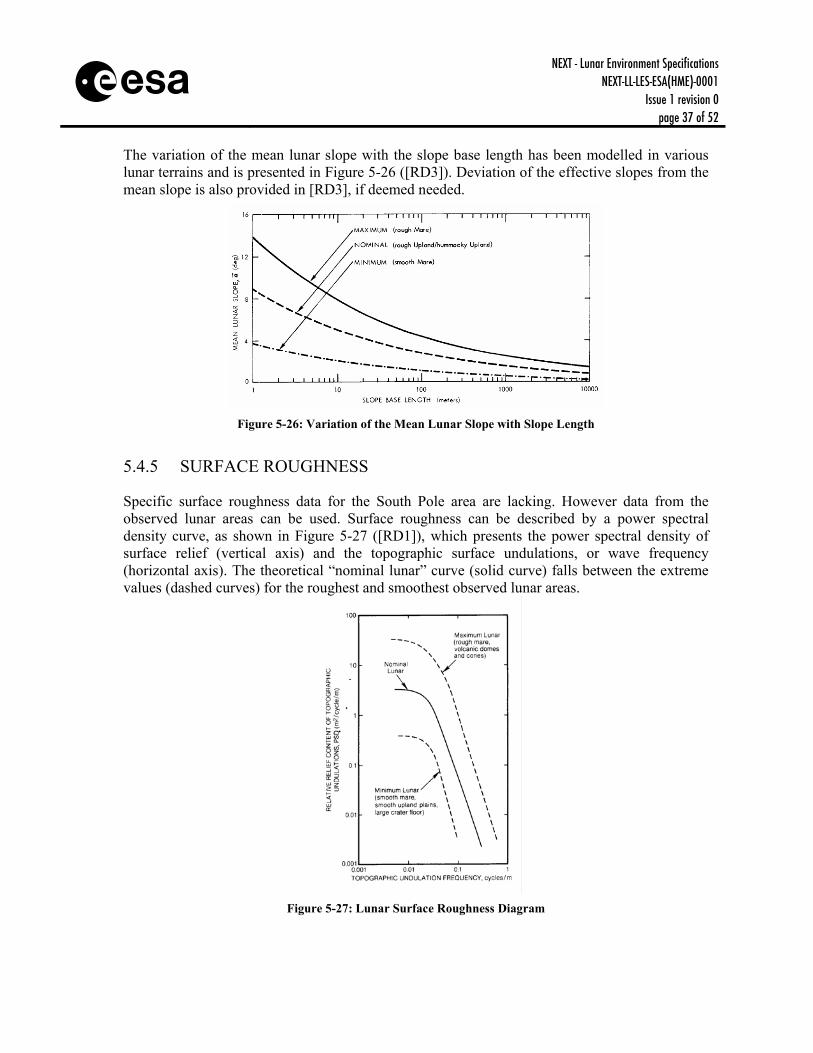
s The variation of the mean lunar slope with the slope base length has been modelled in various lunar terrains and is presented in Figure 5-26 ([RD3]). Deviation of the effective slopes from the mean slope is also provided in [RD3], if deemed needed.
Figure 5-26: Variation of the Mean Lunar Slope with Slope Length
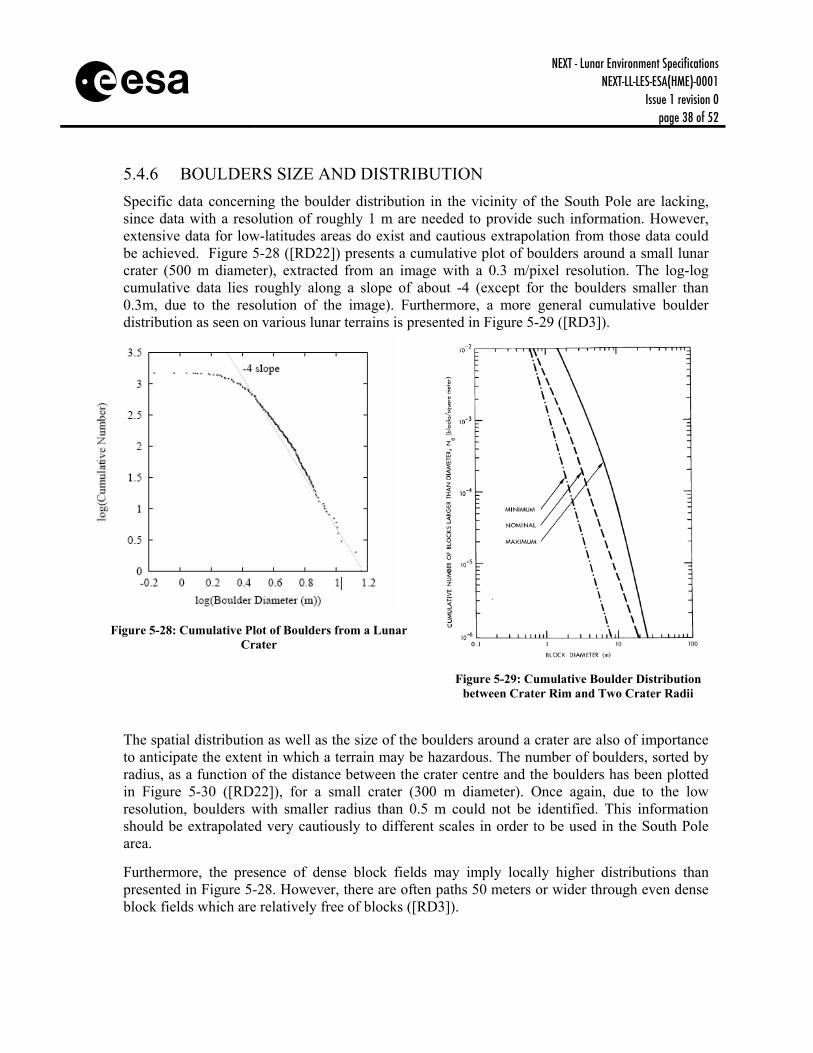
5.4.5 SURFACE ROUGHNESS
Specific surface roughness data for the South Pole area are lacking. However data from the observed lunar areas can be used. Surface roughness can be described by a power spectral density curve, as shown in Figure 5-27 ([RD1]), which presents the power spectral density of surface relief (vertical axis) and the topographic surface undulations, or wave frequency (horizontal axis). The theoretical “nominal lunar” curve (solid curve) falls between the extreme values (dashed curves) for the roughest and smoothest observed lunar areas.
Figure 5-27: Lunar Surface Roughness Diagram
NEXT - Lunar Environment Specifications NEXT-LL-LES-ESA(HME)-0001
Issue 1 revision 0 page 38 of 52
s
5.4.6 BOULDERS SIZE AND DISTRIBUTION Specific data concerning the boulder distribution in the vicinity of the South Pole are lacking, since data with a resolution of roughly 1 m are needed to provide such information. However, extensive data for low-latitudes areas do exist and cautious extrapolation from those data could be achieved. Figure 5-28 ([RD22]) presents a cumulative plot of boulders around a small lunar crater (500 m diameter), extracted from an image with a 0.3 m/pixel resolution. The log-log cumulative data lies roughly along a slope of about -4 (except for the boulders smaller than 0.3m, due to the resolution of the image). Furthermore, a more general cumulative boulder distribution as seen on various lunar terrains is presented in Figure 5-29 ([RD3]).
Figure 5-28: Cumulative Plot of Boulders from a Lunar
Crater
Figure 5-29: Cumulative Boulder Distribution
between Crater Rim and Two Crater Radii
The spatial distribution as well as the size of the boulders around a crater are also of importance to anticipate the extent in which a terrain may be hazardous. The number of boulders, sorted by radius, as a function of the distance between the crater centre and the boulders has been plotted in Figure 5-30 ([RD22]), for a small crater (300 m diameter). Once again, due to the low resolution, boulders with smaller radius than 0.5 m could not be identified. This information should be extrapolated very cautiously to different scales in order to be used in the South Pole area. Furthermore, the presence of dense block fields may imply locally higher distributions than presented in Figure 5-28. However, there are often paths 50 meters or wider through even dense block fields which are relatively free of blocks ([RD3]).
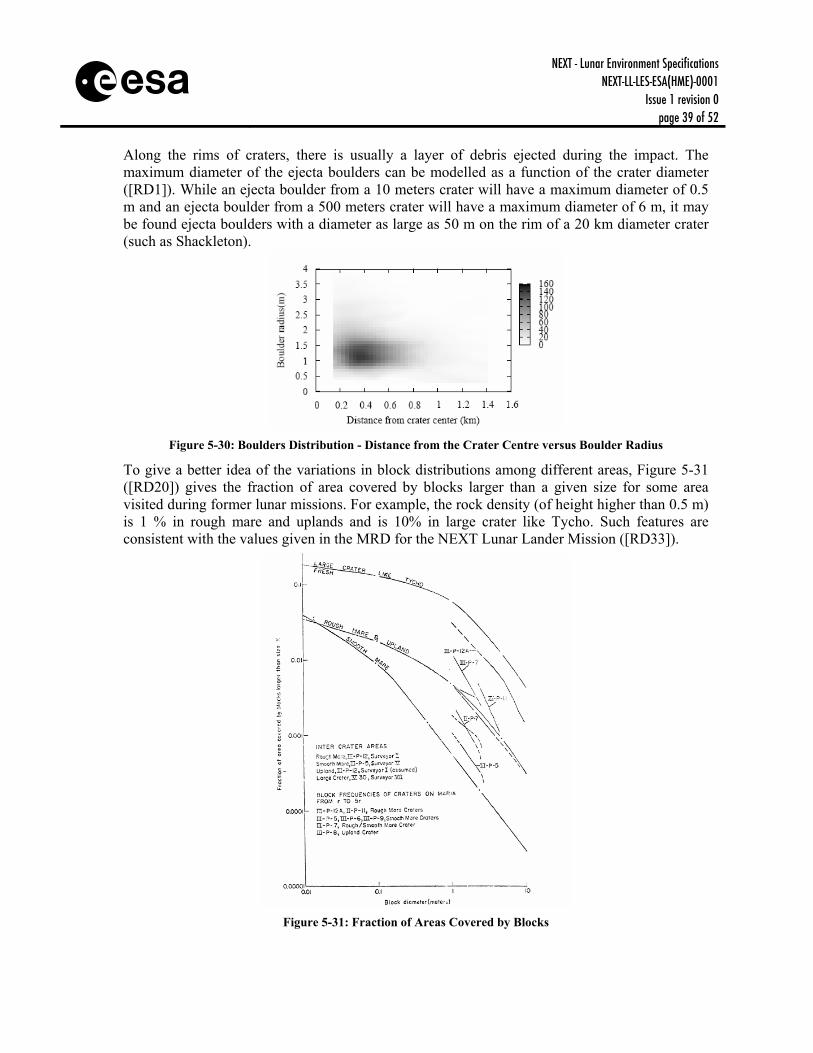
NEXT - Lunar Environment Specifications NEXT-LL-LES-ESA(HME)-0001
Issue 1 revision 0 page 39 of 52
s Along the rims of craters, there is usually a layer of debris ejected during the impact. The maximum diameter of the ejecta boulders can be modelled as a function of the crater diameter ([RD1]). While an ejecta boulder from a 10 meters crater will have a maximum diameter of 0.5 m and an ejecta boulder from a 500 meters crater will have a maximum diameter of 6 m, it may be found ejecta boulders with a diameter as large as 50 m on the rim of a 20 km diameter crater (such as Shackleton).
Figure 5-30: Boulders Distribution - Distance from the Crater Centre versus Boulder Radius
To give a better idea of the variations in block distributions among different areas, Figure 5-31 ([RD20]) gives the fraction of area covered by blocks larger than a given size for some area visited during former lunar missions. For example, the rock density (of height higher than 0.5 m) is 1 % in rough mare and uplands and is 10% in large crater like Tycho. Such features are consistent with the values given in the MRD for the NEXT Lunar Lander Mission ([RD33]).
Figure 5-31: Fraction of Areas Covered by Blocks
NEXT - Lunar Environment Specifications NEXT-LL-LES-ESA(HME)-0001
Issue 1 revision 0 page 40 of 52
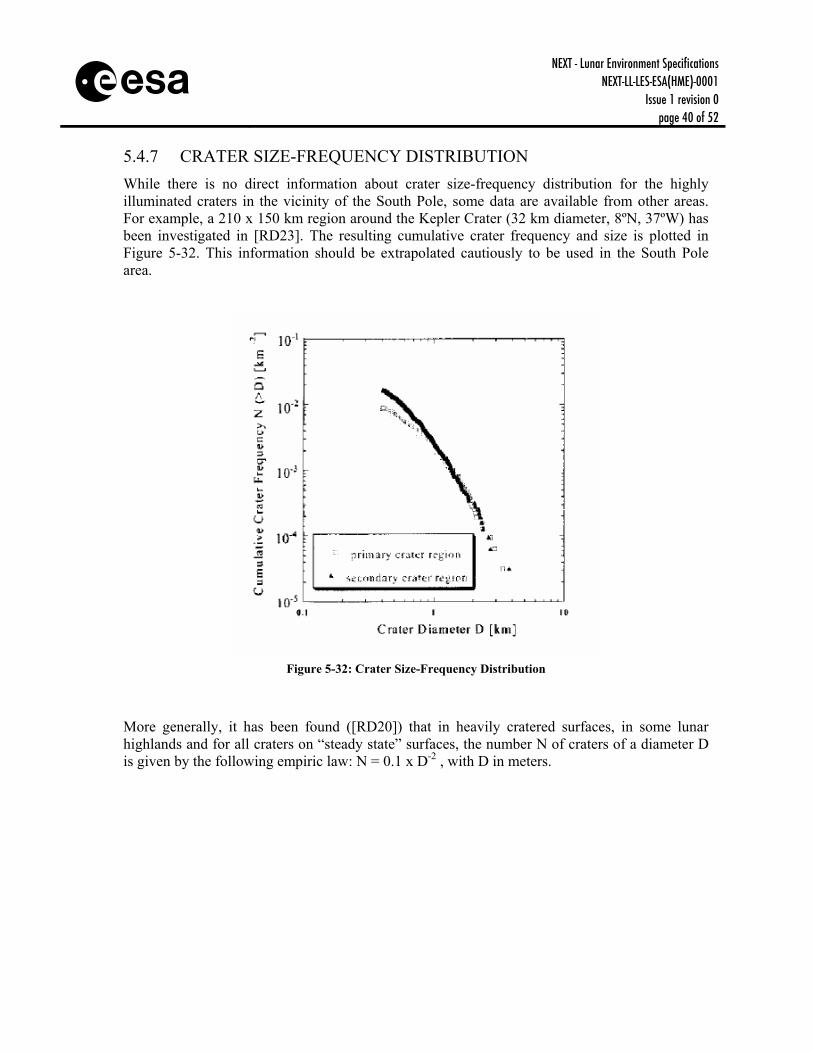
s 5.4.7 CRATER SIZE-FREQUENCY DISTRIBUTION While there is no direct information about crater size-frequency distribution for the highly illuminated craters in the vicinity of the South Pole, some data are available from other areas. For example, a 210 x 150 km region around the Kepler Crater (32 km diameter, 8ºN, 37ºW) has been investigated in [RD23]. The resulting cumulative crater frequency and size is plotted in Figure 5-32. This information should be extrapolated cautiously to be used in the South Pole area.
Figure 5-32: Crater Size-Frequency Distribution
More generally, it has been found ([RD20]) that in heavily cratered surfaces, in some lunar highlands and for all craters on “steady state” surfaces, the number N of craters of a diameter D is given by the following empiric law: N = 0.1 x D-2 , with D in meters.
NEXT - Lunar Environment Specifications NEXT-LL-LES-ESA(HME)-0001
Issue 1 revision 0 page 41 of 52
s
5.5 Lunar Soil Characteristics
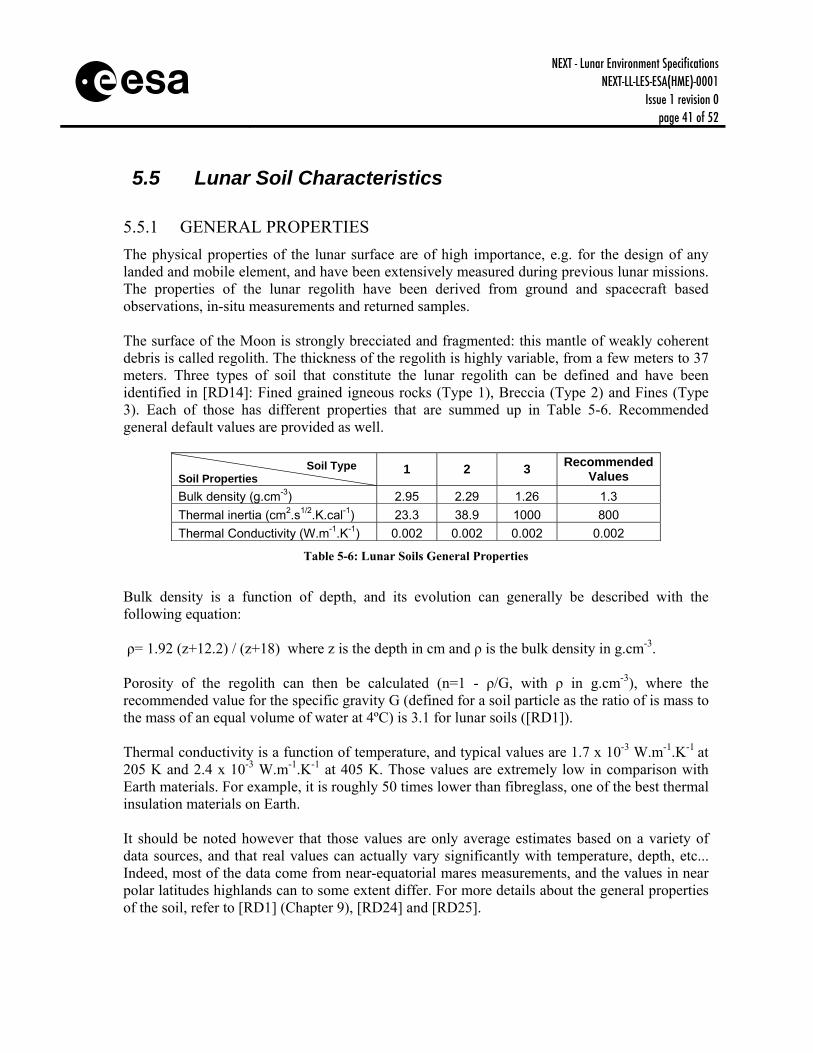
5.5.1 GENERAL PROPERTIES The physical properties of the lunar surface are of high importance, e.g. for the design of any landed and mobile element, and have been extensively measured during previous lunar missions. The properties of the lunar regolith have been derived from ground and spacecraft based observations, in-situ measurements and returned samples. The surface of the Moon is strongly brecciated and fragmented: this mantle of weakly coherent debris is called regolith. The thickness of the regolith is highly variable, from a few meters to 37 meters. Three types of soil that constitute the lunar regolith can be defined and have been identified in [RD14]: Fined grained igneous rocks (Type 1), Breccia (Type 2) and Fines (Type 3). Each of those has different properties that are summed up in Table 5-6. Recommended general default values are provided as well.
Soil Type Soil Properties
1 2 3 Recommended Values
Bulk density (g.cm-3) 2.95 2.29 1.26 1.3 Thermal inertia (cm2.s1/2.K.cal-1) 23.3 38.9 1000 800 Thermal Conductivity (W.m-1.K-1) 0.002 0.002 0.002 0.002
Table 5-6: Lunar Soils General Properties
Bulk density is a function of depth, and its evolution can generally be described with the following equation: ρ= 1.92 (z+12.2) / (z+18) where z is the depth in cm and ρ is the bulk density in g.cm-3. Porosity of the regolith can then be calculated (n=1 - ρ/G, with ρ in g.cm-3), where the recommended value for the specific gravity G (defined for a soil particle as the ratio of is mass to the mass of an equal volume of water at 4ºC) is 3.1 for lunar soils ([RD1]). Thermal conductivity is a function of temperature, and typical values are 1.7 x 10⁻³ W.m-1.K-1 at 205 K and 2.4 x 10⁻³ W.m-1.K-1 at 405 K. Those values are extremely low in comparison with Earth materials. For example, it is roughly 50 times lower than fibreglass, one of the best thermal insulation materials on Earth. It should be noted however that those values are only average estimates based on a variety of data sources, and that real values can actually vary significantly with temperature, depth, etc... Indeed, most of the data come from near-equatorial mares measurements, and the values in near polar latitudes highlands can to some extent differ. For more details about the general properties of the soil, refer to [RD1] (Chapter 9), [RD24] and [RD25].
NEXT - Lunar Environment Specifications NEXT-LL-LES-ESA(HME)-0001
Issue 1 revision 0 page 42 of 52
s The in-situ relative density of lunar soil has been found to be about 65% (medium to dense) in the top 15 cm, increasing to more than 90% (very dense) below a depth of 30 cm. These lunar soil values are even more remarkable when it is considered that a relative density of 65—75% is the practical limit for field compaction of terrestrial soils, even using heavy construction equipment. Obviously, the lunar soil has not been gently shifted into place, but rather has been extensively shaken, probably by the shock waves generated by meteoroid impacts. The in-situ relative density of lunar soil has been estimated by analyses based on astronaut footprints, vehicle tracks, boulder tracks, and penetration resistance.
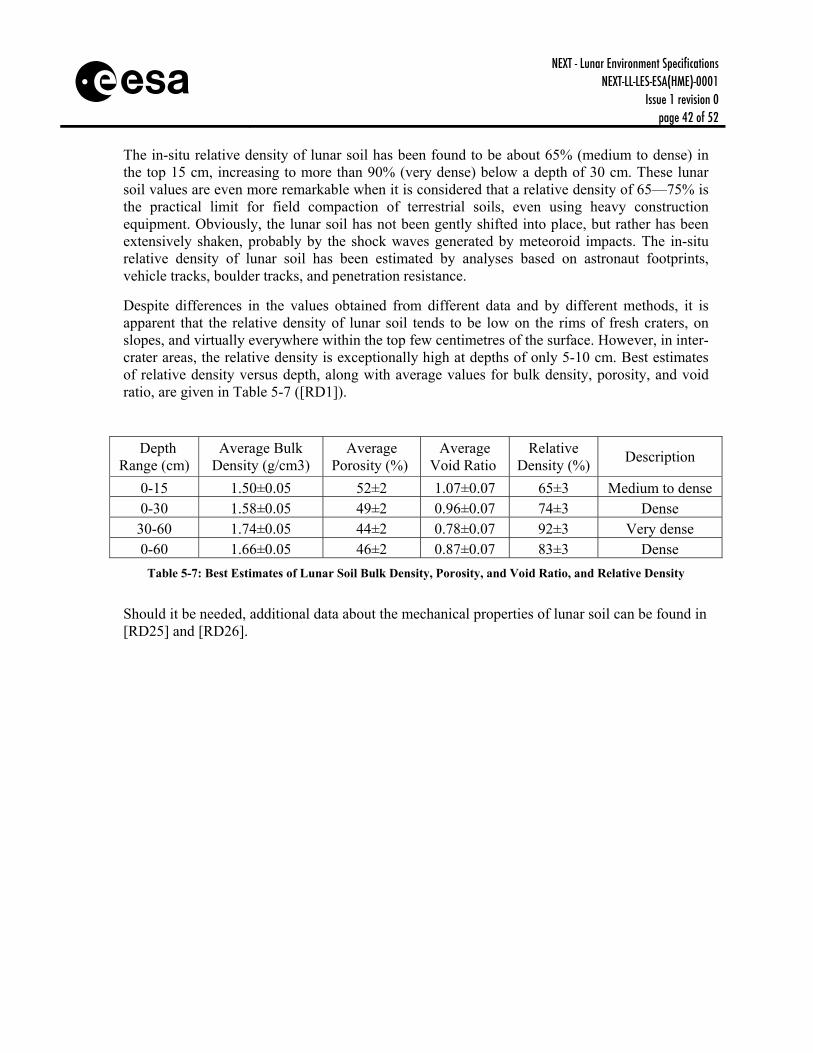
Despite differences in the values obtained from different data and by different methods, it is apparent that the relative density of lunar soil tends to be low on the rims of fresh craters, on slopes, and virtually everywhere within the top few centimetres of the surface. However, in inter-crater areas, the relative density is exceptionally high at depths of only 5-10 cm. Best estimates of relative density versus depth, along with average values for bulk density, porosity, and void ratio, are given in Table 5-7 ([RD1]).
Depth Range (cm)
Average Bulk Density (g/cm3)
Average Porosity (%)
Average Void Ratio
Relative Density (%) Description
0-15 1.50±0.05 52±2 1.07±0.07 65±3 Medium to dense 0-30 1.58±0.05 49±2 0.96±0.07 74±3 Dense 30-60 1.74±0.05 44±2 0.78±0.07 92±3 Very dense 0-60 1.66±0.05 46±2 0.87±0.07 83±3 Dense
Table 5-7: Best Estimates of Lunar Soil Bulk Density, Porosity, and Void Ratio, and Relative Density
Should it be needed, additional data about the mechanical properties of lunar soil can be found in [RD25] and [RD26].
NEXT - Lunar Environment Specifications NEXT-LL-LES-ESA(HME)-0001
Issue 1 revision 0 page 43 of 52
s
5.5.2 BEARING CAPACITY
The bearing capacity describes the ability of a soil to support an applied load, such as a structure, a vehicle, or an astronaut. The ultimate bearing capacity defines the maximum possible load that can be applied without causing gross failure, such as the overturning of a structure. The allowable bearing capacity defines a lesser load that can be applied without exceeding a given depth settlement limit. Any bearing capacity described in this document shall be understood as “static” bearing capacity.
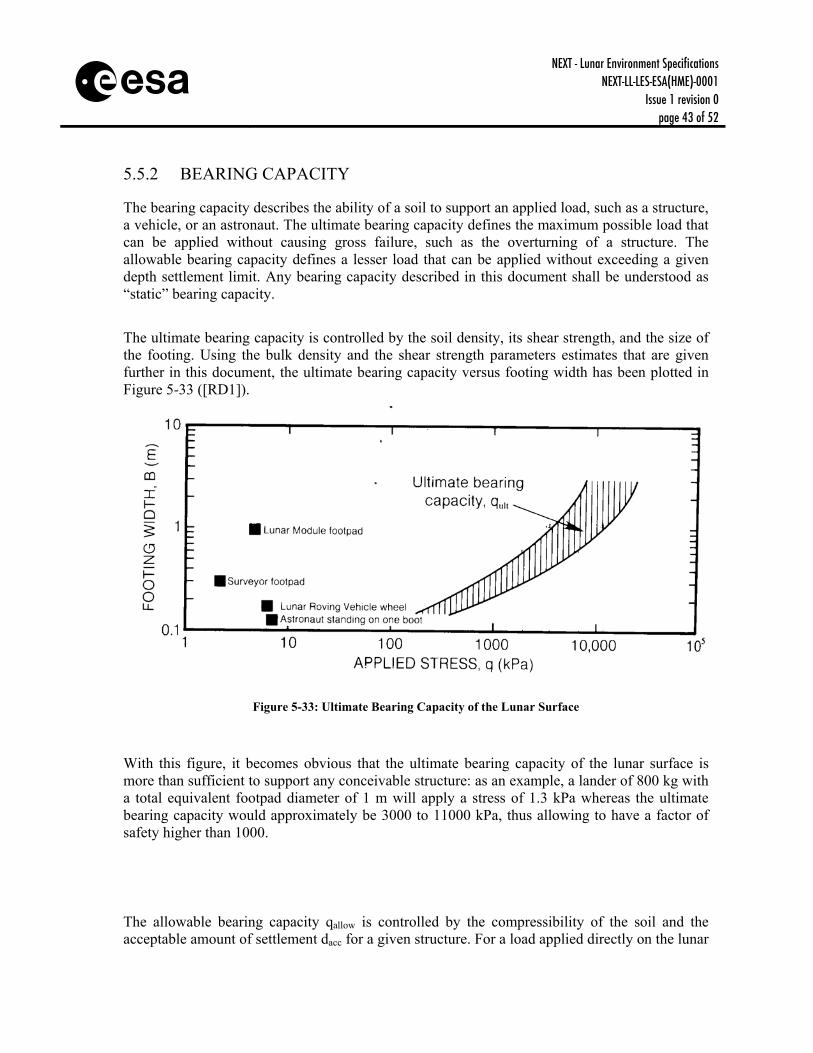
The ultimate bearing capacity is controlled by the soil density, its shear strength, and the size of the footing. Using the bulk density and the shear strength parameters estimates that are given further in this document, the ultimate bearing capacity versus footing width has been plotted in Figure 5-33 ([RD1]).
Figure 5-33: Ultimate Bearing Capacity of the Lunar Surface
With this figure, it becomes obvious that the ultimate bearing capacity of the lunar surface is more than sufficient to support any conceivable structure: as an example, a lander of 800 kg with a total equivalent footpad diameter of 1 m will apply a stress of 1.3 kPa whereas the ultimate bearing capacity would approximately be 3000 to 11000 kPa, thus allowing to have a factor of safety higher than 1000.
The allowable bearing capacity qallow is controlled by the compressibility of the soil and the acceptable amount of settlement dacc for a given structure. For a load applied directly on the lunar
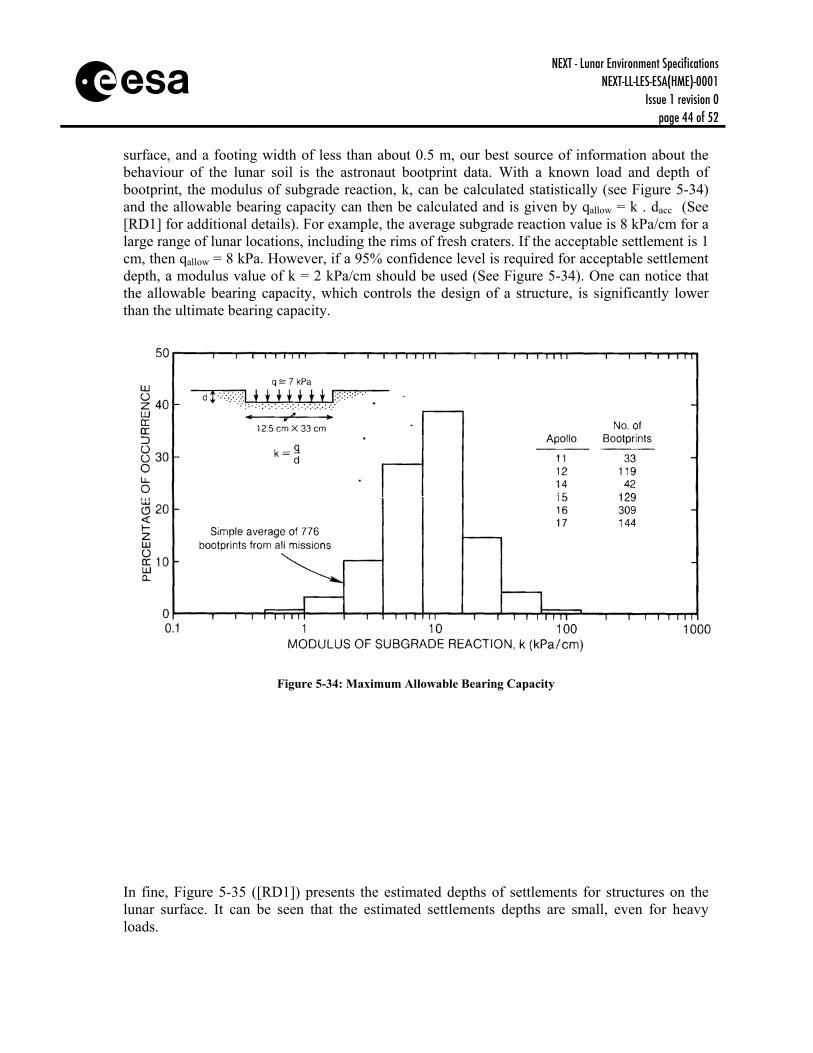
NEXT - Lunar Environment Specifications NEXT-LL-LES-ESA(HME)-0001
Issue 1 revision 0 page 44 of 52
s surface, and a footing width of less than about 0.5 m, our best source of information about the behaviour of the lunar soil is the astronaut bootprint data. With a known load and depth of bootprint, the modulus of subgrade reaction, k, can be calculated statistically (see Figure 5-34) and the allowable bearing capacity can then be calculated and is given by qallow = k . dacc (See [RD1] for additional details). For example, the average subgrade reaction value is 8 kPa/cm for a large range of lunar locations, including the rims of fresh craters. If the acceptable settlement is 1 cm, then qallow = 8 kPa. However, if a 95% confidence level is required for acceptable settlement depth, a modulus value of k = 2 kPa/cm should be used (See Figure 5-34). One can notice that the allowable bearing capacity, which controls the design of a structure, is significantly lower than the ultimate bearing capacity.
Figure 5-34: Maximum Allowable Bearing Capacity
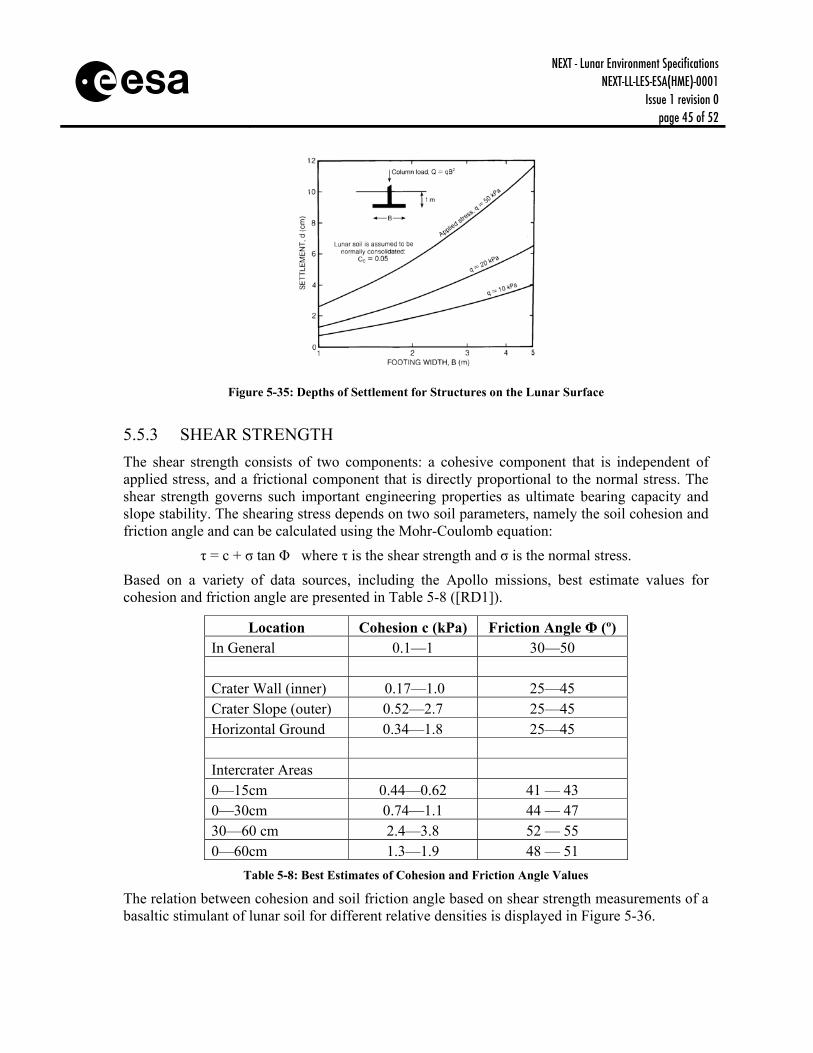
In fine, Figure 5-35 ([RD1]) presents the estimated depths of settlements for structures on the lunar surface. It can be seen that the estimated settlements depths are small, even for heavy loads.
NEXT - Lunar Environment Specifications NEXT-LL-LES-ESA(HME)-0001
Issue 1 revision 0 page 45 of 52
s
Figure 5-35: Depths of Settlement for Structures on the Lunar Surface
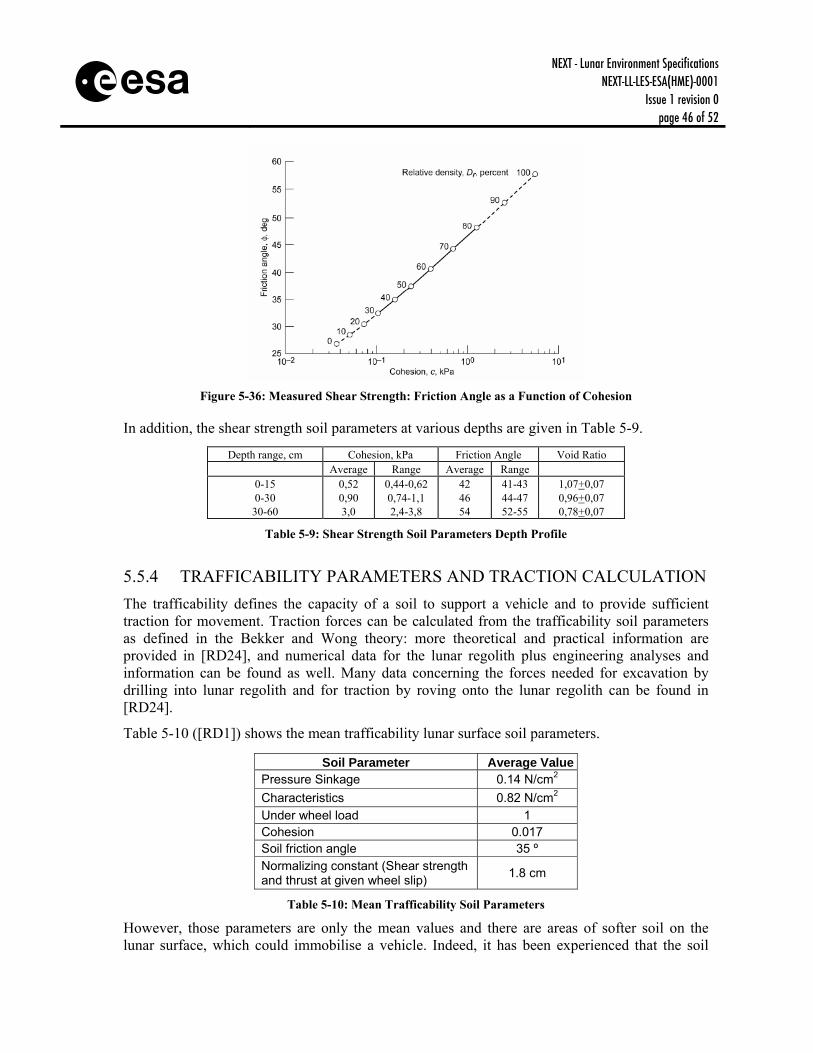
5.5.3 SHEAR STRENGTH The shear strength consists of two components: a cohesive component that is independent of applied stress, and a frictional component that is directly proportional to the normal stress. The shear strength governs such important engineering properties as ultimate bearing capacity and slope stability. The shearing stress depends on two soil parameters, namely the soil cohesion and friction angle and can be calculated using the Mohr-Coulomb equation:
τ = c + σ tan Φ where τ is the shear strength and σ is the normal stress.
Based on a variety of data sources, including the Apollo missions, best estimate values for cohesion and friction angle are presented in Table 5-8 ([RD1]).
Location Cohesion c (kPa) Friction Angle Φ (º) In General 0.1—1 30—50 Crater Wall (inner) 0.17—1.0 25—45 Crater Slope (outer) 0.52—2.7 25—45 Horizontal Ground 0.34—1.8 25—45 Intercrater Areas 0—15cm 0.44—0.62 41 — 43 0—30cm 0.74—1.1 44 — 47 30—60 cm 2.4—3.8 52 — 55 0—60cm 1.3—1.9 48 — 51
Table 5-8: Best Estimates of Cohesion and Friction Angle Values
The relation between cohesion and soil friction angle based on shear strength measurements of a basaltic stimulant of lunar soil for different relative densities is displayed in Figure 5-36.
NEXT - Lunar Environment Specifications NEXT-LL-LES-ESA(HME)-0001
Issue 1 revision 0 page 46 of 52
s
Figure 5-36: Measured Shear Strength: Friction Angle as a Function of Cohesion
In addition, the shear strength soil parameters at various depths are given in Table 5-9.
Depth range, cm Cohesion, kPa Friction Angle Void Ratio Average Range Average Range
0-15 0-30 30-60
0,52 0,90 3,0
0,44-0,62 0,74-1,1 2,4-3,8
42 46 54
41-43 44-47 52-55
1,07+0,07 0,96+0,07 0,78+0,07
Table 5-9: Shear Strength Soil Parameters Depth Profile
5.5.4 TRAFFICABILITY PARAMETERS AND TRACTION CALCULATION The trafficability defines the capacity of a soil to support a vehicle and to provide sufficient traction for movement. Traction forces can be calculated from the trafficability soil parameters as defined in the Bekker and Wong theory: more theoretical and practical information are provided in [RD24], and numerical data for the lunar regolith plus engineering analyses and information can be found as well. Many data concerning the forces needed for excavation by drilling into lunar regolith and for traction by roving onto the lunar regolith can be found in [RD24].
Table 5-10 ([RD1]) shows the mean trafficability lunar surface soil parameters.
Soil Parameter Average Value Pressure Sinkage 0.14 N/cm2 Characteristics 0.82 N/cm2 Under wheel load 1 Cohesion 0.017 Soil friction angle 35 º Normalizing constant (Shear strength and thrust at given wheel slip) 1.8 cm
Table 5-10: Mean Trafficability Soil Parameters
However, those parameters are only the mean values and there are areas of softer soil on the lunar surface, which could immobilise a vehicle. Indeed, it has been experienced that the soil
NEXT - Lunar Environment Specifications NEXT-LL-LES-ESA(HME)-0001
Issue 1 revision 0 page 47 of 52
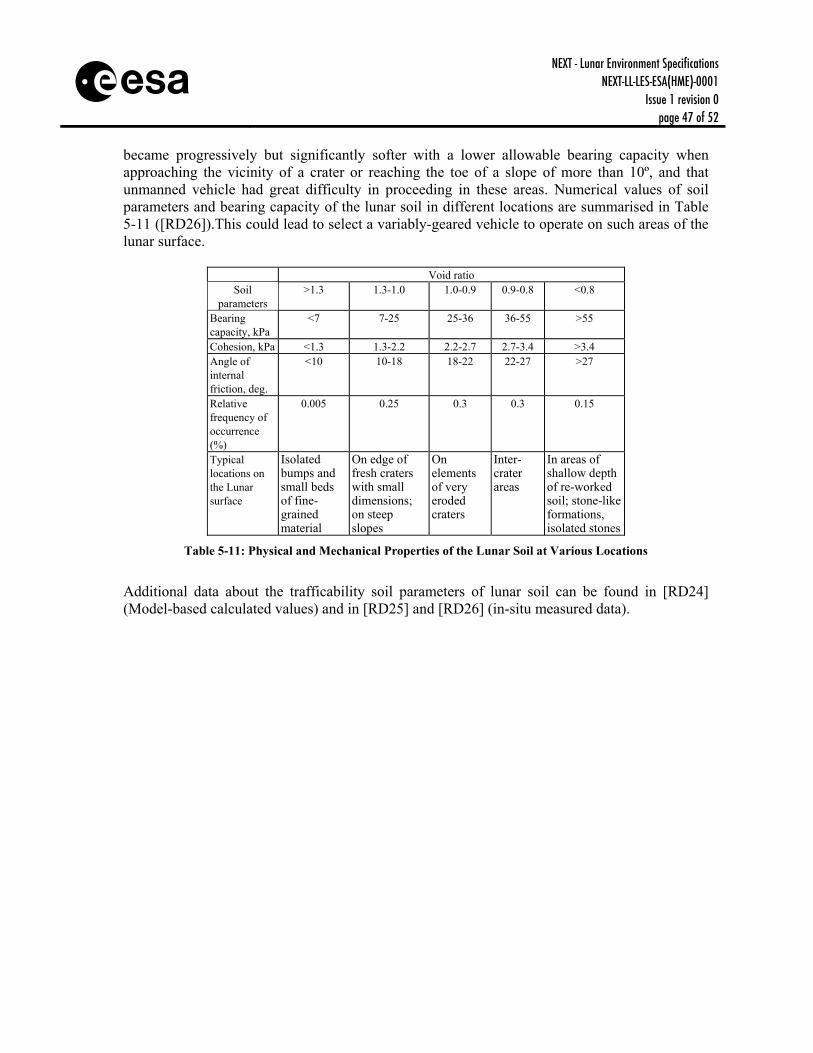
s became progressively but significantly softer with a lower allowable bearing capacity when approaching the vicinity of a crater or reaching the toe of a slope of more than 10º, and that unmanned vehicle had great difficulty in proceeding in these areas. Numerical values of soil parameters and bearing capacity of the lunar soil in different locations are summarised in Table 5-11 ([RD26]).This could lead to select a variably-geared vehicle to operate on such areas of the lunar surface.
Void ratio Soil
parameters >1.3 1.3-1.0 1.0-0.9 0.9-0.8 <0.8
Bearing capacity, kPa
<7
7-25
25-36
36-55
>55
Cohesion, kPa <1.3 1.3-2.2 2.2-2.7 2.7-3.4 >3.4 Angle of internal friction, deg.
<10 10-18 18-22 22-27 >27
Relative frequency of occurrence (%)
0.005 0.25 0.3 0.3 0.15
Typical locations on the Lunar surface
Isolated bumps and small beds of fine-grained material
On edge of fresh craters with small dimensions; on steep slopes
On elements of very eroded craters
Inter- crater areas
In areas of shallow depth of re-worked soil; stone-like formations, isolated stones
Table 5-11: Physical and Mechanical Properties of the Lunar Soil at Various Locations
Additional data about the trafficability soil parameters of lunar soil can be found in [RD24] (Model-based calculated values) and in [RD25] and [RD26] (in-situ measured data).
NEXT - Lunar Environment Specifications NEXT-LL-LES-ESA(HME)-0001
Issue 1 revision 0 page 48 of 52
s
5.6 Lunar Dust The lunar surface is covered by a thick blanket of fine dust. Lunar dust is a potential problem for any lunar landing mission and its surface operations, and has been extensively observed during former lunar missions. It is constituted of the roughly 10% to 20% of the soil that is finer than 20 micrometers. Its main physical properties, explained in [RD1], are summarised in this section. The relative dielectric permittivity for lunar materials depends mainly of the soil bulk density and has been found, from sample measurements, to approximately follow the following empiric law: k=1.9ρ, where ρ is the bulk density in g/cm3. The electrical conductivity of the lunar surface elements (both soils and rocks) depends in a very large extent on temperature, and increases with increasing temperature. It ranges roughly between 10-6 Ω.m-1(maximum at 295 K) and 10-13 Ω.m-1 (minimum at 100K). Consequently, during local sunset and sunrise, close areas have very different electrical conductivity. According to [RD1], this large electrical conductivity change combined with the very low electrical conductivity and electrical losses of lunar material can produce an extremely efficient electrostatic charging mechanism between opposite sides of the lunar terminator. Charging of lunar soil particles could be sufficient to levitate them well above the surface, up to 10 meters. Such charged, levitating soil particles moving across the lunar surface, could create visibility problems during passages through the terminator (i.e. sunset or sunrise), and the particles would also readily adhere to surfaces, creating coating. Night-time surface activities that disturb the lunar soil could generate dust that would thickly and abrasively coat exposed surfaces. Upon lunar sunrise, the resulting photo-induced increase in electrical conductivity would cause most of the coatings to slough off, leaving only a thin residual coating behind. Furthermore, plume effects from the lunar lander engines can significantly make it worse, since once it has been stirred, the lunar dust will take a long period to settle down. Indeed, there are evidences that accumulation of lunar dust can be substantial even as far as 2 km from the landing site. In addition, the roving vehicle will also stir lunar dust and cause additional dust accumulation. Therefore, because of the lunar dust adhesive and cohesive properties, dust represents an eventual threat to any functional surface, and could affect properties and reduce the performances of the exposed active surfaces, such as sensors, solar panels, radiators surfaces, ... Quantitative effects on the performance of power generation and thermal control components are extensively described in [RD29], and one should refer to it for engineering purpose. As an
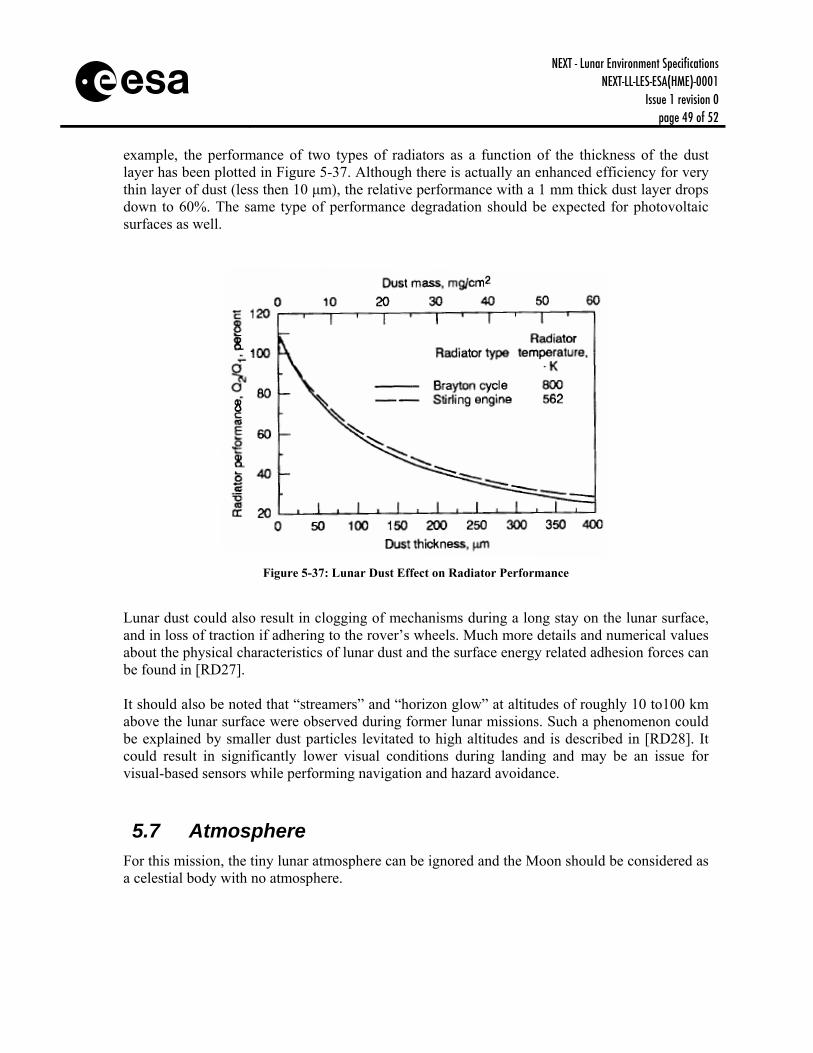
NEXT - Lunar Environment Specifications NEXT-LL-LES-ESA(HME)-0001
Issue 1 revision 0 page 49 of 52
s example, the performance of two types of radiators as a function of the thickness of the dust layer has been plotted in Figure 5-37. Although there is actually an enhanced efficiency for very thin layer of dust (less then 10 µm), the relative performance with a 1 mm thick dust layer drops down to 60%. The same type of performance degradation should be expected for photovoltaic surfaces as well.
Figure 5-37: Lunar Dust Effect on Radiator Performance
Lunar dust could also result in clogging of mechanisms during a long stay on the lunar surface, and in loss of traction if adhering to the rover’s wheels. Much more details and numerical values about the physical characteristics of lunar dust and the surface energy related adhesion forces can be found in [RD27]. It should also be noted that “streamers” and “horizon glow” at altitudes of roughly 10 to100 km above the lunar surface were observed during former lunar missions. Such a phenomenon could be explained by smaller dust particles levitated to high altitudes and is described in [RD28]. It could result in significantly lower visual conditions during landing and may be an issue for visual-based sensors while performing navigation and hazard avoidance.
5.7 Atmosphere For this mission, the tiny lunar atmosphere can be ignored and the Moon should be considered as a celestial body with no atmosphere.
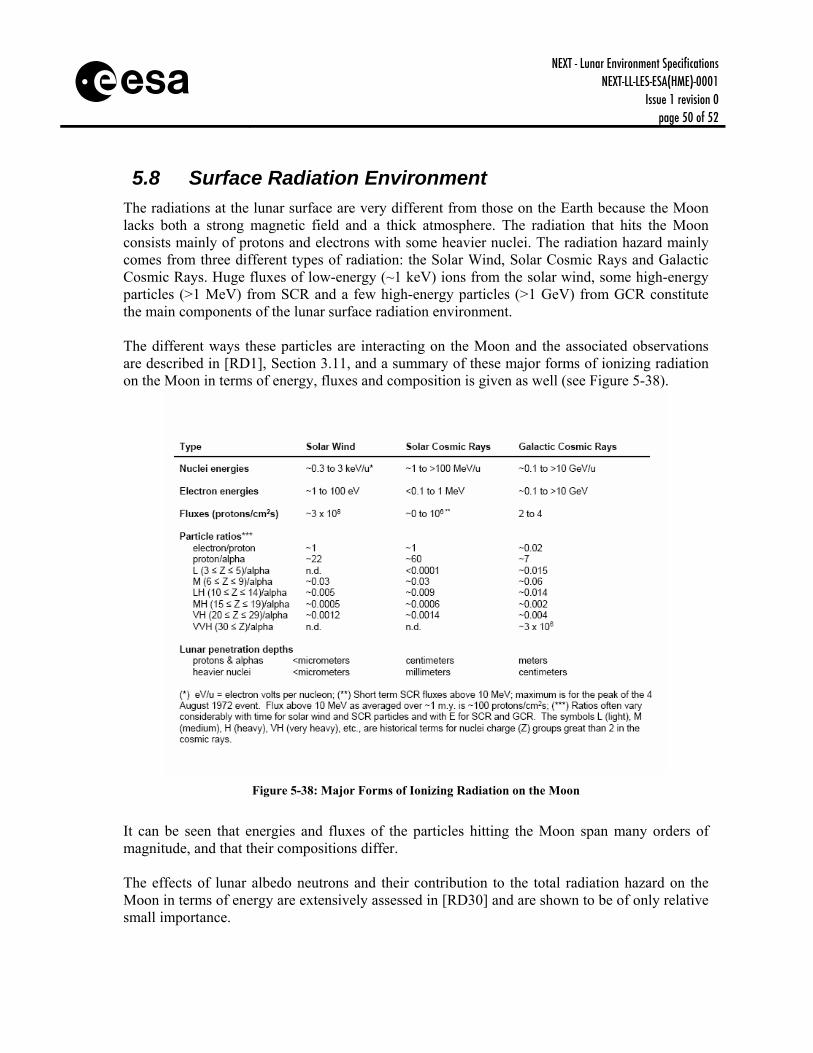
NEXT - Lunar Environment Specifications NEXT-LL-LES-ESA(HME)-0001
Issue 1 revision 0 page 50 of 52
s
5.8 Surface Radiation Environment The radiations at the lunar surface are very different from those on the Earth because the Moon lacks both a strong magnetic field and a thick atmosphere. The radiation that hits the Moon consists mainly of protons and electrons with some heavier nuclei. The radiation hazard mainly comes from three different types of radiation: the Solar Wind, Solar Cosmic Rays and Galactic Cosmic Rays. Huge fluxes of low-energy (~1 keV) ions from the solar wind, some high-energy particles (>1 MeV) from SCR and a few high-energy particles (>1 GeV) from GCR constitute the main components of the lunar surface radiation environment. The different ways these particles are interacting on the Moon and the associated observations are described in [RD1], Section 3.11, and a summary of these major forms of ionizing radiation on the Moon in terms of energy, fluxes and composition is given as well (see Figure 5-38).
Figure 5-38: Major Forms of Ionizing Radiation on the Moon
It can be seen that energies and fluxes of the particles hitting the Moon span many orders of magnitude, and that their compositions differ. The effects of lunar albedo neutrons and their contribution to the total radiation hazard on the Moon in terms of energy are extensively assessed in [RD30] and are shown to be of only relative small importance.
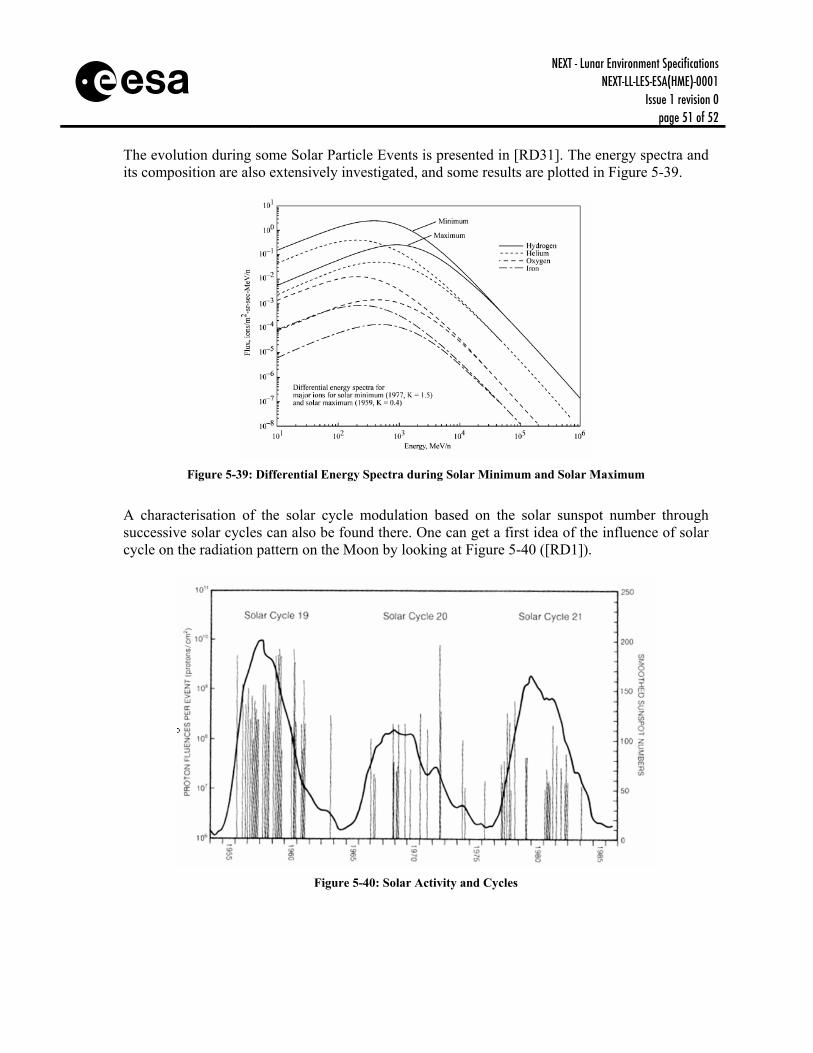
NEXT - Lunar Environment Specifications NEXT-LL-LES-ESA(HME)-0001
Issue 1 revision 0 page 51 of 52
s The evolution during some Solar Particle Events is presented in [RD31]. The energy spectra and its composition are also extensively investigated, and some results are plotted in Figure 5-39.
Figure 5-39: Differential Energy Spectra during Solar Minimum and Solar Maximum
A characterisation of the solar cycle modulation based on the solar sunspot number through successive solar cycles can also be found there. One can get a first idea of the influence of solar cycle on the radiation pattern on the Moon by looking at Figure 5-40 ([RD1]).
Figure 5-40: Solar Activity and Cycles
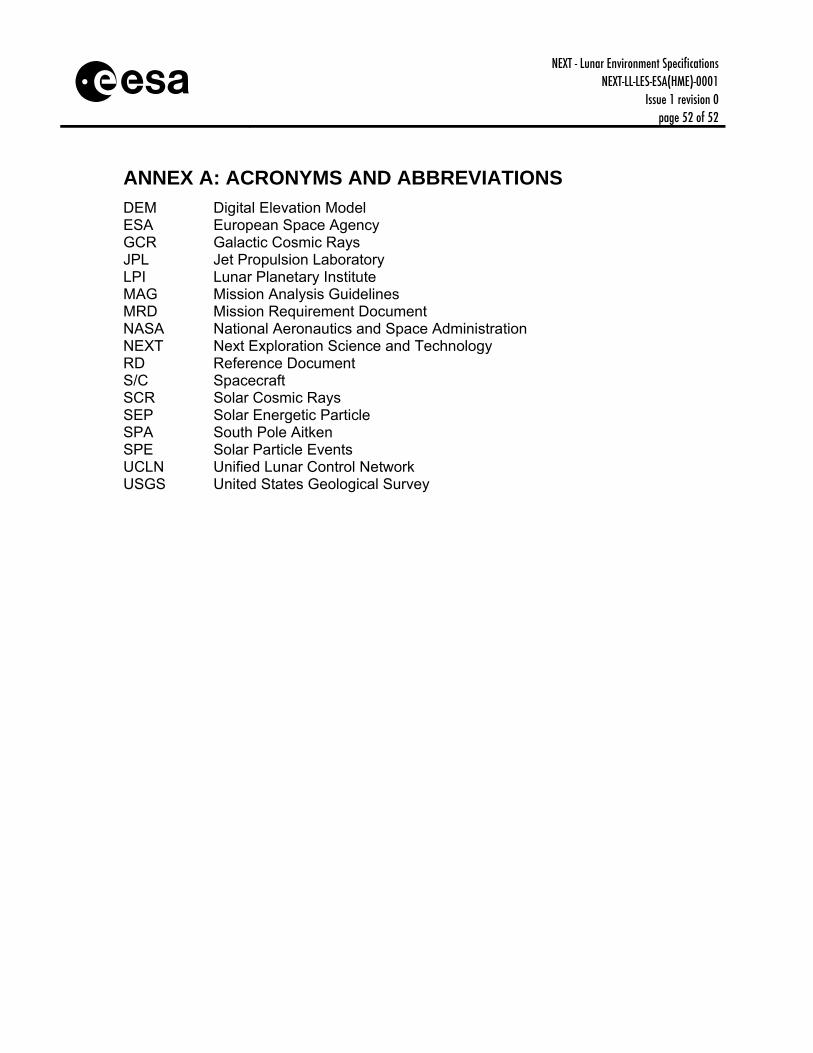
NEXT - Lunar Environment Specifications NEXT-LL-LES-ESA(HME)-0001
Issue 1 revision 0 page 52 of 52
s
ANNEX A: ACRONYMS AND ABBREVIATIONS DEM Digital Elevation Model ESA European Space Agency GCR Galactic Cosmic Rays JPL Jet Propulsion Laboratory LPI Lunar Planetary Institute MAG Mission Analysis Guidelines MRD Mission Requirement Document NASA National Aeronautics and Space Administration NEXT Next Exploration Science and Technology RD Reference Document S/C Spacecraft SCR Solar Cosmic Rays SEP Solar Energetic Particle SPA South Pole Aitken SPE Solar Particle Events UCLN Unified Lunar Control Network USGS United States Geological Survey


![Mind map : learning made simple · 2 sl ll r le lkekftd foKku] d X Mind map : learning made simple baMks&pkbuk esa jk"Vªoknh vkanksyu 1974 esa isfjl esa,d'kkafr le>kSrs ij gLrk{kj](https://img.pdfslide.net/doc/110x75/5fe36e52b14ace304e6b8249/mind-map-learning-made-simple-2-sl-ll-r-le-lkekftd-fokku-d-x-mind-map-learning.jpg)


![cQl@ll 1IITn]@ll - CGIAR](https://img.pdfslide.net/doc/110x75/6198a916b87c36391649b004/cqlll-1iitnll-cgiar.jpg)