Embed Size (px)
Citation preview

ESCAP/UNCTAD/WTO/ARTNeT Research Workshop (Vientiane, October 2010)
Summary Note on Dynamic Exports and New Exports of Asian LDCs UNCTAD
Trade Analysis Branch, Division on International Trade October 2010
1. Definition
2. Focus
3. Dynamic Exports and New Exports: Main Findings
Appendix 1 - Export Structure
Appendix 2 - Tables & Figures
1. Definition • Dynamic exports are those whose export values grew dynamically without a break during the
studied period (1993-2007). They represent a country’s export growth at the intensive margin.
• New exports are those whose export started only after 1998 and grew rapidly afterwards. They represent a country’s export growth at the extensive margin.
“Methodology” for identifying “dynamic” exports and “new” exports
(i) The export products in the highest 10% of growth rate (in export values) during the period 1993-2007 were selected. The growth rates were calculated by comparing the arithmetic averages of the first five years (1993-1997) and the last five years (2003-2007) in order to correct for missing values and inconsistency in the data. For the “new” exports, the growth was calculated by comparing the arithmetic averages of the five years from 1998 to 2002 and the last five years (2003-2007).
(ii) Only those export products that were consistently exported, i.e. those that were exported at least eight years of these 15 years were kept. Exports whose values of the last five-year average were less than US$ 30,000 were excluded.
2. Focus • The composition and sectoral distribution of “dynamic” exports and “new” exports of each
country, and the destinations of these exports.
• Changes in the degree of product sophistication, measured by the Revealed Factor Intensity (RFI)1 of “dynamic” and “new” exports.
1 Using the UNCTAD Revealed Factor Intensity Indices' (RFII), we examine the degree of “sophistication” of exports in terms of revealed capital intensity (RCI), revealed human capital intensity, and revealed natural resource (land) intensity. For the purpose of comparing the RFII between the years, we have used the balanced version of the database that was constructed by using endowments data of a set of same countries (92 countries). For detail on the methodology and the RFII data, see http://r0.unctad.org/ditc/tab/research.shtm.

(UNCTAD/DITC/TAB October 2010)
3. Dynamic Exports and New Exports – Summary Findings
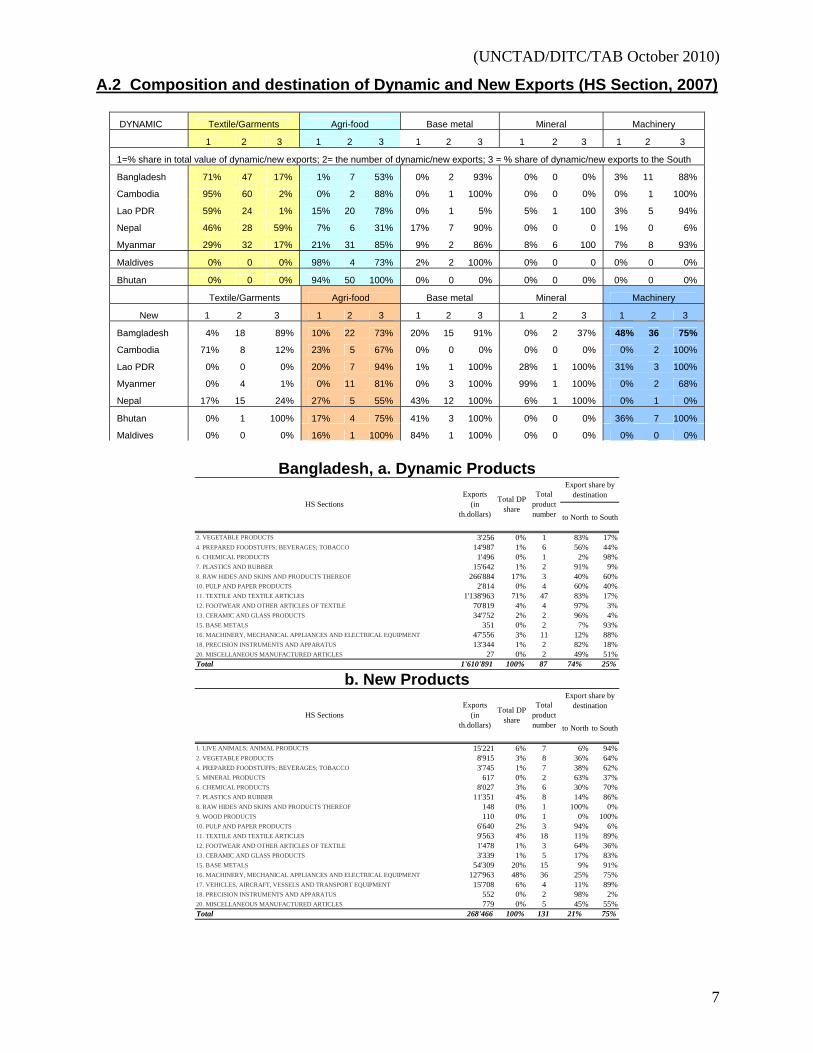
(a) Dynamic exports of Asian LDCs are generally of low factor-intensity (e.g. garments) and exported to the North (developed-country markets, especially the EU and the US).
• The textile/garments sector represents the largest share in terms of export value and the number of “dynamic” exports (except Bhutan and Maldives). Garments are main exports to the Northern markets, while cotton yarns and textiles are those to the South (developing countries, especially those in the region (See Tables A.2).
• Other high-value dynamic products are (i) base metal or metal products, or Minerals – all with low factor-intensity.
(b) New exports generally have higher factor intensity than dynamic exports, and are largely exported to the South (developing-country markets, especially neighboring economic power + China).
• On average, “new” exports have higher factor-intensity than dynamic exports, and this applies to all countries. In Figure A.4 (which maps dynamic/new exports on the RHCI/RCI plane), we see “new” exports are spread more on the upper right-hand-side of the plane than “dynamic” exports, which is most evident in the cases of Bangladesh, Bhutan, Cambodia, and Nepal. (RHCI = revealed human capital intensity, RCI = revealed capital intensity)
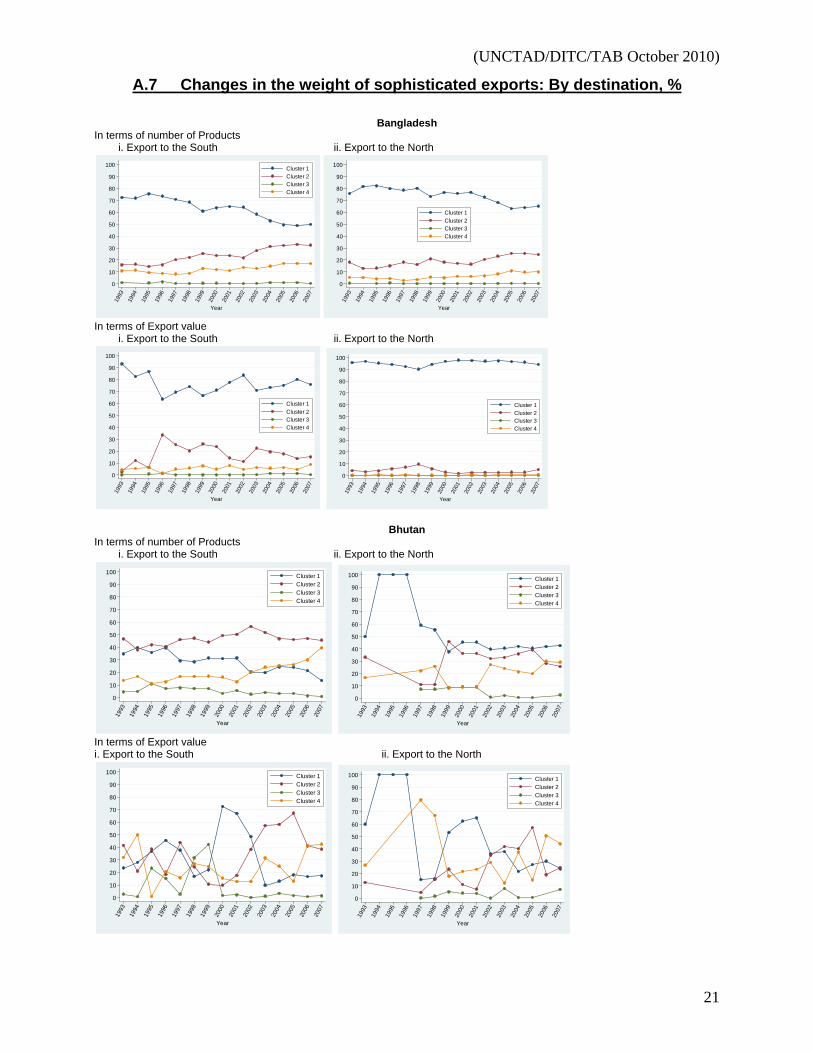
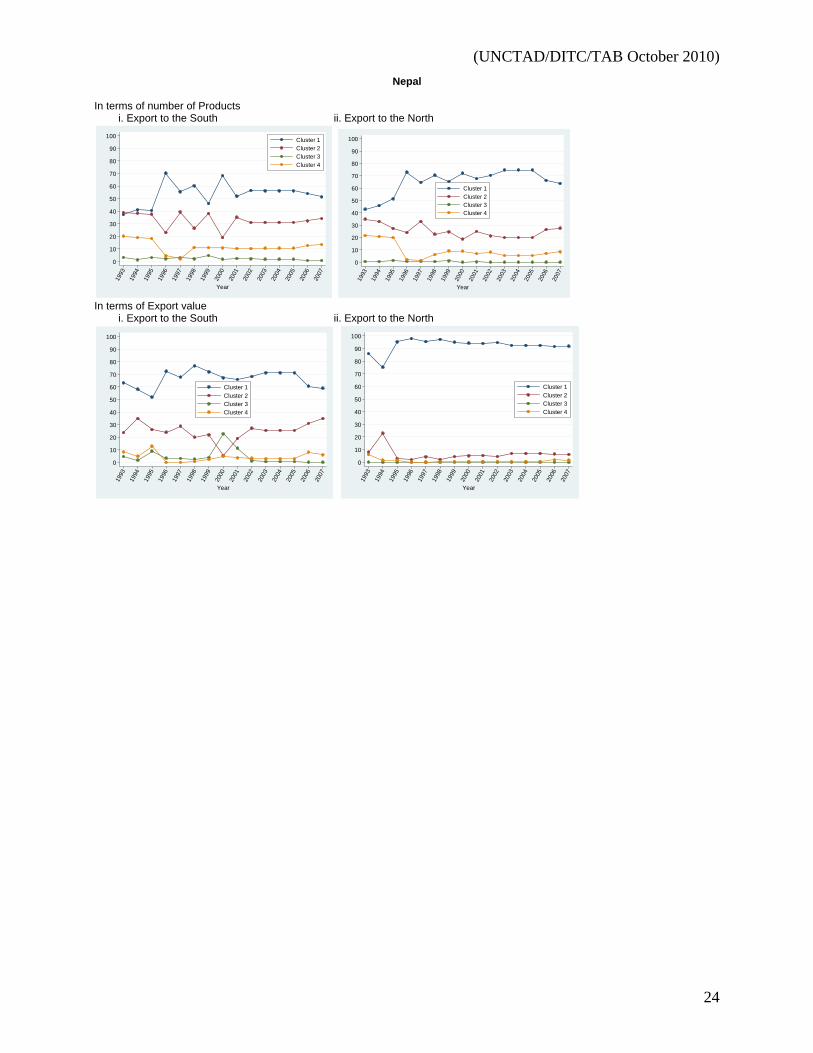
• When dynamic/new exports are grouped into clusters (Cluster 1 being the lowest in RFI and Cluster 4 being the highest): “dynamic” exports are high in Cluster 1 and low in Cluster 4, while “new” exports are high in Cluster 2 and Cluster 4, except Nepal (see Figure A.5).
• Exports in Cluster 4 show the highest factor-intensity among the country’s exports. But they are not necessarily “sophisticated” products in the global market.
• New exports of Asian LDCs include various agri-food products and natural resource-based products, which may a direct result of the recent rise in the demand for these goods. All Asian LDCs have agri-food exports as “new” exports largely to the South, though they are not significant value-wise. Metal-based products and mineral-based products (copper for Laos to China, and natural gas for Myanmar to Thailand) grabbed a high share in their total exports in recent years. A discovery of exportable resources leads to a greater export concentration for these countries.
• Machinery (incl. parts and components) and electric/electronic goods (incl. parts and components) are included as “new” exports (e.g. television receivers and drilling machines for Bangladesh, Ignition wiring sets for Laos), though their export values are not significant. Some exports in this category may be re-exports or sale of used products (e.g. mobile phones). This study cannot evaluate if there is any sign of increasing supply capacity in this sector.
• Many “new” exports are destination specific (i.e. 1 product to 1 market).
• China and regional economic powers (India and Thailand) are the main markets of “new” exports of Asian LDCs (see Table A.3). China stands out as the major destination from Bangladesh, Lao, and Myanmar. India and Thailand are also major markets for “new” exports of Asian LDCs. (They are also important markets for their dynamic (non-garment) exports.
2

(UNCTAD/DITC/TAB October 2010)
(c) Apart from dynamic/new exports, exports to the South (i.e. regional trading partners) generally reveal higher factor-intensity than exports to the North (namely the EU, US and Japan).
• We looked at the changes in the revealed capital intensity (measured by the average RCI) of the export baskets of each Asian LDC (Figure A.6).
• Through the studied period, the simple average RCI of all Asian LDCs were going up, confirming that they increased exports of more capital-intensive goods. But the pattern of small countries (Madlives and Nepal) is not that clear. Also, the pattern of the trade-weighted average RCI is mixed.
• The simple average RCI of exports to the North and that to the South are significantly different. Exports to the South are unambiguously more capital intensive than that of exports to the North (except in the cases of Bhutan and Maldives).
• This pattern is also commonly observed among African LDCs.
(d) Being dynamic or new exports does not suggest the country established supply capacity.
• There are two types of dynamic/new exports: (i) those that are exported to a (large) number of markets; and (ii) those exported to a specific market. The latter (market-specific dynamic/new exports) is frequently observed in our examination.
• Only few of “dynamic” exports are exported to plural markets, e.g. garments, wood products and certain handcraft goods. New exports to plural markets include garments, hides/skin/leather products, and agri-food products. Naturally, they are all traditional exports of these Asian LDCs.
• Large number of dynamic and/new exports are exported only to one or two countries. The majority of single-destination exports are to neighboring economic power, e.g. those of Nepal to India, and those of Laos to Thailand (which could be due to the transit needs). We however find a number of single-importers outside the region, in cases of natural resource-based exports.
4. Research interest • To what extent does the proximity in trade relationship (including geographical) influence the
likelihood of export diversification by Asian LDCs, particularly into more sophisticated goods? What explains the pattern of “new” and higher factor-intensity exports of Asian LDCs going more to the South than to the North: comparative advantage, Linder Hypothesis, RTAs, logistical factors (e.g. geographical proximity favors trade in higher factor-intensity products), or others?
o Do South-South exports enhance structural transformation in exports of Asian LDCs? A recent UNCTAD study2 (Klinger) negates this hypothesis, suggesting that their southbound exports are more sophisticated only relatively to their northbound exports which are concentrated in extremely low factor-intensity products. Their southbound exports remain not well-connected to high-growth products in the “product space”. But, as the statistics confirm, regional markets in the South provides a better export opportunity to more factor-intensive exports of LDCs.
• Which “new” exports survive to become “dynamic” exports of LDCs, and what are the factors that influence the survival rate? What are national/regional/international policy measures which support such survival?
2 Klinger, Bailey “Is South-South trade a testing ground for structural transformation?”, UNCTAD Policy Issues in International Trade and Commodities Study Series No. 40, 2009), http://www.unctad.org/en/docs/itcdtab43_en.pdf
3

(UNCTAD/DITC/TAB October 2010)
Appendix 1 Export Concentration in Asian LDCs
Export growth at the extensive margin • Export baskets have been expanding, in terms of the number of exported products. The
number of exports (HS 6-digit, 2007) of Asian LDCs (Bhutan and Maldives) is above the LDC average, or the DC average in the case of Bangladesh.
Concentration in export products - Harfindhal Index • Export concentration has been increasingly for Bhutan, Lao, Myanmar and Maldives since
2001/2002. The reason was natural resource export in recent years (copper for Lao and natural gas for Myanmar, wire of refined copper, ferro-silicon for Myanmar, frozen skipjack for Maldives), reflecting rapidly increased demand for these goods.
• Even for Bangladesh and Cambodia, their exports are concentrated in just one sector, the textile/garment. 81% of Bangladesh’ exports and 87% of Cambodia’s exports in 2007 were in the textile and garment sector. The declining H Index must be due to a large number of HS codes for garments.
• Nepal’s exports are relatively less concentrated, because it lacks a “dominant” export sector.
No. of export products
0
500
1000
1500
2000
1993 1994 1995 1996 1997 1998 1999 2000 2001 2002 2003 2004 2005 2006 2007
Bangladesh Bhutan Cambodia
Lao PDR Maldives Myanmar
Nepal LDCs Developing Countries
Herfindahl Index, by Product
0.00
0.05
0.10
0.15
0.20
0.25
0.30
0.35
1993 1994 1995 1996 1997 1998 1999 2000 2001 2002 2003 2004 2005 2006 2007
Bangladesh Bhutan Cambodia LaoMaldives Myanmar Nepal
Concentration in export destination • Exports of these countries are also concentrated in destination as well. Exports of each
country depend on 1 or 2 dominant importing markets.
• Grouping markets into (i) North (developed countries) and (ii) the South (developing countries):
o High dependency on the North markets in: Bangladesh (83% of its total exports to North, of which 51% to the EU and 26% to the US); Cambodia (91% to North, of which 59% to the US and 24% to the EU).
o High dependency on the South markets: Bhutan (96% to the South, of which 66% to India, 22% to Hong Kong); Lao (73% to South, of which 50% to Thailand); Myanmar (80% to South, of which 48% to Thailand and 17% to India).
o The share of exports to the South for Myanmar and Laos increased in recent years, due to copper (Laos to China) and natural gas (to Thailand). Excluding these, Laos’ exports to South falls to 43% (with Thailand 25%, China 15%), and that of Myanmar to 64% (with India 30%, China 14%)
4

(UNCTAD/DITC/TAB October 2010)
Appendix 2 – Tables & Figures A.1 Weight of Dynamic/New Exports in Total Exports
2007 Bangladesh Cambodia Lao PDR Myanmar Nepal Bhutan Maldives China Thailand
Number of Product, HS 6-digit Dynamic 87 82 66 107 63 6 6 483 301 New 131 17 17 32 52 28 2 3 16 Other 1873 1144 848 1093 1287 271 8 4004 3982 Total 2091 1243 931 1232 1402 305 16 4490 4299 % Share in terms of the number of product Dynamic 4.2% 6.6% 7.1% 8.7% 4.5% 2.0% 37.5% 10.8% 7.0% New 6.3% 1.4% 1.8% 2.6% 3.7% 9.2% 12.5% 0.1% 0.4% Other 89.6% 92.0% 91.1% 88.7% 91.8% 88.9% 50.0% 89.2% 92.6% % Share in total export value Dynamic 12.0% 44.0% 13.0% 9.0% 22.0% 1.0% 56.0% 29.3% 15.9% New 2.0% 0.4% 2.0% 44.0% 13.0% 83.0% 1.0% 0.0% 0.2% Other 86.0% 56.0% 85.0% 47.0% 66.0% 17.0% 43.0% 70.7% 83.9%
Bangladesh
to North to South to North to South Dynamic Products 1,610,891 12% 74% 25% 87 1,578 54% 44%New Products 268,466 2% 21% 75% 131 904 35% 64%Other Products 11,271,533 86% 85% 14% 1,873 11,048 48% 49%
13,150,890 100% 83% 17% 2,091 13,530 48% 50%
Total number of
export lines
Percentage shares by destination
Total number of products
Exports (in th.dollars)
Total export share
Percentage shares by destination
Bhutan
to North to South to North to South Dynamic Products 3,978 1% 0% 100% 6 7 14% 86%New Products 505,977 83% 0% 100% 28 39 41% 59%Other Products 101,672 17% 4% 96% 271 361 28% 71%All 611,627 100% 1% 99% 305 407 29% 70%
Total number of
export lines
Percentage shares by destination
Percentage shares by destination
Total number of products
Total export share
Exports (in th.dollars)
Cambodia
to North to South to North to South Dynamic Products 1,484,095 44% 96% 3% 82 1,368 45% 44%New Products 15,072 0.4% 69% 30% 17 75 43% 52%Other 1,873,948 56% 89% 10% 1,144 5,092 46% 46%All 3,373,115 100% 92% 7% 1,243 6,535 46% 45%
Total number of
export lines
Percentage shares by destination
Total number of products
Exports (in th.dollars)
Total export share
Percentage shares by destination
5

(UNCTAD/DITC/TAB October 2010)
Lao PDR
to North to South to North to South Dynamic Products 100,683 13% 66% 33% 66 414 62% 27%New Products 14,530 2% 6% 94% 17 25 16% 84%Other Products 661,772 85% 21% 79% 848 1,965 47% 45%
776,984 100% 26% 74% 931 2,404 49% 43%
Total number of
export lines
Percentage shares by destination
Total number of products
Exports (in th.dollars)
Total export share
Percentage shares by destination
Maldives
to North to South to North to South Dynamic Products 59,888 56% 26% 74% 6 19 47% 53%New Products 781 1% 0% 100% 2 3 0% 100%Other 45,691 43% 47% 53% 8 28 46% 54%All 106,359 100% 35% 65% 16 50 44% 56%
Total number of
export lines
Percentage shares by destination
Total number of products
Exports (in th.dollars)
Total export share
Percentage shares by destination
Myanmar
to North to South to North to South Dynamic Products 526,168 9% 48% 52% 107 3884 38% 55%New Products 2,585,583 44% 0.2% 99.8% 32 822 45% 46%Other Products 2,761,203 47% 22% 78% 1,093 78 31% 65%All 5,872,954 100% 15% 85% 1,232 4784 39% 54%
Total number of
export lines
Percentage shares by destinationTotal
number of products
Exports (in th.dollars)
Total export share
Percentage shares by destination
Nepal
to North to South to North to South Dynamic Products 165,030 22% 35% 65% 63 1,014 66% 27%New Products 97,646 13% 18% 82% 52 489 66% 29%Other Products 500,216 66% 36% 64% 1,287 5,509 65% 31%
762,893 100% 34% 66% 1,402 7,012 65% 30%
Total number of
export lines
Percentage shares by destination
Total number of products
Exports (in th.dollars)
Total export share
Percentage shares by destination
6
(UNCTAD/DITC/TAB October 2010)
A.2 Composition and destination of Dynamic and New Exports (HS Section, 2007)
DYNAMIC Textile/Garments Agri-food Base metal Mineral Machinery
1 2 3 1 2 3 1 2 3 1 2 3 1 2 3
1=% share in total value of dynamic/new exports; 2= the number of dynamic/new exports; 3 = % share of dynamic/new exports to the South
Bangladesh 71% 47 17% 1% 7 53% 0% 2 93% 0% 0 0% 3% 11 88%
Cambodia 95% 60 2% 0% 2 88% 0% 1 100% 0% 0 0% 0% 1 100%
Lao PDR 59% 24 1% 15% 20 78% 0% 1 5% 5% 1 100 3% 5 94%
Nepal 46% 28 59% 7% 6 31% 17% 7 90% 0% 0 0 1% 0 6%
Myanmar 29% 32 17% 21% 31 85% 9% 2 86% 8% 6 100 7% 8 93%
Maldives 0% 0 0% 98% 4 73% 2% 2 100% 0% 0 0 0% 0 0%
Bhutan 0% 0 0% 94% 50 100% 0% 0 0% 0% 0 0% 0% 0 0%
Textile/Garments Agri-food Base metal Mineral Machinery
New 1 2 3 1 2 3 1 2 3 1 2 3 1 2 3
Bamgladesh 4% 18 89% 10% 22 73% 20% 15 91% 0% 2 37% 48% 36 75%
Cambodia 71% 8 12% 23% 5 67% 0% 0 0% 0% 0 0% 0% 2 100%
Lao PDR 0% 0 0% 20% 7 94% 1% 1 100% 28% 1 100% 31% 3 100%
Myanmer 0% 4 1% 0% 11 81% 0% 3 100% 99% 1 100% 0% 2 68%
Nepal 17% 15 24% 27% 5 55% 43% 12 100% 6% 1 100% 0% 1 0%
Bhutan 0% 1 100% 17% 4 75% 41% 3 100% 0% 0 0% 36% 7 100%
Maldives 0% 0 0% 16% 1 100% 84% 1 100% 0% 0 0% 0% 0 0%
Bangladesh, a. Dynamic Products
to North to South
2. VEGETABLE PRODUCTS 3'256 0% 1 83% 17%4. PREPARED FOODSTUFFS; BEVERAGES; TOBACCO 14'987 1% 6 56% 44%6. CHEMICAL PRODUCTS 1'496 0% 1 2% 98%7. PLASTICS AND RUBBER 15'642 1% 2 91% 9%8. RAW HIDES AND SKINS AND PRODUCTS THEREOF 266'884 17% 3 40% 60%10. PULP AND PAPER PRODUCTS 2'814 0% 4 60% 40%11. TEXTILE AND TEXTILE ARTICLES 1'138'963 71% 47 83% 17%12. FOOTWEAR AND OTHER ARTICLES OF TEXTILE 70'819 4% 4 97% 3%13. CERAMIC AND GLASS PRODUCTS 34'752 2% 2 96% 4%15. BASE METALS 351 0% 2 7% 93%16. MACHINERY, MECHANICAL APPLIANCES AND ELECTRICAL EQUIPMENT 47'556 3% 11 12% 88%18. PRECISION INSTRUMENTS AND APPARATUS 13'344 1% 2 82% 18%20. MISCELLANEOUS MANUFACTURED ARTICLES 27 0% 2 49% 51%Total 1'610'891 100% 87 74% 25%
Export share by destinationTotal
product number
Total DP share
Exports (in
th.dollars)HS Sections
b. New Products
to North to South
1. LIVE ANIMALS; ANIMAL PRODUCTS 15'221 6% 7 6% 94%2. VEGETABLE PRODUCTS 8'915 3% 8 36% 64%4. PREPARED FOODSTUFFS; BEVERAGES; TOBACCO 3'745 1% 7 38% 62%5. MINERAL PRODUCTS 617 0% 2 63% 37%6. CHEMICAL PRODUCTS 8'027 3% 6 30% 70%7. PLASTICS AND RUBBER 11'351 4% 8 14% 86%8. RAW HIDES AND SKINS AND PRODUCTS THEREOF 148 0% 1 100% 0%9. WOOD PRODUCTS 110 0% 1 0% 100%10. PULP AND PAPER PRODUCTS 6'640 2% 3 94% 6%11. TEXTILE AND TEXTILE ARTICLES 9'563 4% 18 11% 89%12. FOOTWEAR AND OTHER ARTICLES OF TEXTILE 1'478 1% 3 64% 36%13. CERAMIC AND GLASS PRODUCTS 3'339 1% 5 17% 83%15. BASE METALS 54'309 20% 15 9% 91%16. MACHINERY, MECHANICAL APPLIANCES AND ELECTRICAL EQUIPMENT 127'963 48% 36 25% 75%17. VEHICLES, AIRCRAFT, VESSELS AND TRANSPORT EQUIPMENT 15'708 6% 4 11% 89%18. PRECISION INSTRUMENTS AND APPARATUS 552 0% 2 98% 2%20. MISCELLANEOUS MANUFACTURED ARTICLES 779 0% 5 45% 55%Total 268'466 100% 131 21% 75%
Export share by destination
HS SectionsExports
(in th.dollars)
Total DP share
Total product number
7
(UNCTAD/DITC/TAB October 2010)
Bhutan, a. Dynamic Products
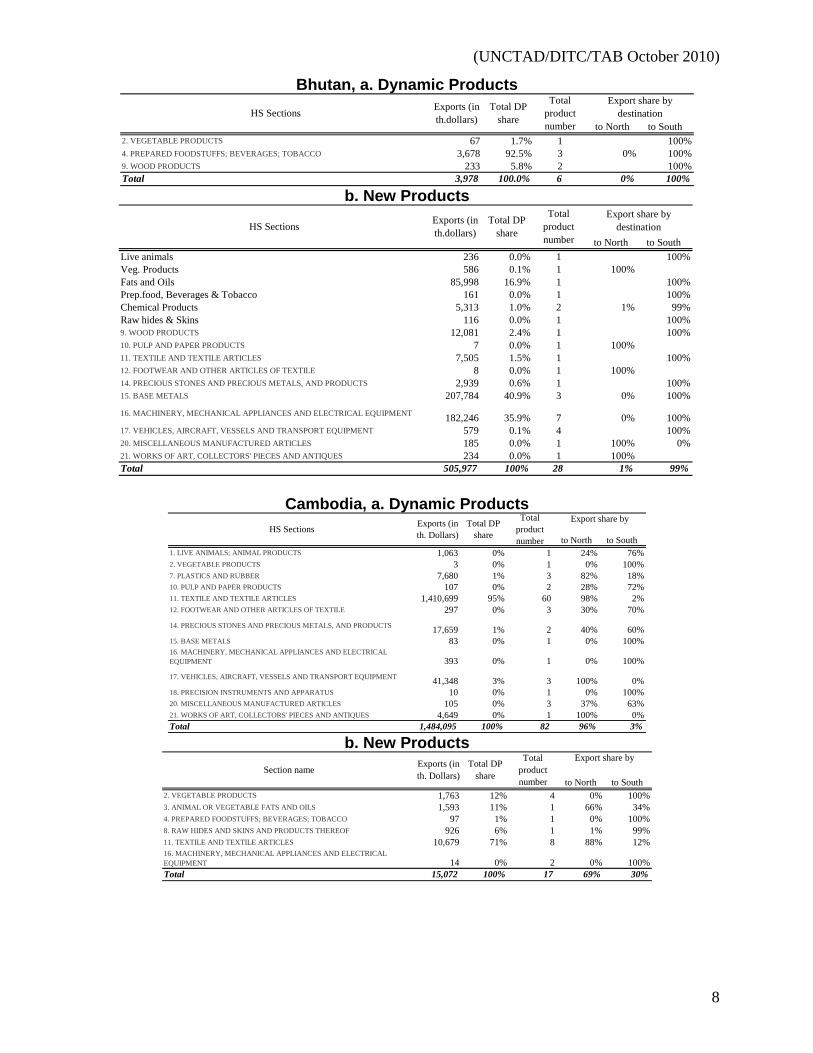
to North to South 2. VEGETABLE PRODUCTS 67 1.7% 1 100%4. PREPARED FOODSTUFFS; BEVERAGES; TOBACCO 3,678 92.5% 3 0% 100%9. WOOD PRODUCTS 233 5.8% 2 100%Total 3,978 100.0% 6 0% 100%
HS SectionsExport share by
destinationTotal
product number
Total DP share
Exports (in th.dollars)
b. New Products
to North to South Live animals 236 0.0% 1 100%Veg. Products 586 0.1% 1 100%Fats and Oils 85,998 16.9% 1 100%Prep.food, Beverages & Tobacco 161 0.0% 1 100%Chemical Products 5,313 1.0% 2 1% 99%Raw hides & Skins 116 0.0% 1 100%9. WOOD PRODUCTS 12,081 2.4% 1 100%10. PULP AND PAPER PRODUCTS 7 0.0% 1 100%11. TEXTILE AND TEXTILE ARTICLES 7,505 1.5% 1 100%12. FOOTWEAR AND OTHER ARTICLES OF TEXTILE 8 0.0% 1 100%14. PRECIOUS STONES AND PRECIOUS METALS, AND PRODUCTS 2,939 0.6% 1 100%15. BASE METALS 207,784 40.9% 3 0% 100%
16. MACHINERY, MECHANICAL APPLIANCES AND ELECTRICAL EQUIPMENT 182,246 35.9% 7 0% 100%17. VEHICLES, AIRCRAFT, VESSELS AND TRANSPORT EQUIPMENT 579 0.1% 4 100%20. MISCELLANEOUS MANUFACTURED ARTICLES 185 0.0% 1 100% 0%21. WORKS OF ART, COLLECTORS' PIECES AND ANTIQUES 234 0.0% 1 100%Total 505,977 100% 28 1% 99%
Total product number
Export share by destinationHS Sections Exports (in
th.dollars)Total DP
share
Cambodia, a. Dynamic Products
to North to South 1. LIVE ANIMALS; ANIMAL PRODUCTS 1,063 0% 1 24% 76%2. VEGETABLE PRODUCTS 3 0% 1 0% 100%7. PLASTICS AND RUBBER 7,680 1% 3 82% 18%10. PULP AND PAPER PRODUCTS 107 0% 2 28% 72%11. TEXTILE AND TEXTILE ARTICLES 1,410,699 95% 60 98% 2%12. FOOTWEAR AND OTHER ARTICLES OF TEXTILE 297 0% 3 30% 70%
14. PRECIOUS STONES AND PRECIOUS METALS, AND PRODUCTS 17,659 1% 2 40% 60%15. BASE METALS 83 0% 1 0% 100%16. MACHINERY, MECHANICAL APPLIANCES AND ELECTRICAL EQUIPMENT 393 0% 1 0% 100%
17. VEHICLES, AIRCRAFT, VESSELS AND TRANSPORT EQUIPMENT 41,348 3% 3 100% 0%18. PRECISION INSTRUMENTS AND APPARATUS 10 0% 1 0% 100%20. MISCELLANEOUS MANUFACTURED ARTICLES 105 0% 3 37% 63%21. WORKS OF ART, COLLECTORS' PIECES AND ANTIQUES 4,649 0% 1 100% 0%Total 1,484,095 100% 82 96% 3%
HS SectionsExport share by Exports (in
th. Dollars)Total DP
share
Total product number
b. New Products
to North to South 2. VEGETABLE PRODUCTS 1,763 12% 4 0% 100%3. ANIMAL OR VEGETABLE FATS AND OILS 1,593 11% 1 66% 34%4. PREPARED FOODSTUFFS; BEVERAGES; TOBACCO 97 1% 1 0% 100%8. RAW HIDES AND SKINS AND PRODUCTS THEREOF 926 6% 1 1% 99%11. TEXTILE AND TEXTILE ARTICLES 10,679 71% 8 88% 12%16. MACHINERY, MECHANICAL APPLIANCES AND ELECTRICAL EQUIPMENT 14 0% 2 0% 100%Total 15,072 100% 17 69% 30%
Total DP share
Total product number
Section nameExport share by Exports (in
th. Dollars)
8

(UNCTAD/DITC/TAB October 2010)
Laos PDR, a. Dynamic Products
to North to South
1. LIVE ANIMALS; ANIMAL PRODUCTS 23 0% 1 100%2. VEGETABLE PRODUCTS 13,917 14% 15 4% 96%4. PREPARED FOODSTUFFS; BEVERAGES; TOBACCO 1,092 1% 4 62% 38%5. MINERAL PRODUCTS 5,428 5% 1 100%6. CHEMICAL PRODUCTS 83 0% 1 100%7. PLASTICS AND RUBBER 9,197 9% 1 100%8. RAW HIDES AND SKINS AND PRODUCTS THEREOF 407 0% 1 100%9. WOOD PRODUCTS 1,978 2% 5 63% 37%11. TEXTILE AND TEXTILE ARTICLES 59,193 59% 24 99% 1%12. FOOTWEAR AND OTHER ARTICLES OF TEXTILE 5,458 5% 3 100% 0%15. BASE METALS 25 0% 1 95% 5%16. MACHINERY, MECHANICAL APPLIANCES AND ELECTRICAL EQUIPMENT 3,453 3% 5 6% 94%
17. VEHICLES, AIRCRAFT, VESSELS AND TRANSPORT EQUIPMENT 224 0% 2 3% 97%20. MISCELLANEOUS MANUFACTURED ARTICLES 206 0% 2 83% 17%Total 100,683 100% 66 66% 33%
HS Section Exports (in th.dollars)
Total DP share
Total product number
Export share by
b. New Products
to North to South
1. LIVE ANIMALS; ANIMAL PRODUCTS 1,050 7% 1 100%2. VEGETABLE PRODUCTS 857 6% 4 100%4. PREPARED FOODSTUFFS; BEVERAGES; TOBACCO 970 7% 2 17% 83%5. MINERAL PRODUCTS 4,041 28% 1 100%6. CHEMICAL PRODUCTS 2,296 16% 3 0% 100%7. PLASTICS AND RUBBER 699 5% 1 100%9. WOOD PRODUCTS 37 0% 1 100%15. BASE METALS 76 1% 1 100%16. MACHINERY, MECHANICAL APPLIANCES AND ELECTRICAL EQUIPMENT 4,505 31% 3 100%Total 14,530 100% 17 6% 94%
Total product number
Export share by
HS Section Exports (in th.dollars)
Total NP share
Maldives, a. Dynamic Products
to North to South 1. LIVE ANIMALS; ANIMAL PRODUCTS 58,527 98% 4 27% 73%15. BASE METALS 1,361 2% 2 0% 100%Total 59,888 100% 6 26% 74%
Export share by destination
Total DP share
Total product number
HS Sections Exports (in th.dollars)
b. New Products
to North to South 1. LIVE ANIMALS; ANIMAL PRODUCTS 125 16% 1 0% 100%15. BASE METALS 656 84% 1 0% 100%Total 781 100% 2 0% 100%
Export share by destination
Total product number
Total NP share
Exports (in th.dollars)HS Sections
9

(UNCTAD/DITC/TAB October 2010)
Myanmar, 2007, a. Dynamic Products
to North to South 1. LIVE ANIMALS; ANIMAL PRODUCTS 20,241 4% 13 16% 84%2. VEGETABLE PRODUCTS 73,260 14% 14 1% 99%4. PREPARED FOODSTUFFS; BEVERAGES; TOBACCO 17,554 3% 4 27% 73%5. MINERAL PRODUCTS 40,698 8% 6 100%7. PLASTICS AND RUBBER 72 0% 2 3% 97%8. RAW HIDES AND SKINS AND PRODUCTS THEREOF 421 0% 3 100%9. WOOD PRODUCTS 40,033 8% 10 47% 53%10. PULP AND PAPER PRODUCTS 3,516 1% 2 5% 95%11. TEXTILE AND TEXTILE ARTICLES 151,668 29% 32 83% 17%12. FOOTWEAR AND OTHER ARTICLES OF TEXTILE 67,311 13% 4 97% 3%14. PRECIOUS STONES AND PRECIOUS METALS, AND PRODUCTS 14,138 3% 1 98% 2%15. BASE METALS 48,518 9% 2 14% 86%16. MACHINERY, MECHANICAL APPLIANCES AND ELECTRICAL EQUIPMENT 37,118 7% 8 7% 93%17. VEHICLES, AIRCRAFT, VESSELS AND TRANSPORT EQUIPMENT 314 0% 1 67% 33%20. MISCELLANEOUS MANUFACTURED ARTICLES 11,273 2% 4 70% 30%21. WORKS OF ART, COLLECTORS' PIECES AND ANTIQUES 34 0% 1 34% 66%Total 526,168 100% 107 48% 52%
Total product number
Total DP share
Exports (in th.dollars)HS Sections
Export share by destination
b. New Products
to North to South 1. LIVE ANIMALS; ANIMAL PRODUCTS 602 0% 3 58% 42%2. VEGETABLE PRODUCTS 723 0% 3 100%4. PREPARED FOODSTUFFS; BEVERAGES; TOBACCO 979 0% 5 0% 100%5. MINERAL PRODUCTS 2,551,338 99% 1 100%6. CHEMICAL PRODUCTS 2,189 0% 2 100%8. RAW HIDES AND SKINS AND PRODUCTS THEREOF 8 0% 1 100%9. WOOD PRODUCTS 295 0% 1 1% 99%10. PULP AND PAPER PRODUCTS 1 0% 1 8% 92%11. TEXTILE AND TEXTILE ARTICLES 4,132 0% 4 99% 1%12. FOOTWEAR AND OTHER ARTICLES OF TEXTILE 309 0% 2 100%15. BASE METALS 2,442 0% 3 100%18. PRECISION INSTRUMENTS AND APPARATUS 21,150 1% 4 1% 99%20. MISCELLANEOUS MANUFACTURED ARTICLES 1,417 0% 2 32% 68%Total 2,585,583 100% 32 0% 100%
HS Sections Exports (in th.dollars)
Total NP share
Total product number
Export share by destination
10

(UNCTAD/DITC/TAB October 2010)
Nepal, 2007, a. Dynamic Products
to North to South 2. VEGETABLE PRODUCTS 1,261 1% 3 50% 50%4. PREPARED FOODSTUFFS; BEVERAGES; TOBACCO 10,434 6% 3 88% 12%6. CHEMICAL PRODUCTS 3,832 2% 6 2% 98%7. PLASTICS AND RUBBER 28,051 17% 2 0% 100%8. RAW HIDES AND SKINS AND PRODUCTS THEREOF 3,985 2% 3 98% 2%9. WOOD PRODUCTS 631 0% 1 75% 25%10. PULP AND PAPER PRODUCTS 3,233 2% 3 96% 4%11. TEXTILE AND TEXTILE ARTICLES 76,117 46% 28 41% 59%12. FOOTWEAR AND OTHER ARTICLES OF TEXTILE 7,420 4% 4 56% 44%15. BASE METALS 28,039 17% 7 10% 90%16. MACHINERY, MECHANICAL APPLIANCES AND ELECTRICAL EQUIPMENT 1,704 1% 1 94% 6%20. MISCELLANEOUS MANUFACTURED ARTICLES 322 0% 2 92% 8%Total 165,030 100% 63 35% 65%
Export share by destinationHS Sections Exports (in
th.dollars)Total DP
share
Total product number
b. New Products
to North to South 2. VEGETABLE PRODUCTS 582 1% 1 91% 9%4. PREPARED FOODSTUFFS; BEVERAGES; TOBACCO 25,672 26% 4 100%5. MINERAL PRODUCTS 5,823 6% 1 100%7. PLASTICS AND RUBBER 2,843 3% 6 3% 97%8. RAW HIDES AND SKINS AND PRODUCTS THEREOF 97 0% 1 100% 0%10. PULP AND PAPER PRODUCTS 742 1% 3 99% 1%11. TEXTILE AND TEXTILE ARTICLES 16,892 17% 15 76% 24%12. FOOTWEAR AND OTHER ARTICLES OF TEXTILE 83 0% 1 0% 100%13. CERAMIC AND GLASS PRODUCTS 101 0% 1 99% 1%15. BASE METALS 41,593 43% 12 0% 100%16. MACHINERY, MECHANICAL APPLIANCES AND ELECTRICAL EQUIPMENT 52 0% 1 100%
17. VEHICLES, AIRCRAFT, VESSELS AND TRANSPORT EQUIPMENT 48 0% 1 100%18. PRECISION INSTRUMENTS AND APPARATUS 796 1% 1 99% 1%20. MISCELLANEOUS MANUFACTURED ARTICLES 444 0% 3 91% 9%21. WORKS OF ART, COLLECTORS' PIECES AND ANTIQUES 1,879 2% 1 99% 1%Total 97,646 100% 52 18% 82%
Total NP share
Exports (in th.dollars)Section name
Export share by destination
Total product number
A.3 Top 3 Importers of Dynamic/NEW Exports
(Main imported products in bracket) Dynamic Exports New Exports Bangladesh EU (garments. leather), India (cotton, leather), US
(garments) China (machinery, metal products, textile), India (metal products, machinery), EU
Cambodia US, EU, Canada (garments) EU , US (dress, bed linen) , Chile (palm oil) Laos PDR EU (garments, Thailand (agri), China (agri) China (copper, essential oil), Thailand (ignition
wiring sets) , EU (polycarbonate in primary forms) Myanmar Japan (footwear, pearls, garments), EU (garments,
wooden furniture), China (iron/zinc ore, wood) Thailand (natural gas), China (optical lens, prism, essential oils), Hong Kong (prism, optical lens)
Nepal India (cotton yarn, iron products, toiletry goods), EU (sugar, garments, handicrafts), USA (garments, handicrafts)
India (metal & plastic goods), US (handicrafts), EU (handicrafts)
Bhutan India (drinking water), Hong Kong (plants), EU (drinking water)
India (copper wire, palm oil, ferro-silicon), Hong Kong (recorded media), Thailand (unrecorded magnetic discs)
Maldives Thailand (frozen skipjack), EU (fresh/chilled fish fillet), Japan (fresh/chilled tuna)
India (scrap of copper) , Argentina (scrap of copper), Thailand (frozen fish fillet)
11

(UNCTAD/DITC/TAB October 2010)
A.4 Product sophistication of Dynamic/New exports (HS 6-digit) Bangladesh Dynamic (#87) Bangladesh New exports (#131) Year 2007 (clus1#44;clus2#37;clus3#0;clus4#6) Year 2007(clus1#32;clus2#62;clus3#4;clus4#33)
24
68
1012
Rev
eale
d H
uman
Cap
ital I
nten
sity
Inde
x
0 50000 100000 150000 200000Revealed Physical Capital Intensity Index
24
68
1012
Rev
eale
d H
uman
Cap
ital I
nten
sity
Inde
x
0 50000 100000 150000 200000Revealed Physical Capital Intensity Index
Bhutan’s Dynamic at HS6 digit (#6) Bhutan’s New exports at HS6 digit (#28) Year 2007 (clus1#2;clus2#4;clus3#0;clus4#0) Year 2007 (clus1#9;clus2#10;clus3#1;clus4#8)
24
68
10R
evea
led
Hum
an C
apita
l Int
ensi
ty In
dex
0 50000 100000 150000Revealed Physical Capital Intensity Index
24
68
10R
evea
led
Hum
an C
apita
l Int
ensi
ty In
dex
0 50000 100000 150000Revealed Physical Capital Intensity Index
Cambodian Dynamic (#82) Cambodia's New exports (#17) Year 2007 (clus1#62;clus2#17;clus3#0;clus4#3) Year 2007 (clus1#8;clus2#7;clus3#1;clus4#1)
24
68
10R
evea
led
Hum
an C
apita
l Int
ensi
ty In
dex
0 50000 100000 150000Revealed Physical Capital Intensity Index
24
68
10R
evea
led
Hum
an C
apita
l Int
ensi
ty In
dex
0 50000 100000 150000Revealed Physical Capital Intensity Index
12

(UNCTAD/DITC/TAB October 2010)
Lao exports at HS6 digit (#66) Lao New exports at HS6 digit (#17) Year 2007 (clus1#44;clus2#13;clus3#2;clus4#7) Year 2007 (clus1#7;clus2#7;clus3#0;clus4#3)
24
68
10R
evea
led
Hum
an C
apita
l Int
ensi
ty In
dex
0 50000 100000 150000Revealed Physical Capital Intensity Index
24
68
10R
evea
led
Hum
an C
apita
l Int
ensi
ty In
dex
0 50000 100000 150000Revealed Physical Capital Intensity Index
Maldives Dynamic exports at HS6 digit (#6) Maldives New exports at HS6 digit (#2) Year 2007 (clus1#4;clus2#2;clus3#0;clus4#0) Year 2007 (clus1#0;clus2#2;clus3#0;clus4#0)
24
68
10R
evea
led
Hum
an C
apita
l Int
ensi
ty In
dex
0 50000 100000 150000Revealed Physical Capital Intensity Index
24
68
10R
evea
led
Hum
an C
apita
l Int
ensi
ty In
dex
0 50000 100000 150000Revealed Physical Capital Intensity Index
Myanmar’s Dynamic exports (#107) Myanmar’s New exports (#32) Year 2007 (clus1#57;clus2#40;clus3#4;clus4#6) Year 2007 (clus1#9;clus2#14;clus3#1;clus4#8)
24
68
10R
evea
led
Hum
an C
apita
l Int
ensi
ty In
dex
0 50000 100000 150000Revealed Physical Capital Intensity Index
24
68
10R
evea
led
Hum
an C
apita
l Int
ensi
ty In
dex
0 50000 100000 150000Revealed Physical Capital Intensity Index
13

(UNCTAD/DITC/TAB October 2010) Nepal’s Dynamic exports (#63) Nepal’s New exports (#52) Year 2007 (clus1#41;clus2#19;clus3#0;clus4#3) Year 2007 (clus1#21;clus2#26;clus3#0;clus4#5)
24
68
10R
evea
led
Hum
an C
apita
l Int
ensi
ty In
dex
0 50000 100000 150000Revealed Physical Capital Intensity Index
24
68
10R
evea
led
Hum
an C
apita
l Int
ensi
ty In
dex
0 50000 100000 150000Revealed Physical Capital Intensity Index
14

(UNCTAD/DITC/TAB October 2010)
A.5 Composition of Dynamic/New exports by Factor-intensity Clusters (in terms of # of products, %)
Bangladesh
i. Dynamic Products ii. New Products iii. Other Products
0
10
20
30
40
50
60
70
80
90
100
1993
1994
1995
1996
1997
1998
1999
2000
2001
2002
2003
2004
2005
2006
2007
Year
Cluster 1Cluster 2Cluster 3Cluster 4
0
10
20
30
40
50
60
70
80
90
100
1998
1999
2000
2001
2002
2003
2004
2005
2006
2007
Year
Cluster 1Cluster 2Cluster 3Cluster 4
0
10
20
30
40
50
60
70
80
90
100
1993
1994
1995
1996
1997
1998
1999
2000
2001
2002
2003
2004
2005
2006
2007
Year
Cluster 1Cluster 2Cluster 3Cluster 4
Bhutan i. Dynamic Products ii. New Products iii. Other Products
0
10
20
30
40
50
60
70
80
90
100
1993
1994
1995
1996
1997
1998
1999
2000
2001
2002
2003
2004
2005
2006
2007
Year
Cluster 1Cluster 2Cluster 3Cluster 4
0
10
20
30
40
50
60
70
80
90
100
1998
1999
2000
2001
2002
2003
2004
2005
2006
2007
Year
Cluster 1Cluster 2Cluster 3Cluster 4
0
10
20
30
40
50
60
70
80
90
100
1993
1994
1995
1996
1997
1998
1999
2000
2001
2002
2003
2004
2005
2006
2007
Year
Cluster 1Cluster 2Cluster 3Cluster 4
Cambodia
i. Dynamic Products ii. New Products iii. Other Products
0
10
20
30
40
50
60
70
80
90
100
1993
1994
1995
1996
1997
1998
1999
2000
2001
2002
2003
2004
2005
2006
2007
Year
Cluster 1Cluster 2Cluster 3Cluster 4
0
10
20
30
40
50
60
70
80
90
100
1998
1999
2000
2001
2002
2003
2004
2005
2006
2007
Year
Cluster 1Cluster 2Cluster 3Cluster 4
0
10
20
30
40
50
60
70
80
90
100
1993
1994
1995
1996
1997
1998
1999
2000
2001
2002
2003
2004
2005
2006
2007
Year
Cluster 1Cluster 2Cluster 3Cluster 4
Laos i. Dynamic Products ii. New Products iii. Other Products
0
10
20
30
40
50
60
70
80
90
100
1993
1994
1995
1996
1997
1998
1999
2000
2001
2002
2003
2004
2005
2006
2007
Year
Cluster 1Cluster 2Cluster 3Cluster 4
0
10
20
30
40
50
60
70
80
90
100
1998
1999
2000
2001
2002
2003
2004
2005
2006
2007
Year
Cluster 1Cluster 2Cluster 3Cluster 4
0
10
20
30
40
50
60
70
80
90
100
1993
1994
1995
1996
1997
1998
1999
2000
2001
2002
2003
2004
2005
2006
2007
Year
Cluster 1Cluster 2Cluster 3Cluster 4
15

(UNCTAD/DITC/TAB October 2010)
Maldives i. Dynamic Products ii. New Products iii. Other Products
0
10
20
30
40
50
60
70
80
90
100
1993
1994
1995
1996
1997
1998
1999
2000
2001
2002
2003
2004
2005
2006
2007
Year
Cluster 1Cluster 2Cluster 3
0
10
20
30
40
50
60
70
80
90
100
1998
1999
2000
2001
2002
2003
2004
2005
2006
2007
Year
Cluster 1Cluster 2Cluster 3
0
10
20
30
40
50
60
70
80
90
100
1993
1994
1995
1996
1997
1998
1999
2000
2001
2002
2003
2004
2005
2006
2007
Year
Cluster 1Cluster 2Cluster 3
Myanmar i. Dynamic Products ii. New Products iii. Other Products
0
10
20
30
40
50
60
70
80
90
100
1993
1994
1995
1996
1997
1998
1999
2000
2001
2002
2003
2004
2005
2006
2007
Year
Cluster 1Cluster 2Cluster 3Cluster 4
0
10
20
30
40
50
60
70
80
90
10019
98
1999
2000
2001
2002
2003
2004
2005
2006
2007
Year
Cluster 1Cluster 2Cluster 3Cluster 4
0
10
20
30
40
50
60
70
80
90
100
1993
1994
1995
1996
1997
1998
1999
2000
2001
2002
2003
2004
2005
2006
2007
Year
Cluster 1Cluster 2Cluster 3Cluster 4
Nepal i. Dynamic Products ii. New Products iii. Other Products
0
10
20
30
40
50
60
70
80
90
100
1993
1994
1995
1996
1997
1998
1999
2000
2001
2002
2003
2004
2005
2006
2007
Year
Cluster 1Cluster 2Cluster 3Cluster 4
0
10
20
30
40
50
60
70
80
90
100
1998
1999
2000
2001
2002
2003
2004
2005
2006
2007
Year
Cluster 1Cluster 2Cluster 3Cluster 4
0
10
20
30
40
50
60
70
80
90
10019
9319
9419
9519
9619
9719
9819
9920
0020
0120
0220
0320
0420
0520
0620
07
Year
Cluster 1Cluster 2Cluster 3Cluster 4
16

(UNCTAD/DITC/TAB October 2010)
A.6 Changes in Average Revealed Capital Intensity (RCI) of Exports Bangladesh, a. Weighted Averages of RCI by destination
0
10000
20000
30000
40000
50000
60000
Wei
ghte
d av
erag
e R
CI
1993
1994
1995
1996
1997
1998
1999
2000
2001
2002
2003
2004
2005
2006
2007
Year
05000
1000015000200002500030000350004000045000500005500060000
1993
1994
1995
1996
1997
1998
1999
2000
2001
2002
2003
2004
2005
2006
2007
Year
exports to North exports to South
b. Un-Weighted Averages of RCI by destination
0
10000
20000
30000
40000
50000
60000
70000
Unw
eigh
ted
aver
age
RC
I
1993
1994
1995
1996
1997
1998
1999
2000
2001
2002
2003
2004
2005
2006
2007
Year
05000
1000015000200002500030000350004000045000500005500060000
1993
1994
1995
1996
1997
1998
1999
2000
2001
2002
2003
2004
2005
2006
2007
Year
exports to North exports to South
Bhutan a. Weighted Averages of RCI by destination
0
10000
20000
30000
40000
50000
60000
70000
Wei
ghte
d av
erag
e R
CI
1993
1994
1995
1996
1997
1998
1999
2000
2001
2002
2003
2004
2005
2006
2007
Year
0
10000
20000
30000
40000
50000
60000
70000
1993
1994
1995
1996
1997
1998
1999
2000
2001
2002
2003
2004
2005
2006
2007
Year
exports to North exports to South
b. Un-Weighted Averages of RCI by destination
0
10000
20000
30000
40000
50000
60000
70000
Unw
eigh
ted
aver
age
RC
I
1993
1994
1995
1996
1997
1998
1999
2000
2001
2002
2003
2004
2005
2006
2007
Year
17
0
10000
20000
30000
40000
50000
60000
70000
1993
1994
1995
1996
1997
1998
1999
2000
2001
2002
2003
2004
2005
2006
2007
Year
exports to North exports to South

(UNCTAD/DITC/TAB October 2010) Cambodia, a. Weighted Averages of RCI by destination
0
10000
20000
30000
40000
50000
60000
Wei
ghte
d av
erag
e R
CI
1993
1994
1995
1996
1997
1998
1999
2000
2001
2002
2003
2004
2005
2006
2007
Year
05000
1000015000200002500030000350004000045000500005500060000
1993
1994
1995
1996
1997
1998
1999
2000
2001
2002
2003
2004
2005
2006
2007
Year
exports to North exports to South
b. Un-Weighted Averages of RCI by destination
0
10000
20000
30000
40000
50000
60000
Unw
eigh
ted
aver
age
RC
I
1993
1994
1995
1996
1997
1998
1999
2000
2001
2002
2003
2004
2005
2006
2007
Year
05000
1000015000200002500030000350004000045000500005500060000
1993
1994
1995
1996
1997
1998
1999
2000
2001
2002
2003
2004
2005
2006
2007
Year
exports to North exports to South
Lao PDR, a. Weighted Averages of RCI by destination
0
10000
20000
30000
40000
50000
60000
Wei
ghte
d av
erag
e R
CI
1993
1994
1995
1996
1997
1998
1999
2000
2001
2002
2003
2004
2005
2006
2007
Year
05000
1000015000200002500030000350004000045000500005500060000
1993
1994
1995
1996
1997
1998
1999
2000
2001
2002
2003
2004
2005
2006
2007
Year
exports to North exports to South
b. Un-Weighted Averages of RCI by destination
0
10000
20000
30000
40000
50000
60000
Unw
eigh
ted
aver
age
RC
I
1993
1994
1995
1996
1997
1998
1999
2000
2001
2002
2003
2004
2005
2006
2007
Year
05000
1000015000200002500030000350004000045000500005500060000
1993
1994
1995
1996
1997
1998
1999
2000
2001
2002
2003
2004
2005
2006
2007
Year
exports to North exports to South
Maldives,
18

(UNCTAD/DITC/TAB October 2010) a. Weighted Averages of RCI by destination
0
10000
20000
30000
40000
50000
60000W
eigh
ted
aver
age
RC
I
1993
1994
1995
1996
1997
1998
1999
2000
2001
2002
2003
2004
2005
2006
2007
Year
05000
1000015000200002500030000350004000045000500005500060000
1993
1994
1995
1996
1997
1998
1999
2000
2001
2002
2003
2004
2005
2006
2007
Year
exports to North exports to South
b. Un-Weighted Averages of RCI by destination
05000
1000015000200002500030000350004000045000500005500060000
1993
1994
1995
1996
1997
1998
1999
2000
2001
2002
2003
2004
2005
2006
2007
Year
exports to North exports to South
0
10000
20000
30000
40000
50000
60000
Unw
eigh
ted
aver
age
RC
I
1993
1994
1995
1996
1997
1998
1999
2000
2001
2002
2003
2004
2005
2006
2007
Year
Nepal, a. Weighted Averages of RCI by destination
0
10000
20000
30000
40000
50000
60000
Wei
ghte
d av
erag
e R
CI
1993
1994
1995
1996
1997
1998
1999
2000
2001
2002
2003
2004
2005
2006
2007
Year
05000
1000015000200002500030000350004000045000500005500060000
1993
1994
1995
1996
1997
1998
1999
2000
2001
2002
2003
2004
2005
2006
2007
Year
exports to North exports to South
b. Un-Weighted Averages of RCI by destination
0
10000
20000
30000
40000
50000
60000
Unw
eigh
ted
aver
age
RC
I
1993
1994
1995
1996
1997
1998
1999
2000
2001
2002
2003
2004
2005
2006
2007
Year
05000
1000015000200002500030000350004000045000500005500060000
1993
1994
1995
1996
1997
1998
1999
2000
2001
2002
2003
2004
2005
2006
2007
Year
exports to North exports to South
19

(UNCTAD/DITC/TAB October 2010) Myanmar, Weighted Averages of RCI by destination,
05000
1000015000200002500030000350004000045000500005500060000
1993
1994
1995
1996
1997
1998
1999
2000
2001
2002
2003
2004
2005
2006
2007
Year
exports to North exports to South
0
10000
20000
30000
40000
50000
60000
Wei
ghte
d av
erag
e R
CI
1993
1994
1995
1996
1997
1998
1999
2000
2001
2002
2003
2004
2005
2006
2007
Year
Excluding 271121
0
10000
20000
30000
40000
50000
60000
Wei
ghte
d av
erag
e R
CI
1993
1994
1995
1996
1997
1998
1999
2000
2001
2002
2003
2004
2005
2006
2007
Year
05000
1000015000200002500030000350004000045000500005500060000
1993
1994
1995
1996
1997
1998
1999
2000
2001
2002
2003
2004
2005
2006
2007
Year
exports to North exports to South
b. Un-Weighted Averages of RCI by destination
0
10000
20000
30000
40000
50000
60000
Unw
eigh
ted
aver
age
RC
I
1993
1994
1995
1996
1997
1998
1999
2000
2001
2002
2003
2004
2005
2006
2007
Year
05000
1000015000200002500030000350004000045000500005500060000
1993
1994
1995
1996
1997
1998
1999
2000
2001
2002
2003
2004
2005
2006
2007
Year
exports to North exports to South
20
(UNCTAD/DITC/TAB October 2010)
A.7 Changes in the weight of sophisticated exports: By destination, %
Bangladesh In terms of number of Products
i. Export to the South ii. Export to the North
0
10
20
30
40
50
60
70
80
90
100
1993
1994
1995
1996
1997
1998
1999
2000
2001
2002
2003
2004
2005
2006
2007
Year
Cluster 1Cluster 2Cluster 3Cluster 4
0
10
20
30
40
50
60
70
80
90
100
1993
1994
1995
1996
1997
1998
1999
2000
2001
2002
2003
2004
2005
2006
2007
Year
Cluster 1Cluster 2Cluster 3Cluster 4
In terms of Export value
i. Export to the South ii. Export to the North
0
10
20
30
40
50
60
70
80
90
100
1993
1994
1995
1996
1997
1998
1999
2000
2001
2002
2003
2004
2005
2006
2007
Year
Cluster 1Cluster 2Cluster 3Cluster 4
0
10
20
30
40
50
60
70
80
90
100
1993
1994
1995
1996
1997
1998
1999
2000
2001
2002
2003
2004
2005
2006
2007
Year
Cluster 1Cluster 2Cluster 3Cluster 4
Bhutan In terms of number of Products
i. Export to the South ii. Export to the North
0
10
20
30
40
50
60
70
80
90
100
1993
1994
1995
1996
1997
1998
1999
2000
2001
2002
2003
2004
2005
2006
2007
Year
Cluster 1Cluster 2Cluster 3Cluster 4
0
10
20
30
40
50
60
70
80
90
100
1993
1994
1995
1996
1997
1998
1999
2000
2001
2002
2003
2004
2005
2006
2007
Year
Cluster 1Cluster 2Cluster 3Cluster 4
In terms of Export value i. Export to the South ii. Export to the North
0
10
20
30
40
50
60
70
80
90
100
1993
1994
1995
1996
1997
1998
1999
2000
2001
2002
2003
2004
2005
2006
2007
Year
Cluster 1Cluster 2Cluster 3Cluster 4
0
10
20
30
40
50
60
70
80
90
100
1993
1994
1995
1996
1997
1998
1999
2000
2001
2002
2003
2004
2005
2006
2007
Year
Cluster 1Cluster 2Cluster 3Cluster 4
21

(UNCTAD/DITC/TAB October 2010) Cambodia
In terms of number of Products i. Export to the South ii. Export to the North
0
10
20
30
40
50
60
70
80
90
10019
9319
9419
9519
9619
9719
9819
9920
0020
0120
0220
0320
0420
0520
0620
07
Year
Cluster 1Cluster 2Cluster 3Cluster 4
0
10
20
30
40
50
60
70
80
90
100
1993
1994
1995
1996
1997
1998
1999
2000
2001
2002
2003
2004
2005
2006
2007
Year
Cluster 1Cluster 2Cluster 3Cluster 4
In terms of Export value
i. Export to the South ii. Export to the North
0
10
20
30
40
50
60
70
80
90
100
1993
1994
1995
1996
1997
1998
1999
2000
2001
2002
2003
2004
2005
2006
2007
Year
Cluster 1Cluster 2Cluster 3Cluster 4
0
10
20
30
40
50
60
70
80
90
100
1993
1994
1995
1996
1997
1998
1999
2000
2001
2002
2003
2004
2005
2006
2007
Year
Cluster 1Cluster 2Cluster 3Cluster 4
Laos In terms of number of Products
i. Export to the South ii. Export to the North
0
10
20
30
40
50
60
70
80
90
100
1993
1994
1995
1996
1997
1998
1999
2000
2001
2002
2003
2004
2005
2006
2007
Year
Cluster 1Cluster 2Cluster 3Cluster 4
0
10
20
30
40
50
60
70
80
90
100
1993
1994
1995
1996
1997
1998
1999
2000
2001
2002
2003
2004
2005
2006
2007
Year
Cluster 1Cluster 2Cluster 3Cluster 4
In terms of Export value
i. Export to the South ii. Export to the North
0
10
20
30
40
50
60
70
80
90
100
1993
1994
1995
1996
1997
1998
1999
2000
2001
2002
2003
2004
2005
2006
2007
Year
Cluster 1Cluster 2Cluster 3Cluster 4
0
10
20
30
40
50
60
70
80
90
100
1993
1994
1995
1996
1997
1998
1999
2000
2001
2002
2003
2004
2005
2006
2007
Year
Cluster 1Cluster 2Cluster 3Cluster 4
22

(UNCTAD/DITC/TAB October 2010) Maldives
In terms of number of Products i. Export to the South ii. Export to the North
0
10
20
30
40
50
60
70
80
90
10019
9319
9419
9519
9619
9719
9819
9920
0020
0120
0220
0320
0420
0520
0620
07
Year
Cluster 1Cluster 2Cluster 3
0
10
20
30
40
50
60
70
80
90
100
1993
1994
1995
1996
1997
1998
1999
2000
2001
2002
2003
2004
2005
2006
2007
Year
Cluster 1Cluster 2Cluster 3
In terms of Export value
i. Export to the South ii. Export to the North
0
10
20
30
40
50
60
70
80
90
100
1993
1994
1995
1996
1997
1998
1999
2000
2001
2002
2003
2004
2005
2006
2007
Year
Cluster 1Cluster 2Cluster 3
0
10
20
30
40
50
60
70
80
90
100
1993
1994
1995
1996
1997
1998
1999
2000
2001
2002
2003
2004
2005
2006
2007
Year
Cluster 1Cluster 2Cluster 3
Myanmar In terms of number of Products
i. Export to the South ii. Export to the North
0
10
20
30
40
50
60
70
80
90
100
1993
1994
1995
1996
1997
1998
1999
2000
2001
2002
2003
2004
2005
2006
2007
Year
Cluster 1Cluster 2Cluster 3Cluster 4
0
10
20
30
40
50
60
70
80
90
100
1993
1994
1995
1996
1997
1998
1999
2000
2001
2002
2003
2004
2005
2006
2007
Year
Cluster 1Cluster 2Cluster 3Cluster 4
In terms of Export value
i. Export to the South All exports Excluding Natural Gas
0
10
20
30
40
50
60
70
80
90
100
1993
1994
1995
1996
1997
1998
1999
2000
2001
2002
2003
2004
2005
2006
2007
Year
Cluster 1Cluster 2Cluster 3Cluster 4
0
10
20
30
40
50
60
70
80
90
100
1993
1994
1995
1996
1997
1998
1999
2000
2001
2002
2003
2004
2005
2006
2007
Year
Cluster 1Cluster 2Cluster 3Cluster 4
23
(UNCTAD/DITC/TAB October 2010) Nepal
In terms of number of Products
i. Export to the South ii. Export to the North
0
10
20
30
40
50
60
70
80
90
100
1993
1994
1995
1996
1997
1998
1999
2000
2001
2002
2003
2004
2005
2006
2007
Year
Cluster 1Cluster 2Cluster 3Cluster 4
0
10
20
30
40
50
60
70
80
90
100
1993
1994
1995
1996
1997
1998
1999
2000
2001
2002
2003
2004
2005
2006
2007
Year
Cluster 1Cluster 2Cluster 3Cluster 4
In terms of Export value
i. Export to the South ii. Export to the North
0
10
20
30
40
50
60
70
80
90
100
1993
1994
1995
1996
1997
1998
1999
2000
2001
2002
2003
2004
2005
2006
2007
Year
Cluster 1Cluster 2Cluster 3Cluster 4
0
10
20
30
40
50
60
70
80
90
100
1993
1994
1995
1996
1997
1998
1999
2000
2001
2002
2003
2004
2005
2006
2007
Year
Cluster 1Cluster 2Cluster 3Cluster 4
24