Embed Size (px)
Citation preview
Mike Schussler Economists.co.za for SASBO
www.economists.co.za 1
How SA compares on prices. How SA compares on some input costs. How SA compares excluding energy taxes. How SA compares when adjusting for input
costs and environment adjustments What these comparisons show. Summary Some suggestions.
2www.Economists.co.za
3www.Economists.co.za
4
6
8
10
12
14
16
18
20
22
Jan
-09
Ma
r-0
9
Ma
y-0
9
Jul-
09
Se
p-0
9
No
v-0
9
Jan
-10
Ma
r-10
Ma
y-1
0
Jul-
10
Se
p-1
0
No
v-10
Jan
-11
Ma
r-11
Ma
y-1
1
Jul-
11
Se
p-1
1
No
v-11
Jan
-12
Ma
r-12
Ma
y-1
2
Jul-
12
Se
p-1
2
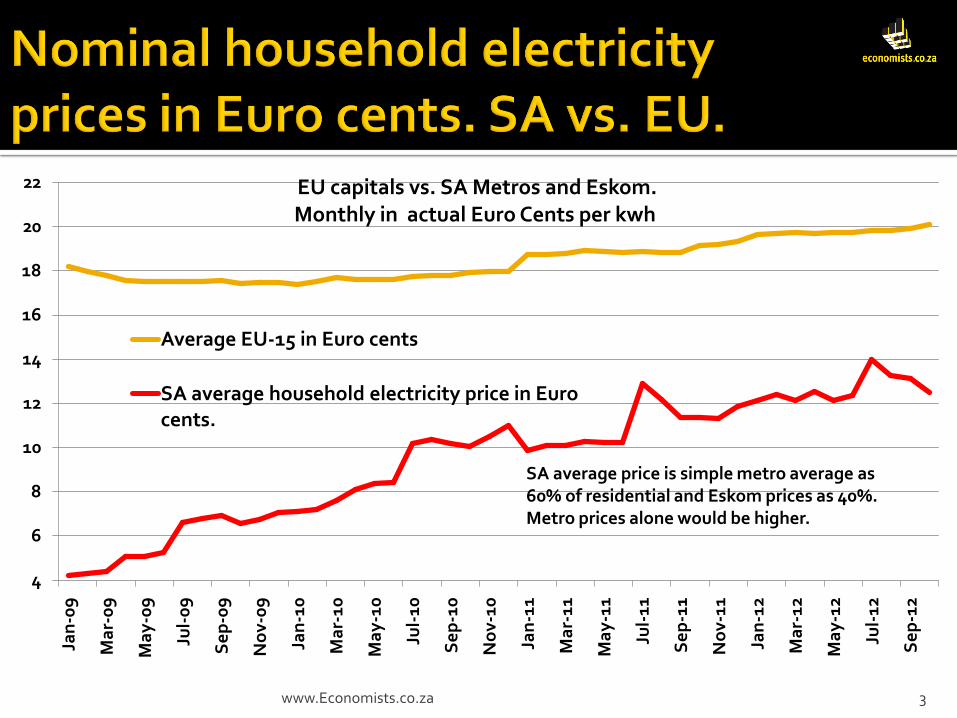
EU capitals vs. SA Metros and Eskom.Monthly in actual Euro Cents per kwh
Average EU-15 in Euro cents
SA average household electricity price in Euro cents.
SA average price is simple metro average as 60% of residential and Eskom prices as 40%. Metro prices alone would be higher.
4www.Economists.co.za
0
2
4
6
8
10
12
14
16
18
2001 2002 2003 2004 2005 2006 2007 2008 2009 2010 2011 2012
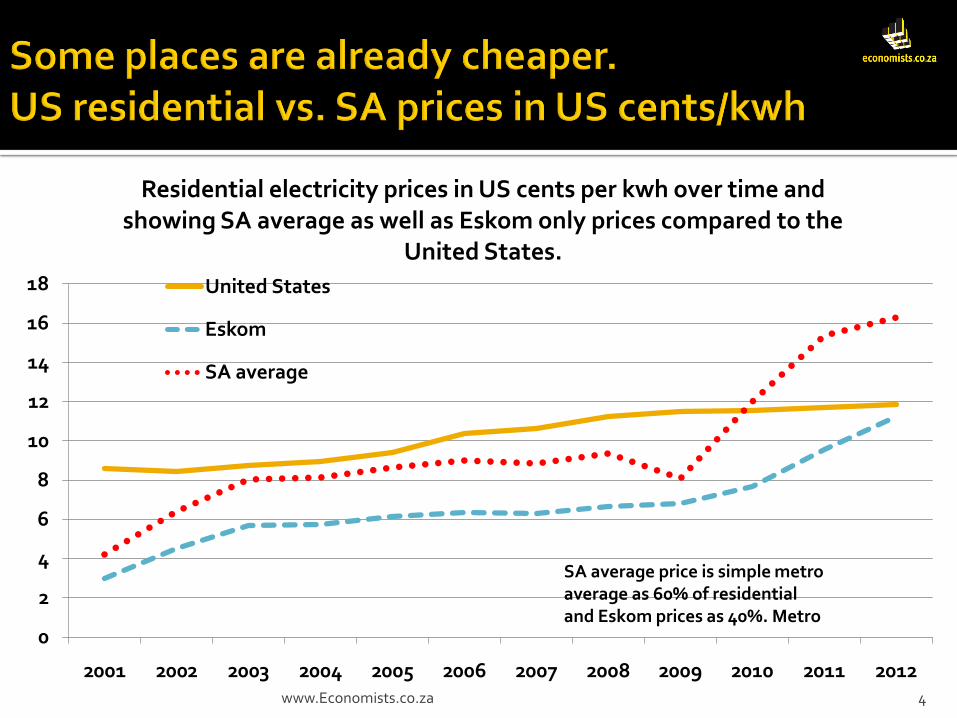
Residential electricity prices in US cents per kwh over time and showing SA average as well as Eskom only prices compared to the
United States.
United States
Eskom
SA average
SA average price is simple metro average as 60% of residential and Eskom prices as 40%. Metro
Input costs in SA should be lower. On average the cost of SA coal is 60% of the price of European
coal.
Admin and personal costs were not available internationally but within SA utility Sector has highest average wage costs. SA should be Cheaper here but probably is not.
Interest rates are higher in SA but Eskom gets it’s capital cheaper than almost all SA firms.
Distribution costs could be higher but in cities and towns the cost should be cheaper than Developed countries as land prices are cheaper.
5www.Economists.co.za
6www.Economists.co.za
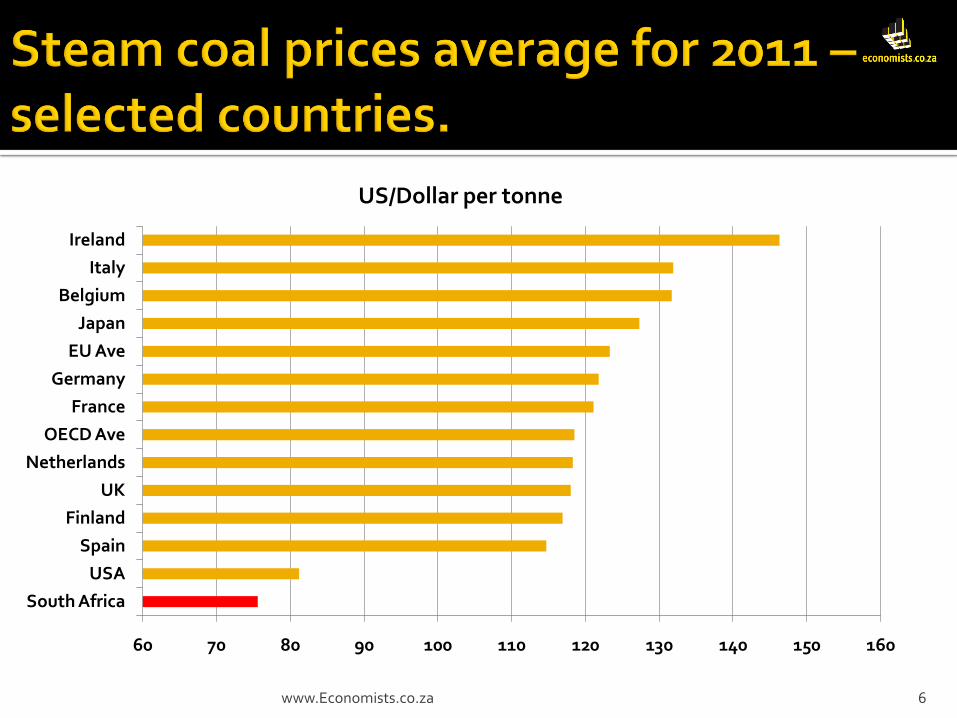
60 70 80 90 100 110 120 130 140 150 160
South Africa
USA
Spain
Finland
UK
Netherlands
OECD Ave
France
Germany
EU Ave
Japan
Belgium
Italy
Ireland
US/Dollar per tonne
7www.Economists.co.za
0
1
2
3
4
5
6
7
8
2001 2002 2003 2004 2005 2006 2007 2008 2009 2010 2011 2012
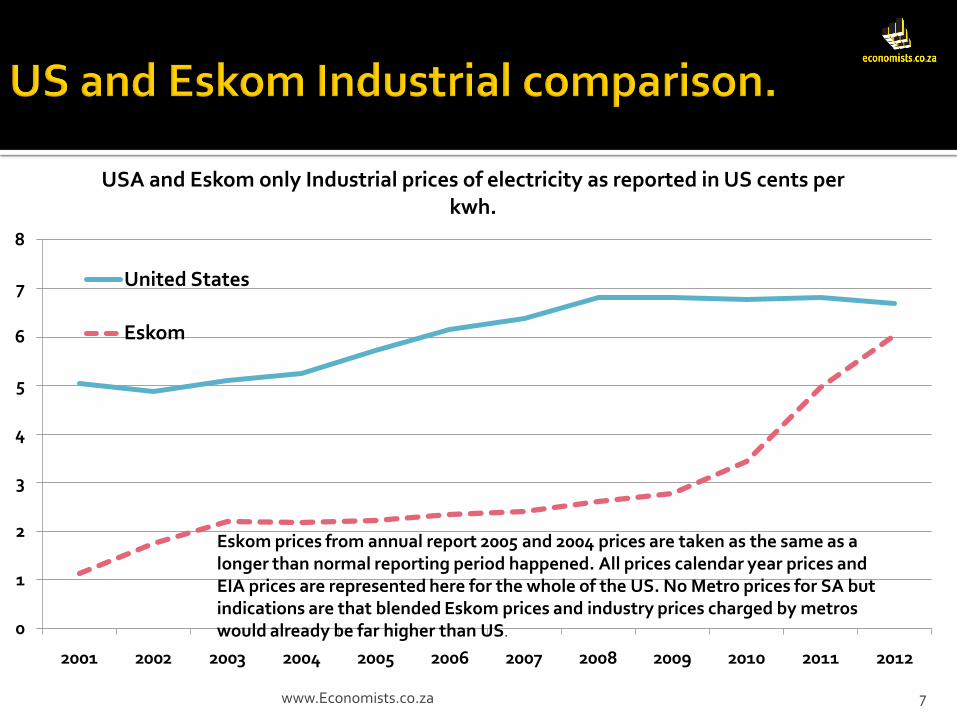
USA and Eskom only Industrial prices of electricity as reported in US cents per kwh.
United States
Eskom
Eskom prices from annual report 2005 and 2004 prices are taken as the same as a longer than normal reporting period happened. All prices calendar year prices and EIA prices are represented here for the whole of the US. No Metro prices for SA but indications are that blended Eskom prices and industry prices charged by metros would already be far higher than US.
Europe as a region generally has higher energy taxes with electricity taxes alone making up 11,7% on average household prices across 15 capitals in Europe.
For Industrial tariffs taxes can make up 29% of electricity prices but the average seems somewhat less, being in the mid teens.
SA energy taxes are about 1% in Household and industry terms.
8www.Economists.co.za
9www.Economists.co.za
8
10
12
14
16
18
20
22
24
26
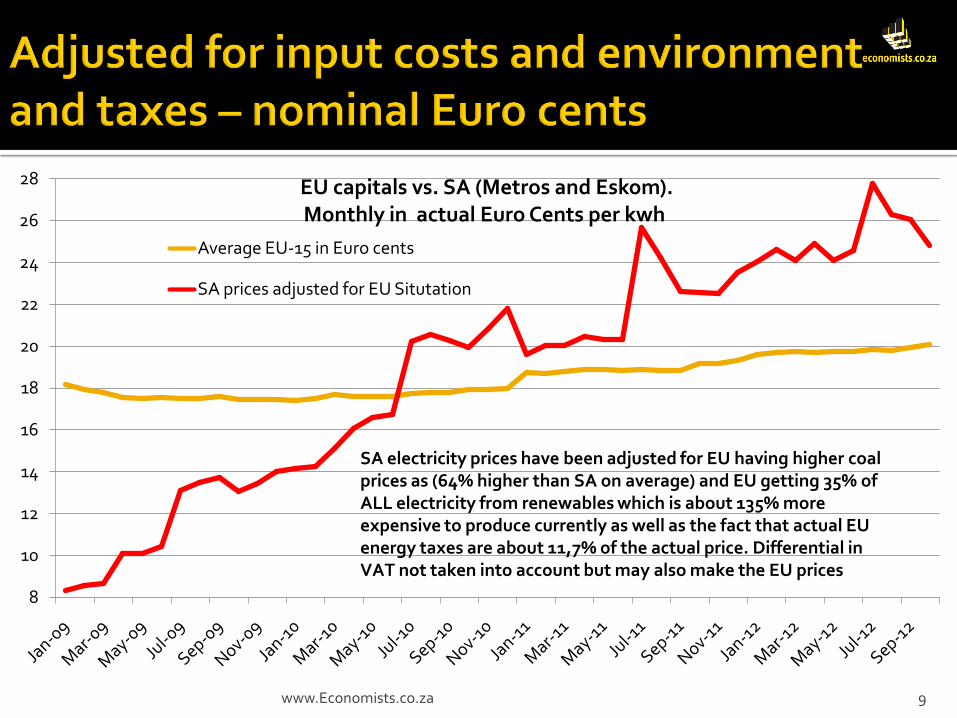
28 EU capitals vs. SA (Metros and Eskom).Monthly in actual Euro Cents per kwh
Average EU-15 in Euro cents
SA prices adjusted for EU Situtation
SA electricity prices have been adjusted for EU having higher coal prices as (64% higher than SA on average) and EU getting 35% of ALL electricity from renewables which is about 135% more expensive to produce currently as well as the fact that actual EU energy taxes are about 11,7% of the actual price. Differential in VAT not taken into account but may also make the EU prices
Purchase power parity would make SA electricity seem even more expensive.
The system whereby municipalities add a big mark-up onto Eskom prices and electricity in effect become a revenue collection system for local government.
This is probably the most inefficient part of SA pricing system.
The actual cost of the build seems high too.
10www.Economists.co.za
11www.Economists.co.za
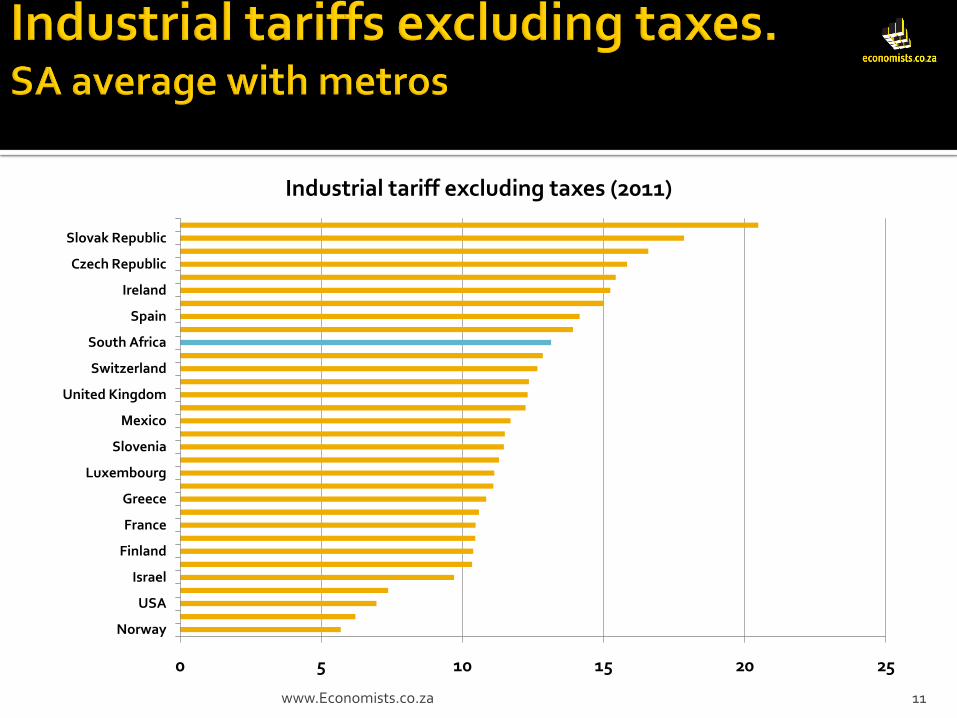
0 5 10 15 20 25
Norway
USA
Israel
Finland
France
Greece
Luxembourg
Slovenia
Mexico
United Kingdom
Switzerland
South Africa
Spain
Ireland
Czech Republic
Slovak Republic
Industrial tariff excluding taxes (2011)
12www.Economists.co.za
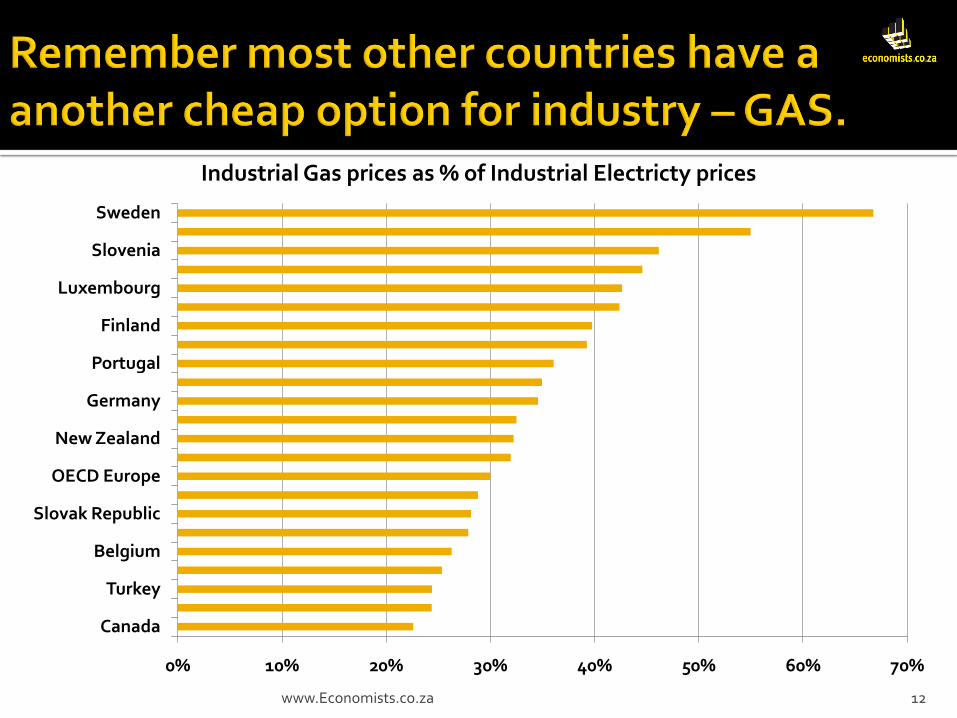
0% 10% 20% 30% 40% 50% 60% 70%
Canada
Turkey
Belgium
Slovak Republic
OECD Europe
New Zealand
Germany
Portugal
Finland
Luxembourg
Slovenia
Sweden
Industrial Gas prices as % of Industrial Electricty prices
Eskom buys SA coal which is cheaper and pays less of an environmental surcharge, by paying less in energy taxes.
Yet with all these advantages “disappear” when comparing like with like.
Converting coal into electricity seems more expensive here than most other countries.
SA Electricity prices compare with highly taxed, high cost countries with high environmental surcharges.
When compared to similar coal producing countries SA seems expensive.
13www.Economists.co.za

Eskom costs too high.
Even with lower coal prices other Eskom costs drive up the price.
It seems too easy for Eskom to raise prices on consumers rather than being forced to look at own cost structure.
As Prof Kantor stated Discount rate is out of sync as well.
Total Electricity market structure makes SA uncompetitive
14www.Economists.co.za
Relook at long-term contracts.
Eskom sell electricity far below costs on these contracts but others have to pay to make this up.
Investigate why Eskom costs such as employee compensation and other costs seem high.
Do not allow “cost plus” calculations if cost have not been compared and analysed.
Lower the returns required.
15www.Economists.co.za
www.Economists.co.za 16