Embed Size (px)
Citation preview
OUTA Presentation to NERSA Eskom’s 2018/19 application
NOVEMBER 2017
1
TABLE OF CONTENTS q Introduction q Our Requests q Our Concerns q Declining Corporate Governance q Lack of Transparency q Regulatory Decision Making Process q Growing Inefficiencies q Recommendations q Concluding Remarks
2
3
q OUTAisaproudlySouthAfricannon-profitcivilac<onorganisa<on,supportedandfundedbythepublicwhoare passionate about improving the prosperity of ourna<on.
q OUTA was established to hold to account, those inauthority who abuse their power w.r.t. Tax Payersmoney.
INTRODUCTION
4
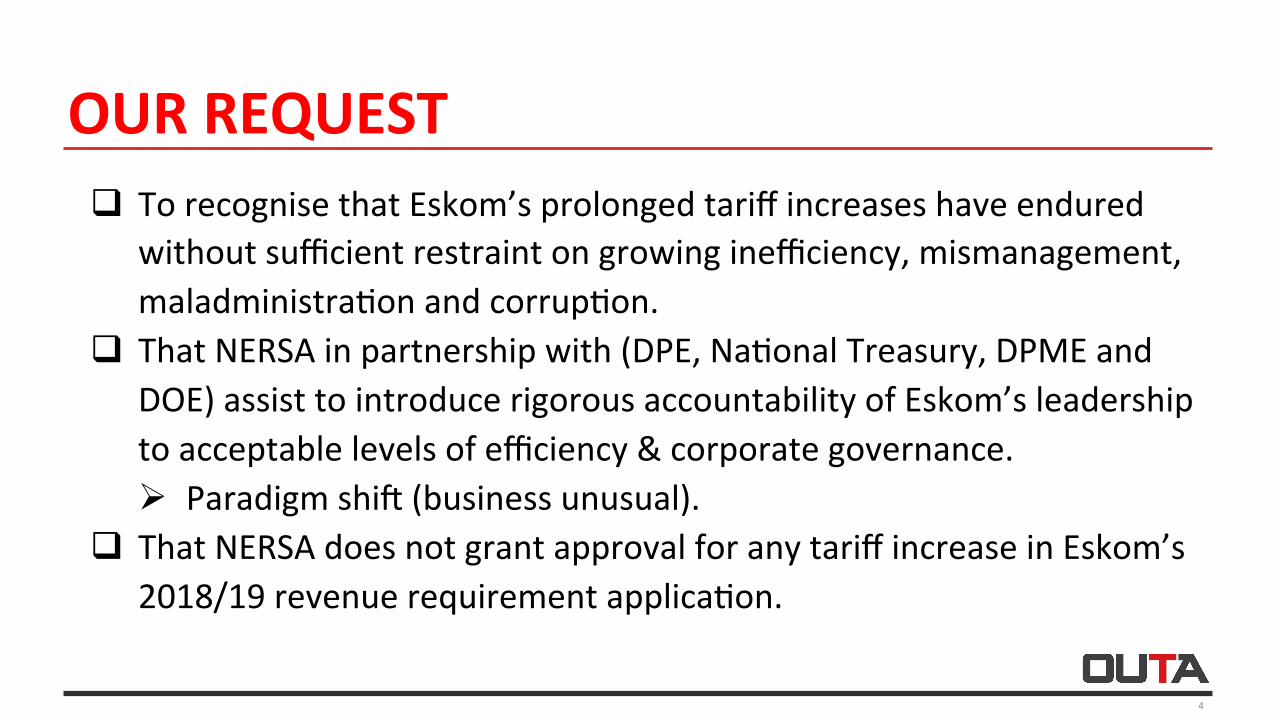
q TorecognisethatEskom’sprolongedtariffincreaseshaveenduredwithoutsufficientrestraintongrowinginefficiency,mismanagement,maladministra<onandcorrup<on.
q ThatNERSAinpartnershipwith(DPE,Na<onalTreasury,DPMEandDOE)assisttointroducerigorousaccountabilityofEskom’sleadershiptoacceptablelevelsofefficiency&corporategovernance.Ø ParadigmshiS(businessunusual).
q ThatNERSAdoesnotgrantapprovalforanytariffincreaseinEskom’s2018/19revenuerequirementapplica<on.
OURREQUEST
5
1. DecliningCorporateGovernance2. LackofTransparency3. GrowingInefficiencies4. DamagingPriceTrajectory5. RegulatoryDecisionMakingProcess
OURCONCERNS
6
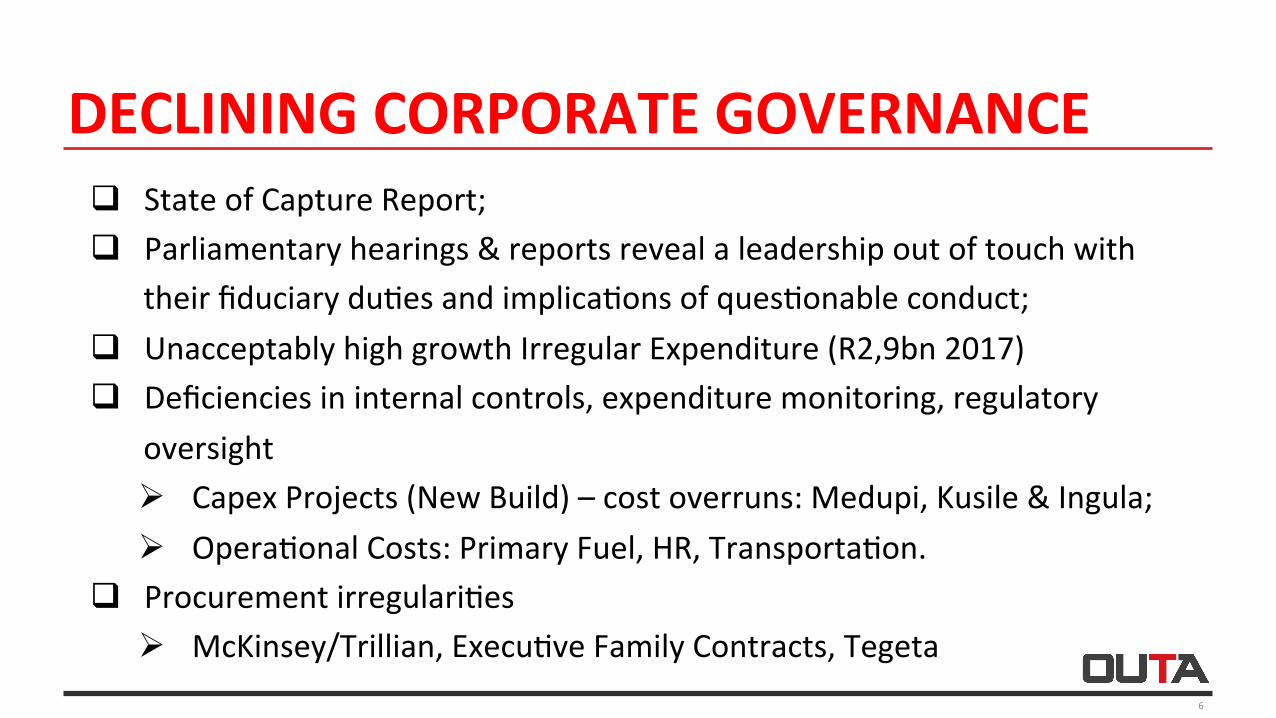
q StateofCaptureReport;q Parliamentaryhearings&reportsrevealaleadershipoutoftouchwith
theirfiduciarydu<esandimplica<onsofques<onableconduct;q UnacceptablyhighgrowthIrregularExpenditure(R2,9bn2017)q Deficienciesininternalcontrols,expendituremonitoring,regulatory
oversightØ CapexProjects(NewBuild)–costoverruns:Medupi,Kusile&Ingula;Ø Opera<onalCosts:PrimaryFuel,HR,Transporta<on.
q Procurementirregulari<esØ McKinsey/Trillian,Execu<veFamilyContracts,Tegeta
DECLININGCORPORATEGOVERNANCE
7
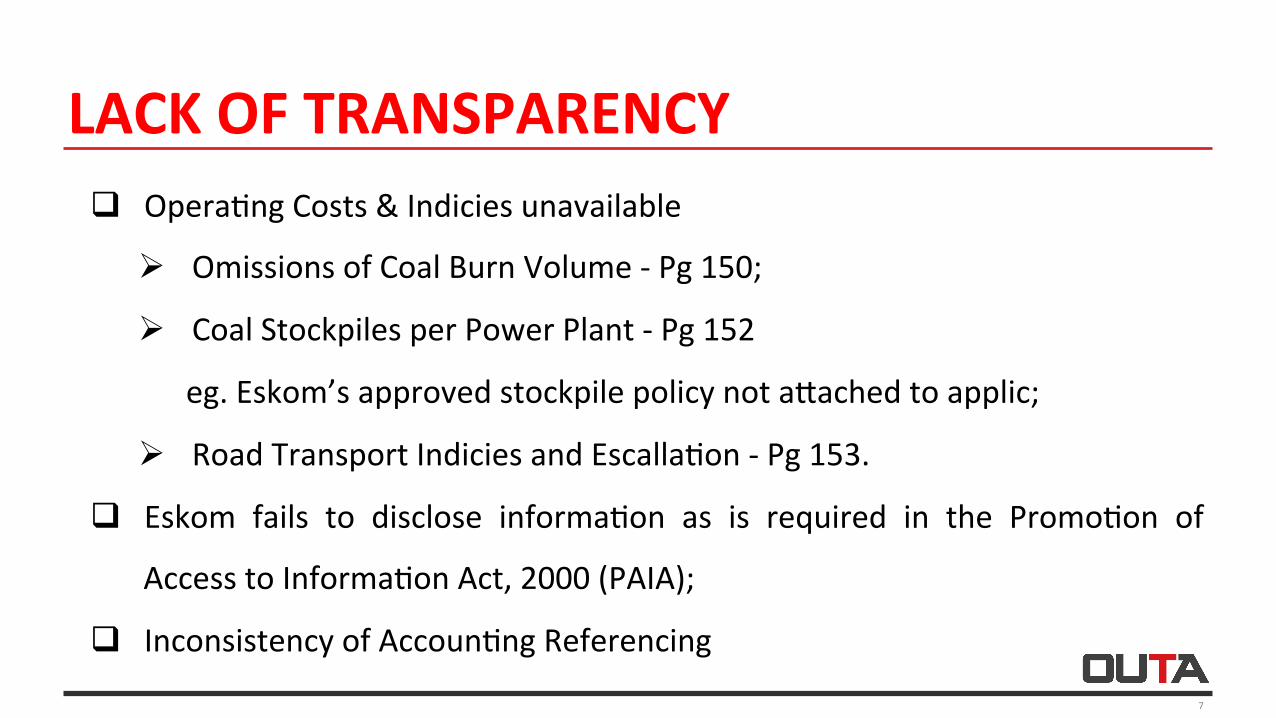
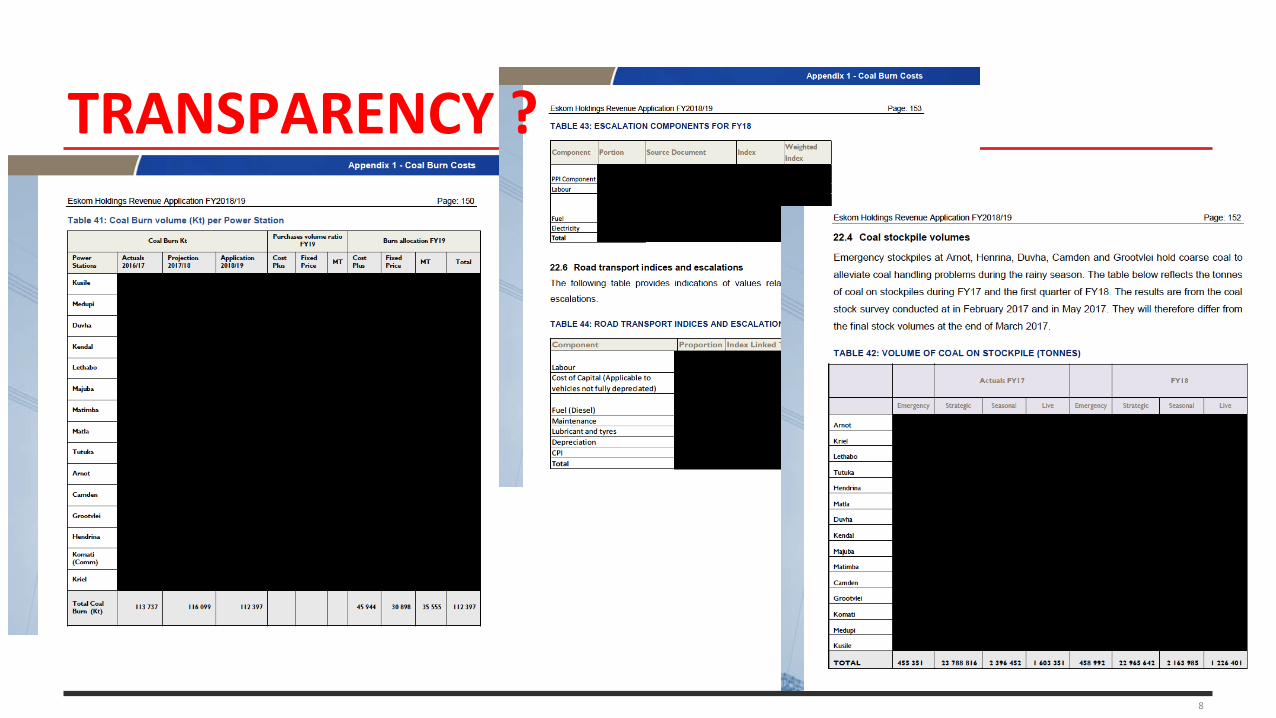
q Opera<ngCosts&IndiciesunavailableØ OmissionsofCoalBurnVolume-Pg150;
Ø CoalStockpilesperPowerPlant-Pg152
eg.Eskom’sapprovedstockpilepolicynotaiachedtoapplic;
Ø RoadTransportIndiciesandEscalla<on-Pg153.
q Eskom fails to disclose informa<on as is required in the Promo<on of
AccesstoInforma<onAct,2000(PAIA);
q InconsistencyofAccoun<ngReferencing
LACKOFTRANSPARENCY
8
TRANSPARENCY?
REGULATORY DECISION MAKING PROCESS q NERSA may use its discretion to in the application of the MYPD rules q Eskom’s lack (or inability) to provide full disclosure of material facts
hinders NERSA from making informed decision. q Is NERSA in a position to grant an increase? We believe not.
Ø NERSA cannot apply its mind objectively if not presented with relevant (and accurate) facts;
Ø Relevant facts = Accurate RAB, expenditure (coal procurement), etc
q Results in ineffective public participation (lack of transparency (incomplete /outdated information and data) – compromises integrity of the regulatory process.
9
10
q TheLegalframeworkrequiresthatEskommayonlyrecoveritscostsandearnareturnifitisan“efficientoperator”.
q Eskomhasbeenallowedtoincreaseitsheadcount/salarycostswellaheadofreasonableexpecta<ons,withproduc<vitydecliningby32%overpastdecade.
q CoalstockpileshavecostEskomalmostR1bninfinancecostsoverpast6years.
q Reportsofcoalqualityandauditprocessescompromised.
GROWINGINEFFICIENCIES
11
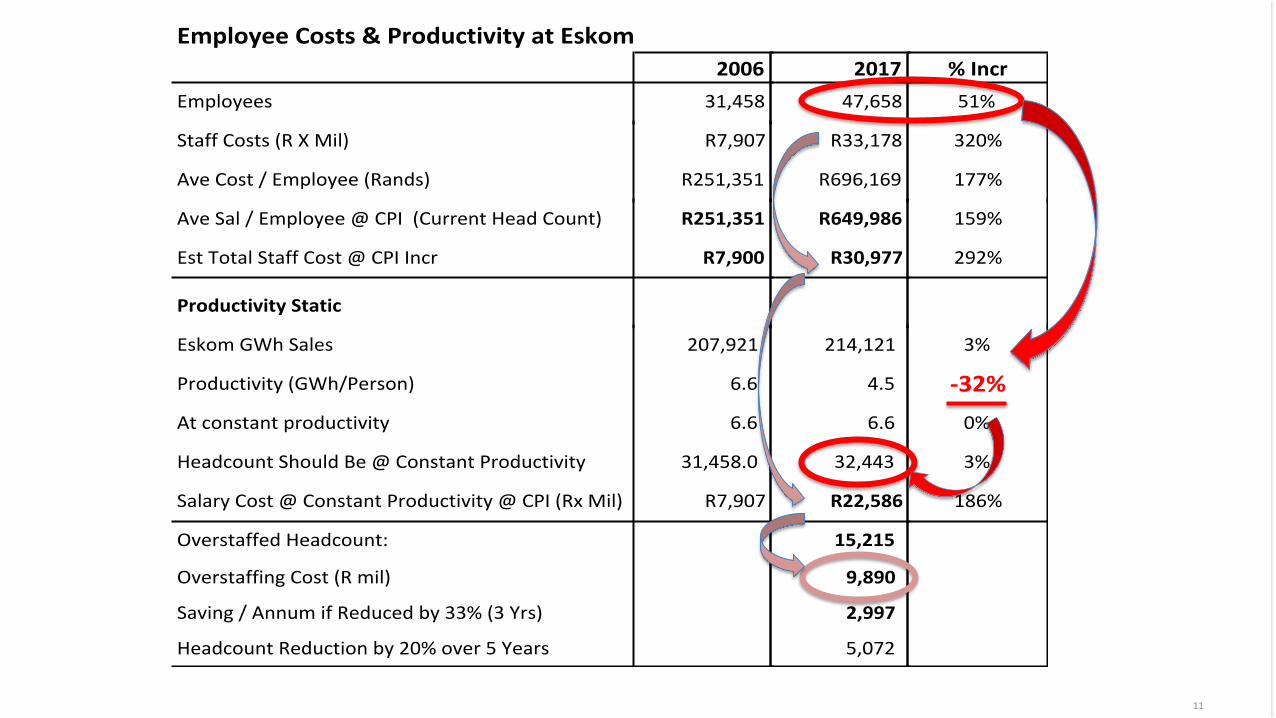
EmployeeCosts&ProductivityatEskom2006
Employees 31,458
201747,658
%Incr51%
StaffCosts(RXMil) R7,907
AveCost/Employee(Rands) R251,351
R33,178
R696,169
320%
177%
AveSal/Employee@CPI(CurrentHeadCount) R251,351
EstTotalStaffCost@CPIIncr R7,900
ProductivityStatic
R649,986
R30,977
159%
292%
EskomGWhSales 207,921
Productivity(GWh/Person) 6.6
Atconstantproductivity 6.6
HeadcountShouldBe@ConstantProductivity 31,458.0
SalaryCost@ConstantProductivity@CPI(RxMil) R7,907
OverstaffedHeadcount:
OverstaffingCost(Rmil)
Saving/AnnumifReducedby33%(3Yrs)
HeadcountReductionby20%over5Years
214,121
4.5
6.6
32,443
R22,586
15,215
9,890
2,997
5,072
3%
-32%0%
3%
186%
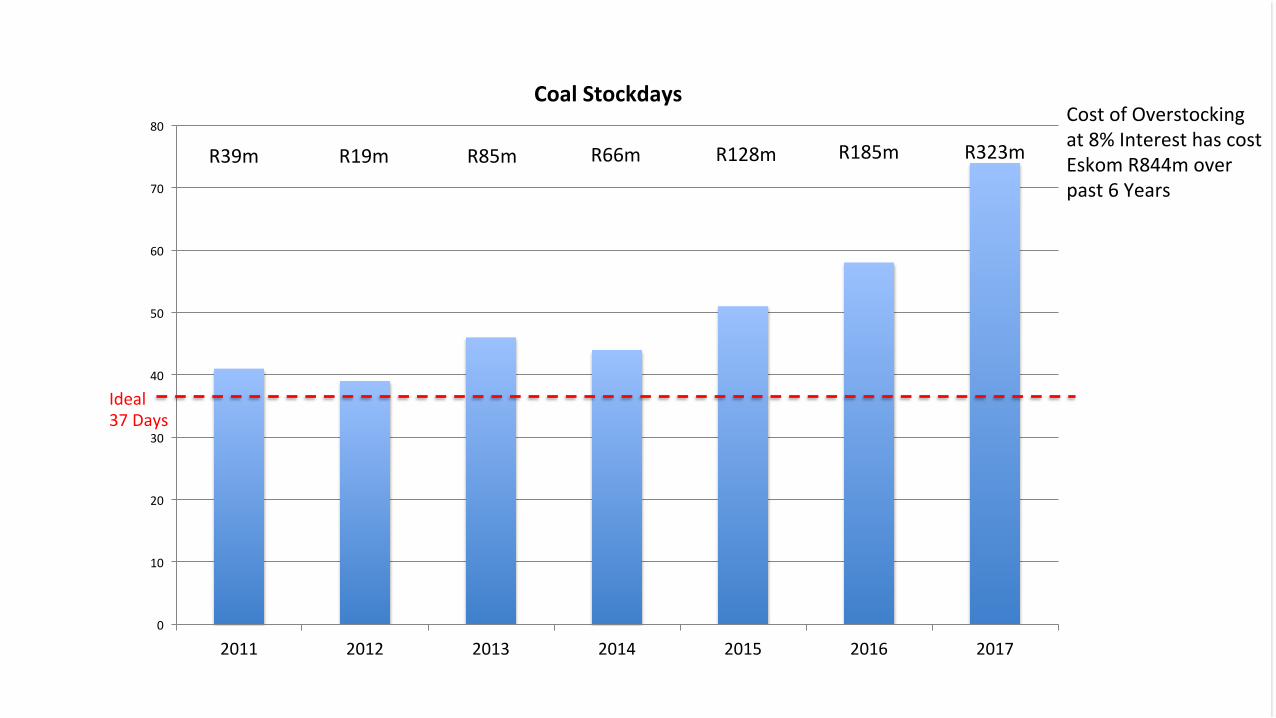
0
10
20
30
40
50
60
70
80
2011 2012 2013 2014 2015 2016 2017
CoalStockdays
Ideal37Days
CostofOverstockingat8%InteresthascostEskomR844moverpast6Years
R39m R19m R85m R66m R128m R185m R323m
13
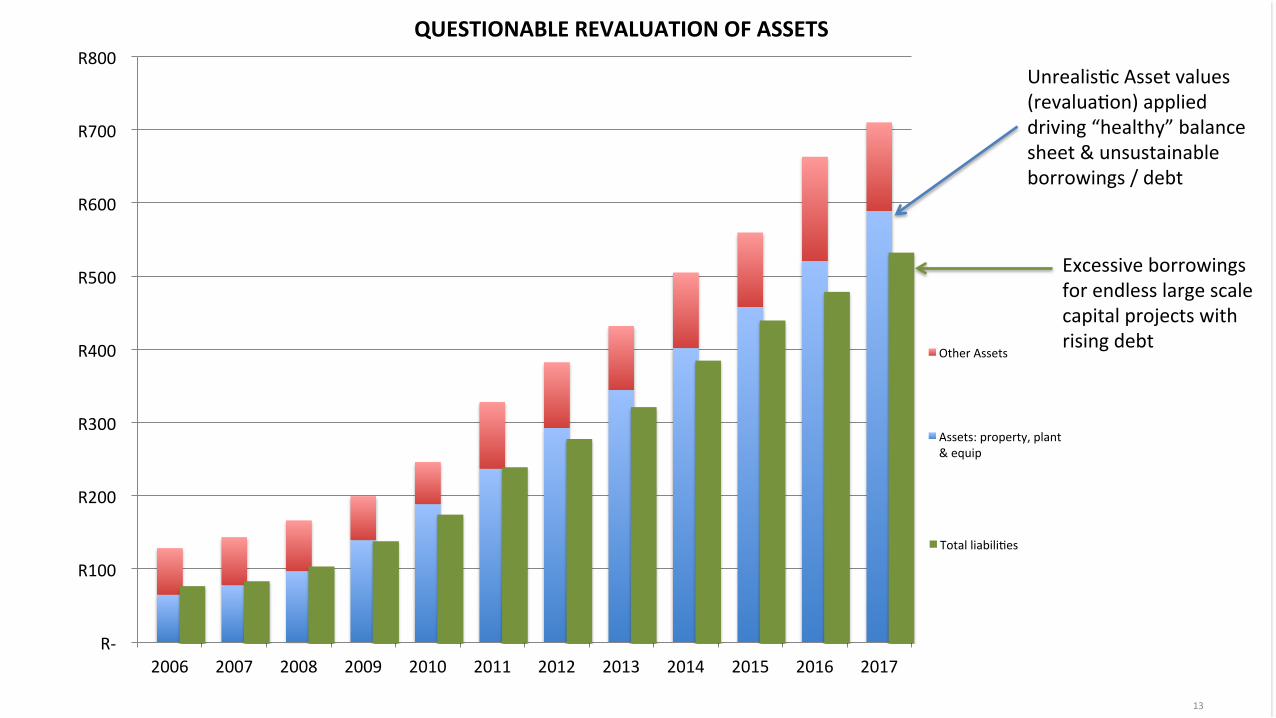
R-
R100
R200
R300
R400
R500
R600
R700
R800
2006 2007 2008 2009 2010 2011 2012 2013 2014 2015 2016 2017
OtherAssets
Assets:property,plant&equip
Totalliabili<es
QUESTIONABLEREVALUATIONOFASSETS
Excessiveborrowingsforendlesslargescalecapitalprojectswithrisingdebt
Unrealis<cAssetvalues(revalua<on)applieddriving“healthy”balancesheet&unsustainableborrowings/debt
14
R-
R100
R200
R300
R400
R500
R600
R700
R800
2006 2007 2008 2009 2010 2011 2012 2013 2014 2015 2016 2017
OtherAssets
Assets:property,plant&equip
Totalliabili<es
15
R-
R100
R200
R300
R400
R500
R600
R700
R800
2006 2007 2008 2009 2010 2011 2012 2013 2014 2015 2016 2017
OtherAssets
Assets:property,plant&equip
Totalliabili<es
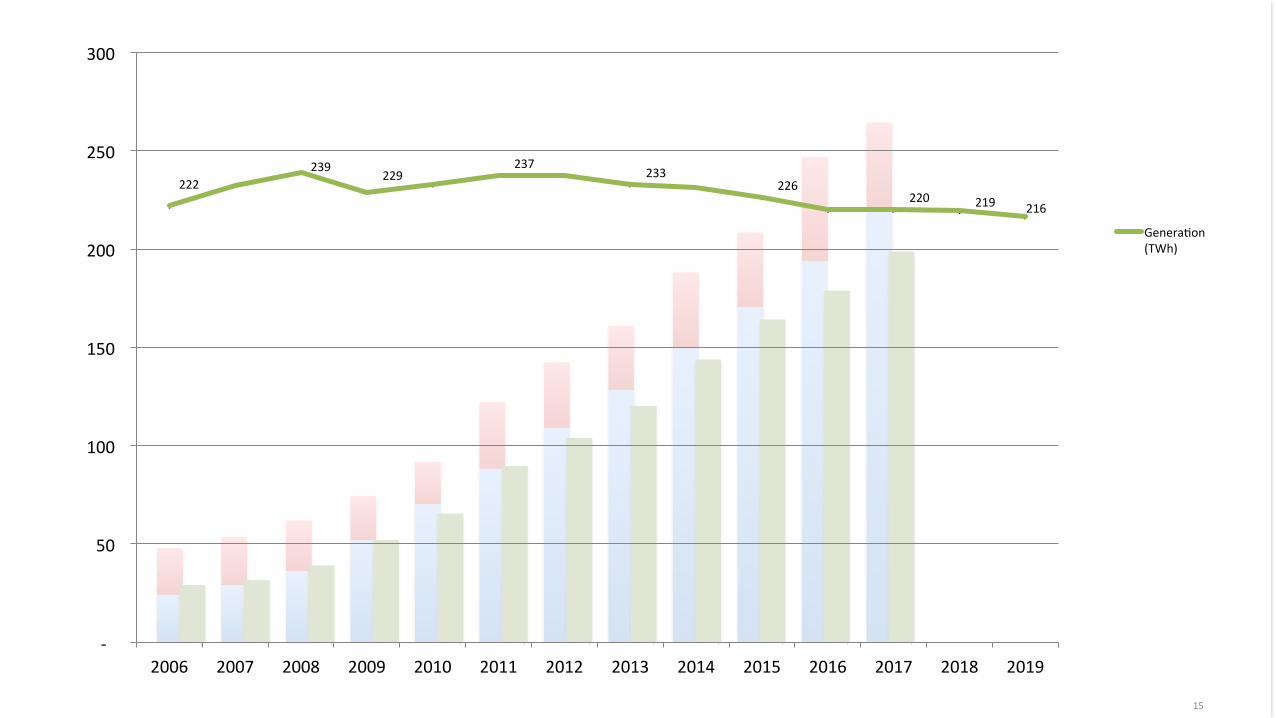
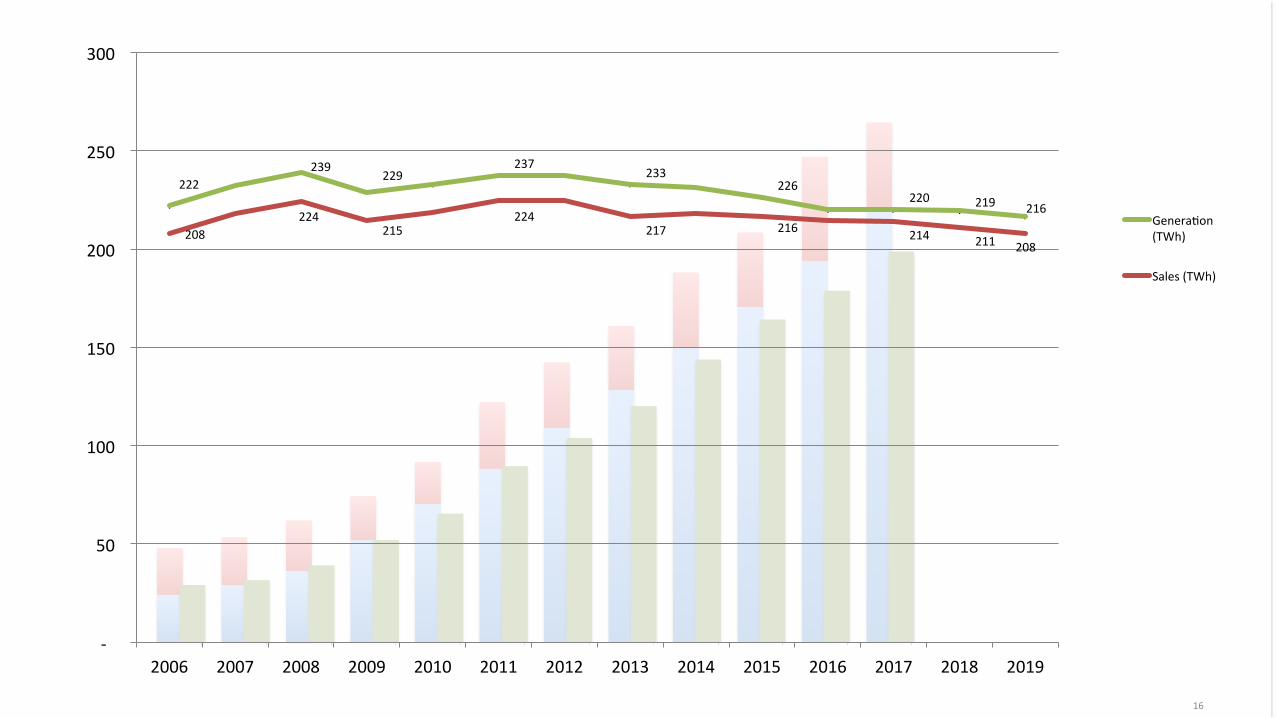
222239
229237
233226
220 219 216
-
50
100
150
200
250
300
2006 2007 2008 2009 2010 2011 2012 2013 2014 2015 2016 2017 2018 2019
Genera<on(TWh)
16
R-
R100
R200
R300
R400
R500
R600
R700
R800
2006 2007 2008 2009 2010 2011 2012 2013 2014 2015 2016 2017
OtherAssets
Assets:property,plant&equip
Totalliabili<es
222239
229237
233226
220 219 216
208224
215224
217 216 214 211 208
-
50
100
150
200
250
300
2006 2007 2008 2009 2010 2011 2012 2013 2014 2015 2016 2017 2018 2019
Genera<on(TWh)
Sales(TWh)
17
R-
R100
R200
R300
R400
R500
R600
R700
R800
2006 2007 2008 2009 2010 2011 2012 2013 2014 2015 2016 2017
OtherAssets
Assets:property,plant&equip
Totalliabili<es
222239
229237
233226
220 219 216
208224
215224
217 216 214 211 208
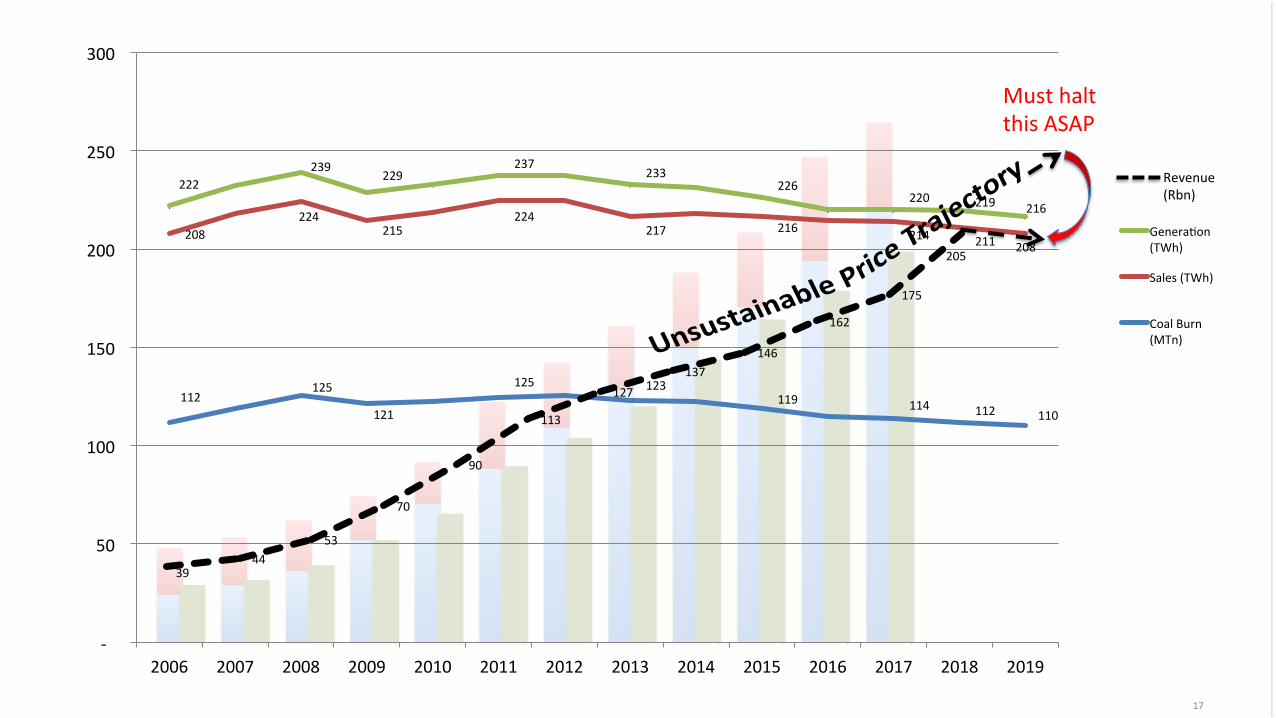
112125
121
125 123119 114 112 110
-
50
100
150
200
250
300
2006 2007 2008 2009 2010 2011 2012 2013 2014 2015 2016 2017 2018 2019
Genera<on(TWh)
Sales(TWh)
CoalBurn(MTn)
3944
53
70
90
113
127137
146
162
175
205
Revenue(Rbn)
MusthaltthisASAP

18
0.17 0.18 0.19 0.21 0.23 0.24 0.26 0.27 0.29 0.31 0.33 0.35 0.380.40
-
0.20
0.40
0.60
0.80
1.00
1.20
2006 2007 2008 2009 2010 2011 2012 2013 2014 2015 2016 2017 2018 2019
TariffifCPI+1%Applied
TariffifCPI+1%Applied
Effec<veTariff
(Rand/K
Whou
r)
19
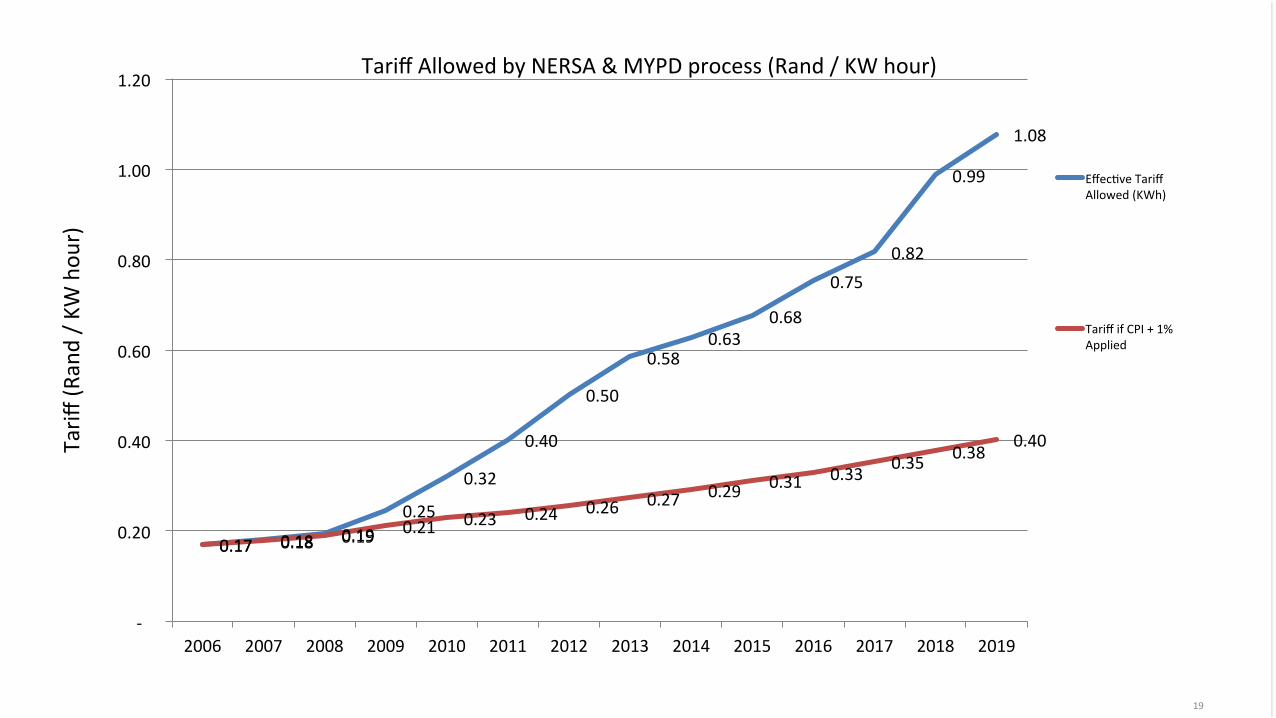
0.17 0.18 0.190.25
0.32
0.40
0.50
0.580.63
0.68
0.750.82
0.99
1.08
0.17 0.18 0.19 0.21 0.23 0.24 0.26 0.27 0.29 0.31 0.33 0.35 0.380.40
-
0.20
0.40
0.60
0.80
1.00
1.20
2006 2007 2008 2009 2010 2011 2012 2013 2014 2015 2016 2017 2018 2019
Effec<veTariffAllowed(KWh)
TariffifCPI+1%Applied
Tariff
(Rand/K
Whou
r)
TariffAllowedbyNERSA&MYPDprocess(Rand/KWhour)
20
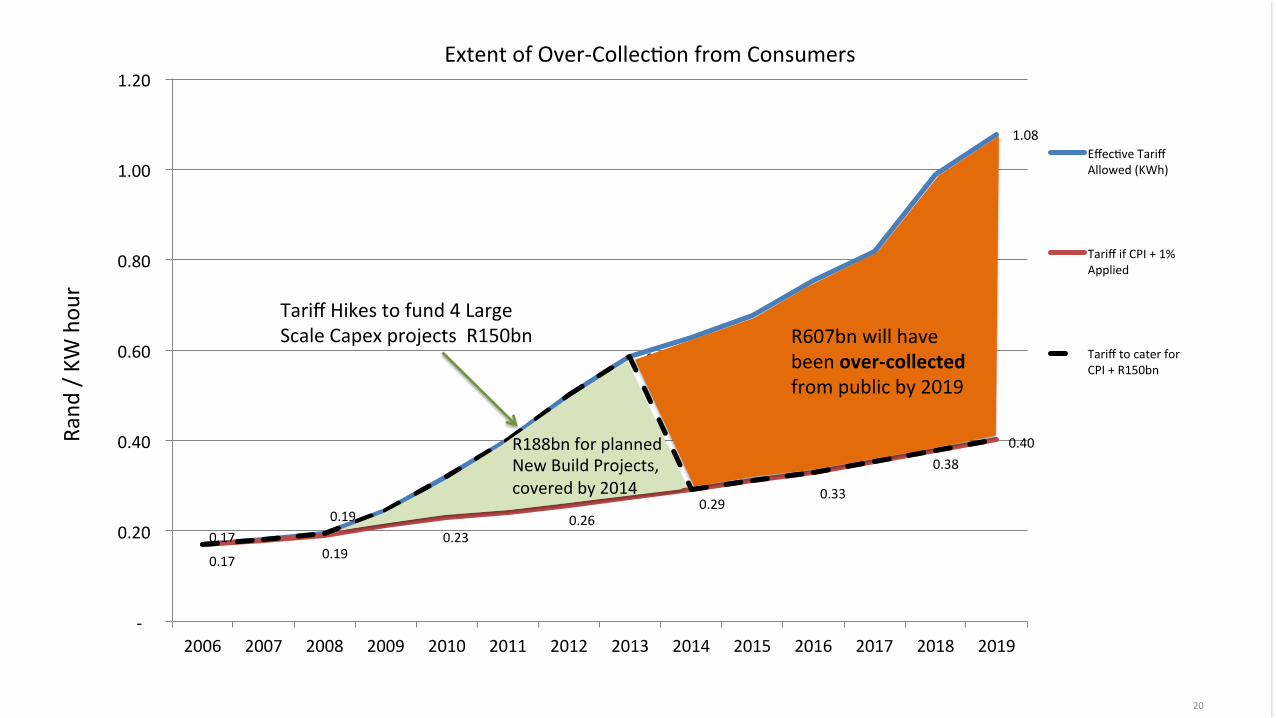
0.170.19 0.25
0.32
0.40
0.50
0.580.63
0.68
0.75
0.82
0.99
1.08
0.17 0.190.23
0.260.29
0.33
0.380.40
-
0.20
0.40
0.60
0.80
1.00
1.20
2006 2007 2008 2009 2010 2011 2012 2013 2014 2015 2016 2017 2018 2019
Effec<veTariffAllowed(KWh)
TariffifCPI+1%Applied
TarifftocaterforCPI+R150bn
TariffHikestofund4LargeScaleCapexprojectsR150bn
R188bnforplannedNewBuildProjects,coveredby2014
R607bnwillhavebeenover-collectedfrompublicby2019
Rand
/KW
hou
rExtentofOver-Collec<onfromConsumers
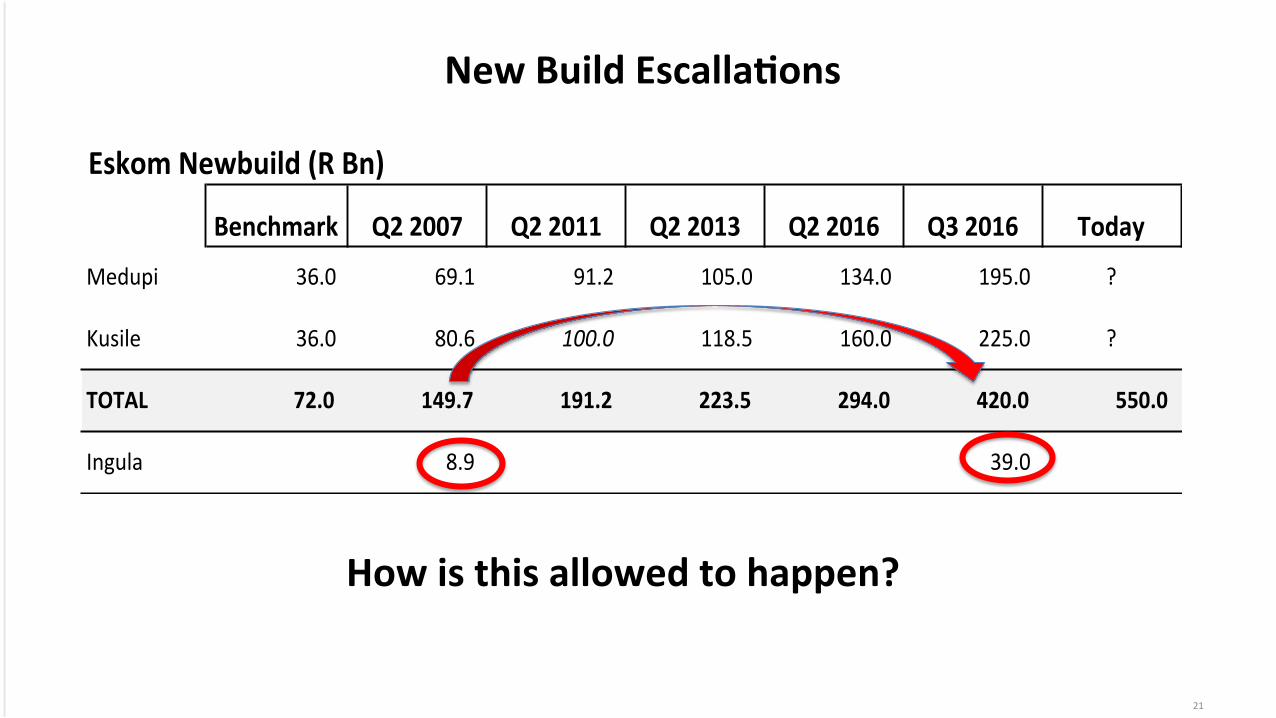
EskomNewbuild(RBn)
Benchmark Q22007 Q22011 Q22013 Q22016 Q32016 Today
Medupi 36.0 69.1 91.2 105.0 134.0 195.0 ?
Kusile 36.0 80.6 100.0 118.5 160.0 225.0 ?
TOTAL 72.0 149.7 191.2 223.5 294.0 420.0 550.0
Ingula 8.9 39.0
21
NewBuildEscallaNons
Howisthisallowedtohappen?
22
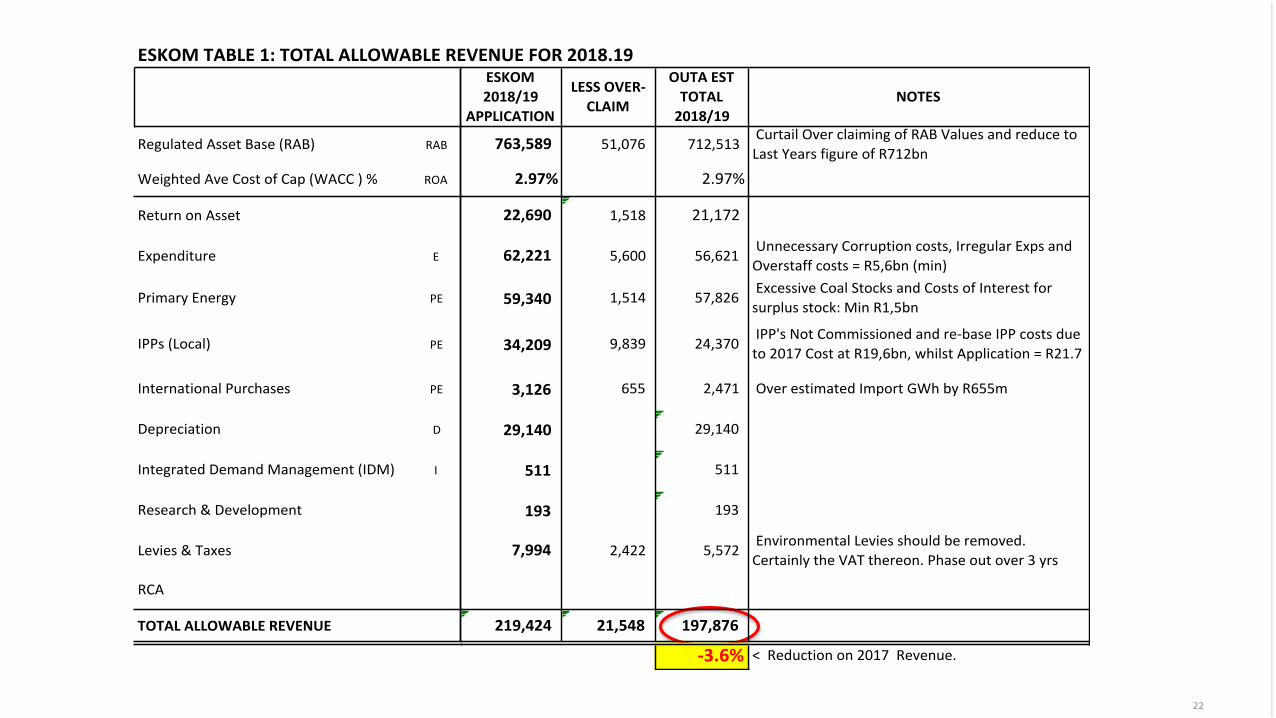
ESKOMTABLE1:TOTALALLOWABLEREVENUEFOR2018.19
RegulatedAssetBase(RAB) RAB
WeightedAveCostofCap(WACC)% ROA
ReturnonAsset
Expenditure E
PrimaryEnergy PE
IPPs(Local) PE
InternationalPurchases PE
Depreciation D
IntegratedDemandManagement(IDM) I
Research&Development
Levies&Taxes
RCA
TOTALALLOWABLEREVENUE
ESKOMTABLE1:TOTALALLOWABLEREVENUEFOR2018.19ESKOM2018/19
APPLICATION
LESSOVER-CLAIM
OUTAESTTOTAL2018/19
NOTES
763,589 51,076 712,513 CurtailOverclaimingofRABValuesandreducetoLastYearsfigureofR712bn
2.97% 2.97%
22,690 1,518 21,172
62,221 5,600 56,621 UnnecessaryCorruptioncosts,IrregularExpsandOverstaffcosts=R5,6bn(min)
59,340 1,514 57,826 ExcessiveCoalStocksandCostsofInterestforsurplusstock:MinR1,5bn
34,209 9,839 24,370 IPP'sNotCommissionedandre-baseIPPcostsdueto2017CostatR19,6bn,whilstApplication=R21.7
3,126 655 2,471 OverestimatedImportGWhbyR655m
29,140 29,140
511 511
193 193
7,994 2,422 5,572 EnvironmentalLeviesshouldberemoved.CertainlytheVATthereon.Phaseoutover3yrs
219,424 21,548 197,876
-3.6% <Reductionon2017Revenue.
23
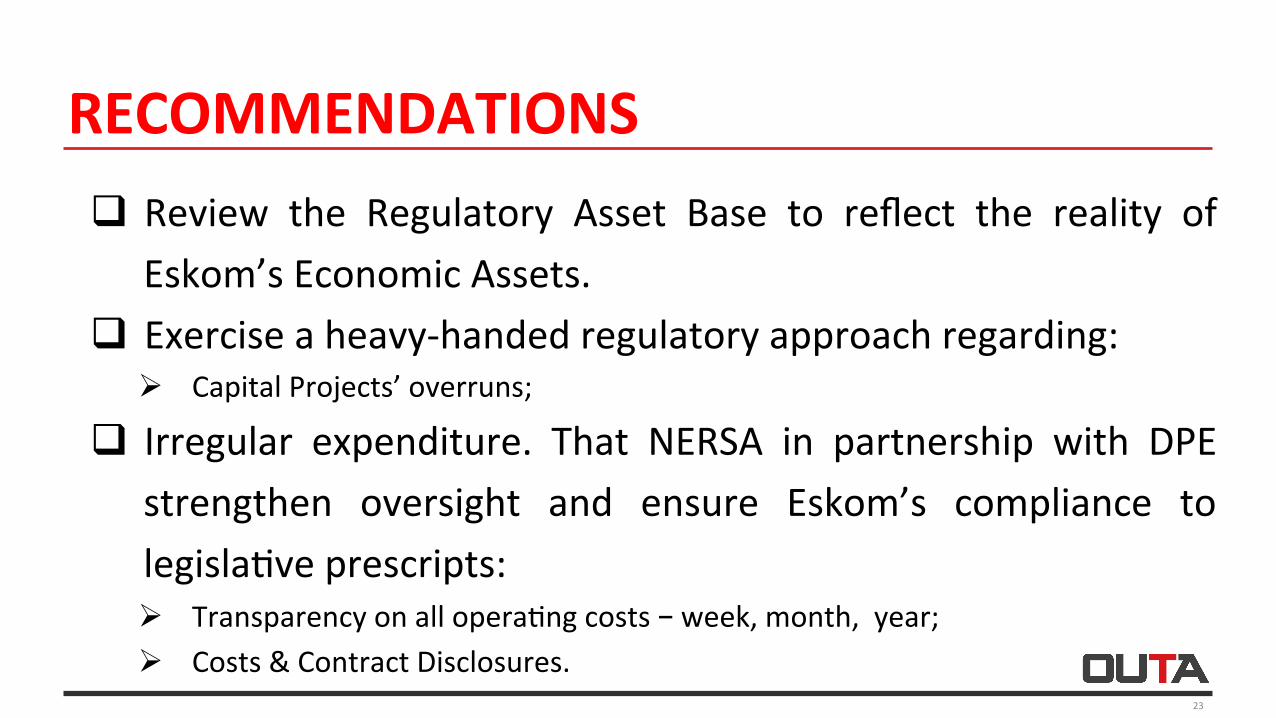
q Review the Regulatory Asset Base to reflect the reality ofEskom’sEconomicAssets.
q Exerciseaheavy-handedregulatoryapproachregarding:Ø CapitalProjects’overruns;
q Irregular expenditure. That NERSA in partnership with DPEstrengthen oversight and ensure Eskom’s compliance tolegisla<veprescripts:Ø Transparencyonallopera<ngcosts–week,month,year;Ø Costs&ContractDisclosures.
RECOMMENDATIONS
24
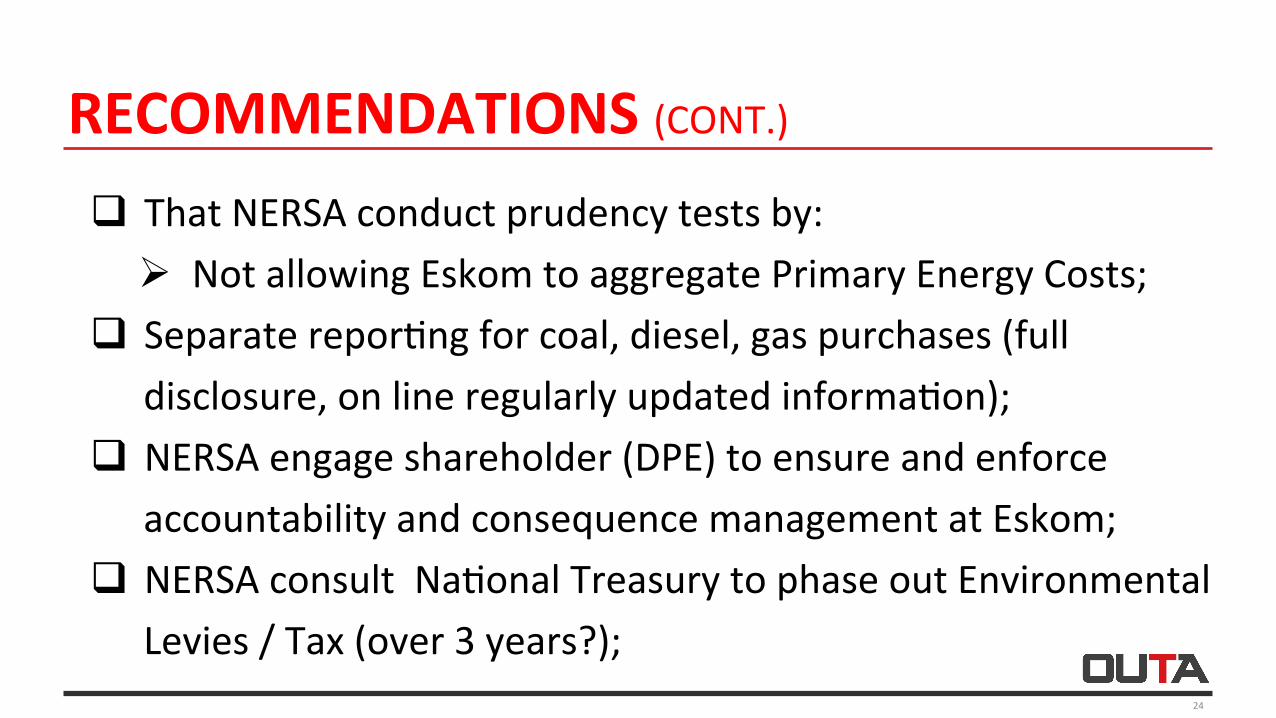
q ThatNERSAconductprudencytestsby:Ø NotallowingEskomtoaggregatePrimaryEnergyCosts;
q Separaterepor<ngforcoal,diesel,gaspurchases(fulldisclosure,onlineregularlyupdatedinforma<on);
q NERSAengageshareholder(DPE)toensureandenforceaccountabilityandconsequencemanagementatEskom;
q NERSAconsultNa<onalTreasurytophaseoutEnvironmentalLevies/Tax(over3years?);
RECOMMENDATIONS(CONT.)
25
q Review/replaceMYPDMethodology/Rules(notworking?);q NERSAmakerecommenda<onstoGovernmentfor
separa<onofGenera<on,TransmissionandDistribu<on(unbundling–OUTAhaslodgedwithCompCommission);
q ThatNERSAlobbyrelevantauthori<estoestablishanindependentinquiryintotheaffairsoftheSouthAfricanElectricitySupplyIndustry(anewenergyroadmap);
RECOMMENDATIONS(CONT.)
26
q Eskomshouldsubmitausterityplanoncostreduc<onsoveraperiodof3-5years(includingpersonnelcosts):Ø Plansonhowitwilladdressthedecliningsalesversusopera<ngcosts.
q Thatthenumberofdaysforcoalstockpilesmustberegulated:Ø NERSAmustsetthebenchmark/minimumthreshold.
q Eskomtosubmitcomprehensive&<me-bounddecommissioningplanofpowerplantsandassociatedcosts.
RECOMMENDATIONS(CONT.)

CONCLUDING REMARKS q Submission of incomplete and outdated information compromises the
integrity of the regulatory process and denies the public ability to make constructive inputs/analysis of its revenue requirement application: Ø NERSA should ensure that Eskom submits ALL the required information in terms
of the MYPD Rules – to make informed decisions on the proposed tariff increase.
q NERSA should not grant approval for ANY tariff increases for the 2018/19 financial year.
q Regulatory decisions should be premised on the principle of economic realities and affordability for electricity users.
27