Embed Size (px)
Citation preview
Eşleştirme Projesi TR 08 IB EN 03 IPPC – Entegre Kirlilik Önleme ve Kontrol
T.C. Çevre ve Şehircilik Bakanlığı
1
BAT Guide for coal and lignite
large combustion plants Project TR-2008-IB-EN-03
Mission no: 2.1.4.a.3
Prepared by:
José Francisco Alonso
José Antonio Vázquez
Maria José Blanco
Rocío Jiménez
Jaime Fernández
Agustín Díaz
Aurora Sáez
Anxo Mourelle
César Seoánez
Ece Tok
Şaziye Savaş
Özlem Gülay
Önder Gürpınar
Yavuz Yücekutlu
Ayşegül Bahayetmez
Halıl Özcan
Ayberk Kırbıyık
Subitay Sencan
Gülben Gülcar
Yavuz Sucu
Ferda Bayrak
June 2012
Eşleştirme Projesi TR 08 IB EN 03 IPPC – Entegre Kirlilik Önleme ve Kontrol
T.C. Çevre ve Şehircilik Bakanlığı
2
GLOSSARY AND ABBREVIATIONS
ABBREVIATIONS MEANING
AFBC atmospheric fluidised bed combustion
AFBG atmospheric circulating fluidised bed gasifier
AMS automated measuring systems
AST annual monitoring test
AOX adsorbable organic halogen compounds. The total concentration in milligrams per litre, expressed as chlorine, of all halogen compounds (except fluorine) present in a sample of water that are capable of being adsorbed on activated carbon
BAT best available techniques
BFB bubbling fluidised bed
BFBC bubbling fluidised bed combustión
BOD biochemical oxygen demand: the quantity of dissolved oxygen required by micro-organisms in order to decompose organic matter. The unit of measurement is mg O2/l.
BOOS burner out of service
BREF BAT reference document
CCP coal combustion products
CEM continuous emission monitoring
CEMS continuous emission monitoring system
CEN European Committee for Standardisation
CFB circulating fluidised bed
CFBC circulating fluidised bed combustion
COD chemical oxygen demand: the amount of potassium dichromate, expressed as oxygen, required to chemically oxidise at approximately 150 °C substances contained in waste water
daf dry and ash free basis
DBB dry bottom boiler
DENOx denitrification
DESONOX a particular SOX and NOX reduction technique
DESOX a desulphurisation technique
ECS European committee for standardization
EIA environmental impact assesment
ELV emission limit values
EOX extractable organic halogens
ESP electrostatic precipitator
EWC European Waste Catalogue
FBC fludised bed combustion
FBCB fludised bed combustion boiler
FF fabric filter
FGD flue-gas desulphurisation
GF grate firing
IED Industrial Emission Directive
ISO International Standard Official
IEP integrated environmentalpermit
Eşleştirme Projesi TR 08 IB EN 03 IPPC – Entegre Kirlilik Önleme ve Kontrol
T.C. Çevre ve Şehircilik Bakanlığı
3
LCP large combustion plant
LHV lower heating value
PAHs polyaromatic hydrocarbons
PC pulverised combustion
PFBC pressurised fluidised bed combustion
PCB polychlorinated benzenes
PCDD polychlorinated-dibenzo-dioxins
PCDF polychlorinated-dibenzo-furans
Pm Primary measures
PM10 particles < 10μm in diameter
PFBC pressurised fluidised bed combustion
QAL Quality assurance level
RENP reduction emission national plan
SACR selective autocatalytic reduction
SCR selective catalytic reduction
SNCR selective non catalytic reduction
SRM standard reference method
TNP transitory national plan
TOC total organic carbon
VOCs volatile organic compounds
WWTP waste water treatment plant
COMMON UNITS, MEASUREMENT AND SYMBOLS
TERM MEANING
atm normal atmosphere (1 atm = 101325 N/m2)
bar bar (1.013 bar = 1 atm)
°C degree Celsius
cm centimetre
d day
G gram
GJ gigajoule
GW gigawatt
GWh gigawatt hours. Note also TWh, MWh, kWh
GWhe gigawatt hours electical. Note also TWhe, MWhe, kWhe
Hz hertz
h hour
J joule
K kelvin (0 oC = 273.15 K)
kcal kilocalorie (1 kcal = 4.19 kJ)
kg kilogram
kJ kilojoule (1 kJ = 0.24 jkcal)
kPa kilopascal
kt kilotonne
kWh kilowatt-hour (1 kWh = 3600 kJ = 3.6 MJ)
l litre
Eşleştirme Projesi TR 08 IB EN 03 IPPC – Entegre Kirlilik Önleme ve Kontrol
T.C. Çevre ve Şehircilik Bakanlığı
4
m metre
m2 square metre
m3 cubic metre
mg milligram (1 mg = 10-3 gram)
MJ megajoule (1 MJ = 1000 kJ = 106 joule)
mm millimetre (1 mm = 10-3 m)
m/min metres per minute
Mt megatonne (1 Mt = 106 tonne)
MWe megawatts electric (energy)
MWth megawatts thermal (energy)
ng nanogram (1 ng = 10-9 gram)
Nm3 normal cubic metre (101.325 kPa, 273 K)
Pa pascal
ppb parts per billion
ppm parts per million (by weight)
ppmvd parts per million in volume for dry gases
ºR degree rankine
s Second
t metric tonne (1000 kg or 106 gram)
T-s temperature-entropy
t/yr tonne(s) per year
V volt
vol-% percentage by volume. (Also % v/v)
wt-% percentage by weight. (Also % w/w)
yr Year
µm micrometre (1 µm = 10-6 m)
LIST OF CHEMICAL ELEMENTS
SYMBOL NAME
As arsenic
Cd cadmium
Cl chlorine
Cr chromium
Cu copper
Hg mercury
Ni nickel
Pb lead
Se selenium
V vanadium
Zn zinc
LIST OF COMPOUNDS
SYMBOL NAME
CO carbon monoxide
CO2 carbon dioxide
Eşleştirme Projesi TR 08 IB EN 03 IPPC – Entegre Kirlilik Önleme ve Kontrol
T.C. Çevre ve Şehircilik Bakanlığı
5
HF hydrofluoric acid
HCl hydrochloric acid
HgCl2 mercuric chloride
NH3 ammonia
NO2 nitrogen dioxide
N2O nitrous oxide
NO3 nitric oxide
NOx nitrogen oxides, mixture of NO and NO2
O2 oxygen
CaO calcium oxide
SO2 sulphur dioxide
SOx sulphur oxides
Other compounds appear in chapter 5.
INDEX
1.2.- Coal power plants in Turkey............................................................................................ 12
1.2.2.- Fuels used................................................................................................................. 14
Eşleştirme Projesi TR 08 IB EN 03 IPPC – Entegre Kirlilik Önleme ve Kontrol
T.C. Çevre ve Şehircilik Bakanlığı
6
1.2.3- Relevant aspects of Turkish Power Plants related to the emission limits
implementation ................................................................................................................... 15
2. Technological Processes, Technologies and Techniques description in the hard coal and
lignite combustion ....................................................................................................................... 16
2.1. General Overview of Combustion Processes with solid fuels: hard coal & lignite. ......... 17
2.1.1 Overview of the combustion process......................................................................... 17
2.1.2 Different processes using solid fuels: coal and lignite ............................................... 18
2.2. Main Aspects to Consider for the determination of the Best Available Techniques (BAT)
in the coal / lignite combustion .............................................................................................. 20
2.2.1. Techniques for the unloading, storage and handling of fuel and additives ............. 22
2.2.2- Techniques for fuel pretreatment ............................................................................ 23
2.2.3.- Techniques to increase efficiency and fuel utilisation ............................................. 25
2.2.4 - Techniques for the prevention and control of dust and particle-bound heavy metal
emissions ............................................................................................................................. 28
2.2.5 - Techniques fot the prevention and control of SO2 emissions ............................... 29
2.2.7 – Techniques to prevent and control water pollution ............................................... 34
2.3.-Solid fuel storage and Treatment. ................................................................................... 36
2.3.1 Unloading, storage and handling of coal and lignite .................................................. 36
2.4. - Additional treatments for the solid fuel used in the power plant ................................. 37
2.4.1. Pretreatment of coal and lignite ............................................................................... 37
2.4.2. Fuel preparation ........................................................................................................ 39
2.5. Fluidised bed combustion (bubbling and circulating fluidised bed Techniques) ............. 43
2.5.1. Fluidised bed ............................................................................................................. 43
2.6. Thermal efficiency ............................................................................................................ 45
2.6.1. Boiler efficiency ......................................................................................................... 45
2.6.2. Techniques to increase coal-fired boilers efficiency ................................................. 46
2.7. Process examples. ............................................................................................................ 46
2.8. Overview and temporal evolution of traditional combustion techniques: Pulverised coal
and peat combustion; greats and Stokers .............................................................................. 47
2.9. - Auxiliary Processes and Potential Environmental Issues ............................................... 48
2.9.1. Landfill management ................................................................................................. 48
2.9.2. Environmental issues in the coal mining ................................................................... 53
2.9.3. Water management .................................................................................................. 54
3. Current Levels emission, energy and raw material Consumption .......................................... 62
3.1. Emissions to air and odournuisance risks. Environmental monitoring and control. ....... 62
Eşleştirme Projesi TR 08 IB EN 03 IPPC – Entegre Kirlilik Önleme ve Kontrol
T.C. Çevre ve Şehircilik Bakanlığı
7
3.1.1 Emissions to air .......................................................................................................... 62
3.1.2. Odour nuisance Risks ................................................................................................ 65
3.1.3. Environmental monitoring and control ..................................................................... 66
3.2. Wastewater Discharges and Monitoring Programme...................................................... 68
3.3. Waste generation. Waste landfilling. ............................................................................... 70
3.4. Noise and vibration issues ................................................................................................ 73
3.5. Soil and groundwater Pollution Risks ............................................................................... 75
3.6. Raw Materials Consumption ............................................................................................ 75
3.7. Energy consumption ........................................................................................................ 76
4. Best Available Techniques in the Hard Coal and Lignite Combustion at power plants. ......... 77
4.1.- Fuel Consumption reduction and thermal efficiency maximization. ............................. 78
4.1.1. Fuel pretreatment ..................................................................................................... 78
4.1.2. Combustion ............................................................................................................... 78
4.1.3. Thermal efficiency ..................................................................................................... 78
4.2. BAT to reduce the air emissions. ...................................................................................... 80
4.2.1. Techniques for reducing dust emissions and emission limit values (ELVs) ............... 80
4.2.2. Techniques for reducing NOx emissions and ELVs associated to BAT. ..................... 82
4.2.3. Techniques for reducing SO2 emissions and ELVs associated to BAT. ...................... 86
4.2.4. Techniques for reducing CO emissions and ELVs associated to BAT. ....................... 88
4.2.5. Techniques for reducing heavy metals emissions and ELVs associated to BAT. ....... 89
4.2.6. Other emissions (chlorides,ammonia…) ................................................................... 89
4.3. BAT to reduce the pollutants load of wastewaters. ......................................................... 90
4.3.1. Preventive measures to reduce water consumption and water pollution ............... 90
4.3.2. Measures to readuce waste water emissions. .......................................................... 91
4.3.3. Wastewater flow rate and pollutants concentration. ............................................... 92
4.4. BAT to reduce soil and groundwater pollution risks. ....................................................... 92
4.4.1. Management of the waste produced. ...................................................................... 92
4.4.2. BATs and best practices to avoid soil and groundwater pollution............................ 93
4.4.3. Reutilization of combustion waste and subproducts. ............................................... 93
4.5. Measures to control noise emissions. .............................................................................. 96
4.6. BAT for the environmental management. ....................................................................... 96
5. CONTROL AND EMISSION MONITORING ................................................................................ 99
5.1 AIR ..................................................................................................................................... 99
Eşleştirme Projesi TR 08 IB EN 03 IPPC – Entegre Kirlilik Önleme ve Kontrol
T.C. Çevre ve Şehircilik Bakanlığı
8
5.1.1 Emissions .................................................................................................................... 99
5.1.2. Air quality ................................................................................................................ 106
5.2. WASTE WATERS.............................................................................................................. 122
5.2.1. Selection of parameters and pollutants ................................................................. 122
5.2.2. Operating Conditions and measurement techniques ............................................ 129
5.3. SOIL AND GROUND WATERS .......................................................................................... 130
5.4 ENVIRONMENTAL MONITORING AND CONTROL PLAN. ....................................... 132
6. EMERGING TECHNIQUES ....................................................................................................... 134
6.1 Pre-dryer of lignite with low temperature heat .............................................................. 134
6.2 Simultaneous control of SOX, NOX and mercury ............................................................. 135
6.3 CO2 capture and storage (CCS) ........................................................................................ 136
ANNEX I: EXAMPLE OF TECHNIQUES BASED ON BATs USED IN 4 SPANISH SOLID FUEL LCPs,
AND RELATED INVESTMENTS OF SOME OF THEM .................................................................... 139
ANNEX II: Relevant Turkish and European technical regulations on measurements of air
immissions. ................................................................................................................................ 143
ANNEX III. CHECK-LISTS TO BE USED IN THE ASSESSMENT OF THE PERMIT APPLICATION ...... 146
BREF SECTIONS TO BE TAKEN INTO ACCOUNT TO ESTABLISH THE PERMIT’S CONDITIONS . 148
ANNEX IV: DETERMINATION OF START-UP AND SHUT-DOWN PERIODS FOR POWER PLANTS:
COMMISSION IMPLEMENTING DECISION ................................................................................. 149
ANNEX V: Parameters to consider in discharges to water from a solid-fuel LCP ..................... 153
ANNEX VI: EMISSION LIMIT VALUES FOR PM, CO, SO2 AND NOx ACCORDING TO CURRENTLY
NATIONAL APPLICABLE LEGISLATION AND TO THE INDUSTRIAL EMISSIONS DIRECTIVE
2010/75/EU (IED) ...................................................................................................................... 156
Eşleştirme Projesi TR 08 IB EN 03 IPPC – Entegre Kirlilik Önleme ve Kontrol
T.C. Çevre ve Şehircilik Bakanlığı
9
INTRODUCTION
This guide forms part of the work by the Ministry of Environment and Urbanism of Turkey
(MoEU) to align the environmental policies to the standards of the European Union. Within
this context, one of the key targets is the alignment with the specifications stated the
Industrial Emissions Directive 2010/75/EU, which establish an integrated environmental
permits system. According to the Directive, the environmental conditions established in the
new integrated environmental permits must be based on the so-called conclusions on Best
Available Techniques (BATs) and the associated Emission Levels (AELs), which are described in
a series of BATs Reference Documents (BREFs).
The objective is that the integrated environmental permitting system will be applied to new
installations constructed after the publication of the by-law, 3 years after the date of
publication of the by-law.
It is foreseen to give at least 10 years time to existing installations, which have already started
their activities before the publication of the by law, for the adaptation of the requirements of
the by law. There will be need for guidance documents, guides, etc. in order to ensure that this
transition period will pass without problems for the industry as well as for the competent
authority.
The excessive length and wide scope of the EU BREF for Large Combustion Plants (LCPs), plus
the importance of the coal and lignite LCPs in Turkey were the reasons to prepare at first a BAT
National Guide for Coal and Lignite LCPs, more understandable and adapted to the
characteristics of the subsector in Turkey, including in addition other information practical for
both this industry and the staff of the MoEU. Moreover, it may serve as well to communicate
to a broader audience the main characteristics of the sector and its main pollution abatement
techniques, given its simple and concise style.
The objectives of this guide are the following:
- Present an overview of the sector’s environmental performance in Turkey, (Chapters 1
& 3).
- Describe the processes, technologies and techniques particular of this kind of industry
(Chapter 2).
- Discuss the BATs and some emerging techniques to increase the environmental
performance, and present the ranges of AELs to them whenever this is possible
(Chapters 4 & 6).
- Discuss the available tools and methods to monitor and control the environmental
impacts of the installations (Chapter 5).

Eşleştirme Projesi TR 08 IB EN 03 IPPC – Entegre Kirlilik Önleme ve Kontrol
T.C. Çevre ve Şehircilik Bakanlığı
10
- Provide in some annexes useful reference tools, such as a check list of the contents
that an integrated environmental permit for a coal or lignite LCP should have.
This guide will be used by the industry and by the competent authority within the
integrated environmental permitting procedure in order to determine the permit
conditions containing BAT associated ELV’s.
Eşleştirme Projesi TR 08 IB EN 03 IPPC – Entegre Kirlilik Önleme ve Kontrol
T.C. Çevre ve Şehircilik Bakanlığı
11
1. General information on Electricity Production from Coal in
the Turkish Energy Sector
Increase of input of local sources to the national economy, carrying out activities in the field of
energy in a environmental friendly way, increase of energy efficiency are some of the main
objectives of the energy policy based on Turkey’s energy supply security.
According to the strategy document on electrical energy market and supply security published
in the year 2009, our target is to use all local lignite and pit coal and our hydrolic potential for
electricity production purposes up to 2023.
Within this frame it is very important to take the necessary measures to ensure that the
negative environmental impact will be minimum during the construction and operation phase
of installations which have to be established for electricityproduction by using coal in the
energy sector and it is also important to generalize the use of technices/technologies for the
combustion of clean coal.
1.1.- IMPLEMENTATION OF THE DIRECTIVE ON INDUSTRIAL
EMISSIONS IN THE SECTOR OF COAL COMBUSTION PLANTS
1.1.1.- National Legislation transposing the permitting requirements of
the Directive on Industrial Emissions. Other sectoral legislation
applicable to the sector.
The Ministry of Environment and Urbanism is drafting the By-Law on Integrated Environmental Permits, that will transpose the permitting requirements stated in chapters 1 and 2 of the Directive on Industrial Emissions 2010/75/EU. Explanations about how to implement in practice this new By-Law are provided in the guidance document “Integrated Environmental Permits: Supporting guideline for the Applicants” .
The list of current national environmental legislation of relevance for the environmental permitting of coal and lignite large combustion plants is provided in Annex VII.
1.1.2.- Installations regulated under this legislation and covered by this
guidance
Eşleştirme Projesi TR 08 IB EN 03 IPPC – Entegre Kirlilik Önleme ve Kontrol
T.C. Çevre ve Şehircilik Bakanlığı
12
The installations covered by this guidance which are subject to the legislation mentioned in section 1.1.1 are the ones fulfilling both of the following conditions:
- installations with a total rated thermal input of 50 MW or more,
- burning lignite or hard coal.
1.1.3.- Administrative procedure to apply for the Integrated
Environmental Permit.
The administrative procedure is explained in detail in chapter 5 of the guidance document “Integrated Environmental Permits: Supporting guideline for the Applicants” .
1.2.- Coal power plants in Turkey.
1.2.1.- Coal power plants: General description
When we make an assessment according to the sources used for coal energy production, as of
the year 2011 approximately 18.2% local coal, 10% imported coal was used for total electricity
production. According to the energy policy strategy document it can be foreseen that the
percentage of coal usage will increase in the future. EÜAŞ, which is the institution responsible
for the operation of the publicly owned power plants and electricity production, has an
installed capacity of 24.200 MW which corresponds to the 45,46% of the installed capacity of
Turkey as the year 2011. The 32,07% of this capacity is based on lignite and hard coal. By
producing a total of 92.333 GWh electric energy a 40,42% of the production of Turkey was
supplied. 61,3% of the electrical energy produced in power plants are
Taking into consideration the proportion in the energy production of coal powered energy
producing installations that are established /will be established, operated/will be operated by
the government or private sector, it is essential that suitable measures are taken in order to
decrease their environmental impact and efficient application of environmental protection
systems.
Name of the Power Plant Installed
capacity
Number
of units
Eşleştirme Projesi TR 08 IB EN 03 IPPC – Entegre Kirlilik Önleme ve Kontrol
T.C. Çevre ve Şehircilik Bakanlığı
13
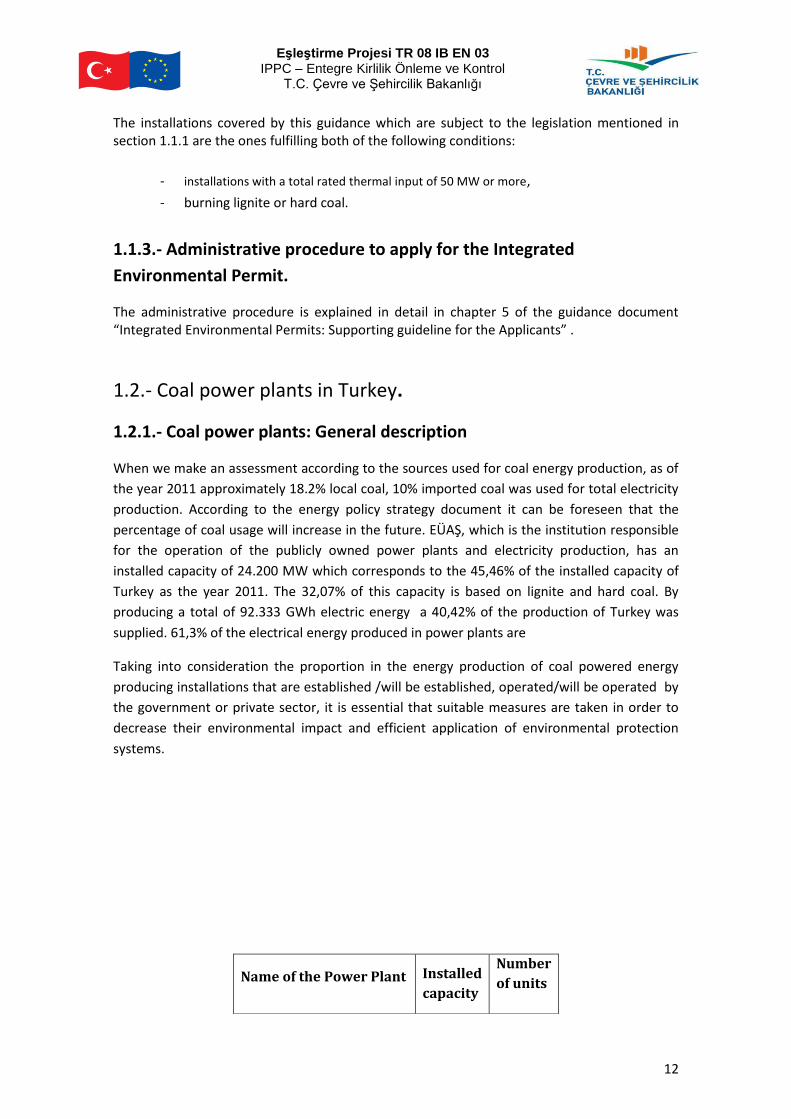
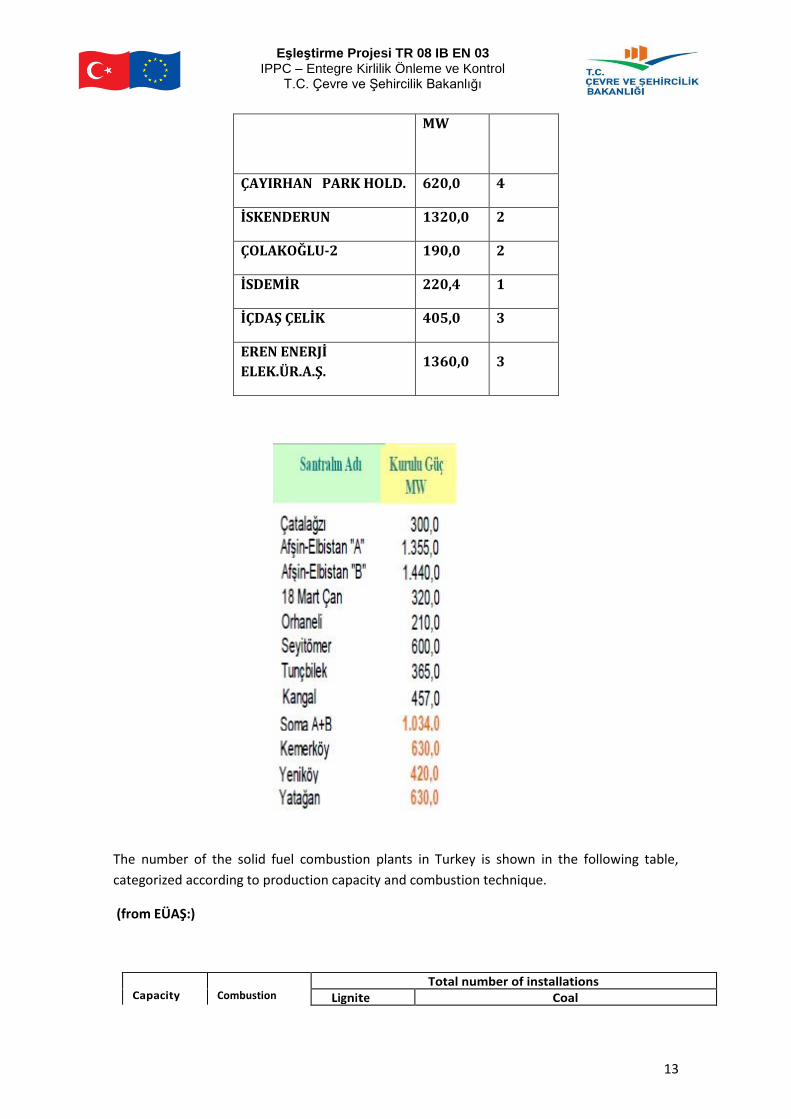
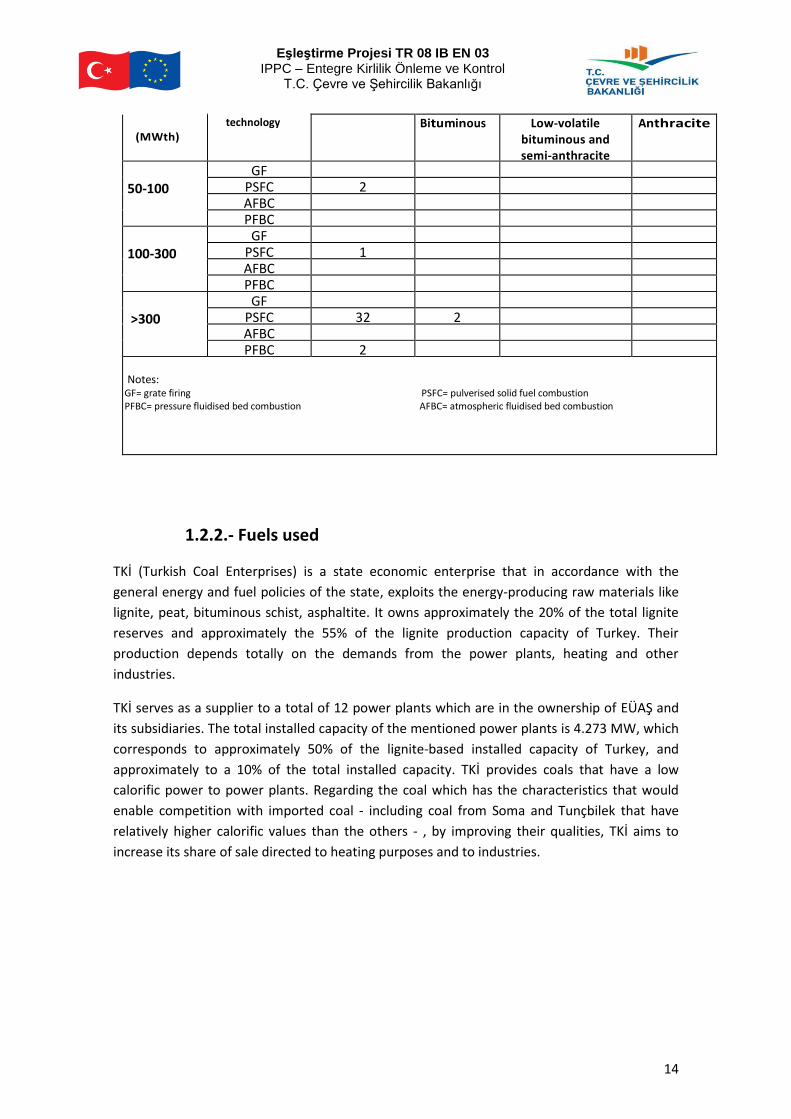
The number of the solid fuel combustion plants in Turkey is shown in the following table,
categorized according to production capacity and combustion technique.
(from EÜAŞ:)
Capacity
Combustion
Total number of installations Lignite Coal
MW
ÇAYIRHAN PARK HOLD. 620,0 4
İSKENDERUN 1320,0 2
ÇOLAKOĞLU-2 190,0 2
İSDEMİR 220,4 1
İÇDAŞ ÇELİK 405,0 3
EREN ENERJİ
ELEK.ÜR.A.Ş. 1360,0 3
Eşleştirme Projesi TR 08 IB EN 03 IPPC – Entegre Kirlilik Önleme ve Kontrol
T.C. Çevre ve Şehircilik Bakanlığı
14
(MWth)
technology Bituminous Low-volatile bituminous and semi-anthracite
Anthracite
50-100
GF PSFC 2 AFBC PFBC
100-300
GF PSFC 1 AFBC PFBC
>300
GF PSFC 32 2 AFBC PFBC 2
Notes:
GF= grate firing PSFC= pulverised solid fuel combustion PFBC= pressure fluidised bed combustion AFBC= atmospheric fluidised bed combustion
1.2.2.- Fuels used
TKİ (Turkish Coal Enterprises) is a state economic enterprise that in accordance with the
general energy and fuel policies of the state, exploits the energy-producing raw materials like
lignite, peat, bituminous schist, asphaltite. It owns approximately the 20% of the total lignite
reserves and approximately the 55% of the lignite production capacity of Turkey. Their
production depends totally on the demands from the power plants, heating and other
industries.
TKİ serves as a supplier to a total of 12 power plants which are in the ownership of EÜAŞ and
its subsidiaries. The total installed capacity of the mentioned power plants is 4.273 MW, which
corresponds to approximately 50% of the lignite-based installed capacity of Turkey, and
approximately to a 10% of the total installed capacity. TKİ provides coals that have a low
calorific power to power plants. Regarding the coal which has the characteristics that would
enable competition with imported coal - including coal from Soma and Tunçbilek that have
relatively higher calorific values than the others - , by improving their qualities, TKİ aims to
increase its share of sale directed to heating purposes and to industries.
Eşleştirme Projesi TR 08 IB EN 03 IPPC – Entegre Kirlilik Önleme ve Kontrol
T.C. Çevre ve Şehircilik Bakanlığı
15
1.2.3- Relevant aspects of Turkish Power Plants related to the emission
limits implementation
In general terms the main environmental impacts generated by large combustion plants derive
from the emissions to air, water consumption, discharge of wastewater and waste
management.
Regarding emissions to air, these are derived from the combustion process of the fuel used
and are different depending on the raw material used. Generally speaking and when the fuel is
coal, the pollutants are fine particles, sulfur dioxide and nitrogen oxides. Also other pollutants
in minor quantities should be considered as, for example, metals, and others with large-scale
effects as carbon dioxide. Other sources of air pollution are the coal storage and mixing yard
and the waste management systems mainly due to their potential emission of large-sized
particles.
Regarding water consumption and waste water discharge, it should be kept in mind that this
natural resource is used in large quantities, mainly in the cooling process, so the polluting
effect of the discharge is the potential increase in temperature of the receiving medium. Also
other processes generate wastewater flows whose impact derives mainly from water and
leachate running off coal stockpiles and waste management systems, carrying large amounts
of suspended matter. Other water streams generated continuously or sporadically as those
derived from the purification of primary circuit water and from the cleaning of facilities should
also be taken into account.
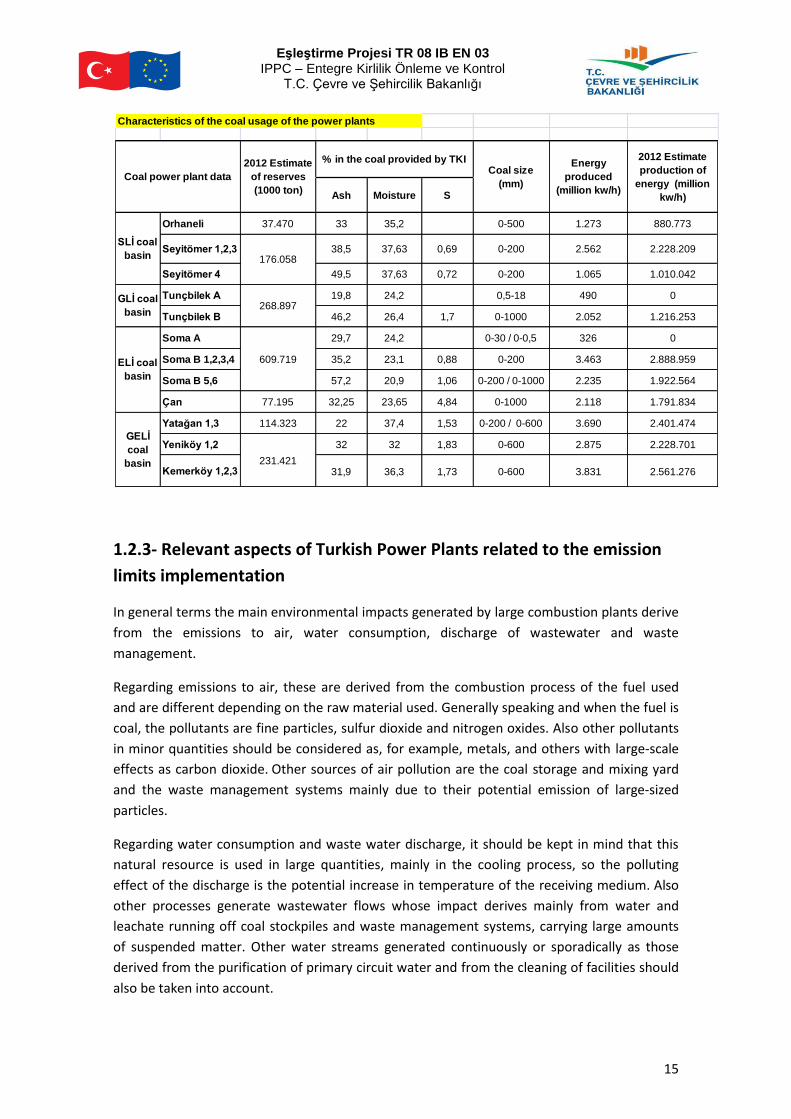
Characteristics of the coal usage of the power plants
Ash Moisture S
Orhaneli 37.470 33 35,2 0-500 1.273 880.773
Seyitömer 1,2,3 38,5 37,63 0,69 0-200 2.562 2.228.209
Seyitömer 4 49,5 37,63 0,72 0-200 1.065 1.010.042
Tunçbilek A 19,8 24,2 0,5-18 490 0
Tunçbilek B 46,2 26,4 1,7 0-1000 2.052 1.216.253
Soma A 29,7 24,2 0-30 / 0-0,5 326 0
Soma B 1,2,3,4 35,2 23,1 0,88 0-200 3.463 2.888.959
Soma B 5,6 57,2 20,9 1,06 0-200 / 0-1000 2.235 1.922.564
Çan 77.195 32,25 23,65 4,84 0-1000 2.118 1.791.834
Yatağan 1,3 114.323 22 37,4 1,53 0-200 / 0-600 3.690 2.401.474
Yeniköy 1,2 32 32 1,83 0-600 2.875 2.228.701
Kemerköy 1,2,3 31,9 36,3 1,73 0-600 3.831 2.561.276
GELİ
coal
basin
Coal size
(mm)
Energy
produced
(million kw/h)
2012 Estimate
production of
energy (million
kw/h)
Coal power plant data
SLİ coal
basin
GLİ coal
basin
ELİ coal
basin
2012 Estimate
of reserves
(1000 ton)
176.058
268.897
609.719
231.421
% in the coal provided by TKI
Eşleştirme Projesi TR 08 IB EN 03 IPPC – Entegre Kirlilik Önleme ve Kontrol
T.C. Çevre ve Şehircilik Bakanlığı
16
Finally, coal power plants generate substantial amounts of waste, mainly slag, ash and sewage
sludge. Although the ash and part of the slag may be reused or valorised directly in other
installations or processes, the large amounts generated imply the need to have disposal
systems for this waste in areas close to the power plant. The impact of these facilities stems
from their potential for contamination of soils and water bodies.
In addition to these environmental impacts other minor impacts can be included such as noise
from transport systems around the facility (trucks and mobile machinery) or the facilities
themselves (coal mills) and the impact on the landscape by the stocks of coal and waste
management systems.
The emission limit values that the power plants are obliged to fulfill are indicated in the By-law
on Large Combustion Plants published in the Official Gazette numbered 27605 and dated
08/06/2010. On the other hand, there are also some regulations in relation to the power
plants in the By-law on Industrial Based Air Pollution Control published in the Official Gazette
numbered 27277 and dated 03/07/2009.
At the same time, the principles and procedures concerning the monitoring, validation and
reporting of the greenhouse gas emissions from the installations that are listed in the Annex 1
of the By-law on Monitoring of the Greenhouse Gas Emissions (which, with the purpose of
restricting the increase of the greenhouse gas emissions of Turkey, entered into force being
published in the Official Gazette numbered 28274 and dated 25/04/2012) are established in
the Chapter 2, Article 6 and 7 of the mentioned By-law.
2. Technological Processes, Technologies and Techniques
description in the hard coal and lignite combustion
Eşleştirme Projesi TR 08 IB EN 03 IPPC – Entegre Kirlilik Önleme ve Kontrol
T.C. Çevre ve Şehircilik Bakanlığı
17
2.1. General Overview of Combustion Processes with solid
fuels: hard coal & lignite.
2.1.1 Overview of the combustion process
Combustion processes using solid fuels, in particular, lignites and coals, are usually performed at atmospheric pressure achieving that all of the energy of the solid fuel is converted into heat and is subsequently transferred in a process of steam generation to produce energy.
Combustion is a fast chemical reaction of oxygen with flammable elements of the fuel. The two relevant chemical elements are carbon and hydrogen and at a smaller level sulfur.
The aim of a good combustion is to create the maximum possible amount of heat while minimizing losses due to the combustion reaction of fuel with oxygen.
The steam generation plants are based on a first thermodynamic steam cycle Rankine proposed in 1908, who suffered developments and improvements increasing its complexity.
Boilers that are employed may be of natural forced circulation and of circulation formed in a single step (Benson boilers).
The components of the boiler or steam generator is a combination of economizer, evaporator, superheater or reheater.
The steam turbine is a rotary engine that uses the calorific value of steam to produce mechanical energy from the expansion of the high pressure steam from the boiler.
The capacitor allows for cooling and condensing the low pressure residual steam coming from the turbine.
The cooling system of power plants can operate as open or closed circuit, depending on the environmental impact caused by the water intake and the final discharge (different if it is from/to a river, a lake or the sea). See the BREF for Industrial Cooling Systems.
The solid fuel to be used determines the combustion technology to be employed and the pollution abatement techniques to be used.
In these facilities a significant number of ancillary systems to the main process of energy production should also be considered, which have environmental impacts.
Eşleştirme Projesi TR 08 IB EN 03 IPPC – Entegre Kirlilik Önleme ve Kontrol
T.C. Çevre ve Şehircilik Bakanlığı
18
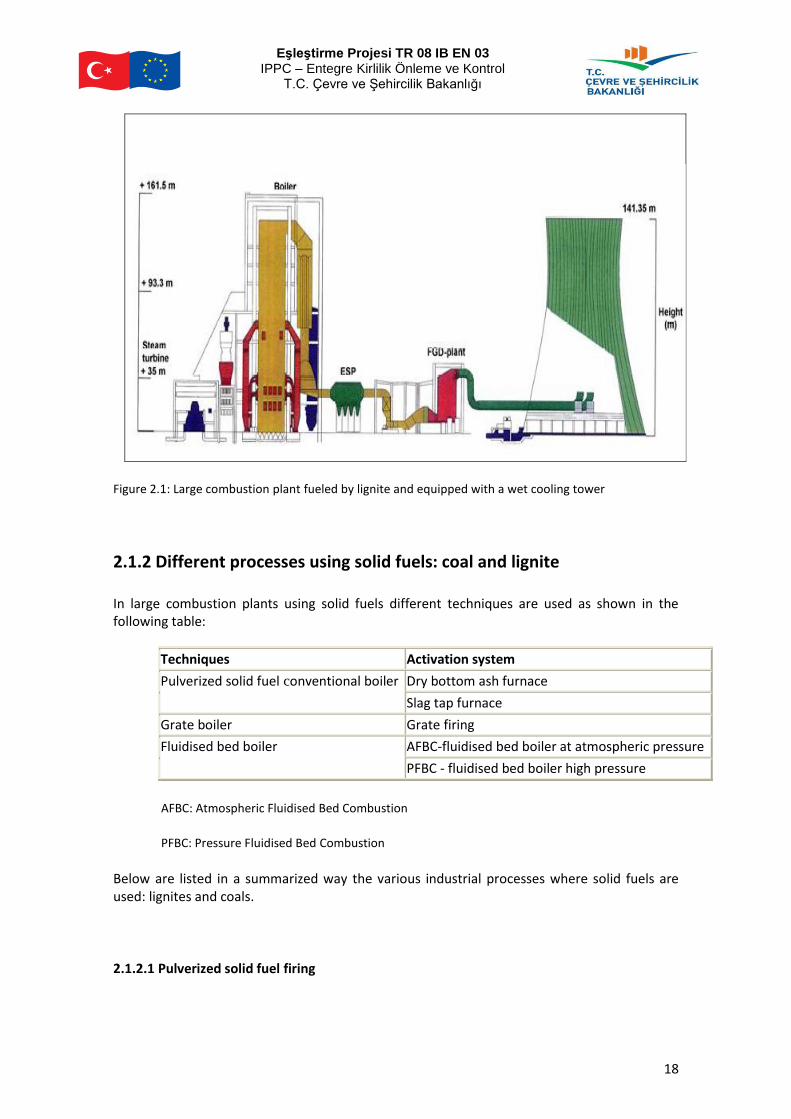
Figure 2.1: Large combustion plant fueled by lignite and equipped with a wet cooling tower
2.1.2 Different processes using solid fuels: coal and lignite
In large combustion plants using solid fuels different techniques are used as shown in the following table:
Techniques Activation system
Pulverized solid fuel conventional boiler Dry bottom ash furnace
Slag tap furnace
Grate boiler Grate firing
Fluidised bed boiler AFBC-fluidised bed boiler at atmospheric pressure
PFBC - fluidised bed boiler high pressure
AFBC: Atmospheric Fluidised Bed Combustion
PFBC: Pressure Fluidised Bed Combustion
Below are listed in a summarized way the various industrial processes where solid fuels are used: lignites and coals.
2.1.2.1 Pulverized solid fuel firing
Eşleştirme Projesi TR 08 IB EN 03 IPPC – Entegre Kirlilik Önleme ve Kontrol
T.C. Çevre ve Şehircilik Bakanlığı
19
In most solid fuel combustion systems, the fuel is pulverized prior to combustion. There are two possible options depending on what happens to the slag:
• dry bottom ash furnace: operates at temperatures well below the melting point of the ashes near the walls of the chamber or heat exchanger.
In this process approximately 10-20% of the ash is removed as slag. The remainder is transported with the flue gas and is removed in the receiving systems of the particles.
• slag tap furnace: works with temperatures above the melting point of ash, a factor that ensures the formation of liquid ash. This system involves recycling the fly ash.
The furnaces need a special ceramic coating to withstand temperatures of the ash melting and chemical attack. Fly ash and the slag can be reintroduced into the combustion chamber to increase energy efficiency.
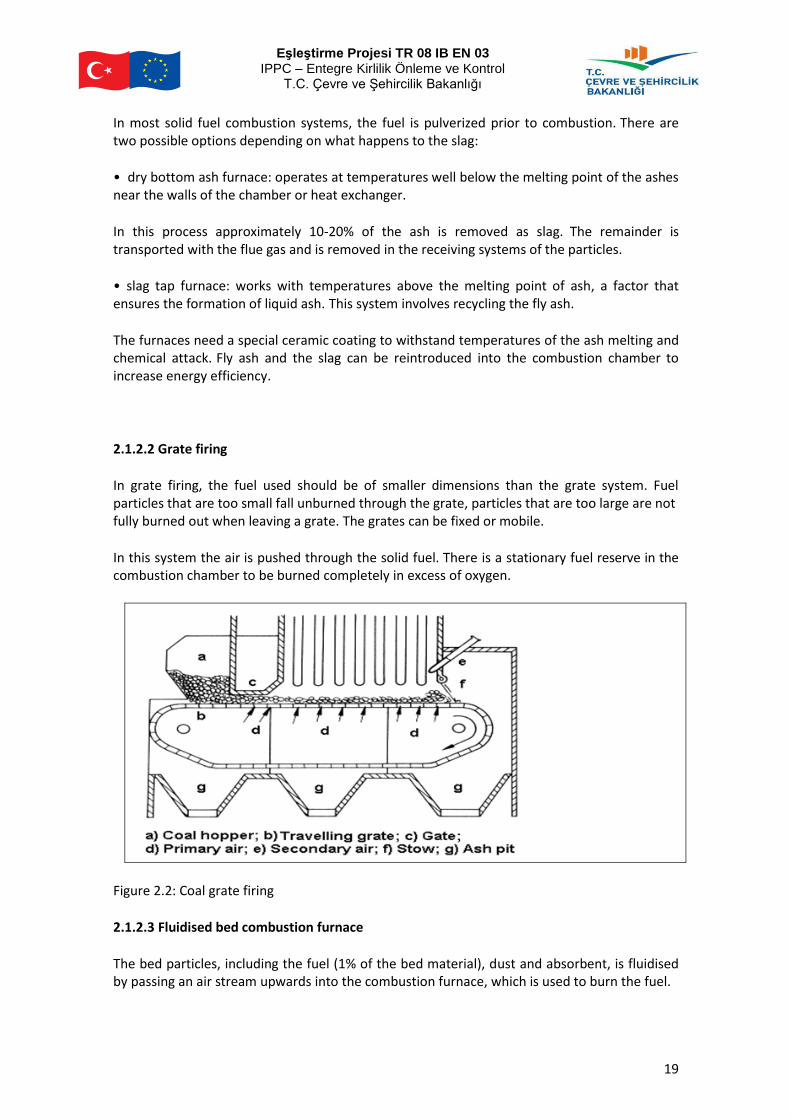
2.1.2.2 Grate firing
In grate firing, the fuel used should be of smaller dimensions than the grate system. Fuel particles that are too small fall unburned through the grate, particles that are too large are not fully burned out when leaving a grate. The grates can be fixed or mobile.
In this system the air is pushed through the solid fuel. There is a stationary fuel reserve in the combustion chamber to be burned completely in excess of oxygen.
Figure 2.2: Coal grate firing
2.1.2.3 Fluidised bed combustion furnace
The bed particles, including the fuel (1% of the bed material), dust and absorbent, is fluidised by passing an air stream upwards into the combustion furnace, which is used to burn the fuel.
Eşleştirme Projesi TR 08 IB EN 03 IPPC – Entegre Kirlilik Önleme ve Kontrol
T.C. Çevre ve Şehircilik Bakanlığı
20
Facilities using fluidised bed combustion are of two types: at atmospheric pressure (AFBC) and high pressure (PFBC), the former being the most widespread. Both types can have, in turn, two subtypes: fluidised bed and circulating bed. In both solid fuels with high ash content are generally employed.
The environmental advantages of each of them, as well as a detailed description of those technologies is given in Section 2.5.
2.2. Main Aspects to Consider for the determination of the Best
Available Techniques (BAT) in the coal / lignite combustion
BREF documents are the reference documents to determine the BATs. They are not legally binding standards, they are meant to give information for the guidance of industry, Environmental Competent Authority and the public on achievable emission and consumption levels when using specified techniques. The appropriate limit values for any specific case will need to be determined taking into account the objectives of the IED and the specificities of each installation.
The following subsections present techniques that must be taken into account when determining the BATs to prevent or reduce emissions and increase the thermal efficiency of an installation.
All the techniques that are included are available from a technical and commercial standpoint, and are described here in general.
The solid-fuel LCPs are not obliged to implement all the aforementioned techniques: Depending on the characteristics of each facility (type of fuel, used systems) each LCP can choose to implement one, several or no techniques at all, as a function of the amount of changes which entail the emission limit values and other conditions stated in the corresponding integrated environmental permit. The emission values which will be established in the future integrated environmental permits will take as reference those values associated to the BATs, which are mentioned in the BREF documents. A summary table with some current and future Emission Limit Values according to the IED are provided in Annex VI.
In the tables shown below, when the column “Environmental Benefits” is blank for a certain technique, it means that in this technique a quantitative assessment of its environmental advantages could not be provided as it is always applied in combination with other techniques.
As will be seen in the tables shown below, many techniques designed to provide a certain specific environmental benefit have unfortunately additional undesired effects, which may be detrimental also from the environmental point of view. For example, a technique to reduce the emissions into air of one specific pollutant may imply an
Eşleştirme Projesi TR 08 IB EN 03 IPPC – Entegre Kirlilik Önleme ve Kontrol
T.C. Çevre ve Şehircilik Bakanlığı
21
increased energy consumption. In practice an operator of a given LCP will have to assess how to fulfill the conditions of the integrated environmental permit by using a set of techniques suitable for that particular installation. Those techniques may belong or not to the list shown in the tables below.
In each of the following subsections is indicated in brackets the section of BREF where the techniques indicated are explained in detail.
The following sections describe:
2.2.1. - Techniques for unloading, storage and handling of fuel and additives
2.2.2. - Techniques for fuel pretreatment
2.2.3. - Techniques to increase energy efficiency
2.2.4 - Techniques for the prevention and control of dust and particle-bound heavy metal emissions
2.2.5 - Techniques for preventing and controlling SO2 emissions
2.2.6. - Techniques for preventing and controlling NOx and N2O emissions
2.2.7 - Techniques to prevent and control water pollution
Eşleştirme Projesi TR 08 IB EN 03 IPPC – Entegre Kirlilik Önleme ve Kontrol
T.C. Çevre ve Şehircilik Bakanlığı
22
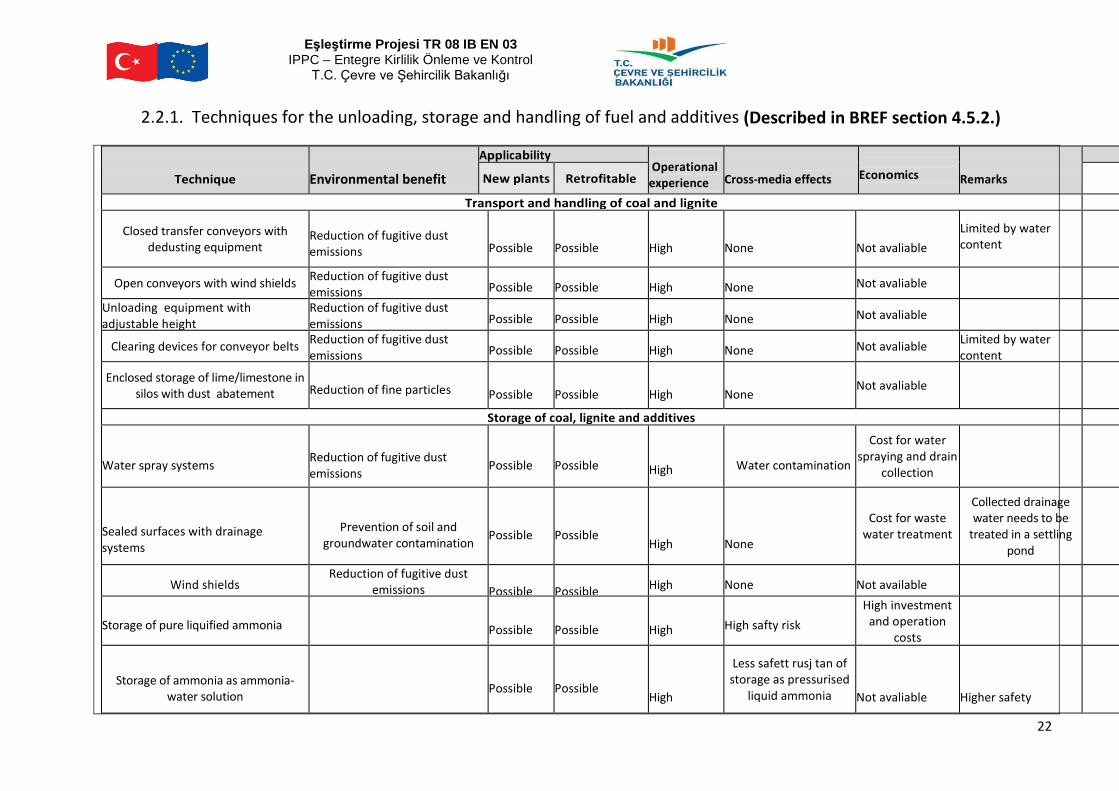
2.2.1. Techniques for the unloading, storage and handling of fuel and additives (Described in BREF section 4.5.2.)
Technique
Environmental benefit
Applicability
Operational experience
Cross-media effects
Economics Remarks
New plants Retrofitable
Transport and handling of coal and lignite
Closed transfer conveyors with dedusting equipment
Reduction of fugitive dust emissions
Possible
Possible
High
None
Not avaliable
Limited by water content
Open conveyors with wind shields Reduction of fugitive dust emissions
Possible
Possible
High
None Not avaliable
Unloading equipment with adjustable height
Reduction of fugitive dust emissions
Possible
Possible
High
None Not avaliable
Clearing devices for conveyor belts Reduction of fugitive dust emissions
Possible
Possible
High
None Not avaliable Limited by water content
Enclosed storage of lime/limestone in silos with dust abatement
Reduction of fine particles Possible
Possible
High
None
Not avaliable
Storage of coal, lignite and additives
Water spray systems
Reduction of fugitive dust emissions
Possible
Possible
High
Water contamination
Cost for water spraying and drain
collection
Sealed surfaces with drainage systems
Prevention of soil and
groundwater contamination
Possible
Possible
High
None
Cost for waste water treatment
Collected drainage water needs to be
treated in a settling pond
Wind shields Reduction of fugitive dust
emissions Possible
Possible
High
None
Not available
Storage of pure liquified ammonia Possible
Possible
High
High safty risk High investment
and operation costs
Storage of ammonia as ammonia-
water solution
Possible
Possible
High
Less safett rusj tan of storage as pressurised
liquid ammonia
Not avaliable
Higher safety
Eşleştirme Projesi TR 08 IB EN 03 IPPC – Entegre Kirlilik Önleme ve Kontrol
T.C. Çevre ve Şehircilik Bakanlığı
23
Table 2.1: Techniques to be considered for the unloading, storage and hanling of fuel
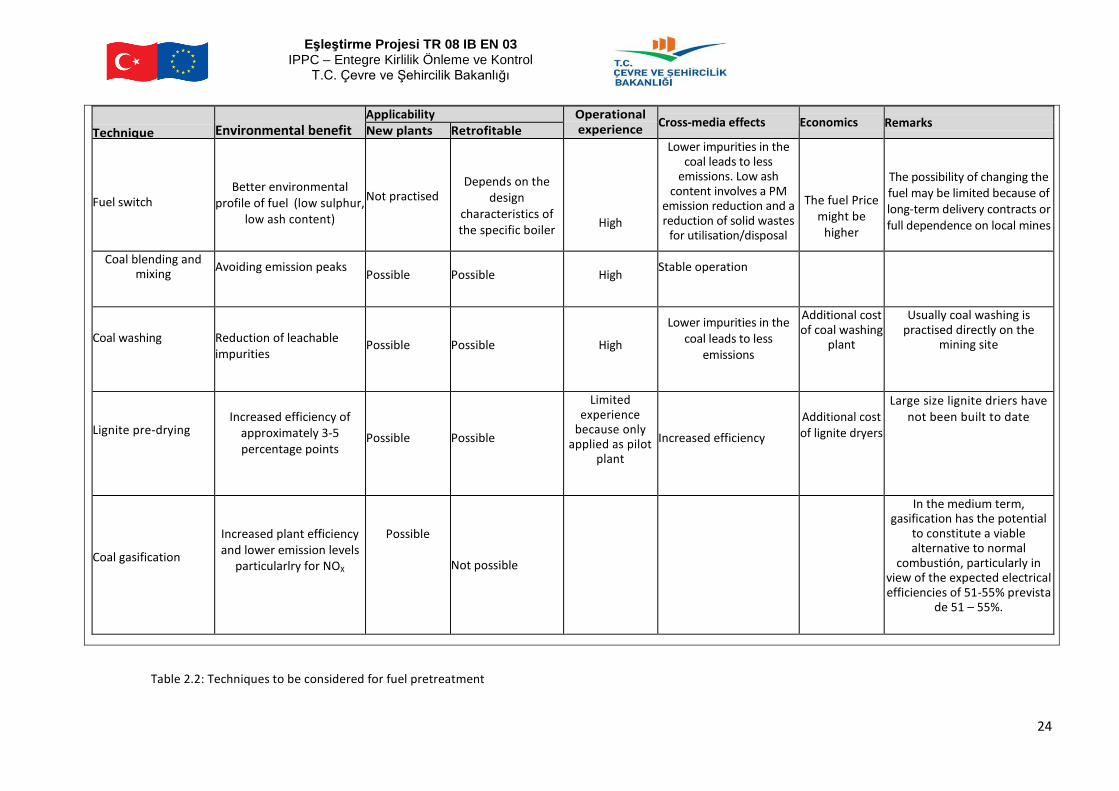
2.2.2- Techniques for fuel pretreatment (Described in BREF section 4.5.3)
Eşleştirme Projesi TR 08 IB EN 03 IPPC – Entegre Kirlilik Önleme ve Kontrol
T.C. Çevre ve Şehircilik Bakanlığı
24
Technique
Environmental benefit
Applicability Operational experience
Cross-media effects
Economics Remarks New plants Retrofitable
Fuel switch
Better environmental profile of fuel (low sulphur,
low ash content)
Not practised
Depends on the design
characteristics of the specific boiler
High
Lower impurities in the coal leads to less
emissions. Low ash content involves a PM
emission reduction and a reduction of solid wastes
for utilisation/disposal
The fuel Price
might be higher
The possibility of changing the fuel may be limited because of long-term delivery contracts or full dependence on local mines
Coal blending and mixing
Avoiding emission peaks Possible
Possible
High
Stable operation
Coal washing
Reduction of leachable impurities
Possible
Possible
High
Lower impurities in the coal leads to less
emissions
Additional cost of coal washing
plant
Usually coal washing is practised directly on the
mining site
Lignite pre-drying
Increased efficiency of
approximately 3-5 percentage points
Possible
Possible
Limited experience
because only applied as pilot
plant
Increased efficiency
Additional cost of lignite dryers
Large size lignite driers have not been built to date
Coal gasification
Increased plant efficiency and lower emission levels
particularlry for NOX
Possible
Not possible
In the medium term, gasification has the potential
to constitute a viable alternative to normal
combustión, particularly in view of the expected electrical efficiencies of 51-55% prevista
de 51 – 55%.
Table 2.2: Techniques to be considered for fuel pretreatment
Eşleştirme Projesi TR 08 IB EN 03 IPPC – Entegre Kirlilik Önleme ve Kontrol
T.C. Çevre ve Şehircilik Bakanlığı
25
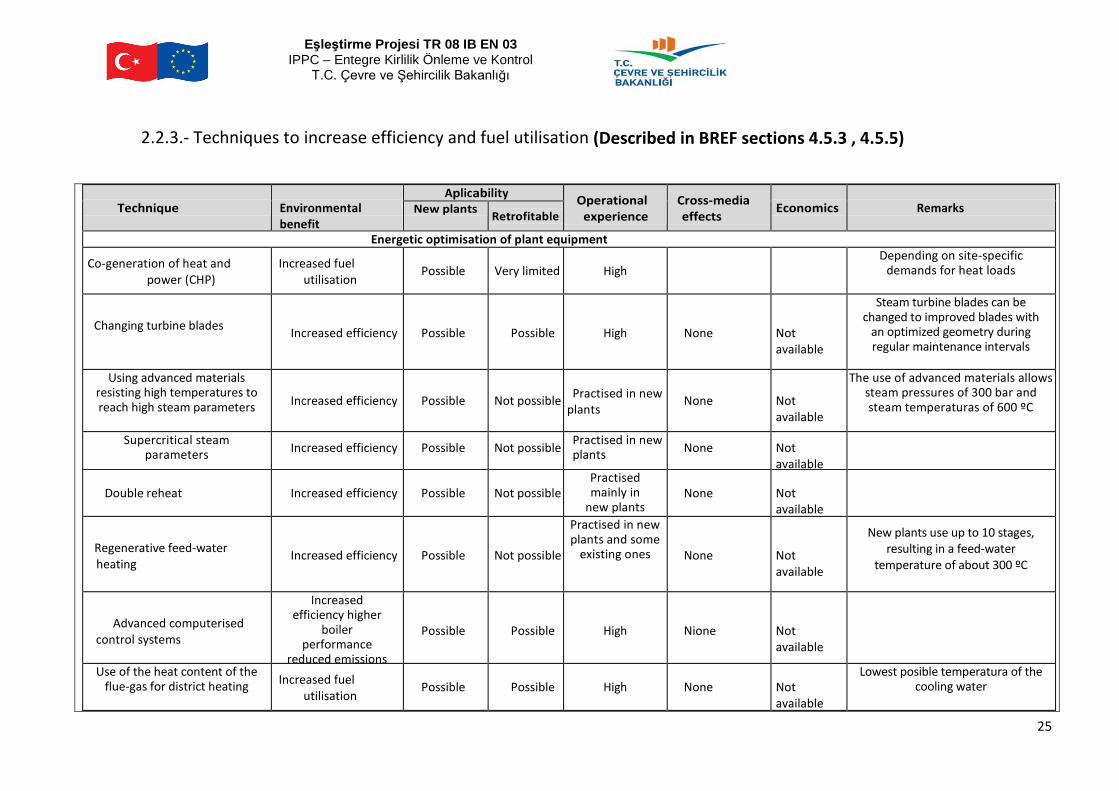
2.2.3.- Techniques to increase efficiency and fuel utilisation (Described in BREF sections 4.5.3 , 4.5.5)
Technique
Environmental benefit
Aplicability
Operational experience
Cross-media effects
Economics
Remarks New plants
Retrofitable
Energetic optimisation of plant equipment
Co-generation of heat and power (CHP)
Increased fuel utilisation
Possible
Very limited
High
Depending on site-specific demands for heat loads
Changing turbine blades
Increased efficiency
Possible
Possible
High
None
Not available
Steam turbine blades can be changed to improved blades with
an optimized geometry during regular maintenance intervals
Using advanced materials resisting high temperatures to reach high steam parameters
Increased efficiency
Possible
Not possible
Practised in new
plants
None
Not available
The use of advanced materials allows steam pressures of 300 bar and steam temperaturas of 600 ºC
Supercritical steam parameters
Increased efficiency
Possible
Not possible Practised in new plants
None
Not available
Double reheat
Increased efficiency
Possible
Not possible
Practised mainly in
new plants sobre todo en
centrales nuevas
None
Not available
Regenerative feed-water heating
Increased efficiency
Possible
Not possible
Practised in new plants and some
existing ones
None
Not available
New plants use up to 10 stages, resulting in a feed-water
temperature of about 300 ºC
Advanced computerised
control systems
Increased efficiency higher
boiler performance
reduced emissions
Possible
Possible
High
Nione
Not available
Use of the heat content of the flue-gas for district heating
Increased fuel utilisation
Possible
Possible
High
None
Not available
Lowest posible temperatura of the cooling water
Eşleştirme Projesi TR 08 IB EN 03 IPPC – Entegre Kirlilik Önleme ve Kontrol
T.C. Çevre ve Şehircilik Bakanlığı
26
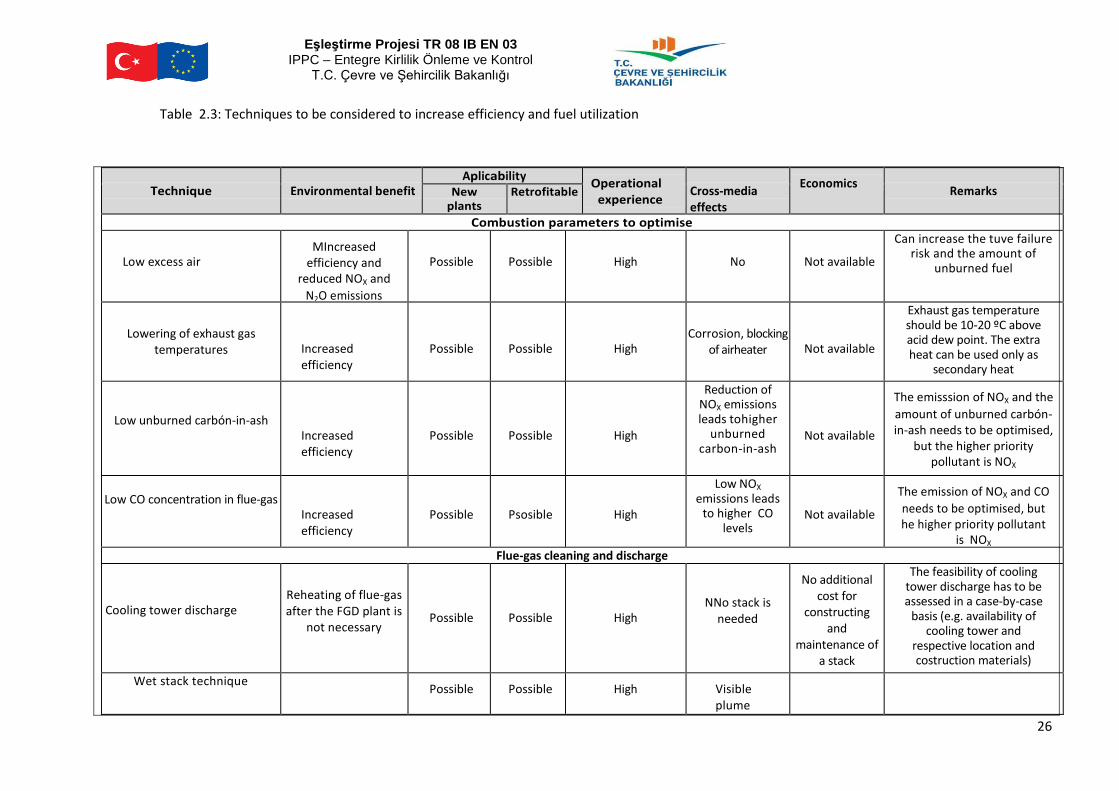
Table 2.3: Techniques to be considered to increase efficiency and fuel utilization
Technique
Environmental benefit
Aplicability
Operational experience
Cross-media effects
Economics Remarks New
plants Retrofitable
Combustion parameters to optimise
Low excess air
MIncreased efficiency and
reduced NOX and
N2O emissions
Possible
Possible
High
No
Not available
Can increase the tuve failure risk and the amount of
unburned fuel
Lowering of exhaust gas
temperatures
Increased efficiency
Possible
Possible
High
Corrosion, blocking
of airheater
Not available
Exhaust gas temperature should be 10-20 ºC above acid dew point. The extra heat can be used only as
secondary heat
Low unburned carbón-in-ash
Increased efficiency
Possible
Possible
High
Reduction of NOX emissions leads tohigher
unburned carbon-in-ash
Not available
The emisssion of NOX and the
amount of unburned carbón-in-ash needs to be optimised,
but the higher priority pollutant is NOX
Low CO concentration in flue-gas
Increased efficiency
Possible
Psosible
High
Low NOX
emissions leads to higher CO
levels
Not available
The emission of NOX and CO
needs to be optimised, but he higher priority pollutant
is NOX Flue-gas cleaning and discharge
Cooling tower discharge
Reheating of flue-gas after the FGD plant is
not necessary
Possible
Possible
High
NNo stack is needed
No additional cost for
constructing and
maintenance of a stack
The feasibility of cooling tower discharge has to be assessed in a case-by-case
basis (e.g. availability of cooling tower and
respective location and costruction materials)
Wet stack technique
Possible
Possible
High
Visible plume
Eşleştirme Projesi TR 08 IB EN 03 IPPC – Entegre Kirlilik Önleme ve Kontrol
T.C. Çevre ve Şehircilik Bakanlığı
27
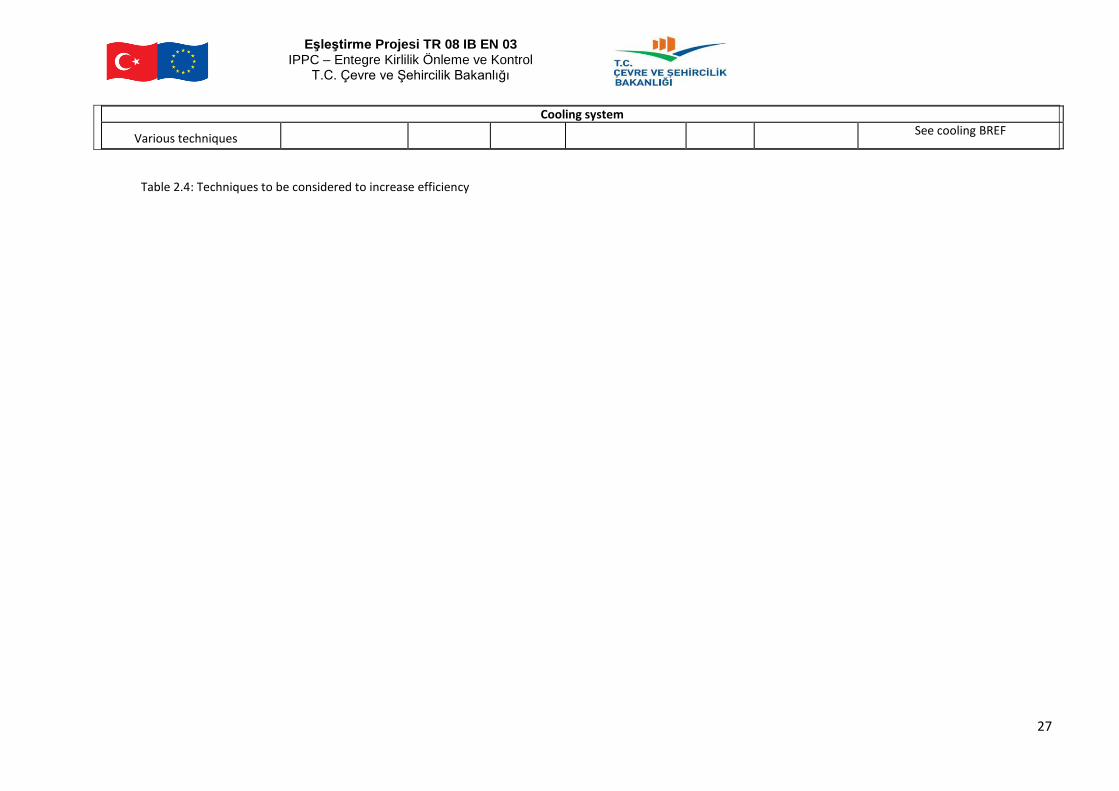
Cooling system
Various techniques See cooling BREF
Table 2.4: Techniques to be considered to increase efficiency
Eşleştirme Projesi TR 08 IB EN 03 IPPC – Entegre Kirlilik Önleme ve Kontrol
T.C. Çevre ve Şehircilik Bakanlığı
28
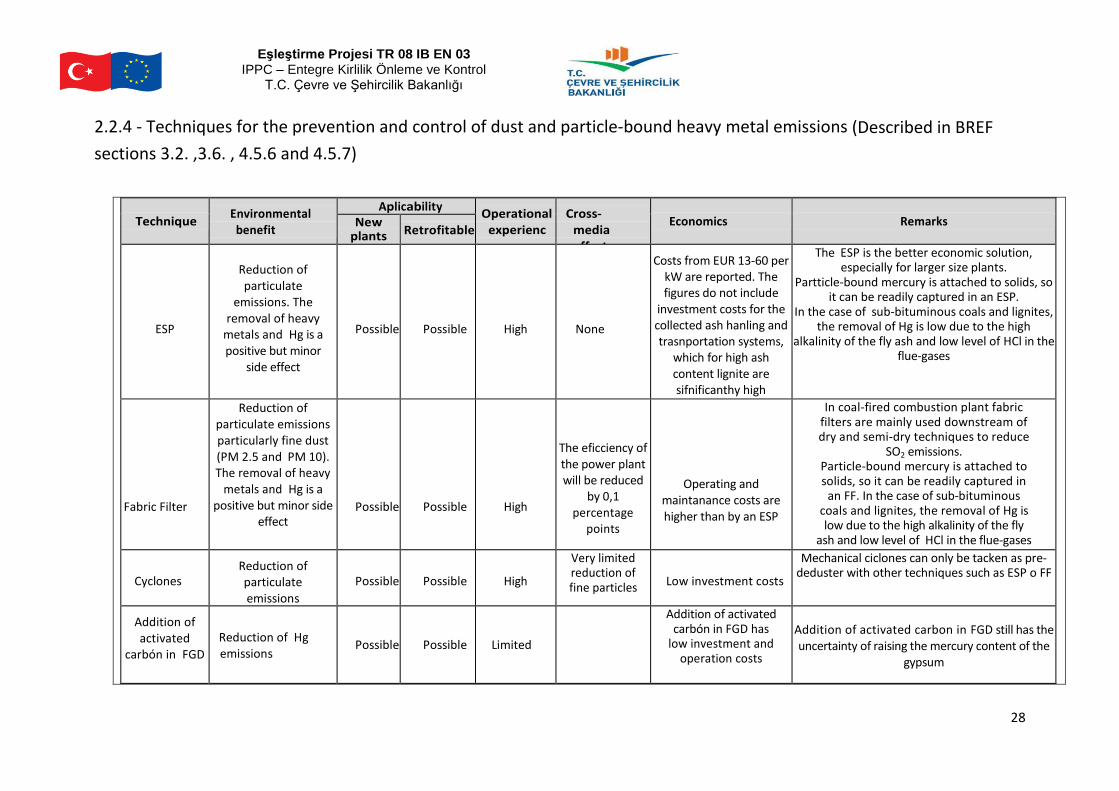
2.2.4 - Techniques for the prevention and control of dust and particle-bound heavy metal emissions (Described in BREF
sections 3.2. ,3.6. , 4.5.6 and 4.5.7)
Technique
Environmental benefit
Aplicability
Operational experience
Cross-media effects
Economics
Remarks New
plants
Retrofitable
ESP
Reduction of particulate
emissions. The removal of heavy
metals and Hg is a positive but minor
side effect
Possible
Possible
High
None
Costs from EUR 13-60 per kW are reported. The figures do not include
investment costs for the collected ash hanling and trasnportation systems,
which for high ash content lignite are sifnificanthy high
The ESP is the better economic solution, especially for larger size plants.
Partticle-bound mercury is attached to solids, so it can be readily captured in an ESP.
In the case of sub-bituminous coals and lignites, the removal of Hg is low due to the high
alkalinity of the fly ash and low level of HCl in the flue-gases
Fabric Filter
Reduction of particulate emissions particularly fine dust (PM 2.5 and PM 10). The removal of heavy
metals and Hg is a positive but minor side
effect
Possible
Possible
High
The eficciency of the power plant will be reduced
by 0,1 percentage
points
Operating and maintanance costs are higher than by an ESP
In coal-fired combustion plant fabric filters are mainly used downstream of dry and semi-dry techniques to reduce
SO2 emissions. Particle-bound mercury is attached to solids, so it can be readily captured in
an FF. In the case of sub-bituminous coals and lignites, the removal of Hg is low due to the high alkalinity of the fly
ash and low level of HCl in the flue-gases
Cyclones
Reduction of particulate emissions
Possible
Possible
High
Very limited reduction of fine particles
Low investment costs
Mechanical ciclones can only be tacken as pre-deduster with other techniques such as ESP o FF
Addition of activated
carbón in FGD
Reduction of Hg emissions
Possible
Possible
Limited
Addition of activated carbón in FGD has
low investment and operation costs
Addition of activated carbon in FGD still has the uncertainty of raising the mercury content of the
gypsum
Eşleştirme Projesi TR 08 IB EN 03 IPPC – Entegre Kirlilik Önleme ve Kontrol
T.C. Çevre ve Şehircilik Bakanlığı
29
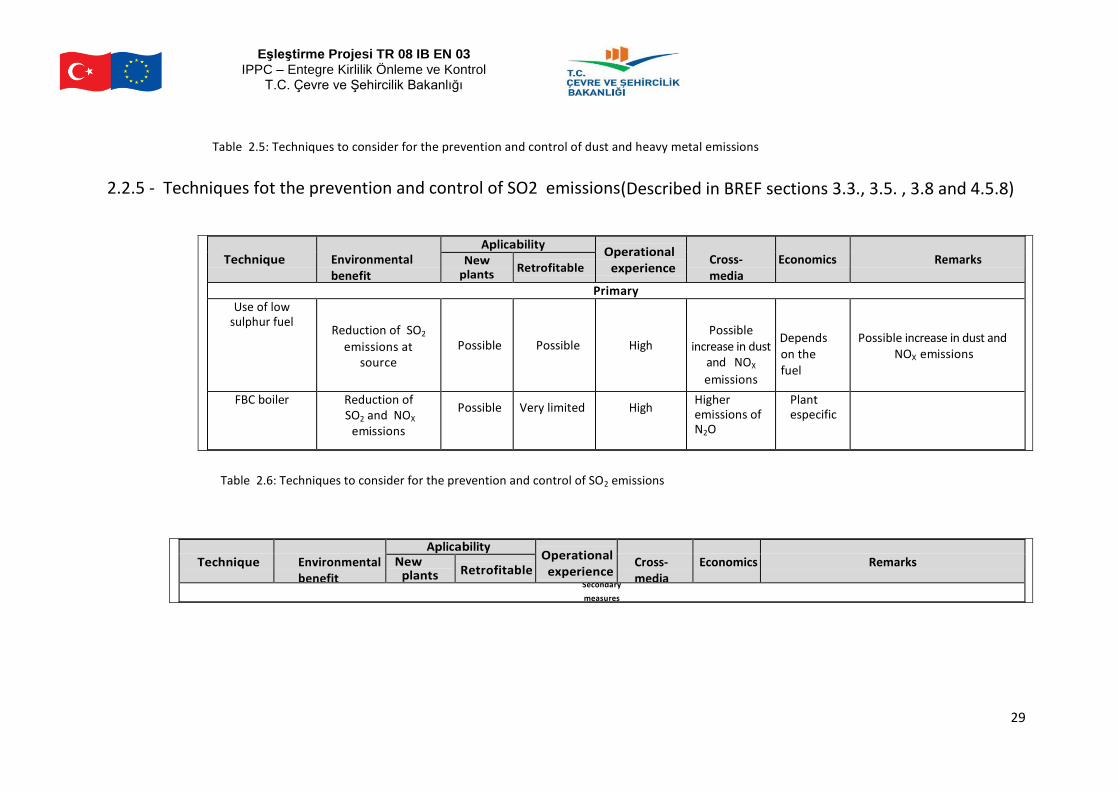
Table 2.5: Techniques to consider for the prevention and control of dust and heavy metal emissions
2.2.5 - Techniques fot the prevention and control of SO2 emissions(Described in BREF sections 3.3., 3.5. , 3.8 and 4.5.8)
Technique
Environmental benefit
Aplicability
Operational experience
Cross-media effects
Economics
Remarks New
plants nuevas
Retrofitable
Primary measures Use of low
sulphur fuel
Reduction of SO2
emissions at source
Possible
Possible
High
Possible
increase in dust and NOX
emissions
Depends on the fuel
Possible increase in dust and NOX emissions
FBC boiler
Reduction of SO2 and NOX
emissions
Possible
Very limited
High Higher emissions of N2O
Plant especific
Table 2.6: Techniques to consider for the prevention and control of SO2 emissions
Technique
Environmental benefit
Aplicability Operational experience
Cross-media effects
Economics
Remarks New
plants
Retrofitable
Secondary
measures
Eşleştirme Projesi TR 08 IB EN 03 IPPC – Entegre Kirlilik Önleme ve Kontrol
T.C. Çevre ve Şehircilik Bakanlığı
30
Technique
Environmental Benefit
Aplicability Operational experience
Cross-media effects
Economics
Remarks New
plants
Retrofitable
Primary measures Low excess air
Reduction of NOX
and N2O emissions, increased efficiency
Possible
Possible
High
Trend to higher unburned carbon-in-ash Low excess air tends to give higher CO and HC levels
Plant specific
Risk of tuve and wall corrosion
Air-staging (OFA, BBF and
BOOS)
Possible
Possible
High
Tendency to lead to higher unburned carbon-
in-ash
Plant specific
Flue-gas recirculation Possible
Possible
High
Plant specific For existing plants, the applicability depends on the i Individual plant
Low NOX burners
Reduction of NOX
Possible
Possible
High
Tendency to lead to higher
unburned carbon-in-ash
For existing plants, the applicability depends on the individual plant. Often includes flue-gas recirculation and air stafing
Reburning
Reduction of NOX
Possible
Possible
High
Plant specific
For existing plants, the applicavility depends on the individual plant. Space restrictions make reburning less appropriate for retrofit situations than for new ones
Measures to reduce N2O emissions in FBC boilers
Low excess air Reduction of N2O emissions
Possible
Possible
High
Higher CO emissions Plant specific
Increased fluidised bed temperature
Reduction of N2O emissions
Possible
Possible
Experimental stage
Increased NOx and SO2 emisssions
Not available
Corrosion risk
Use of catalytic material such as MgO or CaO in the boiler
Reduction of N2O emissions
Possible
Possible
Experimental stage
Not available
Increased flue-gas temperature
Reduction of N2O emissions
Possible
Possible
Pilot plant stage
Not available
T
a
b
l
e
:
T
e
c
h
n
i
q
u
e
s
t
o
c
o
n
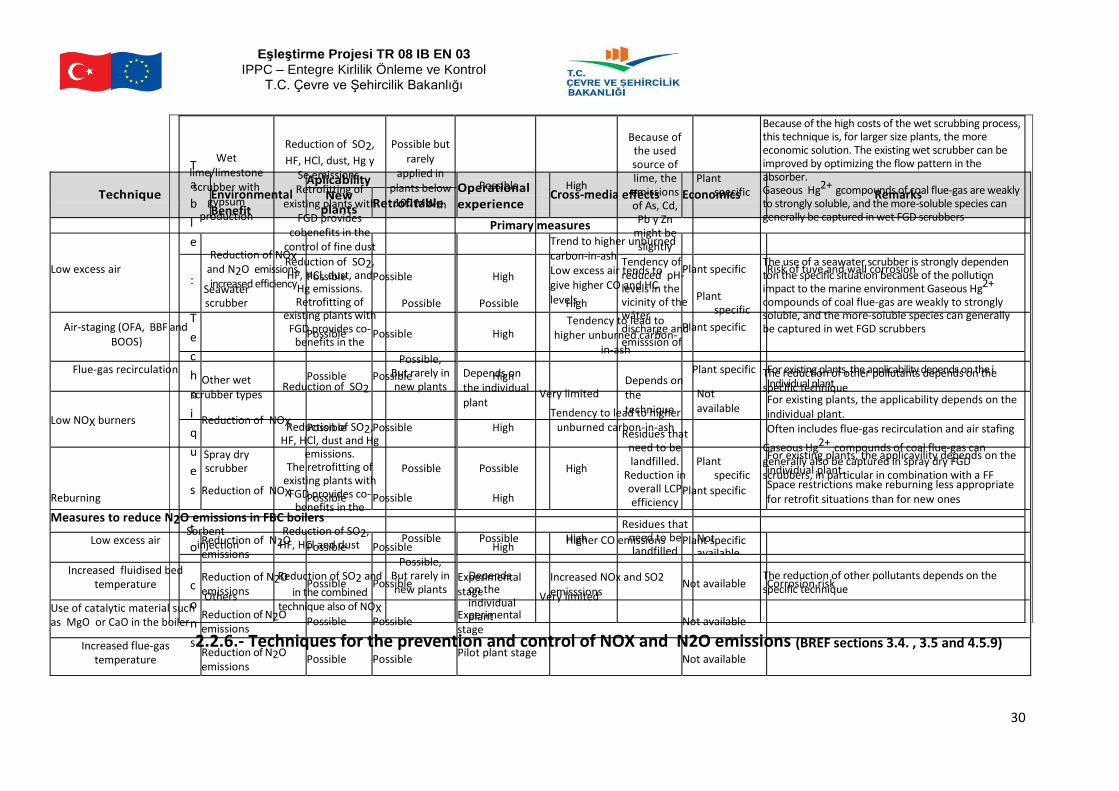
s2.2.6.- Techniques for the prevention and control of NOX and N2O emissions (BREF sections 3.4. , 3.5 and 4.5.9)
Wet lime/limestone scrubber with
gypsum production
Reduction of SO2,
HF, HCl, dust, Hg y Se emissions. Retrofitting of
existing plants with FGD provides
cobenefits in the control of fine dust
and Hg
Possible but
rarely applied in
plants below 100 MWth
Possible
High
Because of
the used source of lime, the emissions of As, Cd, Pb y Zn
might be slightly higher.
Increases CO2
emissions. Waste water
emissions
Plant
specific
Because of the high costs of the wet scrubbing process, this technique is, for larger size plants, the more economic solution. The existing wet scrubber can be improved by optimizing the flow pattern in the absorber. Gaseous Hg2+ gcompounds of coal flue-gas are weakly to strongly soluble, and the more-soluble species can generally be captured in wet FGD scrubbers
Seawater scrubber
Reduction of SO2, HF, HCl, dust, and
Hg emissions. Retrofitting of
existing plants with FGD provides co-
benefits in the control of fine dust
and Hg
Possible
Possible
High
Tendency of reduced pH-levels in the vicinity of the wáter discharge and emisssion of heavy metal and remaining ash to the marine environment
Plant
specific
The use of a seawater scrubber is strongly dependen ton the specific situation because of the pollution impact to the marine environment Gaseous Hg2+
compounds of coal flue-gas are weakly to strongly soluble, and the more-soluble species can generally be captured in wet FGD scrubbers
Other wet scrubber types
Reduction of SO2
Possible, But rarely in new plants
Depends on the individual plant
Very limited
Depends on the technique
Not available
The reduction of other pollutants depends on the specific technique
Spray dry scrubber
Reduction of SO2, HF, HCl, dust and Hg
emissions. The retrofitting of
existing plants with FGD provides co-
benefits in the control of fine dust
and Hg
Possible
Possible
High
Residues that
need to be landfilled.
Reduction in overall LCP efficiency
Plant
specific
Gaseous Hg2+ compounds of coal flue-gas can generally also be captured in spray dry FGD scrubbers, in particular in combination with a FF
Sorbent
injection
Reduction of SO2,
HF, HCl and dust
Possible
Possible
High
Residues that need to be landfilled
Not available
Others
Reduction of SO2 and
in the combined technique also of NOX
Possible, But rarely in new plants
Depends on the individual plant
Very limited
The reduction of other pollutants depends on the specific technique
Eşleştirme Projesi TR 08 IB EN 03 IPPC – Entegre Kirlilik Önleme ve Kontrol
T.C. Çevre ve Şehircilik Bakanlığı
31
Table 2.8: Techniques to consider for the prevention and control of NOx and N2O emissions
Technique
Environmental Benefit
Aplicabiility
Operational experience
Cross-media effects
Economics
Remarks New
plants
Retrofitable
Eşleştirme Projesi TR 08 IB EN 03 IPPC – Entegre Kirlilik Önleme ve Kontrol
T.C. Çevre ve Şehircilik Bakanlığı
32
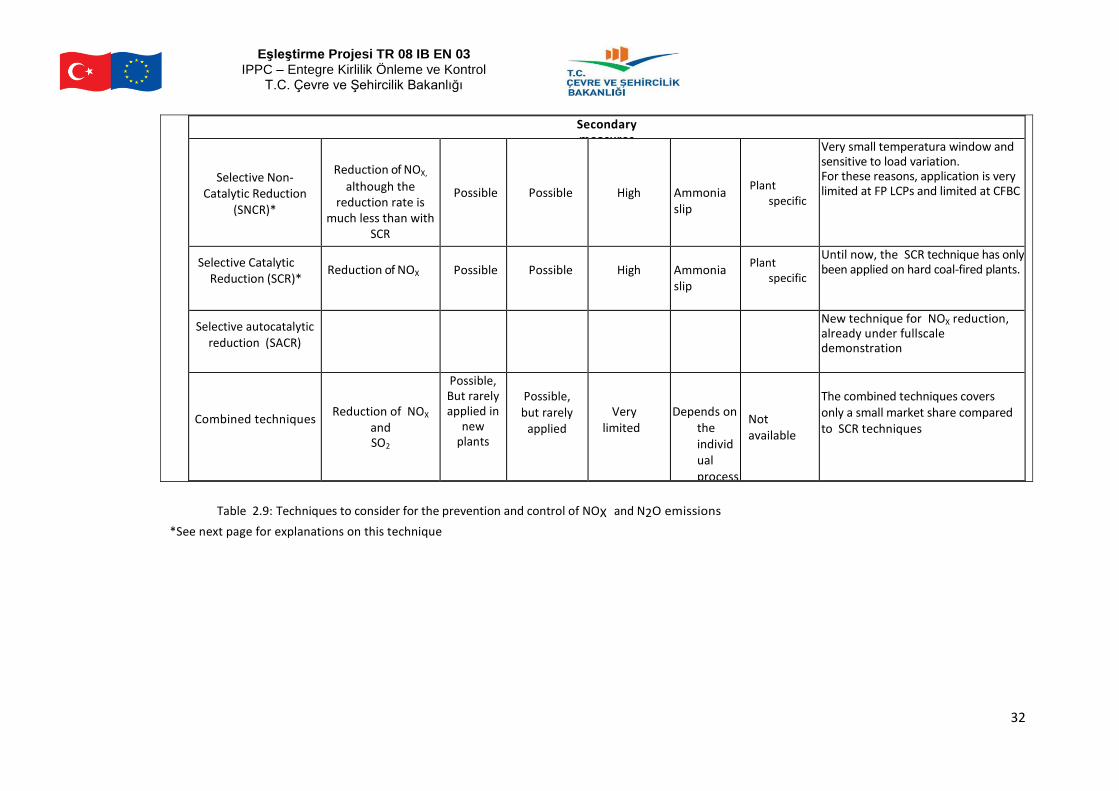
Secondary measures
Selective Non-
Catalytic Reduction (SNCR)*
Reduction of NOX,
although the reduction rate is
much less than with SCR
Possible
Possible
High
Ammonia slip
Plant specific
Very small temperatura window and sensitive to load variation. For these reasons, application is very limited at FP LCPs and limited at CFBC
Selective Catalytic Reduction (SCR)*
Reduction of NOX
Possible
Possible
High
Ammonia slip
Plant specific
Until now, the SCR technique has only been applied on hard coal-fired plants.
Selective autocatalytic reduction (SACR)
New technique for NOX reduction, already under fullscale demonstration
Combined techniques
Reduction of NOX
and SO2
Possible, But rarely applied in
new plants
Possible, but rarely
applied
Very limited
Depends on
the individual process
Not available
The combined techniques covers only a small market share compared to SCR techniques
Table 2.9: Techniques to consider for the prevention and control of NOX and N2O emissions
*See next page for explanations on this technique
Eşleştirme Projesi TR 08 IB EN 03 IPPC – Entegre Kirlilik Önleme ve Kontrol
T.C. Çevre ve Şehircilik Bakanlığı
33
Selective Catalytic Reduction (SCR). Selective Non-Catalytic Reduction (SNCR) And
Desonox Process.
1. SELECTIVE CATALYTIC REDUCTION (SCR).
The Selective Catalytic Reduction (SCR) process is a widely applied process for the
reduction of nitrogen oxides in exhaust gases from LCPs installations.
The SCR process is a catalytic process based on the selective reduction of nitrogen oxides
with a reduction agent (ammonia or urea) in the presence of a catalyst. The reducing
agent is injected into the flue-gas upstream of the catalyst. NOx conversion reaction takes
place on the catalytic surface at a temperature usually between 170 -510 ºC.
When ammonia is used as the reducing agent,it is usually stored as an aqueous solution
or in a liquefied state at a pressure and temperature conditions (17 bar at 20ºC).
In some smaller applications (LCPs<50MW), urea is used in the form of white crystal
granules,which are dissolved in water before being injected.
2. SELECTIVE NON-CATALYTIC REDUCTION (SNCR).
The selective non-catalytic reduction (SNCR) process is another secondary measure to
reduce nitrogen oxides already formed in the flue-gas of combustion unit. It is operated
without a catalyst at a temperature of between 850-1.100 ºC. This temperature window
strongly depends on the reagent used (ammonia,urea or caustic ammonia).
An SNCR facility consists of two operational units :
- The reagent storage unit, including storing,cooling and evaporation of the reagent.
- The SNCR unit itself,where the injection of the reagent and the reaction of
nitrogen oxides to nitrogen and water take place.
3. DESONOX process is a combined technique to reduce sulphur oxide and nitrogen
oxide emissions.
In the DESONOX process, flue-gases are first passed through an ESP (Electrostatic
Precipitator) to remove particles, followed by ammonia injection and SCR (Selective
Catalytic Reduction).
The gases are then cooled by preheating combustion air, and reheating the fully treated
flue-gases prior to release to the air. The temperature of the flue-gas is thus reduced to
approximately 140 ºC which enables the catalytic oxidation of SO2 to SO3 and its
subsequent condensation as sulphuric acid (70%).
The latter step is accomplished in a recirculating acid tower. The flue-gases are finally
directed through a wet electrostatic mist precipitator and are reheated prior to release.
Eşleştirme Projesi TR 08 IB EN 03 IPPC – Entegre Kirlilik Önleme ve Kontrol
T.C. Çevre ve Şehircilik Bakanlığı
34
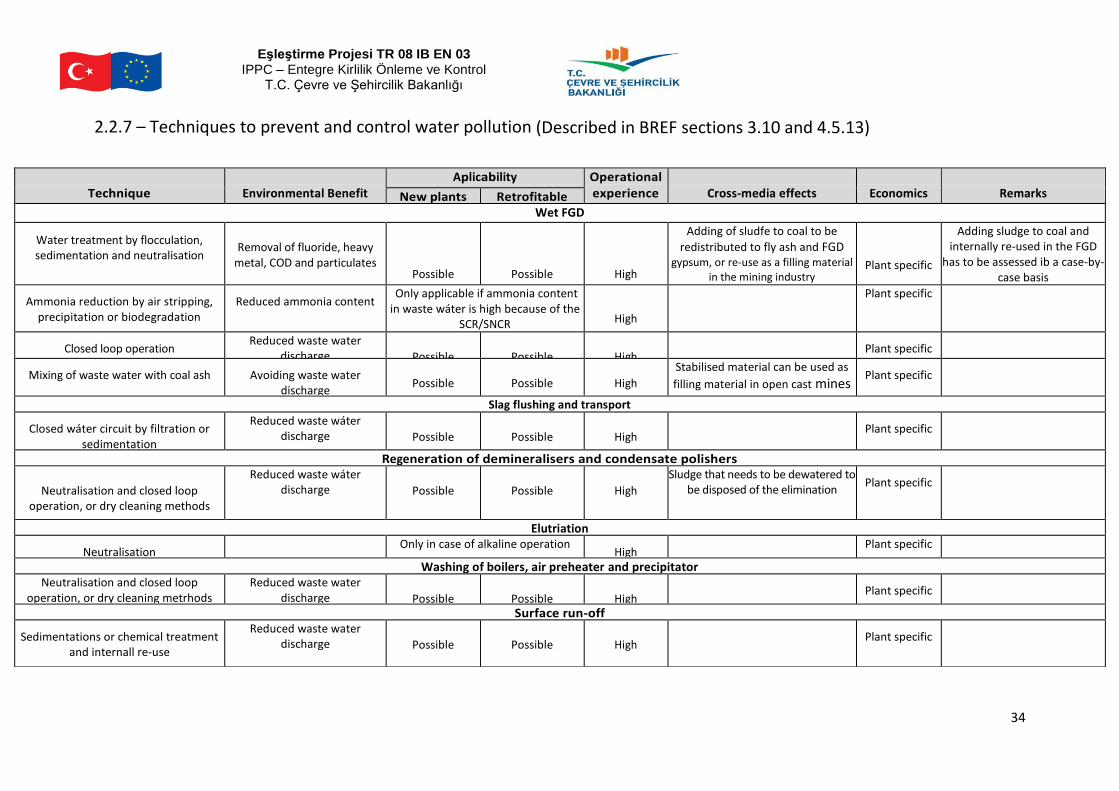
2.2.7 – Techniques to prevent and control water pollution (Described in BREF sections 3.10 and 4.5.13)
Technique
Environmental Benefit
Aplicability Operational experience
Cross-media effects
Economics
Remarks New plants Retrofitable
Wet FGD
Water treatment by flocculation, sedimentation and neutralisation
Removal of fluoride, heavy
metal, COD and particulates
Possible
Possible
High
Adding of sludfe to coal to be
redistributed to fly ash and FGD
gypsum, or re-use as a filling material in the mining industry
Plant specific
Adding sludge to coal and internally re-used in the FGD
has to be assessed ib a case-by-case basis
Ammonia reduction by air stripping, precipitation or biodegradation
Reduced ammonia content Only applicable if ammonia content in waste wáter is high because of the
SCR/SNCR
High
Plant specific
Closed loop operation Reduced waste water discharge
Possible
Possible
High
Plant specific
Mixing of waste water with coal ash
Avoiding waste water discharge
Possible
Possible
High
Stabilised material can be used as
filling material in open cast mines
Plant specific
Slag flushing and transport
Closed wáter circuit by filtration or sedimentation
Reduced waste wáter discharge
Possible
Possible
High
Plant specific
Regeneration of demineralisers and condensate polishers
Neutralisation and closed loop operation, or dry cleaning methods
Reduced waste wáter discharge
Possible
Possible
High
Sludge that needs to be dewatered to be disposed of the elimination
Plant specific
Elutriation
Neutralisation Only in case of alkaline operation
High Plant specific Washing of boilers, air preheater and precipitator
Neutralisation and closed loop operation, or dry cleaning metrhods
Reduced waste water discharge
Possible
Possible
High
Plant specific
Surface run-off
Sedimentations or chemical treatment and internall re-use
Reduced waste water discharge
Possible
Possible
High
Plant specific

Eşleştirme Projesi TR 08 IB EN 03 IPPC – Entegre Kirlilik Önleme ve Kontrol
T.C. Çevre ve Şehircilik Bakanlığı
35
Table 2.10: Techniques to consider for the prevention and control of water pollution
36
2.3.-Solid fuel storage and Treatment.
Combustion plants using lignite as a fuel were usually built in the vicinity of the mine. The fuel supply system depends on the mineral extraction system at the mine. These mines are almost always open air mines. The transport of ore from the mine to the fuel stockyard can be performed on conveyor belts, wagons and/or trucks.
In other large combustion plants using solid fuels different from lignite (coal: anthracite, soft coal), the ore coming to the coal yard can come from nearby coal mines or other areas far away from it.
2.3.1 Unloading, storage and handling of coal and lignite
2.3.1.1 Coal and lignite stockyards
Coal and lignite are usually stored in open-air piles (coal stockyards), with a storage capacity ranging from a few days to several months and in some cases even up to one year of operation. This additional storage capacity helps to improve fuel supply security, as it allows to reduce dependence on transport.
The surface of the solid fuel stockyard is designed as a function of the power production capacity of the plant. In some plants with environmental problems associated with dust emissions from the solid fuel stored in the stockyard (eg: close towns) a cover is recommended for the stockyard, and humidification systems installed along the sides of the stockyard in order to prevent particles from getting out of this area and reach agricultural land / livestock or residential areas.
In the stockyard particle production can also happen because in this area are used machines and pickers accumulating and picking up solid fuel, which are the ones delivering the coal to the mills of the power station.
Storage and transportation of fuel can also contribute to the formation of dust. During loading and unloading of open air piles, it is important to minimize the height from which the fuel is dropped to the pile or conveyor belts, in order to prevent fugitive dust emissions.
In urban areas, transport systems have to be closed systems in order to reduce fugitive emissions.
Stockyards should have their perimeter channels paved with concrete, to collect rain water that may come into contact with the stored coal. This water should be directed to a solids settling basin and then be discharged to a stream or the sea.
2.3.1.2 Storage of fuel oil and gasoil
In the start-up of large combustion plants using lignite it is necessary to use fuel oil or gasoil. The gasoil is used for start-ups and the fuel oil for start-ups and support.
For the storage of fuel oil and gasoil both underground and open air tanks are used whose capacity is a function of the power of the plant. Fuel pumps pump the fluid from the tanks to the boiler.
These tanks must have safety measures and the bunds necessary to prevent that, if leakage and/or spills occurs, they will get in contact with liquid effluents and/or to groundwater.
37
2.3.1.3. Treatment additives and reactants
Chemical treatment additives and reactants are used for different purposes in combustion plants.
They can be used in emission reduction equipment, desulphurization equipment, to reduce nitrogen oxides or in water and waste water treatment plants.
The chemical reactants, for example, are used in the refilling of the water boiler, while biocides are used in cooling systems.
The supplier or the head of the plant establishes how these materials should be stored. The reactants may react with each other and, therefore, the storage and handling methods typically include segregation of reactive materials.
The liquids are stored in drums or tanks within a fenced area, in the open air or in an enclosed space; they may be covered using acid and chemicals-resistant coatings. Powdered solids such as lime, are stored in silos, drums or bags placed inside an enclosed space with isolated drainage system. Solid raw materials of larger size are usually stored in open air stockyards. For transporting material mechanical or pneumatic transport systems are used (eg, screw conveyors, bucket elevators, etc..).
The gases are distributed to the various processes of the plant through pipes, which lie on top of the facilities and have protection systems. Health and safety regulations regulate the storage and distribution of liquid or gaseous ammonia, which is used in the SCR and SNCR systems for reducing NOx
emissions.
2.4. - Additional treatments for the solid fuel used in the power
plant
2.4.1. Pretreatment of coal and lignite
Careful selection of the coal is an effective way of reducing air and water emissions and of reducing residues. Low levels of sulphur and ash need to be given particular attention when using coal as a fuel when using commercially supplied or imported coal. It is important to use fuels with a high energy content and which incur minimum transport and handling costs. The risk of fire and explosion is a major risk from the pretreatment of coal. To achieve a constant fuel quality, which helps to optimise the combustion process, coal is sometimes blended or mixed, depending on the specification range of the combustion plant. This mixing can be simply achieved by picking coal from the stockpile in a different sequence from the actual unloading sequence or by blending different types of coal in silos between the coal yard and the raw-coal bunkers. The effects of a leaner fuel mix: • CO2-content in flue-gas drops • flow of air and flue-gas increses • O2 content in flue-gas rises • losses through exhaust gas increses • energy consumption from fans, and specific CO2 emission increase
38
• efficiency decreases. Aim of a leaner fuel mix: • drop of combustion chamber temperatures (dry bottom furnace) • decrease of primary NOX in flue-gas (less NH3 consumption, longer operation period of SCR) • decrease of CO content in combustion gas (less corrosion risk) • decrease of unburned in fly ash (utilisation quality of fly ash) • increased consumption of catalysts. The effects of a richer fuel mix: • CO2 content in flue-gas rises • flow of air and flue-gas drops • O2 content in flue-gas decreases • losses through exhaust gas drops • energy consumption from fan, and specific CO2 emission decrease. Aim of a richer fuel mix: • rise of combustion chamber temperature (slag tap furnace, better ash extraction) • increase of efficiency. Qualifying conditions: • CO content in combustion gas should not increase • no increase in unburned carbon fly ash (risk of higher corrosion or higher ash recirculation) Aim independent of a lean or rich fuel mix: • decrease of SOx in flue-gas for plants without (or low efficient) FGD • or increase of SOx in flue-gas for efficient ESP operation (ash resistence). Lignite is transferred from the lignite storage yard via belt conveyors (normally located under a roof) to the crusher house, where its size is reduced in hammer mills and two roller crushers to pieces of 80 – 40 mm or less. The crushed lignite is then transported via belt conveyors to the boiler bunkers. There are normally to six to eight bunkers to each boiler, each with enough capacity for four to eight hours of full operation of the steam generation unit with the mills operating at their nominal capacity with the worst lignite design quality. The lignite moisture at this stage is 15-53%so only insignificant amounts of lignite dust are emitted during transportation and crushing, except at the transfer points where, due to air draughts, lignite dust may be created, but this occurs only locally and even then only to a limited extent. In order to ensure healthy working conditions in the bunker house, the crusher house and with the lignite handling systems, all necessary measures are taken, for example by the installation of dedusting systems with air suction at the transfer points and at the closed belt conveyors. The air is cleaned in fabric filters to keep the dust concentration inside buildings below the maximum allowed concentration for working conditions.
39
2.4.2. Fuel preparation
2.4.2.1 Fuel preparation for pulverized hard coal combustion
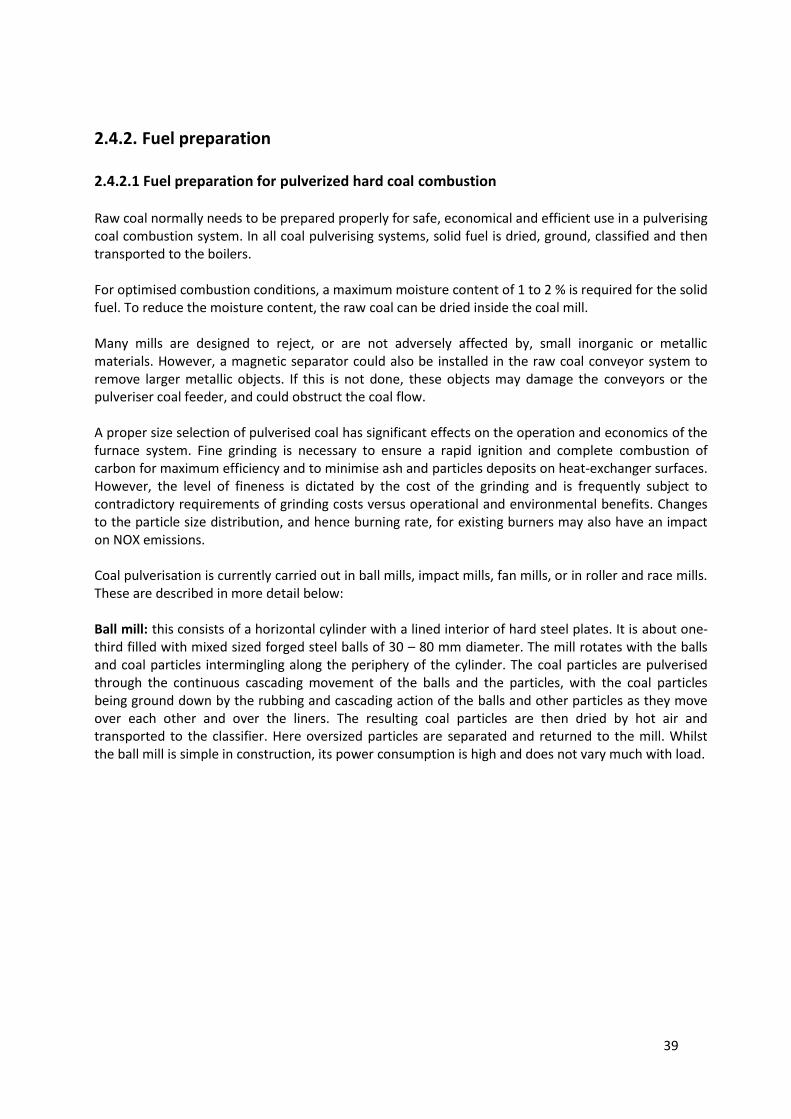
Raw coal normally needs to be prepared properly for safe, economical and efficient use in a pulverising coal combustion system. In all coal pulverising systems, solid fuel is dried, ground, classified and then transported to the boilers. For optimised combustion conditions, a maximum moisture content of 1 to 2 % is required for the solid fuel. To reduce the moisture content, the raw coal can be dried inside the coal mill. Many mills are designed to reject, or are not adversely affected by, small inorganic or metallic materials. However, a magnetic separator could also be installed in the raw coal conveyor system to remove larger metallic objects. If this is not done, these objects may damage the conveyors or the pulveriser coal feeder, and could obstruct the coal flow. A proper size selection of pulverised coal has significant effects on the operation and economics of the furnace system. Fine grinding is necessary to ensure a rapid ignition and complete combustion of carbon for maximum efficiency and to minimise ash and particles deposits on heat-exchanger surfaces. However, the level of fineness is dictated by the cost of the grinding and is frequently subject to contradictory requirements of grinding costs versus operational and environmental benefits. Changes to the particle size distribution, and hence burning rate, for existing burners may also have an impact on NOX emissions. Coal pulverisation is currently carried out in ball mills, impact mills, fan mills, or in roller and race mills. These are described in more detail below: Ball mill: this consists of a horizontal cylinder with a lined interior of hard steel plates. It is about one-third filled with mixed sized forged steel balls of 30 – 80 mm diameter. The mill rotates with the balls and coal particles intermingling along the periphery of the cylinder. The coal particles are pulverised through the continuous cascading movement of the balls and the particles, with the coal particles being ground down by the rubbing and cascading action of the balls and other particles as they move over each other and over the liners. The resulting coal particles are then dried by hot air and transported to the classifier. Here oversized particles are separated and returned to the mill. Whilst the ball mill is simple in construction, its power consumption is high and does not vary much with load.
40
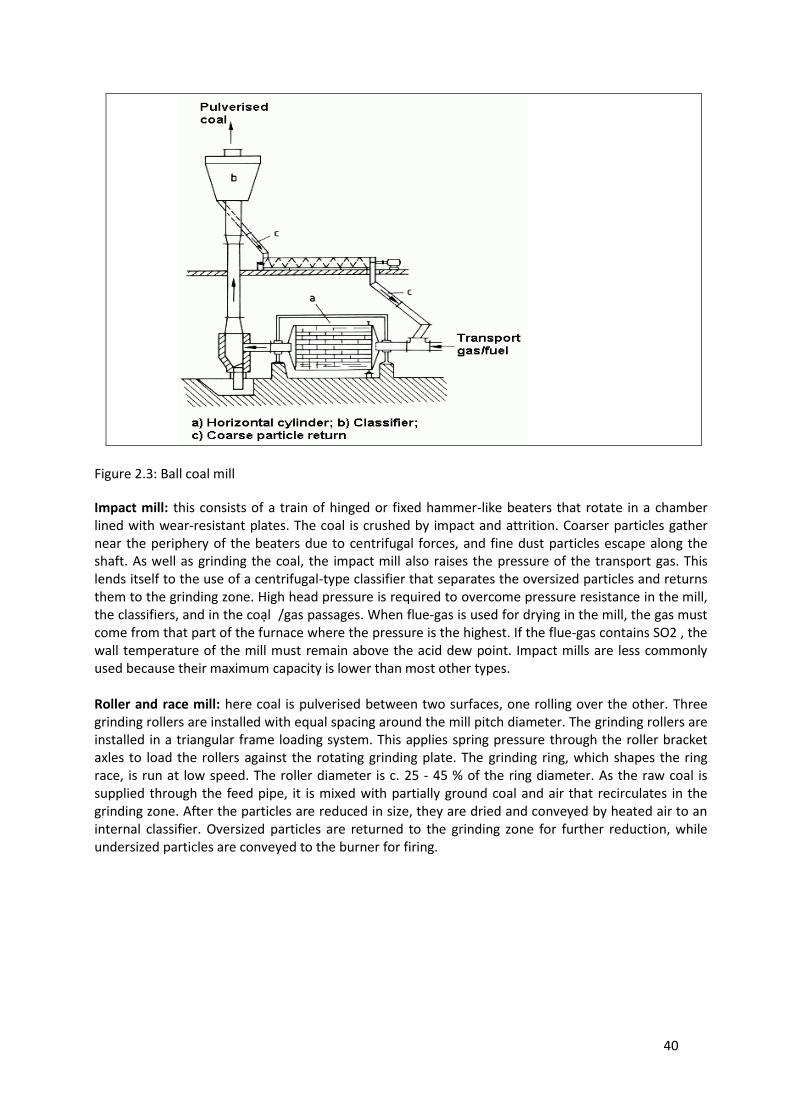
Figure 2.3: Ball coal mill
Impact mill: this consists of a train of hinged or fixed hammer-like beaters that rotate in a chamber lined with wear-resistant plates. The coal is crushed by impact and attrition. Coarser particles gather near the periphery of the beaters due to centrifugal forces, and fine dust particles escape along the shaft. As well as grinding the coal, the impact mill also raises the pressure of the transport gas. This lends itself to the use of a centrifugal-type classifier that separates the oversized particles and returns them to the grinding zone. High head pressure is required to overcome pressure resistance in the mill, the classifiers, and in the coal /gas passages. When flue-gas is used for drying in the mill, the gas must come from that part of the furnace where the pressure is the highest. If the flue-gas contains SO2 , the wall temperature of the mill must remain above the acid dew point. Impact mills are less commonly used because their maximum capacity is lower than most other types. Roller and race mill: here coal is pulverised between two surfaces, one rolling over the other. Three grinding rollers are installed with equal spacing around the mill pitch diameter. The grinding rollers are installed in a triangular frame loading system. This applies spring pressure through the roller bracket axles to load the rollers against the rotating grinding plate. The grinding ring, which shapes the ring race, is run at low speed. The roller diameter is c. 25 - 45 % of the ring diameter. As the raw coal is supplied through the feed pipe, it is mixed with partially ground coal and air that recirculates in the grinding zone. After the particles are reduced in size, they are dried and conveyed by heated air to an internal classifier. Oversized particles are returned to the grinding zone for further reduction, while undersized particles are conveyed to the burner for firing.
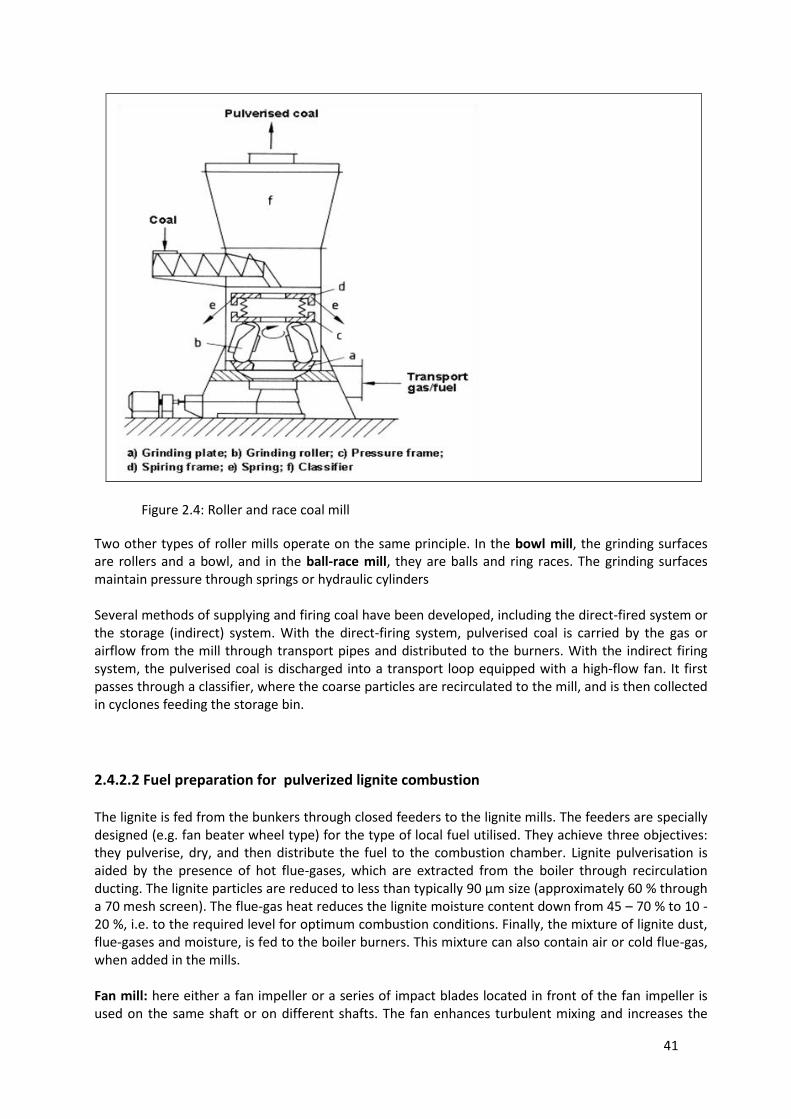
41
Figure 2.4: Roller and race coal mill
Two other types of roller mills operate on the same principle. In the bowl mill, the grinding surfaces are rollers and a bowl, and in the ball-race mill, they are balls and ring races. The grinding surfaces maintain pressure through springs or hydraulic cylinders Several methods of supplying and firing coal have been developed, including the direct-fired system or the storage (indirect) system. With the direct-firing system, pulverised coal is carried by the gas or airflow from the mill through transport pipes and distributed to the burners. With the indirect firing system, the pulverised coal is discharged into a transport loop equipped with a high-flow fan. It first passes through a classifier, where the coarse particles are recirculated to the mill, and is then collected in cyclones feeding the storage bin.
2.4.2.2 Fuel preparation for pulverized lignite combustion
The lignite is fed from the bunkers through closed feeders to the lignite mills. The feeders are specially designed (e.g. fan beater wheel type) for the type of local fuel utilised. They achieve three objectives: they pulverise, dry, and then distribute the fuel to the combustion chamber. Lignite pulverisation is aided by the presence of hot flue-gases, which are extracted from the boiler through recirculation ducting. The lignite particles are reduced to less than typically 90 μm size (approximately 60 % through a 70 mesh screen). The flue-gas heat reduces the lignite moisture content down from 45 – 70 % to 10 - 20 %, i.e. to the required level for optimum combustion conditions. Finally, the mixture of lignite dust, flue-gases and moisture, is fed to the boiler burners. This mixture can also contain air or cold flue-gas, when added in the mills. Fan mill: here either a fan impeller or a series of impact blades located in front of the fan impeller is used on the same shaft or on different shafts. The fan enhances turbulent mixing and increases the
42
relative and absolute velocity of the particles and the gas. Mixing contributes both to a uniform distribution of the coal particles over the impeller’s circumference and also to a drying of coal with high moisture content. Lignite, which contains high moisture levels, may be coarsely ground.
Figure 2.5: Fan mill for lignite milling
When lignite of extremely low heating value and of high moisture content is used as the fuel, an additional step prior to feeding it into the combustion chamber is necessary, for more effective removal of lignite moisture. For this purpose, after the mills, a stream rich in lignite and moisture is directed to specially designed electrostatic precipitators, where the dry lignite particles are separated and then fed to the lower boiler burners. From the lignite electrostatic precipitators, the mixture of flue-gases and moisture is directed via induced fans to the stack or to the FGD.
2.4.2.3 Fuel preparation for grate firing (GF)
If combustion is to be carried out on grates, then normally there is only limited fuel preparation needed. Large pieces of solid fuel may be reduced in size in order to supply a more or less homogeneous particle size distribution into the combustion chamber for burning on the grate. The maximum size of the fuel particles is often determined by the feed systems for the combustion chamber and depending on the technical conditions of the grate.
2.4.2.4 Fuel preparation for fluidised bed combustion (FBC) Fluidised bed combustion needs most solid fuels to be crushed. Depending on the fuel properties maximum grain sizes of between 3 and 20 mm are desired. The prepared fuel is transferred directly to the fluidised bed in the combustion chamber, where the average bed particle size is 1000 μm for bubbling fluidised bed combustion (BFBC) and 100 – 1000 μm for circulating fluidised bed combustion (CFBC).
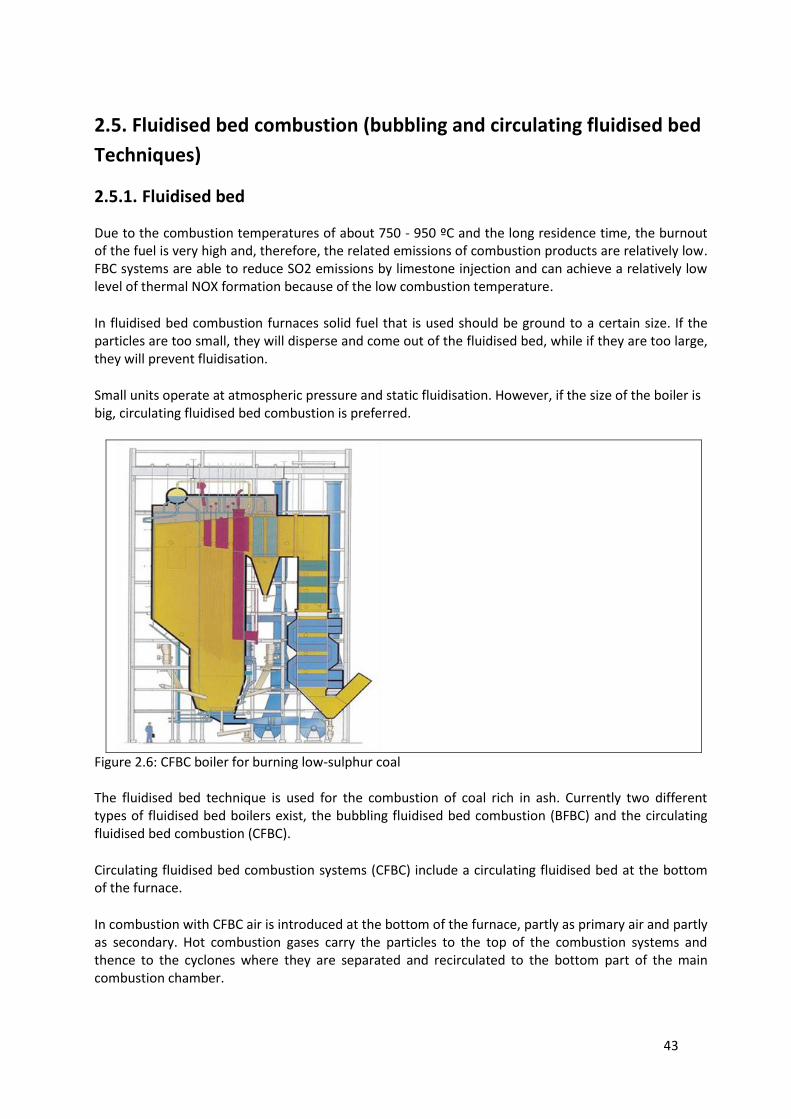
43
2.5. Fluidised bed combustion (bubbling and circulating fluidised bed
Techniques)
2.5.1. Fluidised bed
Due to the combustion temperatures of about 750 - 950 ºC and the long residence time, the burnout of the fuel is very high and, therefore, the related emissions of combustion products are relatively low. FBC systems are able to reduce SO2 emissions by limestone injection and can achieve a relatively low level of thermal NOX formation because of the low combustion temperature.
In fluidised bed combustion furnaces solid fuel that is used should be ground to a certain size. If the particles are too small, they will disperse and come out of the fluidised bed, while if they are too large, they will prevent fluidisation.
Small units operate at atmospheric pressure and static fluidisation. However, if the size of the boiler is big, circulating fluidised bed combustion is preferred.
Figure 2.6: CFBC boiler for burning low-sulphur coal The fluidised bed technique is used for the combustion of coal rich in ash. Currently two different types of fluidised bed boilers exist, the bubbling fluidised bed combustion (BFBC) and the circulating fluidised bed combustion (CFBC).
Circulating fluidised bed combustion systems (CFBC) include a circulating fluidised bed at the bottom of the furnace.
In combustion with CFBC air is introduced at the bottom of the furnace, partly as primary air and partly as secondary. Hot combustion gases carry the particles to the top of the combustion systems and thence to the cyclones where they are separated and recirculated to the bottom part of the main combustion chamber.
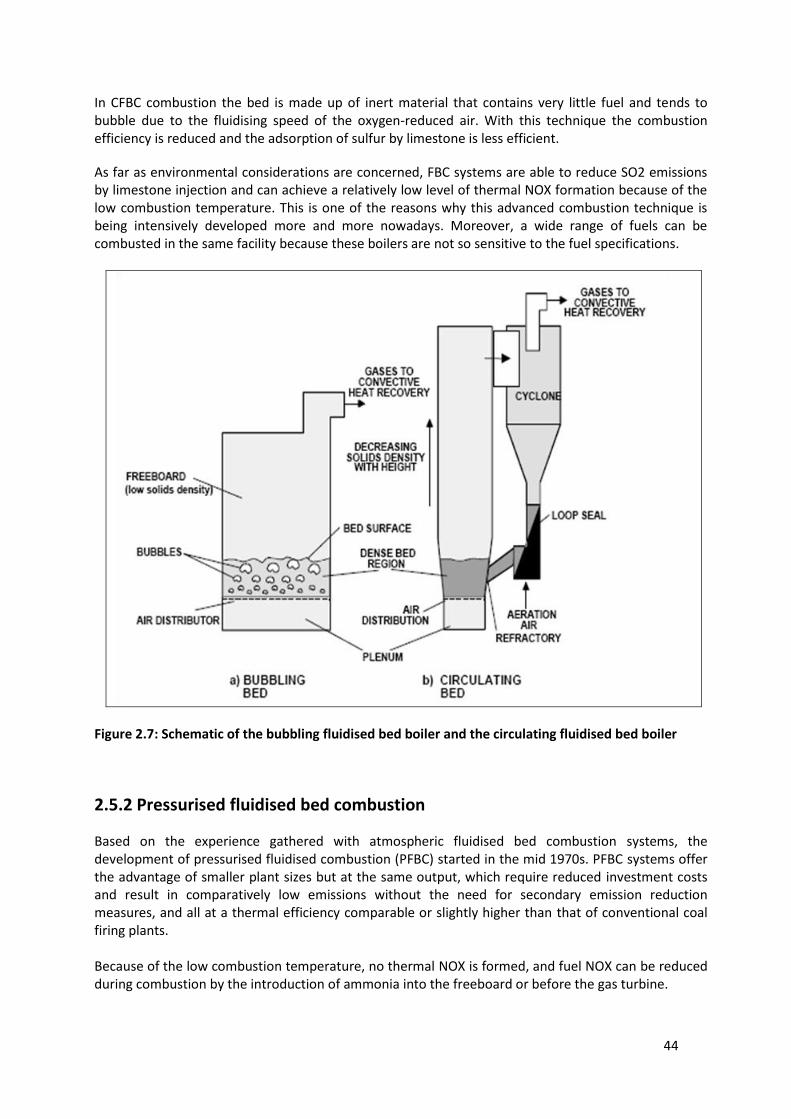
44
In CFBC combustion the bed is made up of inert material that contains very little fuel and tends to bubble due to the fluidising speed of the oxygen-reduced air. With this technique the combustion efficiency is reduced and the adsorption of sulfur by limestone is less efficient.
As far as environmental considerations are concerned, FBC systems are able to reduce SO2 emissions by limestone injection and can achieve a relatively low level of thermal NOX formation because of the low combustion temperature. This is one of the reasons why this advanced combustion technique is being intensively developed more and more nowadays. Moreover, a wide range of fuels can be combusted in the same facility because these boilers are not so sensitive to the fuel specifications.
Figure 2.7: Schematic of the bubbling fluidised bed boiler and the circulating fluidised bed boiler
2.5.2 Pressurised fluidised bed combustion
Based on the experience gathered with atmospheric fluidised bed combustion systems, the development of pressurised fluidised combustion (PFBC) started in the mid 1970s. PFBC systems offer the advantage of smaller plant sizes but at the same output, which require reduced investment costs and result in comparatively low emissions without the need for secondary emission reduction measures, and all at a thermal efficiency comparable or slightly higher than that of conventional coal firing plants. Because of the low combustion temperature, no thermal NOX is formed, and fuel NOX can be reduced during combustion by the introduction of ammonia into the freeboard or before the gas turbine.
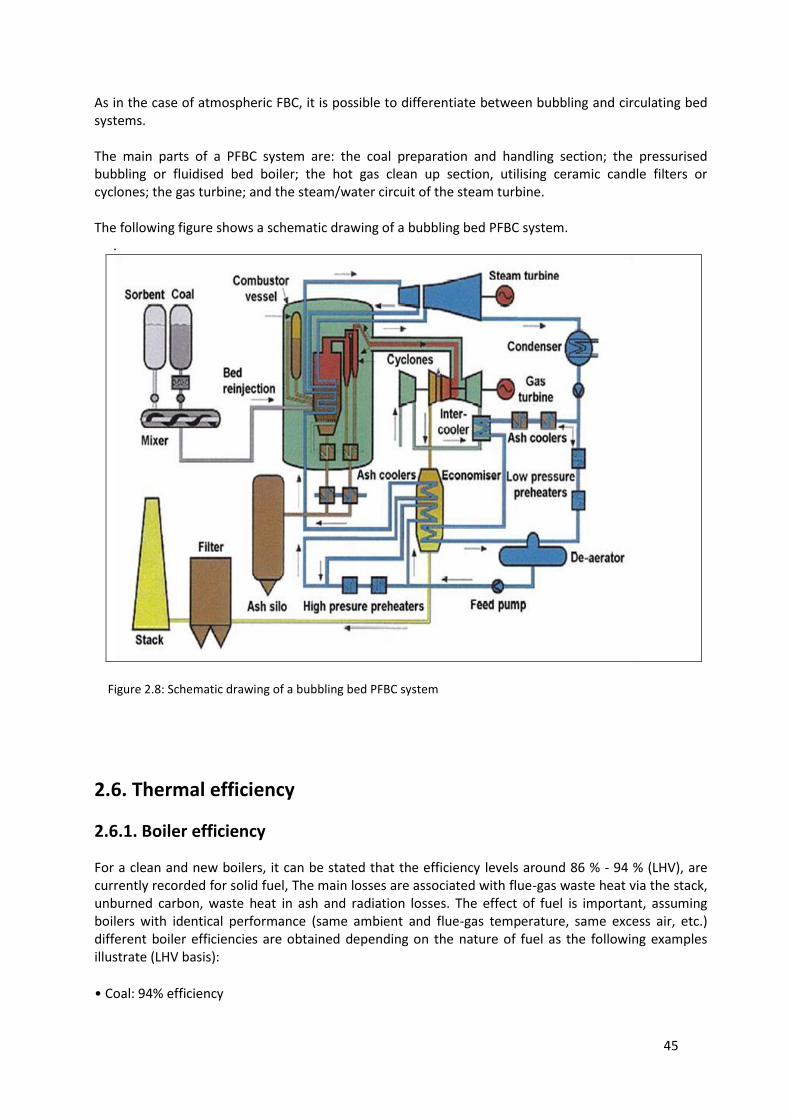
45
As in the case of atmospheric FBC, it is possible to differentiate between bubbling and circulating bed systems. The main parts of a PFBC system are: the coal preparation and handling section; the pressurised bubbling or fluidised bed boiler; the hot gas clean up section, utilising ceramic candle filters or cyclones; the gas turbine; and the steam/water circuit of the steam turbine. The following figure shows a schematic drawing of a bubbling bed PFBC system.
.
Figure 2.8: Schematic drawing of a bubbling bed PFBC system
2.6. Thermal efficiency
2.6.1. Boiler efficiency
For a clean and new boilers, it can be stated that the efficiency levels around 86 % - 94 % (LHV), are currently recorded for solid fuel, The main losses are associated with flue-gas waste heat via the stack, unburned carbon, waste heat in ash and radiation losses. The effect of fuel is important, assuming boilers with identical performance (same ambient and flue-gas temperature, same excess air, etc.) different boiler efficiencies are obtained depending on the nature of fuel as the following examples illustrate (LHV basis):
• Coal: 94% efficiency
46
• Lignite: 92% efficiency
• Low grate lignite: 86%.
2.6.2. Techniques to increase coal-fired boilers efficiency
Coal-fired boiler efficiency is closely linked with the nature of the fuel and the temperature of the ambient air (the project-input data). However, optimisation of some parameters is possible:
unburned carbon in ash. Optimisation of combustion leads to less unburned carbon in ash. It should be noted that NOX abatement technologies by combustion modification show a tendency to increase unburned carbon.The target is to achieve the best burnout in order to the achieve the optimum efficiency or fuel utilisation. However, according to technical and fuel chracteristics in particular by burning anthracite coal, a higher content of unburned carbon in ash may occur
air excess. Excess air is dependent on the type of boiler and on the nature of fuel. Typically, 20 % of excess air is the figure for pulverised coal fired boiler with a dry bottom. Due to combustion quality (CO and unburned carbon formation), boiler integrity (air in-leakage), corrosion and safety (risk of thermal excursions in the boiler) it is often not possible to reduce the excess air any further
flue-gas temperature. The flue- gas temperature leaving the clean boiler (depending on fuel type) traditionally lies between 120 and 220 °C so as to avoid the risk of acid corrosion by condensation of sulphuric acid. However, some designs sometimes incorporate a second stage of air heater to lower this temperature below 100 °C, but with special cladding on the air heater and the stack, which makes this reduction economically less attractive.
2.7. Process examples.
In the following are shown a few examples of Turkish coal power plants. The indicated values are updated to 2012 and comply with the current Turkish legislation.
Table 2.11: Typical energy efficiencies (LHV net) for different technologies of Turkish solid fuel-fired LCPs.
Technology used in the installation
PSFC PSFC CFBC PSFC
Electric capacity (MWe)
22-360
150 160
210
Steam temperature (°C)
489--545 535 543 540
Cooling system Cooling tower Sea water Dry Cooling
tower Sea water
Design coal Lignite Bituminous Lignite Lignite
Lower heating value (MJ/kg)
4,723-16,3 12,12-12,95 10,886(±%10) 6,45-8,15
Ash content (%) 18-45 45 32 39-47
Moisture (%) 53-23 18 22 29-37
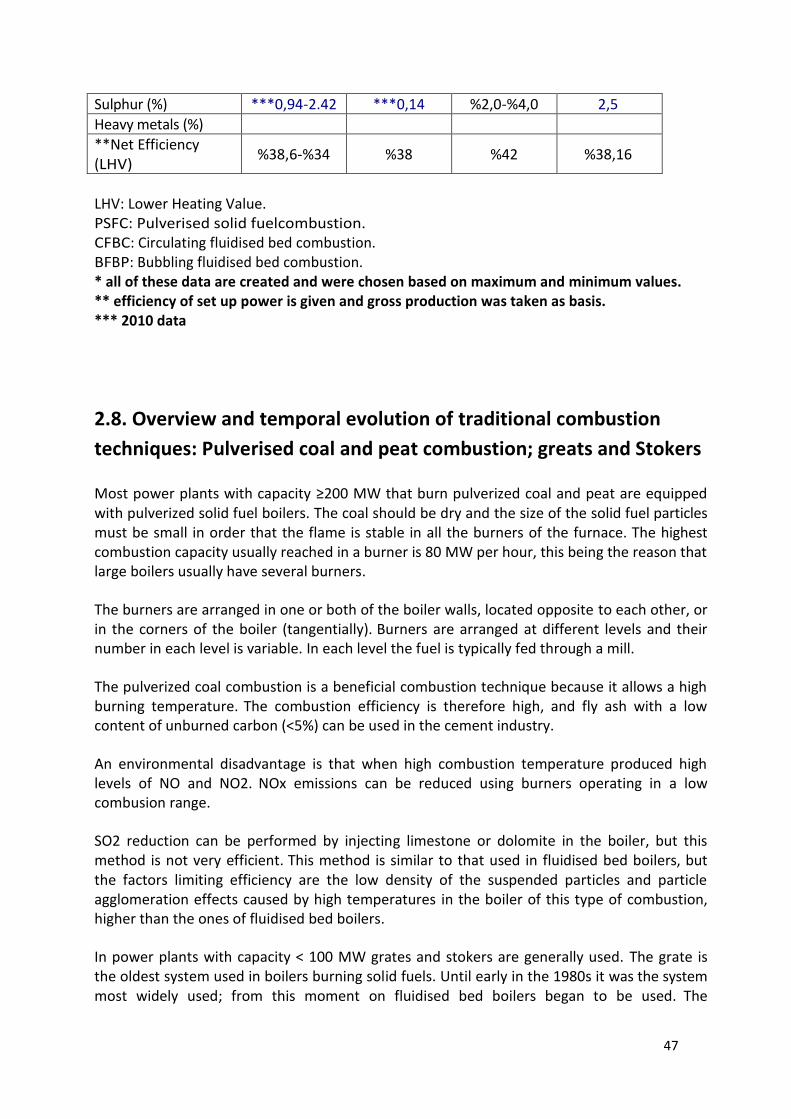
47
Sulphur (%) ***0,94-2.42 ***0,14 %2,0-%4,0 2,5
Heavy metals (%)
**Net Efficiency (LHV)
%38,6-%34 %38 %42 %38,16
LHV: Lower Heating Value. PSFC: Pulverised solid fuelcombustion. CFBC: Circulating fluidised bed combustion. BFBP: Bubbling fluidised bed combustion. * all of these data are created and were chosen based on maximum and minimum values. ** efficiency of set up power is given and gross production was taken as basis. *** 2010 data
2.8. Overview and temporal evolution of traditional combustion
techniques: Pulverised coal and peat combustion; greats and Stokers
Most power plants with capacity ≥200 MW that burn pulverized coal and peat are equipped with pulverized solid fuel boilers. The coal should be dry and the size of the solid fuel particles must be small in order that the flame is stable in all the burners of the furnace. The highest combustion capacity usually reached in a burner is 80 MW per hour, this being the reason that large boilers usually have several burners.
The burners are arranged in one or both of the boiler walls, located opposite to each other, or in the corners of the boiler (tangentially). Burners are arranged at different levels and their number in each level is variable. In each level the fuel is typically fed through a mill.
The pulverized coal combustion is a beneficial combustion technique because it allows a high burning temperature. The combustion efficiency is therefore high, and fly ash with a low content of unburned carbon (<5%) can be used in the cement industry.
An environmental disadvantage is that when high combustion temperature produced high levels of NO and NO2. NOx emissions can be reduced using burners operating in a low combusion range.
SO2 reduction can be performed by injecting limestone or dolomite in the boiler, but this method is not very efficient. This method is similar to that used in fluidised bed boilers, but the factors limiting efficiency are the low density of the suspended particles and particle agglomeration effects caused by high temperatures in the boiler of this type of combustion, higher than the ones of fluidised bed boilers.
In power plants with capacity < 100 MW grates and stokers are generally used. The grate is the oldest system used in boilers burning solid fuels. Until early in the 1980s it was the system most widely used; from this moment on fluidised bed boilers began to be used. The
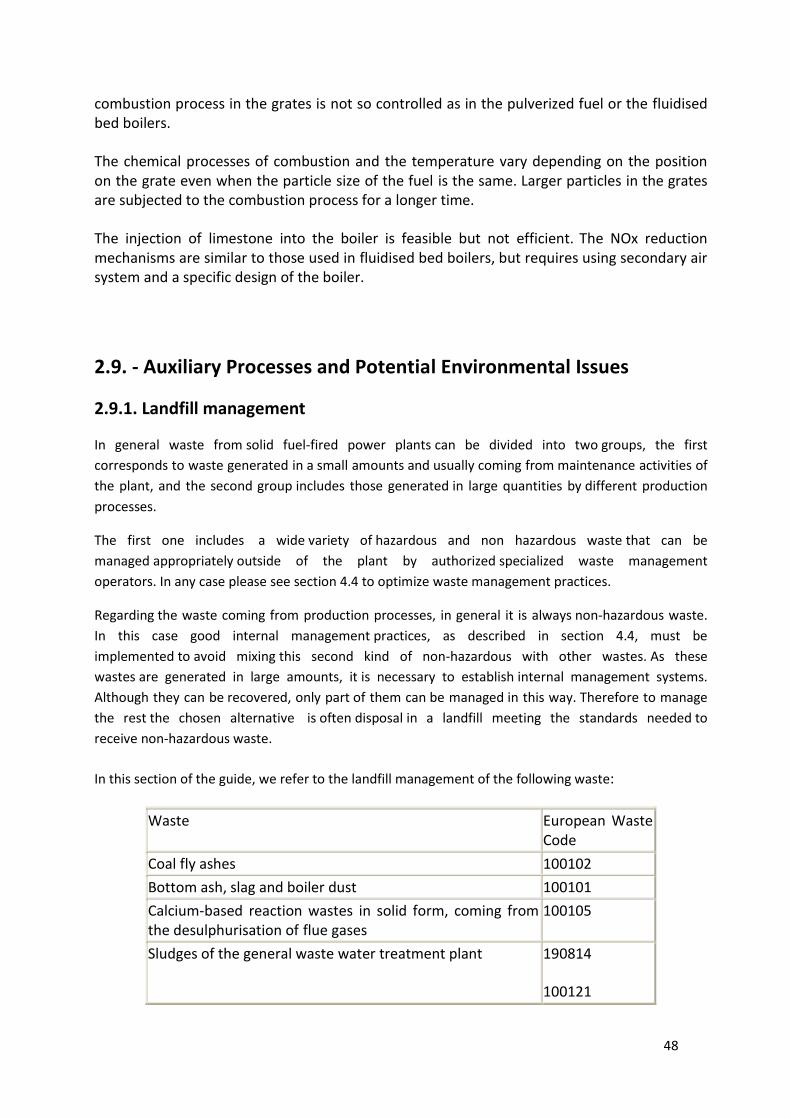
48
combustion process in the grates is not so controlled as in the pulverized fuel or the fluidised bed boilers.
The chemical processes of combustion and the temperature vary depending on the position on the grate even when the particle size of the fuel is the same. Larger particles in the grates are subjected to the combustion process for a longer time.
The injection of limestone into the boiler is feasible but not efficient. The NOx reduction mechanisms are similar to those used in fluidised bed boilers, but requires using secondary air system and a specific design of the boiler.
2.9. - Auxiliary Processes and Potential Environmental Issues
2.9.1. Landfill management
In general waste from solid fuel-fired power plants can be divided into two groups, the first
corresponds to waste generated in a small amounts and usually coming from maintenance activities of
the plant, and the second group includes those generated in large quantities by different production
processes.
The first one includes a wide variety of hazardous and non hazardous waste that can be
managed appropriately outside of the plant by authorized specialized waste management
operators. In any case please see section 4.4 to optimize waste management practices.
Regarding the waste coming from production processes, in general it is always non-hazardous waste.
In this case good internal management practices, as described in section 4.4, must be
implemented to avoid mixing this second kind of non-hazardous with other wastes. As these
wastes are generated in large amounts, it is necessary to establish internal management systems.
Although they can be recovered, only part of them can be managed in this way. Therefore to manage
the rest the chosen alternative is often disposal in a landfill meeting the standards needed to
receive non-hazardous waste.
In this section of the guide, we refer to the landfill management of the following waste:
Waste European Waste Code
Coal fly ashes 100102
Bottom ash, slag and boiler dust 100101
Calcium-based reaction wastes in solid form, coming from the desulphurisation of flue gases
100105
Sludges of the general waste water treatment plant 190814
100121
49
The management of these wastes must follow the guidelines set out in Directive 2008/98/EC of the European Parliament and the Council of 19 November 2008 on waste, and more concretely, in first place they have to follow the following hierarchy:
prevention; preparation for reuse; recycling; other recovery, eg energy recovery; elimination.
Accordingly, first measures must be taken to try to achieve the prevention of waste generation; but for this particular plants there are few measures other than to change fuels.
The next step is the direct reuse, it is done for the case of coal fly ashes through its incorporation as a raw material for cement industry and the "calcium-based reaction wastes in solid form, coming from the desulphurisation of flue gases" for the manufacture of plasterboard and also as raw material for cement industry among others. For this purpose, the national legislation on the use of waste should allow to consider these substances as by-products, in order to avoid the obligation to treat as a waste operator the industry which uses these substances as raw material for its processes. This will facilitate the reuse of those materials, which undoubtedly is the best possible management option.
In practice is not possible to reuse all the coal fly ashes and calcium-based reaction wastes in solid form, coming from the desulphurisation of flue gases, and in addition this also is closely linked to the fact that demand for cement is subject to significant fluctuations. There are two other kinds of waste in thermal power plants, the bottom ash, slag and boiler dust and sludges of the general waste water treatment plant which, in principle, are not fit for direct reuse actions, or they are generally more complex and especially given the large quantities produced. As large amount of waste are produced alternatives for recovery must be found.
In the event that the mine is close, the alternative use for the landscape recovery of that area is the best choice for all types of waste, except for sludges of the general waste water treatment plant, unless they are subjected to a previous drying process. In this case, the landscape recovery operations will be carried out in accordance with the landscape and environment restoration plan of the mine and will be aimed at the orographic restoration of the area and at creating a suitable surface for the growth of vegetation cover consistent with the one existing in the surroundings or for the final land use determined in the Restoration Plan.
Finally if none of the above alternatives is possible, a waste disposal facility for landfilling will be required in the thermal power station or close to it. This facility must comply with Directive 1999/31/EC of the Council of 26 April 1999 on the landfill of waste and in particular, the guidelines set out in this Directive for non-hazardous waste landfills.
This rule contains a number of requirements regarding the necessary measures to prevent pollution of soil and surface and groundwater systems by sealing the bottom and sides of the landfill and ensure the stability of the waste deposited. On the other hand it lays down conditions for the operation of the facility, among them actions to control that the waste
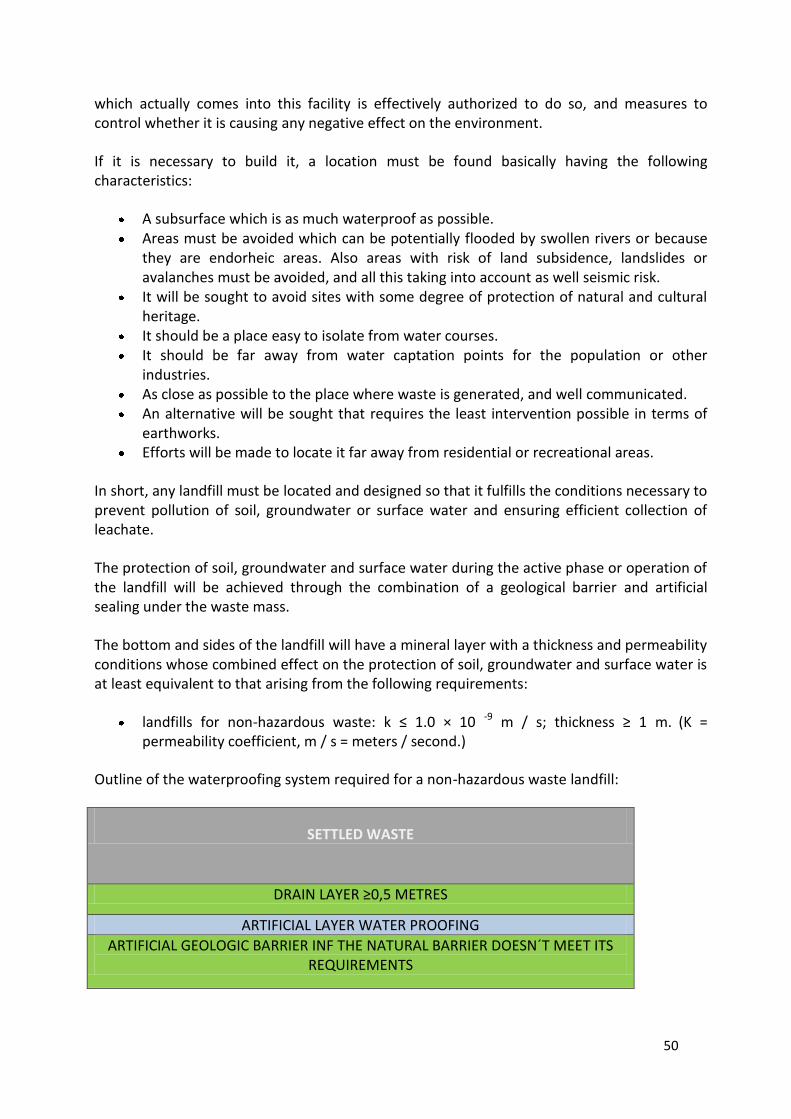
50
which actually comes into this facility is effectively authorized to do so, and measures to control whether it is causing any negative effect on the environment.
If it is necessary to build it, a location must be found basically having the following characteristics:
A subsurface which is as much waterproof as possible. Areas must be avoided which can be potentially flooded by swollen rivers or because
they are endorheic areas. Also areas with risk of land subsidence, landslides or avalanches must be avoided, and all this taking into account as well seismic risk.
It will be sought to avoid sites with some degree of protection of natural and cultural heritage.
It should be a place easy to isolate from water courses. It should be far away from water captation points for the population or other
industries. As close as possible to the place where waste is generated, and well communicated. An alternative will be sought that requires the least intervention possible in terms of
earthworks. Efforts will be made to locate it far away from residential or recreational areas.
In short, any landfill must be located and designed so that it fulfills the conditions necessary to prevent pollution of soil, groundwater or surface water and ensuring efficient collection of leachate.
The protection of soil, groundwater and surface water during the active phase or operation of the landfill will be achieved through the combination of a geological barrier and artificial sealing under the waste mass.
The bottom and sides of the landfill will have a mineral layer with a thickness and permeability conditions whose combined effect on the protection of soil, groundwater and surface water is at least equivalent to that arising from the following requirements:
landfills for non-hazardous waste: k ≤ 1.0 × 10 -9 m / s; thickness ≥ 1 m. (K = permeability coefficient, m / s = meters / second.)
Outline of the waterproofing system required for a non-hazardous waste landfill:
SETTLED WASTE
DRAIN LAYER ≥0,5 METRES
ARTIFICIAL LAYER WATER PROOFING
ARTIFICIAL GEOLOGIC BARRIER INF THE NATURAL BARRIER DOESN´T MEET ITS REQUIREMENTS
51
NORMAL GROUND WHERE A PROOFING COEFICIENT IS ≤10 -9
The possibility must be also taken into account that based on an assessment of risks to the environment, the leachate collection and treatment may not be necessary, or if it is established that the landfill poses an acceptable risk level to the ground, groundwater and surface water, location and natural and artificial waterproofing requirements described above may be modified or reduced accordingly.
After selecting the location, the first measure to be adopted is to control the quality of groundwater and water in rivers or lakes nearby, in order to have data of the "zero" state and use it as input to determine, if necessary, intervention levels; ie a level beyond which there is a significant change in water quality. This will be carried out using piezometers constructed for this purpose, which will be located so as to remain operational throughout the lifetime of the installation and until its final closure.
Geologic material extracted from this perforation will be used to perform the necessary geotechnical tests for determining the permeability of the ground up to the piezometric levels.
Similarly, since this facility may be a source of particles, mainly of those larger than 10 microns, a prior control of the levels of these particles in ambient air in the installation surroundings will be required, and a prior control of ambient noise should also be done.
One of the basic measures of control of these facilities is that the installation should have, if this is technically feasible, a safety drain under the artificial waterproofing systems. It would be desirable that it would not discharge any water flow or, if there is one, it should have similar characteristics to those of the site’s groundwater.
The facility will also have a system for extracting the leachate generated by the fluids that might contain the waste deposited or by the rainwater falling over the waste. This system can be linked to the management system of the waste water from the combustion plant or be a separate system.
Around the perimeter of the waste disposal facility there will be a curb to allow storm water discharge prior to its entry into the landfill, so that this water can be evacuated as clean water.
Finally this facility should have appropriate measures to control its proper operation. It is essential to have a piezometric perimetral network consisting of at least one probe upstream and two downstream with the right design to sample the groundwater quality avoiding pollution from their mouths. In new landfills, as discussed above it is recommended that these piezometers are the ones used in the design stage and maintained throughout the lifetime of the installation, while for existing landfills it will be necessary build them in the proper places, following the criteria of the environmental competent authority.
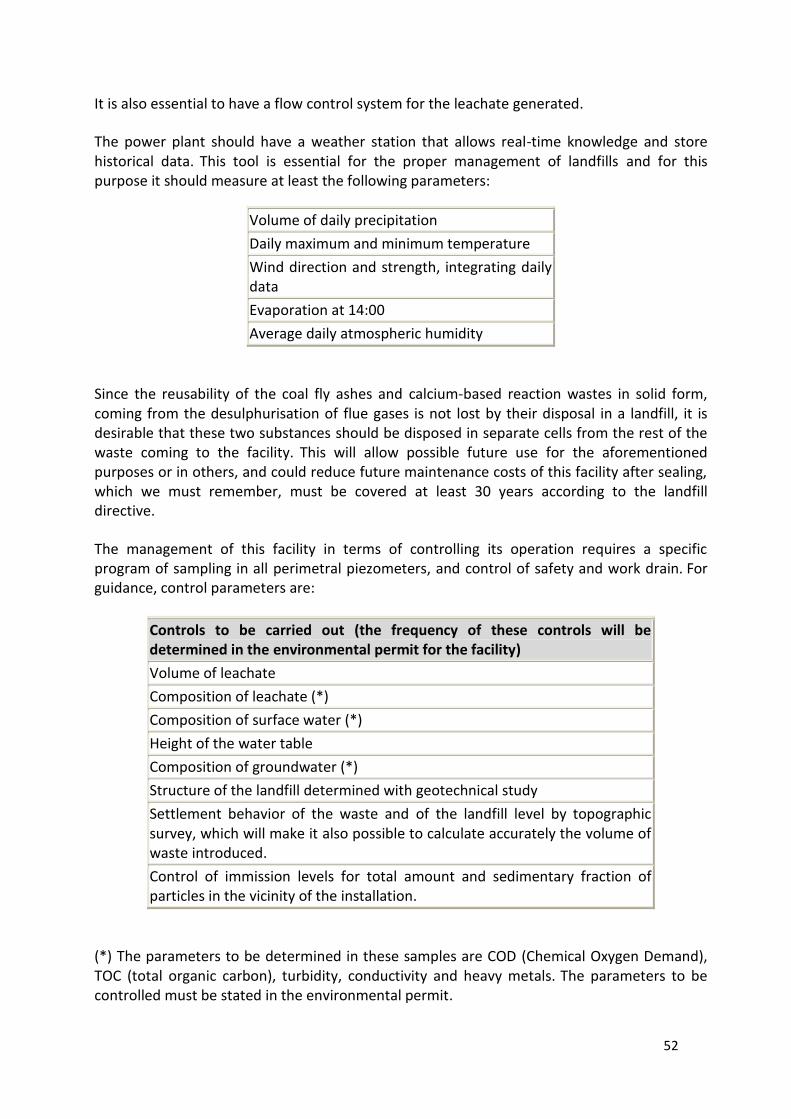
52
It is also essential to have a flow control system for the leachate generated.
The power plant should have a weather station that allows real-time knowledge and store historical data. This tool is essential for the proper management of landfills and for this purpose it should measure at least the following parameters:
Volume of daily precipitation
Daily maximum and minimum temperature
Wind direction and strength, integrating daily data
Evaporation at 14:00
Average daily atmospheric humidity
Since the reusability of the coal fly ashes and calcium-based reaction wastes in solid form, coming from the desulphurisation of flue gases is not lost by their disposal in a landfill, it is desirable that these two substances should be disposed in separate cells from the rest of the waste coming to the facility. This will allow possible future use for the aforementioned purposes or in others, and could reduce future maintenance costs of this facility after sealing, which we must remember, must be covered at least 30 years according to the landfill directive.
The management of this facility in terms of controlling its operation requires a specific program of sampling in all perimetral piezometers, and control of safety and work drain. For guidance, control parameters are:
Controls to be carried out (the frequency of these controls will be determined in the environmental permit for the facility)
Volume of leachate
Composition of leachate (*)
Composition of surface water (*)
Height of the water table
Composition of groundwater (*)
Structure of the landfill determined with geotechnical study
Settlement behavior of the waste and of the landfill level by topographic survey, which will make it also possible to calculate accurately the volume of waste introduced.
Control of immission levels for total amount and sedimentary fraction of particles in the vicinity of the installation.
(*) The parameters to be determined in these samples are COD (Chemical Oxygen Demand), TOC (total organic carbon), turbidity, conductivity and heavy metals. The parameters to be controlled must be stated in the environmental permit.
53
It should be noted that several of the parameters controlled by this process, in the EU and other European countries, should be reported to the European Pollutant Release and Transfer Register (E-PRTR), which aims at contributing to transparency and public participation in environmental decision-making .
On waste acceptance criteria laid down in Directive 1999/31/EC of the Council of 26 April on the landfill of waste and the European legislation developing it, it must be understood that they are not applicable to this case, because it is a specific landfill for a few kinds of waste which are always generated by the same producer. Likewise, the principle that all waste entering the landfill must have a pre-treatment will not apply because there is no prior treatment for these types of waste, except for the case of sludges, for which the only actions are the ones to reduce its moisture content.
Finally, from an administrative standpoint, two important issues must be taken into account regarding the management of the landfill. The first concerns the proper identification of the owner, and also of the operator in case that it is different from the owner. If the latter case occurs the levels of responsibility for the management and decision-making on the facility of owner and operator have to be determined.
On the other hand, it is necessary for the owner or, where appropriate, the operator to make a proper reserve, through the deposit of a (financial) bond or an equivalent guarantee in accordance with the rules determined by each Member State. It should be noted that this facility is affected by the Directive 2004/35/EC of the European Parliament and the Council of 21 April 2004 on environmental liability with regard to the prevention and remedying of environmental damage.
2.9.2. Environmental issues in the coal mining
Mining activity is beyond the scope of 2010/75/UE Directive of the European Parliament and the Council of 24 November 2010 on industrial emissions and therefore little can be said on coal mining taking this Directive as a reference. However, if we analyze in detail the contents of this piece of legislation it can be seen that it covers any other directly associated activities on the same site which have a technical connection with the activities covered by that Directive. Despite the vagueness of this concept and given the fact that in Turkey a significant number of solid-fuel combustion plants are attached to the mines that supply them, it is highly convenient to identify some environmental aspects to take into account in the operation of these facilities.
They are open pits oriented to the extraction of lignite which are used in power stations. This activity requires large earthworks for the extraction of mineral and movement of large amounts of ore.
The main environmental issues arising from these facilities are:
Removal of vegetation cover Deterioration of the landscape
54
Dust emissions by wind action on the bare surface of the ground, by blasting and by movement of machinery.
Noise emissions from blasting and machinery movement Dust emissions from stockpiles and ore conveyors
Emissions from combustion engines of the machinery
Drags of particulate matter due to rainwater or upwelling groundwater levels
Usual remediation measures involve regular watering with water of areas with bare soil surface with powdery material and especially the transit area of machinery and the working area. Systems will be also set up for evacuation of rainwater, which will pass before discharge through settling ponds.
With regard to landscape impacts plant barriers shall be placed, or extractive work shall be carried out respecting some areas so that it will avoid this kind of impacts.
The continuous movement of heavy machinery can generate three types of impacts:
Those derived from engine emissions, which are corrected or minimized with proper maintenance.
The noise of the traffic of vehicles, which, as it is usually only annoying in the workplace it does not require special mention unless there houses in the vicinity, in which case it may be necessary to incorporate noise barriers.
The waste arising from maintenance and oil spill risks. The former consists mainly of waste oil, which should be managed through an authorized operator and of filling operations of fuel tanks; will be held in places specifically authorized for this purpose where the floor is watertight and has a specific caption system so that if an accidental discharge occurs, the spill will be retained.
Finally, the impact of the noise resulting from blasts should be minimized by simply adjusting the implementation schedule to times when nuisances for the population are minimized.
Besides all the above, the actions of mineral extraction will be done according to a planning that allows to reduce the movement of inert materials, and to use them directly in restoration works. The restoration must be performed based on the desired final destination of the area restored. If this is not well defined restoration will aim to restore the site to a condition similar to its starting point before mining activity, at least in terms of its potential uses.
2.9.3. Water management
Water management legislation and policy is a complex issue, both in Turkey and in the EU. Turkey has actively worked to transpose the EU acquis in this field, and its legislation is aligned to a considerable degree with it.
In this section will be shown the requirements which will have to be obeyed when the transposition in this field is complete. They are the requirements deriving from the Directives mentioned in subsection 2.9.3.3.
2.9.3.1 Water supply
55
The coal fired power stations are facilities that consume large amounts of water in their processes, making it necessary to have an adequate and relatively close supply to the plant, which may be lakes, reservoirs, rivers, wells or sea . In general it must be borne in mind that proper management and control of wastewater generation of the flows can result in a significant reduction in consumption and discharges.
The processes which consume more water are:
The cooling circuit, which is the main consumer of water. If this consumption comes from marine waters and the discharge is done into the sea, their environmental impacts are minimized. If on the other hand the source is a source of fresh water, consumption can cause significant reductions in the flow and discharges can cause temperature increases leading to problems of eutrophication or problems derived from the biocides incorporated to these waters occasionally.
Power generation primary circuit water: it is a water flow with special characteristics given by the conditions to which it must be subjected. They circulate in the pipes inside the boiler where they are converted into steam and travel in the alternator, causing its movement and being condensed in this stage and therefore they require a very low degree of mineralization. This implies that this mass of water must come from a source of freshwater or seawater previously desalted. In all cases a process of demineralization is performed.
2.9.3.2 Demineralized water installations
The water used to feed the boilers must be demineralized beforehand, because the natural water always contains pollutants that are not permitted in the steam cycle. For this purpose the ion exchange system is usually used, whose basic principle is that of passing the water through a filter containing a resin capable of exchanging ions. According to the type of ion to be exchanged the resin can be cationic or anionic. Typically cation exchangers are regenerated with a solution of sulfuric acid or hydrochloric acid while the anion exchangers are regenerated with a solution of sodium hydroxide.
The water obtained through this system can be used for the steam cycle, auxiliary systems for cooling and for washing the equipments.
2.9.3.3 Wastewaters generated within the LCP
The processes that generate wastewater are basically the ones listed below, taking into account in any case that different techniques in the preparation of fuels, waste management or, for example, proximity to the coast, may cause variations of these flows or their absence for certain power plants:
The cooling circuit, which as noted is the main consumer of water and whose discharges can cause temperature increases leading to problems of eutrophication or problems relating to biocidal products incorporated to these waters sometimes . In paragraph 2.9.3.5 the discharge of this system is discussed.
56
Generation primary circuit water: In all cases is performed a process of demineralization in a water treatment plant, where it undergoes a multistep process of water purification, more or less long depending on the characteristics of the incoming water which generates a small amount of waste water from the filter cleaning processes and waste generated from the remains of ion exchange resins. Exhausted demineralized water or the drains of the circuit are a flow of water discharge from the power plants but without any particular problems for treatment and discharge into water streams or the sea.
Landfill leachate: it is a very important flow with a pollution load equally important and whose quantity is directly related to the rainfall in the area and the landfill management system related to the risks to prevent fugitive dust emissions and improve dust compaction. Water from this stream must first be treated in a treatment plant before discharge into water streams or the sea.
This type of wastewater generated in a power plant can assimilate certain wastewater generated in wet processes for decontamination of exhaust gases. Such systems are not common in this type of facility.
Other relevant water flows in a power plant:
Runoffs from roads or paths, and other areas of the installation including sources such as wheel washes and the like. This flow generally may be discharged into watercourses or the sea after a simple prior decantation process.
The sanitary wastewaters generated at the plant are another significant flow of a power plant. Its treatment requires biological systems for specific treatment processes, after which it may go eventually to other common treatment systems prior to discharge or may be also reused in watering gardens or vegetable screens devoted to the integration of the facilities into the landscape. If the installation is near a population equipped with treatment systems of urban water this flux can be treated in this latest facility, provided that the flow is perfectly independent from others of the power plant.
Waters of the laboratory. This is a very small flow in terms of amount, but it may involve a significant management problem because of its characteristics.
Wastewaters derived from maintenance processes of the installation. It is a flow that may be significant but occuring sporadically. These waters may have very diverse characteristics and composition, therefore, its treatment or management system should be decided after an analysis. For these flows the facilities must have storage systems prior to purification systems.
Directly related to water flows, is the waterproofing of the premises with respect to soil and groundwater. In general all points with circulation of vehicles and places where dusty materials can fall must be waterproofed and water flows be properly channeled to be treated in the final wastewater treatment plant.
Before considering treatment systems one must consider the possible recirculation of water streams in other processes or for other purposes with the ultimate goal of reducing discharges. Such recirculations are also to be considered after any of the treatments.
57
In the event that the discharge is to a stream or to sea, the reference levels and discharge conditions to be met are the ones stated in:
Directive 2000/60/EC of the European Parliament and of the Council of 23 October 2000 establishing a framework for Community action in the field of water policy.
This framework directive has as its main objectives the prevention and reduction of pollution, environmental protection, improvement of the status of aquatic ecosystems, promotion of sustainable water use and mitigation of floods and droughts. Its ultimate goal is to achieve a "good" ecological and chemical status of all EU waters by 2015.
Directive 2008/56/EC of the European Parliament and of the Council of 17 June 2008 establishing a framework for community action in the marine environmental policy (Marine Strategy Framework Directive).
This Directive provides common principles that provide a basis for Member States to develop strategies to achieve a good environmental status of marine waters for which they are responsible, all in collaboration with Member States and third countries located in the same area of influence (in the case of Turkey: Mediterranean and Black Sea). The goal of these strategies is to protect and restore Europe's marine ecosystems to a state of quality compatible with marine life and the uses of marine resources by establishing the actions required to ensure the sustainability of the entire system.
In addition to these basic rules, it may be necessary to consider others related for example to the protection of ecosystems of special importance or legislation of local character derived from the proximity of the discharge to water supply points.
2.9.3.4 Wastewater and leachates treatment plant
With the water streams described before, and taking into account the objectives of quality established in the legislation, basic treatment systems that will be necessary are:
Filtering systems oriented to prior removal of larger solids. Aeration system, which seeks growth and grouping of microorganisms based on the
organic content of wastewater. Physical-chemical treatment system, aimed at adapting the pH of the discharge and
thus the precipitation of heavy metals that may contain the discharge. Forced settling: is carried out by the addition of flocculating chemicals to allow the
removal of solids of small size. Settling basins: the procedure followed here is simply physical. Tertiary filtration for the final filtration of the effluent. Final mixing chamber that homogenizes the discharge before it takes place. The
objective is to have the final discharge point through a single pipe with a single discharge adequate to be controlled.
The characteristics of the wastewater treatment plant depend on the characteristics and amount of discharge of each LCP and the quality target for the receiving media.
58
The categorisation of the receiving media in the case of the national By-Law on the Control of Water Pollution is as follows:
Class I : High quality water,
Class II : Water having little pollution,
Class III : Dirty water,
Class IV : Water having extreme pollution.
In the case of the EU Directive 2000/60/EC the waters are categorized in terms of their treatment prior to discharge into the following streams, grouping those which by their nature may be treated in the same facility, as follows:
Flow 1: cooling water, water drains from the primary circuit, Flow 2: cleaning of demineralization system filters, cleaning of the primary circuit,
cooling system leaks, runoff from the coals storage area, irrigation, wash-downs and cleaning of wheels and the like.
Flow 3: water from the demineralisation plant and laboratory waters. Flow 4: sanitary waters.
In general, the flow 1 will require a process of prior testing of its temperature before the discharge; to do so it will be stored on a pond that also may serve to dampen flow differences depending on the LCP operation and provide the time necessary for proper degradation of biocides or other additives used. However, if after the generation and composition studies it is deemed appropriate, this flow may be mixed with water flow 2.
The waters of flow 2 will be treated in settling ponds of a size proportional to the amount generated. This system generally will consist of simple physical settling on a pond sized to host possible floods. In certain circumstances, due to the lack of space for the location of a pond or the characteristics of the material transported by the water, it may be necessary to supplement it with chemical systems that promote flocculation of suspended solids.
Flow 3 requires a physical-chemical treatment after which they may be mixed with the flow 2.
Flow 4 will require a previous filtering of large solids, an aeration system and a settling system that could be shared with the flow 2 after the corresponding studies.
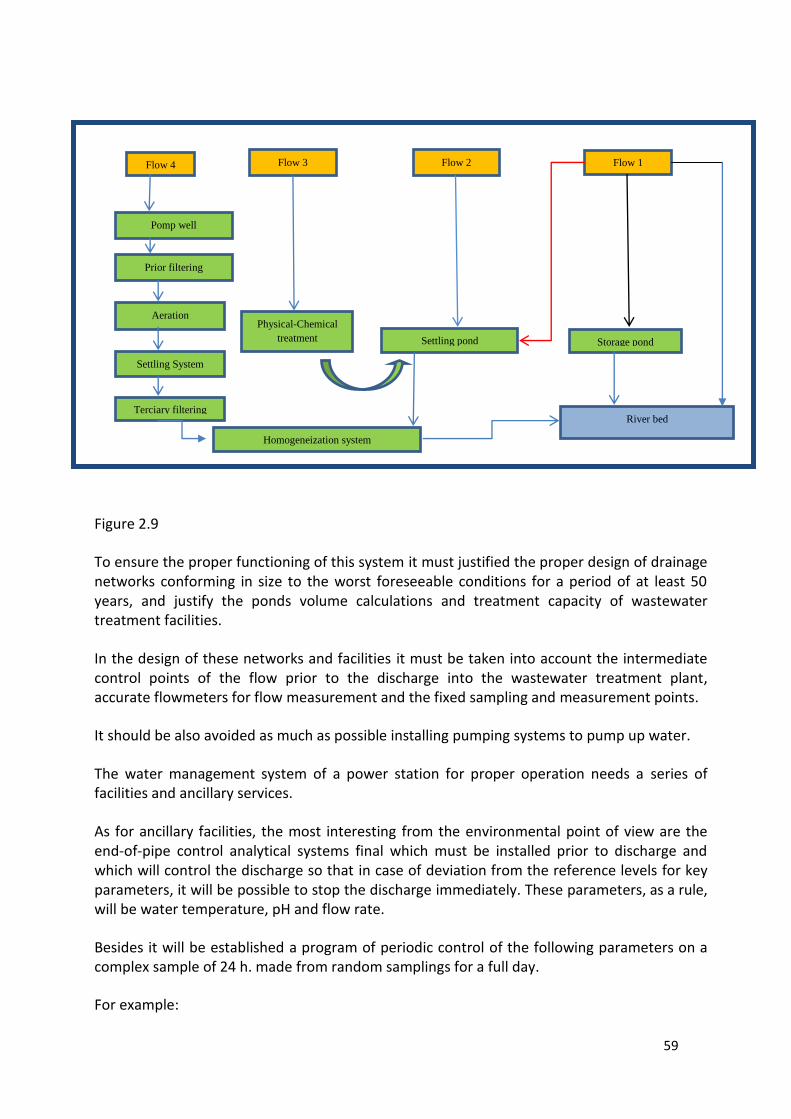
59
Figure 2.9
To ensure the proper functioning of this system it must justified the proper design of drainage networks conforming in size to the worst foreseeable conditions for a period of at least 50 years, and justify the ponds volume calculations and treatment capacity of wastewater treatment facilities.
In the design of these networks and facilities it must be taken into account the intermediate control points of the flow prior to the discharge into the wastewater treatment plant, accurate flowmeters for flow measurement and the fixed sampling and measurement points.
It should be also avoided as much as possible installing pumping systems to pump up water.
The water management system of a power station for proper operation needs a series of facilities and ancillary services.
As for ancillary facilities, the most interesting from the environmental point of view are the end-of-pipe control analytical systems final which must be installed prior to discharge and which will control the discharge so that in case of deviation from the reference levels for key parameters, it will be possible to stop the discharge immediately. These parameters, as a rule, will be water temperature, pH and flow rate.
Besides it will be established a program of periodic control of the following parameters on a complex sample of 24 h. made from random samplings for a full day.
For example:
Flow 3
Flow 2
Flow 1
River bed
Flow 4
Prior filtering
Aeration
Settling System
Physical-Chemical
treatment Settling pond Storage pond
Terciary filtering
Pomp well
Homogeneization system
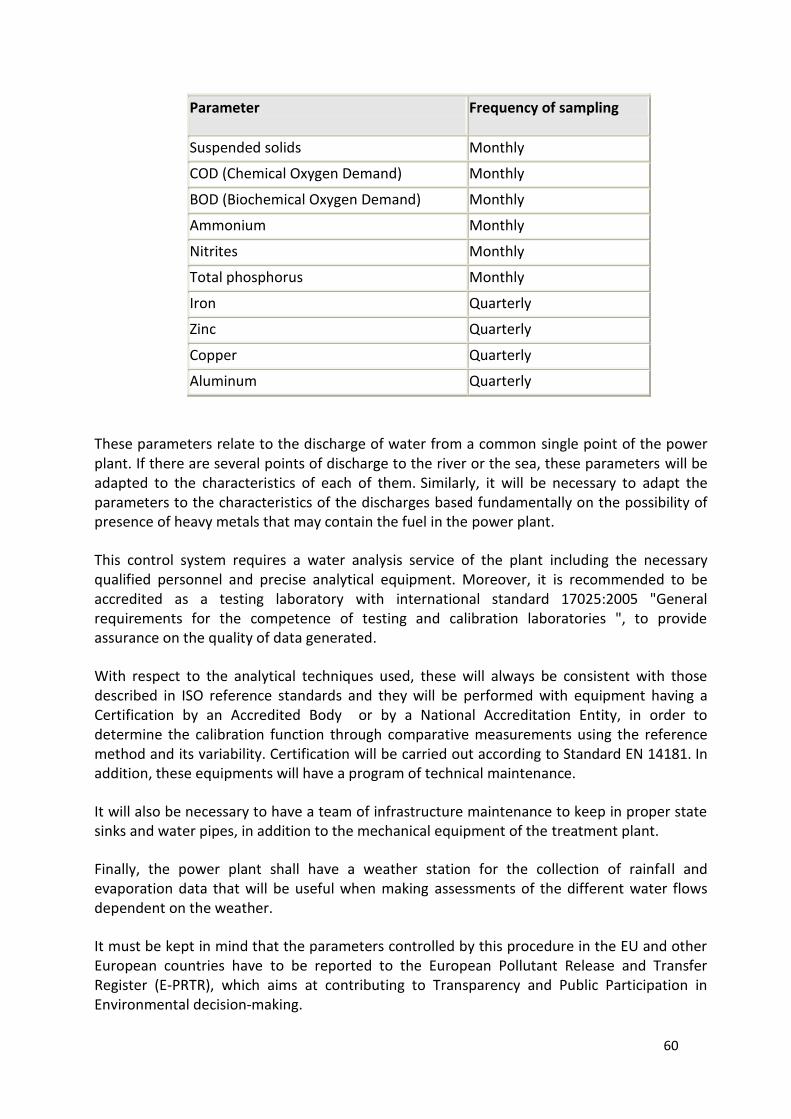
60
Parameter Frequency of sampling
Suspended solids Monthly
COD (Chemical Oxygen Demand) Monthly
BOD (Biochemical Oxygen Demand) Monthly
Ammonium Monthly
Nitrites Monthly
Total phosphorus Monthly
Iron Quarterly
Zinc Quarterly
Copper Quarterly
Aluminum Quarterly
These parameters relate to the discharge of water from a common single point of the power plant. If there are several points of discharge to the river or the sea, these parameters will be adapted to the characteristics of each of them. Similarly, it will be necessary to adapt the parameters to the characteristics of the discharges based fundamentally on the possibility of presence of heavy metals that may contain the fuel in the power plant.
This control system requires a water analysis service of the plant including the necessary qualified personnel and precise analytical equipment. Moreover, it is recommended to be accredited as a testing laboratory with international standard 17025:2005 "General requirements for the competence of testing and calibration laboratories ", to provide assurance on the quality of data generated.
With respect to the analytical techniques used, these will always be consistent with those described in ISO reference standards and they will be performed with equipment having a Certification by an Accredited Body or by a National Accreditation Entity, in order to determine the calibration function through comparative measurements using the reference method and its variability. Certification will be carried out according to Standard EN 14181. In addition, these equipments will have a program of technical maintenance.
It will also be necessary to have a team of infrastructure maintenance to keep in proper state sinks and water pipes, in addition to the mechanical equipment of the treatment plant.
Finally, the power plant shall have a weather station for the collection of rainfall and evaporation data that will be useful when making assessments of the different water flows dependent on the weather.
It must be kept in mind that the parameters controlled by this procedure in the EU and other European countries have to be reported to the European Pollutant Release and Transfer Register (E-PRTR), which aims at contributing to Transparency and Public Participation in Environmental decision-making.
61
2.9.3.5 Cooling water system Discharges
The choice of the cooling systems is dictated by environmental and economic factors. Cooling systems may include wet (water) or dry (air) cooling towers or hybrid system (combination of both).
The heat exchange between the process medium and the coolant is enhanced through heat exchangers, where the coolant discharges its heat to the environment. In open systems the coolant is in contact with the environment, opposite to closed systems, where the coolant flows through tubes or coils.
Systems without recirculation are typically used in large capacity facilities that have a sufficient supply of water for cooling and are located near a body of surface water that serves as a receptor of discharges. When a sufficient supply of water is not available recirculation systems are used (cooling towers).
In the open recirculation towers, cooling water is cooled by contact with an air stream. These towers are equipped with devices to increase the contact surface of air and water. The air stream can be created by natural or mechanical draft using fans.
In closed loop systems, the tubes or coils through which circulates the coolant or the process medium have its own cooling system to cool the substance they contain. In wet process systems, the air stream by evaporation cools down the tubes or coils sprayed with water while in the dry process system only the air stream is used for that purpose.
The hybrid cooling systems, open or closed, are specially designed towers that can use the dry or wet alternatives. With the option of operating systems in dry mode during periods of low ambient air temperature, the annual water consumption can be further reduced.
Water is important in the wet process systems as the primary coolant, but also as receiving environment of discharges that are generated. When performing large water intakes, fish and other aquatic organisms are dragged and beaten. The discharge of large amounts of water can also affect the aquatic environment, but this impact can be controlled by placing the intake and discharge pipes at suitable points and evaluating the tidal flows.
To avoid drift and shock experienced by aquatic organisms mesures are taken related to the design and location of the intake pipe and various devices are used like screens, barriers, light and / or sound.
The BREF on industrial cooling systems includes more detailed information on these techniques.
62
3. Current Levels emission, energy and raw material
Consumption
This section provides information on current levels of emissions to air, water and soil from Turkish large combustion plants using solid fuels.
The aim is to reflect the current environmental framework of the sector.
Data input provided by Turkish installations has been essential in preparing this section.
The data included are related to fuels used in this sector, their chemical and physical characteristics, and theimpurities that are usually present in them.
Information concerning the generation of wastes and by-products generated in the various processes takes account of recycling and reuse options throughout the whole process.
Current emission data, to the extent possible, are given as hourly or daily averages, or as mass of emissions per unit of energy generated. The emissions to water are normally based on a qualified random sample or a 24 hours composite sample. In the case of air emissions standard conditions have been used, of temperature of 273.15 K and pressure 101.3 kPa, oxygen content determined according to the fuel and installation and dry gases.
Dilution of gaseous and liquid effluents is not accepted under any circumstances as a measure to reduce the level of pollution.
The values presented correspond to emissions from the sector in general, without specifying values for individual installations. The possible ranges of values are indicated, with maxima and minima.
3.1. Emissions to air and odournuisance risks. Environmental
monitoring and control.
This subsection presents the emission levels to air from Turkish combustion plants fired with coal and lignite.
3.1.1 Emissions to air
Emissions to air are major environmental factors that must be taken into account in processing the permit of the installation. These emissions are generated both in combustion processes and in the coal stockyard in which the particles can be carried by wind force and constitute a major environmental problem in the immediate surroundings.
63
The main substances emitted and that must be considered are: SO2,NOx and particulates. Additionally, the BREF on Large Combustion Plants, 2006 considered the following substances: CO, HF, HCl and heavy metals.
Moreover, the CO2 emitted as a result of the combustion process is a very important contributor to the greenhouse effect. The amount of CO2emitted by a plant is related to the type of fuel used (at equal calorific value, natural gas reduces to half the emission of CO2 in comparison with the use of coal or fuel). Current measures that are being taken to reduce emissions of CO2 in an installation are closely related to improving the efficiency. The efficiency of the installation affects the emissions of CO2, therefore an efficiency improvement reduces emissions of this gas per unit of electricity produced.
However, the Directive 2010/75/CE on industrial emissions in Article 9.1 indicates that the permit shall not include an emission limit value for direct emissions of greenhouse gases, unless necessary to ensure that no significant local pollution is caused.
SO2 emissions come from the combustion of sulfur in the fuel. A medium-sized installation (500MWe) coal-fired with a sulfur content of 1%, can produce 5 tons of SO2 per hour of operation.
This is one reason why in many EU Member States is imported "sweet" coal because its sulfur content is considerably lower (around 0.5%) than for the case of domestic coal (between 1% and 5%), specially when lignite with high sulfur and ash content is processed.
A"mix" between coals with high sulfur content andimported coals (egWyoming and Indonesiacoals) is usually looked for to achieve coals with sulfur average content which can fulfill, by stoichiometry, the criteria and emission limit values. The associated costs are around 15% to 20% of the cost of evacuated kWh, although they highly depend on emission limit values and quality of processed coal.
The production of NOx mainly depends on the conditions under which combustion takes place, specially the temperature reached. The production of NOx depends on the amount of nitrogen that is present in the fuel and the oxidation of atmospheric nitrogen.
Reducing NOx emissions is achieved by controlling the temperature of the flame in the burner or by controlling the air supply to the combustion process. In more stringent conditions several systems can be applied as addition (catalytic or not) of ammonium or urea which combines with the nitrogen oxides in the gas, avoiding their emissions.
The emission of heavy metal occurs because they are natural constituents of fossil fuels. Most relevant heavy metals (As, Cd, Cr, Cu, Hg, Ni, Pb, Se, V, Zn) are normally emitted as compounds (eg, oxides and chlorides) together with particles. Therefore, BAT included in the BREF aimed at reducing the emission of heavy metals comprise in general devices implementing high dust removal efficiency, such as an electrostatic precipitator (ESP) or a fabric filter (FF).
The emission of particles is decreasing gradually in recent years because it is a type of pollutant relatively easy to catch before it goes up the stack. Keep in mind that particle
64
retention systems have been applied for a long time in power plants, with procedures to ensure removal rates close to 100%. The associated cost of particles reduction has a weight in the cost of kWh between 5% and 6%.
The metals contained in the fuel are converted either into its volatile metallic form during the combustion, or into chlorides, oxides, sulfides, etc. Most of these metals condense at temperatures up to 300 °C and separated at dust particles (fly ash). Only Hg and Se are at least partially present in the vapor phase. Mercury has a high vapor pressure at normal operating temperatures of the control devices, and its collection with dust removal methods gives varying results.
The content of heavy metals in the flue gases becomes very low in installations that have particle removal systems of combustion gases. Therefore these systems and flue gas desulfurization systems are capable of eliminating most of the heavy metals present in the flue gases; ie, the metal elements are not retained in the bottom ash or slag.
Dry bottom boilers have a low capture rate of Hg due to the formation of gaseous mercury that is emitted in significant amounts.In the case of wet bottom boilers, combustion systems and flue gas cleaning systems not only show a low rate of capture of mercury, but also of As. It has been demonstrated in the case of recirculation of fly ash in wet bottom boilers that theonly increased emissions are the ones of heavy metals with a high volatility such as Hg, and especially the As.
In order to assess the effects of the load and combustion of fuel in the emission of heavy metals, experiments have been performed with dry bottom boilers fired with coal.The results obtained are summarized below:
To a great extent, the amount of gaseous emissions of mercury from the flue gas depends on the content of calcium and chlorine in the coal. Chlorine increases the proportion of gaseous mercury while helping to remove the mercury in wet desulfurization processes of combustion gases as HgCl2. The presence of calcium improves the separation of mercury in ESP.
The integrationof heavy metals into the ash from the boiler does not depend on the chemical composition of coal.
The integration of heavy metals into the fly ash does not depend on the chemical composition of coal, but it depends on the boiler load, as the maximum level is reached with a full load.
As a example of advanced performance, installations equipped with a conventional purification systems such as the removal of particles (electrostatic precipitator-ESP) or fabric filter (FF), flue gas desulfurization (FGD) and NOx removal (DeNOx) by Selective Catalytic Reduction (SCR) could meet a limit value of up to 3 µg/m3 without extra cost. An installation not equipped with purification technologies to achieve these emission limits must install equipment with additional costs that can reach several million euros. These costs could lead to a small increase in the price of electricity of around 0.1 euro / MWh which is less than one euro/year per family.
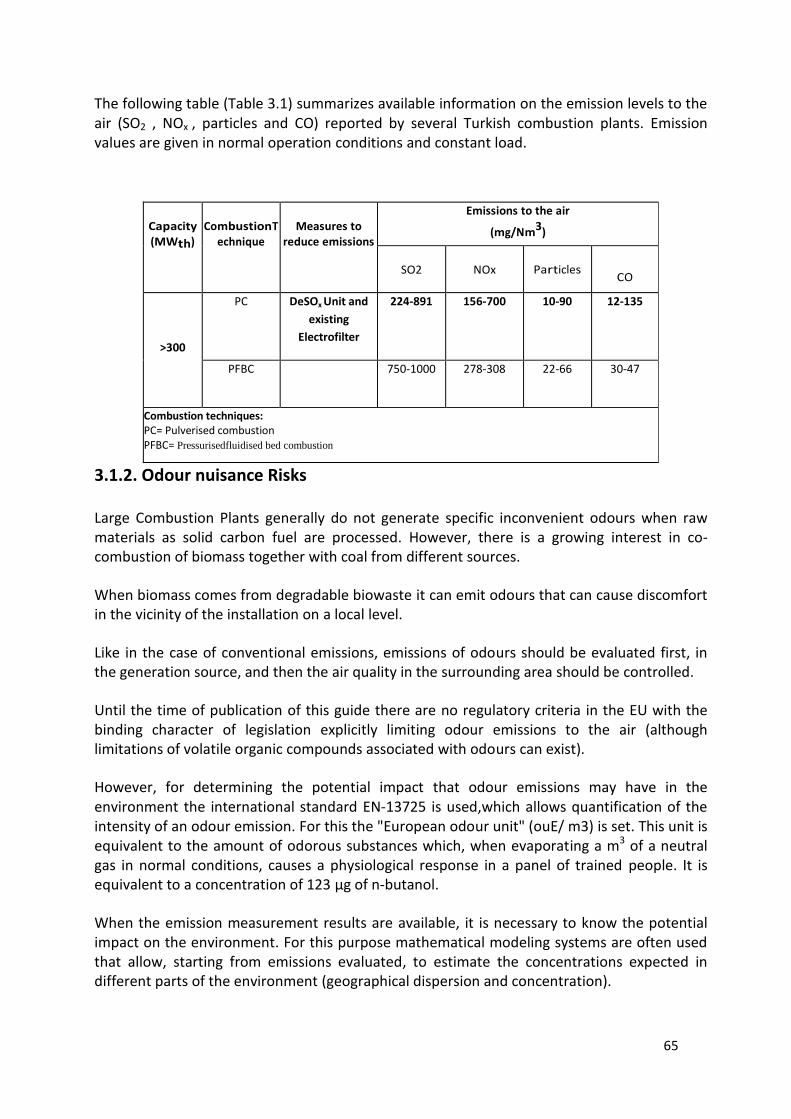
65
The following table (Table 3.1) summarizes available information on the emission levels to the air (SO2 , NOx , particles and CO) reported by several Turkish combustion plants. Emission values are given in normal operation conditions and constant load.
Capacity (MWth)
CombustionT
echnique
Measures to
reduce emissions
Emissions to the air
(mg/Nm3)
SO2
NOx Particles
CO
>300
PC DeSOx Unit and
existing
Electrofilter
224-891 156-700 10-90 12-135
PFBC
750-1000 278-308 22-66 30-47
Combustion techniques: PC= Pulverised combustion PFBC= Pressurisedfluidised bed combustion
3.1.2. Odour nuisance Risks
Large Combustion Plants generally do not generate specific inconvenient odours when raw materials as solid carbon fuel are processed. However, there is a growing interest in co-combustion of biomass together with coal from different sources.
When biomass comes from degradable biowaste it can emit odours that can cause discomfort in the vicinity of the installation on a local level.
Like in the case of conventional emissions, emissions of odours should be evaluated first, in the generation source, and then the air quality in the surrounding area should be controlled.
Until the time of publication of this guide there are no regulatory criteria in the EU with the binding character of legislation explicitly limiting odour emissions to the air (although limitations of volatile organic compounds associated with odours can exist).
However, for determining the potential impact that odour emissions may have in the environment the international standard EN-13725 is used,which allows quantification of the intensity of an odour emission. For this the "European odour unit" (ouE/ m3) is set. This unit is equivalent to the amount of odorous substances which, when evaporating a m3 of a neutral gas in normal conditions, causes a physiological response in a panel of trained people. It is equivalent to a concentration of 123 µg of n-butanol.
When the emission measurement results are available, it is necessary to know the potential impact on the environment. For this purpose mathematical modeling systems are often used that allow, starting from emissions evaluated, to estimate the concentrations expected in different parts of the environment (geographical dispersion and concentration).
66
The concentration of odour in the air quality can not be measured and sampled directly, using sampling and subsequent determination or instrumental methods as in the case of conventional pollutants such as NOx, SO2, etc. For assessments in the receptors, should be referred to a group of staff (panelists) trained specifically cited under the European standard EN-13725.
However, odour emissions are not caused usually by the flue gases because of both the temperatures reached and the stack height and dispersion capacity, but mainly they are caused by emissions in the storage and handling processes (especially to warm up products that need it to flow or when products are exposed to sun) or biodegradable waste products.
3.1.3. Environmental monitoring and control
The requirements for emission control must be established in the permit. It must specify the methodology of measurement, frequency and evaluation procedure. These requirements should be based on monitoring criteria contained in the BAT conclusions of the BREF on Large Combustion Plants, which is currently under review.
Monitoring of emissions can be achieved by direct measurements (direct control of the sources) or by calculations based on the measurement of operating parameters. When building a new plant or when substantial changes are made to an existing installation, the emission factors are used to estimate emissions to the environment.
The two main types of continuous monitoring of air emissions are:
o in-situ control: the sample is analyzed in the stack or duct, with little or without sampling treatment
o extractive control: the sample is extracted and analyzed elsewhere.
Before making measurements, the following factors must be considered when planning supervision:
o operating mode (emergency plants, plants with reduced operating time depending on energy demand, asmedium and extraordinary load plants, base load plants or full-time plants).
o The operating state of the effluent treatment systems. o Operating conditions in the plant (continuous, discontinuous, start up, shut
down ). o The effect of thermodynamic interference factors.
These factors represent the basis for selecting the following operating conditions:
o know the highest level of emissions that can be recorded
o selecting the number and duration of the measurements
o selecting the most appropriate method of measuring
o determining the location of the measurement zones and specific measurement points.
67
In continuous processes, the minimum time of sampling or measurement is usually half hour (average value of thirty minutes). Due to the limit of detection, to detect substances such as PCDD / PCDF are required measurement times longer and, therefore, the reference times vary. In continuous processes, during which only slight fluctuations occur in the emission characteristics, three independent measurements can be performed at the higher level of emissions. Sampling or measurement is carried out only during operation of the plant and excluding the dilution air.
The methods of analysis are provided in the relevant international and national guidelines on monitoring and analysis ofemissions.
It is necessary to determine the following parameters of gaseous effluents to convert emissions concentrations to normal standard, that is 273.15 K, 101.3 kPawith measured oxygen content determined according to the fuel and installation and dry gas:
o the volumetric flow of gaseous effluents to calculate the mass flow of the emission
o the temperature of the gaseous effluents
o the water vapor content of the gaseous effluents
o static pressure in the flue-gas ducts
o atmospheric pressure
o the monitoring period / period of calculation. o measurement ofthe concentration of oxygen.
In addition to these parameters, it is necessary to calculate other parameters such as voltage and electricity (electrostatic precipitators), the pressure drop (fabric filter), the pH of the cleaning fluid (scrubbers) and pollutant concentrations at various points in the flue gas ducts, so that the boiler and the cleaning system of the combustion gases can work properly.
According to the IED, the concentrations of SO2, NOx and particles in the waste gases from each combustion plant with a total rated thermal input equal to or greater than 100 MWth shall be measured continuously. The competent authority may decide not to require continuous measurement in combustion plants with a life span of less than 10 000 operational hours.
When continuous measurement is not required, measurements of SO2, NOx and particlesshall be required at least once every six months. For combustion plants fired with coal or lignite, total mercury emissionsshall be measured at least once a year.
The concentration of CO in waste gases from combustion plants firing gaseous fuels with a total rated thermal input equal to or greater than 100 MW shall also be measured continuously.
It is left to the criteria of the competent authority not to require continuous measurement in the following cases:
a) for SO2 and dust from combustion plants fired with natural gas;
68
b) SO2 from combustion plants firing gasoil with a known sulfur content in cases where there is no waste gas desulfurization equipment;
c) for SO2 from combustion plants fired with biomass if the operator can prove that SO2 emissions can under no circumstances be higher than the prescribed emission limit values.
Procedures that are verified and approved by the competent authority may be used to determine emissions of SO2 and NOx. Such procedures shall use relevant CEN standards or, if not available CEN, ISO or other national or international standards that guarantee data of equivalent scientific quality.
The competent authority shall determine the location of sampling or measurement points to be used for monitoring emissions. Sampling points must meet the requirements of relevant national legislation and guidelines on sampling.
3.2. Wastewater Discharges and Monitoring Programme
This section includes information on the treatment and control of wastewater of the Turkish large combustion plants fired with coal and lignite.
Large combustion plants need water mainly for cooling purposes. After being used for the absorption of heat (temperature increase of about 4 to 8 ° C) this water is usually returned to the place where it was taken.Depending on local conditions, waste heat can produce a heat load of the surface waters (eg, increased temperature of a river), whose magnitude depends on the driving and the flow of the receiving stream. The temperature increase quickly produces a shortage of oxygen, caused in part by stimulation of the metabolism of living beings and partly due to lower dissolved oxygen in warmer water. This shortage of oxygen can cause serious problems for aquatic organisms.
To avoid excessive heating of the water, cooling water can be cooled in a cooling tower (pass or recirculation), before returning to the river bed. However, depending on weather conditions, the cooling system can cause large water losses by evaporation, which is emitted into the air as vapor. This could be avoided by using closed cooling circuits in combination with dry cooling towers, or at least minimized by hybrid cooling towers.
Generally the sources of effluents to be purified are:
1. Regenerated effluent from the additional water treatment and from the desalination of the condensation water;
2. Water from the washing of filters used to clean the water of condensation; 3. Wastewater from the carbon load and storage; 4. Special waste water (for example, with acid content from cleaning or maintenance of
pipes / boiler); 5. Waste water from the wet-ash removal. 6. Water from boilers (purging and washing), turbines and transformers;
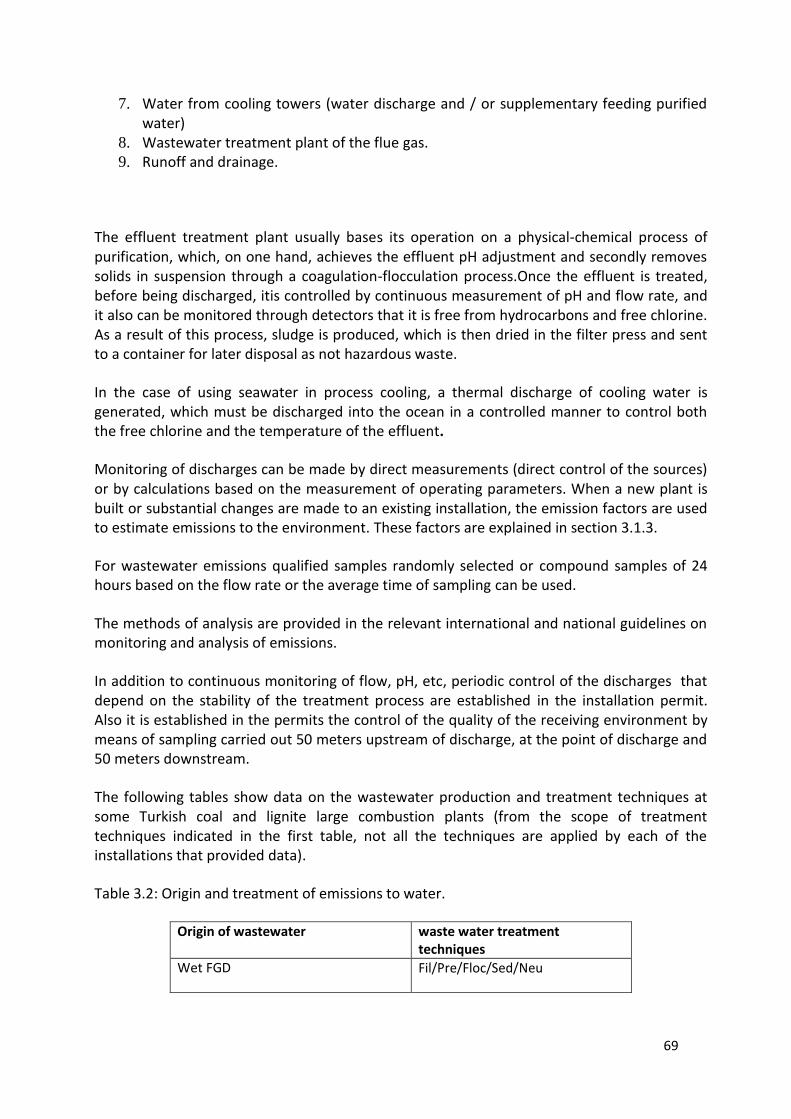
69
7. Water from cooling towers (water discharge and / or supplementary feeding purified water)
8. Wastewater treatment plant of the flue gas. 9. Runoff and drainage.
The effluent treatment plant usually bases its operation on a physical-chemical process of purification, which, on one hand, achieves the effluent pH adjustment and secondly removes solids in suspension through a coagulation-flocculation process.Once the effluent is treated, before being discharged, itis controlled by continuous measurement of pH and flow rate, and it also can be monitored through detectors that it is free from hydrocarbons and free chlorine. As a result of this process, sludge is produced, which is then dried in the filter press and sent to a container for later disposal as not hazardous waste.
In the case of using seawater in process cooling, a thermal discharge of cooling water is generated, which must be discharged into the ocean in a controlled manner to control both the free chlorine and the temperature of the effluent.
Monitoring of discharges can be made by direct measurements (direct control of the sources) or by calculations based on the measurement of operating parameters. When a new plant is built or substantial changes are made to an existing installation, the emission factors are used to estimate emissions to the environment. These factors are explained in section 3.1.3.
For wastewater emissions qualified samples randomly selected or compound samples of 24 hours based on the flow rate or the average time of sampling can be used.
The methods of analysis are provided in the relevant international and national guidelines on monitoring and analysis of emissions.
In addition to continuous monitoring of flow, pH, etc, periodic control of the discharges that depend on the stability of the treatment process are established in the installation permit. Also it is established in the permits the control of the quality of the receiving environment by means of sampling carried out 50 meters upstream of discharge, at the point of discharge and 50 meters downstream.
The following tables show data on the wastewater production and treatment techniques at some Turkish coal and lignite large combustion plants (from the scope of treatment techniques indicated in the first table, not all the techniques are applied by each of the installations that provided data).
Table 3.2: Origin and treatment of emissions to water.
Origin of wastewater waste water treatment techniques
Wet FGD Fil/Pre/Floc/Sed/Neu
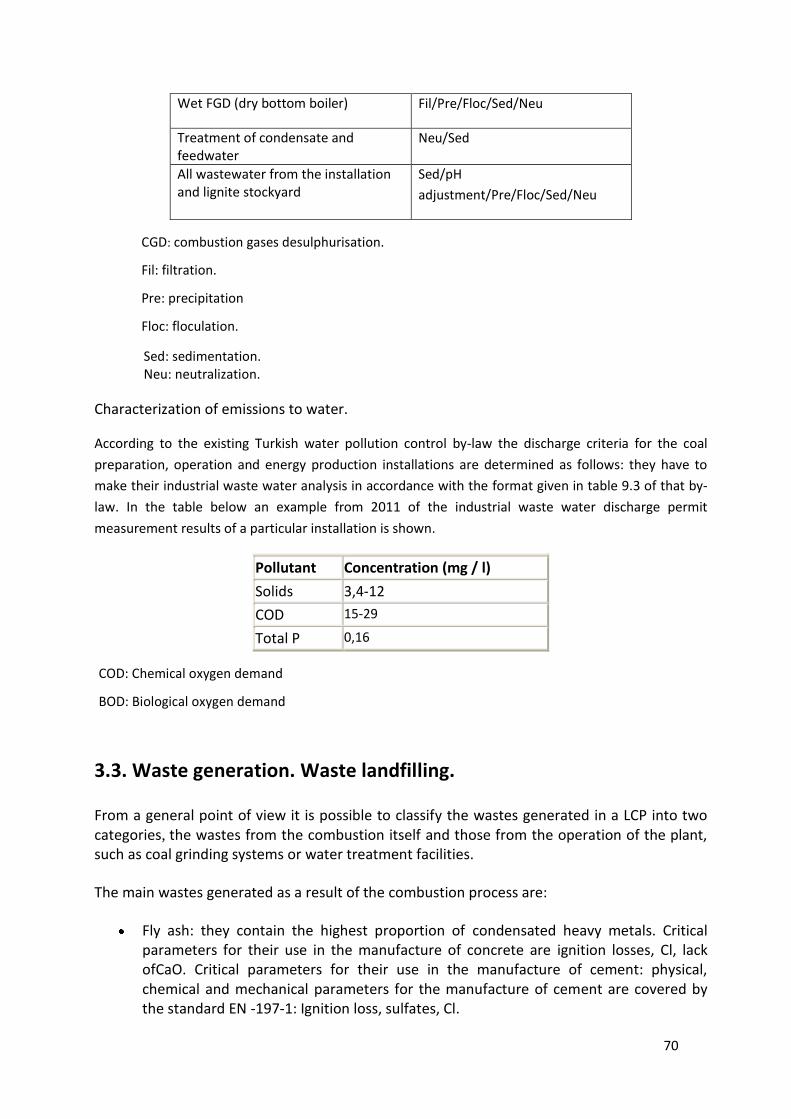
70
Wet FGD (dry bottom boiler) Fil/Pre/Floc/Sed/Neu
Treatment of condensate and feedwater
Neu/Sed
All wastewater from the installation and lignite stockyard
Sed/pH
adjustment/Pre/Floc/Sed/Neu
CGD: combustion gases desulphurisation.
Fil: filtration.
Pre: precipitation
Floc: floculation.
Sed: sedimentation. Neu: neutralization.
Characterization of emissions to water.
According to the existing Turkish water pollution control by-law the discharge criteria for the coal
preparation, operation and energy production installations are determined as follows: they have to
make their industrial waste water analysis in accordance with the format given in table 9.3 of that by-
law. In the table below an example from 2011 of the industrial waste water discharge permit
measurement results of a particular installation is shown.
Pollutant Concentration (mg / l)
Solids 3,4-12
COD 15-29
Total P 0,16
COD: Chemical oxygen demand
BOD: Biological oxygen demand
3.3. Waste generation. Waste landfilling.
From a general point of view it is possible to classify the wastes generated in a LCP into two categories, the wastes from the combustion itself and those from the operation of the plant, such as coal grinding systems or water treatment facilities.
The main wastes generated as a result of the combustion process are:
Fly ash: they contain the highest proportion of condensated heavy metals. Critical parameters for their use in the manufacture of concrete are ignition losses, Cl, lack ofCaO. Critical parameters for their use in the manufacture of cement: physical, chemical and mechanical parameters for the manufacture of cement are covered by the standard EN -197-1: Ignition loss, sulfates, Cl.
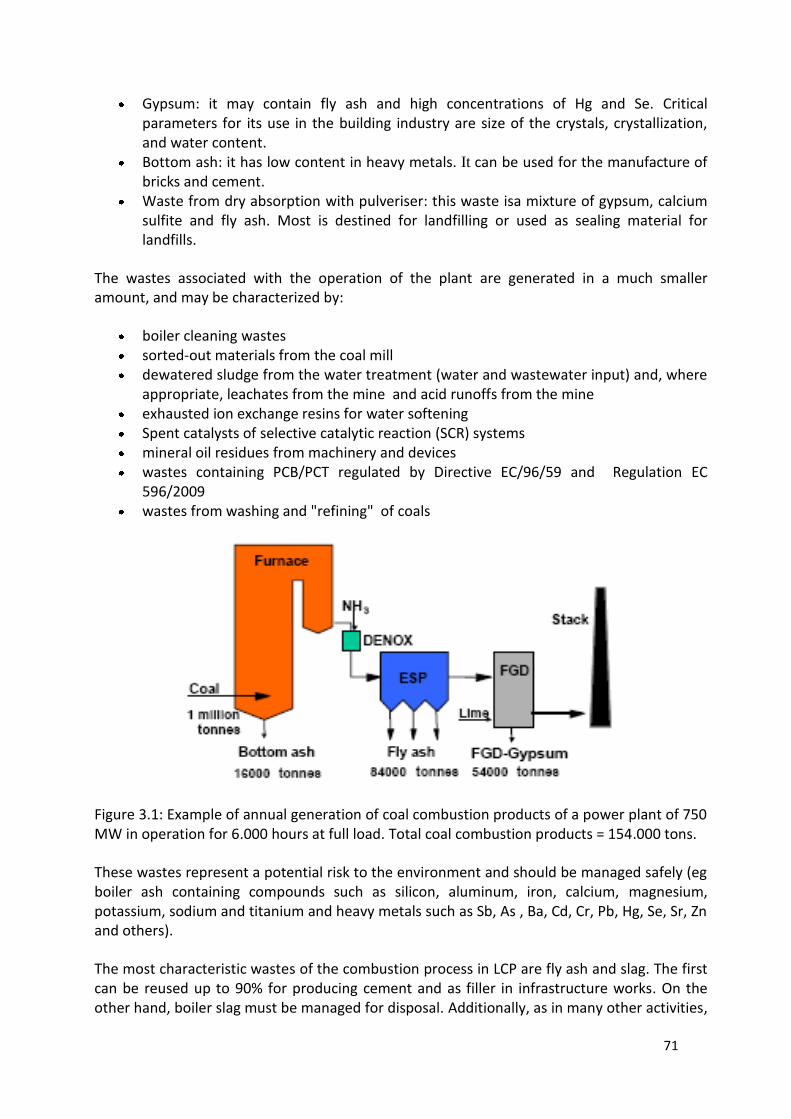
71
Gypsum: it may contain fly ash and high concentrations of Hg and Se. Critical parameters for its use in the building industry are size of the crystals, crystallization, and water content.
Bottom ash: it has low content in heavy metals. It can be used for the manufacture of bricks and cement.
Waste from dry absorption with pulveriser: this waste isa mixture of gypsum, calcium sulfite and fly ash. Most is destined for landfilling or used as sealing material for landfills.
The wastes associated with the operation of the plant are generated in a much smaller amount, and may be characterized by:
boiler cleaning wastes
sorted-out materials from the coal mill dewatered sludge from the water treatment (water and wastewater input) and, where
appropriate, leachates from the mine and acid runoffs from the mine
exhausted ion exchange resins for water softening
Spent catalysts of selective catalytic reaction (SCR) systems mineral oil residues from machinery and devices wastes containing PCB/PCT regulated by Directive EC/96/59 and Regulation EC
596/2009
wastes from washing and "refining" of coals
Figure 3.1: Example of annual generation of coal combustion products of a power plant of 750 MW in operation for 6.000 hours at full load. Total coal combustion products = 154.000 tons.
These wastes represent a potential risk to the environment and should be managed safely (eg boiler ash containing compounds such as silicon, aluminum, iron, calcium, magnesium, potassium, sodium and titanium and heavy metals such as Sb, As , Ba, Cd, Cr, Pb, Hg, Se, Sr, Zn and others).
The most characteristic wastes of the combustion process in LCP are fly ash and slag. The first can be reused up to 90% for producing cement and as filler in infrastructure works. On the other hand, boiler slag must be managed for disposal. Additionally, as in many other activities,
72
wastes from maintenance, treatment of liquid effluents, household, office, etc, can be produced.
The use of coal combustion products can vary according to different climatic, tax and legal conditions, heavy metal content, ignition losses, the total Ca and Cl content, etc.
Desulphurisation products can be used in the building industry, as fertilizers,or to landfill. The gypsum from FDG can be used to make plasterboard plates and floor coverings, or as retarder in setting of cement. In recent years there has been an increase in reusing rates due in large part to research, practical experience and marketing efforts made.
To manage the wastes generated in a LCP the European Waste Catalogue (EWC) approved by Decision 2000/532/EC of 3 May should be used (amended by Decisions 2001/118/EC of 16 January and Council Decision 2001/573 of 23 July).
This catalogue is subject to updates and is important to note that when a substance or material appears it does not necessarily mean that it is considered a hazardous waste.
The wastes that may be produced in an LCPcan be found within the codes listed below. To make an inventory or check the type of waste that can be found, an option is to analyze each residue included in those categories in order to check those that are generated in the installation.
10 Wastes from thermal processes
11 Wastes from chemical surface treatment and coating of metals and other materials, waste from non-ferrous hydrometallurgy
12 Wastes from shaping and physical and mechanical surface treatment of metals and plastics
13 Oils wastes and wastes of liquid fuels (except edible oils and those in chapters 05 and 12 )
14 Waste organic solvents, coolants and propellants (except 07 and 08)
15 Waste packaging, absorbents, wiping cloths, filter materials and protective clothing not otherwise specified
16 Wastes not otherwise specified in the list
17 Waste from building and demolition (including excavated soil from contaminated sites)
19 Wastes from waste management facilities, off-site wastewater treatment plants and preparation of water intended for human consumption and water for industrial use.
73
20 Municipal wastes (household waste and similar commercial, industrial and institutional wastes) including separately collected fractions.
The following table presents data on the characterization of wastes generated in Turkish LCPs fired with coal and lignite.
Table 3.3.Wastes generated.
Wastes EWC Code Total amount generated
(T / year)
Production rate
(T / Gw of electricity produced)
Coal fly ash 100102 367.143-2.635.317 191-391
Bottom ash, slag and boiler dust
100101 91.182-658.829 47-98
* Almost all of the ash is stored in landfills; fly ashes of some power stations are used for construction purposes.
3.4. Noise and vibration issues
The main sources of noise in large combustion plants are rotating machines, transformers and valves. Besides the generation of noise in turbines, pumping and ventilation operations, activation of safety valves, cooling systems, auxiliary engines, there are other operations that shall be taken into account to minimize noise impact. Some of these operations are the activities of transport and handling of fuel (movements in the stockyard for example), wastes and byproducts.
The noise problem in LCPs is manageable technically, but, from a pragmatic point of view, the acceptable level of funds set aside for noise protection sets limits on the technical possibilities. Since increased distance from the source lowers noise, planning of land use both on a community level and within a specific industrial site is perhaps the best preventive measure to avoid noise problems.Inside the building, the same principle applies; ie the layout design should separate the working areas from noisy equipment. With the encouragement of the authorities, there is a general target among machine manufacturers today to reduce the noise generated by equipment. For a given power plant, the noise control technology is mainly based on:
using acoustic machines enclosures, selecting structures according to their noise isolation effect to envelope the building use of mufflers in intakeand exhaust channels use of sound absorptive materials in walls and ceilings
use of vibration isolators and flexible connections apply a carefully detailed design, eg to prevent possible leakage of noise through
openings or to minimize variations pressure in piping
Providing hearing protectors for personnel.
74
In the recent years, interest in noise has increased and has led to a series of noise regulations. Nowadays, the allowable noise level is a factor that should be taken into consideration in the main decisions in a power plant project.
All these activities should be considered when making the noise impact study of a thermal power plant, as well as thecharacteristics of its environment (topography, vegetation, land use, etc). These studies include the location of acoustic noise sources, their relevance and maps of the environment noise level. In practice, in the permits installations are used limit values laid down in current legislation in this area for different ranges of environments andtimes, which are complemented by a monitoring plan particularly intense in areas where there may be people concerned. Directive 2002/49/EC of the European Parliament and the Council of 25 June 2002 on the evaluation and management of environmental noise (the “Directive on Environmental Noise"), is the standard of reference for national noise legislation and for the noise considerations that are stated in the permit granted to a large combustion plant.
The basic measures to reduce noise consist of modifications to the source, transmission medium or changes affecting the receiver.
The land use planning is one of the earliest and most effective preventive measures.
This measure is based on the principle that the noise level decreases when increasing the distance between the receiver and source. In such a way that if the distance of the noise source is increased ten times, the noise will decrease by 20 dB.
This measure applies to areas near urban centers and industrial sites. Even in the entire plant the work areas should be separated from noise-producing equipment.
Other measures are related to direct action in the source generating the noise. One measure would be to place the sound source in a housing. Also, currently one of the objectives of the machinery is to reduce the noise of the equipment itself.
The acoustic barriers are commonly used to modify the path by increasing the distance the sound waves that have to travel from the source to the receiver.The use of noise absorptive material, particularly on the walls and the ceiling, is an effective method to decrease reflection or reverberation inside the building. That is why the environmental noise level is, in some cases, controlled by adding absorptive material inside the building. An equipment-specific method to influence noise is the use of mufflers; typically they are used in channels or pipes.
In Turkey, in the existing “Assesment and Management of Environmental Noise” by-law it is stated that all installations and facilities have to prepare an acoustic report which will be a basis for the permits and licenses that will be obtained according to the Environmental Law, Annexes I and II. If the limit values established are not reached, the installations are obliged to take the necessary measures. However, after the amendment made on the above mentioned by-law, for installations which have been established and have obtained the opening and operation certificate before the date 7/3/2008 and for the installations located at least 500 m away from sensitive areas independent from their establishment date and having a permit or
75
not they will not need to assess their noise emissions, if it is so stated in their environmental permit and license certificate. But on request of the Competent Authority it can be obligatory to prepare an acoustic report also for those installations and facilities.
3.5. Soil and groundwater Pollution Risks
Large combustion plants have very different effects on soil and groundwater. Soil quality may worsen due to precipitation of dust, especially in the vicinity of the plant, being especially dangerous the pollution from heavy metals contained in dust (associated with finer grain sizes, especially with runoff waters with strong acidic characteristics of sites with lignite deposits).
They can also change the chemical properties of soil due to acid deposition, attributable mainly to the hydrogenation of the substances SO2 and NOx. In unfavorable conditions, the acid precipitation also affects groundwater and surface water.
Contamination of soil and groundwater depends on the total emissions during the year (pollutant load) and the diffusion conditions. Therefore, with increasing size of the plant, the degree of removal of harmful substances should also improve.
The soil and especially groundwater near the plant are also threatened by the escape of pollutants originating primarily from deficiencies in the collection and wastewater treatment, oil and other oily liquids leaks, improper oil and coal storage and waste materials storage as well as runoff of acid mine water (leachates).
Other effects on the soil, and even more on groundwater come from waste storage, which consist primarily of slag, fly ash, flue gas desulphurization wastes and sludge from water treatment and sewage. The amount of these residues depends partly on the procedure employed and is especially high when using low quality coals.
3.6. Raw Materials Consumption
The following information has been taken from the European Association for Coal and Lignite (EURACOAL).
As Turkey’s indigenous energy resources consist almost exclusively of lignite and small amounts of hard coal, the country is heavily dependent on imports of hard coal, oil and gas. The country imports approximately 72% of total primary energy needs. Turkey has around 1.3 billion tonnes of hard coal and 11.5 billion tonnes of lignite resources, of which 0.5 billion tonnes and 9.8 billion tonnes respectively are proven reserves. Turkey’s primary energy production totalled 43.3 Mtce in 2010. Indigenous coal provided 52.0 % of total primary energy production in 2010, traditional biomass (firewood) and waste 15.4 %, oil and natural gas together 10.1 %, hydropower 14.7% and other sources 7.8%. However, the biggest share in consumption was natural gas with 29.9%, while indigenous coal’s share was only 15.0%.
The Turkish coal sector produces both hard coal (2.8 million tonnes in 2010) and lignite (69.0 million tonnes), mainly used for power generation. Over 90 % of total coal production was
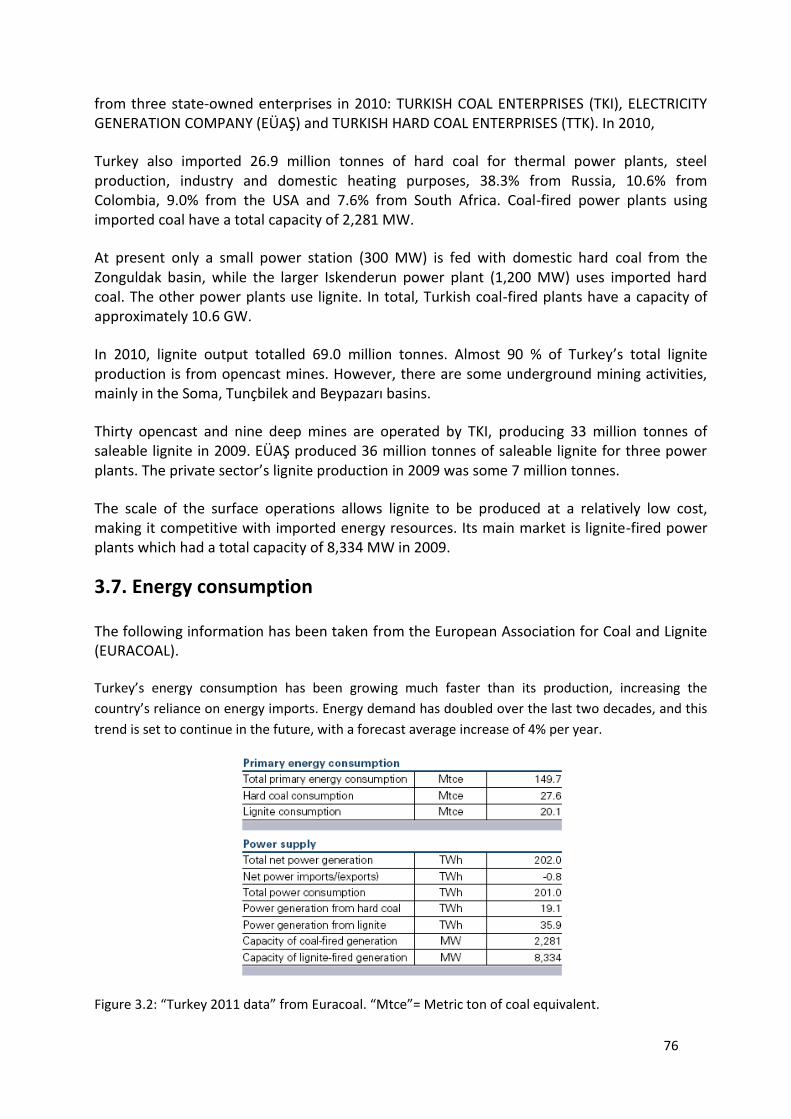
76
from three state-owned enterprises in 2010: TURKISH COAL ENTERPRISES (TKI), ELECTRICITY GENERATION COMPANY (EÜAŞ) and TURKISH HARD COAL ENTERPRISES (TTK). In 2010,
Turkey also imported 26.9 million tonnes of hard coal for thermal power plants, steel production, industry and domestic heating purposes, 38.3% from Russia, 10.6% from Colombia, 9.0% from the USA and 7.6% from South Africa. Coal-fired power plants using imported coal have a total capacity of 2,281 MW.
At present only a small power station (300 MW) is fed with domestic hard coal from the Zonguldak basin, while the larger Iskenderun power plant (1,200 MW) uses imported hard coal. The other power plants use lignite. In total, Turkish coal-fired plants have a capacity of approximately 10.6 GW.
In 2010, lignite output totalled 69.0 million tonnes. Almost 90 % of Turkey’s total lignite production is from opencast mines. However, there are some underground mining activities, mainly in the Soma, Tunçbilek and Beypazarı basins.
Thirty opencast and nine deep mines are operated by TKI, producing 33 million tonnes of saleable lignite in 2009. EÜAŞ produced 36 million tonnes of saleable lignite for three power plants. The private sector’s lignite production in 2009 was some 7 million tonnes.
The scale of the surface operations allows lignite to be produced at a relatively low cost, making it competitive with imported energy resources. Its main market is lignite-fired power plants which had a total capacity of 8,334 MW in 2009.
3.7. Energy consumption
The following information has been taken from the European Association for Coal and Lignite (EURACOAL).
Turkey’s energy consumption has been growing much faster than its production, increasing the
country’s reliance on energy imports. Energy demand has doubled over the last two decades, and this
trend is set to continue in the future, with a forecast average increase of 4% per year.
Figure 3.2: “Turkey 2011 data” from Euracoal. “Mtce”= Metric ton of coal equivalent.
77
4. Best Available Techniques in the Hard Coal and Lignite
Combustion at power plants.
In the Directive 2010/75/UE of the European Parliament and of the Council, of 24 November 2010, on
industrial emissions (integrated pollution prevention and control) the so-called Best Available
Techniques (BATs) are defined as follows : “the most effective and advanced stage in the development
of activities and their methods of operation which indicates the practical suitability of particular
techniques for providing the basis for emission limit values and other permit conditions designed to
prevent and, where that is not practicable, to reduce emissions and the impact on the environment as a
whole”.
Within this definition the following must be understood :
1. "techniques" includes both the technology used and the way in which the installation is designed, built, maintained, operated and decommissioned;
2. "available techniques" means those developed on a scale which allows implementation in the relevant industrial sector, under economically and technically viable conditions, taking into consideration the costs and advantages, whether or not the techniques are used or produced inside the Member State in question, as long as they are reasonably accessible to the operator;
3. "best" means most effective in achieving a high general level of protection of the environment as a whole.
In practice, when can a given technique be considered as a BAT? The answer is simple: if the technique is
mentioned as a BAT in any of the BATs Reference Documents (BREFs) prepared by the IPPC Bureau (see
the list in http://eippcb.jrc.es/reference/ ), then it is a BAT. If it is not mentioned as BAT in any of the
BREFs, then it is not a BAT.
It is also necessary to distinguish between BATs and Best Environmental practices.
Best Environmental Practices are practical operations performed in the production process, not being
included in in any of the BREFs as BATs, but whose implementation has positive effects on the
environment of the installation and its environment.
The BATs considered to be appropriate to the sector as a whole, and as far as possible emission and
consumption levels associated with the use of BAT, are presented in this section . Where emission or
consumption levels ‘associated with best available techniques’ are presented, this is to be understood as
meaning that those levels represent the environmental performance that can be anticipated as a result of
the application, in this sector, of the techniques described.
Most of the BATs presented come from the LCP BREF, and reference is made in each section of this
chapter to the section in that BREF where more information can be found. The LCP BREF sets out the BATs
specific to this industrial sector. Nevertheless, other BREFs contain as well BATs and other relevant
information that may be considered and may help in the assessment of the environmental impacts of this
sector and the techniques to reduce them:
78
- For further information related to the environmental impact of cooling systems used in large combustion plants they can be found in the BREF on industrial cooling systems. In this chapter some references to this BREF have been made.Regarding general information on the monitoring and reporting of emissions from the combustion of fossil fuel, the methods and instruments used for the monitoring of emissions should be the applicable national or international methods. For more detailed information on general monitoring issues, reference is made to the BREF on the General Principles of Monitoring (Monitoring BREF). This BREF does not establish BATs but contains a lot of relevant information related to the measurements and data management. At the moment of drafting this guide, the Monitoring BREF is being reviewed. In addition, its status has been changed from “BREF” into “Reference Report” by the European Commision due to the fact that it is not possible to derive BAT Conclusions according to the Industrial Emission Directive.
4.1.- Fuel Consumption reduction and thermal efficiency
maximization. (BREF chapter 4, sections 4.5.3 – 4.5.5)
4.1.1. Fuel pretreatment
For the fuel pretreatment of coal and lignite, blending and mixing of fuel are considered to be part of
BAT, in order to ensure stable combustion conditions and to thus reduce peak emissions. Switching
fuel, for example from one coal to another coal with a better environmental profile, can also be
regarded as BAT.
4.1.2. Combustion
For the combustion of coal and lignite, pulverised combustion (PC), fluidised bed combustion (CFBC
and BFBC) as well as pressurised fluidised bed combustion (PFBC) and grate firing are all considered to
be BAT for new and existing plants. Grate firing should preferably only be applied to new plants with a
rated thermal input below 100 MW.
For the design of new boilers or retrofit projects for existing plants, those firing systems are BAT which
assure a high boiler efficiency and which include primary measures to reduce the generation of NOX
emissions, such as air and fuel staging, advanced low-NOX burners and/or reburning, etc. The use of
advanced computerised control system in order to achieve a high boiler performance with increased
combustion conditions that support the reduction of emissions are also considered as BAT.
4.1.3. Thermal efficiency
For power plants, energy efficiency is considered as the heat rate (fuel input energy/energy output at
power plant border) and as the power plant efficiency, which is here considered as the inverse of heat
rate, i.e. the percentage of energy produced/fuel input energy. The fuel energy is measured as the
lower heating value.
For the reduction of greenhouse gases, in particular releases of CO2 from coal- and lignite-fired
combustion plants, the best available options from today’s point of view are techniques and
operational measures to increase thermal efficiency.
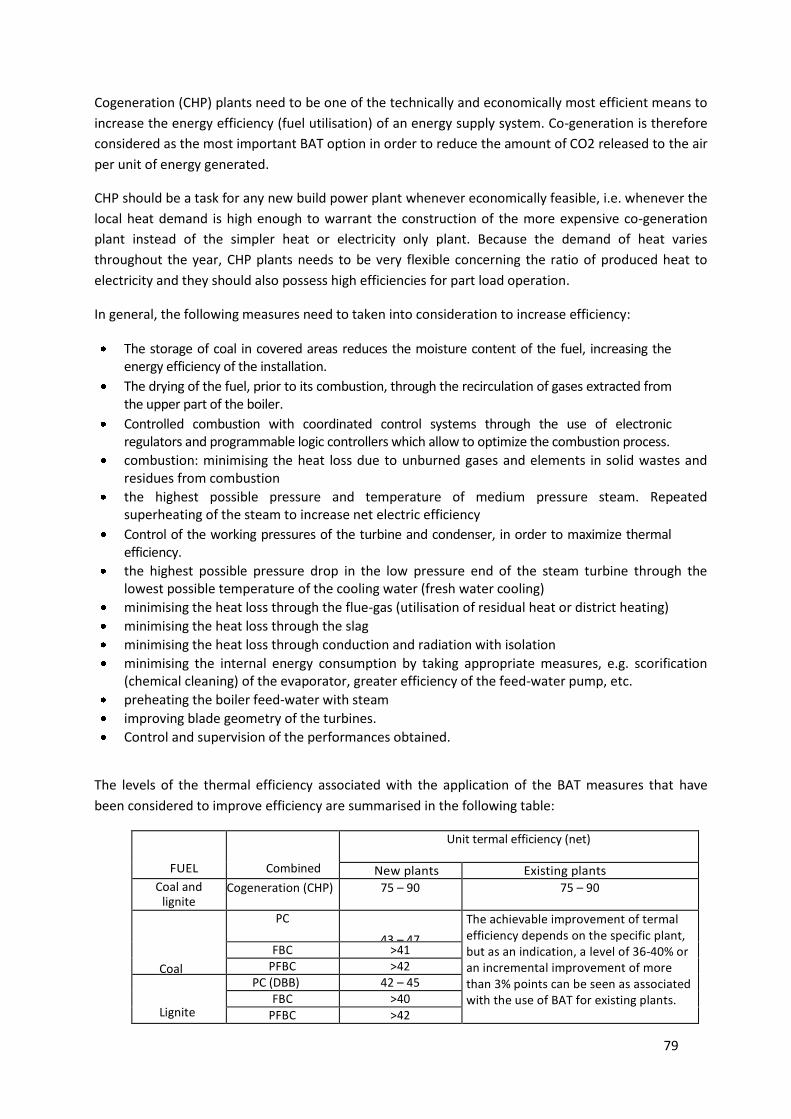
79
Cogeneration (CHP) plants need to be one of the technically and economically most efficient means to
increase the energy efficiency (fuel utilisation) of an energy supply system. Co-generation is therefore
considered as the most important BAT option in order to reduce the amount of CO2 released to the air
per unit of energy generated.
CHP should be a task for any new build power plant whenever economically feasible, i.e. whenever the
local heat demand is high enough to warrant the construction of the more expensive co-generation
plant instead of the simpler heat or electricity only plant. Because the demand of heat varies
throughout the year, CHP plants needs to be very flexible concerning the ratio of produced heat to
electricity and they should also possess high efficiencies for part load operation.
In general, the following measures need to taken into consideration to increase efficiency:
The storage of coal in covered areas reduces the moisture content of the fuel, increasing the energy efficiency of the installation.
The drying of the fuel, prior to its combustion, through the recirculation of gases extracted from the upper part of the boiler.
Controlled combustion with coordinated control systems through the use of electronic regulators and programmable logic controllers which allow to optimize the combustion process.
combustion: minimising the heat loss due to unburned gases and elements in solid wastes and residues from combustion
the highest possible pressure and temperature of medium pressure steam. Repeated superheating of the steam to increase net electric efficiency
Control of the working pressures of the turbine and condenser, in order to maximize thermal efficiency.
the highest possible pressure drop in the low pressure end of the steam turbine through the lowest possible temperature of the cooling water (fresh water cooling)
minimising the heat loss through the flue-gas (utilisation of residual heat or district heating)
minimising the heat loss through the slag
minimising the heat loss through conduction and radiation with isolation
minimising the internal energy consumption by taking appropriate measures, e.g. scorification (chemical cleaning) of the evaporator, greater efficiency of the feed-water pump, etc.
preheating the boiler feed-water with steam
improving blade geometry of the turbines.
Control and supervision of the performances obtained.
The levels of the thermal efficiency associated with the application of the BAT measures that have
been considered to improve efficiency are summarised in the following table:
FUEL
Combined
Technique
Unit termal efficiency (net)
(%) New plants Existing plants Coal and
lignite Cogeneration (CHP) 75 – 90 75 – 90
Coal
PC
(DBB and WBB)
43 – 47
The achievable improvement of termal efficiency depends on the specific plant, but as an indication, a level of 36-40% or an incremental improvement of more than 3% points can be seen as associated with the use of BAT for existing plants.
FBC >41 PFBC >42
Lignite
PC (DBB) 42 – 45 FBC >40
PFBC >42
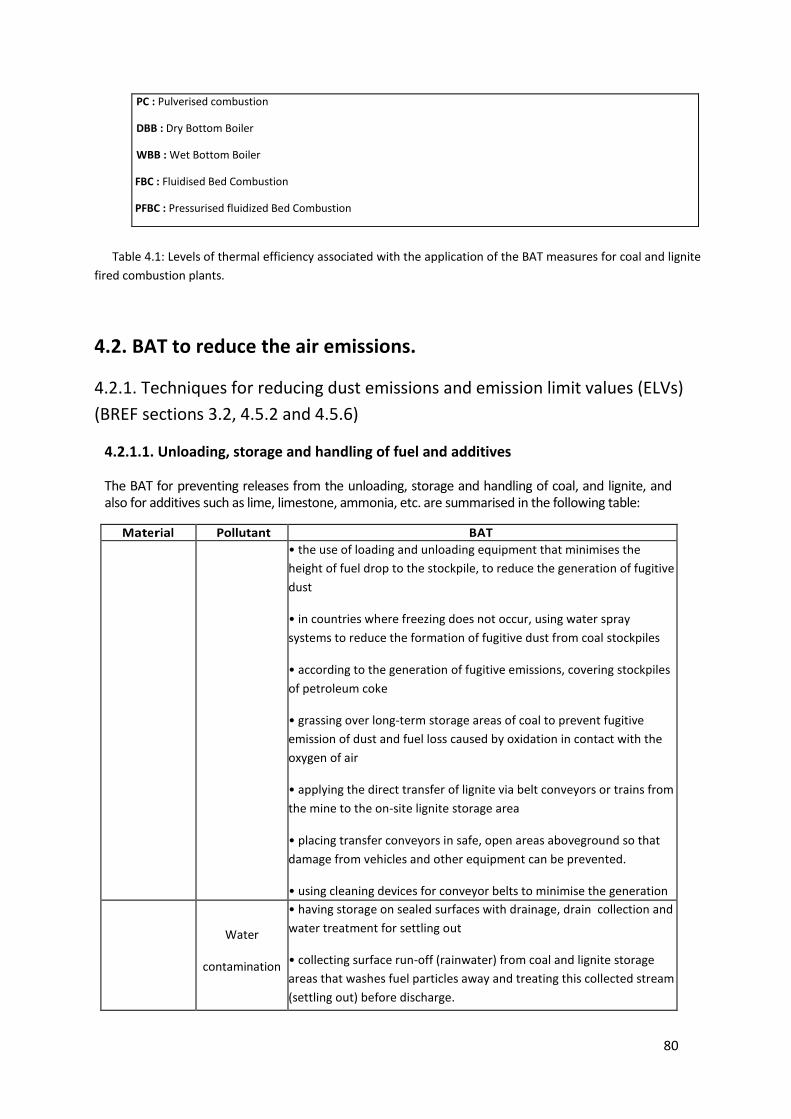
80
PC : Pulverised combustion
DBB : Dry Bottom Boiler
WBB : Wet Bottom Boiler
FBC : Fluidised Bed Combustion
PFBC : Pressurised fluidized Bed Combustion
Table 4.1: Levels of thermal efficiency associated with the application of the BAT measures for coal and lignite
fired combustion plants.
4.2. BAT to reduce the air emissions.
4.2.1. Techniques for reducing dust emissions and emission limit values (ELVs)
(BREF sections 3.2, 4.5.2 and 4.5.6)
4.2.1.1. Unloading, storage and handling of fuel and additives
The BAT for preventing releases from the unloading, storage and handling of coal, and lignite, and also for additives such as lime, limestone, ammonia, etc. are summarised in the following table:
Material Pollutant BAT
Coal and lignite
Dust
• the use of loading and unloading equipment that minimises the
height of fuel drop to the stockpile, to reduce the generation of fugitive
dust
• in countries where freezing does not occur, using water spray
systems to reduce the formation of fugitive dust from coal stockpiles
• according to the generation of fugitive emissions, covering stockpiles
of petroleum coke
• grassing over long-term storage areas of coal to prevent fugitive
emission of dust and fuel loss caused by oxidation in contact with the
oxygen of air
• applying the direct transfer of lignite via belt conveyors or trains from
the mine to the on-site lignite storage area
• placing transfer conveyors in safe, open areas aboveground so that
damage from vehicles and other equipment can be prevented.
• using cleaning devices for conveyor belts to minimise the generation
of fugitive dust
• using enclosed conveyors with well designed, robust extraction and
filtration equipment on conveyor transfer points to prevent the
emission of dust
• rationalising transport systems to minimise the generation and
transport of dust within the site
• the use of good design and construction practices and adequate
maintenance.
Water
contamination
• having storage on sealed surfaces with drainage, drain collection and
water treatment for settling out
• collecting surface run-off (rainwater) from coal and lignite storage
areas that washes fuel particles away and treating this collected stream
(settling out) before discharge.
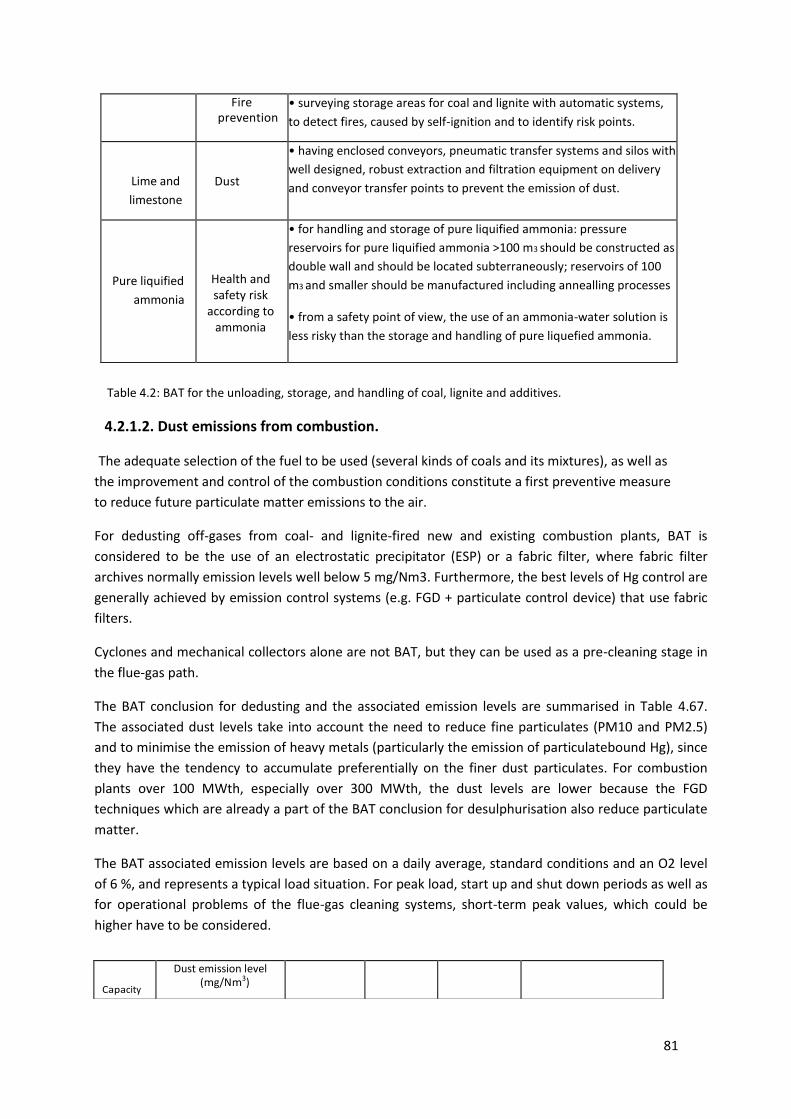
81
Fire prevention
• surveying storage areas for coal and lignite with automatic systems,
to detect fires, caused by self-ignition and to identify risk points.
.
Lime and
limestone
Dust
• having enclosed conveyors, pneumatic transfer systems and silos with
well designed, robust extraction and filtration equipment on delivery
and conveyor transfer points to prevent the emission of dust.
Pure liquified
ammonia
Health and safety risk
according to ammonia
• for handling and storage of pure liquified ammonia: pressure
reservoirs for pure liquified ammonia >100 m3 should be constructed as
double wall and should be located subterraneously; reservoirs of 100
m3 and smaller should be manufactured including annealling processes
• from a safety point of view, the use of an ammonia-water solution is
less risky than the storage and handling of pure liquefied ammonia.
Table 4.2: BAT for the unloading, storage, and handling of coal, lignite and additives.
4.2.1.2. Dust emissions from combustion.
The adequate selection of the fuel to be used (several kinds of coals and its mixtures), as well as
the improvement and control of the combustion conditions constitute a first preventive measure
to reduce future particulate matter emissions to the air.
For dedusting off-gases from coal- and lignite-fired new and existing combustion plants, BAT is
considered to be the use of an electrostatic precipitator (ESP) or a fabric filter, where fabric filter
archives normally emission levels well below 5 mg/Nm3. Furthermore, the best levels of Hg control are
generally achieved by emission control systems (e.g. FGD + particulate control device) that use fabric
filters.
Cyclones and mechanical collectors alone are not BAT, but they can be used as a pre-cleaning stage in
the flue-gas path.
The BAT conclusion for dedusting and the associated emission levels are summarised in Table 4.67.
The associated dust levels take into account the need to reduce fine particulates (PM10 and PM2.5)
and to minimise the emission of heavy metals (particularly the emission of particulatebound Hg), since
they have the tendency to accumulate preferentially on the finer dust particulates. For combustion
plants over 100 MWth, especially over 300 MWth, the dust levels are lower because the FGD
techniques which are already a part of the BAT conclusion for desulphurisation also reduce particulate
matter.
The BAT associated emission levels are based on a daily average, standard conditions and an O2 level
of 6 %, and represents a typical load situation. For peak load, start up and shut down periods as well as
for operational problems of the flue-gas cleaning systems, short-term peak values, which could be
higher have to be considered.
Capacity
Dust emission level (mg/Nm3)
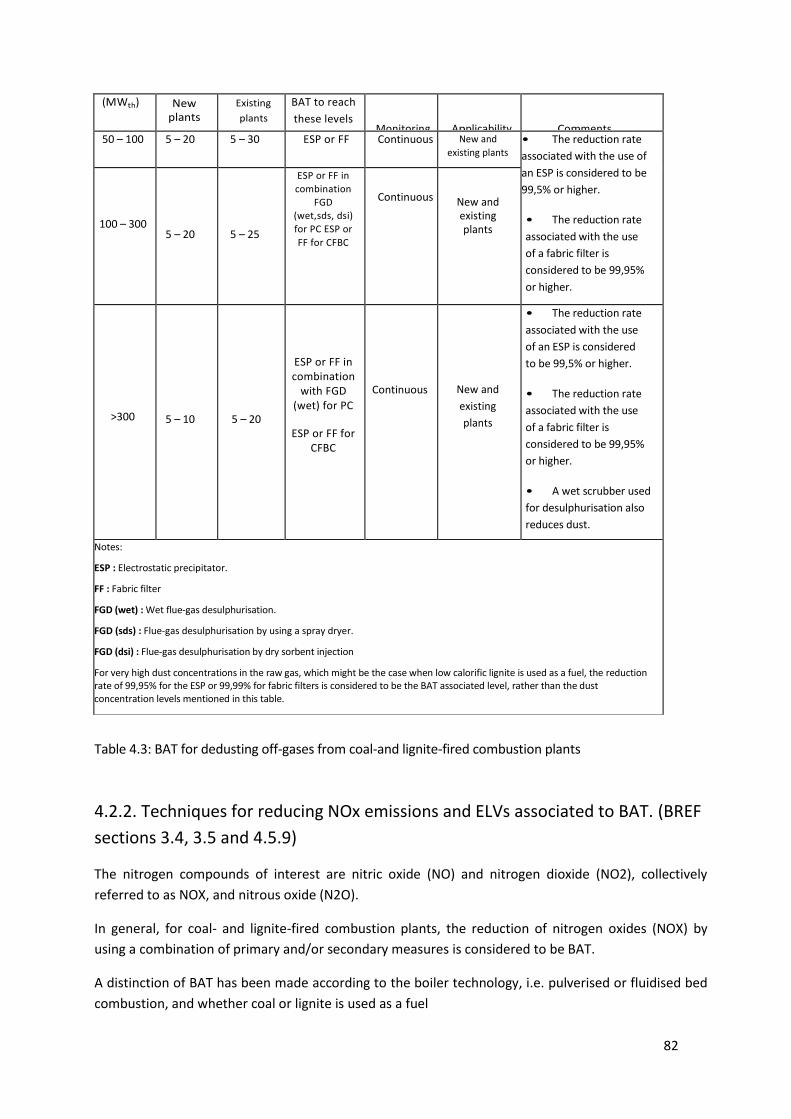
82
Table 4.3: BAT for dedusting off-gases from coal-and lignite-fired combustion plants
4.2.2. Techniques for reducing NOx emissions and ELVs associated to BAT. (BREF
sections 3.4, 3.5 and 4.5.9)
The nitrogen compounds of interest are nitric oxide (NO) and nitrogen dioxide (NO2), collectively
referred to as NOX, and nitrous oxide (N2O).
In general, for coal- and lignite-fired combustion plants, the reduction of nitrogen oxides (NOX) by
using a combination of primary and/or secondary measures is considered to be BAT.
A distinction of BAT has been made according to the boiler technology, i.e. pulverised or fluidised bed
combustion, and whether coal or lignite is used as a fuel
(MWth) New plants
Existing
plants
BAT to reach
these levels
Monitoring
Applicability
Comments 50 – 100 5 – 20 5 – 30 ESP or FF Continuous New and
existing plants • The reduction rate
associated with the use of
an ESP is considered to be
99,5% or higher.
• The reduction rate
associated with the use
of a fabric filter is
considered to be 99,95%
or higher.
100 – 300
5 – 20
5 – 25
ESP or FF in
combination
FGD (wet,sds, dsi)
for PC ESP or
FF for CFBC
Continuous
New and existing plants
>300
5 – 10
5 – 20
5 – 20
5 – 20
ESP or FF in combination
with FGD (wet) for PC
ESP or FF for CFBC
Continuous
New and
existing
plants
• The reduction rate
associated with the use
of an ESP is considered
to be 99,5% or higher.
• The reduction rate
associated with the use
of a fabric filter is
considered to be 99,95%
or higher.
• A wet scrubber used
for desulphurisation also
reduces dust.
Notes:
ESP : Electrostatic precipitator.
FF : Fabric filter
FGD (wet) : Wet flue-gas desulphurisation.
FGD (sds) : Flue-gas desulphurisation by using a spray dryer.
FGD (dsi) : Flue-gas desulphurisation by dry sorbent injection
For very high dust concentrations in the raw gas, which might be the case when low calorific lignite is used as a fuel, the reduction rate of 99,95% for the ESP or 99,99% for fabric filters is considered to be the BAT associated level, rather than the dust concentration levels mentioned in this table.
83
For pulverised coal combustion plants, the reduction of NOX emissions, by the use of primary
measures in combination with secondary measures such as SCR (see Annex III) is BAT, where the
separation efficiency of the SCR system ranges between 80 and 95 %.
There are different processes available today for the regeneration of used catalysts, which increases
the catalyst lifetime considerably and which, therefore, reduces the operating costs.
The economic feasibility of applying an SCR system to an existing boiler is primarily a question of the
expected remaining lifetime of the plant, which cannot necessarily be determined by the age of the
plant. The use of SCR has the disadvantage of a ‘slide’ ammonia emission (i.e. ammonia slip).
With respect to the ammonia concentration when using an SCR, a level of less than 5 mg/Nm3 is the
associated BAT level. This level also avoids problems in the future utilisation of fly ash and the smell of
the flue-gas in the surrounding area.
Combined techniques for the reduction of NOX and SO2 described in Section 3.5, such as the activated
carbon and the DESONOX process (see Annex III), are part of the BAT conclusion, but their advantages,
disadvantages and applicability need to be verified on a local level.
For pulverised lignite-fired combustion plants, the combination of different primary measures is
considered as BAT. This means, for instance, the use of advanced low NOX burners in combination
with other primary measures such as flue-gas recirculation, staged combustion (air staging), reburning,
etc. The SCR technique is regarded as part of BAT for the reduction of NOx emissions, but on account
of the relatively low NOX emissions of lignite-fired plants compared with hard coal-fired plants, SCR
has not been considered as BAT in a general sense for the combustion of lignite.
For the application of advanced low NOX burners to existing boilers, it should be noted, that in older
installations, the furnaces will usually have been built as small as possible (designed for high
combustion intensity). Therefore, the furnace temperature can only be reduced to a limited extent. In
addition, the furnace depth can only accommodate slightly longer flames than it was originally
designed for. For older furnaces, the application of modern swirl burners, which have flames not much
longer than those in the original burners, are regarded as BAT.
The furnace height in old furnaces is usually small and may prevent the installation of overfire air (OFA)
ports. Even if there is room for an OFA, the residence time of the combustion gases in the upper part
of the furnace may not be long enough for complete combustion. In boilers that were built in later
years when more was known about NOX formation, the furnace would usually be larger and lower
NOX levels can thus be achieved. The best results are obtained when low NOX combustion is
integrated into the boiler design, i.e. in new installations.
For small plants without high load variations and with a stable fuel quality, the SNCR technique can be
seen as an additional measure to further reduce NOX emissions.
The use of primary measures, either for coal or lignite, tends to cause incomplete combustion resulting
in a higher level of unburned carbon in the fly ash and some carbon monoxide emissions. With a good
design and control of combustion, these negative impacts can mostly be avoided.
84
The amount of unburned carbon-in-ash varies according to the fuel and is normally somewhat higher
than without primary measures. For most of the utilisation options for the fly ash, the associated BAT
level of unburned carbon-in-ash is below 5 %. Levels of unburned carbon below 5 % can normally be
achieved but with some coals only at the cost of somewhat higher NOX emissions.
Primary NOX reduction measures also have an impact on the total energy efficiency of the process. If
the combustion remains incomplete, the energy efficiency remains lower. A normal rise in the amount
of unburned carbon due to low NOX combustion has a negative impact of approximately 0.1 – 0.3 % on
the unit efficiency.
In boilers fed with coal, it is consider as BAT to reduce NOx the measures taken to optimize the recirculation of the combustion gases.
For the fluidised bed combustion (FBC) of coal and lignite, staged combustion (air-staging) is
considered to be BAT. In this case, the combustion starts in under stoichiometric conditions by
pyrolysis in the bubbling bed or in the bubbling bed type lower part of the circulating bed. The rest of
the combustion air is added later in stages to finally achieve the over stoichiometric conditions and to
complete combustion.
In circulating fluidised beds, the circulating bed material ensures an even temperature distribution that
typically keeps the furnace temperature below 900 oC, which prevents, to a large extent, the
formation of thermal NOX.
On the other hand, low temperatures promote the generation of N2O and increase the amount of
unburned carbon. The fluidised bed combustion option is, therefore, a balancing act between the
partially conflicting requirements of NOX, N2O, and SO2 control, and the control of unburned
hydrocarbons, CO, and char.
In FBC boilers, N2O emission levels of 30 – 150 mg/Nm3 may occur depending on the fuel used (hard
coal or lignite).
In the bubbling bed freeboard above the bed itself, the combustion of the pyrolysis gases can produce
temperatures in excess of 1200 oC and promoting this, the formation of thermal NOX. As a general
rule, NOX formation in a properly designed fluidised bed can be kept below the NOx formation
achieved by low NOX burners.
The BAT associated emission levels are based on a daily average, standard conditions and an O2 level of 6 %, and represent a typical load situation. For peak load, start up and shut down periods, as well as for operational problems of the flue-gas cleaning systems, short-term peak values which could be higher have to be regarded.
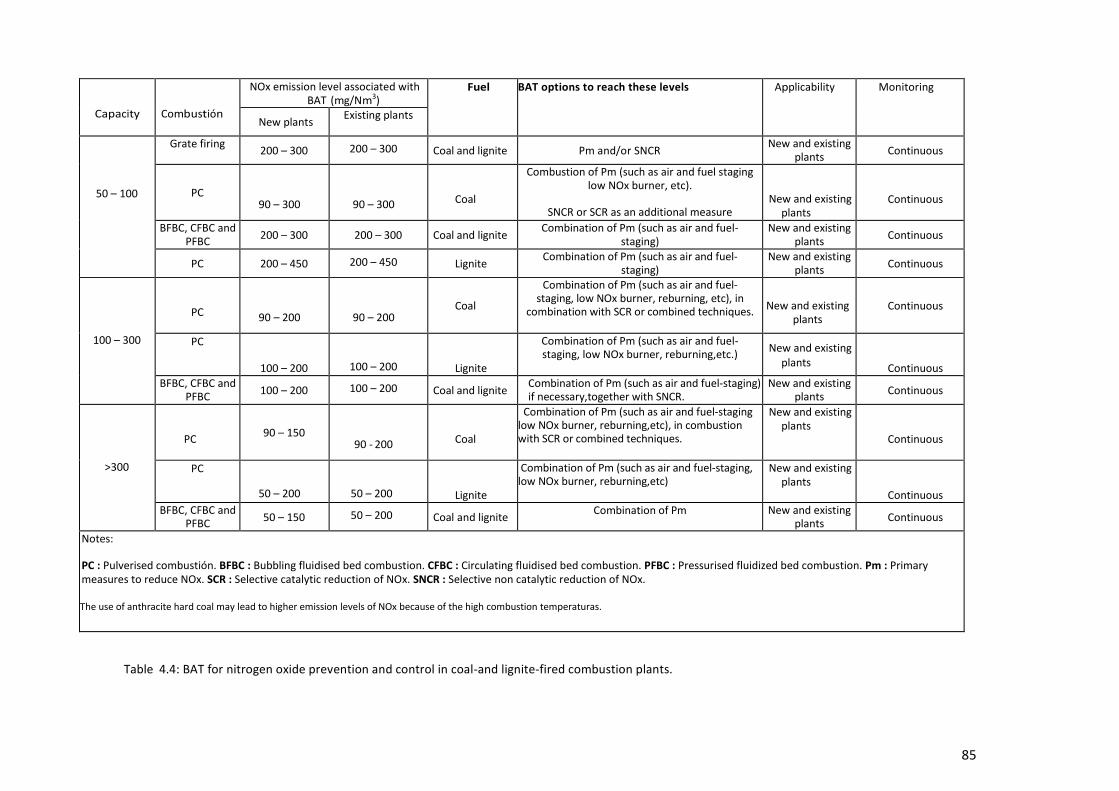
85
Capacity
(MWth)
Combustión
technique
NOx emission level associated with BAT (mg/Nm3)
Fuel BAT options to reach these levels Applicability Monitoring
New plants Existing plants
50 – 100
Grate firing 200 – 300
200 – 300 Coal and lignite Pm and/or SNCR New and existing
plants Continuous
PC
90 – 300
90 – 300
Coal
Combustion of Pm (such as air and fuel staging low NOx burner, etc).
SNCR or SCR as an additional measure
New and existing plants
Continuous
BFBC, CFBC and PFBC
200 – 300 200 – 300 Coal and lignite Combination of Pm (such as air and fuel-staging)
New and existing plants
Continuous
PC 200 – 450 200 – 450 Lignite Combination of Pm (such as air and fuel-staging)
New and existing plants
Continuous
100 – 300
PC
90 – 200
90 – 200
Coal
Combination of Pm (such as air and fuel-staging, low NOx burner, reburning, etc), in
combination with SCR or combined techniques.
New and existing plants
Continuous
PC
100 – 200
100 – 200
Lignite
Combination of Pm (such as air and fuel-staging, low NOx burner, reburning,etc.)
New and existing plants
Continuous BFBC, CFBC and
PFBC 100 – 200
100 – 200 Coal and lignite Combination of Pm (such as air and fuel-staging)
if necessary,together with SNCR. New and existing
plants Continuous
>300
PC
90 – 150
90 - 200
Coal
Combination of Pm (such as air and fuel-staging low NOx burner, reburning,etc), in combustion with SCR or combined techniques.
New and existing plants
Continuous
PC
50 – 200
50 – 200
Lignite
Combination of Pm (such as air and fuel-staging, low NOx burner, reburning,etc)
New and existing plants
Continuous BFBC, CFBC and
PFBC 50 – 150
50 – 200 Coal and lignite Combination of Pm
(such as air and fuel-staging)
New and existing plants
Continuous
Notes:
PC : Pulverised combustión. BFBC : Bubbling fluidised bed combustion. CFBC : Circulating fluidised bed combustion. PFBC : Pressurised fluidized bed combustion. Pm : Primary measures to reduce NOx. SCR : Selective catalytic reduction of NOx. SNCR : Selective non catalytic reduction of NOx.
The use of anthracite hard coal may lead to higher emission levels of NOx because of the high combustion temperaturas.
Table 4.4: BAT for nitrogen oxide prevention and control in coal-and lignite-fired combustion plants.
86
4.2.3. Techniques for reducing SO2 emissions and ELVs associated to BAT. (BREF
sections 3.3, 3.5 and 4.5.8)
In general, for coal- and lignite-fired combustion plants desulphurisation (FGD) and the use of low
sulphur fuel are considered to be BAT. However, the use of low sulphur fuel can be a supplementary
technique (particularly for plants over 100 MWth), but generally is not itself sufficient to reduce SO2
emissions. For combustion plants less than 100 MWth, the use of low sulphur coal or sorbent injection is
considered to be BAT.
A distinction of BAT has been made according to the boiler technology: large pulverised coaland lignite-
fired plants are considered separately from fluidised bed boilers, because of the different technical
options for desulphurisation.
Besides the use of low sulphur coal, the techniques that are considered to be BAT for pulverised coal-
and lignite-fired combustion plants are: wet scrubbers, spray dry scrubbers, and for smaller applications
below approximately 250 MWth also dry sorbent injection (i.e. dry FGD with an adjacent fabric filter).
These techniques have a market share of more than 90 % of the flue-gas desulphurisation techniques.
The corresponding rate of desulphurisation is considered for wet scrubbers between 85 and 98 %, for
spray dryer scrubbers between 80 and 92 % and for dry sorbent injection between 70 and 90 %. It is,
however, not necessary to run the desulphurisation plants on these levels, if the SO2 emission
achievable in this way would be far below the emission levels associated with BAT.
The wet scrubber has also a high reduction rate for HF and HCl (98 – 99 %). FGDs equipped with rotating
gas-gas heat exchangers show higher emissions. The associated emission level for both pollutants by
using a wet scrubber is 1 – 5 mg/Nm3.
Another advantage of the wet scrubber is its contribution to the reduction of dust and heavy metal
(such as Hg) emissions. Existing plants that have already applied a wet FGD system can reduce the SO2
emissions by optimising the flow pattern in the absorber vessel. The wet scrubbing process is expensive
for smaller plants and has therefore not been considered as BAT for plants with a capacity of less than
100 MWth. However, on the contrary to other FGD systems, wet scrubbers produce gypsum which may
be a saleable product used by the cement or construction industries.
The seawater scrubber has been considered to be part of the BAT conclusion because of its high
reliability, and because it is a simple process which does not require slurry handling and does not
generate by-products. However, local conditions such as seawater conditions, tidal flows, the marine
(aquatic) environment close to the scrubber water outlet, etc. need to be carefully examined in order to
avoid any negative environmental or ecological effects. Effects may arise from the reduction of the pH
level in the general vicinity of the power plant as well as from the input of remaining metals (heavy
metals in particular Hg) and fly ash. This is especially applicable for plants situated in an estuary.
Regarding Hg, care needs to be taken that Council Directive 84/156/EEC on mercury discharges is
complied with. Under that Directive and in absence of Community limit values, the Member States will
fix emission standards for mercury discharges autonomously in accordance with the previous Directive
76/464/EEC. Such standards must take into account the best technical means available and must not be
less stringent than the most nearly comparable limit value in Annex I of Directive 84/156/EEC.
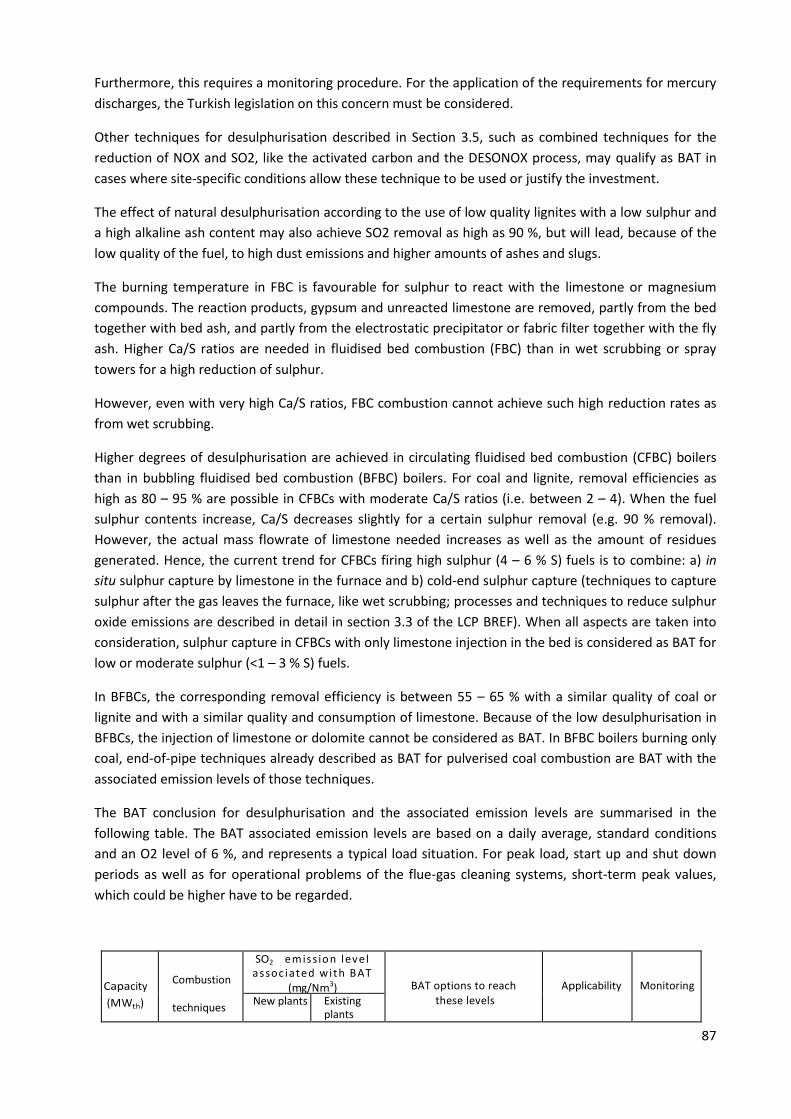
87
Furthermore, this requires a monitoring procedure. For the application of the requirements for mercury
discharges, the Turkish legislation on this concern must be considered.
Other techniques for desulphurisation described in Section 3.5, such as combined techniques for the
reduction of NOX and SO2, like the activated carbon and the DESONOX process, may qualify as BAT in
cases where site-specific conditions allow these technique to be used or justify the investment.
The effect of natural desulphurisation according to the use of low quality lignites with a low sulphur and
a high alkaline ash content may also achieve SO2 removal as high as 90 %, but will lead, because of the
low quality of the fuel, to high dust emissions and higher amounts of ashes and slugs.
The burning temperature in FBC is favourable for sulphur to react with the limestone or magnesium
compounds. The reaction products, gypsum and unreacted limestone are removed, partly from the bed
together with bed ash, and partly from the electrostatic precipitator or fabric filter together with the fly
ash. Higher Ca/S ratios are needed in fluidised bed combustion (FBC) than in wet scrubbing or spray
towers for a high reduction of sulphur.
However, even with very high Ca/S ratios, FBC combustion cannot achieve such high reduction rates as
from wet scrubbing.
Higher degrees of desulphurisation are achieved in circulating fluidised bed combustion (CFBC) boilers
than in bubbling fluidised bed combustion (BFBC) boilers. For coal and lignite, removal efficiencies as
high as 80 – 95 % are possible in CFBCs with moderate Ca/S ratios (i.e. between 2 – 4). When the fuel
sulphur contents increase, Ca/S decreases slightly for a certain sulphur removal (e.g. 90 % removal).
However, the actual mass flowrate of limestone needed increases as well as the amount of residues
generated. Hence, the current trend for CFBCs firing high sulphur (4 – 6 % S) fuels is to combine: a) in
situ sulphur capture by limestone in the furnace and b) cold-end sulphur capture (techniques to capture
sulphur after the gas leaves the furnace, like wet scrubbing; processes and techniques to reduce sulphur
oxide emissions are described in detail in section 3.3 of the LCP BREF). When all aspects are taken into
consideration, sulphur capture in CFBCs with only limestone injection in the bed is considered as BAT for
low or moderate sulphur (<1 – 3 % S) fuels.
In BFBCs, the corresponding removal efficiency is between 55 – 65 % with a similar quality of coal or
lignite and with a similar quality and consumption of limestone. Because of the low desulphurisation in
BFBCs, the injection of limestone or dolomite cannot be considered as BAT. In BFBC boilers burning only
coal, end-of-pipe techniques already described as BAT for pulverised coal combustion are BAT with the
associated emission levels of those techniques.
The BAT conclusion for desulphurisation and the associated emission levels are summarised in the
following table. The BAT associated emission levels are based on a daily average, standard conditions
and an O2 level of 6 %, and represents a typical load situation. For peak load, start up and shut down
periods as well as for operational problems of the flue-gas cleaning systems, short-term peak values,
which could be higher have to be regarded.
Capacity
(MWth)
Combustion
techniques
SO2 emiss ion level assoc iated with BAT
(mg/Nm3)
BAT options to reach these levels
Applicability
Monitoring New plants Existing
plants
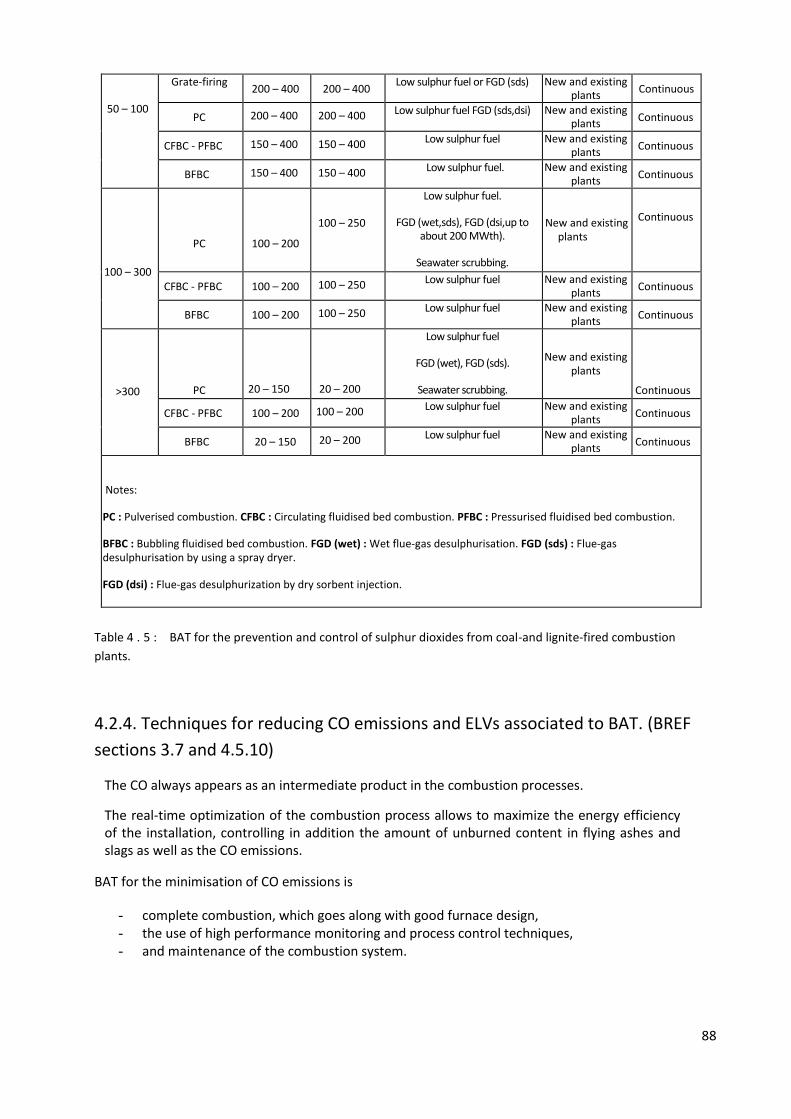
88
50 – 100
Grate-firing 200 – 400 200 – 400 Low sulphur fuel or FGD (sds) New and existing
plants Continuous
PC 200 – 400 200 – 400 Low sulphur fuel FGD (sds,dsi) New and existing plants
Continuous
CFBC - PFBC 150 – 400 150 – 400 Low sulphur fuel
Limestone injection
New and existing plants
Continuous
BFBC 150 – 400 150 – 400 Low sulphur fuel.
FGD (dsi), FGD (sds)
New and existing plants
Continuous
100 – 300
PC
100 – 200
100 – 250
Low sulphur fuel.
FGD (wet,sds), FGD (dsi,up to about 200 MWth).
Seawater scrubbing.
Combined techniques for the reduction of NOx and SO2.
New and existing plants
Continuous
CFBC - PFBC 100 – 200 100 – 250 Low sulphur fuel
Limestone injection
New and existing plants
Continuous
BFBC 100 – 200 100 – 250 Low sulphur fuel
FGD (wet, sds)
New and existing plants
Continuous
>300
PC
20 – 150
20 – 200
Low sulphur fuel
FGD (wet), FGD (sds).
Seawater scrubbing.
Combined techniques for the reduction of NOx and SO2
New and existing plants
Continuous
CFBC - PFBC 100 – 200 100 – 200 Low sulphur fuel
Limestone injection
New and existing plants
Continuous
BFBC 20 – 150 20 – 200 Low sulphur fuel
FGD (wet)
New and existing plants
Continuous
Notes:
PC : Pulverised combustion. CFBC : Circulating fluidised bed combustion. PFBC : Pressurised fluidised bed combustion.
BFBC : Bubbling fluidised bed combustion. FGD (wet) : Wet flue-gas desulphurisation. FGD (sds) : Flue-gas desulphurisation by using a spray dryer.
FGD (dsi) : Flue-gas desulphurization by dry sorbent injection.
Table 4 . 5 : BAT for the prevention and control of sulphur dioxides from coal-and lignite-fired combustion
plants.
4.2.4. Techniques for reducing CO emissions and ELVs associated to BAT. (BREF
sections 3.7 and 4.5.10)
The CO always appears as an intermediate product in the combustion processes.
The real-time optimization of the combustion process allows to maximize the energy efficiency of the installation, controlling in addition the amount of unburned content in flying ashes and slags as well as the CO emissions.
BAT for the minimisation of CO emissions is
- complete combustion, which goes along with good furnace design, - the use of high performance monitoring and process control techniques, - and maintenance of the combustion system.
89
Because of the negative effect of NOX reduction on CO, a well-optimised system to reduce emissions of
NOX will also keep the CO levels down to (30 – 50 mg/Nm3 for pulverised combustion, and below 100
mg/Nm3 in the case of FBC). For lignite-fired combustion plants where mainly primary measures are
regarded as BAT for the reduction of NOX emissions, the CO levels can be higher (100 – 200 mg/Nm3).
4.2.5. Techniques for reducing heavy metals emissions and ELVs associated to
BAT. (BREF sections 3.6 and 4.5.7)
The mineral content of the fuel includes different substances depending on its origin. All solid fuels such
as coal and lignite have a certain concentration of trace elements, such as heavy metals. The behaviour
of heavy metals in the combustion process involves complex physicochemical processes. Basically most
of the heavy metals evaporate in the combustion process and condensate later in the process onto the
surfaces of the particulate matter (i.e. fly ash).
Therefore, BAT to reduce the emissions of heavy metals from flue-gases of coal- and lignite-fired
combustion plants is to use a high performance ESP (reduction rate >99.5 %) or a fabric filter (reduction
rate >99.95 %)
Mercury has a high vapour pressure at the typical control device operating temperatures, and its
collection by particulate matter control devices is highly variable. Taking into account that spray dryer
FGD scrubbers and wet lime/limestone scrubbers are regarded as BAT for the reduction of SO2 for larger
combustion plants, low Hg emission levels are achieved.
For the reduction and limitation of Hg emissions, it can be stated, that coals of good quality have
comparably low Hg contents and that the best levels of control are generally obtained by emission
control systems that use FFs and ESPs, where high efficiency ESPs show good removal of Hg (bituminous
coal) at temperatures of less than 130 ºC. In addition, some combinations of flue-gas cleaning systems
can remove oxidised and particle bound Hg to some extent.
For FFs or ESPs operated in combination with FGD techniques, such as wet limestone scrubbers, spray
dryer scrubbers or dry sorbent injection, an average removal rate of 75 % (50 % in ESP and 50 % in FGD)
or 90 % in the additional presence of SCR can be obtained. The reduction rate when firing sub-
bituminous coal or lignite is considerably lower and ranges from 30 – 70 %. The lower levels of Hg
capture in plants firing sub-bituminous coal and lignite are attributed to the low fly ash carbon content
and the higher relative amounts of gaseous Hg in the flue-gas from the combustion of these fuels.
In the case of LCPs fed with hard coal or lignite, total Hg emissions will be measured at least once a year.
Total Hg emissions need to be monitored and not only Hg present as part of the particle matter.
4.2.6. Other emissions (chlorides,ammonia…) (BREF sections 3.8 and 4.5.11)
For combustion plants, the wet scrubber process (especially for plants with a capacity of over 100
MWth) and the spray dryer have been considered as BAT for the reduction of SO2. These techniques
also give a high reduction rate for HF and HCl (98 – 99 %). By using the wet scrubber or a spray dryer,
90
the associated emission level for HCl is 1 – 10 mg/Nm3 and for HF 1 – 5 mg/Nm3. If an FGD is not
applied, for example if dry lime is added to an FBC boiler, the emission level of both HCl and HF can be
much higher.
In measuring elevated levels of HF or HCl in the stack, the problem might be related to an internal flue-
gas leakage in the rotating gas-gas heat-exchanger. In this event, raw flue-gas will then go directly to the
stack without reducing the SO2, HF and HCl contents. Therefore, a modern type of gas-gas heat-
exchanger has been considered as part of the BAT conclusion.
However, because of operational and economic reasons, replacement only needs to be considered
when the heat exchanger needs to be changed or replaced anyway. The new gas-gas heat-exchanger
might be a combination of a heat extractor (multi-pipe heat extractor) and a reheater, or the use of heat
pipes. The best option in this case is flue-gas discharge via the cooling tower, if possible. In this case, no
flue-gas reheating is necessary and therefore no gasgas heat-exchanger is needed. Another option is the
use of a high-grade drop catcher and passing the flue-gas via an acid resistant stack pipe, where no flue-
gas reheating is necessary and therefore no gas-gas heat-exchanger is needed.
Because the injection of limestone for CFBC has been regarded as BAT for the reduction of SO2 instead
of the wet scrubber of pulverised combustion, the BAT associated level of HCl is between 15 – 30
mg/Nm3.
Ammonia (NH3)
The disadvantage of SNCR and SCR systems is the emission of unreacted ammonia into the air (ammonia
slip). The ammonium concentration associated with the use of BAT is considered to be below 5 mg/Nm3
to avoid problems in the utilisation of fly ash and possibly the smell of the flue-gas in surrounding areas.
The ammonium slip is often the limiting factor in the utilisation of the SNCR technique. To avoid
ammonia slip with the SNCR technique, a low layer of SCR catalyst can be installed in the economiser
area of the boiler. As this catalyst reduces the ammonia slip, it also reduces the corresponding amount
of NOX.
4.3. BAT to reduce the pollutants load of wastewaters. (BREF sections
3.10 and 4.5.13)
Different waste water streams are generated by operating coal- and lignite-fired combustion plants.
4.3.1. Preventive measures to reduce water consumption and water pollution
- Register and control water consumptions, in order to take afterwards measures to save it, by sectors
- Reduce water consumption through recirculation, incorporating the right treatments to guarantee its quality.
- Separate rain waters from waters used in the processes. - Implement hybrid cooling systems to reduce water consumption. - Implement air cooling if it is no or very limited amount of water.
This measure causes a reduction in the energy efficiency.
- Use of water at high pressure or mechanical sweepers for the cleaning operations of the
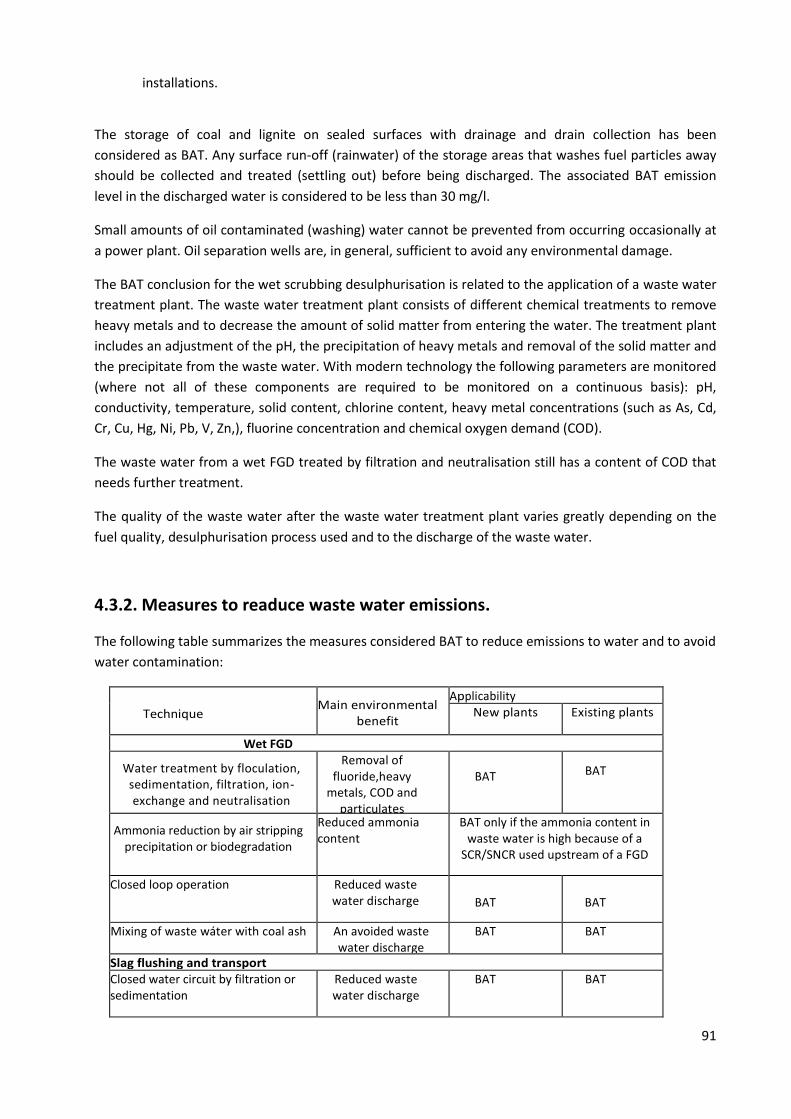
91
installations.
The storage of coal and lignite on sealed surfaces with drainage and drain collection has been
considered as BAT. Any surface run-off (rainwater) of the storage areas that washes fuel particles away
should be collected and treated (settling out) before being discharged. The associated BAT emission
level in the discharged water is considered to be less than 30 mg/l.
Small amounts of oil contaminated (washing) water cannot be prevented from occurring occasionally at
a power plant. Oil separation wells are, in general, sufficient to avoid any environmental damage.
The BAT conclusion for the wet scrubbing desulphurisation is related to the application of a waste water
treatment plant. The waste water treatment plant consists of different chemical treatments to remove
heavy metals and to decrease the amount of solid matter from entering the water. The treatment plant
includes an adjustment of the pH, the precipitation of heavy metals and removal of the solid matter and
the precipitate from the waste water. With modern technology the following parameters are monitored
(where not all of these components are required to be monitored on a continuous basis): pH,
conductivity, temperature, solid content, chlorine content, heavy metal concentrations (such as As, Cd,
Cr, Cu, Hg, Ni, Pb, V, Zn,), fluorine concentration and chemical oxygen demand (COD).
The waste water from a wet FGD treated by filtration and neutralisation still has a content of COD that
needs further treatment.
The quality of the waste water after the waste water treatment plant varies greatly depending on the
fuel quality, desulphurisation process used and to the discharge of the waste water.
4.3.2. Measures to readuce waste water emissions.
The following table summarizes the measures considered BAT to reduce emissions to water and to avoid
water contamination:
Technique
Main environmental benefit
Applicability New plants Existing plants
Wet FGD
Water treatment by floculation, sedimentation, filtration, ion-exchange and neutralisation
Removal of fluoride,heavy
metals, COD and particulates
BAT
BAT
Ammonia reduction by air stripping precipitation or biodegradation
Reduced ammonia content
BAT only if the ammonia content in waste water is high because of a
SCR/SNCR used upstream of a FGD
Closed loop operation Reduced waste water discharge
BAT
BAT
Mixing of waste wáter with coal ash An avoided waste water discharge
BAT BAT
Slag flushing and transport Closed water circuit by filtration or sedimentation
Reduced waste water discharge
BAT BAT
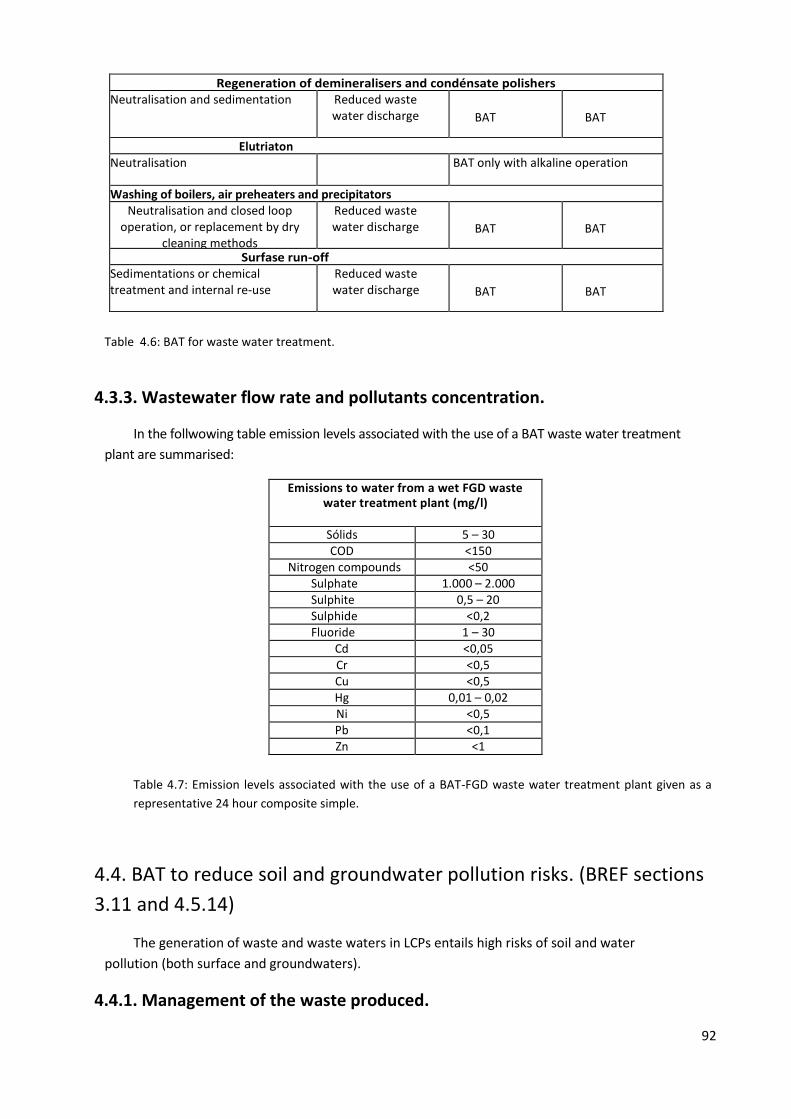
92
Regeneration of demineralisers and condénsate polishers Neutralisation and sedimentation Reduced waste
water discharge
BAT
BAT
Elutriaton Neutralisation BAT only with alkaline operation
Washing of boilers, air preheaters and precipitators Neutralisation and closed loop
operation, or replacement by dry cleaning methods
Reduced waste water discharge
BAT
BAT
Surfase run-off Sedimentations or chemical treatment and internal re-use
Reduced waste water discharge
BAT
BAT
Table 4.6: BAT for waste water treatment.
4.3.3. Wastewater flow rate and pollutants concentration.
In the follwowing table emission levels associated with the use of a BAT waste water treatment
plant are summarised:
Emissions to water from a wet FGD waste water treatment plant (mg/l)
Sólids 5 – 30 COD <150
Nitrogen compounds <50 Sulphate 1.000 – 2.000 Sulphite 0,5 – 20 Sulphide <0,2 Fluoride 1 – 30
Cd <0,05 Cr <0,5 Cu <0,5 Hg 0,01 – 0,02 Ni <0,5 Pb <0,1 Zn <1
Table 4.7: Emission levels associated with the use of a BAT-FGD waste water treatment plant given as a
representative 24 hour composite simple.
4.4. BAT to reduce soil and groundwater pollution risks. (BREF sections
3.11 and 4.5.14)
The generation of waste and waste waters in LCPs entails high risks of soil and water
pollution (both surface and groundwaters).
4.4.1. Management of the waste produced.
93
All the wastes generated in the LCP must be characterized and categorized (hazardous, non hazardous, inert), then stored with hygiene and safety, identifying, labelling and managing them properly. This operation are considered BAT.
The temporary storage of waste must be done in facilities specially designed for that, which have proper prevention measures to ensure the correct separation of wastes, and to avoid a possible pollution of soil and water (surface and groundwaters)
More concretely, there must be:
- Paved and watertight surfaces in waste storage areas. - Containing devices in the fuel deposits and hazardous waste deposits, with enough capacity
to contain the volume of the whole deposit in case of spill. - Systems for collecting spills of hazardous waste (sealed caskets, absorbent materials ...). - Fire safety systems.
4.4.2. BATs and best practices to avoid soil and groundwater pollution.
- Avoid excessive use of groundwater. - Installation of storage tanks and facilities for loading / unloading designed to prevent spills
and prevent contamination of soil and water caused by leaks. - Installation of devices for the detection of tanks overflow. - Use of soil with watertight materials in the areas of maintenance and storage of waste
and chemicals. - Installation of collection systems in areas where spills may occur. - Installation of equipment and use of appropriate procedures to ensure complete
emptying of the tanks prior to their filling. - Installation of leak detection systems and implementation of maintenance programs of all
tanks (especially underground tanks). - Performing controls of groundwater quality.
4.4.3. Reutilization of combustion waste and subproducts.
As mentioned in Section 4.3.6, a lot of attention has already been paid by industry to the utilisation of
combustion residues and by-products, instead of just depositing them in landfills. Utilisation and re-use
is, therefore, the best available option and is a priority.
There are tens of different utilisation possibilities for different by-products. Each different utilisation
option has different specific criteria for the quality of ash it needs. It is impossible to cover all of these
criteria in this BAT reference document. The quality criteria are usually connected to the structural
properties of the ash and the content of any harmful substances, such as the amount of unburned coal
in the ash, the solubility of heavy metals, etc.
The carbon rich ash can be recovered from ash streams. This produces a carbon rich ash that can be
recycled to the boiler to recover the energy in the carbon and a lower carbon ash stream that is less
restricted in terms of options for beneficial re-use.
The end-product of the wet scrubbing technique is gypsum, which is a commercial product for the plant.
It can be sold and used instead of natural gypsum. FGD sludges can be integrated in an FGD process by-

94
product (gypsum) in the limits allowed. The sludges can be re-injected into the furnace when FGD and
SCR techniques are applied. Practically most of the gypsum produced in power plants is utilised in the
plasterboard industry. The purity of gypsum limits the amount of limestone that can be fed into the
process.
The end-product of semi-dry desulphurisation processes is used in different construction purposes
instead of natural minerals, such as in road construction, for earthworks of composting and storage
fields, for the filling of mine pits, and for excavation dams in watertight construction.
A large number of different options to re-use residues and by-products from coal and lignite-fired
combustion plants are presented in the following table:
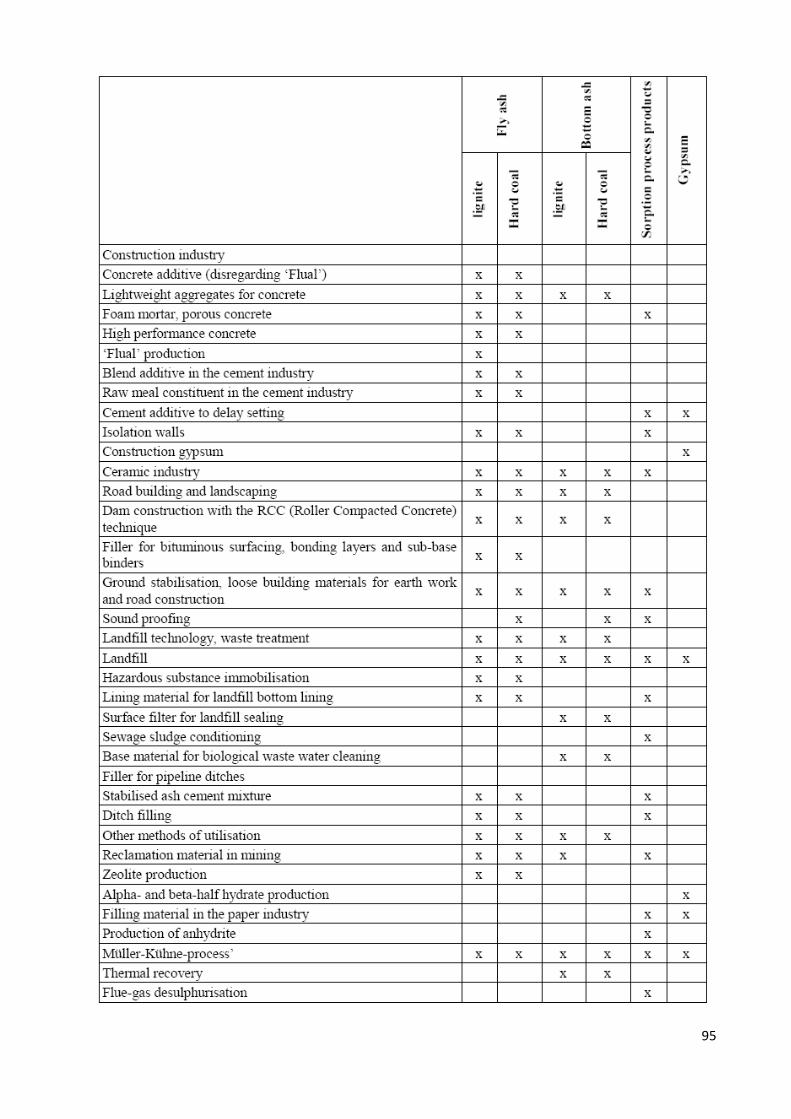
95
96
Table 4.8: Examples of re-use of residues and by-producers from coal and lignite combustion.
4.5. Measures to control noise emissions. (BREF section 3.12.)
In LCPs, the major sources of noise are various rotating machines, transformers and valves.
Preventive measures :
- Since increased distance from the source lowers noise, planning of land use both on a community level and within a specific industrial site is perhaps the best preventive measure to avoid noise problems.
- Periodic manteinance of machinery, equipments and facilities. - Any punctual activity which may imply an increase in the levels of noise pressure will be
performed during the daily shift. Corrective measures :
- using acoustic machine enclosures
- selecting structures according to their noise isolation effect to envelope the building
- using mufflers in intake and exhaust channels
- using sound-absorptive materials in walls and ceilings
- using vibration isolators and flexible connections - put acoustic barriers surrounding the installation through vegetable screens which may
contribute to reduce noise emissions and impact on the landscape.
4.6. BAT for the environmental management. (BREF section 3.15.)
The best environmental performance is usually achieved by the installation of the best technology and
its operation in the most effective and efficient manner. This is recognised by the IE Directive definition
of ‘techniques’ as ‘both the technology used and the way in which the installation is designed, built,
maintained, operated and decommissioned’.
For IED installations an Environmental Management System (EMS) is a tool that operators can use to
address these design, construction, maintenance, operation and decommissioning issues in a
systematic, demonstrable way.
Within the European Union, many organisations have decided on a voluntary basis to implement
environmental management systems based on EN ISO 14001:2004 or the EU Ecomanagement and audit
scheme EMAS.
EMAS includes the management system requirements of EN ISO 14001, but places additional emphasis
on legal compliance, environmental performance and employee involvement; it also requires external
verification of the management system and validation of a public environmental statement
BAT is to implement and adhere to an Environmental Management System (EMS) that incorporates, as appropriate to individual circumstances, the following features:
97
1. definition of an environmental policy for the installation by top management (commitment of the top management is regarded as a precondition for a successful application of other features of the EMS).
2. planning and establishing the necessary procedures (aims and goals)
3. implementation of the procedures, paying particular attention to
- structure and responsibility
- training, awareness and competence
- communication
- employee involvement
- documentation
- efficient process control
- maintenance programme
- emergency preparedness and response
- safeguarding compliance with environmental legislation.
4. checking performance and taking corrective action, paying particular attention to: - Monitoring and measurement (continuous monitoring of emissions). - corrective and preventive action. - maintenance of records - independent (where practicable) internal auditing in order to determine whether or
not the environmental management system conforms to planned arrangements and has been properly implemented and maintained.
5. Review by top management.
Three further features, which can complement the above stepwise, are considered as supporting
measures. However, their absence is generally not inconsistent with BAT.
These three additional steps are:
- having the management system and audit procedure examined and validated by an accredited certification body or an external EMS verifier
- preparation and publication (and possibly external validation) of a regular environmental statement describing all the significant environmental aspects of the installation, allowing for year-by-year comparison against environmental objectives and targets as well as with sector benchmarks as appropriate
- implementation and adherence to an internationally accepted voluntary system such as EMAS and EN ISO 14001:2004. This voluntary step could give higher credibility to the EMS. In particular EMAS, which embodies all the above-mentioned features, gives higher credibility to the EMS.
Specifically for this industry sector, it is also important to consider the following potential features of the EMS :
- giving consideration to the environmental impact from the eventual decommissioning of the unit at the stage of designing a new plant
- giving consideration to the development of cleaner technologies

98
- where practicable, sectoral benchmarking on a regular basis, including energy efficiency and energy conservation activities, choice of input materials, emissions to air, discharges to water, consumption of water and generation of waste.
99
5. CONTROL AND EMISSION MONITORING
5.1 AIR
5.1.1 Emissions
Emissions to the atmosphere from burning fossil fuels are the most important source of SO2, NOx, CO, particles and greenhouse gases such as N2 O and CO2. Other substances are also emitted in smaller quantities, such as heavy metals (As, Cd, Cr, Cu, Hg, Ni, Pb, Se, Zn, V), hydrogen chloride (HCl), hydrogen fluoride (HF), volatile organic compounds (VOCs), persistent organic compounds as polycyclic aromatic hydrocarbons (PAHs), dioxins (PCDD) and furans (PCDF).
5.1.1.1 Selection of pollutants
5.1.1.1.1 Pollutants to which ELVs must be assigned
According to the Directive 2010/75/UE of November 24, 2010, on industrial emissions (integrated prevention and control of pollution), pollutants that have associated emission limit values are sulfur dioxide (SO2), nitrogen oxides (NOx) expressed as nitrogen dioxide (NO2) and particles.
The ELVs are referenced to a temperature of 273.15 K, a pressure of 101.3 kPa, after correction for the water vapor content of the waste gases at a standard oxygen percentage of 6%.
5.1.1.1.2 Other pollutants to report to the E-PRTR
Directive 96/61/EC of 24 September 1996 on the integrated prevention pollution control (IPPC), established in its Article 15 the requirement to make an emissions’ inventory and to provide information on the monitoring results of the principal emissions and responsible sources .
On February 4, 2006 the Commission Regulation (EC) No 166/2006,was published amending Directives 91/689/EEC and 96/61/EC, which is the definition of competences, checks to make and information to be sent to the administration. As stated in Article 5, the operator of each facility that undertakes one or more of the activities included in Annex I above the capacity thresholds specified therein shall report annually to the competent authority indicating quantities if the information is based on measurements, or calculations or estimates of: a) emissions to air, water and land of any pollutant specified in Annex II; b) off-site transfers of hazardous waste exceeding 2 tons of waste or non-hazardous in an amount exceeding 2.000 tonnes per year either for recovery or disposal; c) off-site transfers of any pollutant listed in Annex II in waste water treatment for which the threshold value specified in column of Annex 1b is exceeded.
Therefore, the list of pollutants to be reported to the E-PRTR Annex II shall include, considering the emission limits and taking into account that the list is so long, only those of that Annex that will be objectively produced in the processes of the installation, starting from the raw materials and fuels used
by the installation.
5.1.1.2 Operating conditions and measurement techniques
The measures related to conditions other than normal operating conditions, such as plant start up and shutdown, leaks, malfunctions, momentary stoppages and the decommissioning of the installation shall be defined in the permit (Article 14 of Directive 2010/75/UE) .
100
It must be ensured that the permits contain a provision on the procedures related to malfunction or breakdown of abatement equipment.
The operator shall inform the competent authority within forty-eight hours after a malfunction or breakdown of abatement equipment.
The competent authority shall require the operator to reduce or close down operations if he fails to restore normal operation within twenty-four hours, or to operate the plant using low polluting fuels.
The cumulative time operating without emission abatement equipment shall not exceed 120 hours in a twelve month period.
The competent authority may grant exemptions to the time limits in any of the following cases:
when there is need to maintain energy supplies; when the combustion plant where damage has occurred would need to be replaced for a
limited period by another that causes an overall increase in emissions.
Definition of measurement: Set of operations whose goal is to determine the value of a parameter or measurement. The measurement can be continuous or discontinuous over a period of time.
Sampling and analysis of pollutants and measurement of process parameters, as well as quality assurance of automated measuring systems (AMS) and measurement methods to calibrate these systems will be conducted under the rules of ECS (European Committee for Standardization). If ECS standards were not available the IOS (International Organization for Standardization) standards will applied, or national or international standards that guarantee data of equivalent scientific quality.
To ensure the reliability and comparability of the results of emissions through a stack, the measurement plane for both measurements with automated measuring systems (AMS) as with reference methods (periodic measurements), the sampling strategy and in general the sampling point of the AMS must meet the standard EN 15259 "Requirements for measurement sections and sites and for the measurement objective, plan and report.".The national “Communique 28082 on continuous emission monitoring systems” states these requirements except from the need of homogeneity, which is mentioned in section 8.3 of the standard EN 15259.
Automated Measurement (AMS): equipment to measure continuous physical and chemical parameters necessary for the correct quantification of an emission. It includes an analyzer and all the elements necessary to quantify the emission (typically devices for sample taking and preparation, testing and adjustment devices required for periodic checks of its operation, etc.).
Peripheral AMS: automatic measurement system used to collect the data required to convert measured values to reference conditions, ie AMS for humidity, temperature, pressure, oxygen and flow.
Automated measuring systems installed on combustion plants must comply with the “Communique 28082 on continuous emission monitoring systems” that is related with the standard TS EN 14181."Stationary source emissions.Quality assurance of automated measuring systems." This standard describes the quality assurance procedures necessary to ensure that an AMS installed to measure air emissions, is able to meet the requirements of uncertainty of the measured values established in the regulations, and in this case in Directive 2010/75/EU.
To achieve this objective three different Levels of Quality Assurance are defined (QAL1, QAL2 and QAL3).
QAL1
Procedure to demonstrate, before the installation of the AMS, that they are suitable for the purposes of measurement, and meet the requirements and uncertainty set forth in the applicable legislation. AMS must have an official certificate approval where reference is made to the fulfillment of the requirements of the QAL 1. This certificate shall be issued by any body recognized for that purpose in the Member States of the European Union who have signed the Agreement on the European Economic Area.
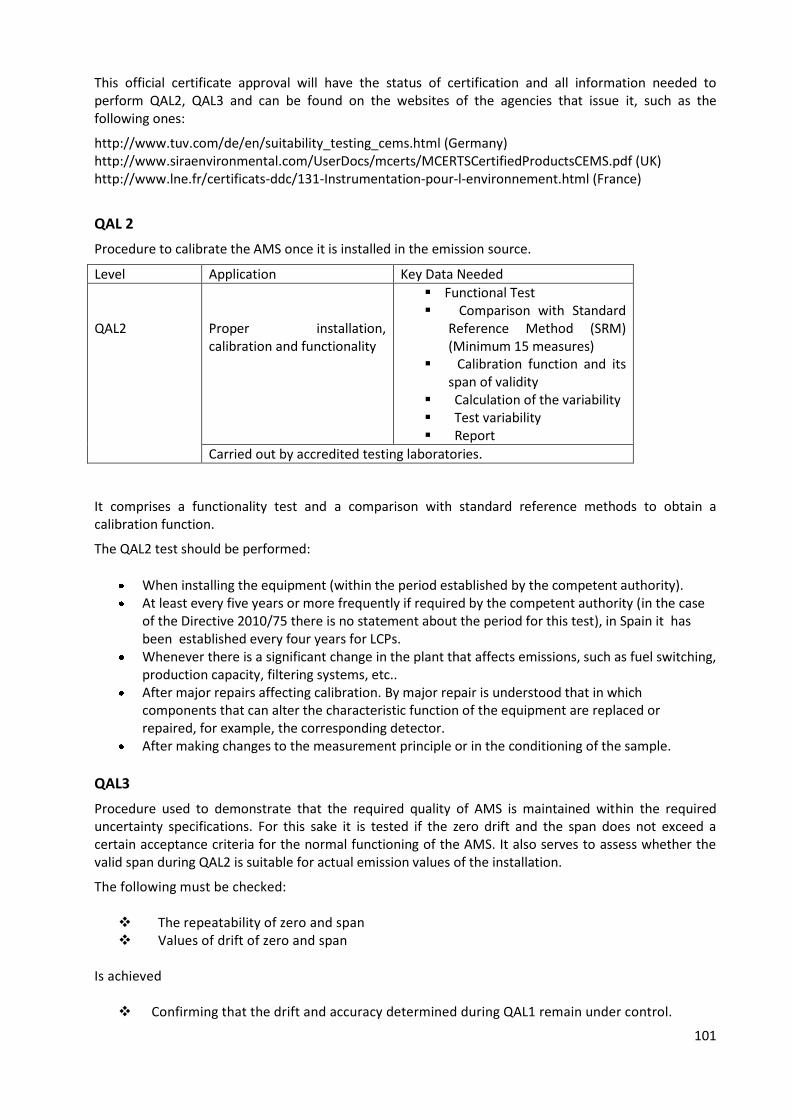
101
This official certificate approval will have the status of certification and all information needed to perform QAL2, QAL3 and can be found on the websites of the agencies that issue it, such as the following ones:
http://www.tuv.com/de/en/suitability_testing_cems.html (Germany) http://www.siraenvironmental.com/UserDocs/mcerts/MCERTSCertifiedProductsCEMS.pdf (UK) http://www.lne.fr/certificats-ddc/131-Instrumentation-pour-l-environnement.html (France)
QAL 2
Procedure to calibrate the AMS once it is installed in the emission source.
Level Application Key Data Needed
QAL2
Proper installation, calibration and functionality
Functional Test Comparison with Standard
Reference Method (SRM) (Minimum 15 measures)
Calibration function and its span of validity
Calculation of the variability Test variability Report
Carried out by accredited testing laboratories.
It comprises a functionality test and a comparison with standard reference methods to obtain a calibration function.
The QAL2 test should be performed:
When installing the equipment (within the period established by the competent authority). At least every five years or more frequently if required by the competent authority (in the case
of the Directive 2010/75 there is no statement about the period for this test), in Spain it has been established every four years for LCPs.
Whenever there is a significant change in the plant that affects emissions, such as fuel switching, production capacity, filtering systems, etc..
After major repairs affecting calibration. By major repair is understood that in which components that can alter the characteristic function of the equipment are replaced or repaired, for example, the corresponding detector.
After making changes to the measurement principle or in the conditioning of the sample.
QAL3
Procedure used to demonstrate that the required quality of AMS is maintained within the required uncertainty specifications. For this sake it is tested if the zero drift and the span does not exceed a certain acceptance criteria for the normal functioning of the AMS. It also serves to assess whether the valid span during QAL2 is suitable for actual emission values of the installation.
The following must be checked:
The repeatability of zero and span Values of drift of zero and span
Is achieved
Confirming that the drift and accuracy determined during QAL1 remain under control.
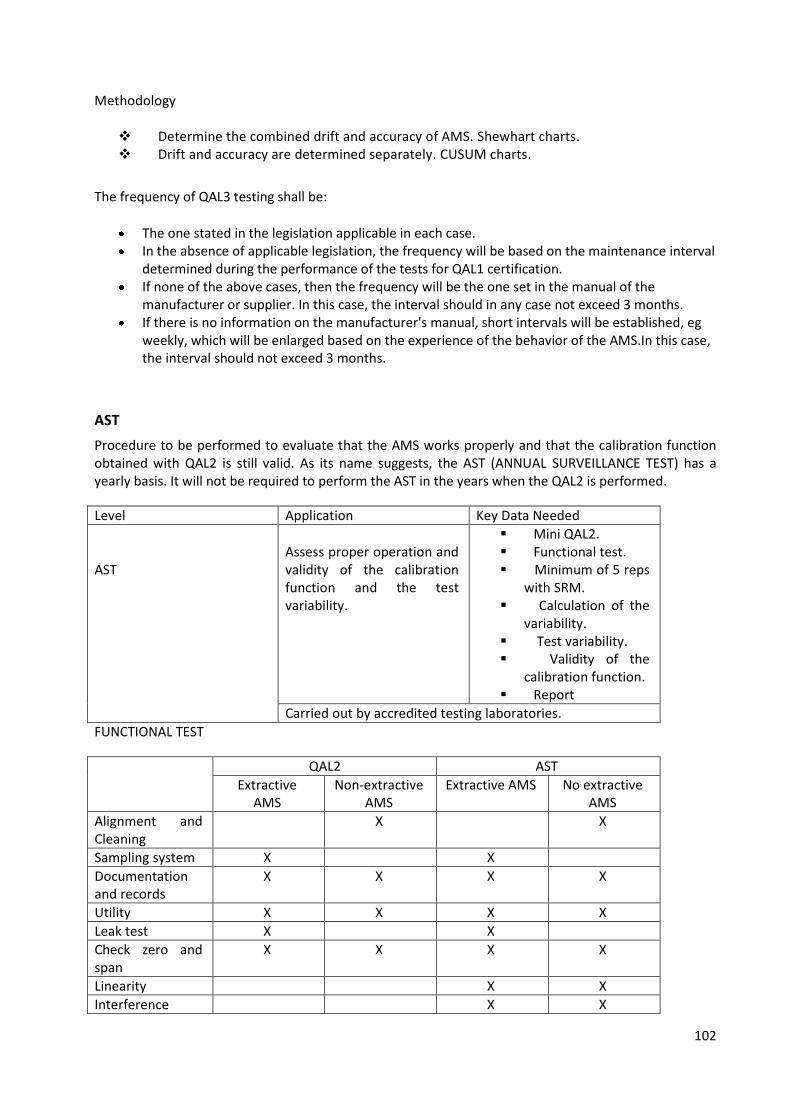
102
Methodology
Determine the combined drift and accuracy of AMS. Shewhart charts. Drift and accuracy are determined separately. CUSUM charts.
The frequency of QAL3 testing shall be:
The one stated in the legislation applicable in each case. In the absence of applicable legislation, the frequency will be based on the maintenance interval
determined during the performance of the tests for QAL1 certification. If none of the above cases, then the frequency will be the one set in the manual of the
manufacturer or supplier. In this case, the interval should in any case not exceed 3 months. If there is no information on the manufacturer's manual, short intervals will be established, eg
weekly, which will be enlarged based on the experience of the behavior of the AMS.In this case, the interval should not exceed 3 months.
AST
Procedure to be performed to evaluate that the AMS works properly and that the calibration function obtained with QAL2 is still valid. As its name suggests, the AST (ANNUAL SURVEILLANCE TEST) has a yearly basis. It will not be required to perform the AST in the years when the QAL2 is performed.
Level Application Key Data Needed
AST
Assess proper operation and validity of the calibration function and the test variability.
Mini QAL2. Functional test. Minimum of 5 reps
with SRM. Calculation of the
variability. Test variability. Validity of the
calibration function. Report
Carried out by accredited testing laboratories.
FUNCTIONAL TEST
QAL2 AST
Extractive AMS
Non-extractive AMS
Extractive AMS No extractive AMS
Alignment and Cleaning
X X
Sampling system X X
Documentation and records
X X X X
Utility X X X X
Leak test X X
Check zero and span
X X X X
Linearity X X
Interference X X
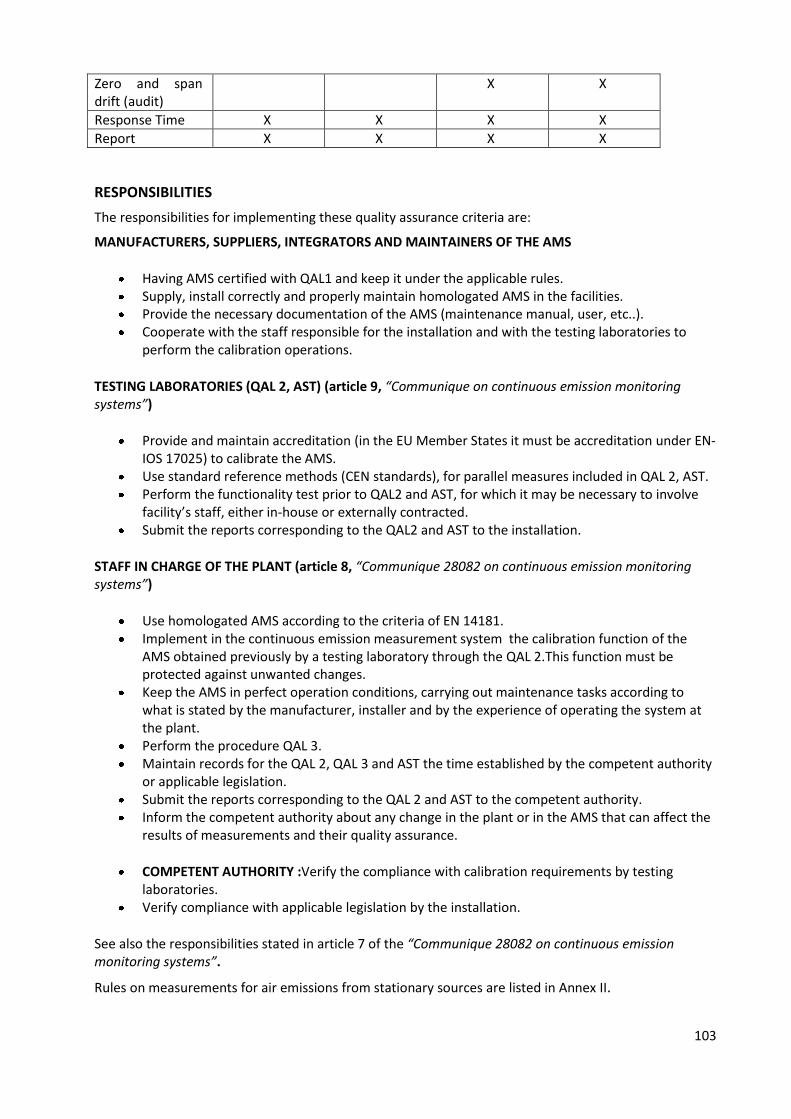
103
Zero and span drift (audit)
X X
Response Time X X X X
Report X X X X
RESPONSIBILITIES
The responsibilities for implementing these quality assurance criteria are:
MANUFACTURERS, SUPPLIERS, INTEGRATORS AND MAINTAINERS OF THE AMS
Having AMS certified with QAL1 and keep it under the applicable rules. Supply, install correctly and properly maintain homologated AMS in the facilities. Provide the necessary documentation of the AMS (maintenance manual, user, etc..). Cooperate with the staff responsible for the installation and with the testing laboratories to
perform the calibration operations.
TESTING LABORATORIES (QAL 2, AST) (article 9, “Communique on continuous emission monitoring systems”)
Provide and maintain accreditation (in the EU Member States it must be accreditation under EN-IOS 17025) to calibrate the AMS.
Use standard reference methods (CEN standards), for parallel measures included in QAL 2, AST. Perform the functionality test prior to QAL2 and AST, for which it may be necessary to involve
facility’s staff, either in-house or externally contracted. Submit the reports corresponding to the QAL2 and AST to the installation.
STAFF IN CHARGE OF THE PLANT (article 8, “Communique 28082 on continuous emission monitoring systems”)
Use homologated AMS according to the criteria of EN 14181. Implement in the continuous emission measurement system the calibration function of the
AMS obtained previously by a testing laboratory through the QAL 2.This function must be protected against unwanted changes.
Keep the AMS in perfect operation conditions, carrying out maintenance tasks according to what is stated by the manufacturer, installer and by the experience of operating the system at the plant.
Perform the procedure QAL 3. Maintain records for the QAL 2, QAL 3 and AST the time established by the competent authority
or applicable legislation. Submit the reports corresponding to the QAL 2 and AST to the competent authority. Inform the competent authority about any change in the plant or in the AMS that can affect the
results of measurements and their quality assurance.
COMPETENT AUTHORITY :Verify the compliance with calibration requirements by testing laboratories.
Verify compliance with applicable legislation by the installation.
See also the responsibilities stated in article 7 of the “Communique 28082 on continuous emission monitoring systems”.
Rules on measurements for air emissions from stationary sources are listed in Annex II.
104
5.1.1.3 Calculations of start-up times regarding emissions; end of combustion and stoppages
National applicable legislation regarding this topic must be respected.
When the Chapters and Annexes of the Industrial Emissions Directive related to LCPs will be transposed into national legislation, the methodology to define the periods of start-up and shut-down of combustion plants will correspond to the one explained in the Commission Implementing Decision 2012/249/EU of 7 May 2012. The contents of this important document are shown in Annex IV.
5.1.1.4 Emissions monitoring (see also articles 38 and 39 of the “Communique 28082 on continuous emission monitoring systems” regarding Online Monitoring of CEMS)
SO2, NOx and particles concentrations must be continuously measured in the waste gases from each combustion plant with a total rated thermal input equal to or greater than 50 MW, including continuous measurement of oxygen content, temperature, pressure and water vapor content of the waste gases. Continuous measurement of water vapor content of the waste gases is not necessary, provided that the residual gas sample is dried before the emissions are analyzed.
The competent authority may decide not to require continuous measurement for those combustion plants with a life span of less than 10,000 hours of activity.
When continuous measurement is not required, measurements will be required for SO2, NOx, particles, at least once every six months.
As an alternative to measurements of SO2 and NOx, other procedures may be verified and approved by the competent authority (stoichiometric calculations, emission factors, etc.). Such procedures shall use relevant ECS standards or, if not available ECS, IOS or other national or international standards that guarantee data of equivalent scientific quality.
For combustion plants firing coal or lignite, total mercury emissions must be measured at least once a year.
Calibration of the AMs was performed according to standard EN 14181 (QAL2), at intervals established by the competent authority and provided that the circumstances described in paragraph 5.1.1.2 (QAL2).
The annual test (AST) monitoring shall be performed according to EN 14181 annually. This is a requirement contained in Directive 2010/75 with the following expression "automatic measuring systems shall be subject to control by means of parallel measurements with the reference methods at least once a year."
In the case of plants which must comply with the desulphurisation rates provided for in Article 31 of Directive 2010/75, the sulfur content of fuel used in the combustion plant must also be regularly monitored. The competent authorities shall be informed of any substantial change recorded in the type of fuel used.
5.1.1.4.1 Data Validation of AMS (see also articles 36 and 37 of the “Communique 28082 on continuous emission monitoring systems”)
Measurement values shall be averaged at intervals of a maximum of 10 seconds and recorded, performing with them time averages hourly, daily and monthly.
To perform time averages, the data must meet the following criteria:
a) only will be taken into account the data obtained when the process generating the emissions is operating. Start-ups and shut-downs will not be considered periods of operation.
105
b) for the realization of these averages the data obtained during periods of maintenance, calibration, or during any other incident that may have affected the response of the measuring system (AMS). shall be removed.
c) The values used to set these time averages will be those obtained from the AMS after applying the calibration function and standardized conditions of pressure and temperature, in dry basis and corrected to the dry oxygen percentage of reference.
d) Values used to check the equipment (verification of the zero, span, self-calibration, etc..) shall not be included in the calculations.
e) In cases in which the measured parameter is below the quantified detection limit of the measuring system, the value which should be recorded will be the limit of detection, which will be considered valid data for all purposes.
f) When measurements are obtained which fall above the valid span of calibration, then the value measured by the AMS will be used.
g) To perform the hourly time average it will be necessary to have a minimum percentage of valid data above 75 percent. Below this data coverage, the operation of the measuring system will be considered abnormal and the average shall not be calculated.
h) the days when more than three hourly average values are invalid due to malfunction or maintenance of automatic measurement system will be invalidated.If for this reason are invalidated more than ten days a year, the competent authority shall require the operator to take steps to improve the reliability of the automatic measurement system.
5.1.1.4.2 Valid data
Therefore, those data considered valid data will be those which do not include the data generated in the circumstances described above and in which the data coverage listed above is fulfilled and which have been made with monitoring systems that have passed the variability test contained in TS EN 14181:2004 and the “Communique 28082 on continuous emission monitoring systems”, and provided that when periodic checks are made on the zero and span inadequate response deviations are not shown, failure of the equipment does not take place, etc.. This requirements mean that the measurement systems used to monitor each pollutant (instrument + data acquisition system) must provide results with an expanded uncertainty less than the maximum allowable (σo) set as a percentage (X%) of the appropriate emission limit value (ELV) for a span of 95 percent.
20% sulfur dioxide. Nitrogen oxides 20%.
30% particles. The corresponding information of mass load (t / year, kg / year, etc.) shall be prepared using valid data.
5.1.1.4.3 Validated data
The validated hourly and daily average values are determined from valid hourly average values, measured after extracting the confidence interval contained in Directive 2010/75 in its Annex V Part 3 and in the preceding paragraph of this document . This means that any measured value of SO2, NOx and particles cannot have an associated expanded uncertainty bigger than the maximum value, which is established as a percentage of the ELV.
Consequently, the data validation process in a given installation should consist in applying to each valid measured data (each data obtained with an instrument that meets applicable standards) the following treatment:
106
If the valid Data ≥ ELV: Validated data = Valid data - (X% x ELV).
If the Valid data <ELV: Validated data = Valid data - (X% x Valid data).
Where X% will take the following values:
For SO2 (X%) = 0.2.
For NOx (X%) = 0.2.
For particles (X%) = 0.3.
This formulation avoids the appearance of negative values during the validation process.
The verification of compliance with the emission limits applicable in each case will be conducted using only validated data.
5.1.1.5. Noise control
The operators of the LCPs will have to fulfill the requirements deriving from the current By-Law on the assessment and management of environmental noise, which will be imposed by the corresponding Competent Authority.
5.1.2. Air quality
5.1.2.1. Air pollutants immision control
The criteria and measures for immission control of a facility must be stated in the Integrated Environmental Permit (IEP), linked to an environmental monitoring program and all this on a technical and scientific basis allowing the adoption of sound decisions.
The basic regulatory framework controlling air quality in Europe is the Directive 2008/50/Ec Of The European Parliament and of The Council of 21 May 2008 on ambient air quality and cleaner air in Europe.
Ambient air is defined as the outdoor air in the troposphere, excluding workplaces.
The directive states:
The obligation to determine the ambient air quality throughout the territory of the Member States. This evaluation shall be made by different methods: either by measurement or by mathematical modeling or by a combination of both methods, or by calculation.
Reference values, objective and limits. Forms and procedures of control including:
o Criteria to locate the stations. o Standards to be met by the analytical and auxiliary equipment. o Procedures to inform the public in cases of exceedance of LV or thresholds.
Additionally it establishes the criteria, procedures and effects of action plans to improve air quality.
To control the effects of a thermal power plant in general, an environmental monitoring program should be established in the integrated environmental permit (IEP) that, with regard to air quality will be based on measuring and evaluating the direct and indirect effects of pollution through the procedures set out in Directive 2008/50/EC and which will generally include the following:
107
Installation of emission sensors or meters in all significant outgoing gas flows and / or immission sensors or meters in areas where an incidence of pollution on population or on vegetation is previewed.
Self-monitoring of emissions through the installation of measuring equipment in stack and / or direct collection of samples to evaluate the mass flow of pollutants into the environment.
Track and monitor the effectiveness of corrective actions. Here controls must be established at critical points in the line of decontamination ensuring that decontamination equipment (filters, FGD) and actions to reduce pollution, work properly ,storing a record within the facility.
With respect to control atmospheric pollution immission, this can be accomplished by two procedures:
Direct: consisting of the in situ measurement directly by continuous analytical equipment or by indirect methods, in situ sampling and laboratory analysis. It consists basically in obtaining data directly comparable with legislated values to determine the ambient air quality.
Indirect: Based mainly on predictive systems; ie models that integrate data of emissions, diffusion of emissions and weather to determine the expected quality of the air.
These systems must consider the main pollutants that may cause problems in the ambient air quality.For the determination of these it will be taken into account mainly the composition of fuels used and emissions from their combustion.The selection of pollutants shall be extracted from the ones stated in Directive 2008/50/EC.
Basically, for combustion of coal, one will always have to consider the particules (PM 10 and PM 2.5), sulfur dioxide, nitrogen dioxide and ozone as a secondary pollutant in relation to its impact on health of people, and all of them except particles for the protection of the vegetation. Additionally, checks on other pollutants whose presence may be more sporadic or absent, such as metals, must be carried out at a rate commensurate with their level of presence in ambient air.
With respect to ozone, this pollutant will be considered in areas not directly affected by the emitting source where more formation of this substance is foreseeable. We are talking about areas where the plume has been diluted in the atmosphere and there has been sufficient time for the chemical processes occurring in the air for the possible formation of secondary pollutants.
Quality control of air by direct methods
The air quality control network in immission is configured as a control system of the environmental impact of thermal power plants outside the enclosure of the plant itself.The ultimate goal of these facilities is to protect the population and vegetation and therefore will require the development of two tasks that must be made by the environmental competent authority.
Give warnings to the population when there is a surpassing of certain limits, if they occur. And, with the data generated and others that are available,assess ambient air quality in the
area.
For this reason this network of stations must be integrated into existing national networks, regardless of
the fact that the maintenance and management of data correspond to the holder of the power station.
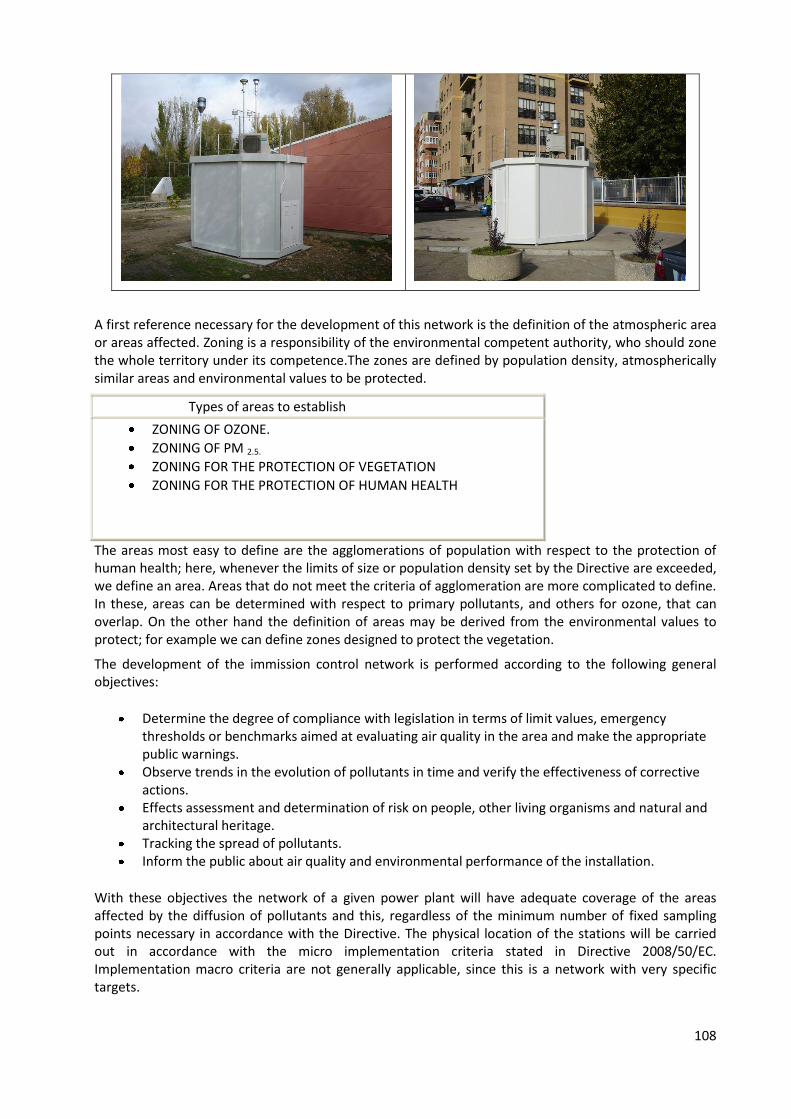
108
A first reference necessary for the development of this network is the definition of the atmospheric area or areas affected. Zoning is a responsibility of the environmental competent authority, who should zone the whole territory under its competence.The zones are defined by population density, atmospherically similar areas and environmental values to be protected.
Types of areas to establish
ZONING OF OZONE.
ZONING OF PM 2.5.
ZONING FOR THE PROTECTION OF VEGETATION
ZONING FOR THE PROTECTION OF HUMAN HEALTH
The areas most easy to define are the agglomerations of population with respect to the protection of human health; here, whenever the limits of size or population density set by the Directive are exceeded, we define an area. Areas that do not meet the criteria of agglomeration are more complicated to define. In these, areas can be determined with respect to primary pollutants, and others for ozone, that can overlap. On the other hand the definition of areas may be derived from the environmental values to protect; for example we can define zones designed to protect the vegetation.
The development of the immission control network is performed according to the following general objectives:
Determine the degree of compliance with legislation in terms of limit values, emergency thresholds or benchmarks aimed at evaluating air quality in the area and make the appropriate public warnings.
Observe trends in the evolution of pollutants in time and verify the effectiveness of corrective actions.
Effects assessment and determination of risk on people, other living organisms and natural and architectural heritage.
Tracking the spread of pollutants. Inform the public about air quality and environmental performance of the installation.
With these objectives the network of a given power plant will have adequate coverage of the areas affected by the diffusion of pollutants and this, regardless of the minimum number of fixed sampling points necessary in accordance with the Directive. The physical location of the stations will be carried out in accordance with the micro implementation criteria stated in Directive 2008/50/EC. Implementation macro criteria are not generally applicable, since this is a network with very specific targets.
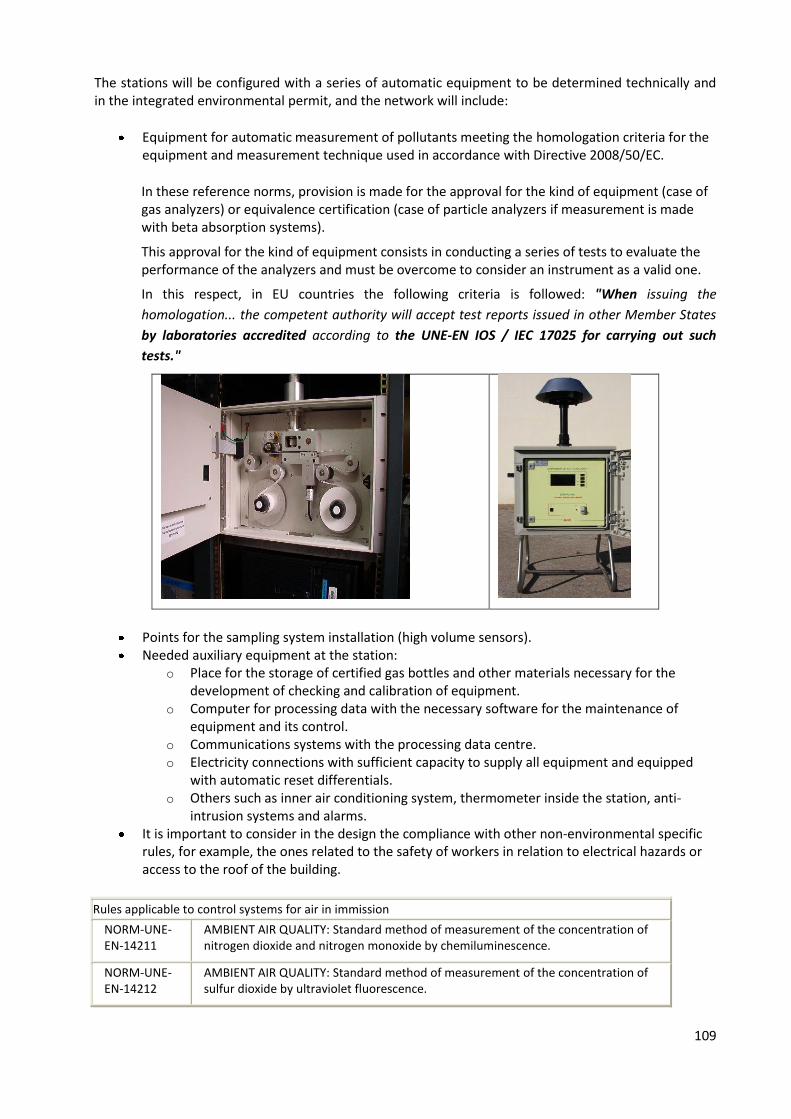
109
The stations will be configured with a series of automatic equipment to be determined technically and in the integrated environmental permit, and the network will include:
Equipment for automatic measurement of pollutants meeting the homologation criteria for the equipment and measurement technique used in accordance with Directive 2008/50/EC.
In these reference norms, provision is made for the approval for the kind of equipment (case of gas analyzers) or equivalence certification (case of particle analyzers if measurement is made with beta absorption systems).
This approval for the kind of equipment consists in conducting a series of tests to evaluate the performance of the analyzers and must be overcome to consider an instrument as a valid one.
In this respect, in EU countries the following criteria is followed: "When issuing the
homologation... the competent authority will accept test reports issued in other Member States
by laboratories accredited according to the UNE-EN IOS / IEC 17025 for carrying out such
tests."
Points for the sampling system installation (high volume sensors). Needed auxiliary equipment at the station:
o Place for the storage of certified gas bottles and other materials necessary for the development of checking and calibration of equipment.
o Computer for processing data with the necessary software for the maintenance of equipment and its control.
o Communications systems with the processing data centre. o Electricity connections with sufficient capacity to supply all equipment and equipped
with automatic reset differentials. o Others such as inner air conditioning system, thermometer inside the station, anti-
intrusion systems and alarms. It is important to consider in the design the compliance with other non-environmental specific
rules, for example, the ones related to the safety of workers in relation to electrical hazards or access to the roof of the building.
Rules applicable to control systems for air in immission
NORM-UNE-EN-14211
AMBIENT AIR QUALITY: Standard method of measurement of the concentration of nitrogen dioxide and nitrogen monoxide by chemiluminescence.
NORM-UNE-EN-14212
AMBIENT AIR QUALITY: Standard method of measurement of the concentration of sulfur dioxide by ultraviolet fluorescence.
110
NORM-UNE-EN-14626
AMBIENT AIR QUALITY: Standard method of measurement of the concentration of carbon monoxide by non-disperse infrared spectroscopy.
NORM-UNE-EN-14625
AMBIENT AIR QUALITY: Standard method of measurement of the concentration of ozone by ultraviolet photometry.
NORM-UNE-EN-9169
AMBIENT AIR QUALITY: Definition and determination of the performance characteristics of an AMS.
NORM-UNE-EN-10012
MEASUREMENTS MANAGEMENT SYSTEM: Requirements for measurement processes and measuring equipment.
NORM-UNE-EN-10012-erratum
MEASUREMENTS MANAGEMENT SYSTEM: Requirements for measurement processes and measuring equipment.
NORM-UNE-EN-11222
AIR QUALITY: Determination of measurement uncertainty in air quality temporary measurements.
NORM-UNE-EN-12341
AIR QUALITY: Determination of the PM 10 fraction of suspended particulate matter.Reference method and field test procedure to demonstrate the equivalence of measurement methods with respect to the reference method.
NORM-UNE-EN-14377 IN
AIR QUALITY: Approach to the estimation of uncertainty for the reference methods of measurement of ambient air.
NORM-UNE-EN-14907
AMBIENT AIR QUALITY: gravimetric method for determination of PM 2.5 mass fraction of suspended particulate matter.
NORM-UNE-EN-14956
AIR QUALITY: Evaluation of the suitability of a measurement procedure by comparison with a required measurement uncertainty.
NORM-UNE-EN-19011
Guidelines for auditing quality and / or environmental management systems.
NORM-UNE-EN-19011 erratum
Guidelines for auditing quality and / or environmental management systems.
NORM-UNE-EN-66040
Statistical interpretation of test results.Estimate of the measurement. Confidence interval.
NORM-UNE-EN-66040 erratum
Statistical interpretation of test results. Estimate of the measurement. Confidence interval.
NORM-UNE-EN-77204
AIR QUALITY: General aspects. Vocabulary.
NORM-UNE-EN-77205
AIR QUALITY: General aspects. Measurement units.
NORM-UNE-EN-77239
AIR QUALITY: Calculation of the uncertainty of a measurement method under field conditions, using a second method as reference.
NORM-UNE-EN-77240
AIR QUALITY: Evaluation of the performance characteristics of gas analyzers.
NORM UNE-EN 82009-1
Accuracy (trueness and precision) of measurement methods and results.Part 1: General principles and definitions.
NORM UNE-EN 82009-2
Accuracy (trueness and precision) of measurement methods and results.Part 2: Basic method for the determination of repeatability and reproducibility of a standard measurement method.
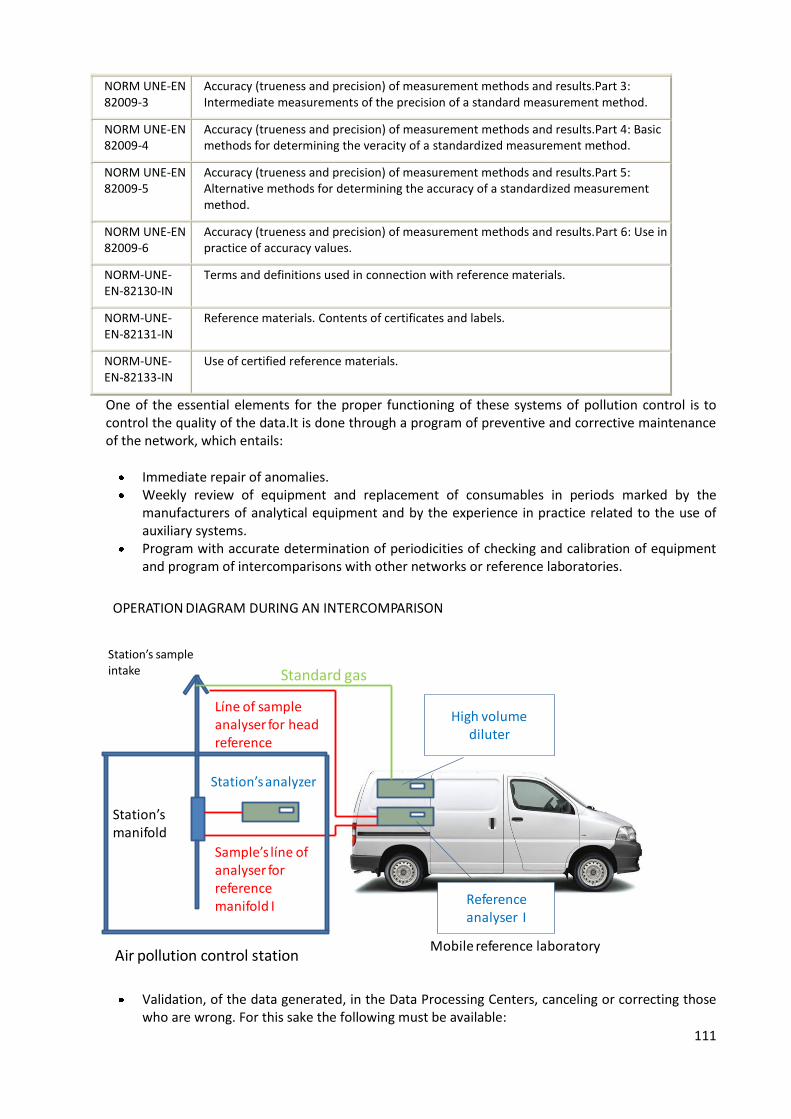
111
NORM UNE-EN 82009-3
Accuracy (trueness and precision) of measurement methods and results.Part 3: Intermediate measurements of the precision of a standard measurement method.
NORM UNE-EN 82009-4
Accuracy (trueness and precision) of measurement methods and results.Part 4: Basic methods for determining the veracity of a standardized measurement method.
NORM UNE-EN 82009-5
Accuracy (trueness and precision) of measurement methods and results.Part 5: Alternative methods for determining the accuracy of a standardized measurement method.
NORM UNE-EN 82009-6
Accuracy (trueness and precision) of measurement methods and results.Part 6: Use in practice of accuracy values.
NORM-UNE-EN-82130-IN
Terms and definitions used in connection with reference materials.
NORM-UNE-EN-82131-IN
Reference materials. Contents of certificates and labels.
NORM-UNE-EN-82133-IN
Use of certified reference materials.
One of the essential elements for the proper functioning of these systems of pollution control is to control the quality of the data.It is done through a program of preventive and corrective maintenance of the network, which entails:
Immediate repair of anomalies. Weekly review of equipment and replacement of consumables in periods marked by the
manufacturers of analytical equipment and by the experience in practice related to the use of auxiliary systems.
Program with accurate determination of periodicities of checking and calibration of equipment and program of intercomparisons with other networks or reference laboratories.
Validation, of the data generated, in the Data Processing Centers, canceling or correcting those who are wrong. For this sake the following must be available:
Mobile reference laboratoryAir pollution control station
Station’s manifold
Station’s sampleintake
High volumediluter
Standard gas
Reference analyser I
Líne of sampleanalyser for head reference
Sample’s líne of analyser forreferencemanifold I
Station’s analyzer
OPERATION DIAGRAM DURING AN INTERCOMPARISON
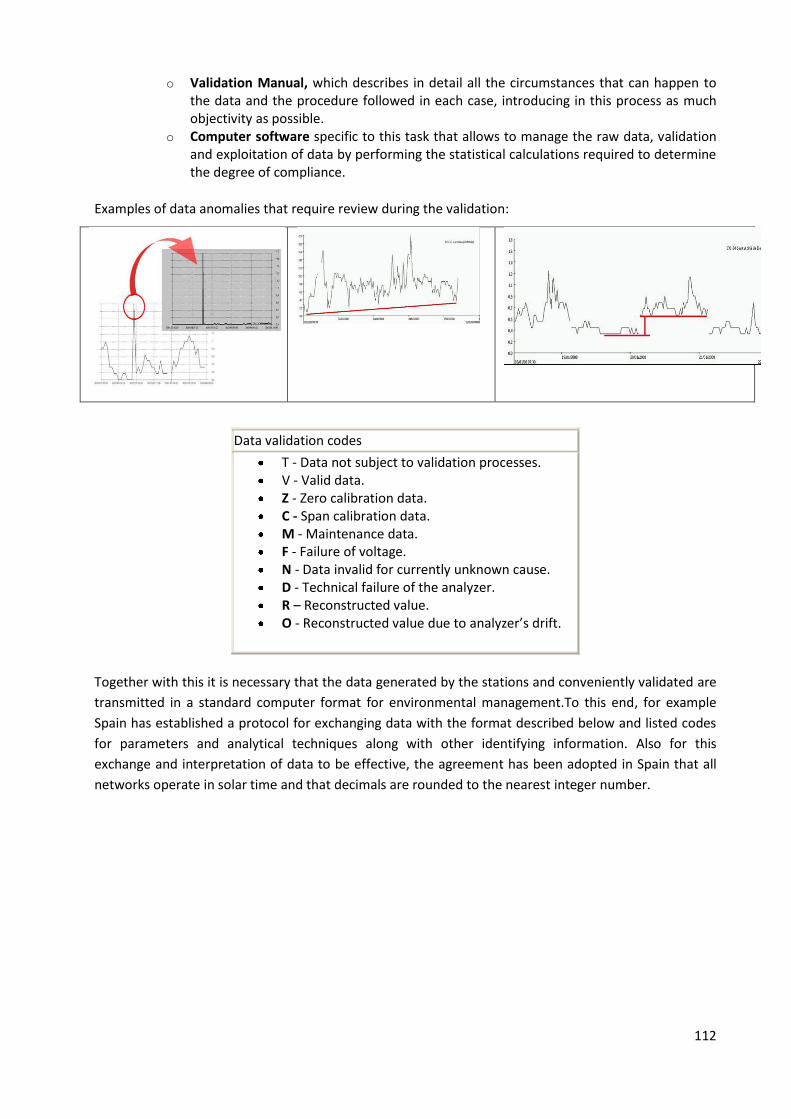
112
o Validation Manual, which describes in detail all the circumstances that can happen to the data and the procedure followed in each case, introducing in this process as much objectivity as possible.
o Computer software specific to this task that allows to manage the raw data, validation and exploitation of data by performing the statistical calculations required to determine the degree of compliance.
Examples of data anomalies that require review during the validation:
Data validation codes
T - Data not subject to validation processes. V - Valid data. Z - Zero calibration data. C - Span calibration data. M - Maintenance data. F - Failure of voltage. N - Data invalid for currently unknown cause. D - Technical failure of the analyzer. R – Reconstructed value. O - Reconstructed value due to analyzer’s drift.
Together with this it is necessary that the data generated by the stations and conveniently validated are
transmitted in a standard computer format for environmental management.To this end, for example
Spain has established a protocol for exchanging data with the format described below and listed codes
for parameters and analytical techniques along with other identifying information. Also for this
exchange and interpretation of data to be effective, the agreement has been adopted in Spain that all
networks operate in solar time and that decimals are rounded to the nearest integer number.
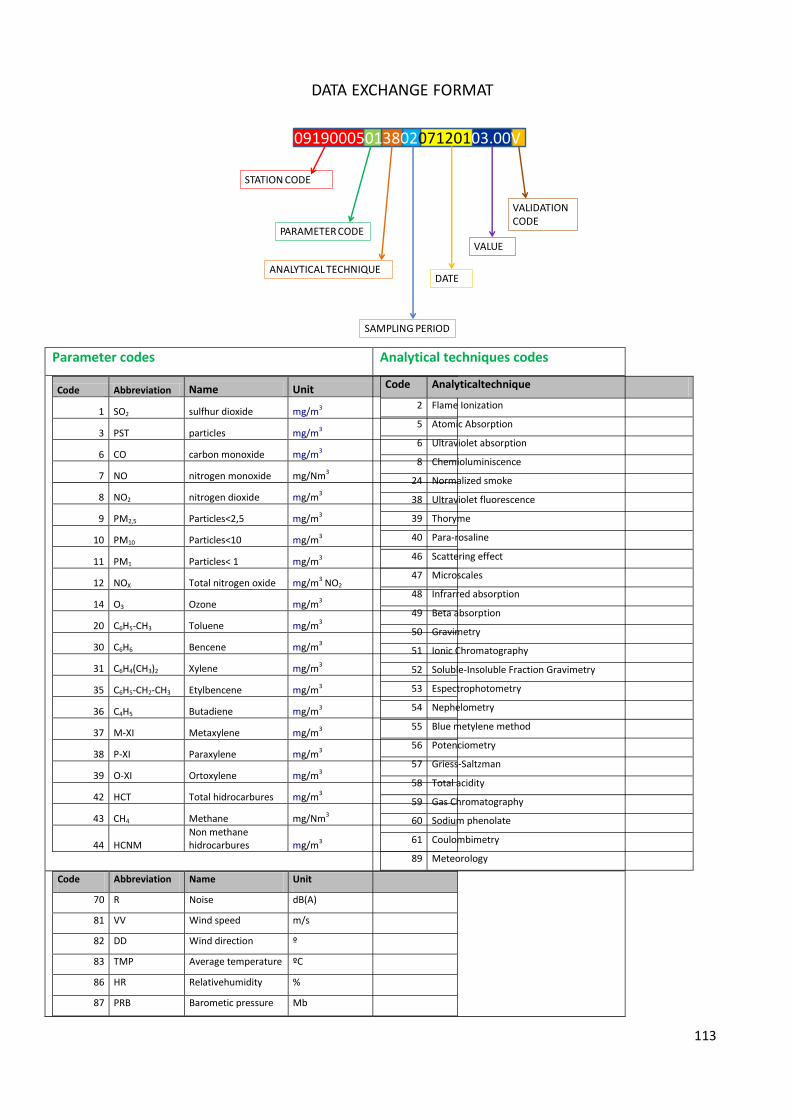
113
Parameter codes Analytical techniques codes
Code Abbreviation Name Unit
1 SO2 sulfhur dioxide mg/m3
3 PST particles mg/m3
6 CO carbon monoxide mg/m3
7 NO nitrogen monoxide mg/Nm3
8 NO2 nitrogen dioxide mg/m3
9 PM2,5 Particles<2,5 mg/m3
10 PM10 Particles<10 mg/m3
11 PM1 Particles< 1 mg/m3
12 NOX Total nitrogen oxide mg/m3 NO2
14 O3 Ozone mg/m3
20 C6H5-CH3 Toluene mg/m3
30 C6H6 Bencene mg/m3
31 C6H4(CH3)2 Xylene mg/m3
35 C6H5-CH2-CH3 Etylbencene mg/m3
36 C4H5 Butadiene mg/m3
37 M-XI Metaxylene mg/m3
38 P-XI Paraxylene mg/m3
39 O-XI Ortoxylene mg/m3
42 HCT Total hidrocarbures mg/m3
43 CH4 Methane mg/Nm3
44 HCNM Non methane hidrocarbures mg/m3
Code Analyticaltechnique
2 Flame Ionization
5 Atomic Absorption
6 Ultraviolet absorption
8 Chemioluminiscence
24 Normalized smoke
38 Ultraviolet fluorescence
39 Thoryme
40 Para-rosaline
46 Scattering effect
47 Microscales
48 Infrarred absorption
49 Beta absorption
50 Gravimetry
51 Ionic Chromatography
52 Soluble-Insoluble Fraction Gravimetry
53 Espectrophotometry
54 Nephelometry
55 Blue metylene method
56 Potenciometry
57 Griess-Saltzman
58 Total acidity
59 Gas Chromatography
60 Sodium phenolate
61 Coulombimetry
89 Meteorology
Code Abbreviation Name Unit
70 R Noise dB(A)
81 VV Wind speed m/s
82 DD Wind direction º
83 TMP Average temperature ºC
86 HR Relativehumidity %
87 PRB Barometic pressure Mb
0919000501380207120103.00V
DATA EXCHANGE FORMAT
STATION CODE
PARAMETER CODE
ANALYTICAL TECHNIQUE
SAMPLING PERIOD
VALUE
DATE
VALIDATION CODE
114
88 RS Solar Radiative w/m2
89 LL Rainfall mm
This program of maintenance and network management in accordance with Directive 2008/50/EC must have a certified system of quality assurance. At present, there is no standard (EN or IOS) on which to base this program .Therefore the opportunity to develop the rules for testing laboratories has been assessed, but this involves major complications arising from the specificities of this system. In response, the network operators in Spain are choosing to certify the quality system through the UNE-EN-IOS 9001 quality assurance norm.
5.1.2.2 Modelling of pollutants into the atmosphere
Controlling the ambient air quality by using indirect methods
Directive 2008/50/EC on ambient air quality and cleaner air in Europe determined that the modeling of emissions to the atmosphere can be very useful and in many cases necessary to:
Interpret the data concentration measured in relation to atmospheric processes of the pollutants.
Evaluate the quality of air in each of the zones in addition to or even replacing the fixed measurements.
Design plans and programs to ensure compliance with limit values and air quality objective. Predict air quality.
Mathematical modeling is a tool in the study of air pollution, which allows us to understand the processes involved, from the point where the pollutants leave the stack forming a plume, during the mixing process and its distribution until the air can be breathed in or affect people or the environment. It is necessary to consider that the context in which events take place is the atmosphere; it is not completely controllable nor reproducible in the laboratory and thus the interest of having this type of tool is higher.
The basis of modeling is the same as in all branches of science in which it is used, it is basically theoretical hypotheses in the form of mathematical equations that attempt to reproduce a real event observed. A very accurate mathematical reproduction of the real fact observed by solving mathematical equations raised is the guarantee that that the real fact is being understood.
Thus, a model is a set of solutions of the equations or mathematical algorithms deducted from the set of laws governing a fact observed.In particular diffusion models of air pollutants, are trying to solve an equation called the equation of advection - diffusion, which basically implies that the evolution of the concentration of a pollutant in a location will depend on:
Where and how much is the pollutant emitted. This information is obtained in our case by direct measurements unless we are talking about new installations.
The meteorological variables responsible for transportation. How well the pollutant is deposited in the earth's surface, which is included in the model
through specific modules and settings, along with a good database of land types and uses. How the substance reacts with other compounds present in the atmosphere.Chemicals models
are the ones that incorporate chemical equations representing the reactions involved.
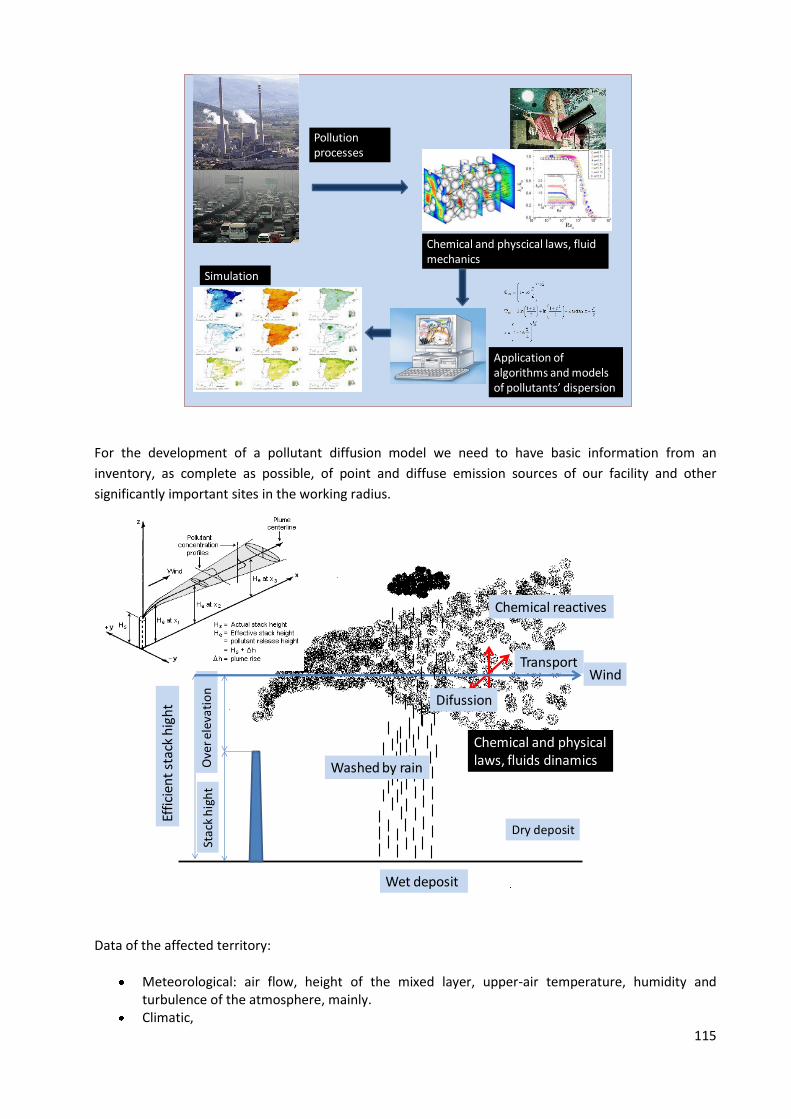
115
For the development of a pollutant diffusion model we need to have basic information from an
inventory, as complete as possible, of point and diffuse emission sources of our facility and other
significantly important sites in the working radius.
Data of the affected territory:
Meteorological: air flow, height of the mixed layer, upper-air temperature, humidity and turbulence of the atmosphere, mainly.
Climatic,
Pollutionprocesses
Chemical and physcical laws, fluid mechanics
Application of algorithms and modelsof pollutants’ dispersion
Simulation
Difussion
Transport
Stac
k h
igh
t
Effi
cien
tst
ack
hig
ht
Ove
rel
evat
ion
Wind
Chemical reactives
Dry deposit
Wet deposit
Washed by rain
Chemical and physicallaws, fluids dinamics
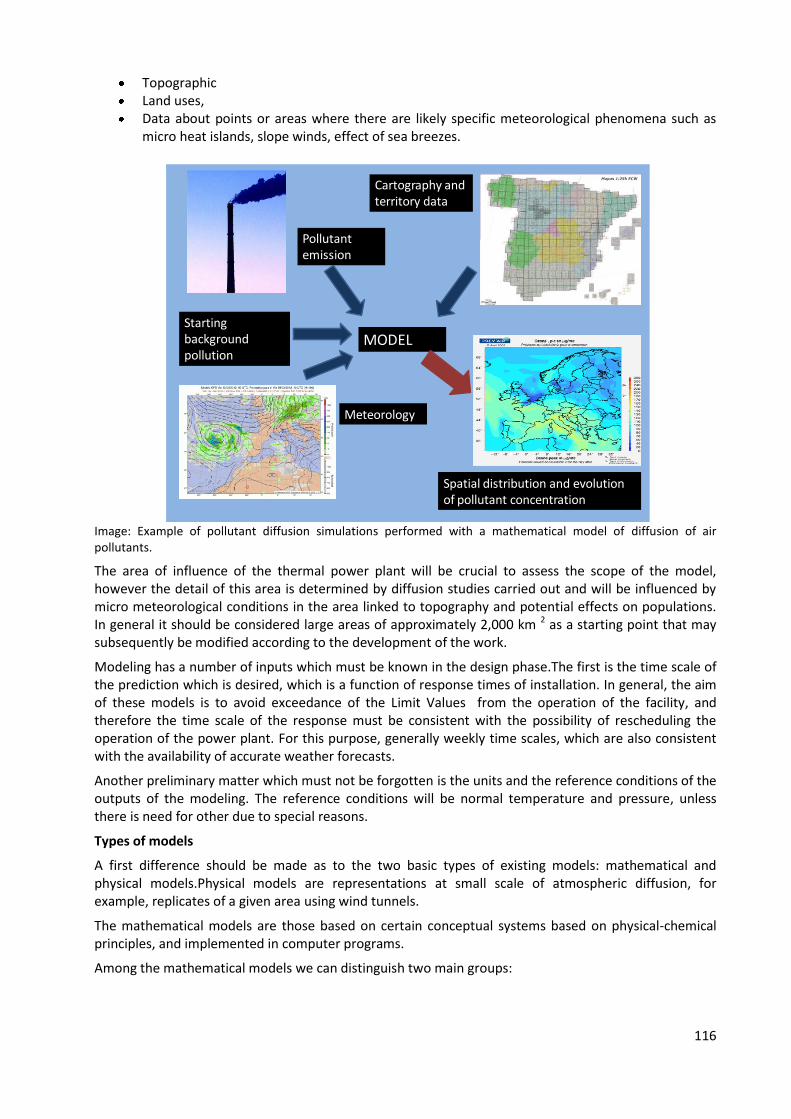
116
Topographic Land uses, Data about points or areas where there are likely specific meteorological phenomena such as
micro heat islands, slope winds, effect of sea breezes.
Image: Example of pollutant diffusion simulations performed with a mathematical model of diffusion of air pollutants.
The area of influence of the thermal power plant will be crucial to assess the scope of the model, however the detail of this area is determined by diffusion studies carried out and will be influenced by micro meteorological conditions in the area linked to topography and potential effects on populations. In general it should be considered large areas of approximately 2,000 km 2 as a starting point that may subsequently be modified according to the development of the work.
Modeling has a number of inputs which must be known in the design phase.The first is the time scale of the prediction which is desired, which is a function of response times of installation. In general, the aim of these models is to avoid exceedance of the Limit Values from the operation of the facility, and therefore the time scale of the response must be consistent with the possibility of rescheduling the operation of the power plant. For this purpose, generally weekly time scales, which are also consistent with the availability of accurate weather forecasts.
Another preliminary matter which must not be forgotten is the units and the reference conditions of the outputs of the modeling. The reference conditions will be normal temperature and pressure, unless there is need for other due to special reasons.
Types of models
A first difference should be made as to the two basic types of existing models: mathematical and physical models.Physical models are representations at small scale of atmospheric diffusion, for example, replicates of a given area using wind tunnels.
The mathematical models are those based on certain conceptual systems based on physical-chemical principles, and implemented in computer programs.
Among the mathematical models we can distinguish two main groups:
Pollutant emission
Cartography and territory data
Meteorology
MODELStarting background pollution
Spatial distribution and evolutionof pollutant concentration
117
deterministic models based on mathematical equations (mainly the advection diffusion equation representing atmospheric processes), and
empirical models based on empirical relationships between statistics and data on pollution and other variables that may influence it.
Deterministic Models
1. Box models 2. Gaussian models 3. Eulerian numerical models 4. Lagrangian models
Segmented plume models
Lagrangian Gaussian puff models (Gaussian cloud models)
Models-PIC ('Particle-in-cell'),
Lagrangian box models.
Empirical Models
"Rollback" models. Models based on statistical techniques.
Application of models in Environmental Management
1. Studies on air quality and environmental impact of different activities .
Prior to the construction of an industrial plant with high potential to emit pollutants into the atmosphere and in the context of environmental impact studies, it is advisable to apply models to determine the size (capacity of the plant), design (eg , stack height) and operating conditions so as not to cause contamination that added to the already existing one may surpass the limit values for ambient air quality imposed by legislation.
With the models are simulated the expected usual conditions of pollutant emissions for the future source of pollution in the area or region where it will be installed under the geographical conditions of the area and the most common or unfavorable weather, or they may be also obtained on an annual basis considering all weather situations that can be found along one or more years. In these simulations are obtained maps of the estimated concentration of various pollutants.
The modeling also allows to estimate the individual contribution of various sources of air pollutants, which by measurement is only possible in the case of atmospheric particles by analyzing their composition, being quite complicated anyway.This information helps determine which sources are the main causes of high concentrations of a pollutant and can provide guidance on control measures to define plans for improving air quality, or if required by the legislation, for imposing sanctions.
Modelling studies to estimate the impact on air quality can also be used to assess the so-called external costs (environmental) arising from potentially polluting activities of energy production, industrial installations, etc.This is done by applying dose-response functions to the concentrations of pollutants and indicators such as population density.This allows estimating the damage, for example, to health (illness, hospitalization, lost working hours, etc..). An economic assessment of such damages can also be made.
2. Determination of optimal measures to reduce air pollution with the best cost / benefit ratio.
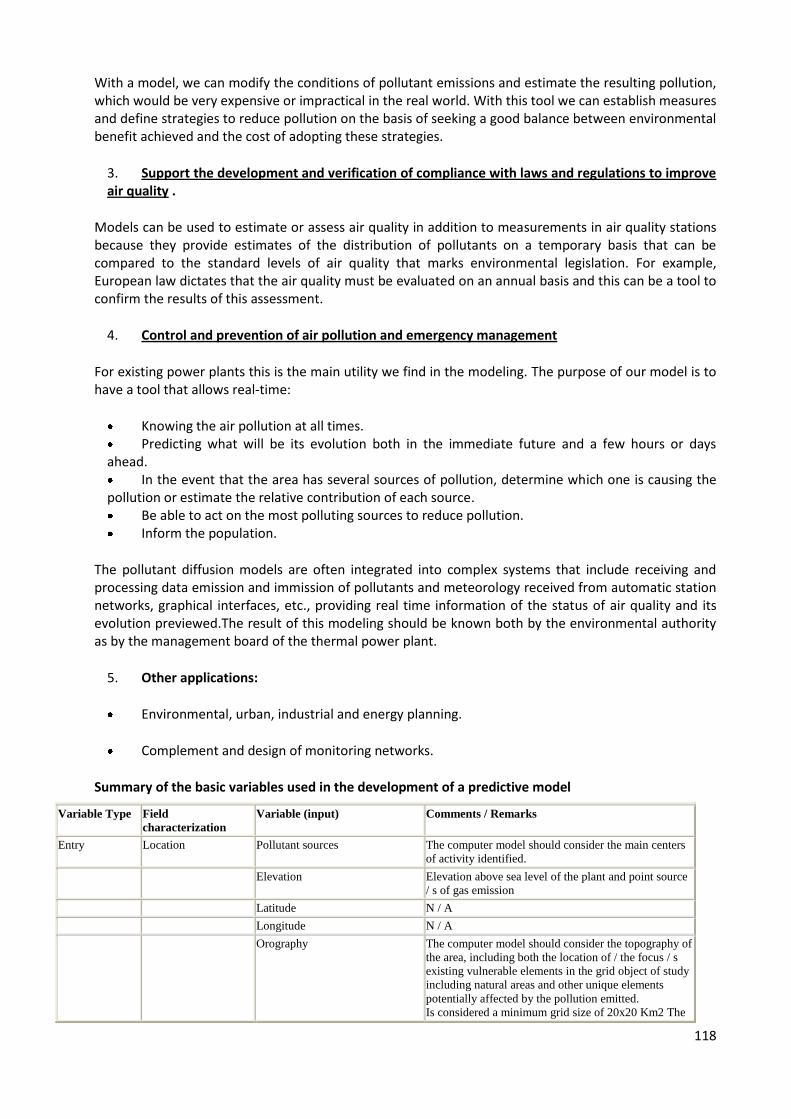
118
With a model, we can modify the conditions of pollutant emissions and estimate the resulting pollution, which would be very expensive or impractical in the real world. With this tool we can establish measures and define strategies to reduce pollution on the basis of seeking a good balance between environmental benefit achieved and the cost of adopting these strategies.
3. Support the development and verification of compliance with laws and regulations to improve air quality .
Models can be used to estimate or assess air quality in addition to measurements in air quality stations because they provide estimates of the distribution of pollutants on a temporary basis that can be compared to the standard levels of air quality that marks environmental legislation. For example, European law dictates that the air quality must be evaluated on an annual basis and this can be a tool to confirm the results of this assessment.
4. Control and prevention of air pollution and emergency management
For existing power plants this is the main utility we find in the modeling. The purpose of our model is to have a tool that allows real-time:
Knowing the air pollution at all times. Predicting what will be its evolution both in the immediate future and a few hours or days
ahead. In the event that the area has several sources of pollution, determine which one is causing the
pollution or estimate the relative contribution of each source. Be able to act on the most polluting sources to reduce pollution. Inform the population.
The pollutant diffusion models are often integrated into complex systems that include receiving and processing data emission and immission of pollutants and meteorology received from automatic station networks, graphical interfaces, etc., providing real time information of the status of air quality and its evolution previewed.The result of this modeling should be known both by the environmental authority as by the management board of the thermal power plant.
5. Other applications:
Environmental, urban, industrial and energy planning.
Complement and design of monitoring networks.
Summary of the basic variables used in the development of a predictive model
Variable Type Field
characterization
Variable (input) Comments / Remarks
Entry Location Pollutant sources The computer model should consider the main centers
of activity identified.
Elevation Elevation above sea level of the plant and point source
/ s of gas emission
Latitude N / A
Longitude N / A
Orography The computer model should consider the topography of
the area, including both the location of / the focus / s
existing vulnerable elements in the grid object of study
including natural areas and other unique elements
potentially affected by the pollution emitted.
Is considered a minimum grid size of 20x20 Km2 The
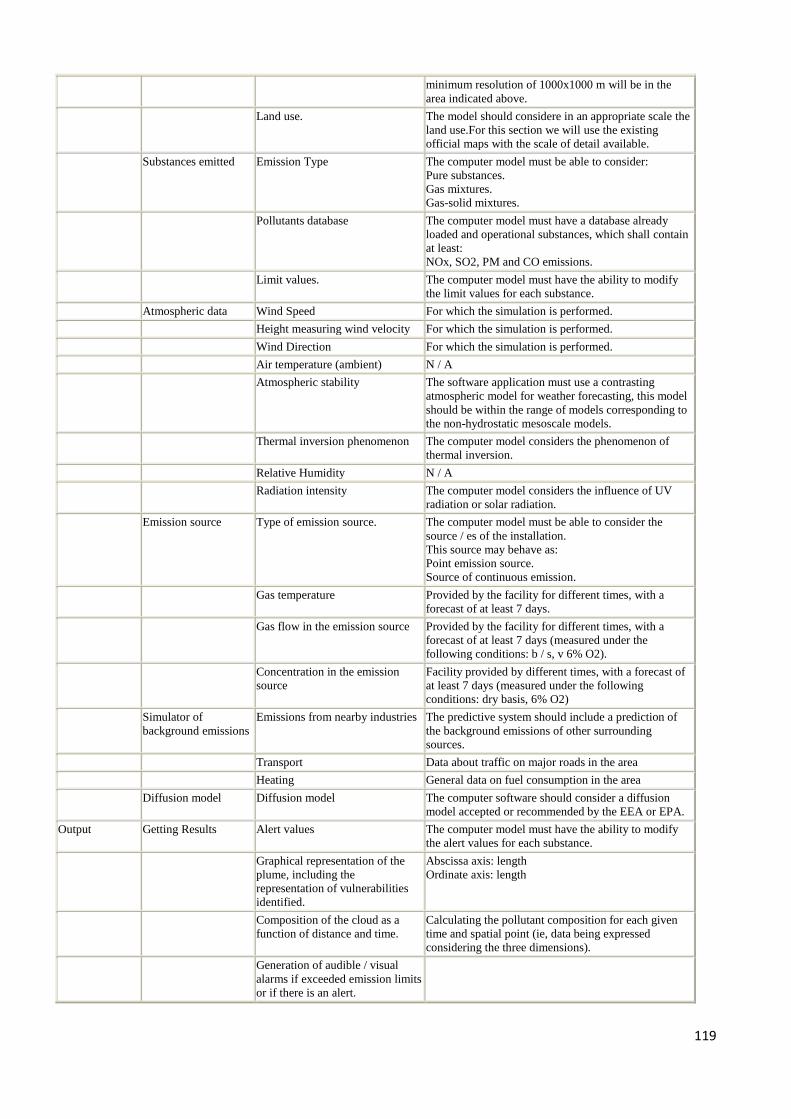
119
minimum resolution of 1000x1000 m will be in the
area indicated above.
Land use. The model should considere in an appropriate scale the
land use.For this section we will use the existing
official maps with the scale of detail available.
Substances emitted Emission Type The computer model must be able to consider:
Pure substances.
Gas mixtures.
Gas-solid mixtures.
Pollutants database The computer model must have a database already
loaded and operational substances, which shall contain
at least:
NOx, SO2, PM and CO emissions.
Limit values. The computer model must have the ability to modify
the limit values for each substance.
Atmospheric data Wind Speed For which the simulation is performed.
Height measuring wind velocity For which the simulation is performed.
Wind Direction For which the simulation is performed.
Air temperature (ambient) N / A
Atmospheric stability The software application must use a contrasting
atmospheric model for weather forecasting, this model
should be within the range of models corresponding to
the non-hydrostatic mesoscale models.
Thermal inversion phenomenon The computer model considers the phenomenon of
thermal inversion.
Relative Humidity N / A
Radiation intensity The computer model considers the influence of UV
radiation or solar radiation.
Emission source Type of emission source. The computer model must be able to consider the
source / es of the installation.
This source may behave as:
Point emission source.
Source of continuous emission.
Gas temperature Provided by the facility for different times, with a
forecast of at least 7 days.
Gas flow in the emission source Provided by the facility for different times, with a
forecast of at least 7 days (measured under the
following conditions: b / s, v 6% O2).
Concentration in the emission
source
Facility provided by different times, with a forecast of
at least 7 days (measured under the following
conditions: dry basis, 6% O2)
Simulator of
background emissions
Emissions from nearby industries The predictive system should include a prediction of
the background emissions of other surrounding
sources.
Transport Data about traffic on major roads in the area
Heating General data on fuel consumption in the area
Diffusion model Diffusion model The computer software should consider a diffusion
model accepted or recommended by the EEA or EPA.
Output Getting Results Alert values The computer model must have the ability to modify
the alert values for each substance.
Graphical representation of the
plume, including the
representation of vulnerabilities
identified.
Abscissa axis: length
Ordinate axis: length
Composition of the cloud as a
function of distance and time.
Calculating the pollutant composition for each given
time and spatial point (ie, data being expressed
considering the three dimensions).
Generation of audible / visual
alarms if exceeded emission limits
or if there is an alert.
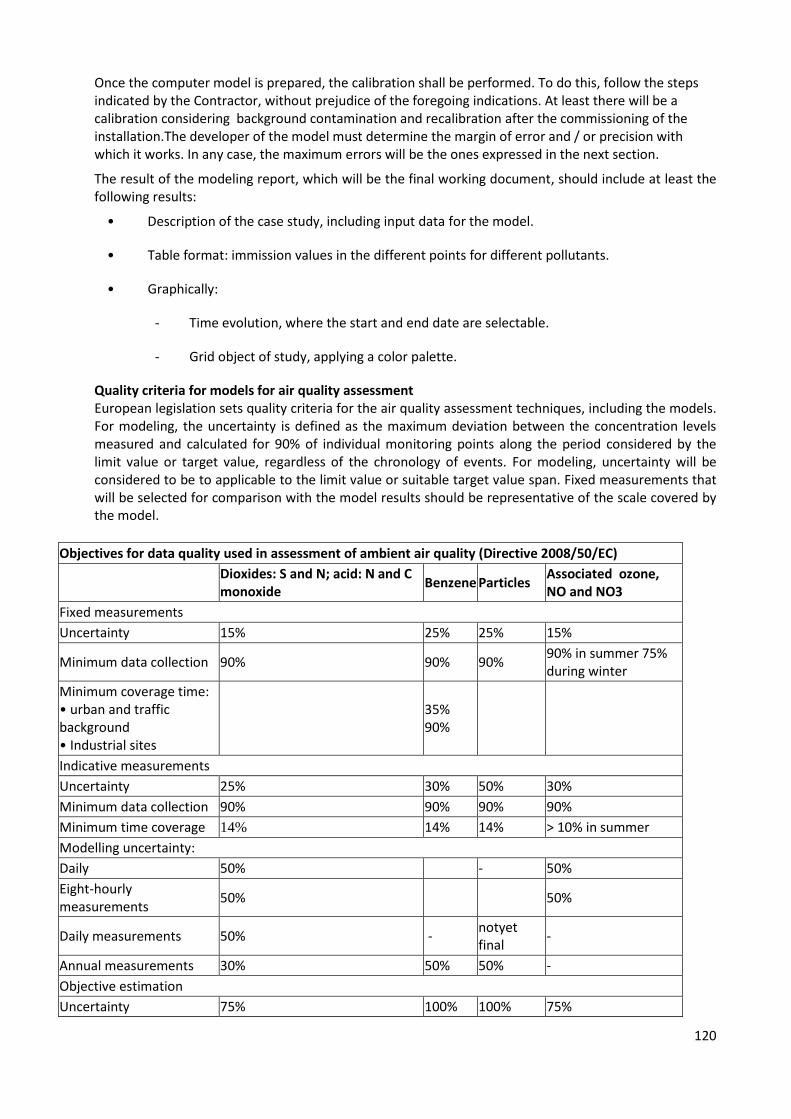
120
Once the computer model is prepared, the calibration shall be performed. To do this, follow the steps indicated by the Contractor, without prejudice of the foregoing indications. At least there will be a calibration considering background contamination and recalibration after the commissioning of the installation.The developer of the model must determine the margin of error and / or precision with which it works. In any case, the maximum errors will be the ones expressed in the next section.
The result of the modeling report, which will be the final working document, should include at least the following results:
• Description of the case study, including input data for the model.
• Table format: immission values in the different points for different pollutants.
• Graphically:
- Time evolution, where the start and end date are selectable.
- Grid object of study, applying a color palette.
Quality criteria for models for air quality assessment European legislation sets quality criteria for the air quality assessment techniques, including the models. For modeling, the uncertainty is defined as the maximum deviation between the concentration levels measured and calculated for 90% of individual monitoring points along the period considered by the limit value or target value, regardless of the chronology of events. For modeling, uncertainty will be considered to be to applicable to the limit value or suitable target value span. Fixed measurements that will be selected for comparison with the model results should be representative of the scale covered by the model.
Objectives for data quality used in assessment of ambient air quality (Directive 2008/50/EC)
Dioxides: S and N; acid: N and C monoxide
Benzene Particles Associated ozone, NO and NO3
Fixed measurements
Uncertainty 15% 25% 25% 15%
Minimum data collection 90% 90% 90% 90% in summer 75% during winter
Minimum coverage time: • urban and traffic background
• Industrial sites
35%
90%
Indicative measurements
Uncertainty 25% 30% 50% 30%
Minimum data collection 90% 90% 90% 90%
Minimum time coverage 14% 14% 14% > 10% in summer
Modelling uncertainty:
Daily 50% - 50%
Eight-hourly measurements
50% 50%
Daily measurements 50% - notyet final
-
Annual measurements 30% 50% 50% -
Objective estimation
Uncertainty 75% 100% 100% 75%
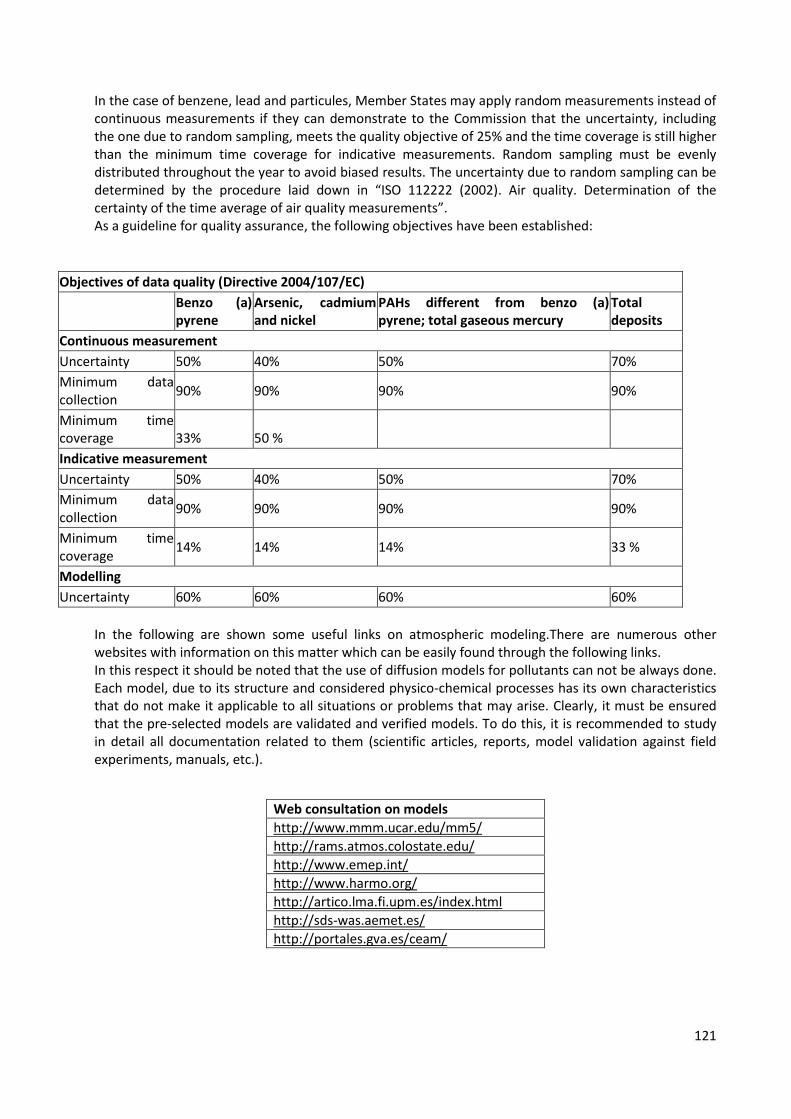
121
In the case of benzene, lead and particules, Member States may apply random measurements instead of continuous measurements if they can demonstrate to the Commission that the uncertainty, including the one due to random sampling, meets the quality objective of 25% and the time coverage is still higher than the minimum time coverage for indicative measurements. Random sampling must be evenly distributed throughout the year to avoid biased results. The uncertainty due to random sampling can be determined by the procedure laid down in “ISO 112222 (2002). Air quality. Determination of the certainty of the time average of air quality measurements”. As a guideline for quality assurance, the following objectives have been established:
Objectives of data quality (Directive 2004/107/EC)
Benzo (a) pyrene
Arsenic, cadmium and nickel
PAHs different from benzo (a) pyrene; total gaseous mercury
Total deposits
Continuous measurement
Uncertainty 50% 40% 50% 70%
Minimum data collection
90% 90% 90% 90%
Minimum time coverage
33%
50 %
Indicative measurement
Uncertainty 50% 40% 50% 70%
Minimum data collection
90% 90% 90% 90%
Minimum time coverage
14% 14% 14% 33 %
Modelling
Uncertainty 60% 60% 60% 60%
In the following are shown some useful links on atmospheric modeling.There are numerous other websites with information on this matter which can be easily found through the following links. In this respect it should be noted that the use of diffusion models for pollutants can not be always done. Each model, due to its structure and considered physico-chemical processes has its own characteristics that do not make it applicable to all situations or problems that may arise. Clearly, it must be ensured that the pre-selected models are validated and verified models. To do this, it is recommended to study in detail all documentation related to them (scientific articles, reports, model validation against field experiments, manuals, etc.).
Web consultation on models
http://www.mmm.ucar.edu/mm5/
http://rams.atmos.colostate.edu/
http://www.emep.int/
http://www.harmo.org/
http://artico.lma.fi.upm.es/index.html
http://sds-was.aemet.es/
http://portales.gva.es/ceam/
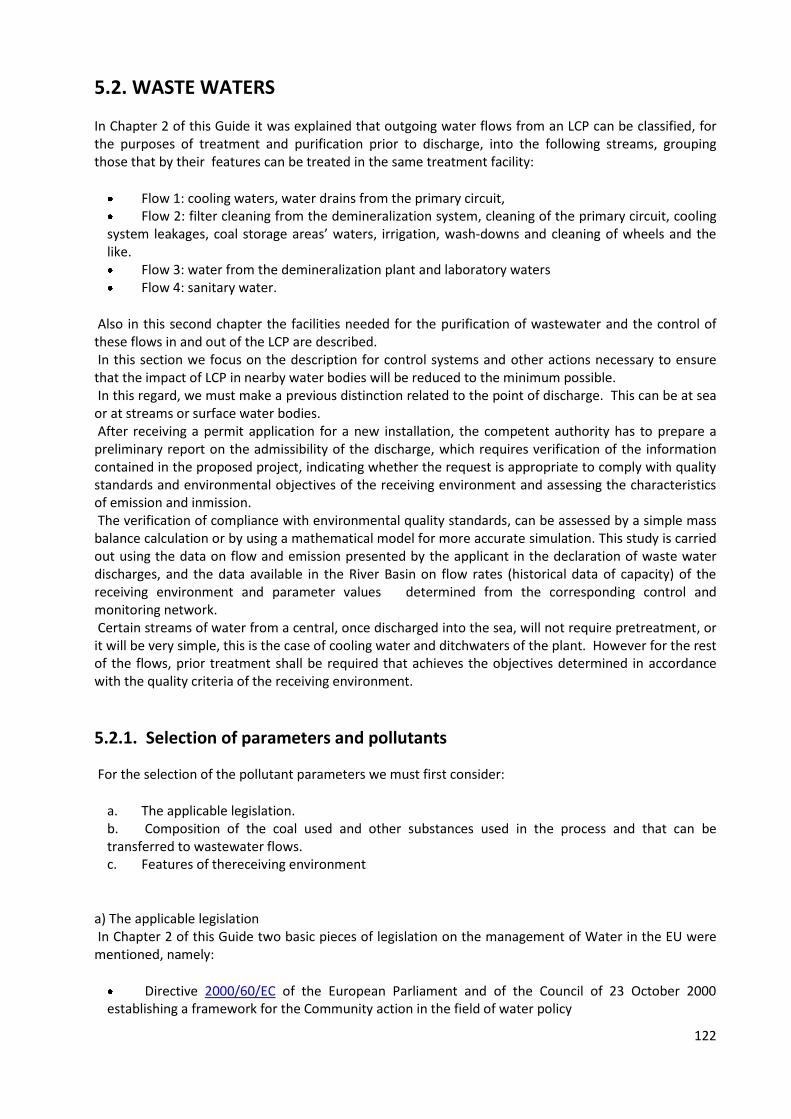
122
5.2. WASTE WATERS
In Chapter 2 of this Guide it was explained that outgoing water flows from an LCP can be classified, for the purposes of treatment and purification prior to discharge, into the following streams, grouping those that by their features can be treated in the same treatment facility:
Flow 1: cooling waters, water drains from the primary circuit, Flow 2: filter cleaning from the demineralization system, cleaning of the primary circuit, cooling
system leakages, coal storage areas’ waters, irrigation, wash-downs and cleaning of wheels and the like. Flow 3: water from the demineralization plant and laboratory waters Flow 4: sanitary water.
Also in this second chapter the facilities needed for the purification of wastewater and the control of these flows in and out of the LCP are described. In this section we focus on the description for control systems and other actions necessary to ensure that the impact of LCP in nearby water bodies will be reduced to the minimum possible. In this regard, we must make a previous distinction related to the point of discharge. This can be at sea or at streams or surface water bodies. After receiving a permit application for a new installation, the competent authority has to prepare a preliminary report on the admissibility of the discharge, which requires verification of the information contained in the proposed project, indicating whether the request is appropriate to comply with quality standards and environmental objectives of the receiving environment and assessing the characteristics of emission and inmission. The verification of compliance with environmental quality standards, can be assessed by a simple mass balance calculation or by using a mathematical model for more accurate simulation. This study is carried out using the data on flow and emission presented by the applicant in the declaration of waste water discharges, and the data available in the River Basin on flow rates (historical data of capacity) of the receiving environment and parameter values determined from the corresponding control and monitoring network. Certain streams of water from a central, once discharged into the sea, will not require pretreatment, or it will be very simple, this is the case of cooling water and ditchwaters of the plant. However for the rest of the flows, prior treatment shall be required that achieves the objectives determined in accordance with the quality criteria of the receiving environment.
5.2.1. Selection of parameters and pollutants
For the selection of the pollutant parameters we must first consider:
a. The applicable legislation. b. Composition of the coal used and other substances used in the process and that can be transferred to wastewater flows. c. Features of thereceiving environment
a) The applicable legislation In Chapter 2 of this Guide two basic pieces of legislation on the management of Water in the EU were mentioned, namely:
Directive 2000/60/EC of the European Parliament and of the Council of 23 October 2000 establishing a framework for the Community action in the field of water policy
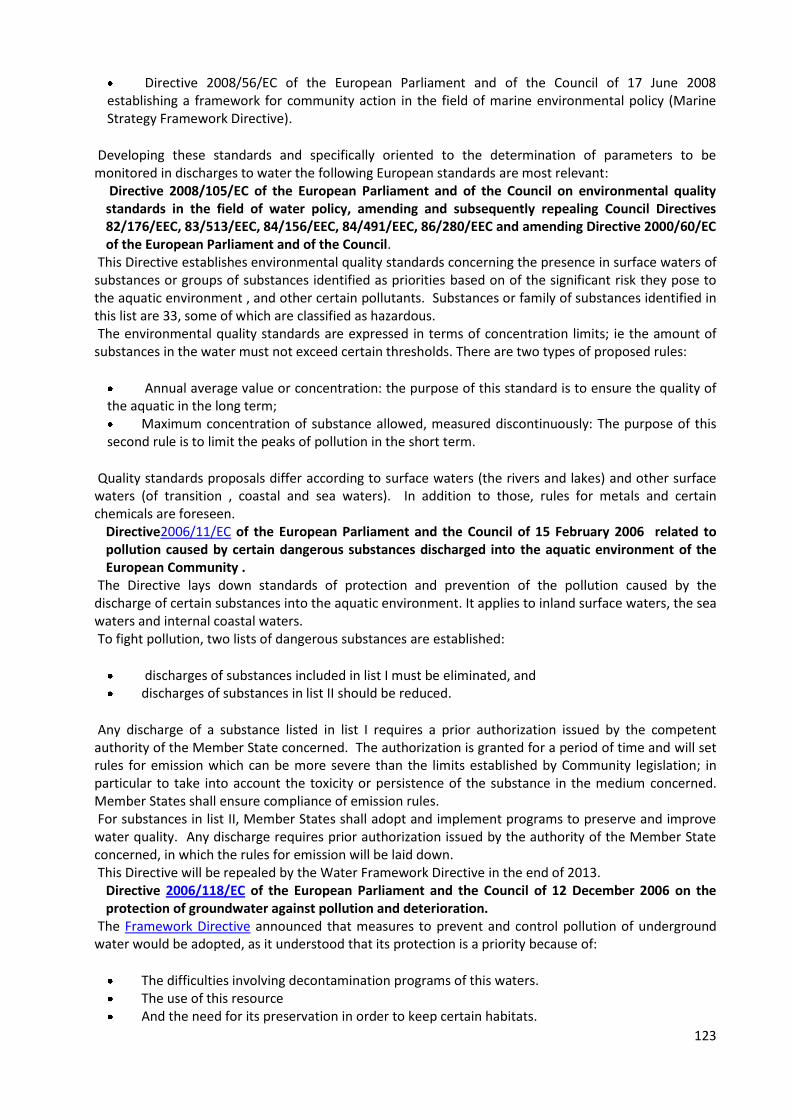
123
Directive 2008/56/EC of the European Parliament and of the Council of 17 June 2008 establishing a framework for community action in the field of marine environmental policy (Marine Strategy Framework Directive).
Developing these standards and specifically oriented to the determination of parameters to be monitored in discharges to water the following European standards are most relevant:
Directive 2008/105/EC of the European Parliament and of the Council on environmental quality standards in the field of water policy, amending and subsequently repealing Council Directives 82/176/EEC, 83/513/EEC, 84/156/EEC, 84/491/EEC, 86/280/EEC and amending Directive 2000/60/EC of the European Parliament and of the Council.
This Directive establishes environmental quality standards concerning the presence in surface waters of substances or groups of substances identified as priorities based on of the significant risk they pose to the aquatic environment , and other certain pollutants. Substances or family of substances identified in this list are 33, some of which are classified as hazardous. The environmental quality standards are expressed in terms of concentration limits; ie the amount of substances in the water must not exceed certain thresholds. There are two types of proposed rules:
Annual average value or concentration: the purpose of this standard is to ensure the quality of the aquatic in the long term; Maximum concentration of substance allowed, measured discontinuously: The purpose of this
second rule is to limit the peaks of pollution in the short term.
Quality standards proposals differ according to surface waters (the rivers and lakes) and other surface waters (of transition , coastal and sea waters). In addition to those, rules for metals and certain chemicals are foreseen.
Directive2006/11/EC of the European Parliament and the Council of 15 February 2006 related to pollution caused by certain dangerous substances discharged into the aquatic environment of the European Community .
The Directive lays down standards of protection and prevention of the pollution caused by the discharge of certain substances into the aquatic environment. It applies to inland surface waters, the sea waters and internal coastal waters. To fight pollution, two lists of dangerous substances are established:
discharges of substances included in list I must be eliminated, and discharges of substances in list II should be reduced.
Any discharge of a substance listed in list I requires a prior authorization issued by the competent authority of the Member State concerned. The authorization is granted for a period of time and will set rules for emission which can be more severe than the limits established by Community legislation; in particular to take into account the toxicity or persistence of the substance in the medium concerned. Member States shall ensure compliance of emission rules. For substances in list II, Member States shall adopt and implement programs to preserve and improve water quality. Any discharge requires prior authorization issued by the authority of the Member State concerned, in which the rules for emission will be laid down. This Directive will be repealed by the Water Framework Directive in the end of 2013.
Directive 2006/118/EC of the European Parliament and the Council of 12 December 2006 on the protection of groundwater against pollution and deterioration.
The Framework Directive announced that measures to prevent and control pollution of underground water would be adopted, as it understood that its protection is a priority because of:
The difficulties involving decontamination programs of this waters. The use of this resource And the need for its preservation in order to keep certain habitats.
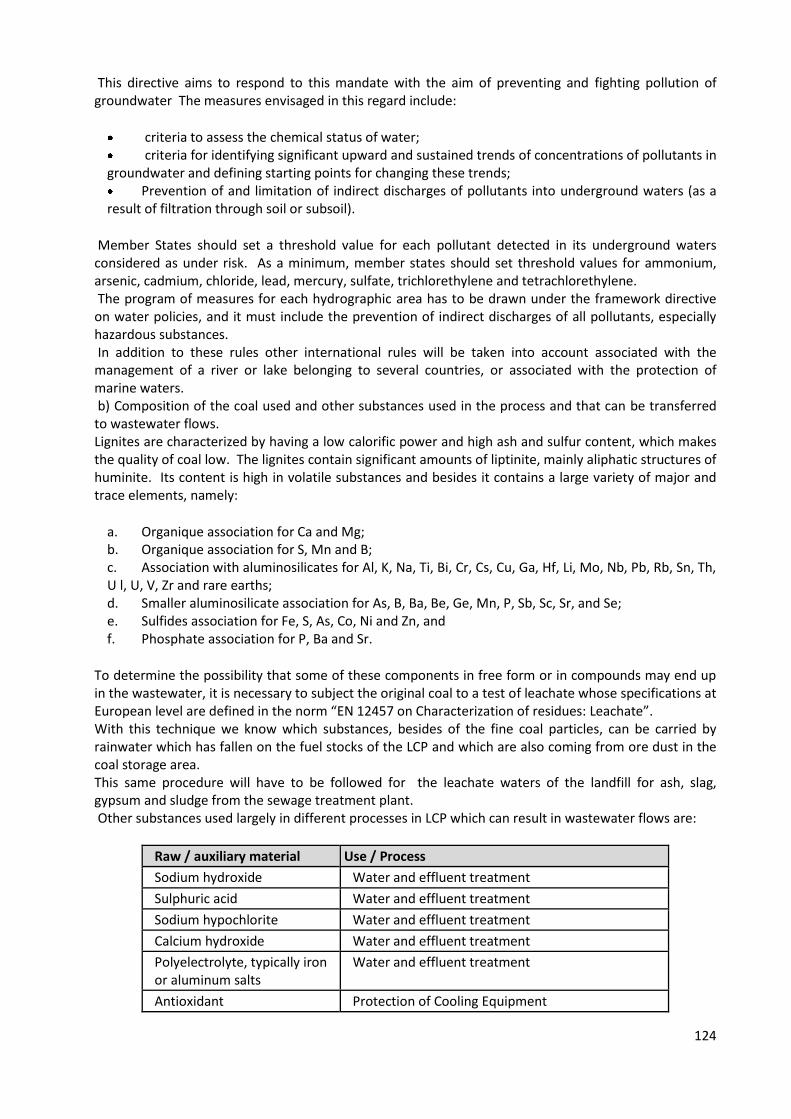
124
This directive aims to respond to this mandate with the aim of preventing and fighting pollution of groundwater The measures envisaged in this regard include:
criteria to assess the chemical status of water; criteria for identifying significant upward and sustained trends of concentrations of pollutants in
groundwater and defining starting points for changing these trends; Prevention of and limitation of indirect discharges of pollutants into underground waters (as a
result of filtration through soil or subsoil).
Member States should set a threshold value for each pollutant detected in its underground waters considered as under risk. As a minimum, member states should set threshold values for ammonium, arsenic, cadmium, chloride, lead, mercury, sulfate, trichlorethylene and tetrachlorethylene. The program of measures for each hydrographic area has to be drawn under the framework directive on water policies, and it must include the prevention of indirect discharges of all pollutants, especially hazardous substances. In addition to these rules other international rules will be taken into account associated with the management of a river or lake belonging to several countries, or associated with the protection of marine waters. b) Composition of the coal used and other substances used in the process and that can be transferred to wastewater flows. Lignites are characterized by having a low calorific power and high ash and sulfur content, which makes the quality of coal low. The lignites contain significant amounts of liptinite, mainly aliphatic structures of huminite. Its content is high in volatile substances and besides it contains a large variety of major and trace elements, namely:
a. Organique association for Ca and Mg; b. Organique association for S, Mn and B; c. Association with aluminosilicates for Al, K, Na, Ti, Bi, Cr, Cs, Cu, Ga, Hf, Li, Mo, Nb, Pb, Rb, Sn, Th, U l, U, V, Zr and rare earths; d. Smaller aluminosilicate association for As, B, Ba, Be, Ge, Mn, P, Sb, Sc, Sr, and Se; e. Sulfides association for Fe, S, As, Co, Ni and Zn, and f. Phosphate association for P, Ba and Sr.
To determine the possibility that some of these components in free form or in compounds may end up in the wastewater, it is necessary to subject the original coal to a test of leachate whose specifications at European level are defined in the norm “EN 12457 on Characterization of residues: Leachate”. With this technique we know which substances, besides of the fine coal particles, can be carried by rainwater which has fallen on the fuel stocks of the LCP and which are also coming from ore dust in the coal storage area. This same procedure will have to be followed for the leachate waters of the landfill for ash, slag, gypsum and sludge from the sewage treatment plant. Other substances used largely in different processes in LCP which can result in wastewater flows are:
Raw / auxiliary material Use / Process
Sodium hydroxide Water and effluent treatment
Sulphuric acid Water and effluent treatment
Sodium hypochlorite Water and effluent treatment
Calcium hydroxide Water and effluent treatment
Polyelectrolyte, typically iron or aluminum salts
Water and effluent treatment
Antioxidant Protection of Cooling Equipment
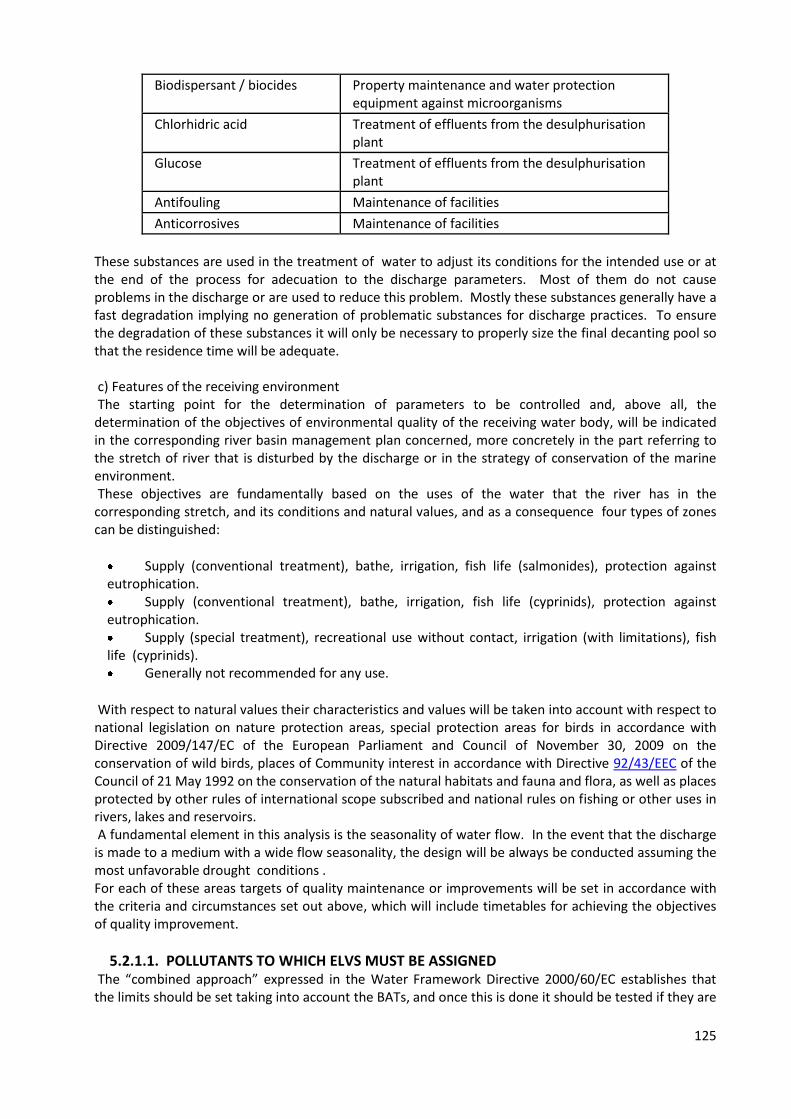
125
Biodispersant / biocides Property maintenance and water protection equipment against microorganisms
Chlorhidric acid Treatment of effluents from the desulphurisation plant
Glucose Treatment of effluents from the desulphurisation plant
Antifouling Maintenance of facilities
Anticorrosives Maintenance of facilities
These substances are used in the treatment of water to adjust its conditions for the intended use or at the end of the process for adecuation to the discharge parameters. Most of them do not cause problems in the discharge or are used to reduce this problem. Mostly these substances generally have a fast degradation implying no generation of problematic substances for discharge practices. To ensure the degradation of these substances it will only be necessary to properly size the final decanting pool so that the residence time will be adequate. c) Features of the receiving environment The starting point for the determination of parameters to be controlled and, above all, the determination of the objectives of environmental quality of the receiving water body, will be indicated in the corresponding river basin management plan concerned, more concretely in the part referring to the stretch of river that is disturbed by the discharge or in the strategy of conservation of the marine environment. These objectives are fundamentally based on the uses of the water that the river has in the corresponding stretch, and its conditions and natural values, and as a consequence four types of zones can be distinguished:
Supply (conventional treatment), bathe, irrigation, fish life (salmonides), protection against eutrophication. Supply (conventional treatment), bathe, irrigation, fish life (cyprinids), protection against
eutrophication. Supply (special treatment), recreational use without contact, irrigation (with limitations), fish
life (cyprinids). Generally not recommended for any use.
With respect to natural values their characteristics and values will be taken into account with respect to national legislation on nature protection areas, special protection areas for birds in accordance with Directive 2009/147/EC of the European Parliament and Council of November 30, 2009 on the conservation of wild birds, places of Community interest in accordance with Directive 92/43/EEC of the Council of 21 May 1992 on the conservation of the natural habitats and fauna and flora, as well as places protected by other rules of international scope subscribed and national rules on fishing or other uses in rivers, lakes and reservoirs. A fundamental element in this analysis is the seasonality of water flow. In the event that the discharge is made to a medium with a wide flow seasonality, the design will be always be conducted assuming the most unfavorable drought conditions . For each of these areas targets of quality maintenance or improvements will be set in accordance with the criteria and circumstances set out above, which will include timetables for achieving the objectives of quality improvement.
5.2.1.1. POLLUTANTS TO WHICH ELVS MUST BE ASSIGNED The “combined approach” expressed in the Water Framework Directive 2000/60/EC establishes that the limits should be set taking into account the BATs, and once this is done it should be tested if they are
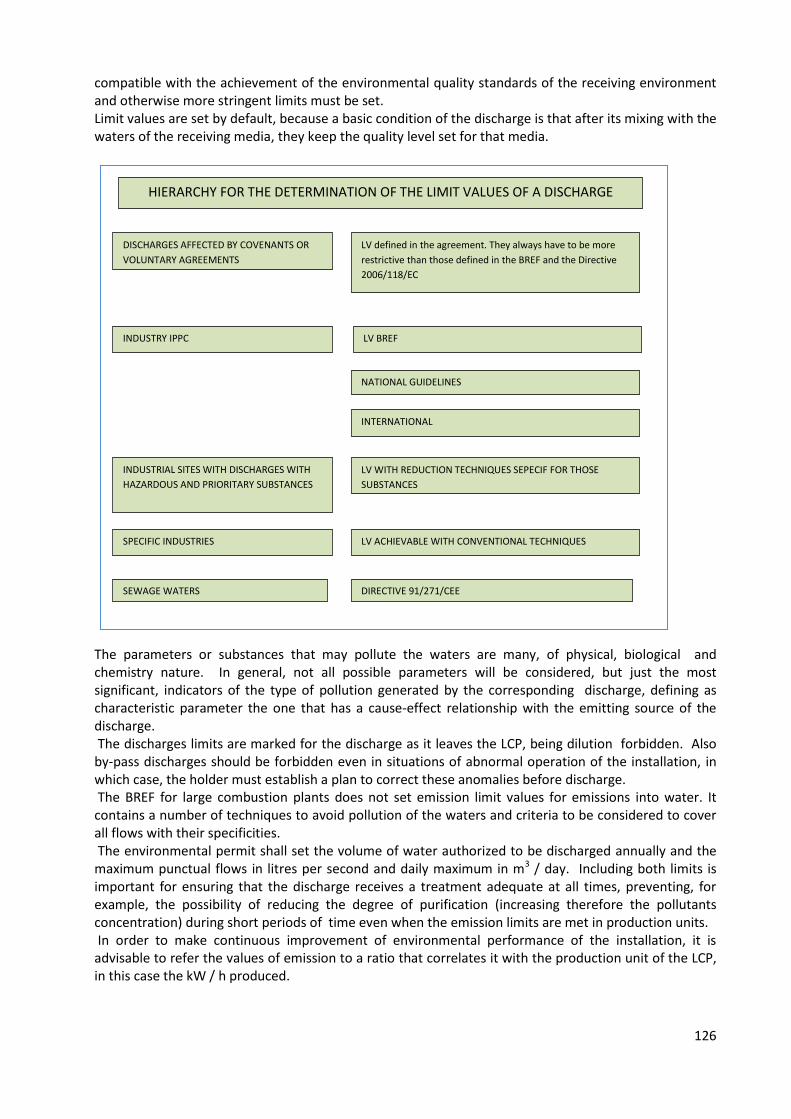
126
compatible with the achievement of the environmental quality standards of the receiving environment and otherwise more stringent limits must be set. Limit values are set by default, because a basic condition of the discharge is that after its mixing with the waters of the receiving media, they keep the quality level set for that media. The parameters or substances that may pollute the waters are many, of physical, biological and chemistry nature. In general, not all possible parameters will be considered, but just the most significant, indicators of the type of pollution generated by the corresponding discharge, defining as characteristic parameter the one that has a cause-effect relationship with the emitting source of the discharge. The discharges limits are marked for the discharge as it leaves the LCP, being dilution forbidden. Also by-pass discharges should be forbidden even in situations of abnormal operation of the installation, in which case, the holder must establish a plan to correct these anomalies before discharge. The BREF for large combustion plants does not set emission limit values for emissions into water. It contains a number of techniques to avoid pollution of the waters and criteria to be considered to cover all flows with their specificities. The environmental permit shall set the volume of water authorized to be discharged annually and the maximum punctual flows in litres per second and daily maximum in m3 / day. Including both limits is important for ensuring that the discharge receives a treatment adequate at all times, preventing, for example, the possibility of reducing the degree of purification (increasing therefore the pollutants concentration) during short periods of time even when the emission limits are met in production units. In order to make continuous improvement of environmental performance of the installation, it is advisable to refer the values of emission to a ratio that correlates it with the production unit of the LCP, in this case the kW / h produced.
HIERARCHY FOR THE DETERMINATION OF THE LIMIT VALUES OF A DISCHARGE
DISCHARGES AFFECTED BY COVENANTS OR
VOLUNTARY AGREEMENTS
LV defined in the agreement. They always have to be more
restrictive than those defined in the BREF and the Directive
2006/118/EC
INDUSTRY IPPC LV BREF
NATIONAL GUIDELINES
INTERNATIONAL
LV WITH REDUCTION TECHNIQUES SEPECIF FOR THOSE
SUBSTANCES
INDUSTRIAL SITES WITH DISCHARGES WITH
HAZARDOUS AND PRIORITARY SUBSTANCES
SPECIFIC INDUSTRIES LV ACHIEVABLE WITH CONVENTIONAL TECHNIQUES
SEWAGE WATERS DIRECTIVE 91/271/CEE
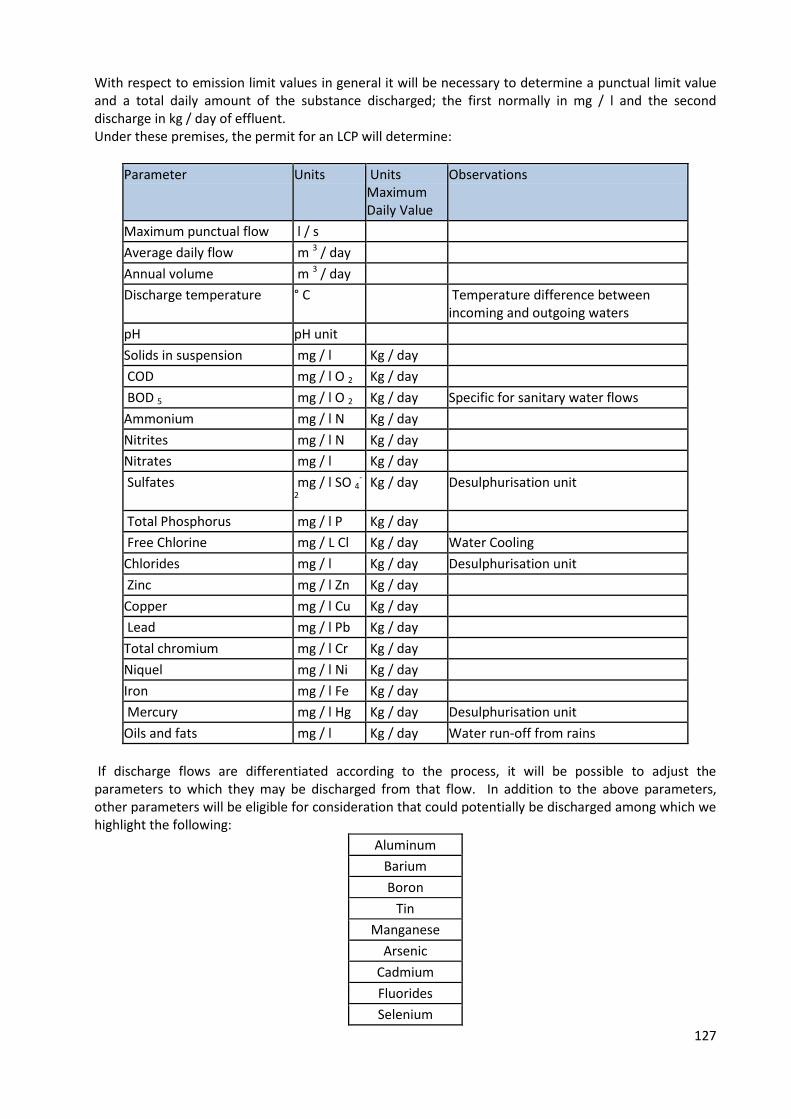
127
With respect to emission limit values in general it will be necessary to determine a punctual limit value and a total daily amount of the substance discharged; the first normally in mg / l and the second discharge in kg / day of effluent. Under these premises, the permit for an LCP will determine:
Parameter Units Units Maximum Daily Value
Observations
Maximum punctual flow l / s
Average daily flow m 3 / day
Annual volume m 3 / day
Discharge temperature ° C Temperature difference between incoming and outgoing waters
pH pH unit
Solids in suspension mg / l Kg / day
COD mg / l O 2 Kg / day
BOD 5 mg / l O 2 Kg / day Specific for sanitary water flows
Ammonium mg / l N Kg / day
Nitrites mg / l N Kg / day
Nitrates mg / l Kg / day
Sulfates mg / l SO 4-
2 Kg / day Desulphurisation unit
Total Phosphorus mg / l P Kg / day
Free Chlorine mg / L Cl Kg / day Water Cooling
Chlorides mg / l Kg / day Desulphurisation unit
Zinc mg / l Zn Kg / day
Copper mg / l Cu Kg / day
Lead mg / l Pb Kg / day
Total chromium mg / l Cr Kg / day
Niquel mg / l Ni Kg / day
Iron mg / l Fe Kg / day
Mercury mg / l Hg Kg / day Desulphurisation unit
Oils and fats mg / l Kg / day Water run-off from rains
If discharge flows are differentiated according to the process, it will be possible to adjust the parameters to which they may be discharged from that flow. In addition to the above parameters, other parameters will be eligible for consideration that could potentially be discharged among which we highlight the following:
Aluminum
Barium
Boron
Tin
Manganese
Arsenic
Cadmium
Fluorides
Selenium
128
The list of parameters given above is an example, its definition for a particular case will depend fundamentally on the characteristics of the substances used in processes that ultimately end up in water streams. It should be emphasized that in general the permit must cover all substances which may be released to water from the LCP with negative impact on the water bodies and whose concentration is bigger than the limits of detection of standard analytical equipments. For substances that are not included in the list its discharge will be considered to be forbidden. In this regard it should be borne in mind that there are substances emitted in quantities extremely low punctually or daily, but which annually exceed the thresholds for notification to the PRTR, and therefore the permit shall consider this circumstance. Control of discharges The discharge of a new LCP it will be necessary to preview intermediate checkpoints at the exits of water of each stream that we can separate. For existing facilities this is likely not possible because of structural issues, which can cause problems for the proper management of the flows of water. The controls of the intermediate points are needed for the internal management of the installation and proper understanding of each of the flows. For example, an essential intermediate control is to know periodically the amount and composition of leachate leaving the different waste disposal sites. From the environmental standpoint controls will be established in each of the points of water discharge to the environment, where there will be infrastructure and equipment enough for the development of these controls. This will consist in a chest to allow access to the flow of water leaving the plant for representative sampling and auxiliary systems necessary to ensure the safety of workers and ensure that analysis and sampling equipment can function correctly at that site. As a general rule the pH, turbidity, conductivity and flow will be controlled constantly in the single discharge of the plant or in any of the flows which discharge directly to the receiving media. Water temperature will be in continuous control in the flow of cooling waters. As a safety measure and in order to detect early abnormalities in the operation, continuous control systems of discharges will be connected to the control center of the LCP’s alarm system to be able to control situations of surpassing of discharge thresholds marked on the permit, taking the necessary measures. Periodically at least the parameters stated in the permit will be checked in punctual samples of the discharge representing a significant period of plant operation and at a frequency consistent with the indications stated the permit of the installation. This frequency, if there is a historic register with correct data, can be quarterly, and if there are no previous data or these indicated a superation of the limits, then the frequency, at least during the first year, will be higher than a monthly check. The analysis will be conducted both on punctual samples and on compound sampling of samples collected at time periods of 24 h. The monitoring plan for the discharge of an LCP may include the development of studies using biomarkers in receiving waters if is so determined in the integrated environmental permit. In rivers fish fauna may be considered arthropods and seagrass communities, and in the sea, the presence of benthic macroinvertebrates complemented by studies of plant communities (Posidonia Oceanica). In addition to the controls of discharges, the LCP will perform a quality control of groundwater. Its aim is to control polluting leaks that may come basically from the landfill, but also from the rest of the facility. Measures to control the possible affection of the discharge of waste into groundwaters will be carried out in at least one point above the landfill in the same direction of the underground incoming water and in at least two points below the landfill in the same direction of the outgoing flow of waters. The situation of the control points and frequency of checks will be conditioned to an accurate knowledge of the flow of water given by the hydrogeological study to be performed. As a reference, the following parameters will be necessarily measured in the ground waters, nevertheless the concrete definition of these will be determined in the integrated environmental permit and will be held on the basis of the list of substances that can effectively be emitted by the LCP:
pH, conductivity, temperature.
129
COD (Chemical Oxygen Demand), DOC (dissolved organic carbon), TOC (Total organic carbon), dissolved solids and settleable solids. Chlorides, sulfides, sulfates, fluorides and phenols. Metals (As, Cd, Cr VI and total Cr, Mn, Pb, Hg, In, Fe, Cu, Ba, Zn, Sb, Ni, Se, Mo) The periodicity of the measurement will be at least quarterly in the exploitation phase and half-
yearly in the maintenance phase.
The groundwater level will be measured every six months both in the phase of exploitation as in maintenance or post-closure of the landfill.
5.2.1.2. OTHER POLLUTANTS TO BE REPORTED TO E-PRTR
On January 18, 2006 Regulation (EC) No 166/2006 of the European Parliament and of the Council concerning the establishment of a European Pollutant Release and Transfer Register and amending Directives 91/689/EEC and 96/61/CE was adopted. The European PRTR (E-PRTR) aims to implement at EU level the Protocol CEPE/ONU/PRTR, which was signed by the European Union and 23 Member States in May 2003 in Kiev within the framework of the Aarhus Convention. The E-PRTR Regulation aims at promoting access of the public to environmental information by establishing a European PRTR coherent and integrated register, contributing in this way to prevent and reduce the pollution of the environment, providing data for the establishment of policy guidelines and facilitating the participation of the public in the decision making process in environmental matters. The E-PRTR includes information on specific atmospheric, water and soil emissions, as well as on off-site transfers of waste, and of pollutants discharged to waste water treatment. This information should be provided by operators of facilities conducting specific activities. Specifically, for discharges to water, the E-PRTR Regulation, specifies a total of 71 substances as relevant water pollutants. As a reference, Annex V shows in its third column the indicative sub-list of significant parameters for waste water discharges of LCPs, while its fourth column shows PRTR parameters reported by Spanish LCPs.
5.2.2. Operating Conditions and measurement techniques
The operation conditions regarding wastewaters come from the indications of the BREF. Basically they just establish watertight systems, channeling and adequate treatment of each flow and the specific conditions resulting from general water regulations or conditions established for the control of the installation. For example it will be necessary to determine in the permit very specific questions clarifying the scope of work. Among others the following can be mentioned:
Control point on the riverbed for the determination of the zero state and the state after the discharge;ie the point where it is considered that the discharge is completely mixed with the water flowing through the riverbed. Time or periodicity for the implementation of a pollution reduction programme. Measures in case of break or leakage of liquids’ deposits. Measures to be carried out in case of a breakdown in the waste water treatment plant.
Other liabilities to determine in the permit are for example that the holder of the permit is obliged to keep the collectors and treatment facilities in perfect working state, and shall designate a person responsible for such obligations, to whom the holder of the permit will provide written rules and
130
necessary means for the care and operation of facilities. In the case of discharges to sea using submarine outfall, the proper control of this infrastructure will be included in this plan. As indicated in Chapter 2 of this Guide, the control system for waste water discharges requires an analysis service of the waters of the LCP, accredited as a testing laboratory by International Standard “17025:2005 General Requirements for the competence of testing and calibration laboratories”. With respect to analytical techniques to use, these will always be in line with those described in ISO reference norms and with equipments that have a Certificate by a Body accredited by a National Accreditation Body, in order to determine the calibration function by means of comparative measurements with the reference method and its variability. The Certification will be made according to standard EN 14181. In addition to this, these equipments will have a technical maintenance program. It is also recommended that laboratories performing these checks participate in intercomparison programmes . In addition it will be necessary to have a team of maintenance of the infrastructures to perform the work necessary to ensure the proper status of sinks and water pipes, besides the mechanic equipment of the waste water treatment plant. All this, if the competent authority for issuing the permit considers it appropriate, may appear in the permit.
5.3. SOIL AND GROUND WATERS
The new Industrial Emissions Directive establishes the requirement for integrated environmental permits to state guidelines for the decommissioning of the installation. The intention is that after the closure of the facility and its demolition / dismantling, the site will be in a good status for the development of the kind of activity established for that place in accordance with the local land use planning.
A polluted soil is one whose characteristics have been affected negatively by the presence of hazardous chemicals coming from human activity in such concentration that leads to an unacceptable risk to human health or the environment, according to the criteria and standards legally determined. Polluted soils may have very different effects, from a toxic risk to human health to the loss of economic resources. Keep in mind that the effects caused by a polluted soil are generally long term ones and sometimes the consequences are not detected immediately so that potential hazards can take decades to manifest, with far-reaching impact.
The LCPs are specifically mentioned among the activities potentially polluting soil. There are also two sections for which this Directive (IED) would affect them, namely the collection and wastewater treatment and the collection and treatment of other waste. On the other hand, it is possible that due to the multitude of processes involved in a facility of this type other sections of the IED may be applicable to parts of a given installation.
Accordingly an LCP must be considered as a whole as a potentially polluting for the soil and, therefore, in an integrated environmental permit prescriptions must be determined to avoid pollution of the soil on which it is located and in case of decommissioning, to provide appropriate measures to determine whether there has been no pollution of soil and, where appropriate, to adopt measures for remediation.
The main facilities within an LCP that may contaminate soils are:
Storage of liquid fuels. Storage of raw materials Sewage pipes Waste water treatment Landfill and leachate pond
131
Measures to prevent soil pollution are always actions involving sealing and containment of accidental discharges with appropriate barriers that allow isolating the ground from the points of possible pollution. These barriers for example, in the case of waste management, are watertight layers in landfills according to the prescriptions of the landfills Directive, and in the case of deposits of liquid substances, the retention bunds in case of breakage of tank or pipe.
For new installations a series of checks will be set to determine the “zero” status of the location, from which it will be possible to determine whether soil has been polluted and to what degree. Simultaneously in the design of the installation waterproofing measures will be set, as well as the barriers, etc..necessary to avoid as technically and economically possible soil pollution from leaks or accidental discharges.
For existing facilities it will be necessary to draw up a preliminary situation report whose ultimate goal is to assess the possibility of previous significant pollution episodes in the ground where the facility is located, or possible future ones. The elaboration of the preliminary situation report does not always demand an obligation to conduct any test or tests specifically for this purpose and may be made using the data generated in compliance with current legislation on waste and hazardous substances. However, the report should contain as much information as may be considered for a good assessment of the situation of the soil.
In those areas with activities potentially polluting soil, the presence of structural elements that may avoid the possibility of pollution shall be specified. This description will be made considering separately the various stages involved in the production process.
Derived from the presentation of the preliminary report and corresponding conclusions the Competent Authority has to determine the need for new evidence or request more detailed reports to determine the real potential of pollution.
Potentially polluted soils or soils suspected of being polluted or those who meet any of the following conditions:
Total hydrocarbon concentrations above 50 mg / kg. There is evidence that the analytical concentration of one or more of the substances listed in
law exceeds the generic reference level corresponding to its use, current or foreseeable. There is evidence that the analytical concentration of any chemical pollutant (metals,
hydrocarbons, biocides, etc..) for this soil is higher than the generic reference level calculated according to the criteria established. The concentration of one or more of the substances exceeds generic reference levels
established for one or several of the groups of organisms to protect in each case: soil organisms, aquatic organisms and / or terrestrial vertebrates. There is evidence that the analytical concentration of one or more chemical pollutants is higher
than the generic reference level calculated according to the criteria established. Toxicity is observed in biotests with soil or leachate in undiluted samples. Potential risks to human health or ecosystems are detected due to the presence of physical or
biological pollutants or to the pollution of groundwater.
Pollutants that are most likely found as soil pollutants derived from the activity of an LCP are:
Mineral oils Polychlorinated biphenyls (PCB) Hydrocarbons Chlorobenzene Heavy metals Hazardous substances stored at the plant, or waste products.
132
Finally, in case of proof of soil pollution a specific procedure should be made to assess in detail the risk of spread of pollution, assessed in terms of toxicity of the pollutant, and of its environmental effects, to determine the urgency of the action to perform, and in any case:
prevent further pollution of the soil the spread of pollution to nearby soil or groundwater (containment techniques), and the development of a specific soil remediation program which, if the pollution is confined, may
take place after the dismantling stage and if this is not the case, will seek the best alternative for at least preventing the spread the pollutant.
It should be noted that in case of soil pollution due to an accidental discharge,the legislation at European level for the adoption of measures for soil remediation is the one on environmental liability (Directive 2004/35/EC), affecting LCPs as they are IPPC installations.
5.4 ENVIRONMENTAL MONITORING AND CONTROL PLAN.
Assessment of compliance with emission limit values for emissions to air from stationary sources
Continuous measurements In the case of continuous measurements, the emission limit values will be considered to be respected if the evaluation of the measurement results indicates, for the operating hours of a year, that the following conditions have been fully met:
- No validated monthly average value exceeds the relevant emission limit values set out in parts 1 and 2 of Annex V to Directive 2010/75/EU.
- No validated daily average value exceeds 110% of the relevant emission limit values set out in Parts 1 and 2 of Annex V to Directive 2010/75/EU.
- In the case of combustion plants composed only of boilers using coal with a total rated thermal input below 50 MW, no validated daily average value exceeds 150% of the relevant emission limit values set out in Parts 1 and 2 of Annex V of Directive 2010/75/EU.
- 95% of all the validated hourly average values of the year do not exceed 200% of the relevant emission limit values set out in Parts 1 and 2 of Annex V to Directive 2010/75/EU.
For the calculation of average emission values, the values measured during the periods referred to in Article 30, paragraphs 5 and 6 and Article 37 of Directive 2010/75/EU will not be taken into account nor during the periods of startup and shutdown. Periodic measurements In cases when continuous measurements are not required, emission limit values set out in Parts 1 and 2 of Annex V to Directive 2010/75 shall be considered to be met if the results of each series of periodic measurements or of the other procedures defined and determined under the procedures established by the competent authorities do not exceed the emission limit values. Minimum rate of desulfurization The minimum rates of desulphurisation set out in Part 5 of Annex V to Directive 2010/75 will be applied as a monthly average limit value.
Frequency of information to the Competent Authorities and associated reporting systems.
The administration will be informed that the measurement plane of the AMS and the reference methods comply and the AMS meet the level of quality assurance QAL1 of the “Communique 28082 on continuous emission monitoring systems”. The checks by the LCP operator shall be made prior to its installation and the body authorized by the competent authorities will carry out the necessary checks

133
and issue the report/certificate of compliance required.This is done once in the life of the source, unless substantial changes occur in both the process and the structure of the source. The reports of the Annual Monitoring Tests (according to the “Communique 28082 on continuous emission monitoring systems”) will be forwarded to the competent authority, as well as the reports of the accredited testing laboratory (which in the EU must be accredited under the EN-17025), for the calibration of the AMS (QAL2 according to the “Communique 28082 on continuous emission monitoring systems”). AMS data may be transmitted in real time to the competent authority according to the protocol established. In case this circumstance does not occur at least on an annual basis validated data from the AMS will be sent, in order to verify compliance with emission limit values. The competent authority will be notified of the surpassing of the emission limit values, the incidents in the AMS that lead to the failure to record data, the malfunction or breakdown of abatement equipment and other problems.
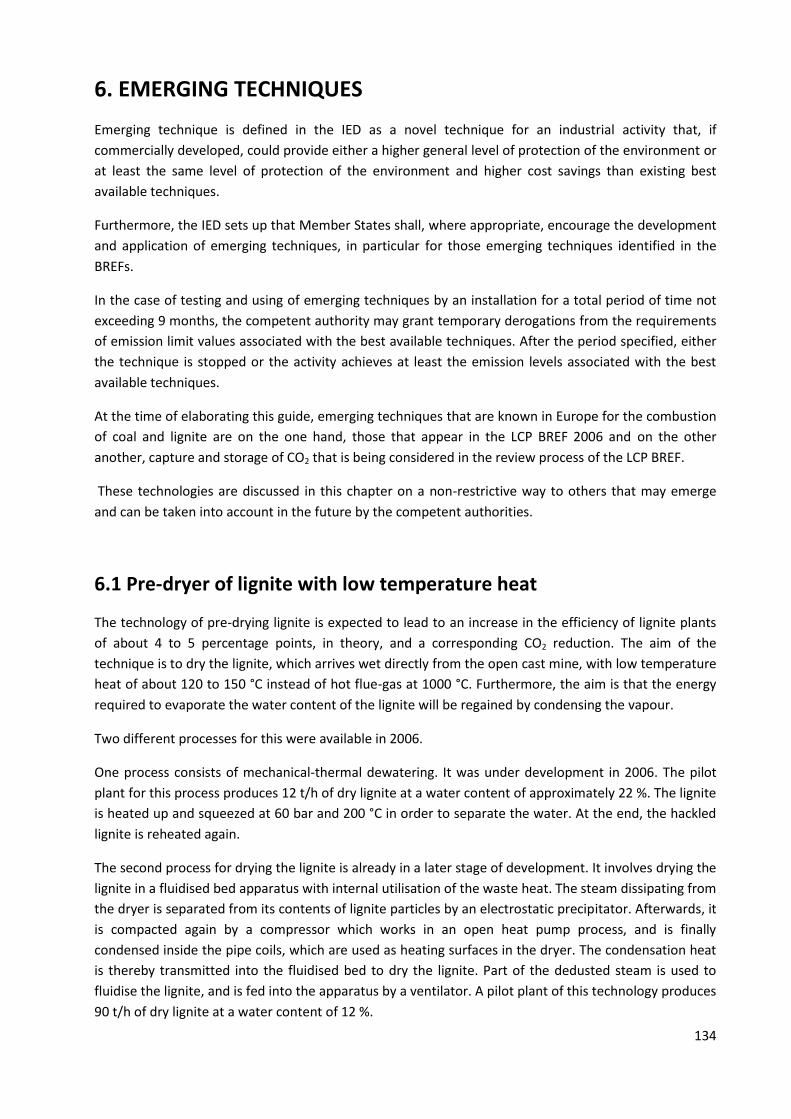
134
6. EMERGING TECHNIQUES
Emerging technique is defined in the IED as a novel technique for an industrial activity that, if
commercially developed, could provide either a higher general level of protection of the environment or
at least the same level of protection of the environment and higher cost savings than existing best
available techniques.
Furthermore, the IED sets up that Member States shall, where appropriate, encourage the development
and application of emerging techniques, in particular for those emerging techniques identified in the
BREFs.
In the case of testing and using of emerging techniques by an installation for a total period of time not
exceeding 9 months, the competent authority may grant temporary derogations from the requirements
of emission limit values associated with the best available techniques. After the period specified, either
the technique is stopped or the activity achieves at least the emission levels associated with the best
available techniques.
At the time of elaborating this guide, emerging techniques that are known in Europe for the combustion
of coal and lignite are on the one hand, those that appear in the LCP BREF 2006 and on the other
another, capture and storage of CO2 that is being considered in the review process of the LCP BREF.
These technologies are discussed in this chapter on a non-restrictive way to others that may emerge
and can be taken into account in the future by the competent authorities.
6.1 Pre-dryer of lignite with low temperature heat
The technology of pre-drying lignite is expected to lead to an increase in the efficiency of lignite plants
of about 4 to 5 percentage points, in theory, and a corresponding CO2 reduction. The aim of the
technique is to dry the lignite, which arrives wet directly from the open cast mine, with low temperature
heat of about 120 to 150 °C instead of hot flue-gas at 1000 °C. Furthermore, the aim is that the energy
required to evaporate the water content of the lignite will be regained by condensing the vapour.
Two different processes for this were available in 2006.
One process consists of mechanical-thermal dewatering. It was under development in 2006. The pilot
plant for this process produces 12 t/h of dry lignite at a water content of approximately 22 %. The lignite
is heated up and squeezed at 60 bar and 200 °C in order to separate the water. At the end, the hackled
lignite is reheated again.
The second process for drying the lignite is already in a later stage of development. It involves drying the
lignite in a fluidised bed apparatus with internal utilisation of the waste heat. The steam dissipating from
the dryer is separated from its contents of lignite particles by an electrostatic precipitator. Afterwards, it
is compacted again by a compressor which works in an open heat pump process, and is finally
condensed inside the pipe coils, which are used as heating surfaces in the dryer. The condensation heat
is thereby transmitted into the fluidised bed to dry the lignite. Part of the dedusted steam is used to
fluidise the lignite, and is fed into the apparatus by a ventilator. A pilot plant of this technology produces
90 t/h of dry lignite at a water content of 12 %.
135
Both processes are shown in the following figure.
Figure 6.1: Pilot plant for lignite drying
There is a commercial-scale pilot plant of pre-drying of lignite in a fluidized bed of high efficiency with
favourable final report dated May 2010.
The objective of this project is the demonstration of the operational viability of a commercial-scale
drying module and the dry lignite firing system. This step is aimed at making the pre-drying and dry
lignite-fired power plant technologies available for planning new power plants from 2010 on. The
efficient operation is dependent on the coal used. The main objective of the work undertaken by the
project partners is to investigate the potential application of pre-drying in their existing and newly
planned power plants.
6.2 Simultaneous control of SOX, NOX and mercury
The flue-gas treatment system simultaneously captures sulphur and nitrogen oxides, heavy metals, such
as mercury, from the burning of fossil fuels. This system is a post-combustion emission control system
with higher capture rates of more pollutants while producing saleable co-products.
The system is a gas-phase oxidation process to simultaneously capture up to 99 % of the nitrogen and
sulphur oxides as well as heavy metals (100 % of mercury). Capture rates of up 99 % SOx and 98 % NOx
were demonstrated at laboratory level over a wide range of temperatures found in flue-gases.
Engineering cost estimates for the construction of a full scale 500 MW power plant installation is 30 – 50
% lower in capital costs and with 1/6th operating costs compared to limestone/SCR. The main
applications are where fossil fuels, such as coal, are burned for the generation of electrical power. Other
applications are found with smelters, municipal incinerators, and industrial boilers.
136
The advantages of the system are:
- High simultaneous SOx and NOx capture rates to 99%. - Heavy metals such as mercury and other metallic species will be captured. - Produces saleable co-products. - Does not use limestone/lime. - Does not contribute to CO2 emissions. - Does not use catalysts to produce hazardous waste. - The reagent is recycled. - Uses proven co-product technologies. - It can be retrofitted on most plants. - Projected lower capital costs and lower operating costs than conventional technologies.
Currently there is a North American patented technology available for an integrated air pollution control
process that achieves major reductions in NOX, SO2, mercury, and fine particulate matter from coal-fired
power plants. This process produces a highly marketable fertilizer co-product, avoiding the landfill
disposal of flue gas desulfurization waste. Furthermore, this system uses less water because it requires
no wastewater treatment or disposal.
6.3 CO2 capture and storage (CCS)
The International Energy Agency (IEA) predicts an important increase of the energy consumption up to
2030. This matter together with economic and supply security matters make fossil fuel continues to be
important in the energy framework. However the use of coal has to adapt to the global warming
requirements. The technology is seen as crucial to reducing the impact of fossil fuels such as coal. One of
the most promising technologies to reduce global warming is CO2 capture and storage (CCS).
The science and technology behind CCS is already manifest, but has not yet been implemented with the
intention of reducing CO2 emissions on a large scale. Further developments regarding CO2 capture and
separation processes in particular will be needed if CCS is to be accepted as a fully fledged mitigation
solution for climate change. Costs will also need to be brought down if the technology is ever to be
deployed on a commercial scale.
In this line the European Union considers the construction of 12 industrial demonstration fossil fuel
plants provided with CO2 capture systems to come into service from 2015 as a part of the Climate and
Energy Package agreed in December 2008.
By 2020 the aim of reducing CO2 emissions in the EU is 20% compared to 1990. By 2020 the plant to be
built should be prepared to install capture systems ("Capture Ready") and storage of CO2 (CCS). And
after 2020 the fossil fuel plants will necessarily have CCS systems.
CCS involves the separation and capture of CO2 from the gases produced by Large Combustion Plants. It
also requires pressurization of the captured CO2, transportation to a given location (usually via existing
pipeline networks or shipped by trucks or ships), and injection into geological formations deep
underground or under the ocean bed (often depleted gas fields). Several different technologies, at
varying stages of development, may be considered for the CO2 separation and capture. Depending on
the plant's location, CO2 can sometimes be directly injected underground, without having to compress
137
and transport the gas to a suitable location. The CO2 is pumped straight underground, where it is
compressed by higher pressures and essentially becomes a liquid, which then becomes trapped in the
rock.
The aim of the CCS is to produce a concentrated CO2 stream that can be easily transported to safety
storage. There are different technologies for CCS: post combustion, pre combustion and during
combustion techniques.
Post combustion techniques where the CO2 is captured after the process of burning coal for electricity
production. It may be applied in existent and new plants.
CCS post combustion by chemical absorption consists in the separation of CO2 by means of amine
aqueous solution. It is commercially available but the costs are high, it has to treat a big amount of flue
gases and has difficulties of operation because some impurities appear in the gases. These kinds of
problems are overcome by CCS pre combustion technology that further more can produce hydrogen for
future applications.
The carbonation-calcination cycles are very interesting post combustion technique for existing
installations. The CO2 is separated from the combustion gases by means of a carbonation process. The
gases are put into contact with CaO in order to form CaCO3 at 600-700ªC and atmospheric pressure. This
is conceptually a simple process, but may be complicated in practice due to the following
considerations. The required temperature in the carbonation process should be controlled to give high
capture yields. The presence of SO2 in the flue gas makes a new exothermic reaction between CaO and
SO2 to give CaSO2. This requires careful with the temperature in the calcination unit, to avoid breaking
the CaSO2 that would contaminate the stream of CO2. Moreover the presence of CaSO2 imposes an extra
amount of solids that circulate in an inert way through the capture cycle. The working capacity of CaO is
not infinite and it is degraded gradually as carbonation-calcination cycles are being accumulated.
Consequently, it is necessary to introduce continuously a fresh stream of CaCO3 to the capture process
in order to replace the degraded CaO that is purged from the cycle. The dosages of fresh limestone must
take into account the formation of calcium sulphate in the carbonator. To achieve high collection
efficiencies it is required a compromise between the amounts of CaO that circulate in the process and
the amounts of CaCO3 that is replenished again in each cycle.
Pre combustion techniques look for obtaining a syntesis gas by a previous gasification of the coal or
lignite that produces CO2 and hydrogen after taking it to a reformer.
The coal and oxygen are mixed at a temperature sufficiently high but without causing the complete
combustion, and pyrolysis processes and devolatilization of the fuel are induced. The required oxygen is
obtained by a plant which separates the air. The output from the gasifier is a mixture of oxides of
sulphur, synthesis gas (mainly CO and H2) and particles which are separated at this stage. CO treated
with steam in a water-gas shift reactor is converted to CO2 and hydrogen, mainly, with small amount of
CO remaining. In that gas flow CO2 can be separated from hydrogen.
The principal advantage is the greater concentration of CO2 and lower amount of impurities in the gases
stream which allow using chemical or physical absorption of CO2 in a very efficient way. This technique is
close to the production of hydrogen and is used mainly in Integrated Gasification Combined Cycle (IGCC)
and combined cycled (CC). In Spain there is a commercial IGCC plant (Elcogas) that is working since
1998.
138
Oxycombustion involves the capture during the combustion using only oxygen as oxidiser instead of air.
This technique needs a plant to separate the oxygen from the air. The gases generated by the
oxycombustion are mainly CO2 and H2O that are easily separable. Some characteristic of this process are
high temperature in the boiler and greater heat transmission by radiation, low volume of bolier and heat
recuperation area, low NOx formation, possibility of corrosion in the boiler that involve a carefully
material selection and water net production by means of condensation of combustion gases. The basic
advantages of this technique are reasonable associated costs, the associated CO2 captured ton cost, and
flexibility and reliability in the operation that permit to assimilate to the existing installation. There are
two lines of development of this technique, one for circulating bed fluidised and the other for pulverized
coal. In both cases the recirculation of gases has been applied because it involves a better control of the
combustion temperature in the boiler (critical point of this technique). In the other hand it involves a
higher consumption of auxiliary materials, higher size of the boiler and thus an increase of the
investment and operation costs. The weak point of the oxycombustion yield is related to the high energy
consumption because of the plant for the air separation. The most efficient technology is applied in
circulating fluidised bed.
Regarding costs of the CCS technologies, pre combustion by gasification (IGCC) and the oxycombustion
are the cheapest. In the case of oxycombustion, the circulating fluidised bed has the lowest cost. The
CCS post combustion by carbonation-calcination cycle could have similar costs than circulating fluidised
bed.
According to CCS study of the Spanish Engineering Institute, the decrease of the efficiency in an
oxycombustion plant is about 10 points (45 to 35 %) in comparison with a conventional combustion
plant. The penalization of using IGCC is about 6 to 10 points. The penalization regarded to the KW
investment is about 500 Euros/KW installed. The specific investment depends on the type of fuel; it is
approximately 600 Euros/KW for lignite.
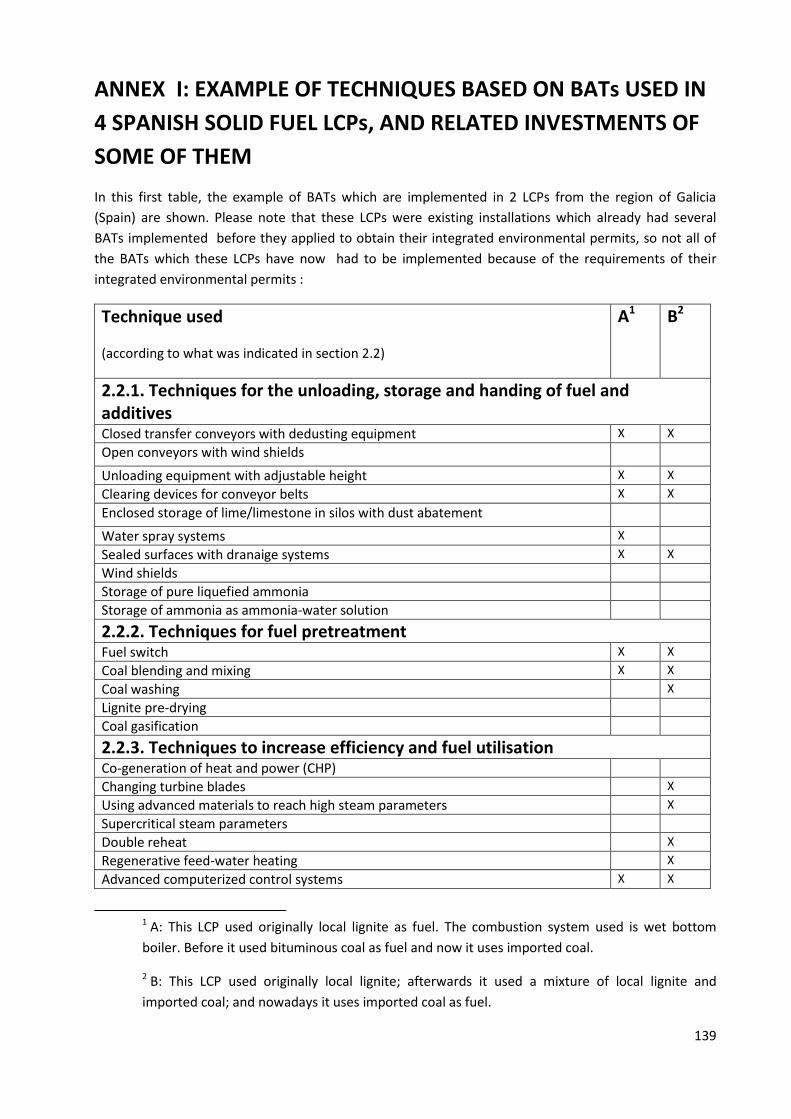
139
ANNEX I: EXAMPLE OF TECHNIQUES BASED ON BATs USED IN
4 SPANISH SOLID FUEL LCPs, AND RELATED INVESTMENTS OF
SOME OF THEM
In this first table, the example of BATs which are implemented in 2 LCPs from the region of Galicia
(Spain) are shown. Please note that these LCPs were existing installations which already had several
BATs implemented before they applied to obtain their integrated environmental permits, so not all of
the BATs which these LCPs have now had to be implemented because of the requirements of their
integrated environmental permits :
Technique used
(according to what was indicated in section 2.2)
A1 B2
2.2.1. Techniques for the unloading, storage and handing of fuel and additives Closed transfer conveyors with dedusting equipment X X Open conveyors with wind shields Unloading equipment with adjustable height X X Clearing devices for conveyor belts X X Enclosed storage of lime/limestone in silos with dust abatement Water spray systems X
Sealed surfaces with dranaige systems X X
Wind shields
Storage of pure liquefied ammonia
Storage of ammonia as ammonia-water solution
2.2.2. Techniques for fuel pretreatment
Fuel switch X X
Coal blending and mixing X X
Coal washing X
Lignite pre-drying
Coal gasification
2.2.3. Techniques to increase efficiency and fuel utilisation
Co-generation of heat and power (CHP)
Changing turbine blades X
Using advanced materials to reach high steam parameters X
Supercritical steam parameters
Double reheat X
Regenerative feed-water heating X
Advanced computerized control systems X X
1 A: This LCP used originally local lignite as fuel. The combustion system used is wet bottom
boiler. Before it used bituminous coal as fuel and now it uses imported coal.
2 B: This LCP used originally local lignite; afterwards it used a mixture of local lignite and
imported coal; and nowadays it uses imported coal as fuel.
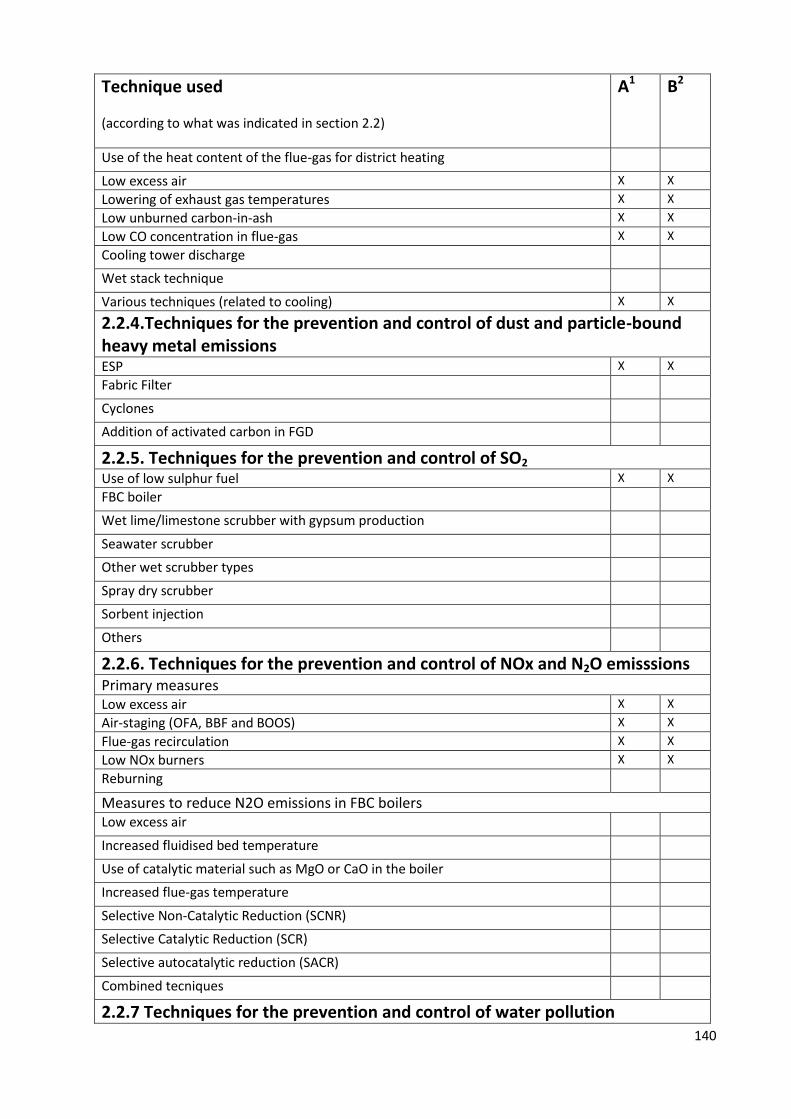
140
Technique used
(according to what was indicated in section 2.2)
A1 B2
Use of the heat content of the flue-gas for district heating Low excess air X X Lowering of exhaust gas temperatures X X Low unburned carbon-in-ash X X Low CO concentration in flue-gas X X Cooling tower discharge Wet stack technique Various techniques (related to cooling) X X
2.2.4.Techniques for the prevention and control of dust and particle-bound heavy metal emissions ESP X X Fabric Filter Cyclones Addition of activated carbon in FGD
2.2.5. Techniques for the prevention and control of SO2
Use of low sulphur fuel X X FBC boiler Wet lime/limestone scrubber with gypsum production Seawater scrubber Other wet scrubber types Spray dry scrubber Sorbent injection Others
2.2.6. Techniques for the prevention and control of NOx and N2O emisssions
Primary measures Low excess air X X Air-staging (OFA, BBF and BOOS) X X Flue-gas recirculation X X Low NOx burners X X Reburning Measures to reduce N2O emissions in FBC boilers Low excess air Increased fluidised bed temperature Use of catalytic material such as MgO or CaO in the boiler Increased flue-gas temperature Selective Non-Catalytic Reduction (SCNR) Selective Catalytic Reduction (SCR) Selective autocatalytic reduction (SACR) Combined tecniques 2.2.7 Techniques for the prevention and control of water pollution
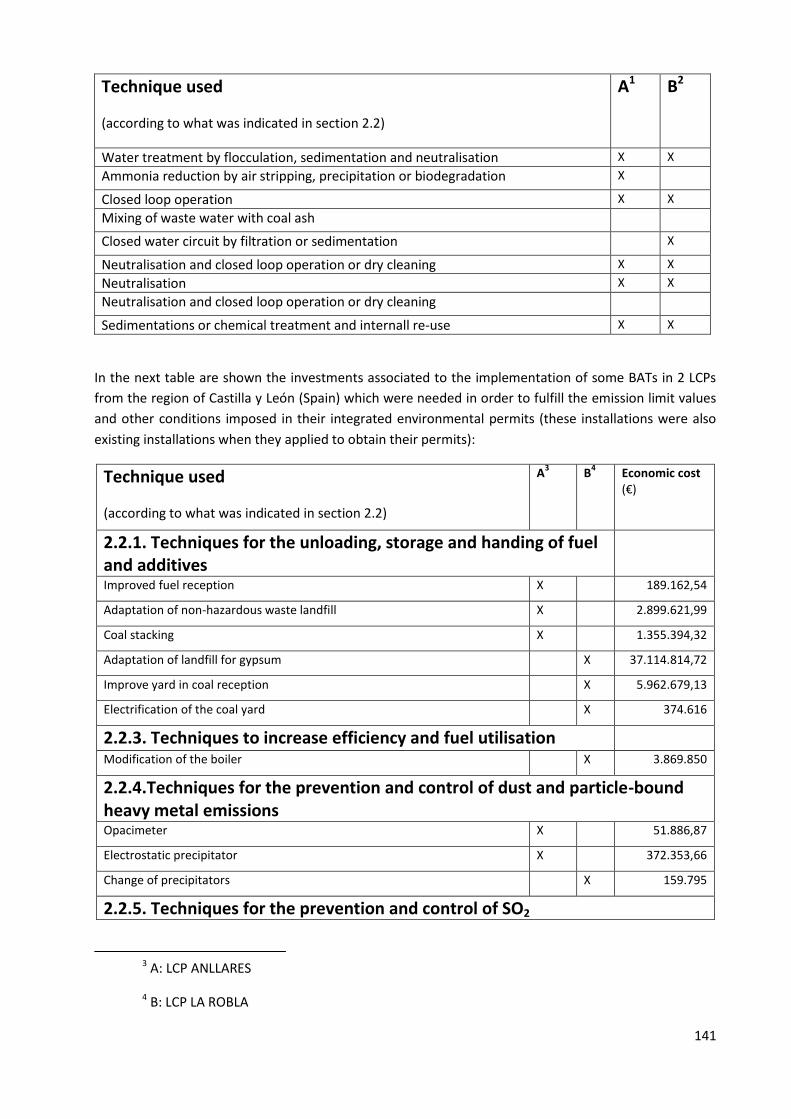
141
Technique used
(according to what was indicated in section 2.2)
A1 B2
Water treatment by flocculation, sedimentation and neutralisation X X Ammonia reduction by air stripping, precipitation or biodegradation X Closed loop operation X X Mixing of waste water with coal ash Closed water circuit by filtration or sedimentation X
Neutralisation and closed loop operation or dry cleaning X X Neutralisation X X Neutralisation and closed loop operation or dry cleaning Sedimentations or chemical treatment and internall re-use X X
In the next table are shown the investments associated to the implementation of some BATs in 2 LCPs
from the region of Castilla y León (Spain) which were needed in order to fulfill the emission limit values
and other conditions imposed in their integrated environmental permits (these installations were also
existing installations when they applied to obtain their permits):
Technique used
(according to what was indicated in section 2.2)
A3 B
4 Economic cost
(€)
2.2.1. Techniques for the unloading, storage and handing of fuel and additives
Improved fuel reception X 189.162,54
Adaptation of non-hazardous waste landfill X 2.899.621,99
Coal stacking X 1.355.394,32
Adaptation of landfill for gypsum X 37.114.814,72
Improve yard in coal reception X 5.962.679,13
Electrification of the coal yard X 374.616
2.2.3. Techniques to increase efficiency and fuel utilisation
Modification of the boiler X 3.869.850
2.2.4.Techniques for the prevention and control of dust and particle-bound heavy metal emissions Opacimeter X 51.886,87
Electrostatic precipitator X 372.353,66
Change of precipitators X 159.795
2.2.5. Techniques for the prevention and control of SO2
3 A: LCP ANLLARES
4 B: LCP LA ROBLA
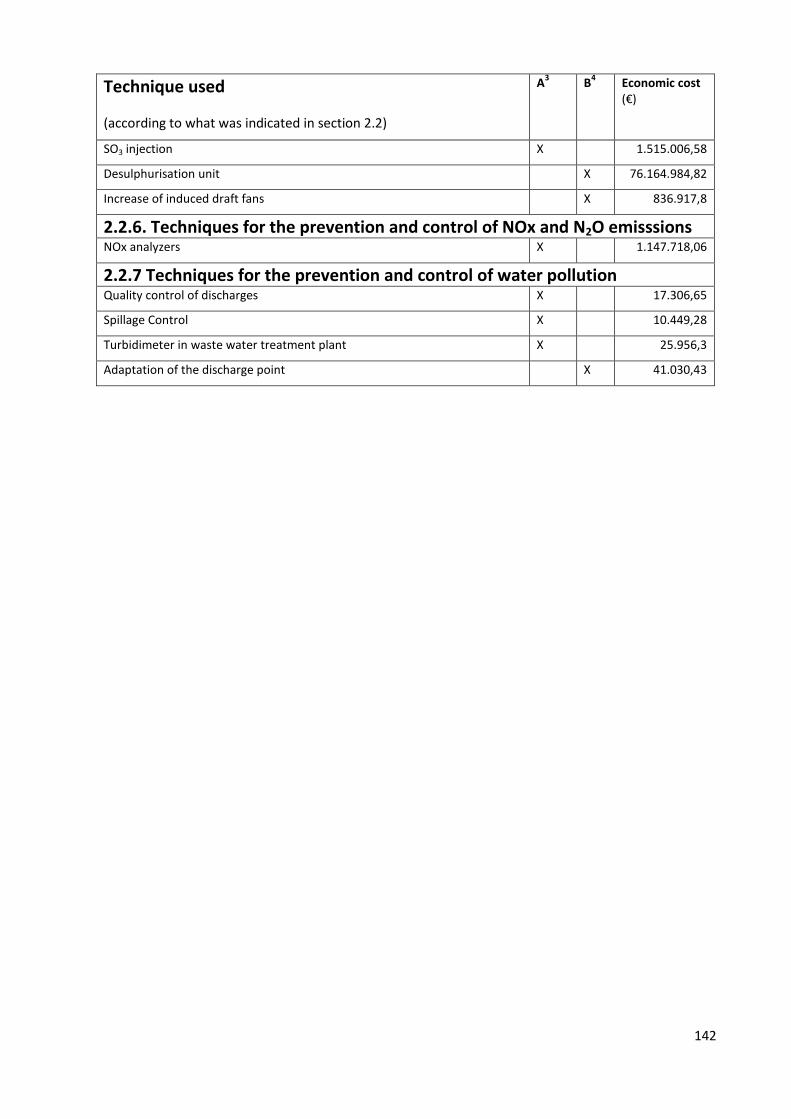
142
Technique used
(according to what was indicated in section 2.2)
A3 B
4 Economic cost
(€)
SO3 injection X 1.515.006,58
Desulphurisation unit X 76.164.984,82
Increase of induced draft fans X 836.917,8
2.2.6. Techniques for the prevention and control of NOx and N2O emisssions NOx analyzers X 1.147.718,06
2.2.7 Techniques for the prevention and control of water pollution Quality control of discharges X 17.306,65
Spillage Control X 10.449,28
Turbidimeter in waste water treatment plant X 25.956,3
Adaptation of the discharge point X 41.030,43
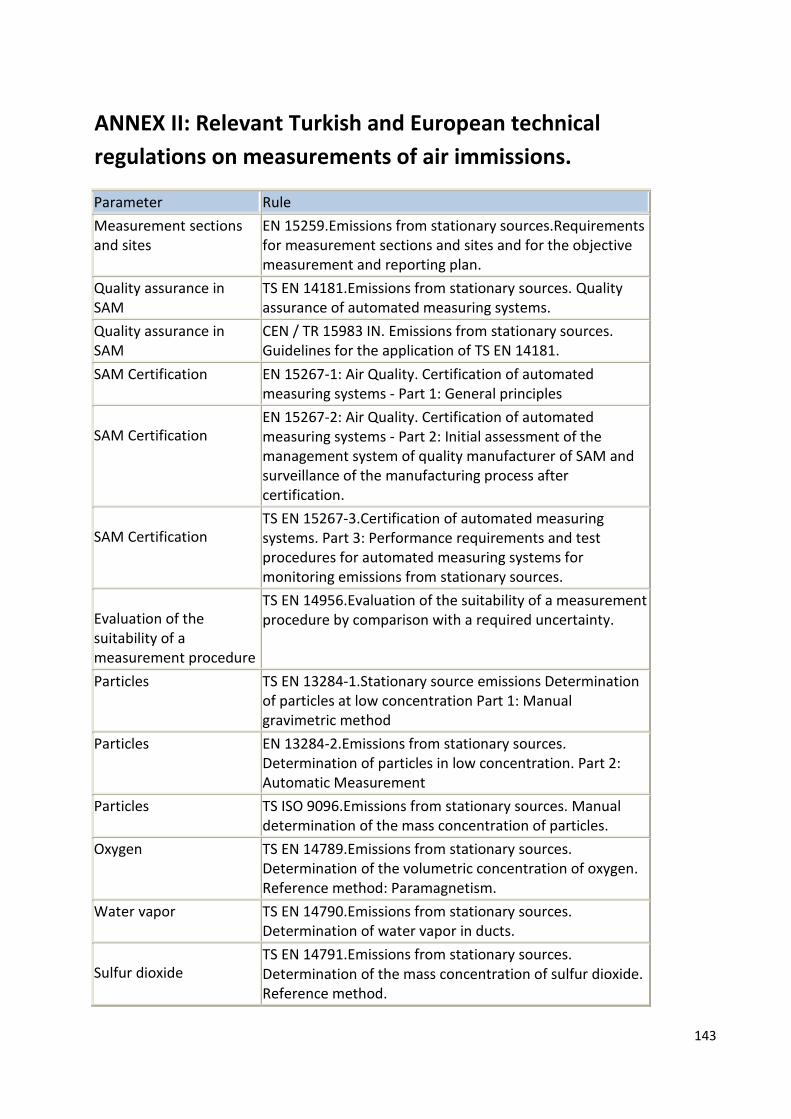
143
ANNEX II: Relevant Turkish and European technical
regulations on measurements of air immissions.
Parameter Rule
Measurement sections and sites
EN 15259.Emissions from stationary sources.Requirements for measurement sections and sites and for the objective measurement and reporting plan.
Quality assurance in SAM
TS EN 14181.Emissions from stationary sources. Quality assurance of automated measuring systems.
Quality assurance in SAM
CEN / TR 15983 IN. Emissions from stationary sources. Guidelines for the application of TS EN 14181.
SAM Certification EN 15267-1: Air Quality. Certification of automated measuring systems - Part 1: General principles
SAM Certification
EN 15267-2: Air Quality. Certification of automated measuring systems - Part 2: Initial assessment of the management system of quality manufacturer of SAM and surveillance of the manufacturing process after certification.
SAM Certification
TS EN 15267-3.Certification of automated measuring systems. Part 3: Performance requirements and test procedures for automated measuring systems for monitoring emissions from stationary sources.
Evaluation of the suitability of a measurement procedure
TS EN 14956.Evaluation of the suitability of a measurement procedure by comparison with a required uncertainty.
Particles TS EN 13284-1.Stationary source emissions Determination of particles at low concentration Part 1: Manual gravimetric method
Particles EN 13284-2.Emissions from stationary sources. Determination of particles in low concentration. Part 2: Automatic Measurement
Particles TS ISO 9096.Emissions from stationary sources. Manual determination of the mass concentration of particles.
Oxygen TS EN 14789.Emissions from stationary sources. Determination of the volumetric concentration of oxygen. Reference method: Paramagnetism.
Water vapor TS EN 14790.Emissions from stationary sources. Determination of water vapor in ducts.
Sulfur dioxide
TS EN 14791.Emissions from stationary sources. Determination of the mass concentration of sulfur dioxide. Reference method.
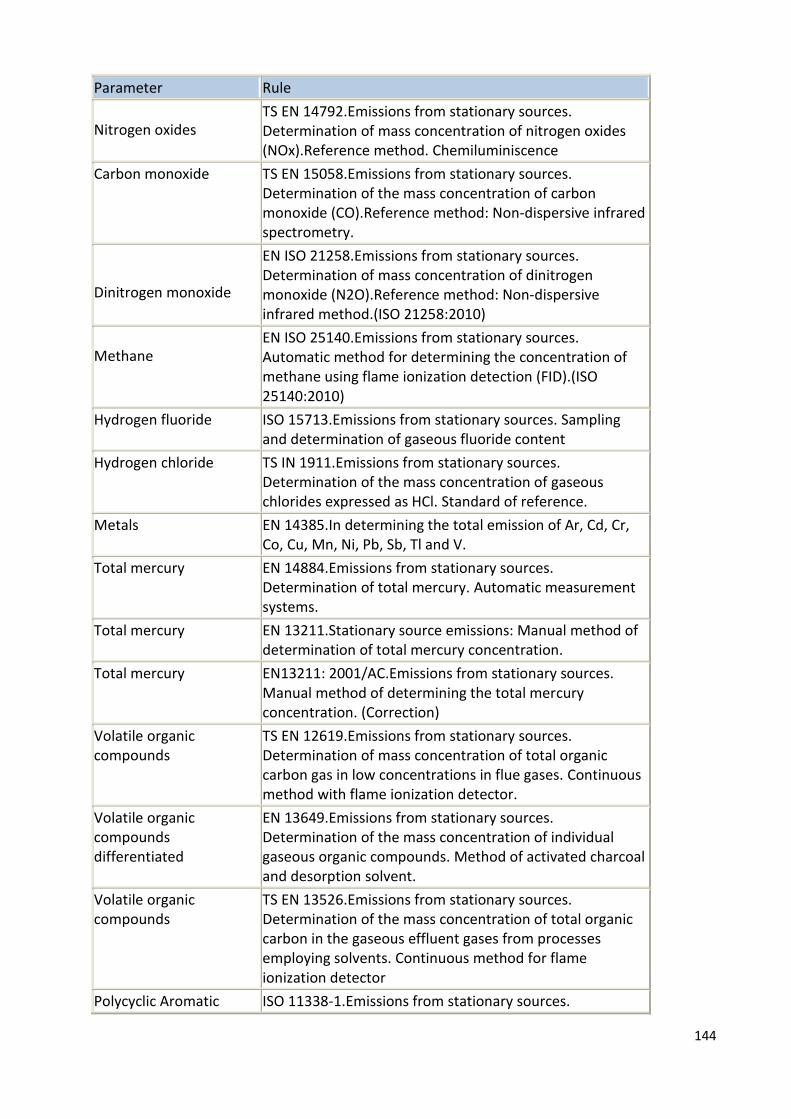
144
Parameter Rule
Nitrogen oxides TS EN 14792.Emissions from stationary sources. Determination of mass concentration of nitrogen oxides (NOx).Reference method. Chemiluminiscence
Carbon monoxide TS EN 15058.Emissions from stationary sources. Determination of the mass concentration of carbon monoxide (CO).Reference method: Non-dispersive infrared spectrometry.
Dinitrogen monoxide
EN ISO 21258.Emissions from stationary sources. Determination of mass concentration of dinitrogen monoxide (N2O).Reference method: Non-dispersive infrared method.(ISO 21258:2010)
Methane
EN ISO 25140.Emissions from stationary sources. Automatic method for determining the concentration of methane using flame ionization detection (FID).(ISO 25140:2010)
Hydrogen fluoride ISO 15713.Emissions from stationary sources. Sampling and determination of gaseous fluoride content
Hydrogen chloride TS IN 1911.Emissions from stationary sources. Determination of the mass concentration of gaseous chlorides expressed as HCl. Standard of reference.
Metals EN 14385.In determining the total emission of Ar, Cd, Cr, Co, Cu, Mn, Ni, Pb, Sb, Tl and V.
Total mercury EN 14884.Emissions from stationary sources. Determination of total mercury. Automatic measurement systems.
Total mercury EN 13211.Stationary source emissions: Manual method of determination of total mercury concentration.
Total mercury EN13211: 2001/AC.Emissions from stationary sources. Manual method of determining the total mercury concentration. (Correction)
Volatile organic compounds
TS EN 12619.Emissions from stationary sources. Determination of mass concentration of total organic carbon gas in low concentrations in flue gases. Continuous method with flame ionization detector.
Volatile organic compounds differentiated
EN 13649.Emissions from stationary sources. Determination of the mass concentration of individual gaseous organic compounds. Method of activated charcoal and desorption solvent.
Volatile organic compounds
TS EN 13526.Emissions from stationary sources. Determination of the mass concentration of total organic carbon in the gaseous effluent gases from processes employing solvents. Continuous method for flame ionization detector
Polycyclic Aromatic ISO 11338-1.Emissions from stationary sources.
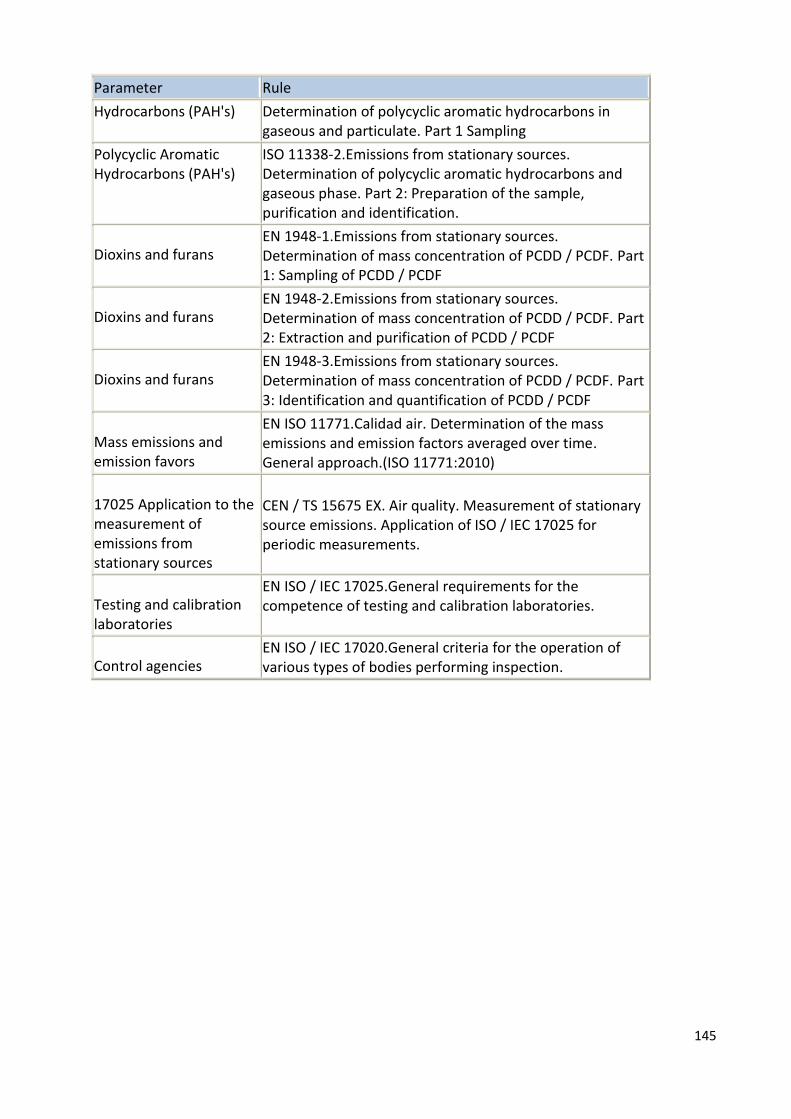
145
Parameter Rule
Hydrocarbons (PAH's) Determination of polycyclic aromatic hydrocarbons in gaseous and particulate. Part 1 Sampling
Polycyclic Aromatic Hydrocarbons (PAH's)
ISO 11338-2.Emissions from stationary sources. Determination of polycyclic aromatic hydrocarbons and gaseous phase. Part 2: Preparation of the sample, purification and identification.
Dioxins and furans
EN 1948-1.Emissions from stationary sources. Determination of mass concentration of PCDD / PCDF. Part 1: Sampling of PCDD / PCDF
Dioxins and furans
EN 1948-2.Emissions from stationary sources. Determination of mass concentration of PCDD / PCDF. Part 2: Extraction and purification of PCDD / PCDF
Dioxins and furans
EN 1948-3.Emissions from stationary sources. Determination of mass concentration of PCDD / PCDF. Part 3: Identification and quantification of PCDD / PCDF
Mass emissions and emission favors
EN ISO 11771.Calidad air. Determination of the mass emissions and emission factors averaged over time. General approach.(ISO 11771:2010)
17025 Application to the measurement of emissions from stationary sources
CEN / TS 15675 EX. Air quality. Measurement of stationary source emissions. Application of ISO / IEC 17025 for periodic measurements.
Testing and calibration laboratories
EN ISO / IEC 17025.General requirements for the competence of testing and calibration laboratories.
Control agencies
EN ISO / IEC 17020.General criteria for the operation of various types of bodies performing inspection.

146
ANNEX III. CHECK-LISTS TO BE USED IN THE ASSESSMENT OF
THE PERMIT APPLICATION
CONTENTS OF THE PERMIT APPLICATION FILE
DESCRIPTION CHECK
Owner of the company
Name of the company 1
Full address 2
VAT number 3
Main activity 4
Operator (if is different from the owner)
Name of the company 5
Data of the contact person (in each work centre) 6
Full address 7
VAT number 8
Main activity 9
Description of the installation and technical characteristics
Number of work centres 10
PR
OJE
CT
RE
PO
RT
Register number of industrial establishments 11
National Classification of Economic Activities (NACE) 12
Total number of workers 13
Investments targeted to environmental improvements.
14
Organization chart 15
UTM coordinates 16
Activity of Annex I of the By Law 17
Main activity and others 18
Nominal production/treatment capacity and size 19
Planned date for commencing and completion of building activities (for new installations)
20
Planned date for starting operation (for new installations)
21
Operational time of the installation 22
Description of the production process
Production process description, with a schematic flow chart divided into phases.
23
Description of the phases 24
Operational hours in each phase 25
The methods of operation (continuous or discontinuous)
26
Description of the equipment and the techniques used, specifying which of them are considered as
Best Available Techniques (BAT) 27
Detailed description of the natural resources, raw and
auxiliary materials and products
Energy consumption: use of fuel for heat and steam generation and for transport inside the enterprise not
including use of fuel for production of electricity or combined power and heat, use of heat and steam
from external suppliers, use of electricity, use of fuel for production of electricity and heat -power plants and boiler houses. Measures to increase energy
efficiency.
28
Water: quantity of water used in the process, intake of surface, ground and marine water –detailed
description of intake, and indication of the cases of supply of water from outside or re-circulated
29
Raw materials: list and quantities of raw materials, indicating hazardous or non-hazardous character
30
Auxiliary materials: list and quantities of auxiliary materials, indicating hazardous or non-hazardous character
31
Products and by-products: list of output products and by-products, types and quantity generated of each of them, per hour, day or year.
32
Air quality
Modelization requirements 33
Plan for monitoring of immisions 34
Description of the emission points 35
Requirements and technical conditions of the focus 36
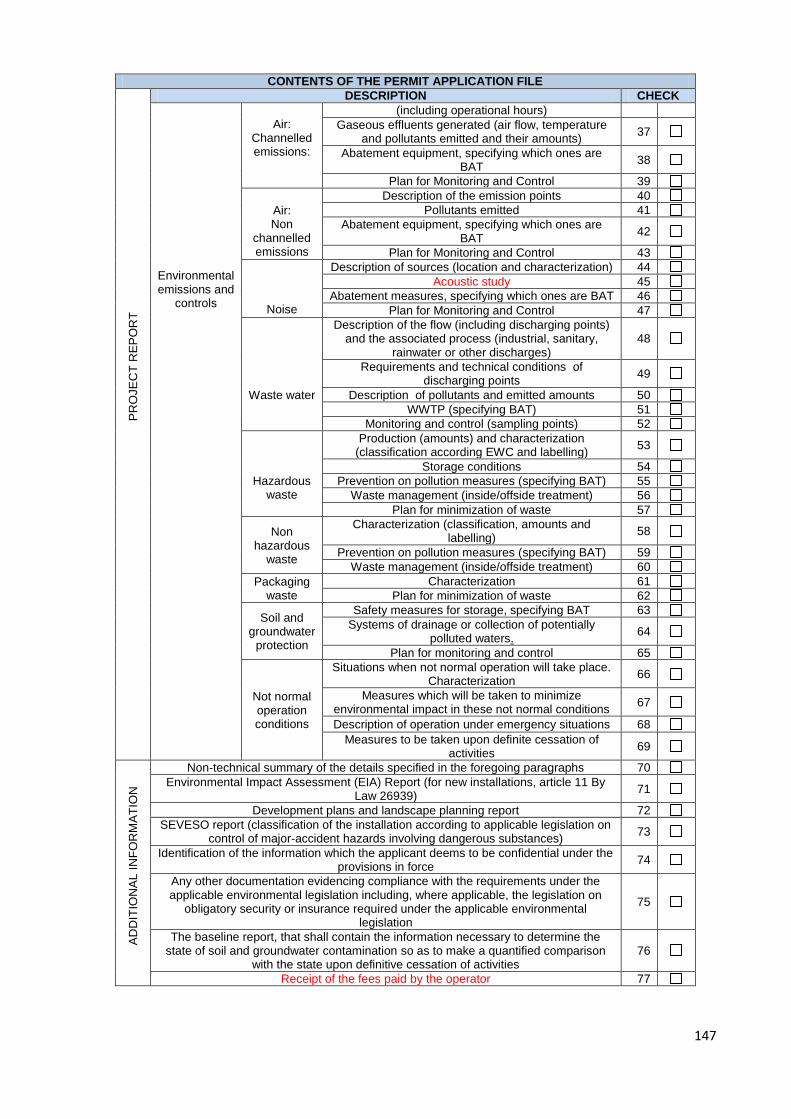
147
CONTENTS OF THE PERMIT APPLICATION FILE
DESCRIPTION CHECK
Environmental emissions and
controls
Air:
Channelled emissions:
(including operational hours)
Gaseous effluents generated (air flow, temperature
and pollutants emitted and their amounts) 37
Abatement equipment, specifying which ones are
BAT 38
Plan for Monitoring and Control 39
Air: Non
channelled emissions
Description of the emission points 40
Pollutants emitted 41
Abatement equipment, specifying which ones are
BAT 42
PR
OJE
CT
RE
PO
RT
Plan for Monitoring and Control 43
Noise
Description of sources (location and characterization) 44
Acoustic study 45
Abatement measures, specifying which ones are BAT 46
Plan for Monitoring and Control 47
Waste water
Description of the flow (including discharging points) and the associated process (industrial, sanitary,
rainwater or other discharges) 48
Requirements and technical conditions of discharging points
49
Description of pollutants and emitted amounts 50
WWTP (specifying BAT) 51
Monitoring and control (sampling points) 52
Hazardous waste
Production (amounts) and characterization (classification according EWC and labelling)
53
Storage conditions 54
Prevention on pollution measures (specifying BAT) 55
Waste management (inside/offside treatment) 56
Plan for minimization of waste 57
Non hazardous
waste
Characterization (classification, amounts and labelling)
58
Prevention on pollution measures (specifying BAT) 59
Waste management (inside/offside treatment) 60
Packaging waste
Characterization 61
Plan for minimization of waste 62
Soil and
groundwater protection
Safety measures for storage, specifying BAT 63
Systems of drainage or collection of potentially polluted waters.
64
Plan for monitoring and control 65
Not normal operation conditions
Situations when not normal operation will take place. Characterization
66
Measures which will be taken to minimize environmental impact in these not normal conditions
67
Description of operation under emergency situations 68
Measures to be taken upon definite cessation of activities
69
AD
DIT
ION
AL
IN
FO
RM
AT
ION
Non-technical summary of the details specified in the foregoing paragraphs 70
Environmental Impact Assessment (EIA) Report (for new installations, article 11 By Law 26939)
71
Development plans and landscape planning report 72
SEVESO report (classification of the installation according to applicable legislation on control of major-accident hazards involving dangerous substances)
73
Identification of the information which the applicant deems to be confidential under the provisions in force
74
Any other documentation evidencing compliance with the requirements under the applicable environmental legislation including, where applicable, the legislation on
obligatory security or insurance required under the applicable environmental legislation
75
The baseline report, that shall contain the information necessary to determine the state of soil and groundwater contamination so as to make a quantified comparison
with the state upon definitive cessation of activities 76
Receipt of the fees paid by the operator 77
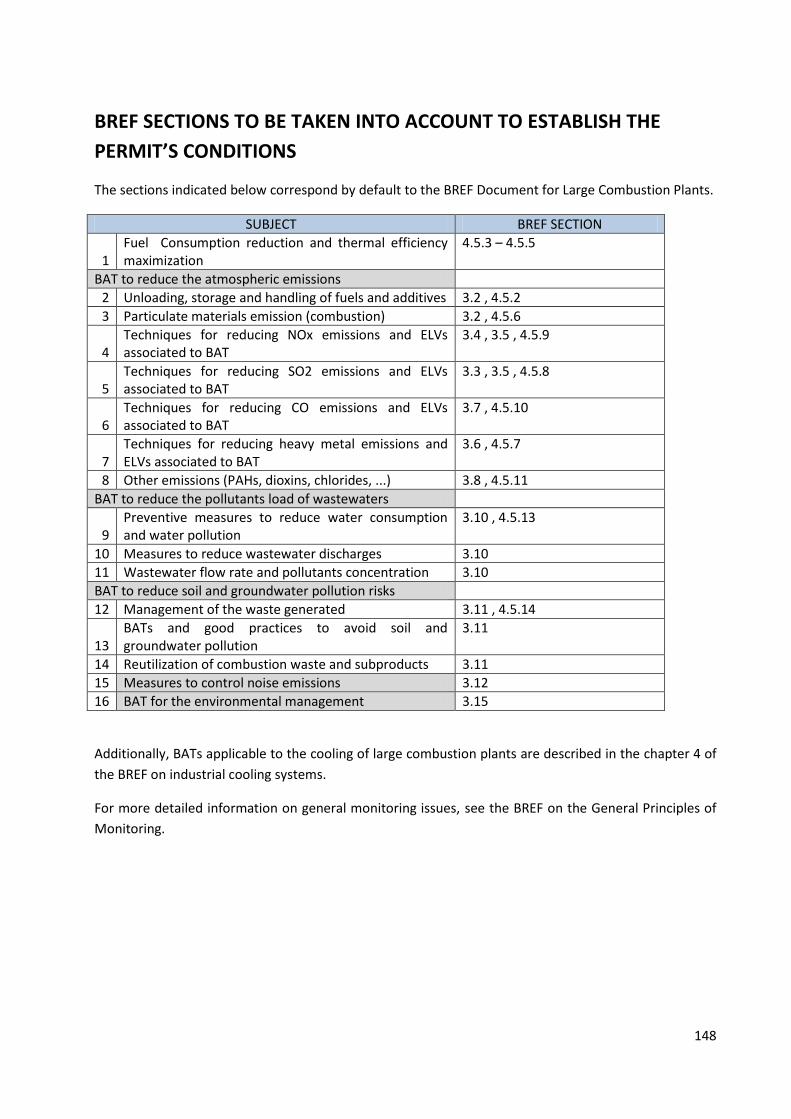
148
BREF SECTIONS TO BE TAKEN INTO ACCOUNT TO ESTABLISH THE
PERMIT’S CONDITIONS
The sections indicated below correspond by default to the BREF Document for Large Combustion Plants.
SUBJECT BREF SECTION
1 Fuel Consumption reduction and thermal efficiency maximization
4.5.3 – 4.5.5
BAT to reduce the atmospheric emissions
2 Unloading, storage and handling of fuels and additives 3.2 , 4.5.2
3 Particulate materials emission (combustion) 3.2 , 4.5.6
4 Techniques for reducing NOx emissions and ELVs associated to BAT
3.4 , 3.5 , 4.5.9
5 Techniques for reducing SO2 emissions and ELVs associated to BAT
3.3 , 3.5 , 4.5.8
6 Techniques for reducing CO emissions and ELVs associated to BAT
3.7 , 4.5.10
7 Techniques for reducing heavy metal emissions and ELVs associated to BAT
3.6 , 4.5.7
8 Other emissions (PAHs, dioxins, chlorides, ...) 3.8 , 4.5.11
BAT to reduce the pollutants load of wastewaters
9 Preventive measures to reduce water consumption and water pollution
3.10 , 4.5.13
10 Measures to reduce wastewater discharges 3.10
11 Wastewater flow rate and pollutants concentration 3.10
BAT to reduce soil and groundwater pollution risks
12 Management of the waste generated 3.11 , 4.5.14
13 BATs and good practices to avoid soil and groundwater pollution
3.11
14 Reutilization of combustion waste and subproducts 3.11
15 Measures to control noise emissions 3.12
16 BAT for the environmental management 3.15
Additionally, BATs applicable to the cooling of large combustion plants are described in the chapter 4 of
the BREF on industrial cooling systems.
For more detailed information on general monitoring issues, see the BREF on the General Principles of
Monitoring.
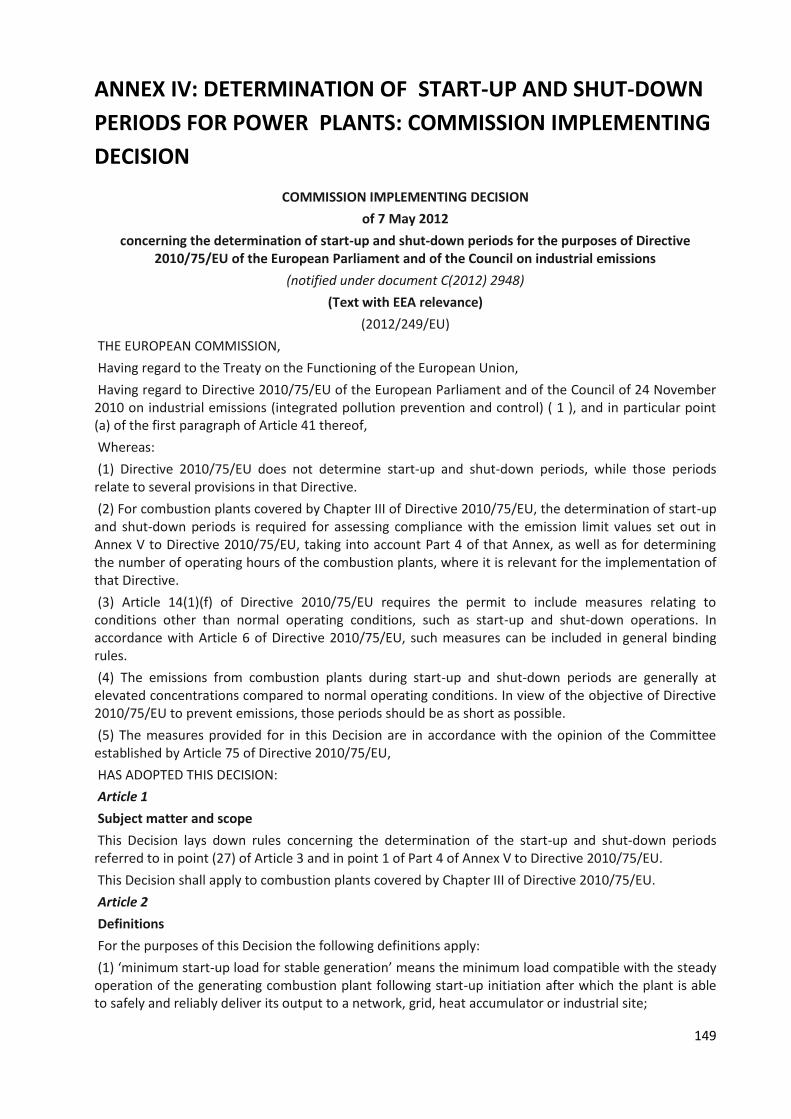
149
ANNEX IV: DETERMINATION OF START-UP AND SHUT-DOWN
PERIODS FOR POWER PLANTS: COMMISSION IMPLEMENTING
DECISION
COMMISSION IMPLEMENTING DECISION
of 7 May 2012
concerning the determination of start-up and shut-down periods for the purposes of Directive 2010/75/EU of the European Parliament and of the Council on industrial emissions
(notified under document C(2012) 2948)
(Text with EEA relevance)
(2012/249/EU)
THE EUROPEAN COMMISSION,
Having regard to the Treaty on the Functioning of the European Union,
Having regard to Directive 2010/75/EU of the European Parliament and of the Council of 24 November 2010 on industrial emissions (integrated pollution prevention and control) ( 1 ), and in particular point (a) of the first paragraph of Article 41 thereof,
Whereas:
(1) Directive 2010/75/EU does not determine start-up and shut-down periods, while those periods relate to several provisions in that Directive.
(2) For combustion plants covered by Chapter III of Directive 2010/75/EU, the determination of start-up and shut-down periods is required for assessing compliance with the emission limit values set out in Annex V to Directive 2010/75/EU, taking into account Part 4 of that Annex, as well as for determining the number of operating hours of the combustion plants, where it is relevant for the implementation of that Directive.
(3) Article 14(1)(f) of Directive 2010/75/EU requires the permit to include measures relating to conditions other than normal operating conditions, such as start-up and shut-down operations. In accordance with Article 6 of Directive 2010/75/EU, such measures can be included in general binding rules.
(4) The emissions from combustion plants during start-up and shut-down periods are generally at elevated concentrations compared to normal operating conditions. In view of the objective of Directive 2010/75/EU to prevent emissions, those periods should be as short as possible.
(5) The measures provided for in this Decision are in accordance with the opinion of the Committee established by Article 75 of Directive 2010/75/EU,
HAS ADOPTED THIS DECISION:
Article 1
Subject matter and scope
This Decision lays down rules concerning the determination of the start-up and shut-down periods referred to in point (27) of Article 3 and in point 1 of Part 4 of Annex V to Directive 2010/75/EU.
This Decision shall apply to combustion plants covered by Chapter III of Directive 2010/75/EU.
Article 2
Definitions
For the purposes of this Decision the following definitions apply:
(1) ‘minimum start-up load for stable generation’ means the minimum load compatible with the steady operation of the generating combustion plant following start-up initiation after which the plant is able to safely and reliably deliver its output to a network, grid, heat accumulator or industrial site;
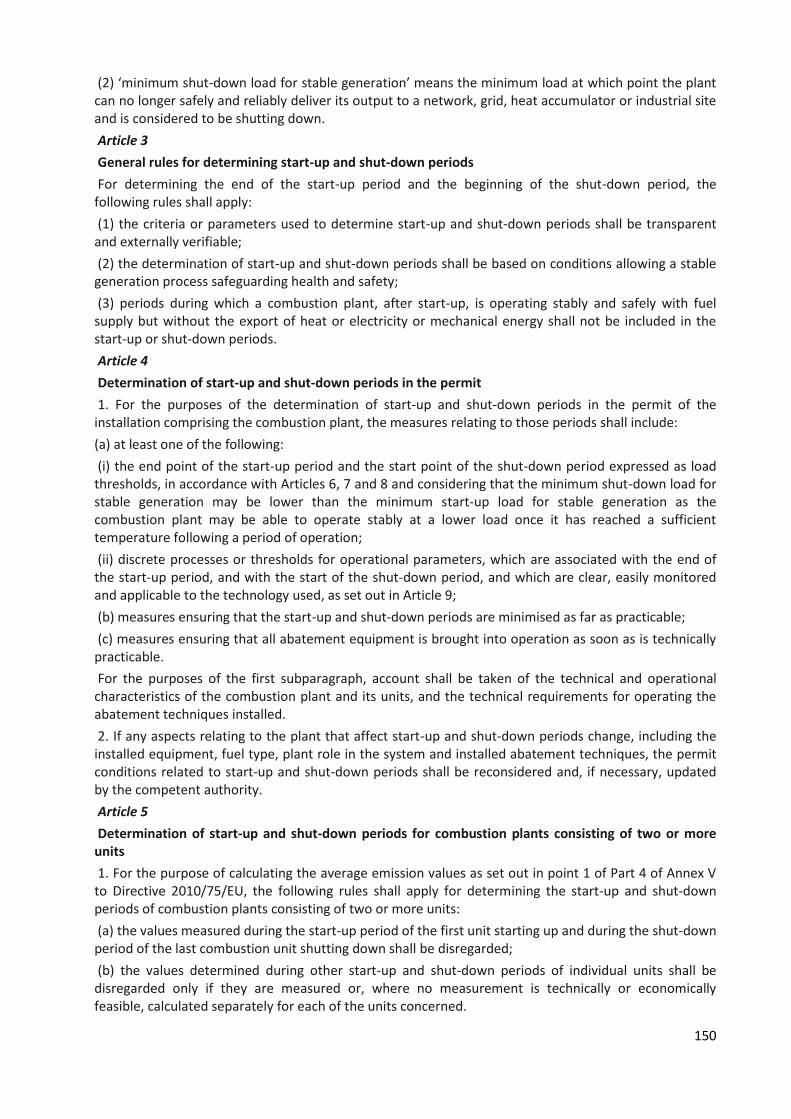
150
(2) ‘minimum shut-down load for stable generation’ means the minimum load at which point the plant can no longer safely and reliably deliver its output to a network, grid, heat accumulator or industrial site and is considered to be shutting down.
Article 3
General rules for determining start-up and shut-down periods
For determining the end of the start-up period and the beginning of the shut-down period, the following rules shall apply:
(1) the criteria or parameters used to determine start-up and shut-down periods shall be transparent and externally verifiable;
(2) the determination of start-up and shut-down periods shall be based on conditions allowing a stable generation process safeguarding health and safety;
(3) periods during which a combustion plant, after start-up, is operating stably and safely with fuel supply but without the export of heat or electricity or mechanical energy shall not be included in the start-up or shut-down periods.
Article 4
Determination of start-up and shut-down periods in the permit
1. For the purposes of the determination of start-up and shut-down periods in the permit of the installation comprising the combustion plant, the measures relating to those periods shall include:
(a) at least one of the following:
(i) the end point of the start-up period and the start point of the shut-down period expressed as load thresholds, in accordance with Articles 6, 7 and 8 and considering that the minimum shut-down load for stable generation may be lower than the minimum start-up load for stable generation as the combustion plant may be able to operate stably at a lower load once it has reached a sufficient temperature following a period of operation;
(ii) discrete processes or thresholds for operational parameters, which are associated with the end of the start-up period, and with the start of the shut-down period, and which are clear, easily monitored and applicable to the technology used, as set out in Article 9;
(b) measures ensuring that the start-up and shut-down periods are minimised as far as practicable;
(c) measures ensuring that all abatement equipment is brought into operation as soon as is technically practicable.
For the purposes of the first subparagraph, account shall be taken of the technical and operational characteristics of the combustion plant and its units, and the technical requirements for operating the abatement techniques installed.
2. If any aspects relating to the plant that affect start-up and shut-down periods change, including the installed equipment, fuel type, plant role in the system and installed abatement techniques, the permit conditions related to start-up and shut-down periods shall be reconsidered and, if necessary, updated by the competent authority.
Article 5
Determination of start-up and shut-down periods for combustion plants consisting of two or more units
1. For the purpose of calculating the average emission values as set out in point 1 of Part 4 of Annex V to Directive 2010/75/EU, the following rules shall apply for determining the start-up and shut-down periods of combustion plants consisting of two or more units:
(a) the values measured during the start-up period of the first unit starting up and during the shut-down period of the last combustion unit shutting down shall be disregarded;
(b) the values determined during other start-up and shut-down periods of individual units shall be disregarded only if they are measured or, where no measurement is technically or economically feasible, calculated separately for each of the units concerned.
151
2. The start-up and shut-down periods of combustion plants consisting of two or more units shall only consist of the start-up period of the first combustion unit starting up and the shut-down period of the last combustion unit shutting down.
For combustion plants for which points 2, 4 and 6 of Part 1 of Annex V to Directive 2010/75/EU allow the application of an emission limit value to part of the plant discharging its waste gases through one or more separate flues within a common stack, the start-up and shut-down periods may be determined for each of those parts of the combustion plant separately. The start-up and shut-down periods for a part of the plant shall then consist of the start-up period of the first combustion unit starting up within that part of the plant and the shut-down period of the last combustion unit shutting down within that part of the plant.
Article 6
Determination of start-up and shut-down periods for combustion plants generating electricity or delivering power for mechanical drive using load thresholds
1. For combustion plants generating electricity and for combustion plants for mechanical drive, the start-up period shall be considered to end at the point when the plant reaches the minimum start-up load for stable generation.
2. The shut-down period shall be considered to begin at the initiation of termination of fuel supply after reaching the point of the minimum shut-down load for stable generation from where on generated electricity is no longer available for the grid or generated mechanical power is no longer useful for the mechanical load.
3. The load thresholds to be used for determining the end of the start-up period and the start of the shut-down period for electricity generating combustion plants and to be included in the plant’s permit shall be a fixed percentage of the rated electrical output of the combustion plant.
4. The load thresholds to be used for determining the end of the start-up period and the start of the shut-down period for combustion plant for mechanical drive and to be included in the plant’s permit shall be a fixed percentage of the mechanical power output of the combustion plant.
Article 7
Determination of start-up and shut-down periods for heat generating combustion plants using load thresholds
1. For heat-generating combustion plants, the start-up period shall be considered to end when the plant reaches the minimum start-up load for stable generation and heat can be safely and reliably delivered to a distributing network, to a heat accumulator or used directly on a local industrial site.
2. The shut-down period shall be considered to begin after reaching the minimum shut-down load for stable generation when heat can no longer be safely and reliably delivered to a network or used directly on a local industrial site.
3. The load thresholds to be used for determining the end of the start-up period and the beginning of the shut-down period for heat generating combustion plants and to be included in the plant’s permit shall be a fixed percentage of the rated thermal output of the combustion plant.
4. Periods in which heat-generating plants are heating up an accumulator or reservoir without exporting heat shall be considered as operating hours and not as start-up or shut- down periods.
Article 8
Determination of start-up and shut-down periods for combustion plants generating heat and electricity using load thresholds
For combustion plants generating electricity and heat, the start-up and shut-down periods shall be determined as set out in Articles 6 and 7, taking into account both the electricity and heat generated.
Article 9
Determination of start-up and shut-down periods using operational parameters or discrete processes
For determining the minimum start-up load and the minimum shut-down load for stable generation, at least three criteria shall be defined, with the end of start-up or start of shut-down periods reached when

152
at least two of the criteria have been met.
These criteria shall be chosen from the following:
(1) discrete processes set out in the Annex or equivalent processes that suit the technical characteristics of the plant;
(2) thresholds for the operational parameters set out in the Annex, or equivalent operational parameters that suit the technical characteristics of the plant.
Article 10
This Decision is addressed to the Member States.
Done at Brussels, 7 May 2012.
For the Commission
Janez POTOČNIK
Member of the Commission
ANNEX
DISCRETE PROCESSES AND OPERATIONAL PARAMETERS ASSOCIATED WITH START-UP AND SHUT-DOWN PERIODS
1. Discrete processes associated with the minimum start-up load for stable generation
1.1. For solid fuel-fired boilers: complete transition from using the stability auxiliary burners or supplementary burners to operating with normal fuel only.
1.2. For liquid fuel-fired boilers: start of the main fuel feed pump and when burner oil pressure stabilises, and for which fuel flow rate may be used as an indicator.
1.3. For gas turbines: point where the combustion mode switches to fully premixed steady state combustion mode, or ‘idle speed’.
2. Operational parameters
2.1. Oxygen content of the flue gases.
2.2. Flue gas temperature.
2.3. Steam pressure.
2.4. For heat producing plants: enthalpy and heat transfer fluid rate.
2.5. For liquid and gas fired plants: fuel flow rate, specified as a percentage of the rated fuel flow capacity.
2.6. For steam boiler plants: temperature of steam at the exit of the boiler.
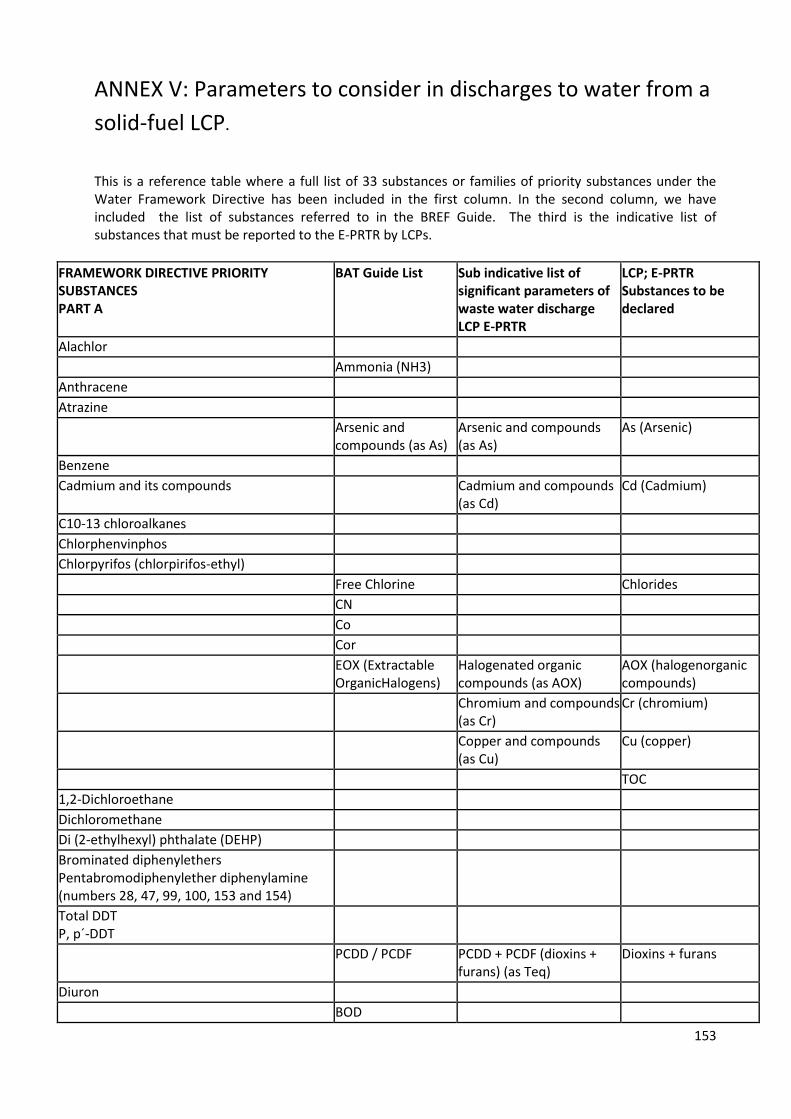
153
ANNEX V: Parameters to consider in discharges to water from a
solid-fuel LCP.
This is a reference table where a full list of 33 substances or families of priority substances under the Water Framework Directive has been included in the first column. In the second column, we have included the list of substances referred to in the BREF Guide. The third is the indicative list of substances that must be reported to the E-PRTR by LCPs.
FRAMEWORK DIRECTIVE PRIORITY SUBSTANCES PART A
BAT Guide List Sub indicative list of significant parameters of waste water discharge LCP E-PRTR
LCP; E-PRTR Substances to be declared
Alachlor
Ammonia (NH3)
Anthracene
Atrazine
Arsenic and compounds (as As)
Arsenic and compounds (as As)
As (Arsenic)
Benzene
Cadmium and its compounds Cadmium and compounds (as Cd)
Cd (Cadmium)
C10-13 chloroalkanes
Chlorphenvinphos
Chlorpyrifos (chlorpirifos-ethyl)
Free Chlorine Chlorides
CN
Co
Cor
EOX (Extractable OrganicHalogens)
Halogenated organic compounds (as AOX)
AOX (halogenorganic compounds)
Chromium and compounds (as Cr)
Cr (chromium)
Copper and compounds (as Cu)
Cu (copper)
TOC
1,2-Dichloroethane
Dichloromethane
Di (2-ethylhexyl) phthalate (DEHP)
Brominated diphenylethers Pentabromodiphenylether diphenylamine (numbers 28, 47, 99, 100, 153 and 154)
Total DDT P, p´-DDT
PCDD / PCDF PCDD + PCDF (dioxins + furans) (as Teq)
Dioxins + furans
Diuron
BOD
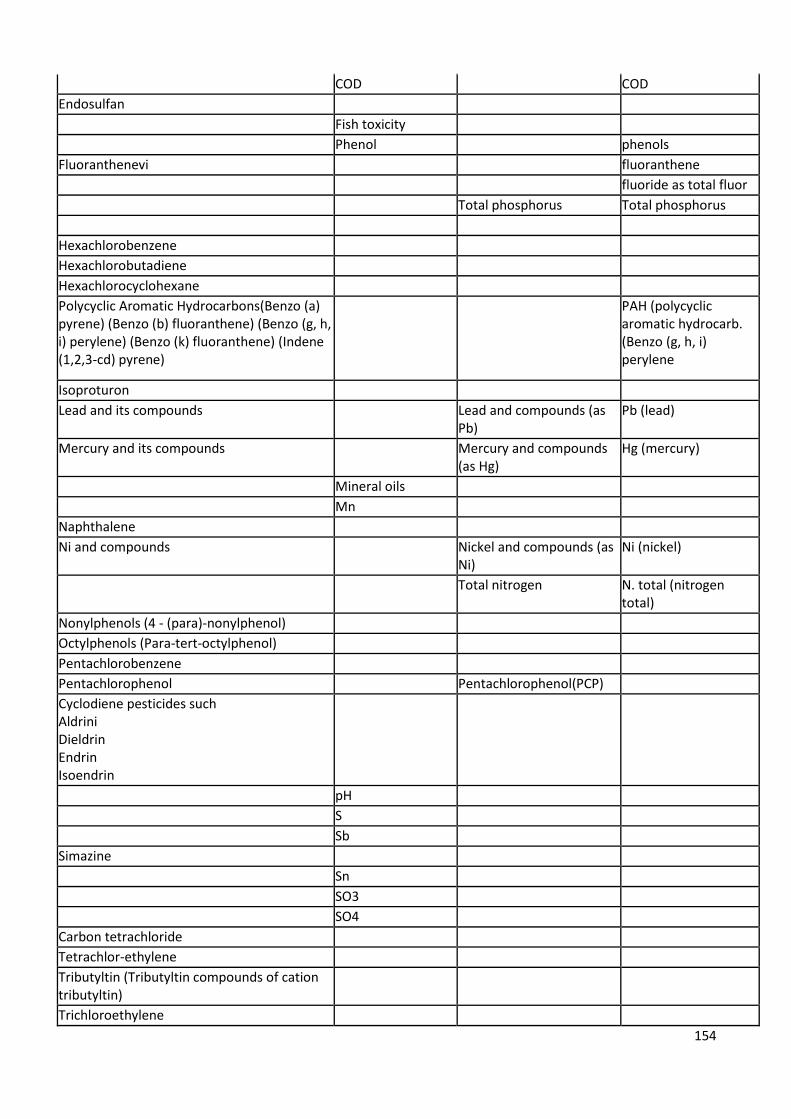
154
COD COD
Endosulfan
Fish toxicity
Phenol phenols
Fluoranthenevi fluoranthene
fluoride as total fluor
Total phosphorus Total phosphorus
Hexachlorobenzene
Hexachlorobutadiene
Hexachlorocyclohexane
Polycyclic Aromatic Hydrocarbons(Benzo (a) pyrene) (Benzo (b) fluoranthene) (Benzo (g, h, i) perylene) (Benzo (k) fluoranthene) (Indene (1,2,3-cd) pyrene)
PAH (polycyclic aromatic hydrocarb. (Benzo (g, h, i) perylene
Isoproturon
Lead and its compounds Lead and compounds (as Pb)
Pb (lead)
Mercury and its compounds Mercury and compounds (as Hg)
Hg (mercury)
Mineral oils
Mn
Naphthalene
Ni and compounds Nickel and compounds (as Ni)
Ni (nickel)
Total nitrogen N. total (nitrogen total)
Nonylphenols (4 - (para)-nonylphenol)
Octylphenols (Para-tert-octylphenol)
Pentachlorobenzene
Pentachlorophenol Pentachlorophenol(PCP)
Cyclodiene pesticides such Aldrini Dieldrin Endrin Isoendrin
pH
S
Sb
Simazine
Sn
SO3
SO4
Carbon tetrachloride
Tetrachlor-ethylene
Tributyltin (Tributyltin compounds of cation tributyltin)
Trichloroethylene

155
Tl
Tributyltin (compounds )
Tributyltin (cation)
Temperature
TDS
Trichlorobenzene (1,2,4-trichlorobenzene)
Trichloromethane (chloroform)
Trifluralin
TSS
V
Zinc and compounds (as Zn)
Zn (cinc)
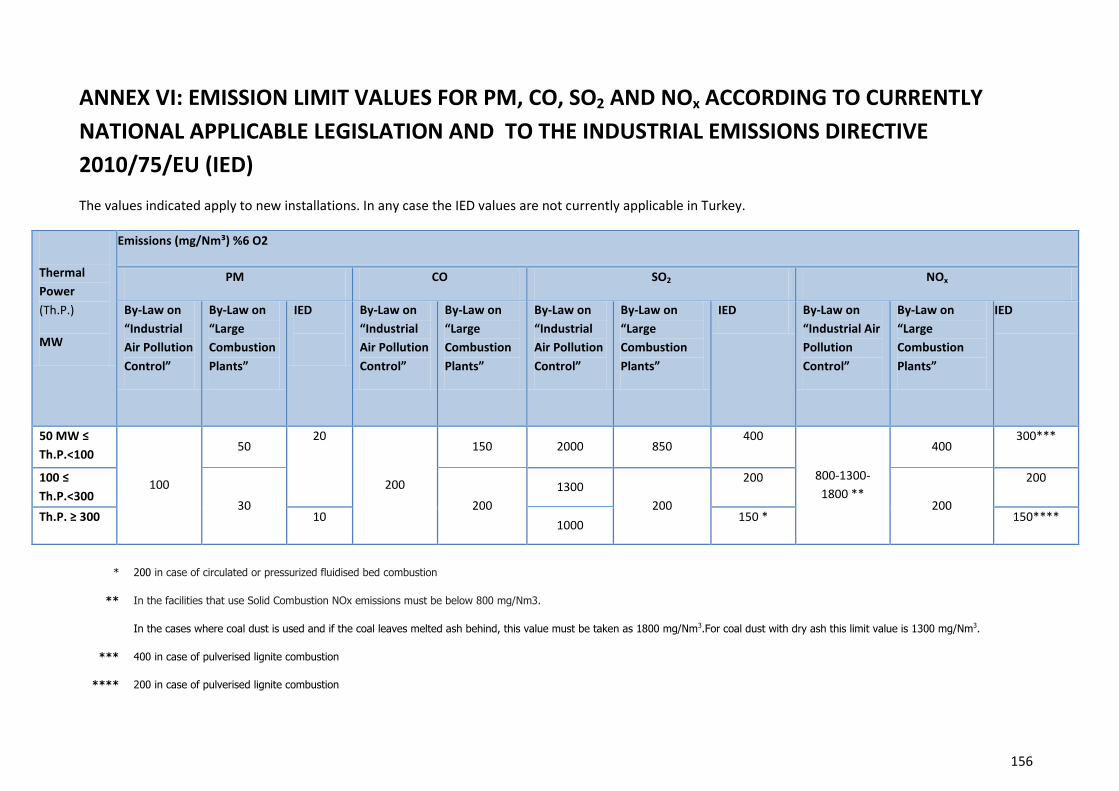
156
ANNEX VI: EMISSION LIMIT VALUES FOR PM, CO, SO2 AND NOx ACCORDING TO CURRENTLY
NATIONAL APPLICABLE LEGISLATION AND TO THE INDUSTRIAL EMISSIONS DIRECTIVE
2010/75/EU (IED)
The values indicated apply to new installations. In any case the IED values are not currently applicable in Turkey.
Thermal
Power
(Th.P.)
MW
Emissions (mg/Nm³) %6 O2
PM CO SO2 NOx
By-Law on
“Industrial
Air Pollution
Control”
By-Law on
“Large
Combustion
Plants”
IED
By-Law on
“Industrial
Air Pollution
Control”
By-Law on
“Large
Combustion
Plants”
By-Law on
“Industrial
Air Pollution
Control”
By-Law on
“Large
Combustion
Plants”
IED By-Law on
“Industrial Air
Pollution
Control”
By-Law on
“Large
Combustion
Plants”
IED
50 MW ≤
Th.P.<100
100
50 20
200
150 2000 850 400
800-1300-
1800 **
400 300***
100 ≤
Th.P.<300 30 200
1300
200
200
200
200
Th.P. ≥ 300 10 1000
150 * 150****
*
**
***
****
200 in case of circulated or pressurized fluidised bed combustion
In the facilities that use Solid Combustion NOx emissions must be below 800 mg/Nm3.
In the cases where coal dust is used and if the coal leaves melted ash behind, this value must be taken as 1800 mg/Nm3.For coal dust with dry ash this limit value is 1300 mg/Nm3.
400 in case of pulverised lignite combustion
200 in case of pulverised lignite combustion