Embed Size (px)
Citation preview

Stéphane Champiat, MD, PhDcDrug Development Department (DITEP)Gustave Roussy
16-17th February 2018Amsterdam, Netherlands
The issue of fast progression
ESMO advanced Course on Unsolved questions in Immuno-Oncology

Conflicts of interestAstraZeneca, BMS, Janssen, MSD, Novartis, Roche
Stéphane Champiat, MD, PhDcDrug Development Department (DITEP)Gustave Roussy
The issue of fast progression
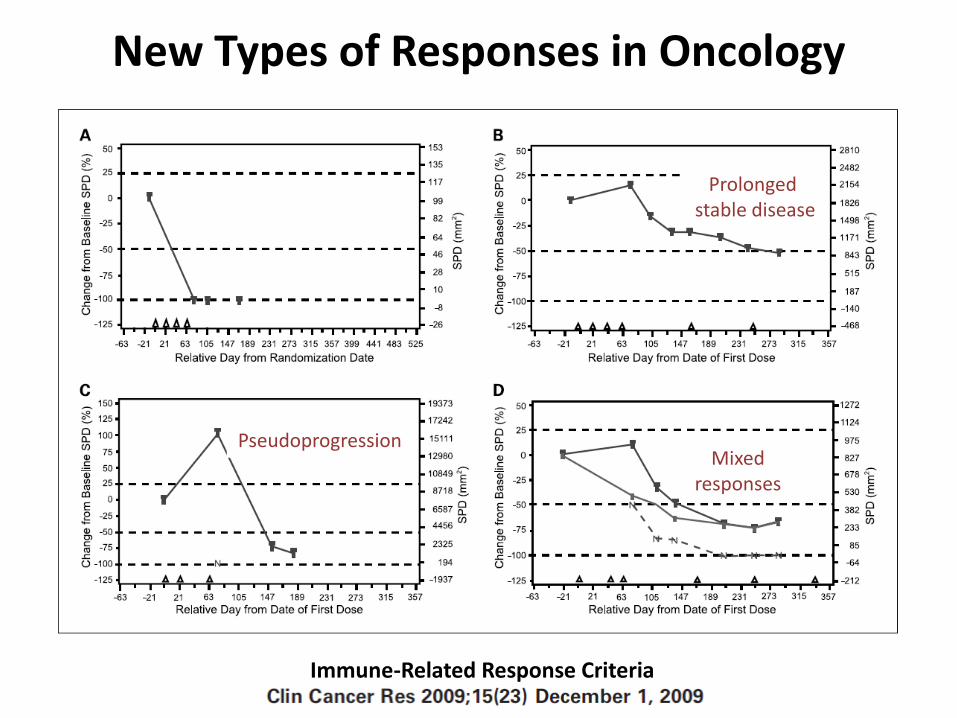
New Types of Responses in Oncology
Immune-Related Response Criteria
Prolonged stable disease
PseudoprogressionMixed
responses
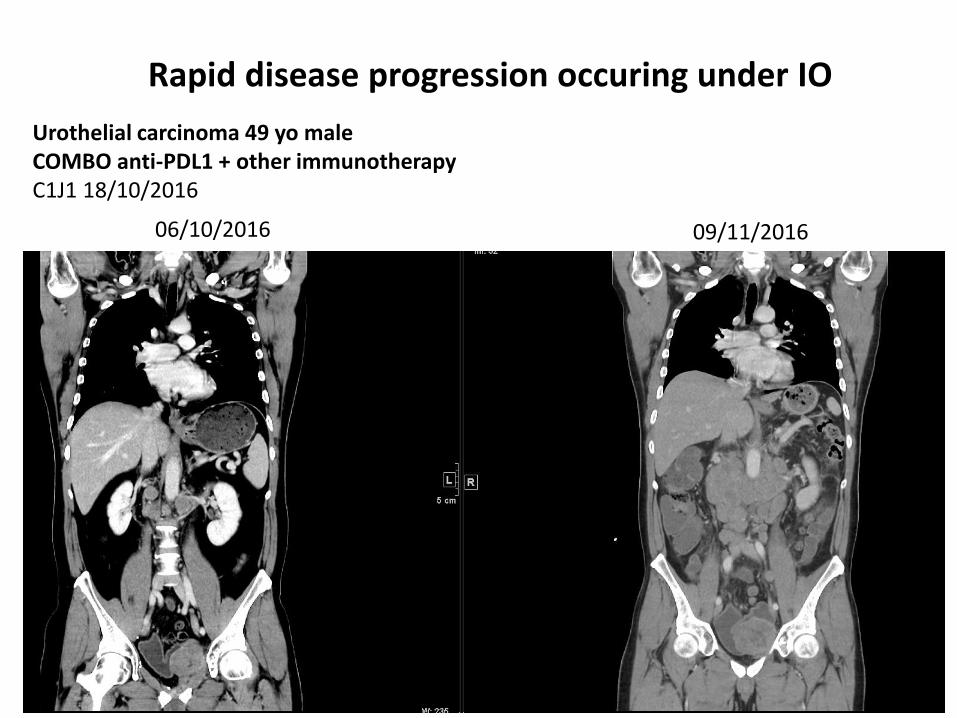
09/11/201606/10/2016
Urothelial carcinoma 49 yo maleCOMBO anti-PDL1 + other immunotherapyC1J1 18/10/2016
Rapid disease progression occuring under IO

Baseline 1st Evaluation(+8 weeks)
Before(-8 weeks)
Rapid disease progression occuring under IO
58-year-old woman with metastatic urothelial carcinoma
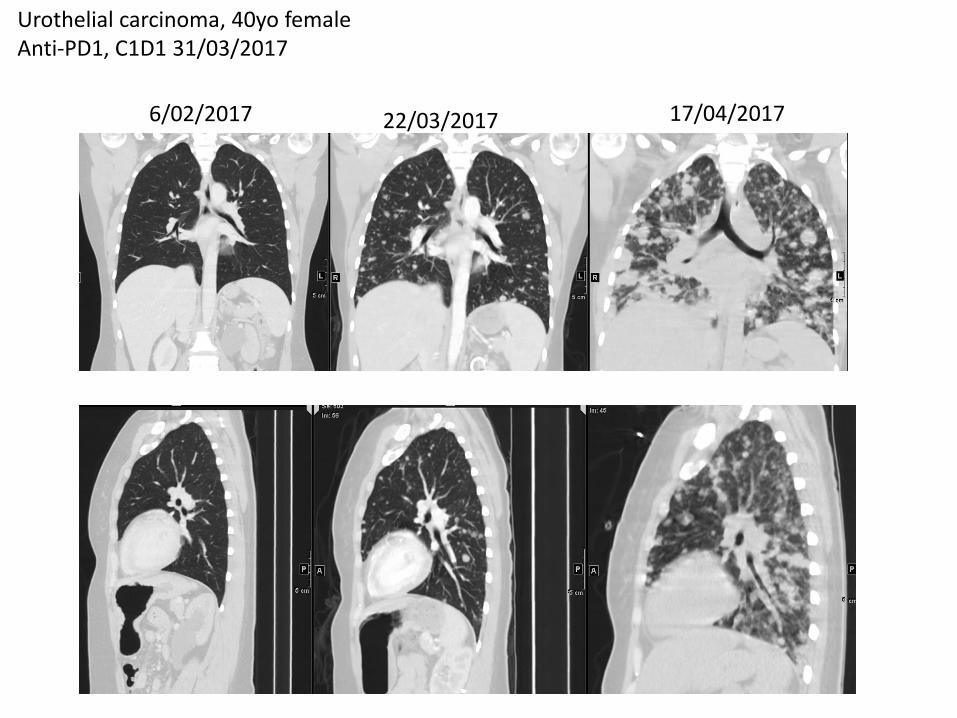
Urothelial carcinoma, 40yo femaleAnti-PD1, C1D1 31/03/2017
22/03/20176/02/2017 17/04/2017
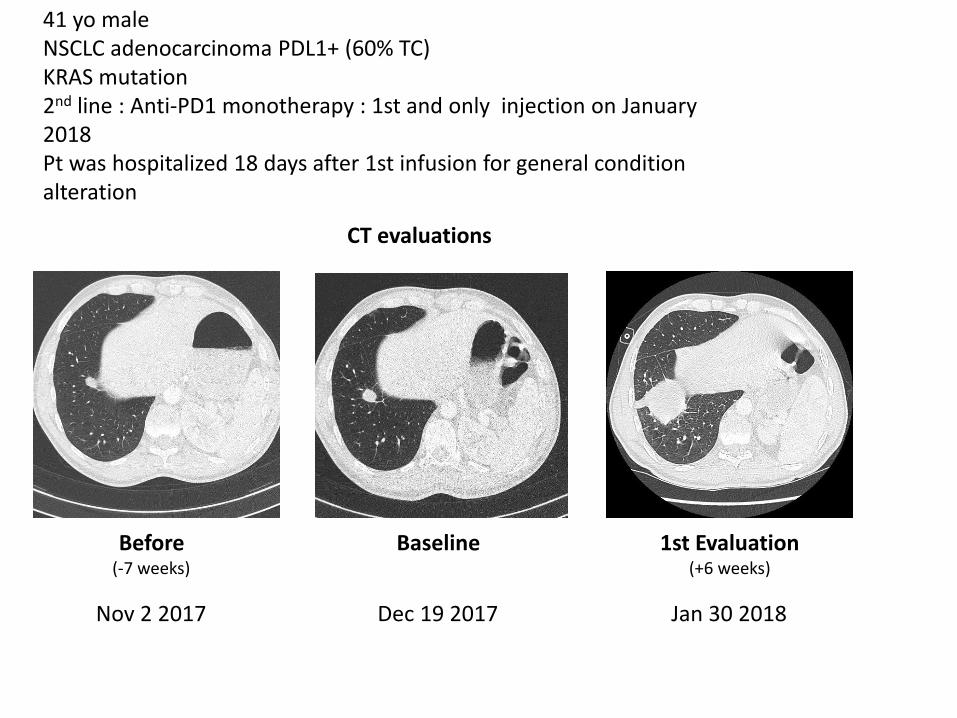
Dec 19 2017 Jan 30 2018Nov 2 2017
41 yo maleNSCLC adenocarcinoma PDL1+ (60% TC) KRAS mutation2nd line : Anti-PD1 monotherapy : 1st and only injection on January2018 Pt was hospitalized 18 days after 1st infusion for general condition alteration
Before(-7 weeks)
Baseline 1st Evaluation(+6 weeks)
CT evaluations
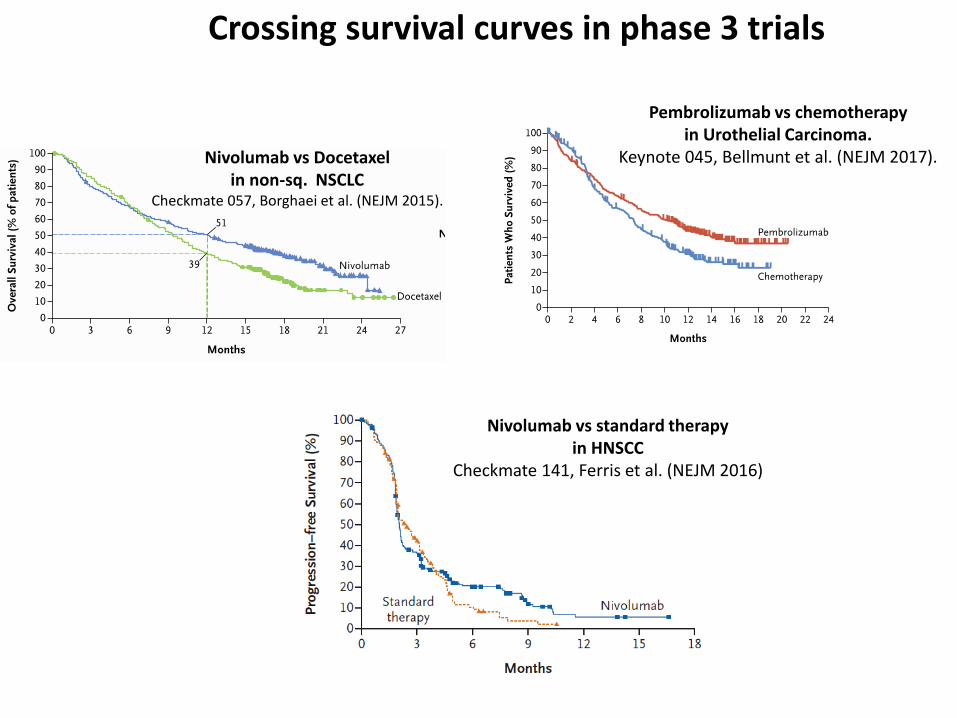
Crossing survival curves in phase 3 trials
Nivolumab vs Docetaxelin non-sq. NSCLC
Checkmate 057, Borghaei et al. (NEJM 2015).
Pembrolizumab vs chemotherapy in Urothelial Carcinoma.
Keynote 045, Bellmunt et al. (NEJM 2017).
Nivolumab vs standard therapyin HNSCC
Checkmate 141, Ferris et al. (NEJM 2016)

% variation
of the SLD
of target lesions
BEFORE
treatment
Time
?
Progression (PD)
Stable disease (SD)
Tumor
Response (PR, CR)
Tumor response evaluation by RECIST 1.1
ON
treatment- 32%
+ 10%
+ 30%
+ 50%


RECIST(-1)R-1
RECIST(0)R0
RECIST(+1)R+1
t-1 t+1
mm
months
What is needed ?
Integrating Tumor Kinetics in clinical practice

RECIST(-1)R-1
RECIST(0)R0
RECIST(+1)R+1
t-1 t+1
mm
months
What is needed ?
Integrating Tumor Kinetics in clinical practice
TGR+1
100 [exp(3 log(R+1/ R0) ) – 1]t+1
TGR-1
100 [exp(3 log(R0/ R-1) ) – 1]t-1
TGR method :
TGK method : TGK-1 = R0-R-1
t-1
TGK+1 = R+1- R0
t+1
TGR ratio :TGR+1
TGR-1
Delta TGR : TGR+1 – TGR-1 TGK ratio :
TGK+1
Champiat et al. Saada-Bouzid et al.Ferrara et al.
TGK-1
Compare Tumor Growth Kinetics

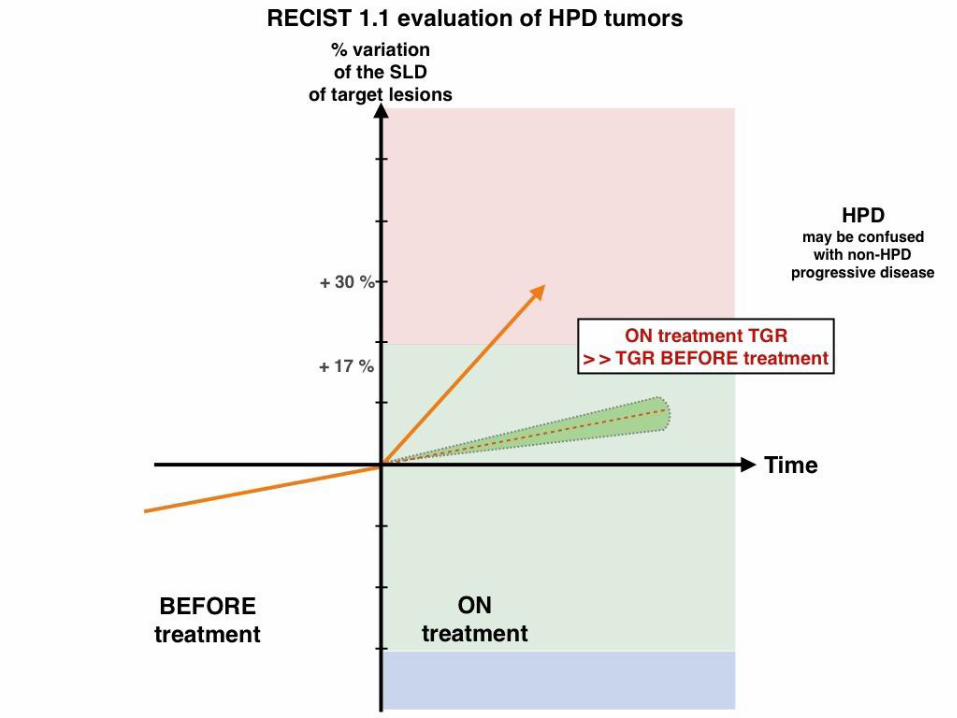
Hyperprogressive DiseaseDefinition ?
Champiat et al. Clin. Cancer Research 2016
Kato et al. Clin. Cancer Research
2017
Saada-Bouzid et al.Annals of Oncology
2017
Ferrara et al.WLC presentation
Oct. 2017
HPD definition
• RECIST PD at first evaluation
and
• TGR EXP/TGR Ratio ≥ 2
• time-to-treatment failure (TTF) <2 months
• >50% increase in tumor burden compared with pre-immunotherapy imaging
• >2-fold increase in “progression pace”
acceleration of tumor growth kinetics (TGK)
TGK ratio (TGKR) ≥2• RECIST PD at first
evaluation
and
• TGR EXP/TGR Ratio > 1,5
HPD on non-target lesions ? New lesions ?

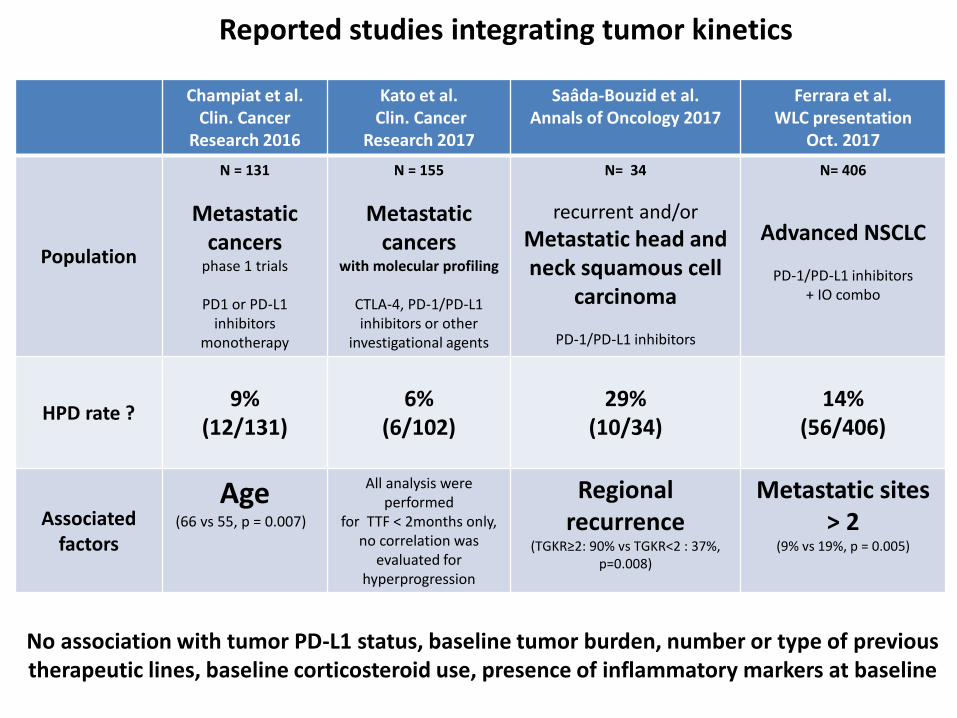
Champiat et al. Clin. Cancer
Research 2016
Kato et al. Clin. Cancer
Research 2017
Saada-Bouzid et al.Annals of Oncology 2017
Ferrara et al.WLC presentation
Oct. 2017
Population
N = 131
Metastatic cancers
phase 1 trials
PD1 or PD-L1 inhibitors
monotherapy
N = 155
Metastatic cancers
with molecular profiling
CTLA-4, PD-1/PD-L1 inhibitors or other
investigational agents
N= 34
recurrent and/or
Metastatic head and neck squamous cell
carcinoma
PD-1/PD-L1 inhibitors
N= 406
Advanced NSCLC
PD-1/PD-L1 inhibitors + IO combo
HPD rate ?9%
(12/131)6%
(6/102)29%
(10/34)14%
(56/406)
Reported studies integrating tumor kinetics

0 5 10 15 20 25 30 35
0.0
0.2
0.4
0.6
0.8
1.0
Months
Overa
ll surv
ival (%
)
CR or PR (n=16)
SD (n=64)
PD non−HPD (n=36)
HPD (n=10)
overall log−rank test
P= 1e−05
landmark survival analysis, landmark point set to 2 months
Champiat et al.Ferrara et al.
HPD and Survival
Champiat et al. Clin. Cancer
Research 2016
Kato et al. Clin. Cancer
Research 2017
Saada-Bouzid et al.Annals of Oncology 2017
Ferrara et al.WLC presentation
Oct. 2017
Population
N = 131
Metastatic cancers
phase 1 trials
PD1 or PD-L1 inhibitors
monotherapy
N = 155
Metastatic cancers
with molecular profiling
CTLA-4, PD-1/PD-L1 inhibitors or other
investigational agents
N= 34
recurrent and/or
Metastatic head and neck squamous cell
carcinoma
PD-1/PD-L1 inhibitors
N= 406
Advanced NSCLC
PD-1/PD-L1 inhibitors + IO combo
HPD rate ?9%
(12/131)6%
(6/102)29%
(10/34)14%
(56/406)
Associated factors
Age(66 vs 55, p = 0.007)
All analysis were performed
for TTF < 2months only, no correlation was
evaluated for hyperprogression
Regional recurrence
(TGKR≥2: 90% vs TGKR<2 : 37%, p=0.008)
Metastatic sites > 2
(9% vs 19%, p = 0.005)
Reported studies integrating tumor kinetics
No association with tumor PD-L1 status, baseline tumor burden, number or type of previous therapeutic lines, baseline corticosteroid use, presence of inflammatory markers at baseline

MDM2 amplification and HPD ? Kato et al. (CCR 2017). Hyperprogressors after Immunotherapy: Analysis of
Genomic Alterations Associated with Accelerated Growth Rate.
• MDM2 amplification : found in 7 % of cancers, Inhibit the P53 tumor suppressor
• Statistical analyzes were performedfor a time to treatment failure (TTF) <2 months
No analysis done for hyperprogression
• => MDM2 amplifications and EGFR abnormalities are correlated withtime to treatment failure (FTT) <2 months
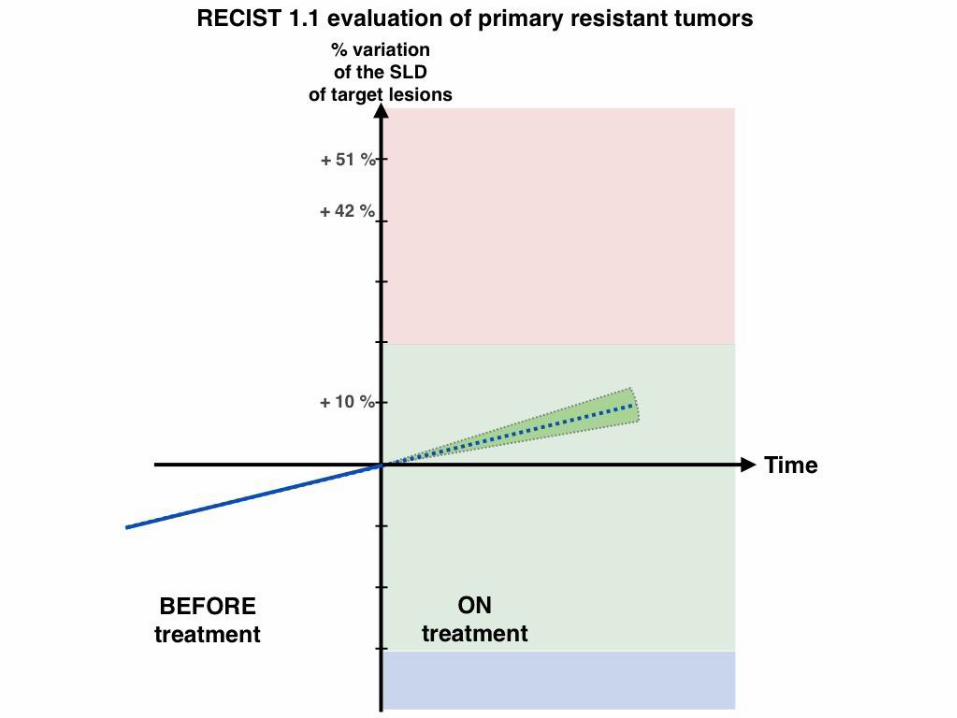
Primary resistance= Fast Progressors ?
= Hyperprogressors ?
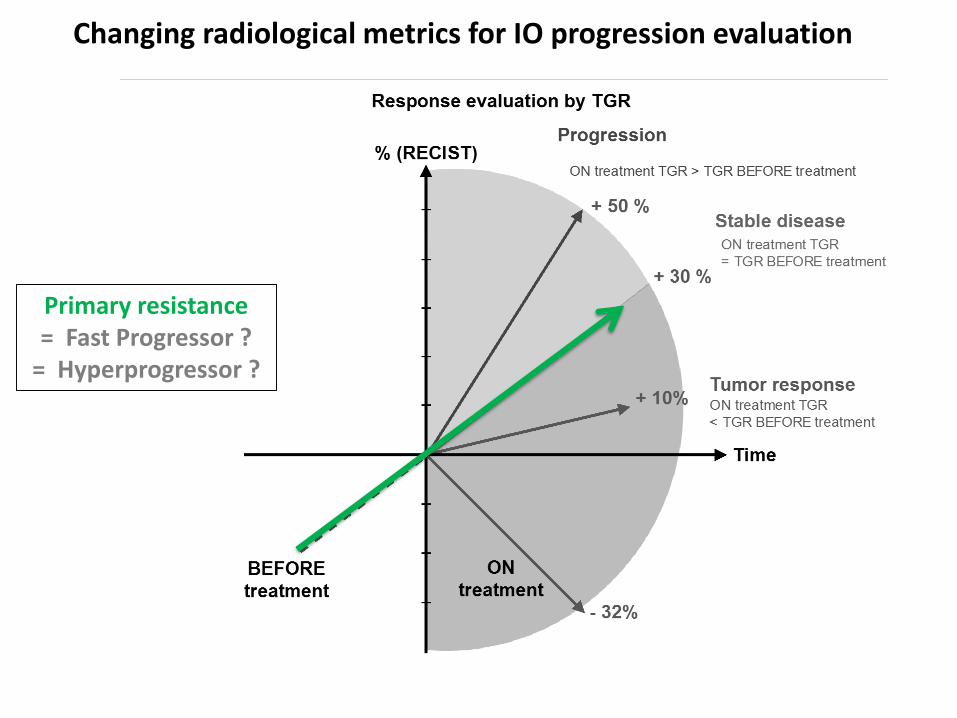
% (RECIST)
BEFORE
treatment
Time
?+ 10%
- 32%
+ 30 %
+ 50 %
Response
by RECIST
Progression (PD)
Stable disease (SD)
Tumor
Response (PR, CR)
Response evaluation by RECIST
ON
treatment
Primary resistance= Fast Progressor ?
= Hyperprogressor ?
Changing radiological metrics for IO progression evaluation

% (RECIST)
BEFORE
treatment
Time
?+ 10%
- 32%
+ 30 %
+ 50 %
Response
by RECIST
Progression (PD)
Stable disease (SD)
Tumor
Response (PR, CR)
Response evaluation by RECIST
ON
treatment
Primary resistance= Fast Progressor ? = Hyperprogressor ?
Changing radiological metrics for IO progression evaluation
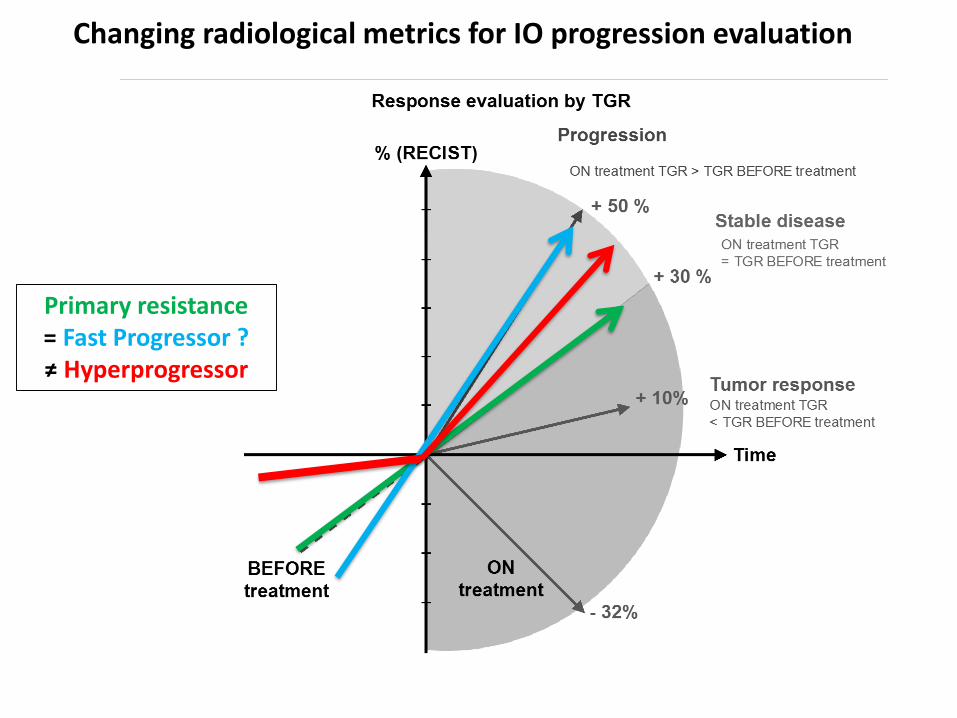
Changing radiological metrics for IO progression evaluation
% (RECIST)
BEFORE
treatment
Time
?+ 10%
- 32%
+ 30 %
+ 50 %
Response
by RECIST
Progression (PD)
Stable disease (SD)
Tumor
Response (PR, CR)
Response evaluation by RECIST
ON
treatment
Primary resistance= Fast Progressor ?≠ Hyperprogressor


Ferté et al. (2014). Tumor growth rate is an early indicator of antitumor drug activity in phase I clinical trials. Clinical Cancer Research
TGR profiling across 12 phase I clinical trialsIs HPD only observed with IO ?

Patients
characteristics
N=406
(%)Age
≥ 70 years 102 (25%)
Smoking history
Non-smokers 35 (9%)
Former/Current 371 (91%)
Histology
Non-squamous 294 (72%)
PD-L1 status
PDL-1 negative 39 (10%)
PDL-1 positive 78 (19%)
Unknown 289 (71%)
Stage (advanced
disease)
IVA or IVB 336 (83%)
N° met sites IO
baseline
> 2 184 (45%)
Performance
status
0-1 360 (89%)
IO Line
≥ 2 (range 2-9) 402 (99%)
IO drug type
PD-1 inhibitor 377 (93%)
PD-L1 inhibitor 29 (7%)
Mono or combo
Monotherapy 380 (94%)
Molecular Status
EGFR mutation 16 (4%)
ALK
rearrangement
4 (1%)
KRAS mutation 87 (21%)
0%
5%
10%
15%
20%
25%
30%
35%
40%
45%
19%
39%42%
5%
14%
Immunotherapy
Ferrara et al., WLC presentation Oct 2017
HPD = (TGR IO – TGR PRE IO) > 50% + PD RECIST AT 1st CT SCAN
Is HPD only observed with IO ?

Patients
characteristics
N=406
(%)Age
≥ 70 years 102 (25%)
Smoking history
Non-smokers 35 (9%)
Former/Current 371 (91%)
Histology
Non-squamous 294 (72%)
PD-L1 status
PDL-1 negative 39 (10%)
PDL-1 positive 78 (19%)
Unknown 289 (71%)
Stage (advanced
disease)
IVA or IVB 336 (83%)
N° met sites IO
baseline
> 2 184 (45%)
Performance
status
0-1 360 (89%)
IO Line
≥ 2 (range 2-9) 402 (99%)
IO drug type
PD-1 inhibitor 377 (93%)
PD-L1 inhibitor 29 (7%)
Mono or combo
Monotherapy 380 (94%)
Molecular Status
EGFR mutation 16 (4%)
ALK
rearrangement
4 (1%)
KRAS mutation 87 (21%)
0%
5%
10%
15%
20%
25%
30%
35%
40%
45%
19%
39%42%
5%
14%
0%
10%
20%
30%
40%
50%
60%
10%
59%
31%
5%
0%
Immunotherapy Chemotherapy
Patients
characteristics
N=59
(%)Age
≥70 years 14
(24%)
Smoking history
Non-smokers 6 (10%)
Former/Current 53
(90%)
Histology
Non-squamous 47
(80%)
N° met sites chemo
baseline
≥ 3 16
(27%)
Performance status
≥2 8 (13%)
Chemo Line
≥ 3rd line (3-8) 17
(29%)
Chemo drug type
Taxane 43
(73%)
Pemetrexed 7 (12%)
Vinorelbine 4 (7%)
Gemcitabine 5 (8%)
Molecular Status
EGFR mutation 4 (7%)
ALK rearr 3 (5%)
KRAS mutation 17
(29%)
vsFerrara et al., WLC presentation Oct 2017
HPD = (TGR IO – TGR PRE IO) > 50% + PD RECIST AT 1st CT SCAN
Is HPD only observed with IO ?

Oncogenic drivers activationImmuno-selection
of aggressive tumor clones
• Intra-cellular activation of oncogenic escape mechanisms ?
• Predisposing tumor genetic alterations?EGFR ? MDM2?
Hyperprogressive DiseaseHypothesis ?
Immune compensatory mechanisms
• Alternative immune checkpoints
• Modulation of protumor immune subsets: T-regs, Innate immunity
• Inflammation mediated angiogenesis, matrix/tissue remodeling, metabolism
modification

• Which patients ?: ✓ NSCLC, HNSCC, others ? ✓ Associated factors ? : age ? Number of metastatic sites > 2 ? Regional recurrence ?
HyperprogressorsWhat should we do ?

• Which patients ?: ✓ NSCLC, HNSCC, others ? ✓ Associated factors ? : age ? Number of metastatic sites > 2 ? Regional recurrence ?
• Change tumor evaluation metrics✓ pre-baseline CT scan ✓ Early evaluation✓ Integrate new lesions in HPD definition ?
• Change the use of biomarkersResponse Biomarkers => Progression biomarkers
HyperprogressorsWhat should we do ?
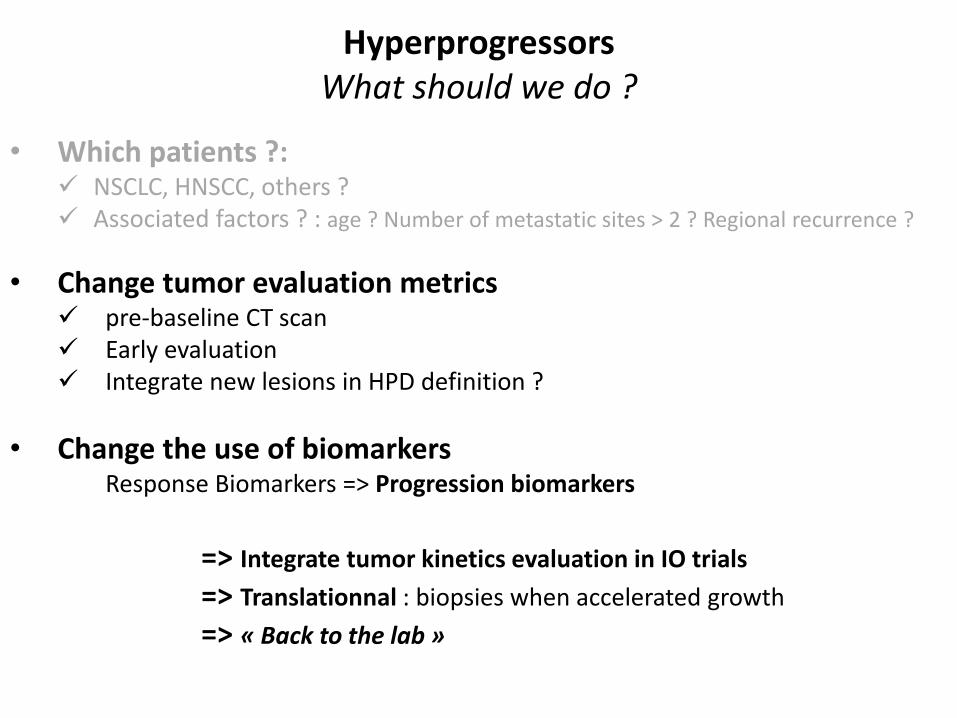
• Which patients ?: ✓ NSCLC, HNSCC, others ? ✓ Associated factors ? : age ? Number of metastatic sites > 2 ? Regional recurrence ?
• Change tumor evaluation metrics✓ pre-baseline CT scan ✓ Early evaluation✓ Integrate new lesions in HPD definition ?
• Change the use of biomarkersResponse Biomarkers => Progression biomarkers
=> Integrate tumor kinetics evaluation in IO trials
=> Translationnal : biopsies when accelerated growth
=> « Back to the lab »
HyperprogressorsWhat should we do ?
Primum non nocere
Understand HPD mechanisms to improve IO efficacy … and patients survival

% variation
of the SLD
of target lesions
BEFORE
treatment
Time
?
Progression (PD)
Stable disease (SD)
Tumor
Response (PR, CR)
Tumor response evaluation by RECIST 1.1
ON
treatment- 32%
+ 10%
+ 30%
+ 50%


Progressive tumors assessment under IO therapy
exposure to an ineffective or deleterious IO therapy

Progressive tumors assessment under IO therapy
Integrating PRE and ON treatment tumor kinetics
exposure to an ineffective or deleterious IO therapy
@iTOXreport
Stéphane CHAMPIAT MD, PhDcGustave [email protected]
Get updates on last publications about irAEs
The issue of fast progression
ESMO advanced Course on Unsolved questions in Immuno-Oncology
Charles FertéJean-Charles SoriaAurélien MarabelleSamy AmmariLaurent DercleChristophe Massard


R
• Tumor size (D) was defined as the sum of the largest diameters (RECIST sums).• Let t be the time between each tumor evaluation.
=> Consecutively, TG = 3 log(Dt / D0) / t
To report the TGR results in a clinically meaningful way,
we expressed TGR as a percentage increase in tumor volume during 1 month : TGR = 100 [exp(TG) – 1]
TGomez-Roca C, Koscielny S et al, Eur J Cancer 2011
Defining TGR
Tumor volumeat time t Tumor volume
at baseline
TumorGrowth
Assuming the tumor growthfollows an exponential law
Vt =V0 exp(TG.t)
Tumor volume (V) was approximatedby V = 4 π R3 where R= D/2
3

RECIST(-1)R-1
RECIST(0)R0
RECIST(+1)R+1
t-1 t+1
mm
months
TG-1 TG+1
3 log(R0/ R-1)t-1
3 log(R+1/ R0)t+1
TGR-1
100 [exp(TG-1) – 1]
Percentage increasein tumor volume during 1 month
TGR+1
100 [exp(TG+1) – 1]
TGR ratio
TGR+1
TGR-1
Calculating TGRin clinical practice
What do I need ?
3 RECISTs evaluations
Days of CT scan
evaluation
Enter the values in an excel file
with the formula

Patients treated by monotherapyanti PD1 or anti PD-L1 agents
in phase I trials at Gustave Roussybetween Dec. 2011 and Jan. 2014
N=218
Progressionbefore the first evaluation
N=18
Toxicitybefore the first evaluation
N=5
TGR evaluable patientsduring the REFERENCE
and the EXPERIMENTAL periodN=166
REFERENCE periodshorter than 2 weeks
or longer than 3 monthsN=35
No tumor burdenmeasurable by RECISTon previous CT-scan
N=2
No previous CT-scanN=27
CT-scan evaluationafter baseline available
(on treatment)N= 195
Clinically meaningfulTGR evaluable patients
N=131
Flowchart of study selection process


Analysis of the TGR between the REFERENCE and the EXPERIMENTAL periods

Analysis of the TGR between the REFERENCE and the EXPERIMENTAL periods
A subset of progressive patients presenting a marked increase in tumor growth
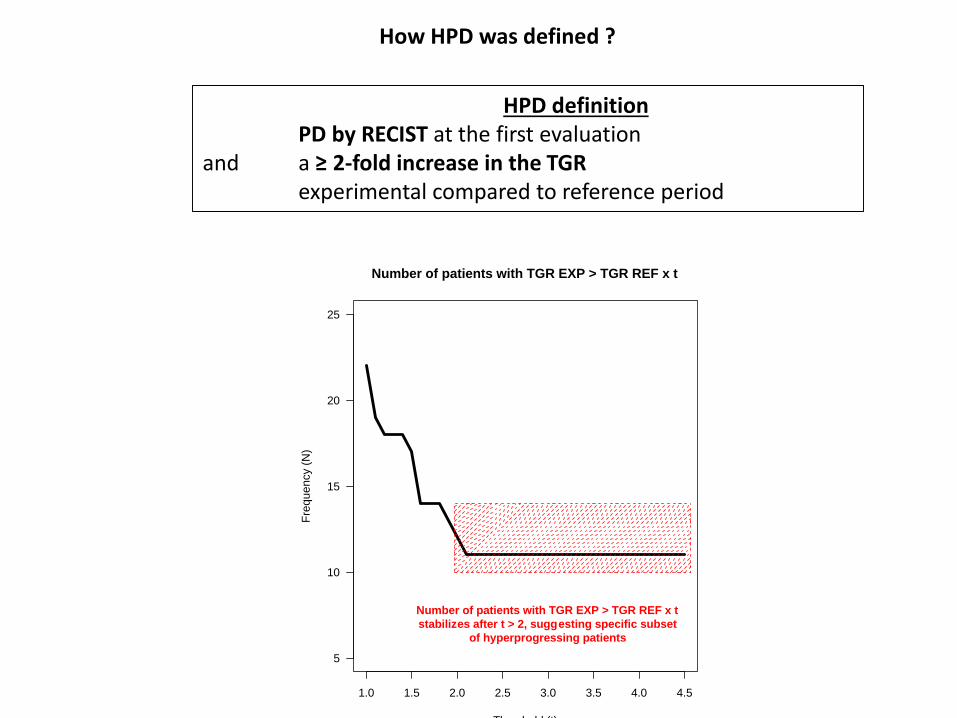
HPD definitionPD by RECIST at the first evaluation
and a ≥ 2-fold increase in the TGR experimental compared to reference period
1.0 1.5 2.0 2.5 3.0 3.5 4.0 4.5
5
10
15
20
25
Number of patients with TGR EXP > TGR REF x t
Threshold (t)
Fre
que
ncy (
N)
Number of patients with TGR EXP > TGR REF x t
stabilizes after t > 2, suggesting specific subset
of hyperprogressing patients
How HPD was defined ?

A subset of progressive patients presenting a marked increase in tumor growth

Association between HPD and overall survival
0 5 10 15 20 25 30 35
0.0
0.2
0.4
0.6
0.8
1.0
Months
Overa
ll surv
ival (%
)
CR or PR (n=16)
SD (n=64)
PD non−HPD (n=36)
HPD (n=10)
overall log−rank test
P= 1e−05
landmark survival analysis, landmark point set to 2 months

19
−3
4
34
−4
9
49
−6
4
64
−7
9
−100
−50
0
50
100
Age
RE
CIS
T (
%)
●
●
●
●
●
●
●
●
●●
●
●
●
●
●
●
●
●
●
●
●
●
●
●
●
●
●
●
●
●
●
●
●
●
●
●
●
●
●
●
●●●
●
●
●
●
●
●
●
●
●
●
●
●
●
●
●
●
●
●
●●
●
●
●
●
●
●
●
●
●
●
●
●
●
●
●
●
●
●
●
●
●
●
●
●
●
●
●
●
●
●
●
●
● ●
●
●
●
●
●
●
●
●
●
●
●
●
●
●
●
●
●
●
●
●
●
●
●
●
●
●
●
●
●●
●
●
●
HPD is associated with older age
non HPD HPD
20
30
40
50
60
70
80
Ag
e
●
●
●
●
●
●
●
●
●
●
●
●
●
●
●
●
●
●
●
●
●
●●
●
●
●
●
●
●
●
●
●●
●
●
●
●
●
●
●
●
●
●
●
●
●
●
●
●
●
●
●●
●
●
● ●
●
●
●
●
●
●
●
●
●
●
●
●
●
●
●
●
●
●
●
●
●
●
●
●
●
●
●●
●
●
●
●
●
●
●
●
●
●
●
●
●
●
●
●
●
●
●
●
●
●
●
●
●
●
●
●
●
●
●
●
●
●
●
●
●
●
●
●
●
●
●
●
●
●
wilcoxon test
P= 0.0066
REC
IST
(%)
Age (years) < 35 35-49 50-64 ≥65Fisher-exact test :
15.4% 13.3% 15.4% 5.6%Overall Response Rate (%)
8% 0% 8% 19%HPD Rate (%)
P=1.9 e-4
P=0.046

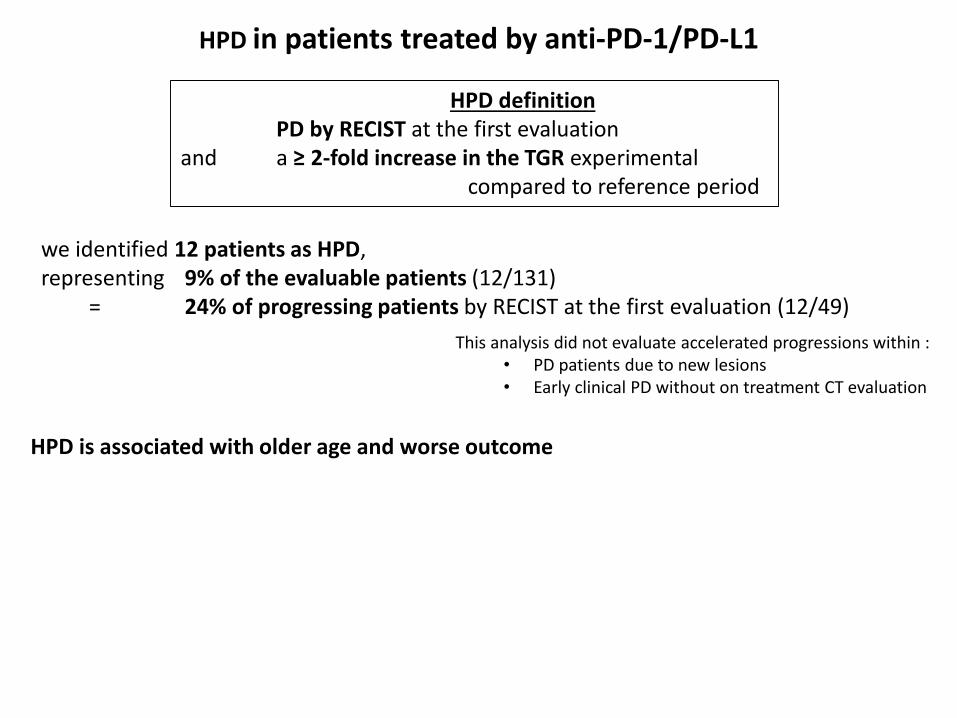
HPD in patients treated by anti-PD-1/PD-L1
HPD definitionPD by RECIST at the first evaluation
and a ≥ 2-fold increase in the TGR experimental compared to reference period
we identified 12 patients as HPD, representing 9% of the evaluable patients (12/131)
= 24% of progressing patients by RECIST at the first evaluation (12/49)
HPD is associated with older age and worse outcome
HPD in patients treated by anti-PD-1/PD-L1
HPD definitionPD by RECIST at the first evaluation
and a ≥ 2-fold increase in the TGR experimental compared to reference period
we identified 12 patients as HPD, representing 9% of the evaluable patients (12/131)
= 24% of progressing patients by RECIST at the first evaluation (12/49)
This analysis did not evaluate accelerated progressions within : • PD patients due to new lesions• Early clinical PD without on treatment CT evaluation
HPD is associated with older age and worse outcome
no association between HPD and tumor burden at baseline (RECIST sum) (P=0.64)number of metastatic sites (P=0.76) Royal Marsden Hospital (RMH) prognostic score (P=0.43)number of previous lines (P=0.69)corticosteroids at baseline (P=0.16) type of previous treatment line blood characteristics at baseline : lymphocytes (P=0.64), neutrophils (P=0.69), albumin (P=0.23), fibrinogen (P= 0.43) or LDH (P=0.097)

Crossing survival curves in phase 3 trials
Nivolumab vs Docetaxelin non-sq. NSCLC
Checkmate 057, Borghaei et al. (NEJM 2015).
Pembrolizumab vs chemotherapy in Urothelial Carcinoma.
Keynote 045, Bellmunt et al. (NEJM 2017).
Nivolumab vs standard therapyin HNSCC
Checkmate 141, Ferris et al. (NEJM 2016)
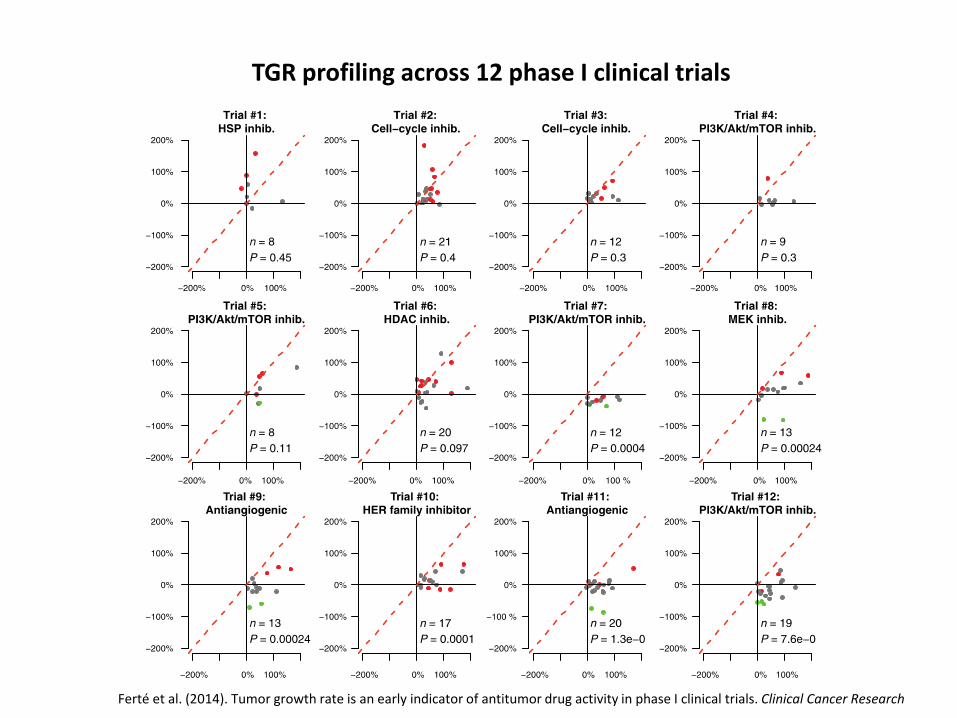
Ferté et al. (2014). Tumor growth rate is an early indicator of antitumor drug activity in phase I clinical trials. Clinical Cancer Research
TGR profiling across 12 phase I clinical trials

Ferté et al. (2014). Tumor Growth Rate Provides Useful Information to Evaluate Sorafenib and Everolimus Treatment in Metastatic Renal Cell Carcinoma Patients: An Integrated Analysis of the TARGET and RECORD Phase 3 Trial Data. European Urology
Tumor Growth Rate of RCC with Sorafenib
Assessment of the tumor growth kinetics ratio (TGKR) based on TGK on immunotherapy (TGKPOST) and
TGK before starting immunotherapy (TGKPRE)
254x190mm (96 x 96 DPI)
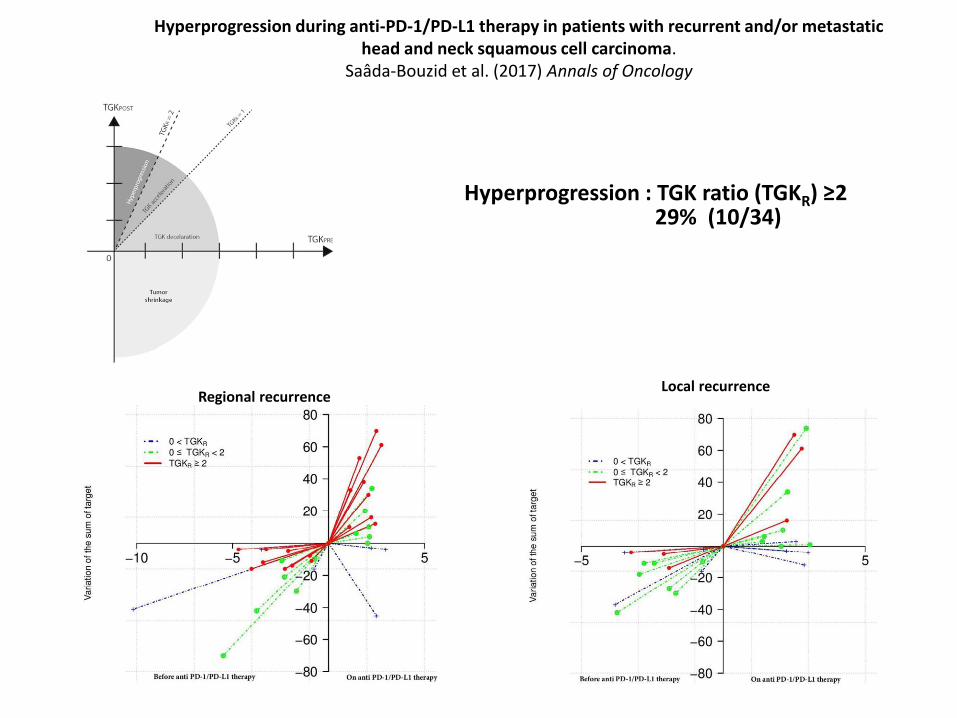
Regional recurrenceLocal recurrence
Hyperprogression during anti-PD-1/PD-L1 therapy in patients with recurrent and/or metastatic head and neck squamous cell carcinoma.
Saâda-Bouzid et al. (2017) Annals of Oncology
Hyperprogression : TGK ratio (TGKR) ≥229% (10/34)
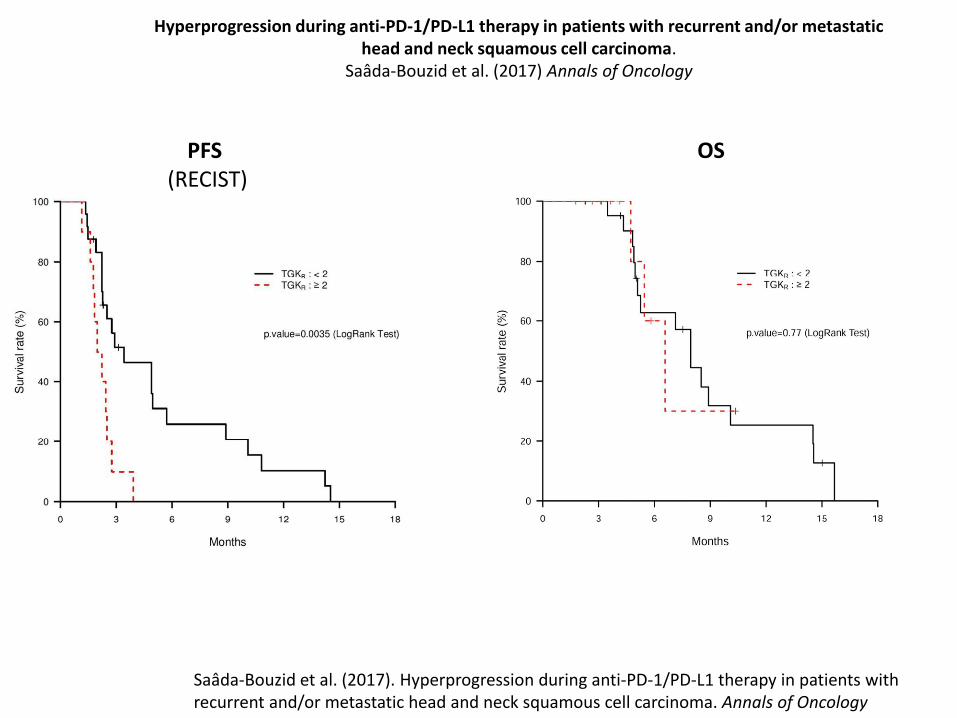
PFS (RECIST)
OS
Saâda-Bouzid et al. (2017). Hyperprogression during anti-PD-1/PD-L1 therapy in patients with recurrent and/or metastatic head and neck squamous cell carcinoma. Annals of Oncology
Hyperprogression during anti-PD-1/PD-L1 therapy in patients with recurrent and/or metastatic head and neck squamous cell carcinoma.
Saâda-Bouzid et al. (2017) Annals of Oncology

Table 1. Patients characteristics
TGKR<2
N (%)
TGKR≥2
N (%)
P value
Total 24 10
Immune checkpoint inhibitor 0.23
PD-1 inhibitor 18 (75) 5 (50)
PD-L1 inhibitor 6 (25) 5 (50)
Number of previous lines of treatment in the R/M setting 0.70
0 2 (8) 0
1 14 (58) 6 (60)
>2 8 (34) 4 (40)
Gender 1
female 5 (21) 2 (20)
male 19 (79) 8 (80)
Tobacco 1
yes 20 (83) 8 (80)
no 4 (17) 2 (20)
HPV status 1
p16 negatif 10 (42) 2 (20)
p16 positif 4 (17) 1 (10)
unknown 10 (42) 7(70)
Previous neck irradiation 1
yes 23 (96) 10 (100)
no 1 (4) 0
Local recurrence 0.46
yes 11 (46) 3 (30)
no 13 (54) 7 (70)
Regional recurrence 0.008
yes 9 (38) 9 (90)
no 15 (62) 1 (10)
Distant metastases 0.70
yes 15 (62) 5 (50)
no 9 (38) 5 (50)
Tumor size at baseline (S0) 0.7
≤ median 11 (46) 6 (60)
> median 13 (54) 4 (40)
TGKR = Tumor growth kinetics ratio; PD-1: Programmed death 1 receptor; PD-L1 Programmed death
ligand 1 receptor; R/M: Recurrent and/or metastatic; HPV: Human papilloma virus
Saâda-Bouzid et al., Annals of Oncology 2017
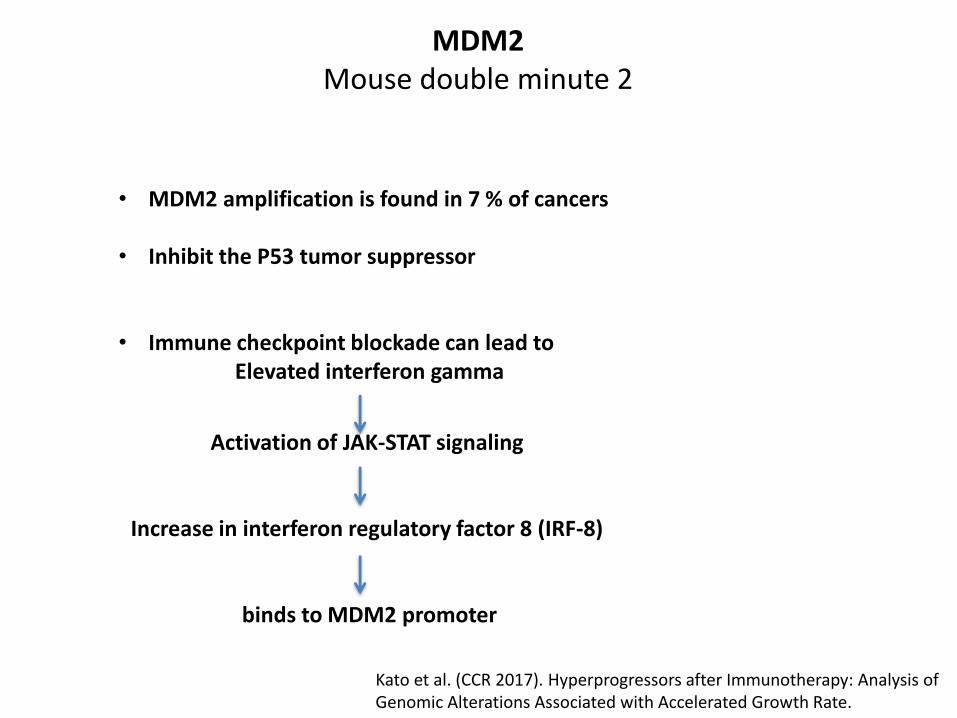
MDM2Mouse double minute 2
• MDM2 amplification is found in 7 % of cancers
• Inhibit the P53 tumor suppressor
• Immune checkpoint blockade can lead to Elevated interferon gamma
Activation of JAK-STAT signaling
Increase in interferon regulatory factor 8 (IRF-8)
binds to MDM2 promoter
Kato et al. (CCR 2017). Hyperprogressors after Immunotherapy: Analysis of Genomic Alterations Associated with Accelerated Growth Rate.

RECIST(-1)R-1
RECIST(0)R0
RECIST(+1)R+1
t-1 t+1
mm
months
TG-1 TG+1
3 log(R0/ R-1)t-1
3 log(R+1/ R0)t+1
TGR-1
100 [exp(TG-1) – 1]
Percentage increasein tumor volume during 1 month
TGR+1
100 [exp(TG+1) – 1]
TGR ratio
TGR+1
TGR-1
Calculating TGRin clinical practice
What do I need ?
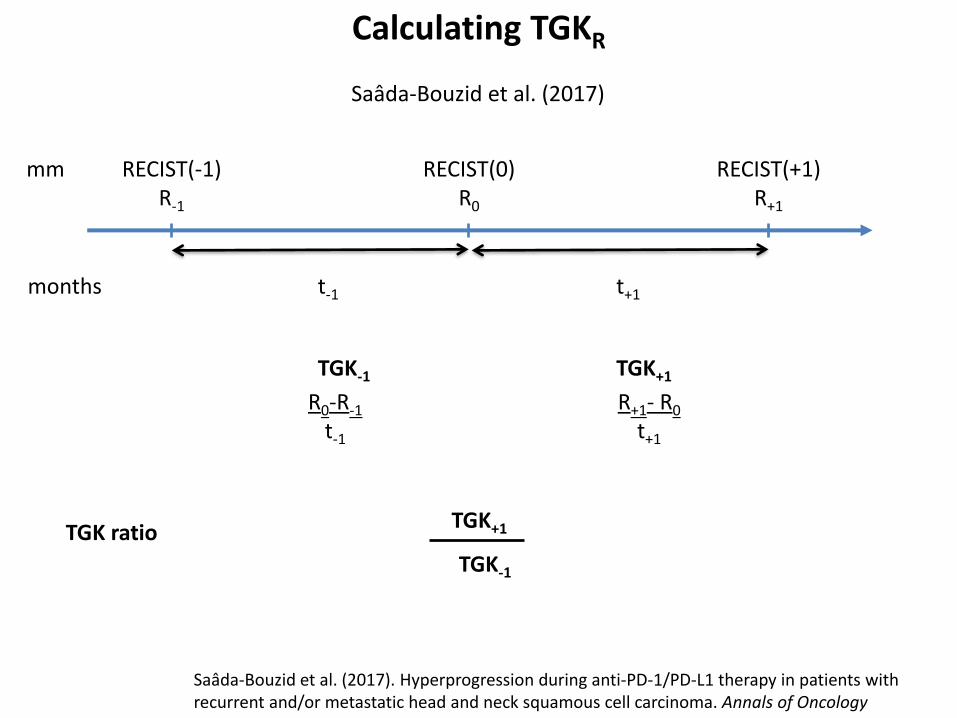
RECIST(-1)R-1
RECIST(0)R0
RECIST(+1)R+1
t-1 t+1
mm
months
TGK-1 TGK+1
R0-R-1
t-1
R+1- R0
t+1
TGK ratioTGK+1
TGK-1
Calculating TGKR
Saâda-Bouzid et al. (2017). Hyperprogression during anti-PD-1/PD-L1 therapy in patients with recurrent and/or metastatic head and neck squamous cell carcinoma. Annals of Oncology
Saâda-Bouzid et al. (2017)

@iTOXreport
Stéphane CHAMPIAT MD, PhDcGustave [email protected]
Get updates on last publications about irAEs
The issue of fast progression
ESMO advanced Course on Unsolved questions in Immuno-Oncology
Charles FertéJean-Charles SoriaAurélien MarabelleSamy AmmariLaurent DercleChristophe Massard