Embed Size (px)
Citation preview
ADVANCES IN SYSTEMIC TREATMENT OF ADVANCED/METASTATIC RENAL CELL CARCINOMA
Defining new standards of care
from Phase III trials
Rosa Nadal1 & Joaquim Bellmunt Molins2
1. National Cancer Institute. National Institutes of Health.
Bethesda, Maryland, USA
2. Dana-Farber Cancer Institute/Brigham and Women’s Hospital.
Harvard Medical School, Boston, USA ; PSMAR and IMIM-
Hospital del Mar Medical Research Institute, Barcelona, Spain

I. Epidemiology fact sheet
II. Nephrectomy and/or metastasectomy in advanced renal cancer
III. 1st, 2nd and 3rd line systemic therapy in advanced cancer
IV. New agents, selected new combinations
V. adjuvant systemic therapy
VI. Conclusions
CONTENT:
RENAL CELL CARCINOMA
EPIDEMIOLOGY
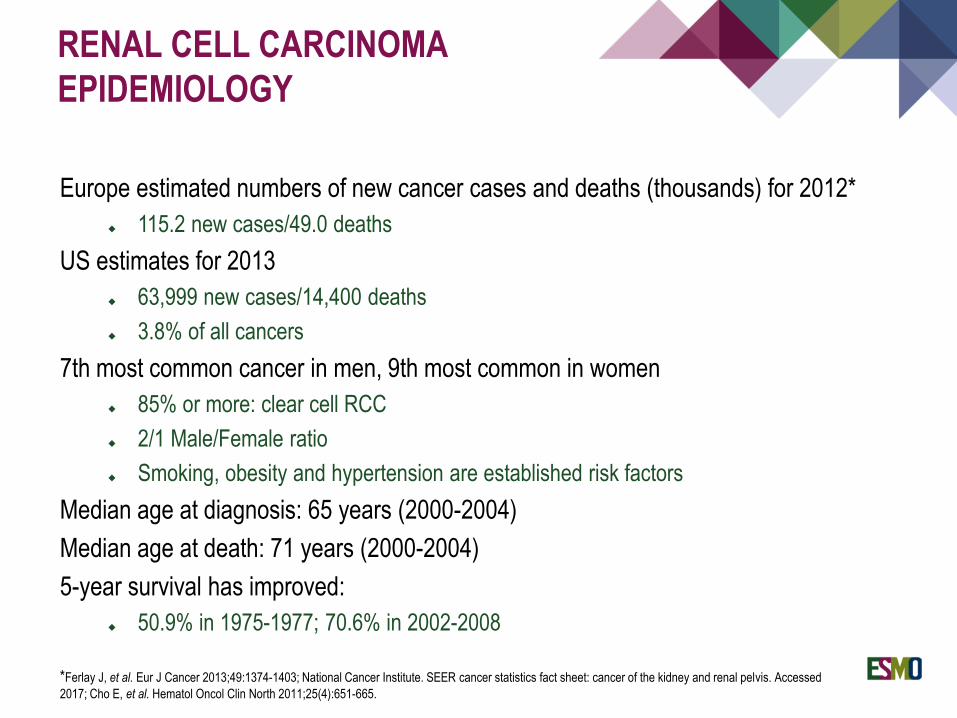
Europe estimated numbers of new cancer cases and deaths (thousands) for 2012*
115.2 new cases/49.0 deaths
US estimates for 2013
63,999 new cases/14,400 deaths
3.8% of all cancers
7th most common cancer in men, 9th most common in women
85% or more: clear cell RCC
2/1 Male/Female ratio
Smoking, obesity and hypertension are established risk factors
Median age at diagnosis: 65 years (2000-2004)
Median age at death: 71 years (2000-2004)
5-year survival has improved:
50.9% in 1975-1977; 70.6% in 2002-2008
*Ferlay J, et al. Eur J Cancer 2013;49:1374-1403; National Cancer Institute. SEER cancer statistics fact sheet: cancer of the kidney and renal pelvis. Accessed
2017; Cho E, et al. Hematol Oncol Clin North 2011;25(4):651-665.
Around 20% of patients present with metastatic disease
Around 30% of individuals undergoing curative therapy eventually experience disease
recurrence.
Value of Metastasectomy:
No Phase III data, to be considered in highly selected cases of single/oligo metastases
Value of Cytoreductive Nephrectomy in patients with metastatic disease:
No mature data on the additive value of nephrectomy in patients treated with a first line
Tyrosine Kinase Inhibitor. A randomised prospective trial by the EORTC ( NCT
01099423), which evaluates this question for the sunitinib case, has recently reached
its intended accrual and results are awaited.
SURGERY FOR ADVANCED RCC
Flanigan RC, et al. N Engl J Med 2001;345:1655; Mickisch GH, et al. Lancet 2001;358:966; Choueiri,TK, et al. J Urol 2011;185:60–66.
SYSTEMIC THERAPY FOR
ADVANCED RCC
EMA AND FDA REGULATORY
APPROVED DRUGS
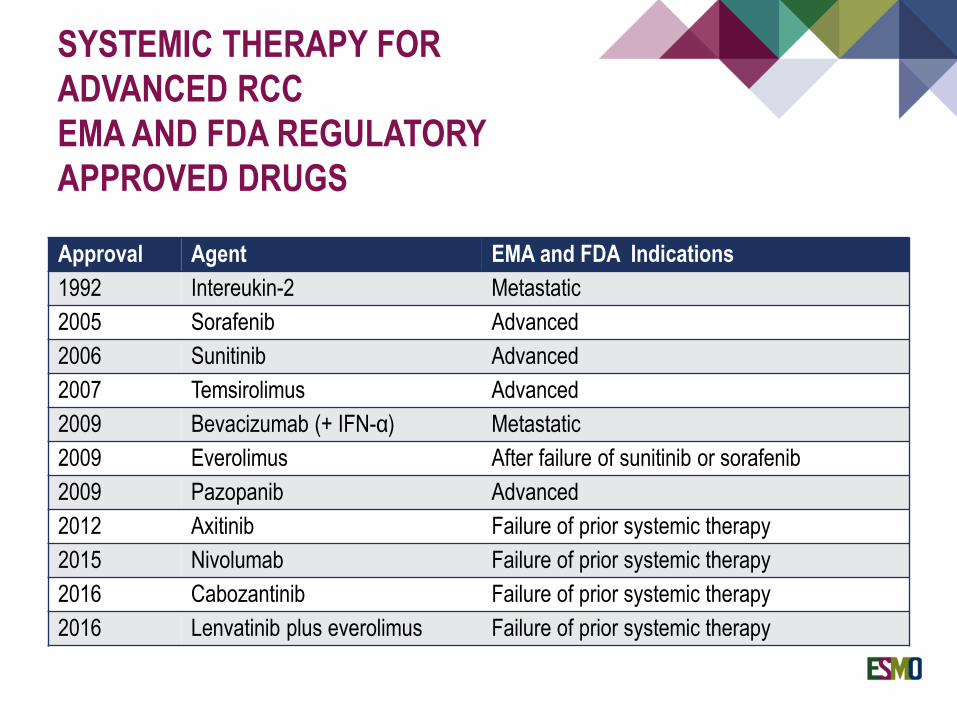
Approval Agent EMA and FDA Indications
1992 Intereukin-2 Metastatic
2005 Sorafenib Advanced
2006 Sunitinib Advanced
2007 Temsirolimus Advanced
2009 Bevacizumab (+ IFN-α) Metastatic
2009 Everolimus After failure of sunitinib or sorafenib
2009 Pazopanib Advanced
2012 Axitinib Failure of prior systemic therapy
2015 Nivolumab Failure of prior systemic therapy
2016 Cabozantinib Failure of prior systemic therapy
2016 Lenvatinib plus everolimus Failure of prior systemic therapy

TREATMENT OPTIONS
for patients with mRCC* have been revolutionised in a short period of
time…
1. Fyfe G, et al. J Clin Oncol 1995;13:688-96; 2. Escudier B, et al. N Engl J Med 2007;356:125-34; 3. Motzer RJ, et al. N Engl J Med 2007;356:115-24;
4. Hudes G, et al. N Engl J Med 2007;356:2271-81; 5. Escudier B, et al. Lancet 2007;370:2103-111; 6. Motzer RJ, et al. Lancet 2008;372:449-56;
7. Sternberg CN, et al. J Clin Oncol 2010;28:1061-8; 8. Rini BI, et al. Lancet 2011;378:1931-9; 9. Motzer RJ, et al. N Engl J Med 2015;373:19;
10. Choueiri TK, et al. N Engl J Med 2015;373:19; 11. Motzer RJ, et al. Lancet Oncol 2015;16:1473-82.
1992-2005 2005 2006 2007 2008 2009 2010 2011 2012 2015 2016
*mRCC: metastatic Renal Cell Carcinoma
IFN-α Bevacizumab
+ IFN-α5
High-dose
interleukin-21
Sorafenib2
Sunitinib3
Temsirolimus4 Pazopanib7
Everolimus6 Axitinib8
Nivolumab9
Cabozantinib10
Lenvatinib plus
everolimus11
MECHANISM OF ACTION OF
TREATMENTS FOR RCC
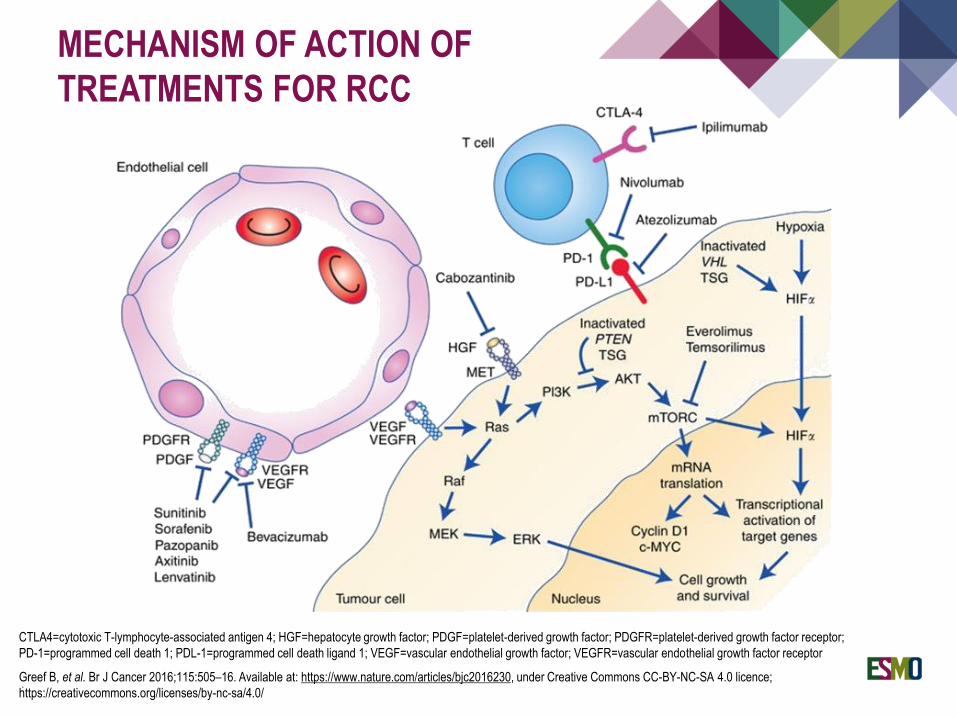
CTLA4=cytotoxic T-lymphocyte-associated antigen 4; HGF=hepatocyte growth factor; PDGF=platelet-derived growth factor; PDGFR=platelet-derived growth factor receptor;
PD-1=programmed cell death 1; PDL-1=programmed cell death ligand 1; VEGF=vascular endothelial growth factor; VEGFR=vascular endothelial growth factor receptor
Greef B, et al. Br J Cancer 2016;115:505–16. Available at: https://www.nature.com/articles/bjc2016230, under Creative Commons CC-BY-NC-SA 4.0 licence;
https://creativecommons.org/licenses/by-nc-sa/4.0/ .
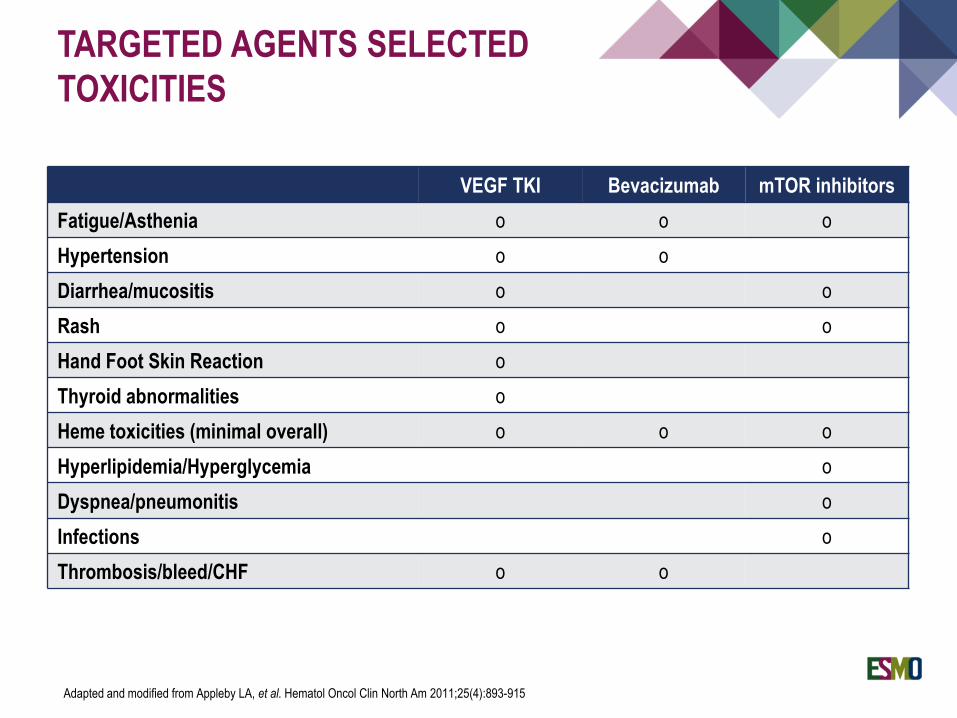
TARGETED AGENTS SELECTED
TOXICITIES
VEGF TKI Bevacizumab mTOR inhibitors
Fatigue/Asthenia o o o
Hypertension o o
Diarrhea/mucositis o o
Rash o o
Hand Foot Skin Reaction o
Thyroid abnormalities o
Heme toxicities (minimal overall) o o o
Hyperlipidemia/Hyperglycemia o
Dyspnea/pneumonitis o
Infections o
Thrombosis/bleed/CHF o o
Adapted and modified from Appleby LA, et al. Hematol Oncol Clin North Am 2011;25(4):893-915

ROLE OF NEPHRECTOMY AND METASTASECTOMY IN THE MANAGEMENT OF RCC
Randomized clinical trials have shown a benefit of cytoreductive nephrectomy
as compared to cytokine therapy alone
Several targeted therapies have demonstrated efficacy in treating metastatic
RCC.
Retrospective studies and meta-analysis have suggested a benefit for
cytoreductive nephrectomy
BACKGROUND
Flannigan R, et al. N Engl J Med. 2001; 345:1655.
Mickish G, et al. Lancet. 2001; 358:966
Bamias A, et al. Oncologist. 2017; 22:667
Garcia-Perdomo H, et al. Investig Clin Urol. 2018; 59:2
Bhindi B, et al. J Urol. 2018, Mar 21. pii: S0022-5347(18)42718-8. doi: 10.1016/j.juro.2018.03.077.
SUNITINIB ALONE OR AFTER NEPHRECTOMY IN METASTATIC RENAL-CELL CARCINOMA
CARMENA: Prospective, multicenter,
open-label, randomised, Phase III
non-inferiority study
Méjean A, et al. N Engl J Med. 2018; 379: 417- 427.

CARMENA: PROSPECTIVE, MULTICENTRE,
OPEN-LABEL, RANDOMISED, PHASE III NON-
INFERIORITY STUDY
Study design and conduct
▪ Confirmed metastatic clear cell
RCC/Biopsy
▪ Amenable to nephrectomy
▪ Eligible for sunitinib
▪ Brain metastases absent or
controlled by treatment
▪ No prior systemic therapy for RCC
R1:1
nephrectomy
Sunitinib
50 mg QD 4 wks on / 2 wks off
Sunitinib
50 mg QD 4 wks on / 2 wks off
3-6 wksARM A
ARM B
Primary endpoint:
Overall Survival
Primary endpoint:
Progression-free survival, objective response rate, clinical benefit, safety
Stratification
- MSKCC risk group
- Centre location
MSKCC: Memorial Sloan Kettering Center; QD: once daily; R: randomisation; RCC: renal cell carcinoma
Méjean A, et al. N Engl J Med. 2018; 379: 417- 427.
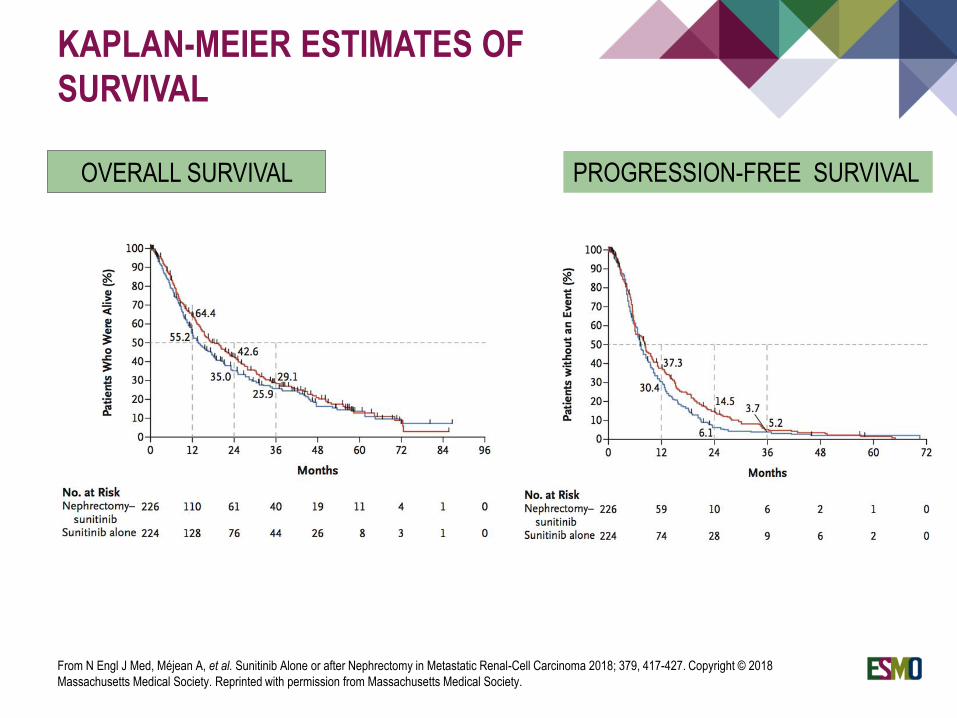
OVERALL SURVIVAL
KAPLAN-MEIER ESTIMATES OF
SURVIVAL
PROGRESSION-FREE SURVIVAL
From N Engl J Med, Méjean A, et al. Sunitinib Alone or after Nephrectomy in Metastatic Renal-Cell Carcinoma 2018; 379, 417-427. Copyright © 2018
Massachusetts Medical Society. Reprinted with permission from Massachusetts Medical Society.
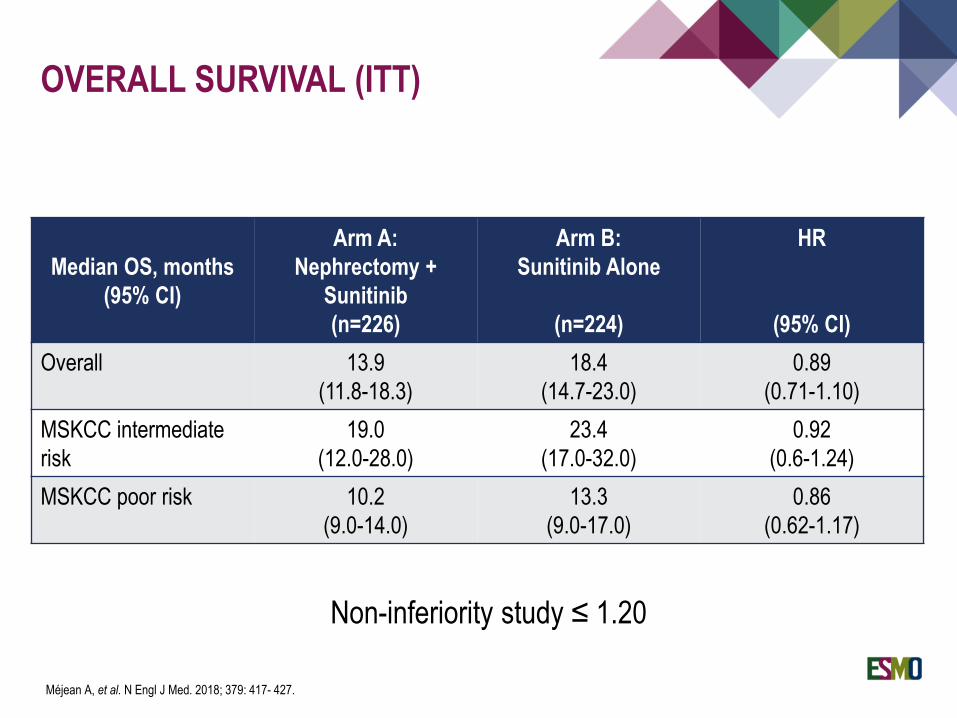
OVERALL SURVIVAL
Median OS, months
(95% CI)
Arm A:
Nephrectomy +
Sunitinib
(n=226)
Arm B:
Sunitinib Alone
(n=224)
HR
(95% CI)
Overall 13.9
(11.8-18.3)
18.4
(14.7-23.0)
0.89
(0.71-1.10)
MSKCC intermediate
risk
19.0
(12.0-28.0)
23.4
(17.0-32.0)
0.92
(0.6-1.24)
MSKCC poor risk 10.2
(9.0-14.0)
13.3
(9.0-17.0)
0.86
(0.62-1.17)
OVERALL SURVIVAL (ITT)
Non-inferiority study ≤ 1.20
Méjean A, et al. N Engl J Med. 2018; 379: 417- 427.
Sunitinib alone is non-inferior to cytoreductive nephrectomy followed by sunitinib for
overall survival, both in intermediate- and poor-risk patients with metastatic RCC
Clinical benefit was also significantly better in the sunitinib alone arm
Cytoreductive nephrectomy should no longer be considered standard of care in
intermediate- and poor-risk MSKCC groups of metastatic RCC, at least when
medical treatment is required
CONCLUSIONS

RESORT TRIAL:STUDY DESIGN
Key eligibility criteria
• Histological diagnosis of predominantly clear
cell RCC
• Maximum 3 metastatic lesions
(independently if the site)
• Absence of radiological residual lesions
following removal of metastatic disease
• Histologically proven disease free margins of
resected surgical specimens
• No more than three months from radical
resection of metastases
• ECOG Performance Status of 0-2
Randomised
1:1
Stratification according to:
• Time from nephrectomy
( > or < 12 months)
• Site of disease ( lung vs.
others)
• Number of lesions ( single
vs. multiple)
Sorafenib *
for 52 weeks
Observation
for 52 weeks
Primary endpoint:
Recurrence-free
survival
Primary endpoint:
Overall survival and safety profile
Exploratory endpoint:
Translational analyses and tumour
samples
Sorafenib dose: Sorafenib 400 mg once a day for 3 weeks. After 21 days, the dose should be increased to the standard dose
(400 mg bid) if the patient has not experienced greater than grade 1 skin toxicity or greater than grade 2 of any other toxicities.
Procopio G, et al. A randomized, open label, multicenter phase 2 study, to evaluate the efficacy of sorafenib (So) in patients (pts) with metastatic renal cell carcinoma
(mRCC) after a radical resection of the metastases: RESORT trial. J Clin Oncol 36, 2018 (suppl; abstr 4502).
Courtesy of Prof G Procopio
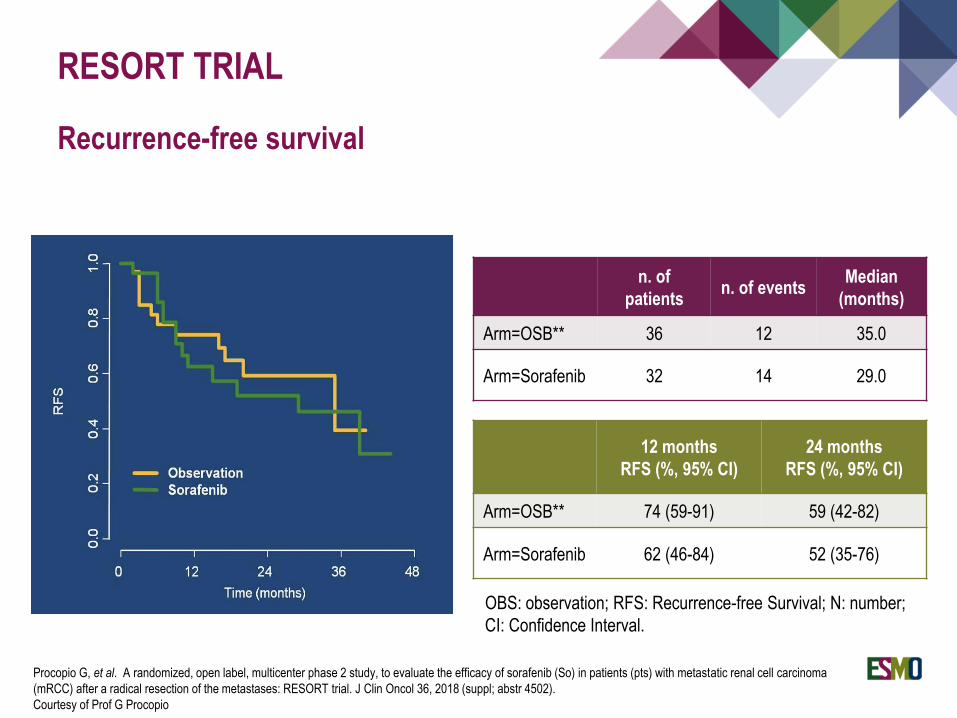
RESORT TRIAL
Recurrence-free survival
n. of
patientsn. of events
Median
(months)
Arm=OSB** 36 12 35.0
Arm=Sorafenib 32 14 29.0
12 months
RFS (%, 95% CI)
24 months
RFS (%, 95% CI)
Arm=OSB** 74 (59-91) 59 (42-82)
Arm=Sorafenib 62 (46-84) 52 (35-76)
OBS: observation; RFS: Recurrence-free Survival; N: number;
CI: Confidence Interval.
Procopio G, et al. A randomized, open label, multicenter phase 2 study, to evaluate the efficacy of sorafenib (So) in patients (pts) with metastatic renal cell carcinoma
(mRCC) after a radical resection of the metastases: RESORT trial. J Clin Oncol 36, 2018 (suppl; abstr 4502).
Courtesy of Prof G Procopio
RESORT trial did not meet its primary endpoint
Sorafenib did not improve recurrence-free survival over observation in patients with
metastatic RCC after radical metastasectomy
The limited sample size and the heterogeneity of the study population suggest to
consider the efficacy of the results with caution.
CONCLUSIONS

CHOICE OF TARGETED AGENT IN FIRST-LINE TREATMENT
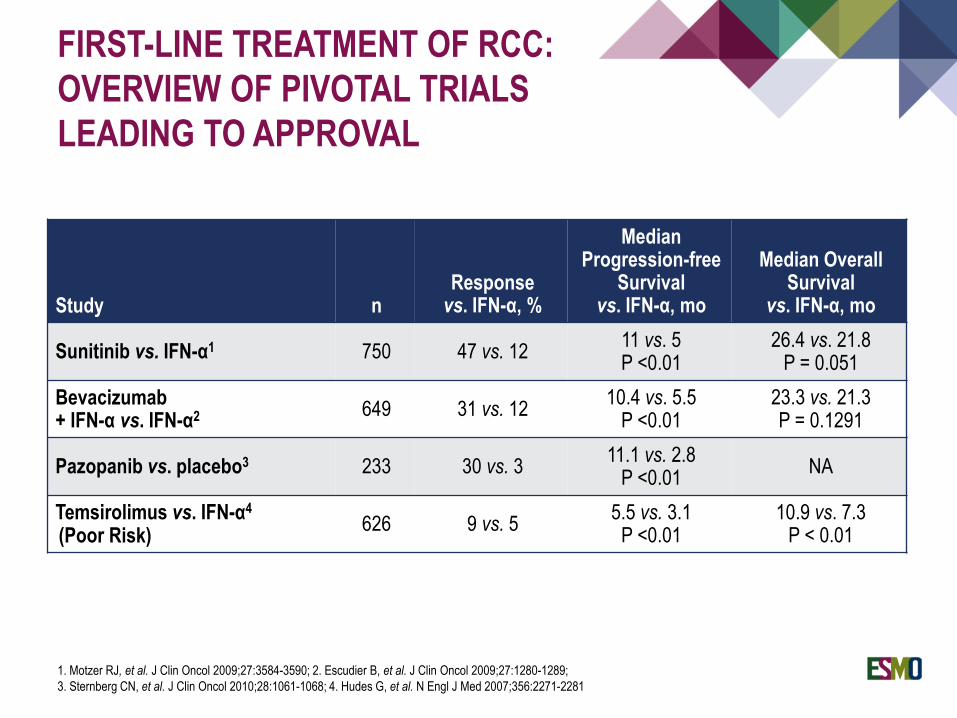
FIRST-LINE TREATMENT OF RCC:
OVERVIEW OF PIVOTAL TRIALS
LEADING TO APPROVAL
Study nResponse
vs. IFN-α, %
MedianProgression-free
Survivalvs. IFN-α, mo
Median Overall Survival
vs. IFN-α, mo
Sunitinib vs. IFN-α1 750 47 vs. 1211 vs. 5P <0.01
26.4 vs. 21.8P = 0.051
Bevacizumab+ IFN-α vs. IFN-α2 649 31 vs. 12
10.4 vs. 5.5P <0.01
23.3 vs. 21.3P = 0.1291
Pazopanib vs. placebo3 233 30 vs. 311.1 vs. 2.8
P <0.01NA
Temsirolimus vs. IFN-α4
(Poor Risk)626 9 vs. 5
5.5 vs. 3.1P <0.01
10.9 vs. 7.3 P < 0.01
1. Motzer RJ, et al. J Clin Oncol 2009;27:3584-3590; 2. Escudier B, et al. J Clin Oncol 2009;27:1280-1289;
3. Sternberg CN, et al. J Clin Oncol 2010;28:1061-1068; 4. Hudes G, et al. N Engl J Med 2007;356:2271-2281
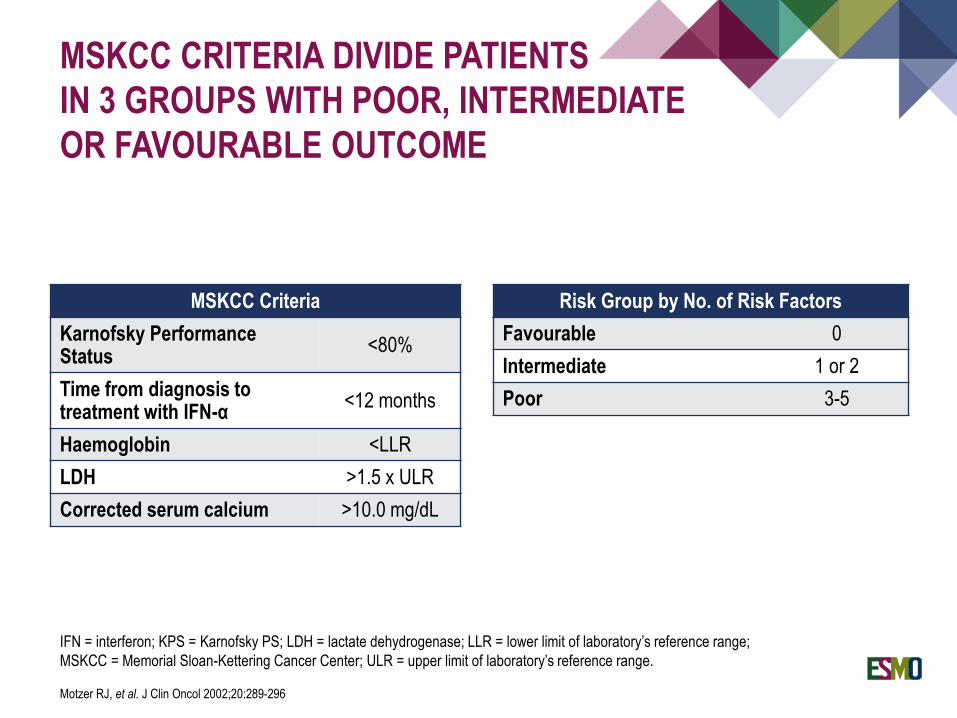
MSKCC CRITERIA DIVIDE PATIENTS
IN 3 GROUPS WITH POOR, INTERMEDIATE
OR FAVOURABLE OUTCOME
Risk Group by No. of Risk Factors
Favourable 0
Intermediate 1 or 2
Poor 3-5
MSKCC Criteria
Karnofsky Performance Status
<80%
Time from diagnosis to treatment with IFN-α
<12 months
Haemoglobin <LLR
LDH >1.5 x ULR
Corrected serum calcium >10.0 mg/dL
IFN = interferon; KPS = Karnofsky PS; LDH = lactate dehydrogenase; LLR = lower limit of laboratory’s reference range;
MSKCC = Memorial Sloan-Kettering Cancer Center; ULR = upper limit of laboratory’s reference range.
Motzer RJ, et al. J Clin Oncol 2002;20:289-296
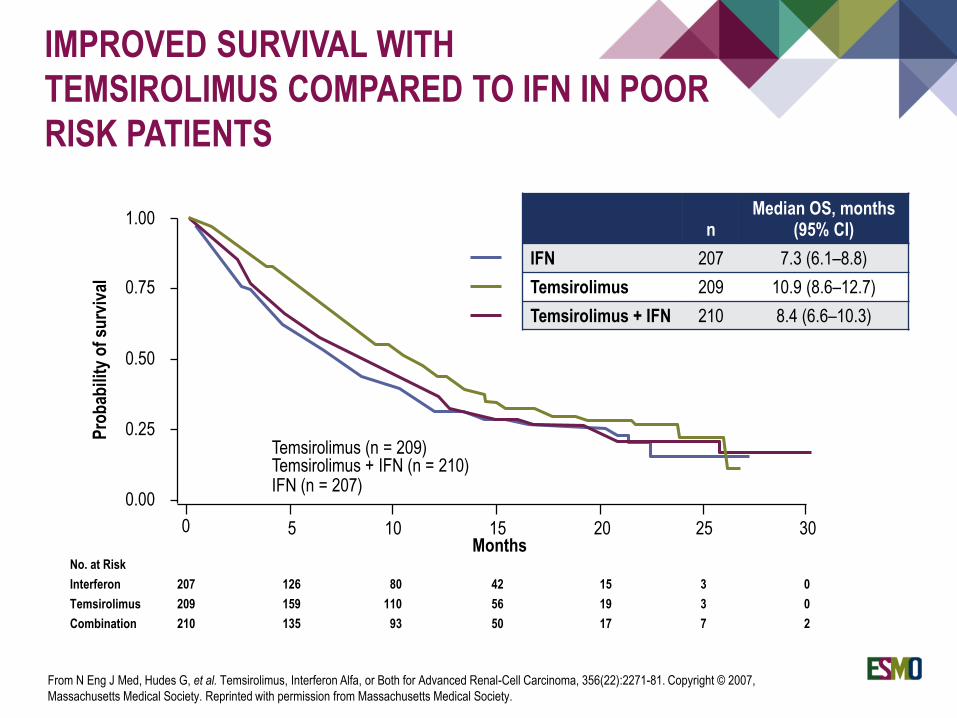
No. at Risk
Interferon 207 126 80 42 15 3 0
Temsirolimus 209 159 110 56 19 3 0
Combination 210 135 93 50 17 7 2
IMPROVED SURVIVAL WITH
TEMSIROLIMUS COMPARED TO IFN IN POOR
RISK PATIENTS
1.00
0.75
0.50
0.00
0.25
0 5 10 15 20 25 30
Temsirolimus (n = 209) Temsirolimus + IFN (n = 210)IFN (n = 207)
Pro
bab
ility
of
surv
ival
Months
From N Eng J Med, Hudes G, et al. Temsirolimus, Interferon Alfa, or Both for Advanced Renal-Cell Carcinoma, 356(22):2271-81. Copyright © 2007,
Massachusetts Medical Society. Reprinted with permission from Massachusetts Medical Society.
nMedian OS, months
(95% CI)
IFN 207 7.3 (6.1–8.8)
Temsirolimus 209 10.9 (8.6–12.7)
Temsirolimus + IFN 210 8.4 (6.6–10.3)
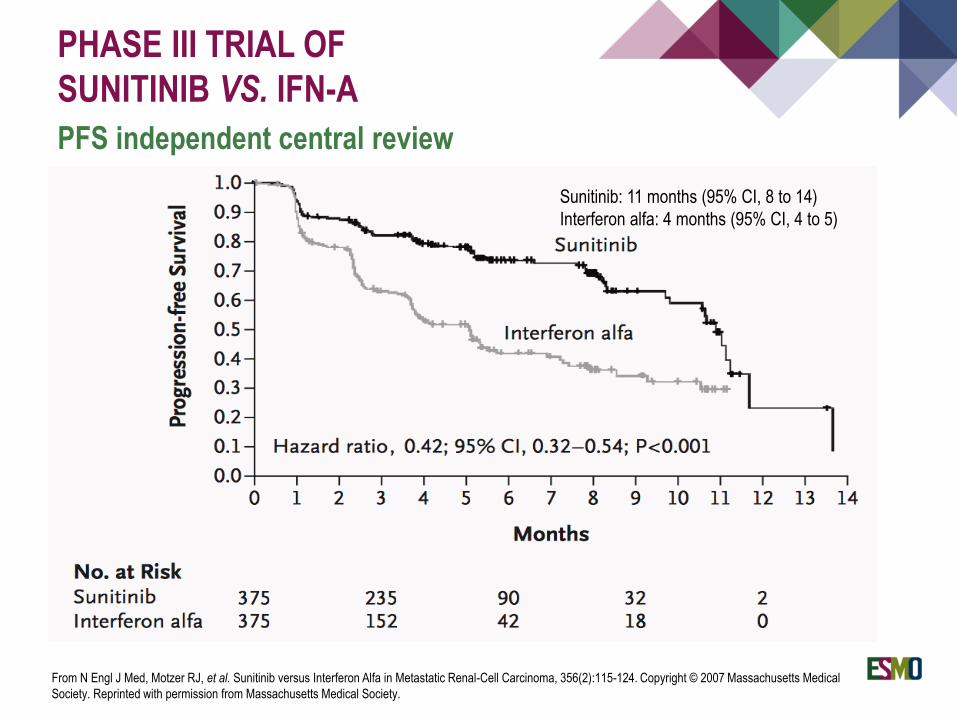
PHASE III TRIAL OF
SUNITINIB VS. IFN-Α
PFS independent central review
Sunitinib: 11 months (95% CI, 8 to 14)
Interferon alfa: 4 months (95% CI, 4 to 5)
From N Engl J Med, Motzer RJ, et al. Sunitinib versus Interferon Alfa in Metastatic Renal-Cell Carcinoma, 356(2):115-124. Copyright © 2007 Massachusetts Medical
Society. Reprinted with permission from Massachusetts Medical Society.
PAZOPANIB VS. SUNITINIB
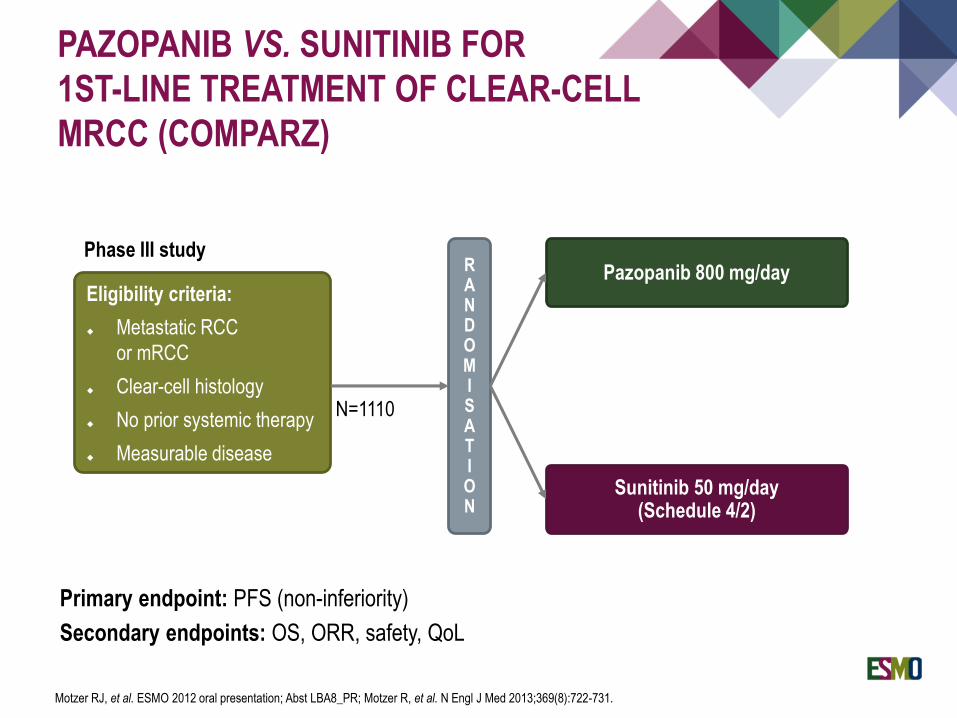
PAZOPANIB VS. SUNITINIB FOR
1ST-LINE TREATMENT OF CLEAR-CELL
MRCC (COMPARZ)
Primary endpoint: PFS (non-inferiority)
Secondary endpoints: OS, ORR, safety, QoL
Pazopanib 800 mg/day
Sunitinib 50 mg/day (Schedule 4/2)
N=1110
Eligibility criteria:
Metastatic RCC
or mRCC
Clear-cell histology
No prior systemic therapy
Measurable disease
RANDOMISATION
Phase III study
Motzer RJ, et al. ESMO 2012 oral presentation; Abst LBA8_PR; Motzer R, et al. N Engl J Med 2013;369(8):722-731.

PRIMARY ENDPOINT:
PROGRESSION-FREE SURVIVAL
(INDEPENDENT REVIEW)
Pazopanib
Sunitinib
N Median PFS (95% CI)
Pazopanib 557 8.4 mo (8.3, 10.9)
Sunitinib 553 9.5 mo (8.3, 11.1)
HR (95% CI ) = 1.047 (0.898,1.220)
The upper bound of 95% CI hazard
ratio <1.25 indicates pazopanib is
non-inferior compared to sunitinib
From N Engl J Med, Motzer R, et al. Pazopanib versus Sunitinib in Metastatic Renal-Cell Carcinoma 2013;369(8):722-731. Copyright © 2013. Massachusetts
Medical Society. Reprinted with permission from Massachusetts Medical Society.
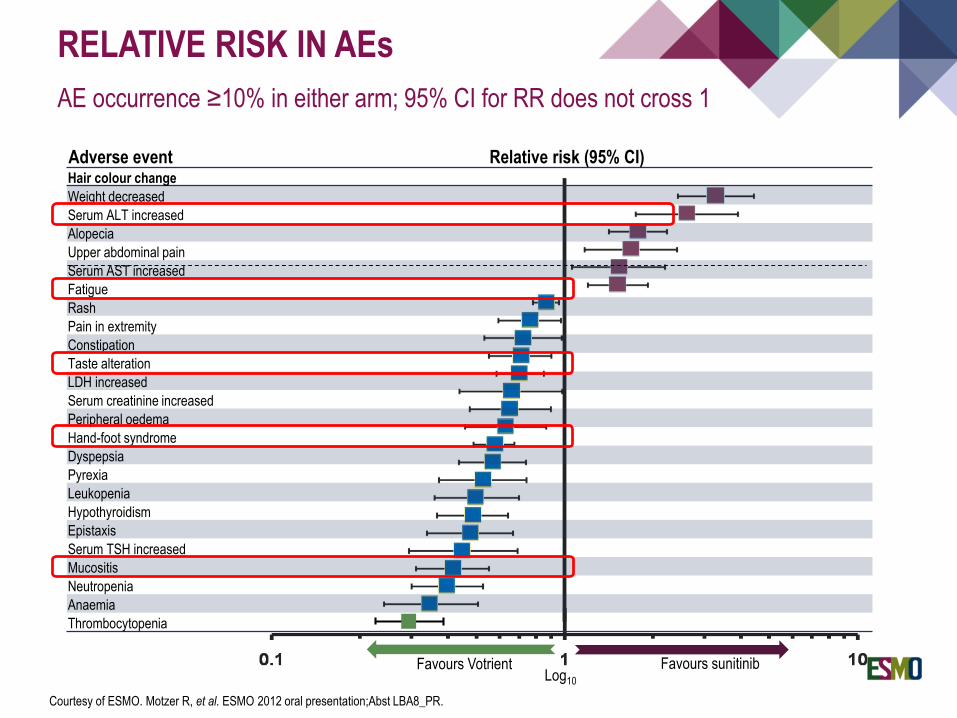
Hair colour change
Weight decreased
Serum ALT increased
Alopecia
Upper abdominal pain
Serum AST increased
Fatigue
Rash
Pain in extremity
Constipation
Taste alteration
LDH increased
Serum creatinine increased
Peripheral oedema
Hand-foot syndrome
Dyspepsia
Pyrexia
Leukopenia
Hypothyroidism
Epistaxis
Serum TSH increased
Mucositis
Neutropenia
Anaemia
Thrombocytopenia
Relative risk (95% CI)
Favours Votrient Favours sunitinib
Adverse event
Log10
RELATIVE RISK IN AEs
AE occurrence ≥10% in either arm; 95% CI for RR does not cross 1
Courtesy of ESMO. Motzer R, et al. ESMO 2012 oral presentation;Abst LBA8_PR.

PRECLINICAL DATA SUGGEST HIGHER POTENCY OF NEW VEGF-R INHIBITORS TIVOZANIB AND AXITINIBIN FIRST-LINE TREATMENT

IN VITRO POTENCY OF TIVOZANIB
AND AXITINIB COMPARED TO OTHER TKIS1
VEGFR-1 VEGFR-2 VEGFR-3
More potent
Less potent
Sunitinib1 Sorafenib1
Axitinib*,1
(AG13736)
Pazopanib1
(GW-786034)
Tivozanib2,3
(AV-951)
Approximate: adjustment in
consideration of 2.3% BSA
Note: Reported potencies* are either biochemical- or cell-based IC50s (nM); cell-based data are shown when available.
*Axitinib data for VEGFR-2 are from an ELISA assay; all other axitinib data are from an immunoprecipitation essay.
In addition, Chow LQM, Eckhardt SG reported an axitinib IC50 of 1.2, 0.25, and 0.29 nM for VEGFR-1, -2, and -3 (J Clin Oncol 2007;25:884-95)
1. Axitinib FDA Oncologic Drugs Advisory Committee briefing document. 12/7/2011; 2. Eskens FALM et al. Proceedings of the 99th Annual Meeting of the
AACR 2008:Abst LB-201; 3. Nakamura K, et al. Cancer Res 2006;66:9134-9142;
Courtesy of Prof Tim Eisen.

AXITINIB FOR FIRST-LINE
METASTATIC RCC
Overall efficacy and pharmacokinetic analyses from a randomised
Phase II study: Study design
1:1
Arm CAxitinib ≤5 mg BID(no dose titration)
Arm BAxitinib 5 mg BID
+Placebo dose titrationb
(blinded therapy)
Arm AAxitinib 5 mg BID
+Axitinib dose titrationb
(blinded therapy)
R
A
N
D
O
M
I
S
EDuring Cycle 1
(subset of patients)
ABPMc
6-h PK samplingd
Randomisation criteriaa
BP ≤150/90 mmHg
and
≤2 concurrent anti-HTN medications
andNo grade 3 or 4
axitinib-related toxicities
and
No dose reduction
Lead-in period(Cycle 1)
Axitinib 5 mg BID(4 wks)
aFor at least 2 consecutive weeksbTitrated stepwise to 7 mg BID and then to a maximum of 10 mg BID if criteria for randomisation to dose titration were metcAmbulatory blood pressure monitoring performed at baseline and on Cycle 1 Days 4 and 15; d6-hr PK sampling performed on
Cycle 1 Day 15Rini B, et al. Lancet Oncol 2013;14:1233–42
Yes
No
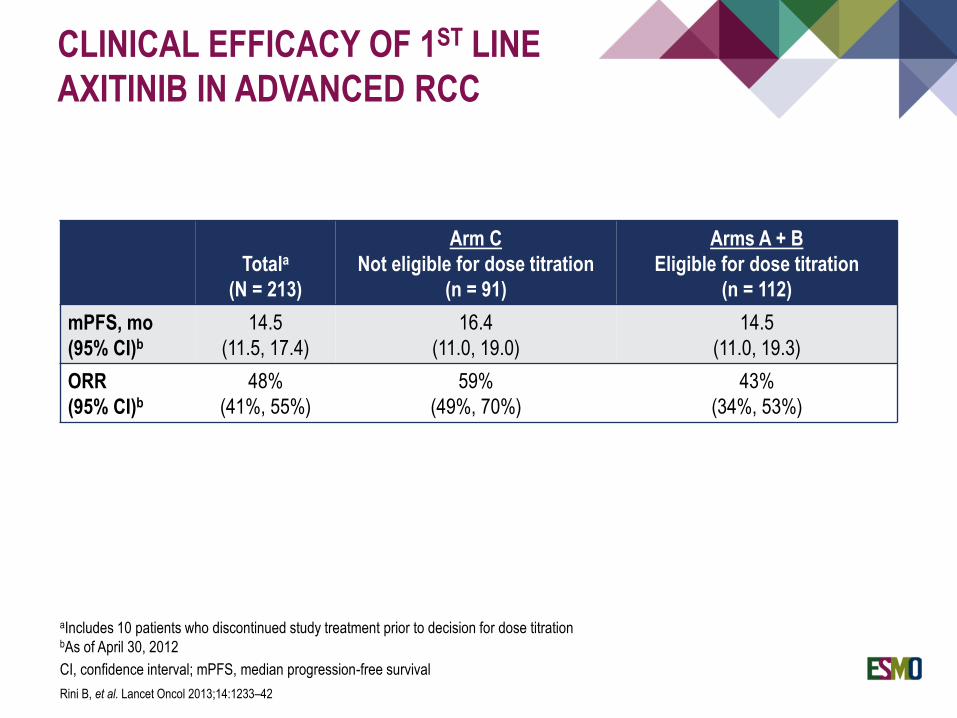
CLINICAL EFFICACY OF 1ST LINE
AXITINIB IN ADVANCED RCC
Totala
(N = 213)
Arm C
Not eligible for dose titration
(n = 91)
Arms A + B
Eligible for dose titration
(n = 112)
mPFS, mo
(95% CI)b
14.5
(11.5, 17.4)
16.4
(11.0, 19.0)
14.5
(11.0, 19.3)
ORR
(95% CI)b
48%
(41%, 55%)
59%
(49%, 70%)
43%
(34%, 53%)
aIncludes 10 patients who discontinued study treatment prior to decision for dose titrationbAs of April 30, 2012
CI, confidence interval; mPFS, median progression-free survival
Rini B, et al. Lancet Oncol 2013;14:1233–42
Axitinib versus sorafenib as first-line therapy in patients with
metastatic renal cell carcinoma (mRCC)
TE Hutson1, J Gallardo2, V Lesovoy3, S Al-Shukri4,
VP Stus5, A Bair6, B Rosbrook6, P Bycott6, J Tarazi6,
S Kim6, NJ Vogelzang7
1. GU Oncology Program, Baylor Sammons Cancer Center, Dallas, TX and US Oncology Research, Houston, TX; 2. Instituto de Terapias
Oncológicas, Providencia, Santiago, Chile; 3. Kharkiv Regional Clinical Center of Urology and Nephrology, Kharkiv, Ukraine; 4. Department
of Urology, Saint-Petersburg State Medical University, Saint-Petersburg, Russian Federation; 5. Department of Urology, Municipal
Institution “Dnipropetrovs’k Regional Clinical Hospital n.a. I.I. Mechnikov”, Dnipropetrovsk, Ukraine; 6. Clinical Development, Pfizer
Oncology, San Diego, CA; 7. Comprehensive Cancer Centers of Nevada, Las Vegas, NV, and US Oncology Research, Houston, TX.
Hutson TE, et al. Lancet Oncol. 2013 Dec;14(13):1287-94
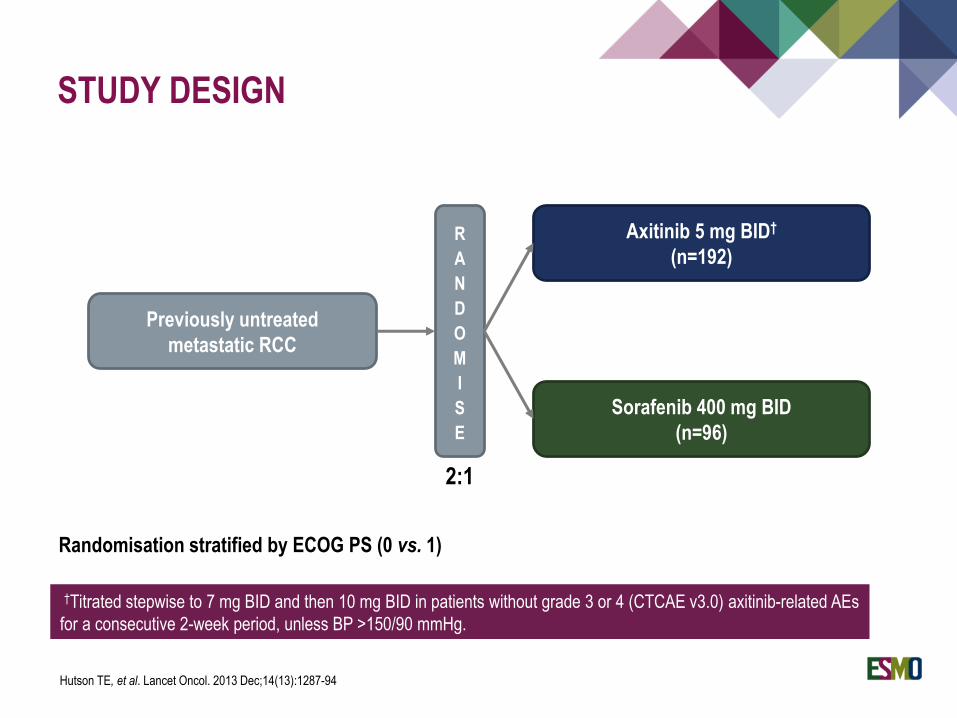
STUDY DESIGN
Previously untreated
metastatic RCC
R
A
N
D
O
M
I
S
E
Axitinib 5 mg BID†
(n=192)
2:1
Sorafenib 400 mg BID
(n=96)
Randomisation stratified by ECOG PS (0 vs. 1)
†Titrated stepwise to 7 mg BID and then 10 mg BID in patients without grade 3 or 4 (CTCAE v3.0) axitinib-related AEs
for a consecutive 2-week period, unless BP >150/90 mmHg.
Hutson TE, et al. Lancet Oncol. 2013 Dec;14(13):1287-94
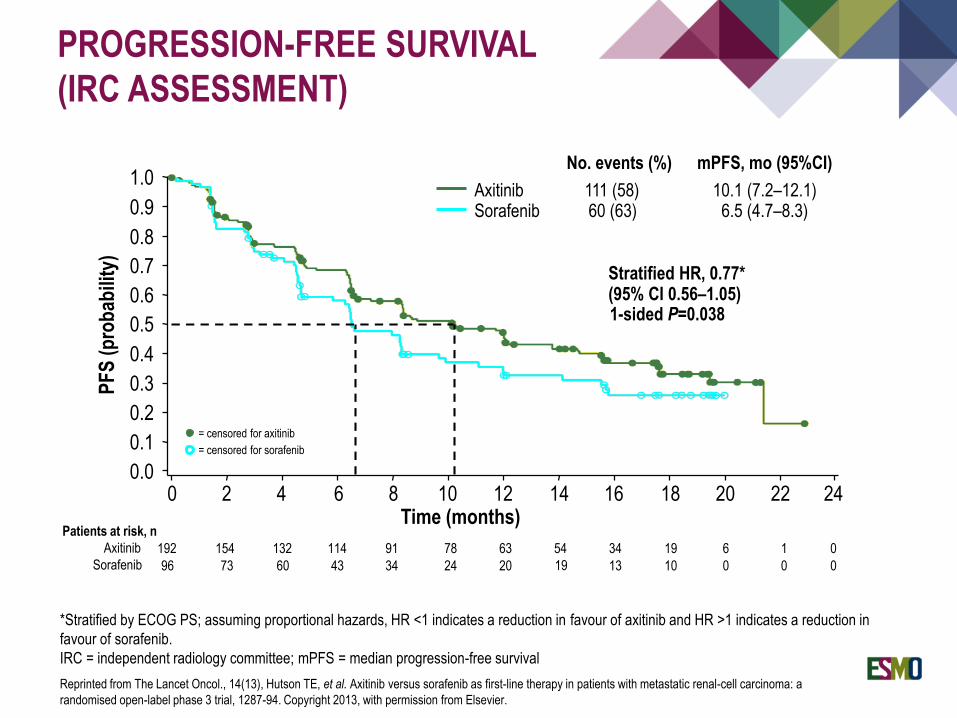
PROGRESSION-FREE SURVIVAL
(IRC ASSESSMENT)
*Stratified by ECOG PS; assuming proportional hazards, HR <1 indicates a reduction in favour of axitinib and HR >1 indicates a reduction in
favour of sorafenib.
IRC = independent radiology committee; mPFS = median progression-free survival
1.0
0.9
0.8
0.7
0.6
0.5
0.4
0.3
0.2
0.1
0.00 2 4 6 8 10
Time (months)12 14 16 18 20
PF
S (
pro
bab
ility
)
22 24
1-sided P=0.038
Stratified HR, 0.77*(95% CI 0.56–1.05)
192 154 132 114 91 78 63 54 19 6 0
96 73 60 43 34 24 20 19 10 0 0
Patients at risk, n
Axitinib
Sorafenib
34
13
1
0
= censored for axitinib
= censored for sorafenib
10.1 (7.2–12.1)6.5 (4.7–8.3)
AxitinibSorafenib
No. events (%)
111 (58)60 (63)
mPFS, mo (95%CI)
Reprinted from The Lancet Oncol., 14(13), Hutson TE, et al. Axitinib versus sorafenib as first-line therapy in patients with metastatic renal-cell carcinoma: a
randomised open-label phase 3 trial, 1287-94. Copyright 2013, with permission from Elsevier.

CABOzantinib versus SUNitinib (CABOSUN) as initial targeted therapy for patients with metastatic renal cell
carcinoma (mRCC) of poor and intermediate risk groups
ALLIANCE A031203 Trial
Toni K. Choueiri MD, Susan Halabi PhD, Ben Sanford
MS, Olwen Hahn MD, M. Dror Michaelson MD, Meghara
Walsh RN, Thomas Olencki MD, Joel Picus MD, Eric
Small MD, Shaker Dakhil MD, Daniel George MD, and
Michael J. Morris MD
Choueiri TK, et al. J Clin Oncol 2017;35:591-7
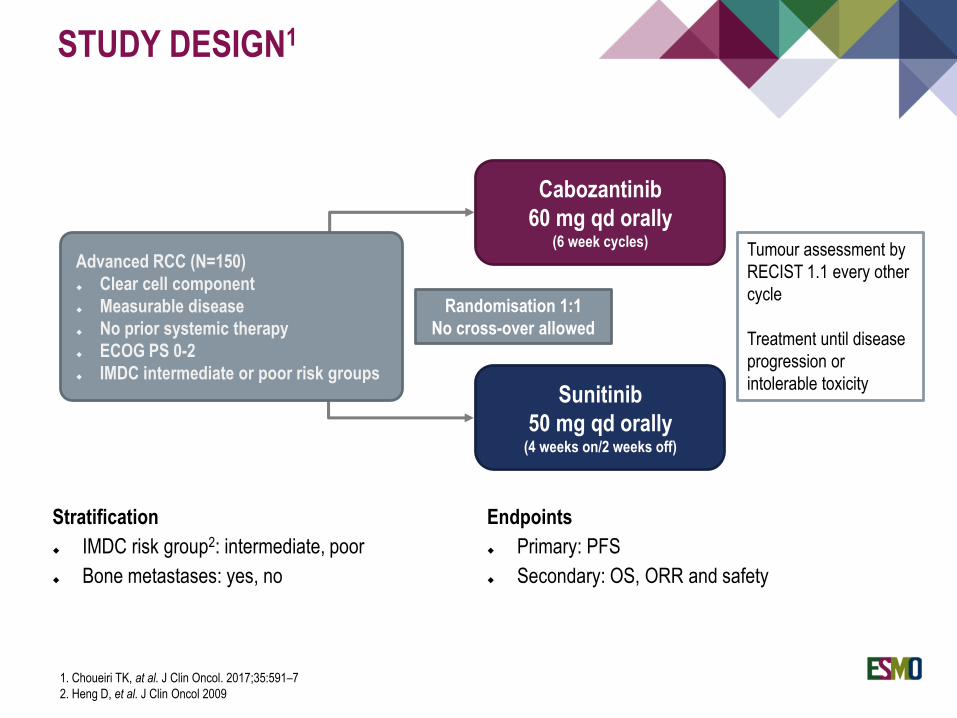
STUDY DESIGN1
Advanced RCC (N=150)
Clear cell component
Measurable disease
No prior systemic therapy
ECOG PS 0-2
IMDC intermediate or poor risk groups
Cabozantinib
60 mg qd orally(6 week cycles)
Sunitinib
50 mg qd orally(4 weeks on/2 weeks off)
Randomisation 1:1
No cross-over allowed
Tumour assessment by
RECIST 1.1 every other
cycle
Treatment until disease
progression or
intolerable toxicity
Stratification
IMDC risk group2: intermediate, poor
Bone metastases: yes, no
Endpoints
Primary: PFS
Secondary: OS, ORR and safety
1. Choueiri TK, at al. J Clin Oncol. 2017;35:591–7
2. Heng D, et al. J Clin Oncol 2009
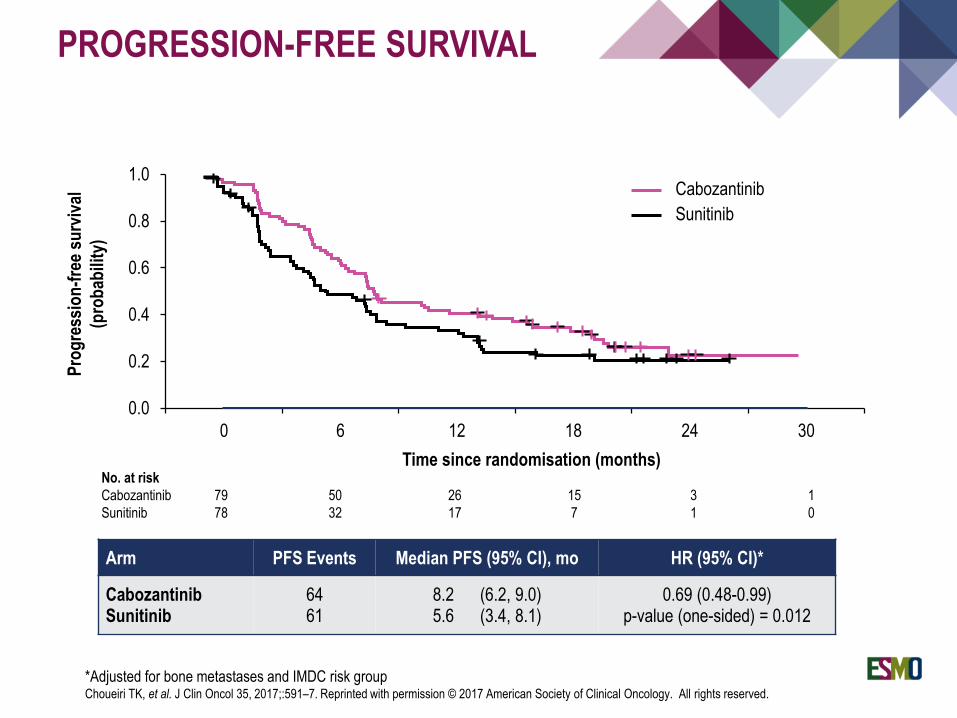
Arm PFS Events Median PFS (95% CI), mo HR (95% CI)*
CabozantinibSunitinib
6461
8.2 (6.2, 9.0)5.6 (3.4, 8.1)
0.69 (0.48-0.99)p-value (one-sided) = 0.012
0.0
0.2
0.4
0.6
0.8
1.0
0 6 12 18 24 30
Pro
gre
ssio
n-f
ree
surv
ival
(pro
bab
ility
)
Cabozantinib
Sunitinib
No. at risk
Cabozantinib 79 50 26 15 3 1
Sunitinib 78 32 17 7 1 0
Time since randomisation (months)
PROGRESSION-FREE SURVIVAL
*Adjusted for bone metastases and IMDC risk groupChoueiri TK, et al. J Clin Oncol 35, 2017;:591–7. Reprinted with permission © 2017 American Society of Clinical Oncology. All rights reserved.
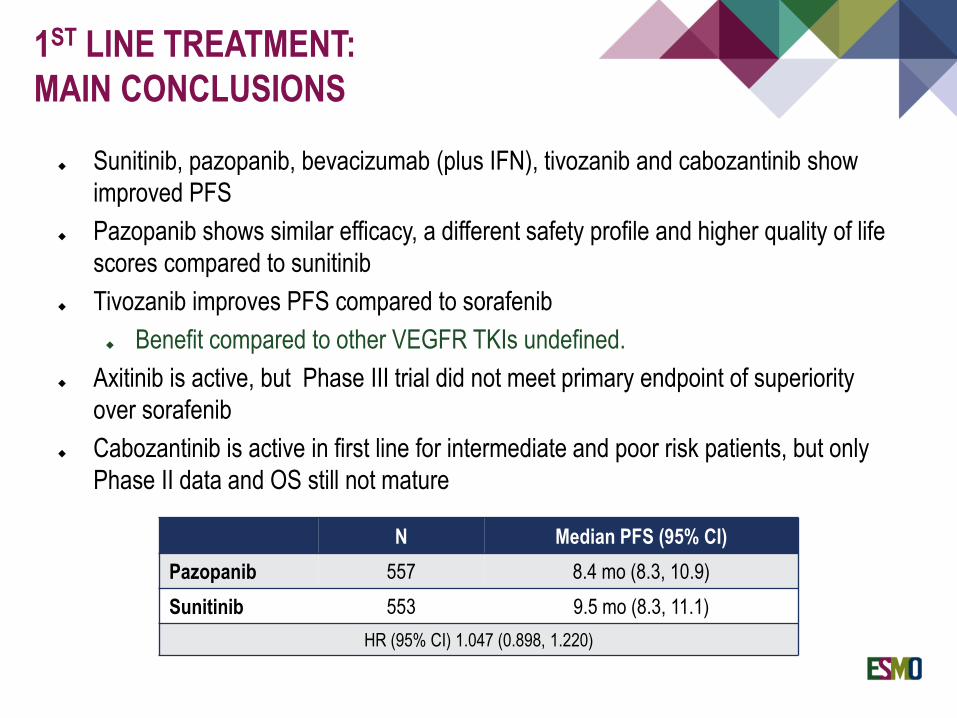
Sunitinib, pazopanib, bevacizumab (plus IFN), tivozanib and cabozantinib show
improved PFS
Pazopanib shows similar efficacy, a different safety profile and higher quality of life
scores compared to sunitinib
Tivozanib improves PFS compared to sorafenib
Benefit compared to other VEGFR TKIs undefined.
Axitinib is active, but Phase III trial did not meet primary endpoint of superiority
over sorafenib
Cabozantinib is active in first line for intermediate and poor risk patients, but only
Phase II data and OS still not mature
1ST LINE TREATMENT:
MAIN CONCLUSIONS
N Median PFS (95% CI)
Pazopanib 557 8.4 mo (8.3, 10.9)
Sunitinib 553 9.5 mo (8.3, 11.1)
HR (95% CI) 1.047 (0.898, 1.220)
SECOND-LINE TREATMENT AFTER FAILURE OF ANTI-VEGF

2ND LINE EVEROLIMUS VS.
PLACEBO
Study design and conduct
N = 416
Stratification
Prior VEGFR-TKI: 1 or 2
MSKCC risk group:
favourable, intermediate,
or poor
RANDOMISATION
Placebo + BSC
(n = 139)
Upon Disease
Progression
Safety interim
analysis
Everolimus 10 mg/day +
best supportive care (BSC) (n = 277)
416 patients randomised between December 2006 and November 2007
Analysis cut-off: February 28, 2008, based on 266 PFS events
Second interim analysis based on cut-off: October 15, 2007, efficacy boundary crossed with 410
patients/191 PFS events,complete study unblinded on February 28, 2008
Second interim
analysis data cut-
off: October 15,
2007, N = 4101
End of double- blind
analysis data cut-off:
February 28, 20082
Study
Unblinded
2:1
1. Motzer RJ, et al. Lancet 2008;372(9637):449-456
2. Motzer RJ, et al. Cancer 2010;116(18):4256-65
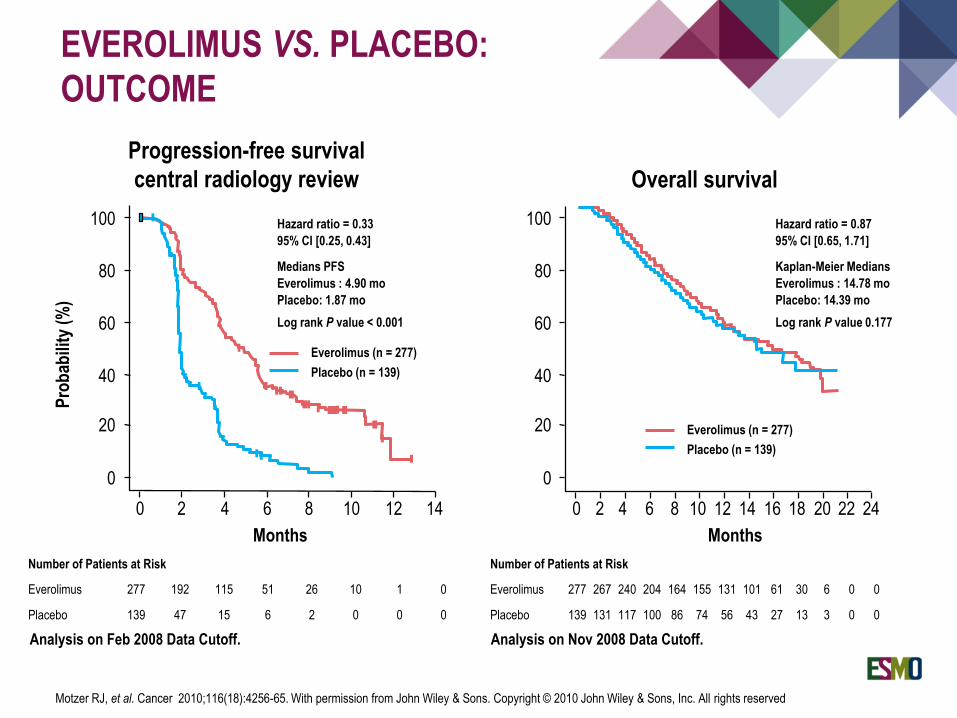
EVEROLIMUS VS. PLACEBO:
OUTCOME
Number of Patients at Risk
Everolimus 277 192 115 51 26 10 1 0
Placebo 139 47 15 6 2 0 0 0
Analysis on Feb 2008 Data Cutoff. Analysis on Nov 2008 Data Cutoff.
Number of Patients at Risk
Everolimus 277 267 240 204 164 155 131 101 61 30 6 0 0
Placebo 139 131 117 100 86 74 56 43 27 13 3 0 0
Pro
bab
ility
(%
)
100
80
60
40
20
0
0 2 4 6 8 10 12 14 0 2 4 6 8 10 12 14 16 18 20 22 24
Hazard ratio = 0.87
95% CI [0.65, 1.71]
Kaplan-Meier Medians
Everolimus : 14.78 mo
Placebo: 14.39 mo
Log rank P value 0.177
Hazard ratio = 0.33
95% CI [0.25, 0.43]
Medians PFS
Everolimus : 4.90 mo
Placebo: 1.87 mo
Log rank P value < 0.001
Everolimus (n = 277)
Placebo (n = 139)
Progression-free survival
central radiology review Overall survival
Everolimus (n = 277)
Placebo (n = 139)
Months Months
Motzer RJ, et al. Cancer 2010;116(18):4256-65. With permission from John Wiley & Sons. Copyright © 2010 John Wiley & Sons, Inc. All rights reserved
100
80
60
40
20
0
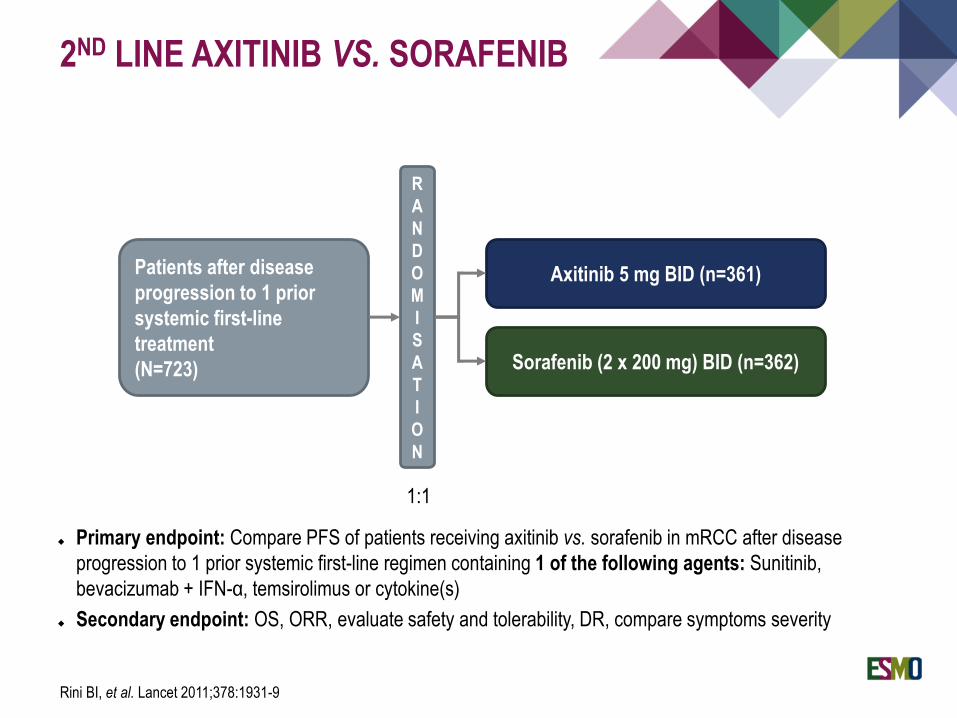
2ND LINE AXITINIB VS. SORAFENIB
Primary endpoint: Compare PFS of patients receiving axitinib vs. sorafenib in mRCC after disease
progression to 1 prior systemic first-line regimen containing 1 of the following agents: Sunitinib,
bevacizumab + IFN-α, temsirolimus or cytokine(s)
Secondary endpoint: OS, ORR, evaluate safety and tolerability, DR, compare symptoms severity
Patients after disease
progression to 1 prior
systemic first-line
treatment
(N=723)
R
A
N
D
O
M
I
S
A
T
I
O
N
Sorafenib (2 x 200 mg) BID (n=362)
Axitinib 5 mg BID (n=361)
1:1
Rini BI, et al. Lancet 2011;378:1931-9
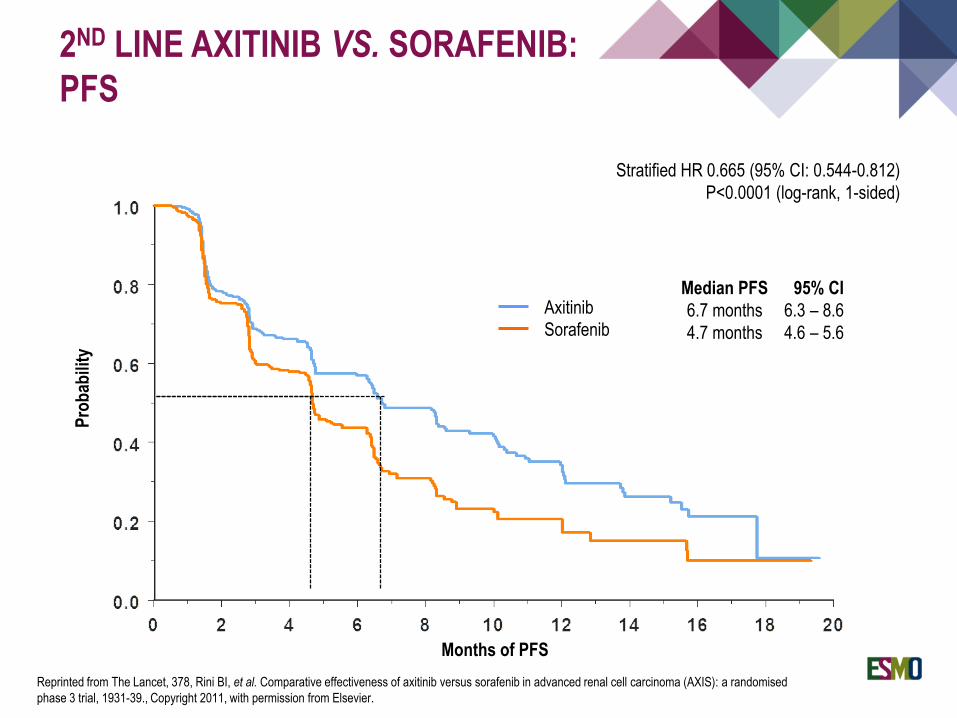
2ND LINE AXITINIB VS. SORAFENIB:
PFS
Months of PFS
Pro
bab
ility
Axitinib
Sorafenib
Stratified HR 0.665 (95% CI: 0.544-0.812)
P<0.0001 (log-rank, 1-sided)
Median PFS 95% CI
6.7 months 6.3 – 8.6
4.7 months 4.6 – 5.6
Reprinted from The Lancet, 378, Rini BI, et al. Comparative effectiveness of axitinib versus sorafenib in advanced renal cell carcinoma (AXIS): a randomised
phase 3 trial, 1931-39., Copyright 2011, with permission from Elsevier.
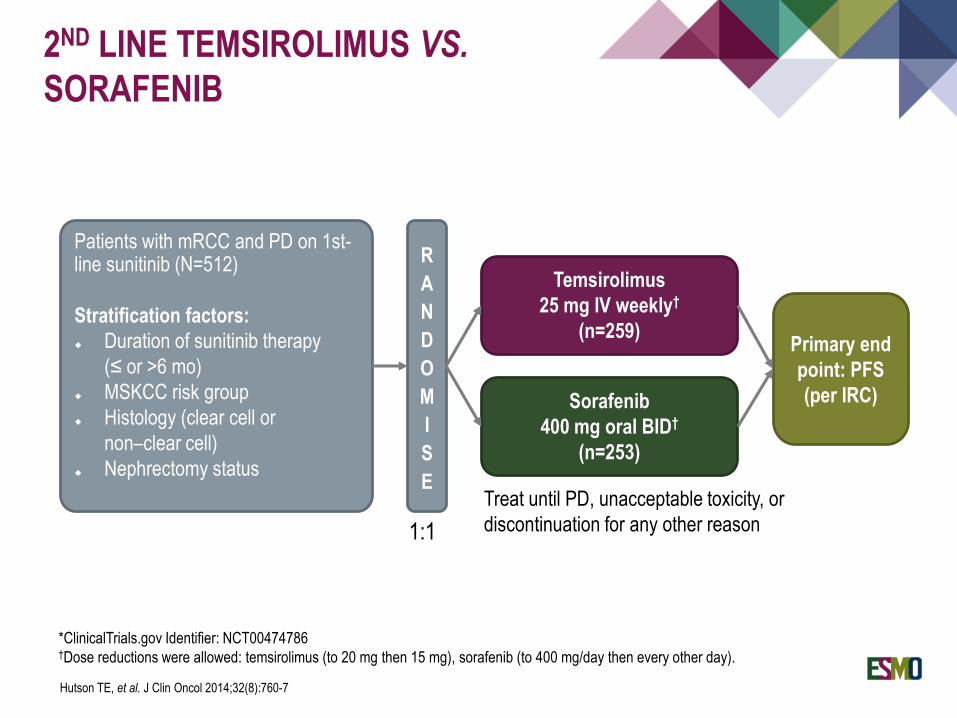
Patients with mRCC and PD on 1st-line sunitinib (N=512)
Stratification factors:
Duration of sunitinib therapy
(≤ or >6 mo)
MSKCC risk group
Histology (clear cell or
non–clear cell)
Nephrectomy status
R
A
N
D
O
M
I
S
E
1:1
Temsirolimus
25 mg IV weekly†
(n=259)
Sorafenib
400 mg oral BID†
(n=253)
Treat until PD, unacceptable toxicity, or
discontinuation for any other reason
Primary end
point: PFS
(per IRC)
*ClinicalTrials.gov Identifier: NCT00474786†Dose reductions were allowed: temsirolimus (to 20 mg then 15 mg), sorafenib (to 400 mg/day then every other day).
2ND LINE TEMSIROLIMUS VS.
SORAFENIB
Hutson TE, et al. J Clin Oncol 2014;32(8):760-7
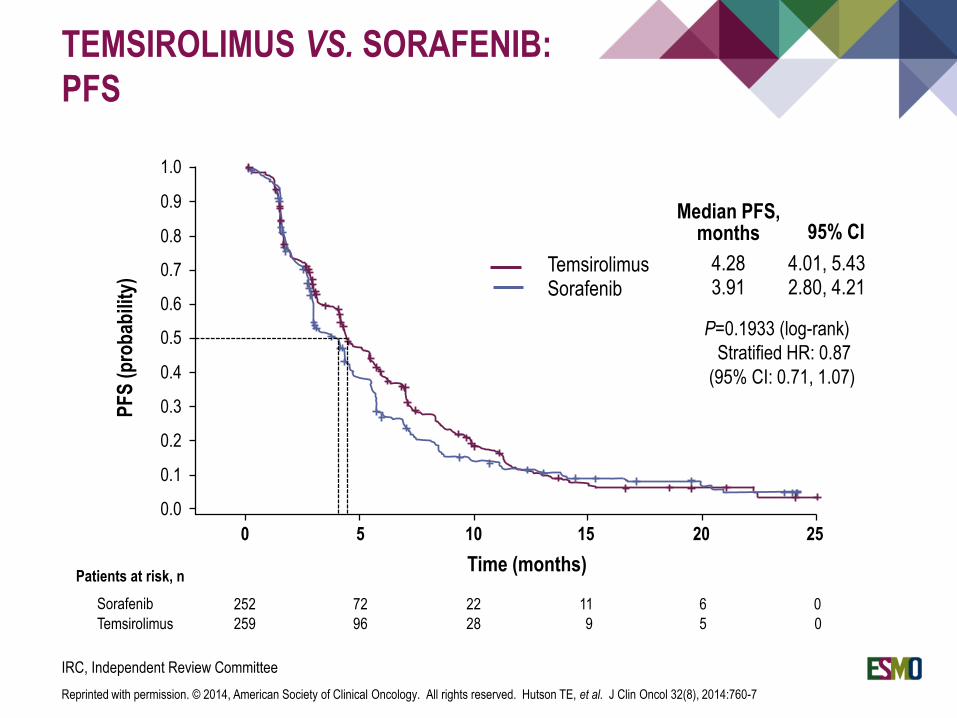
TEMSIROLIMUS VS. SORAFENIB:
PFSP
FS
(p
rob
abili
ty)
252 72 22 11 6 0
259 96 28 9 5 0
Sorafenib
Temsirolimus
Time (months)
0 5 10 15 20 25
TemsirolimusSorafenib
P=0.1933 (log-rank)
Stratified HR: 0.87
(95% CI: 0.71, 1.07)
Median PFS,months 95% CI
4.283.91
4.01, 5.432.80, 4.21
Patients at risk, n
1.0
0.9
0.8
0.7
0.6
0.5
0.4
0.3
0.2
0.1
0.0
IRC, Independent Review Committee
Reprinted with permission. © 2014, American Society of Clinical Oncology. All rights reserved. Hutson TE, et al. J Clin Oncol 32(8), 2014:760-7
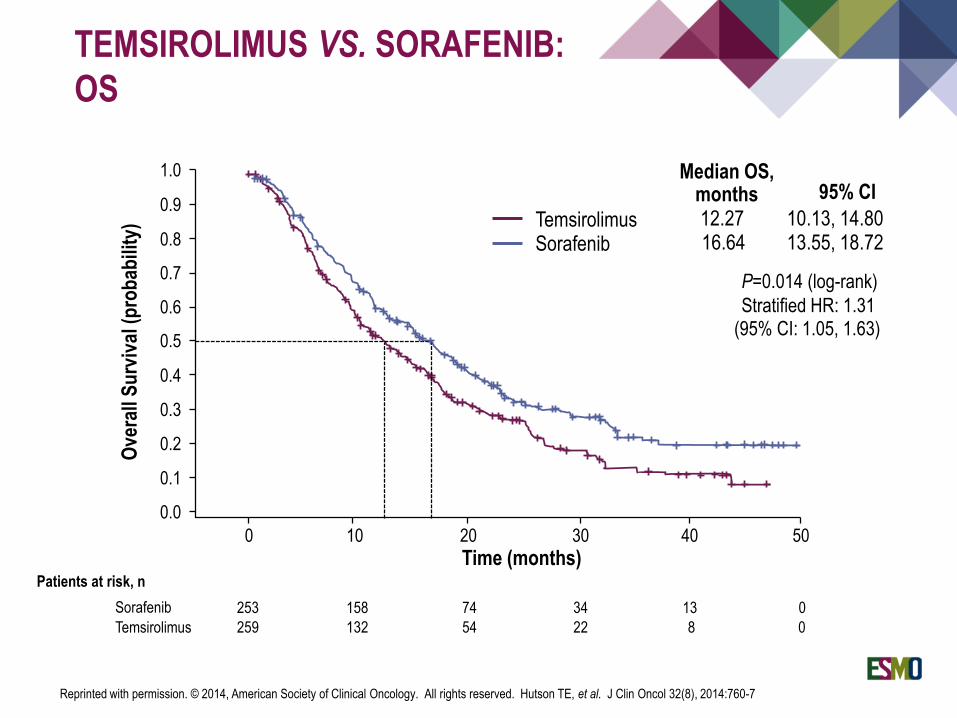
TEMSIROLIMUS VS. SORAFENIB:
OSO
vera
ll S
urv
ival
(p
rob
abili
ty)
0 10 20 30 40 50
253 158 74 34 13 0
259 132 54 22 8 0
Sorafenib
Temsirolimus
Patients at risk, n
Time (months)
1.0
0.9
0.8
0.7
0.6
0.5
0.4
0.3
0.2
0.1
0.0
TemsirolimusSorafenib
P=0.014 (log-rank)
Stratified HR: 1.31(95% CI: 1.05, 1.63)
12.2716.64
10.13, 14.8013.55, 18.72
Median OS,months 95% CI
Reprinted with permission. © 2014, American Society of Clinical Oncology. All rights reserved. Hutson TE, et al. J Clin Oncol 32(8), 2014:760-7
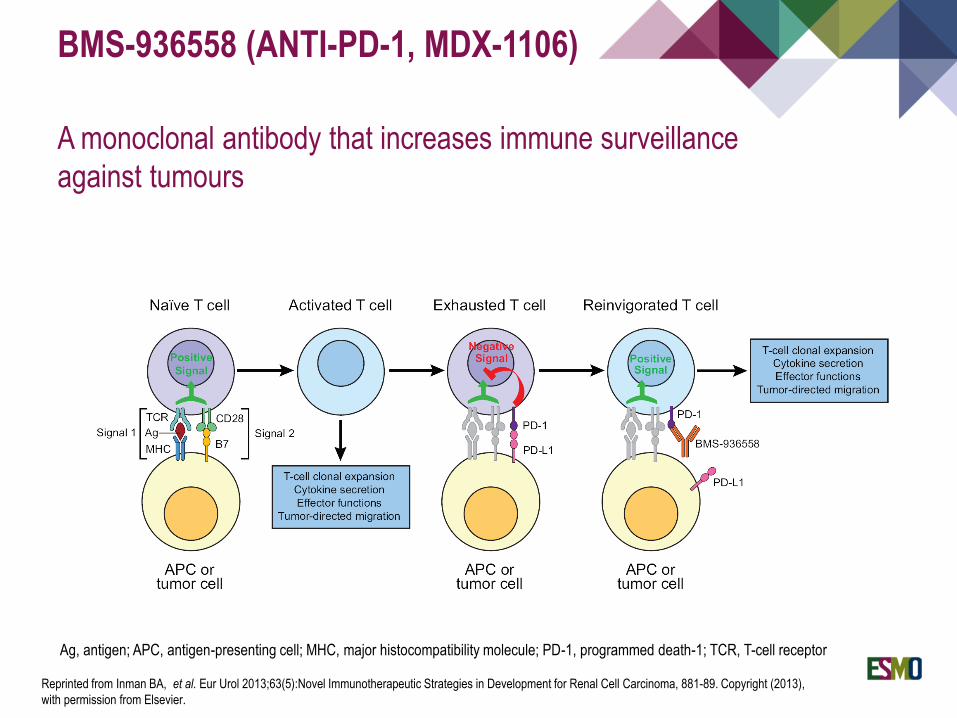
BMS-936558 (ANTI-PD-1, MDX-1106)
A monoclonal antibody that increases immune surveillance
against tumours
Ag, antigen; APC, antigen-presenting cell; MHC, major histocompatibility molecule; PD-1, programmed death-1; TCR, T-cell receptor
Reprinted from Inman BA, et al. Eur Urol 2013;63(5):Novel Immunotherapeutic Strategies in Development for Renal Cell Carcinoma, 881-89. Copyright (2013),
with permission from Elsevier.
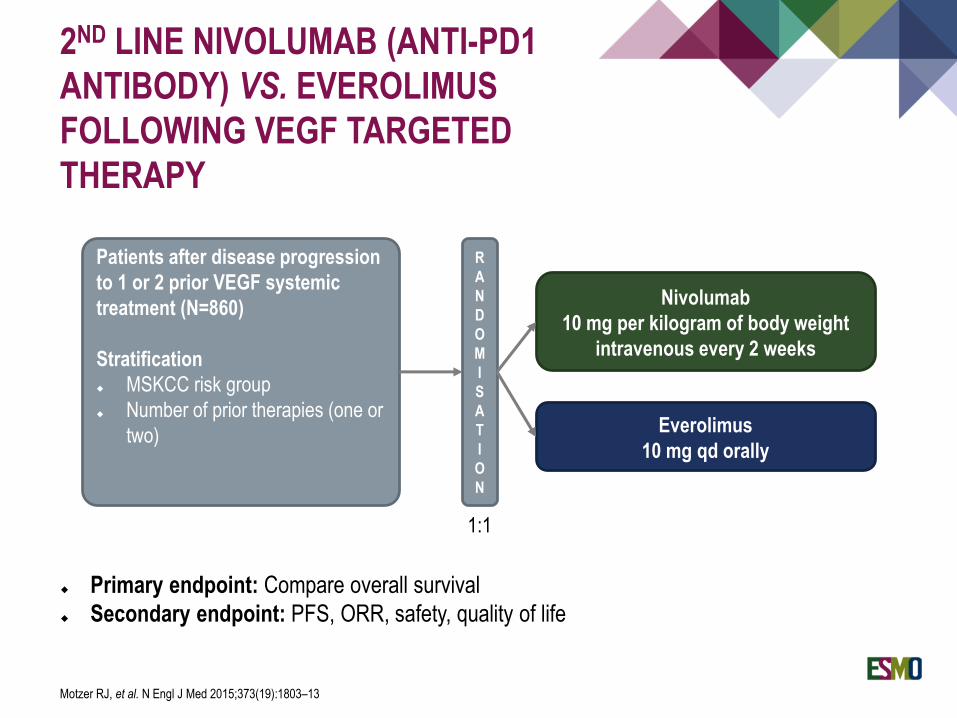
2ND LINE NIVOLUMAB (ANTI-PD1
ANTIBODY) VS. EVEROLIMUS
FOLLOWING VEGF TARGETED
THERAPY
Primary endpoint: Compare overall survival
Secondary endpoint: PFS, ORR, safety, quality of life
Patients after disease progression
to 1 or 2 prior VEGF systemic
treatment (N=860)
Stratification
MSKCC risk group
Number of prior therapies (one or
two)
R
A
N
D
O
M
I
S
A
T
I
O
N
Everolimus
10 mg qd orally
Nivolumab
10 mg per kilogram of body weight
intravenous every 2 weeks
1:1
Motzer RJ, et al. N Engl J Med 2015;373(19):1803–13
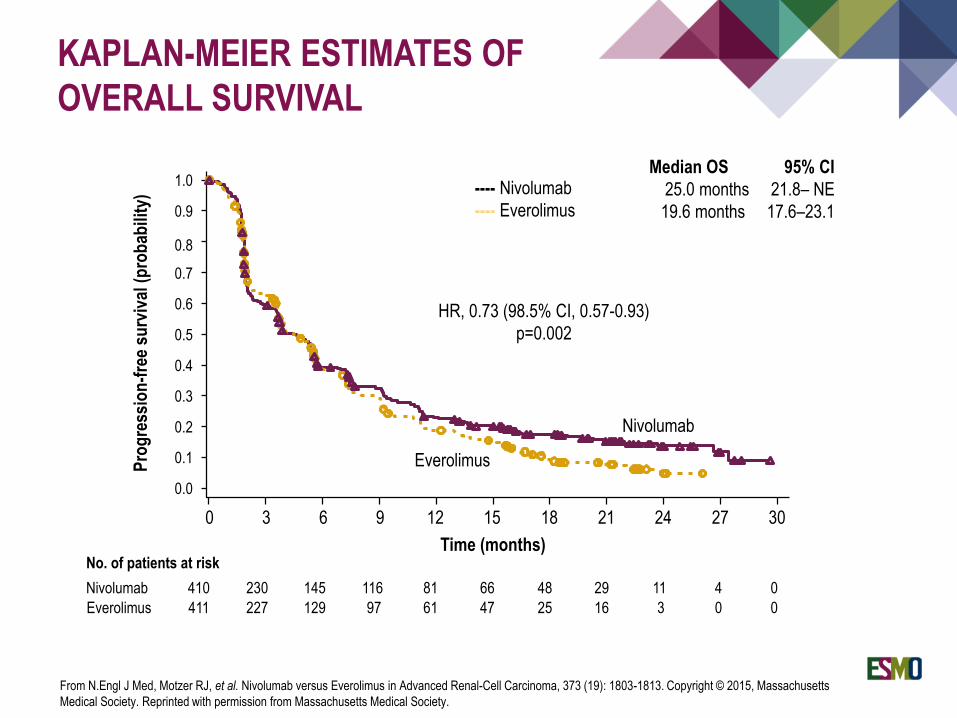
KAPLAN-MEIER ESTIMATES OF
OVERALL SURVIVAL
No. of patients at risk
Nivolumab 410 230 145 116 81 66 48 29 11 4 0
Everolimus 411 227 129 97 61 47 25 16 3 0 0
0 3 6 129 15
Time (months)
18 21 24 27 30
0.0
0.3
0.1
0.2
0.4
0.5
0.6
0.7
0.8
0.9
1.0
Pro
gre
ssio
n-f
ree
surv
ival
(p
rob
abili
ty)
Nivolumab
Everolimus
Median OS 95% CI
25.0 months 21.8– NE
19.6 months 17.6–23.1
---- Nivolumab
---- Everolimus
HR, 0.73 (98.5% CI, 0.57-0.93)
p=0.002
From N.Engl J Med, Motzer RJ, et al. Nivolumab versus Everolimus in Advanced Renal-Cell Carcinoma, 373 (19): 1803-1813. Copyright © 2015, Massachusetts
Medical Society. Reprinted with permission from Massachusetts Medical Society.
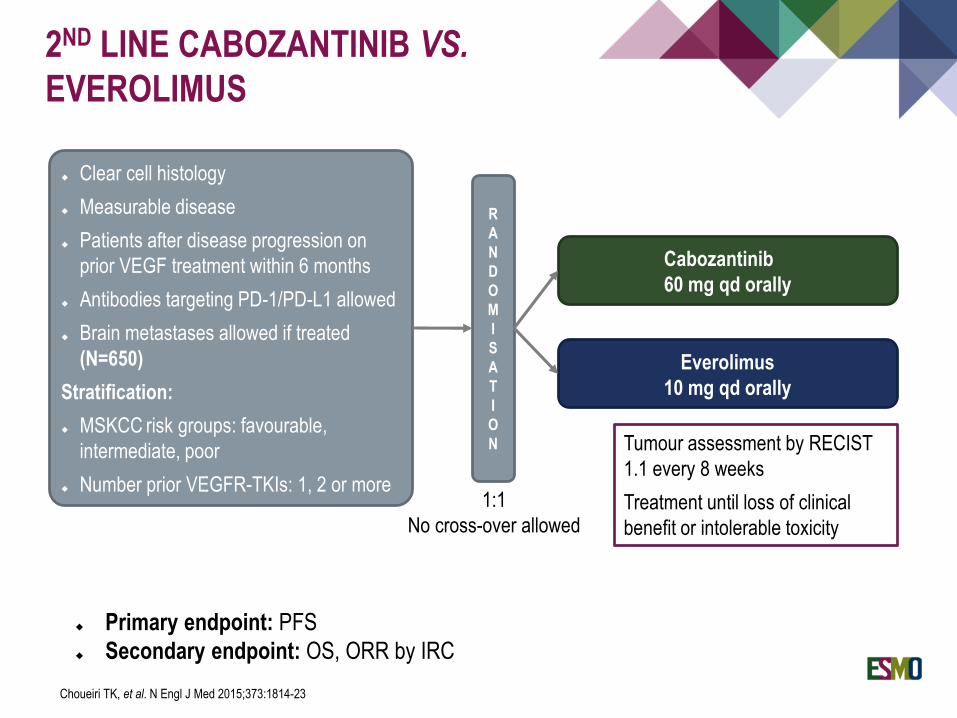
2ND LINE CABOZANTINIB VS.
EVEROLIMUS
Clear cell histology
Measurable disease
Patients after disease progression on
prior VEGF treatment within 6 months
Antibodies targeting PD-1/PD-L1 allowed
Brain metastases allowed if treated
(N=650)
Stratification:
MSKCC risk groups: favourable,
intermediate, poor
Number prior VEGFR-TKIs: 1, 2 or more
R
A
N
D
O
M
I
S
A
T
I
O
N
Everolimus
10 mg qd orally
Cabozantinib
60 mg qd orally
1:1
No cross-over allowed
Tumour assessment by RECIST
1.1 every 8 weeks
Treatment until loss of clinical
benefit or intolerable toxicity
Primary endpoint: PFS
Secondary endpoint: OS, ORR by IRC
Choueiri TK, et al. N Engl J Med 2015;373:1814-23

CABOZANTINIB VS. EVEROLIMUS:
OS
Interim analysis (49% information fraction)
The interim boundary to reach significance (P=0.0019) was not reached
Survival follow up is continuing to the planned final analysis
From N.Engl J Med, Choueiri TK, et al. Cabozantinib versus Everolimus in Advanced Renal-Cell Carcinoma, 373:1814-1823. Copyright © 2015, Massachusetts
Medical Society. Reprinted with permission from Massachusetts Medical Society.

2ND LINE LENVATINIB VS.
EVEROLIMUS VS. COMBINATION
Everolimus
10 mg qd orally (n=50)
Clear cell histology
Measurable disease
Patients after disease progression on
prior 1 VEGF systemic treatment
within 9 months
Stratification
Hemoglobin (low vs. normal)
Corrected serum calcium
(≥ vs. <10 mg/dl) (N=153)
R
A
N
D
O
M
I
S
A
T
I
O
N
Lenvatinib
24 mg qd orally (n=52)
Lenvatinib 18 mg qd + everolimus 5 mg
qd orally (n=51)
1:1
Patients were treated until progressive disease or unacceptable toxicity
Primary endpoint: PFS with lenvatinib± everolimus vs. everolimus alone
Secondary endpoints: PFS with combination vs lenvatinib, ORR, OS, safety
vs: versus; qd: every day
Motzer RJ, et al. Lancet Oncol 2015.

2ND LINE OPTIONS AFTER VEGF
TREATMENT
Sunitinib or
Pazopanib
mTOR (Everolimus)
VEGF TKI (Axitinib)
PROGRESSION PD-1 inh (Nivolumab)
MET and VEGF TKI (Cabozantinib)
VEGF TKI (Lenvatinib) +
mTOR (Everolimus)
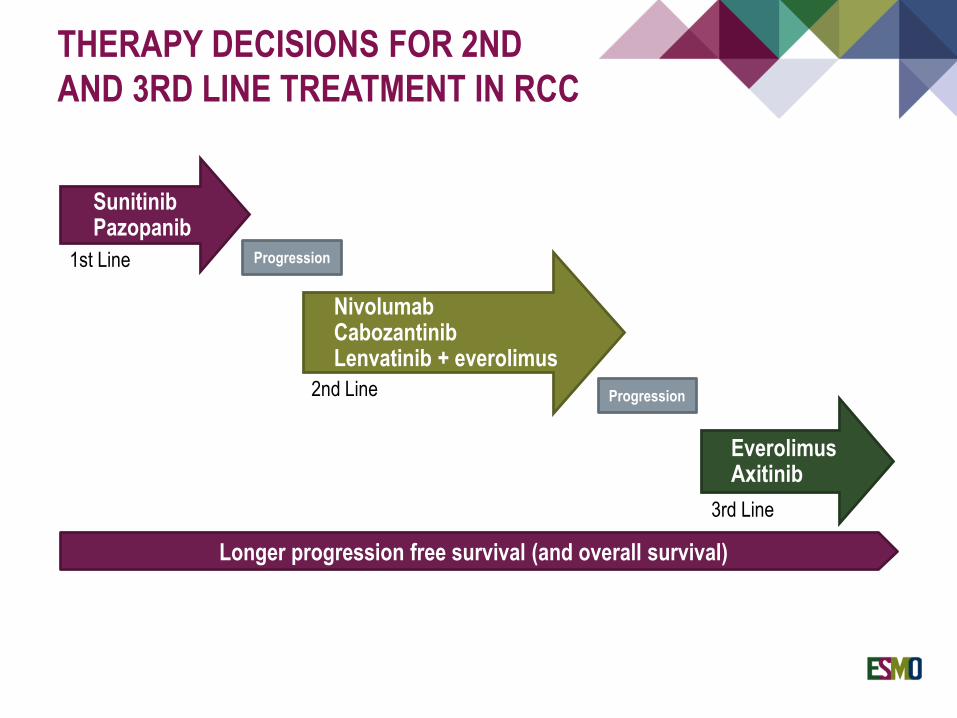
THERAPY DECISIONS FOR 2ND
AND 3RD LINE TREATMENT IN RCC
SunitinibPazopanib
Longer progression free survival (and overall survival)
Progression
NivolumabCabozantinibLenvatinib + everolimus
Progression
EverolimusAxitinib
1st Line
2nd Line
3rd Line
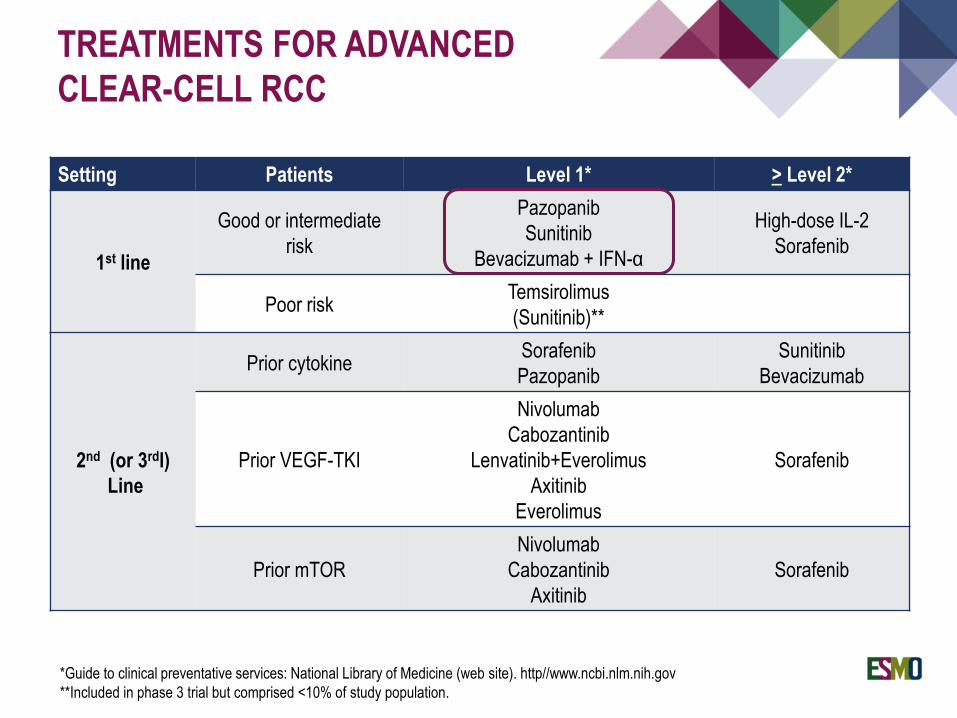
Setting Patients Level 1* > Level 2*
1st line
Good or intermediate
risk
Pazopanib
Sunitinib
Bevacizumab + IFN-α
High-dose IL-2
Sorafenib
Poor riskTemsirolimus
(Sunitinib)**
2nd (or 3rdl)
Line
Prior cytokineSorafenib
Pazopanib
Sunitinib
Bevacizumab
Prior VEGF-TKI
Nivolumab
Cabozantinib
Lenvatinib+Everolimus
Axitinib
Everolimus
Sorafenib
Prior mTOR
Nivolumab
Cabozantinib
Axitinib
Sorafenib
TREATMENTS FOR ADVANCED
CLEAR-CELL RCC
*Guide to clinical preventative services: National Library of Medicine (web site). http//www.ncbi.nlm.nih.gov
**Included in phase 3 trial but comprised <10% of study population.

NEW AGENTS - SELECTED NEW COMBINATIONS
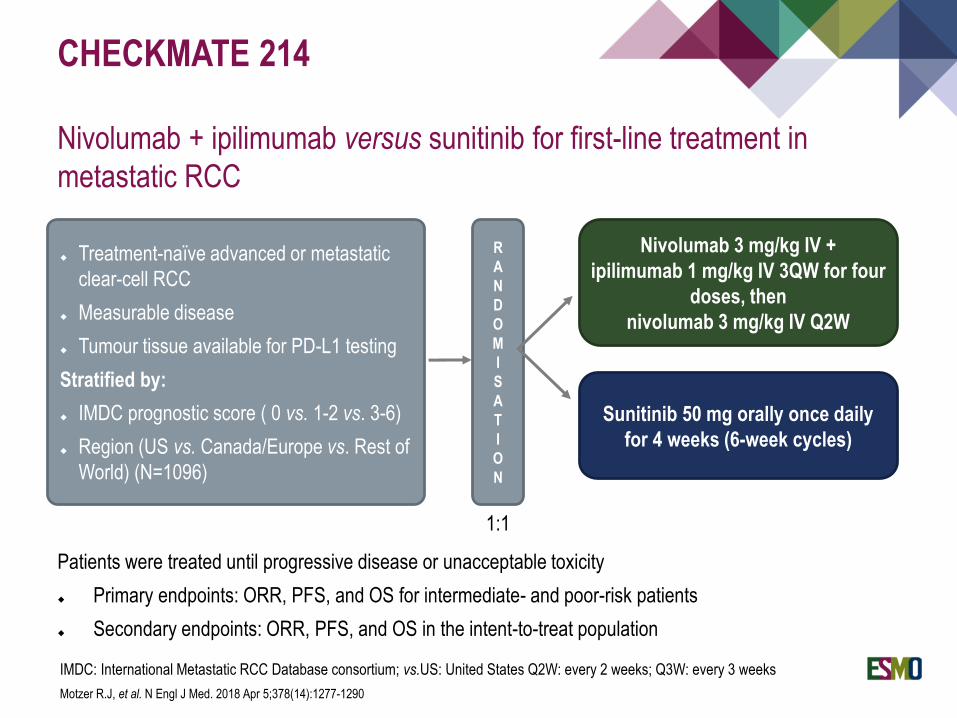
CHECKMATE 214
Nivolumab + ipilimumab versus sunitinib for first-line treatment in
metastatic RCC
Treatment-naïve advanced or metastatic
clear-cell RCC
Measurable disease
Tumour tissue available for PD-L1 testing
Stratified by:
IMDC prognostic score ( 0 vs. 1-2 vs. 3-6)
Region (US vs. Canada/Europe vs. Rest of
World) (N=1096)
R
A
N
D
O
M
I
S
A
T
I
O
N
Sunitinib 50 mg orally once daily
for 4 weeks (6-week cycles)
Nivolumab 3 mg/kg IV +
ipilimumab 1 mg/kg IV 3QW for four
doses, then
nivolumab 3 mg/kg IV Q2W
1:1
Patients were treated until progressive disease or unacceptable toxicity
Primary endpoints: ORR, PFS, and OS for intermediate- and poor-risk patients
Secondary endpoints: ORR, PFS, and OS in the intent-to-treat population
IMDC: International Metastatic RCC Database consortium; vs.US: United States Q2W: every 2 weeks; Q3W: every 3 weeks
Motzer R.J, et al. N Engl J Med. 2018 Apr 5;378(14):1277-1290

IMDC Intermediate/poor risk Intention to treat
OutcomeNIVO+IPI
N=425
SUN
N=422PD-L1< 1% PD-L1 >=1% PD-L1< 1% PD-L1 >=1%
NIVO+IPI
N=284
SUN
N=278
NIVO+IPI
N=100
SUN
N=114
NIVO+IPI
N=386
SUN
N=376
NIVO+IPI
N=113
SUN
N=127
Confirmed ORR, %
(95%CI)42 (37-47) 27(22-31) 37 (32-43) 28(23-43) 58 (48-68) 22 (15-31) 36 (31-41) 35 (31-40) 53 (44-63) 22 (15-30)
p < 0.0001 p = 0.0252 p < 0.0001 p = 0.8799 p = 0.0001
BOR, %
Complete Response
Partial Response
Stable Disease
Progressive Disease
NA
9
32
31
20
8
1
25
45
17
12
7
30
36
20
7
1
27
47
13
12
16
42
19
14
9
1
21
40
25
13
9
27
39
18
7
2
33
43
11
11
14
39
25
14
8
1
21
43
23
13
Duration of ResponseNot reached
(21.8-NE)
18.2
(14.8-NE)- - - - - - - -
CHECKMATE 214
ANTITUMOUR ACTIVITY
Motzer R.J, et al. N Engl J Med. 2018 Apr 5;378(14):1277-1290
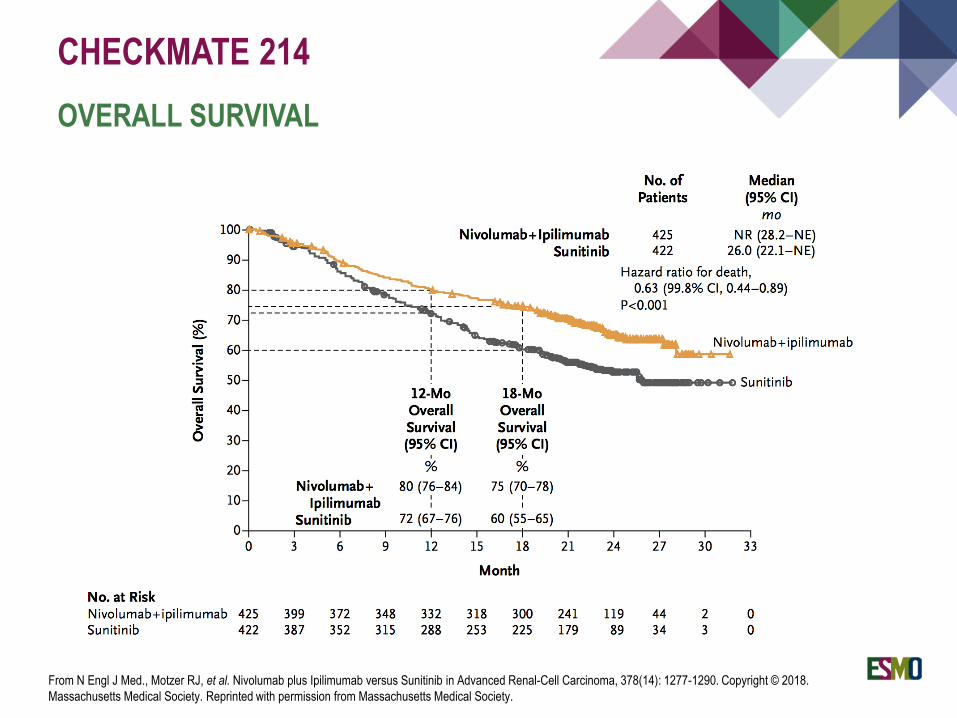
CHECKMATE 214
OVERALL SURVIVAL
From N Engl J Med., Motzer RJ, et al. Nivolumab plus Ipilimumab versus Sunitinib in Advanced Renal-Cell Carcinoma, 378(14): 1277-1290. Copyright © 2018.
Massachusetts Medical Society. Reprinted with permission from Massachusetts Medical Society.
ADJUVANT TREATMENT FOR CLEAR CELL RCC
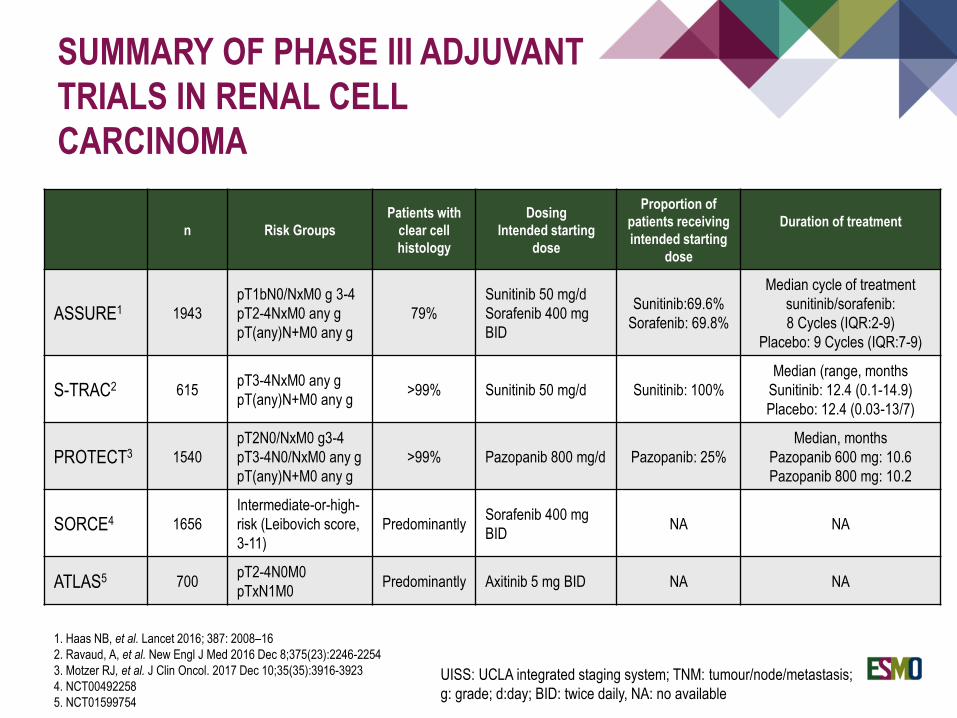
SUMMARY OF PHASE III ADJUVANT
TRIALS IN RENAL CELL
CARCINOMA
1. Haas NB, et al. Lancet 2016; 387: 2008–16
2. Ravaud, A, et al. New Engl J Med 2016 Dec 8;375(23):2246-2254
3. Motzer RJ, et al. J Clin Oncol. 2017 Dec 10;35(35):3916-3923
4. NCT00492258
5. NCT01599754
n Risk Groups
Patients with
clear cell
histology
Dosing
Intended starting
dose
Proportion of
patients receiving
intended starting
dose
Duration of treatment
ASSURE1 1943
pT1bN0/NxM0 g 3-4
pT2-4NxM0 any g
pT(any)N+M0 any g
79%
Sunitinib 50 mg/d
Sorafenib 400 mg
BID
Sunitinib:69.6%
Sorafenib: 69.8%
Median cycle of treatment
sunitinib/sorafenib:
8 Cycles (IQR:2-9)
Placebo: 9 Cycles (IQR:7-9)
S-TRAC2 615pT3-4NxM0 any g
pT(any)N+M0 any g>99% Sunitinib 50 mg/d Sunitinib: 100%
Median (range, months
Sunitinib: 12.4 (0.1-14.9)
Placebo: 12.4 (0.03-13/7)
PROTECT3 1540
pT2N0/NxM0 g3-4
pT3-4N0/NxM0 any g
pT(any)N+M0 any g
>99% Pazopanib 800 mg/d Pazopanib: 25%
Median, months
Pazopanib 600 mg: 10.6
Pazopanib 800 mg: 10.2
SORCE4 1656
Intermediate-or-high-
risk (Leibovich score,
3-11)
PredominantlySorafenib 400 mg
BIDNA NA
ATLAS5 700pT2-4N0M0
pTxN1M0Predominantly Axitinib 5 mg BID NA NA
UISS: UCLA integrated staging system; TNM: tumour/node/metastasis;
g: grade; d:day; BID: twice daily, NA: no available
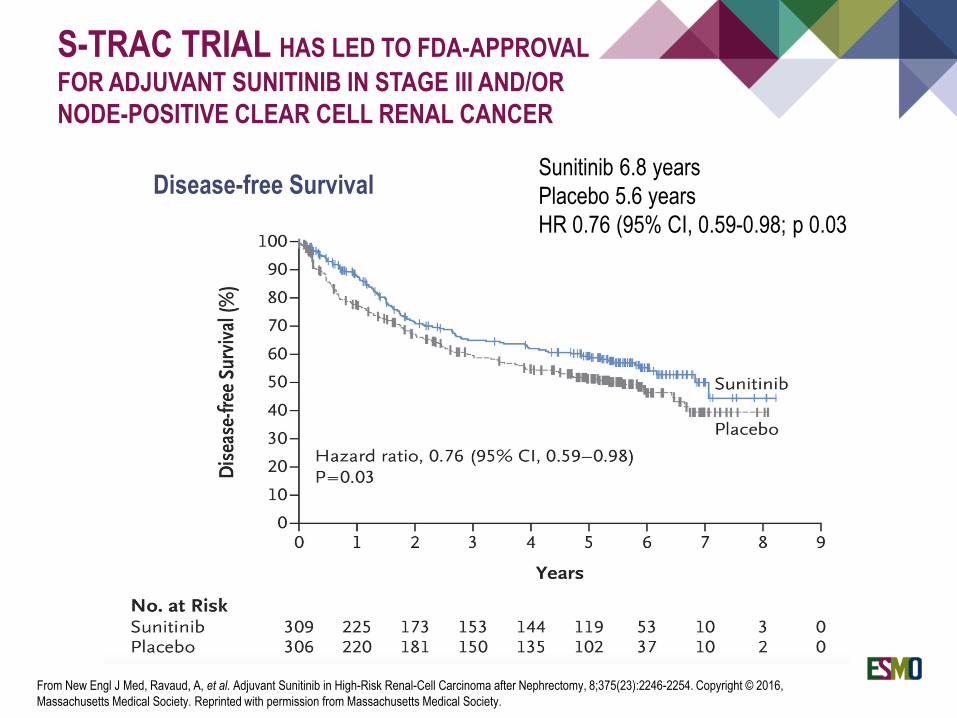
Disease-free Survival
S-TRAC TRIAL HAS LED TO FDA-APPROVAL
FOR ADJUVANT SUNITINIB IN STAGE III AND/OR
NODE-POSITIVE CLEAR CELL RENAL CANCER
Sunitinib 6.8 years
Placebo 5.6 years
HR 0.76 (95% CI, 0.59-0.98; p 0.03
From New Engl J Med, Ravaud, A, et al. Adjuvant Sunitinib in High-Risk Renal-Cell Carcinoma after Nephrectomy, 8;375(23):2246-2254. Copyright © 2016,
Massachusetts Medical Society. Reprinted with permission from Massachusetts Medical Society.
Sunitinib 6.8 years
Placebo 5.6 years
HR 0.76 (95% CI, 0.59-0.98; p 0.03
Cytoreductive nephrectomy should no longer be considered standard of care in
intermediate- and poor-risk MSKCC groups of metastatic RCC, at least when
medical treatment is required.
Radical metastasectomy followed by observation is a commonly used strategy in
selected patients with oligometastatic RCC. There is no clear role for systemic
targeted therapy after surgical metastasectomy.
Sunitinib has been FDA approved for adjuvant therapy in high risk clear cell renal
cancer
Standard of care for advanced renal cancer has dramatically changed in the era of
targeted therapy and immune-checkpoint inhibitors
Standard 1st line therapy for most patients is a VEGF-TKI for patients with
favorable-risk metastatic RCC or unfit for nivolumab plus ipilimumab combination,
likely pazopanib, sunitinib or tivozanib.
CONCLUSIONS
Nivolumab and ipilimumab in combination were granted FDA approval in April 2018
for the treatment of intermediate or poor risk, previously untreated advanced renal
cell carcinoma.
Standard 2nd line therapy and beyond for most patients is either nivolumab or
cabozantinib , both drugs have not been compared head to head.
Additional combination therapies are under investigation.
CONCLUSIONS

THANK YOU!