Embed Size (px)
Citation preview

113 September 2014 |
RESOURCE-RESERVE ESTIMATION OF
ALLUVIAL DIAMOND DEPOSITS
A CASE STUDY OF ROCKWELL DIAMONDS INC.“uncover ing the facets o f our potent ia l ”

213 September 2014 |
RESOURCES MATRIX (CIM)
The Inferred and Indicated Resource
categories used by Rockwell for its
alluvial diamond deposits follow the
CIM definitions (Rockwell’s primary
listing is in Canada)
Rockwell does not use the Measured
Resource category in its estimations,
due to the nature of its deposits. This
will be explained in more detail in the
course of the presentation

313 September 2014 |
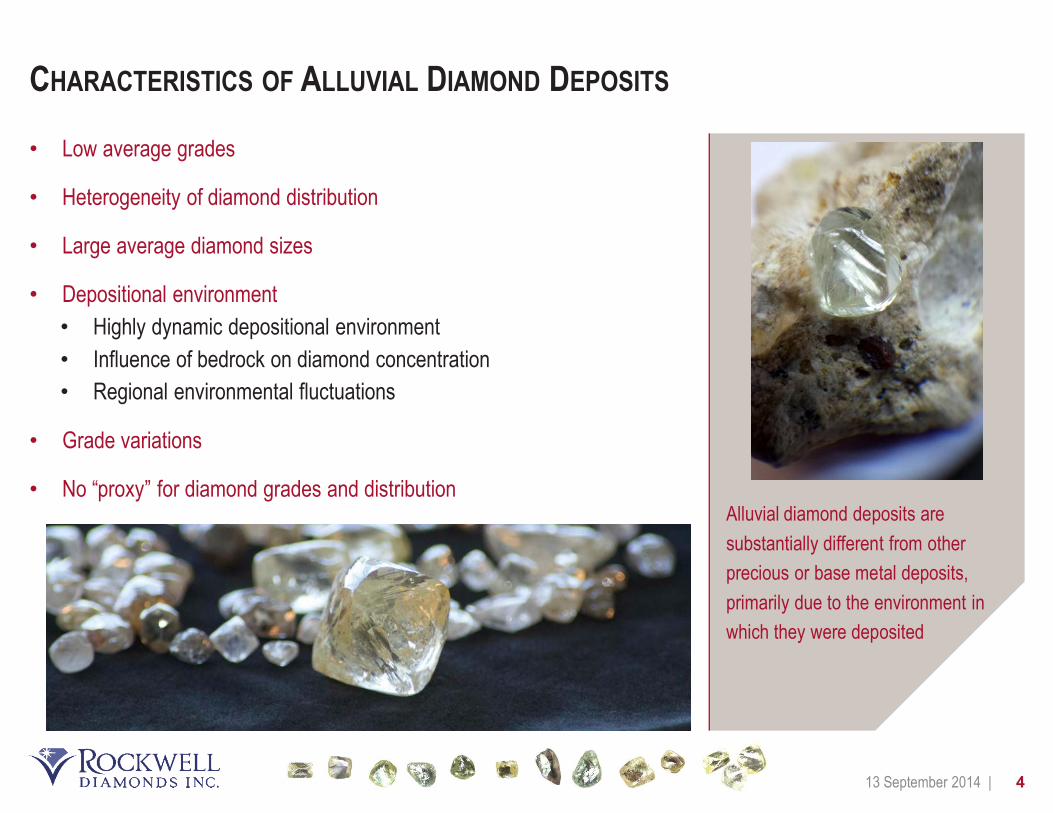
CHARACTERISTICS OF ALLUVIAL DIAMOND DEPOSITS
Alluvial diamond deposits are
typically heterogeneous and low-
grade
Any assumption on grade continuity
must be supported by a deep
understanding of their geology –
sedimentology, stratigraphy,
depositional environment and
morphotectonic evolution
Detailed levels of sampling and
drilling are critical to resource
estimation for alluvial diamond
deposits
413 September 2014 |
CHARACTERISTICS OF ALLUVIAL DIAMOND DEPOSITS
Alluvial diamond deposits are
substantially different from other
precious or base metal deposits,
primarily due to the environment in
which they were deposited
• Low average grades
• Heterogeneity of diamond distribution
• Large average diamond sizes
• Depositional environment
• Highly dynamic depositional environment
• Influence of bedrock on diamond concentration
• Regional environmental fluctuations
• Grade variations
• No “proxy” for diamond grades and distribution

513 September 2014 |
CHARACTERISTICS OF ALLUVIAL DIAMOND DEPOSITS:
LOW AVERAGE GRADES
Low average grades typical of alluvial
diamond deposits require a different
approach to sampling and resource
estimation
• Measured as number of carats in one hundred cubic metres
(ct/100m3) of ore
• Typically less than 2ct/100m3
* 6 mm BCOS
# 2 mm BCOS
MineAverage recovered grade for
Indicated Resources
Saxendrift 0.45 ct/100m3 (Marshall & Norton, 2014)*
Wouterspan 0.50 ct/100m3 (Marshall & Norton, 2014)*
Niewejaarskraal 0.50 ct/100m3 (Marshall & Norton, 2014)*
Tirisano 1.15 ct/100m3 (Marshall & Norton, 2014)#

613 September 2014 |
CHARACTERISTICS OF ALLUVIAL DIAMOND DEPOSITS:
LARGE AVERAGE DIAMOND SIZES
Diamond average stone sizes sizes
in inland alluvial deposits are
extremely large in comparison to
those in primary deposits
The majority of the value of a parcel
of alluvial diamonds may be
attributed to a single stone
• Average diamond sizes in all of South African inland alluvial diamond deposits
range from 0.5 to 2.0 carats/stone
• Diamonds form discrete particle deposits of varying size and density, as opposed to
disseminated particle deposits typical of other mineralisations
• Size and value distribution can be extremely variable from one stone to another
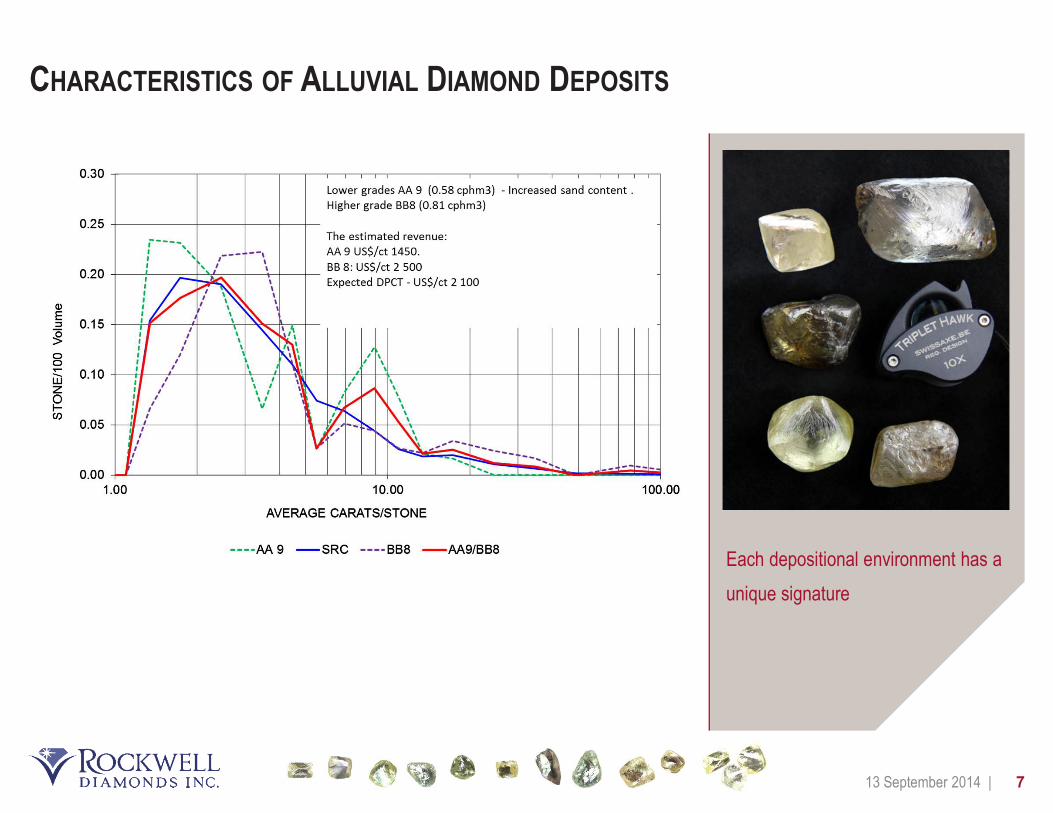
713 September 2014 |
CHARACTERISTICS OF ALLUVIAL DIAMOND DEPOSITS
Each depositional environment has a
unique signature

813 September 2014 |
CHARACTERISTICS OF ALLUVIAL DIAMOND DEPOSITS:
DEPOSITIONAL ENVIRONMENT
Braided channels are formed and
destroyed continuously, producing
highly varied depositional
assemblages
Sediment units of irregular thickness
with evidence of erosion and re-
deposition are common features in
braided stream deposits
Alluvial diamond deposits are
frequently reworked through one or
more post-depositional processes
• Highly dynamic and transient depositional environment
• Extreme variability at broad (10-100’s metres) and local scale (1-
10’s metres)
• Variability on a broad scale is due to the multiple sedimentary bar units
of coarse and fine material

913 September 2014 |
CHARACTERISTICS OF ALLUVIAL DIAMOND DEPOSITS:
HETEROGENEITY OF DIAMOND DISTRIBUTION
The diamond distribution pattern
(grade) of alluvial deposits is such
that poor repeatability of sample
results is to be expected as the norm
Two adjacent areas may have
substantially different grade potential;
consequently grades recovered from
one operation cannot be applied to
another property
Within a gravel unit, small individual
samples may have totally different,
non-representative results
Much larger (bulk) samples provide
better estimates of overall grade
• A sketch of a typical palaeo fluvial-alluvial system shows coarse gravel
bars enriched in diamonds within mostly barren sandy layers
• The distribution of diamonds in alluvial deposits can be described as a
“random distribution of clusters of points”, where clusters are randomly
distributed in space and so are the points in each cluster
1013 September 2014 |
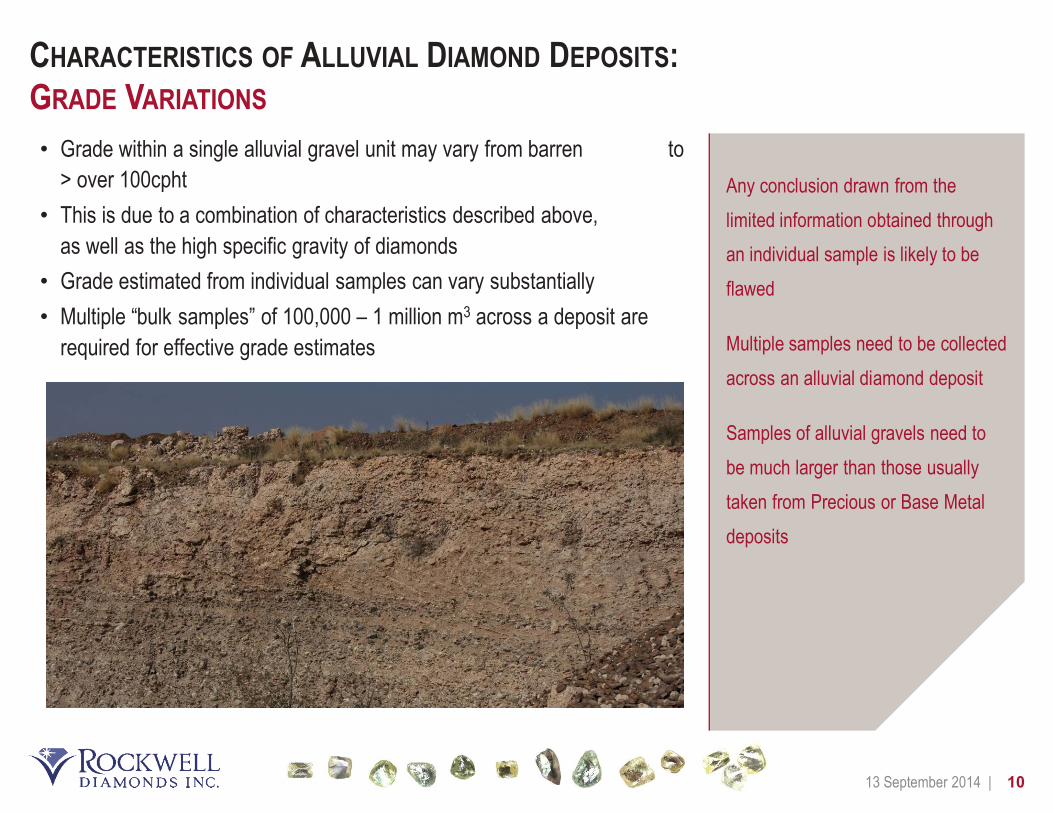
CHARACTERISTICS OF ALLUVIAL DIAMOND DEPOSITS:
GRADE VARIATIONS
Any conclusion drawn from the
limited information obtained through
an individual sample is likely to be
flawed
Multiple samples need to be collected
across an alluvial diamond deposit
Samples of alluvial gravels need to
be much larger than those usually
taken from Precious or Base Metal
deposits
• Grade within a single alluvial gravel unit may vary from barren to
> over 100cpht
• This is due to a combination of characteristics described above,
as well as the high specific gravity of diamonds
• Grade estimated from individual samples can vary substantially
• Multiple “bulk samples” of 100,000 – 1 million m3 across a deposit are
required for effective grade estimates
1113 September 2014 |
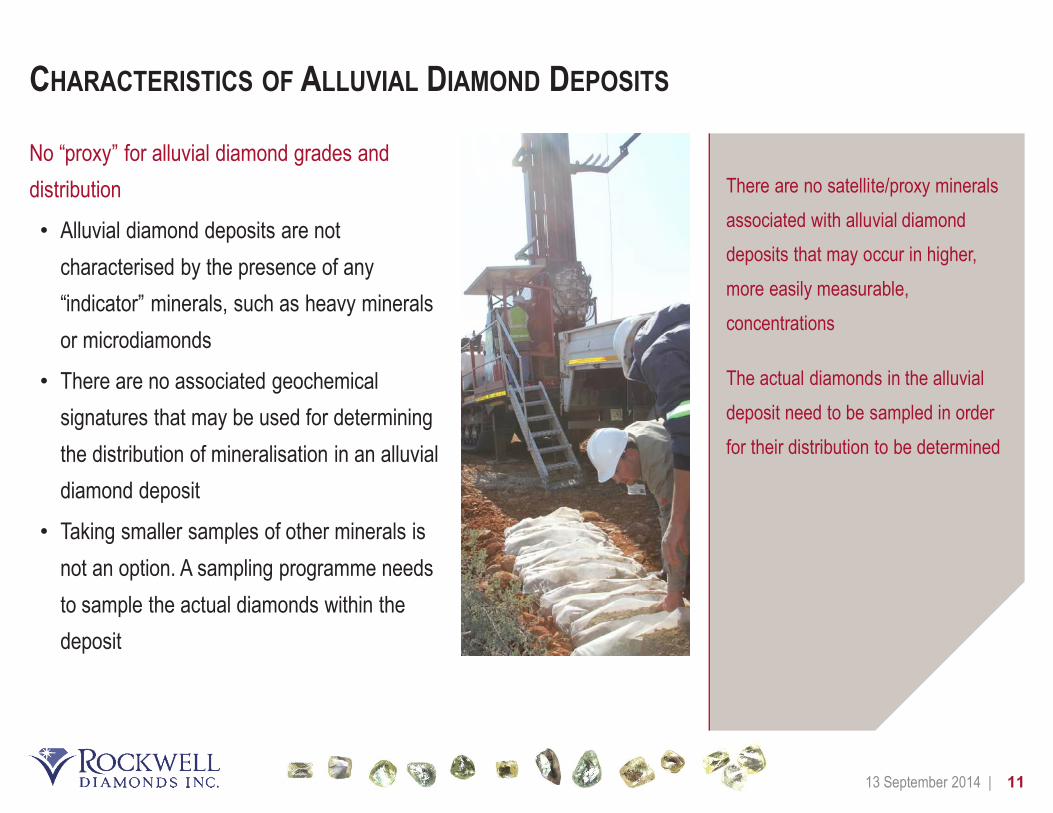
CHARACTERISTICS OF ALLUVIAL DIAMOND DEPOSITS
There are no satellite/proxy minerals
associated with alluvial diamond
deposits that may occur in higher,
more easily measurable,
concentrations
The actual diamonds in the alluvial
deposit need to be sampled in order
for their distribution to be determined
No “proxy” for alluvial diamond grades and
distribution
• Alluvial diamond deposits are not
characterised by the presence of any
“indicator” minerals, such as heavy minerals
or microdiamonds
• There are no associated geochemical
signatures that may be used for determining
the distribution of mineralisation in an alluvial
diamond deposit
• Taking smaller samples of other minerals is
not an option. A sampling programme needs
to sample the actual diamonds within the
deposit

1213 September 2014 |
ROCKWELL’S MINERAL RESOURCE EVALUATION
Rockwell’s classification and
estimation procedure reflects
accurately the peculiar nature of its
alluvial diamond deposits
Rockwell continually reconciles
recovered grades with estimated
resource/reserve grades on all of it
operations
Where Indicated Resources or
Provable Reserves are estimated, it
is expected that the recovered grades
be witih 15% of the estimated sample
grades
Desktop
Studies
Desktop
Studies
Field Studies
& Exploration
Targets
Field Studies
& Exploration
Targets
Inferred
Resource
Estimation
Inferred
Resource
Estimation
Indicated
Resource
Estimation
Indicated
Resource
Estimation
Probable
Reserve
Estimation
Probable
Reserve
Estimation
Identification of
area of interest
Geological
mapping;
Remote sensing;
Reconnaissance
drilling
Detailed drilling
100x100m
Bulk sampling
0.5% of
resource
Recovery of
>500ct
Infill drilling
50x50m.
Bulk sampling &
Trial mining
Recovery of
3,000-5,000ct
Trial mining
3-5% declared
reserve
+/-1-2 years +/-2-3 years+/-1-2 years

1313 September 2014 |
ROCKWELL’S RESERVE ESTIMATION
Pre-Feasibility and Feasibility Studies
typically determine the extent to
which the estimates of Mineral
Resources may be mined
economically
Such studies also look at how the
impact of various environmental,
legal, financial, socio-economic, and
marketing issues (together known as
the “modifying factors”) materially
affect the commerciality of the
deposit
• The conversion of a Mineral Resource to a Mineral Reserve demands
that either a Pre-Feasibility or Feasibility Study has been completed on
the deposit
• The following variables are generally considered in Pre-Feasibility and
Feasibility Studies:
• Resource volumes (Life of Mine) and grade
• Mining and Production rates
• Revenue
• Operating Costs and Fees
• Capital Costs
• Taxes and royalties
• Depreciation, interest and residual value
• For alluvial diamond deposits, most of these modifying factors are
considered from the start of the exploration programme and updated
through the bulk-sampling and trial-mining phases
• Due to the timespan of the trial mining phase, Pre-Feasibility Studies are
typically conducted in-house

1413 September 2014 |
CONCLUSIONS:
As a listed, professionally operated
listed diamond exploration and mining
company, Rockwell undertakes
rigorous and robust evaluation
studies of its deposits
Rockwell has developed resource
classification procedures that are
premised on internationally accepted
classification systems
• Rockwell has considerable geological information and knowledge and
excellent mining data for the deposits it is mining and has created
detailed and extensive geological and diamond databases
• The deposits and their depositional regimes are well understood, having
been mined for well over 100 years
• The different alluvial deposits on which Rockwell operates have distinct
geological characteristics and diamond populations - these populations
can be easily characterized in respect of diamond size frequency studies
• The average sales prices obtained for the different deposits and mines
relate directly to the size frequency characteristics
• Good correlation exists between predicted or sample grade and actual
grades recovered in the trial-mining operations

1513 September 2014 |
MOR DPCT
SRC SHC NJK BHC
DPCT 0C - 5C 612 636 795 638
DPCT 5C - 10C 1 220 1 312 1 260 1 225
DPCT 10C-20C 3 540 3 377 2 938 1 477
DPCT >20C 3 877 4 641 4 860 5 350
DPCT 1 854 2 012 1 943 2 397
% Revenue
SRC SHC NJK BHC
DPCT 0C- 5C 14% 12% 16% 9%
DPCT 5C - 10C 15% 17% 17% 9%
DPCT 10C -20C 29% 33% 29% 11%
DPCT >20C 42% 38% 38% 71%
% Stone
SRC SHC NJK BHC
DPCT 0C - 5C 78% 75% 70% 74%
DPCT 5C - 10C 14% 17% 20% 14%
DPCT10C -20C 5% 5% 7% 7%
DPCT >20C 3% 3% 2% 5%