Embed Size (px)
Citation preview
1
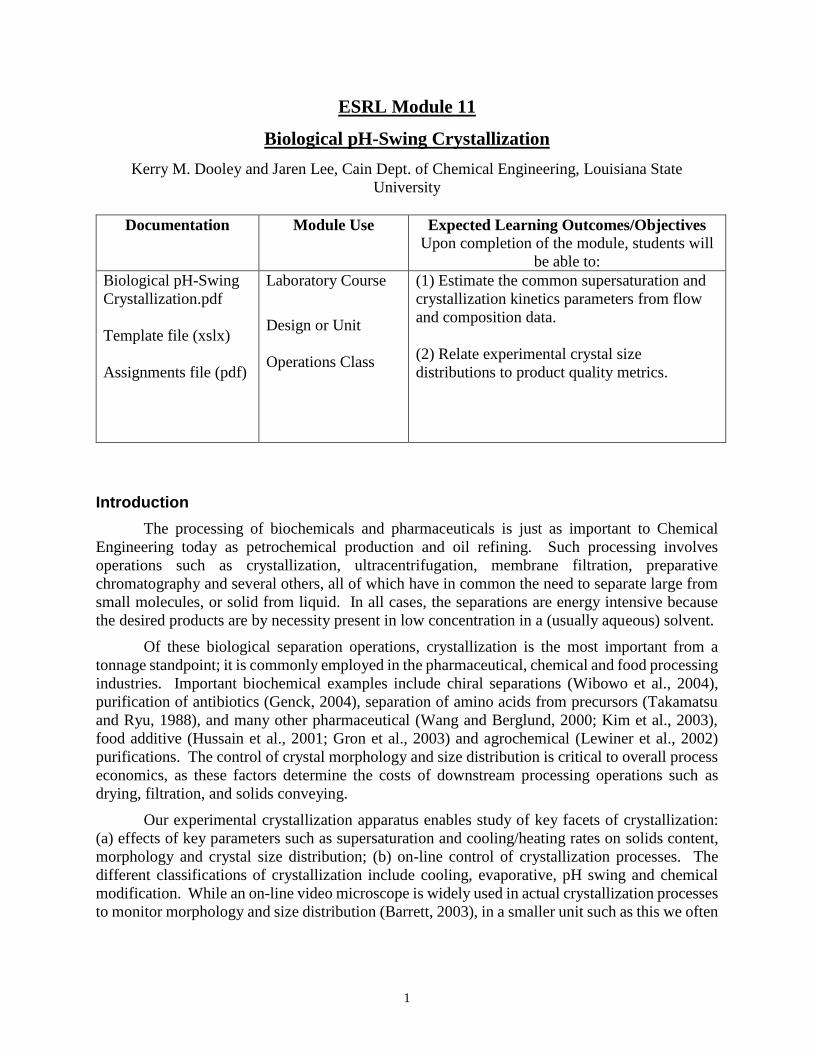
ESRL Module 11
Biological pH-Swing Crystallization
Kerry M. Dooley and Jaren Lee, Cain Dept. of Chemical Engineering, Louisiana State
University
Documentation Module Use Expected Learning Outcomes/Objectives
Upon completion of the module, students will
be able to:
Biological pH-Swing
Crystallization.pdf
Template file (xslx)
Assignments file (pdf)
Laboratory Course
Design or Unit
Operations Class
(1) Estimate the common supersaturation and
crystallization kinetics parameters from flow
and composition data.
(2) Relate experimental crystal size
distributions to product quality metrics.
Introduction
The processing of biochemicals and pharmaceuticals is just as important to Chemical
Engineering today as petrochemical production and oil refining. Such processing involves
operations such as crystallization, ultracentrifugation, membrane filtration, preparative
chromatography and several others, all of which have in common the need to separate large from
small molecules, or solid from liquid. In all cases, the separations are energy intensive because
the desired products are by necessity present in low concentration in a (usually aqueous) solvent.
Of these biological separation operations, crystallization is the most important from a
tonnage standpoint; it is commonly employed in the pharmaceutical, chemical and food processing
industries. Important biochemical examples include chiral separations (Wibowo et al., 2004),
purification of antibiotics (Genck, 2004), separation of amino acids from precursors (Takamatsu
and Ryu, 1988), and many other pharmaceutical (Wang and Berglund, 2000; Kim et al., 2003),
food additive (Hussain et al., 2001; Gron et al., 2003) and agrochemical (Lewiner et al., 2002)
purifications. The control of crystal morphology and size distribution is critical to overall process
economics, as these factors determine the costs of downstream processing operations such as
drying, filtration, and solids conveying.
Our experimental crystallization apparatus enables study of key facets of crystallization:
(a) effects of key parameters such as supersaturation and cooling/heating rates on solids content,
morphology and crystal size distribution; (b) on-line control of crystallization processes. The
different classifications of crystallization include cooling, evaporative, pH swing and chemical
modification. While an on-line video microscope is widely used in actual crystallization processes
to monitor morphology and size distribution (Barrett, 2003), in a smaller unit such as this we often
2
use an offline microscope to measure from 10-1000 crystal sizes, a typical size range for
crystallizations of biologicals.
The current experiment is a “chemical modification” or “pH-swing” crystallization,
generating salicylic acid (FW = 160.1, a precursor of aspirin) crystals from the rapid reaction of
aqueous solutions of sodium salicylate (RM, FW = 138.1) and H2SO4 (Franck et al., 1988). It is
similar in form to that of many other biologicals :
Na+SAL + 0.5 H2SO4 SAL (ppt) + Na+ + 0.5 SO42- (1)
The solubility of SAL is only ~5.16 g/L at crystallizer conditions (~323 K, Nordstrom and
Rasmuson, 2006), while sodium sulfate is very soluble, and assumed to remain in solution.
This process has many characteristics in common with crystallizations of other biologicals
such L-ornithine-L-aspartate (LOLA), used to treat chronic liver failure (Kim et al., 2003).
However, whereas the precursor L-ornithine hydrochloride costs >$300/kg and is difficult to
recycle, sodium salicylate costs ~$50/kg, and the salicylic acid can be reused by rinsing and
draining out the byproduct sodium sulfate, and then reacting the salicylic acid with dilute NaOH
solution (~0.25 N) in the product tank, followed by recycle.
Laboratory System Overview
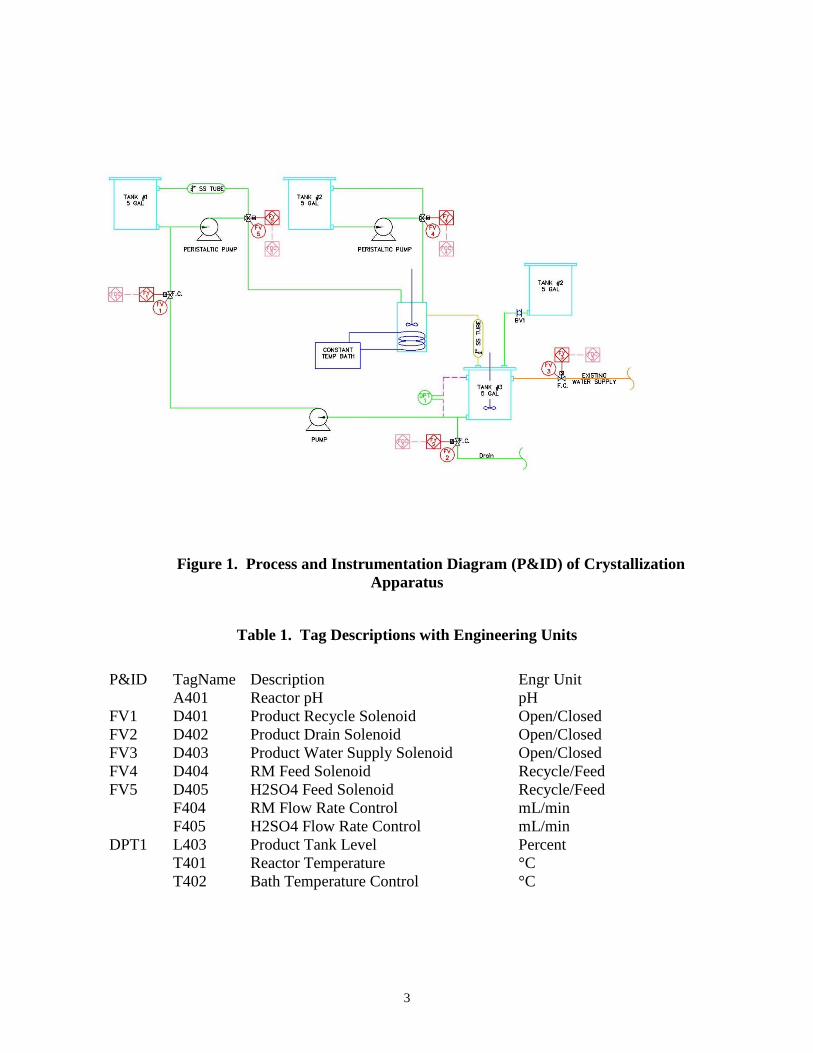
The crystallization apparatus consists of two feed tanks, three variable speed (peristaltic)
pumps, a crystallizer, a circulating bath for temperature control, power controller, product tank,
and a makeup tank for feed regeneration. There are pH and temperature probes on the crystallizer.
There is also a UV spectrophotometer with a fiber optic probe (Ocean Optics) for offline analysis
of the dissolved salicylate ion concentration, along with miscellaneous other instruments, valves
and variable speed agitators. A P&ID is shown as Figure 1. A complete list of the equipment tag
designations can be found below as Table 1.
The crystallization itself takes place in a baffled ~5 L glass vessel equipped with an air-
driven agitator, thermocouple, pH probe, sampling port and extra ports. The organic (sodium
salicylate, RM) and acid (sulfuric acid, 0.25 M = 0.50 N) solutions are fed to the crystallizer, and
a base (sodium hydroxide, 0.25 N) solution is fed to the product tank from a base makeup tank to
convert the crystalline product back to RM. Water can be fed to the makeup tank from the city
water supply, and the city water supply is also used to make up the feed solutions. The
crystallization can be run at any temperature from 25-80°C, although the kinetics are sluggish
below 40°C. The product is collected from an overflow line so that the level is maintained
constant.
3
Figure 1. Process and Instrumentation Diagram (P&ID) of Crystallization
Apparatus
Table 1. Tag Descriptions with Engineering Units
P&ID TagName Description Engr Unit
A401 Reactor pH pH
FV1 D401 Product Recycle Solenoid Open/Closed
FV2 D402 Product Drain Solenoid Open/Closed
FV3 D403 Product Water Supply Solenoid Open/Closed
FV4 D404 RM Feed Solenoid Recycle/Feed
FV5 D405 H2SO4 Feed Solenoid Recycle/Feed
F404 RM Flow Rate Control mL/min
F405 H2SO4 Flow Rate Control mL/min
DPT1 L403 Product Tank Level Percent
T401 Reactor Temperature °C
T402 Bath Temperature Control °C
4
Some Notes on the Analytical Methods
The salicylic acid concentration can be determined gravimetrically. Samples (10-15 mL, typically)
are taken from either the entrance of the product tank or from the sample port of the crystallizer.
After centrifuging and decanting the solution it can be used for RM spectrophotometric analysis.
The crystals are not washed, but they are dried in a static oven at 60ºC for two days. Much effort
was devoted to determining this optimal drying sequence – at too high of a drying T the SAL will
begin to decompose. At too low of a T even two days is not enough to complete the drying.
The crystals are typically needle shaped. The key dimension is length. The length
distribution of representative samples is determined microscopically, using a light microscope,
reticle, and image measuring software.
The pH and UV probes are calibrated with standard solutions prior to each run.
Theories of Crystal Growth
Any Unit Operations textbook (e.g., McCabe et al., 2005) or other general source on
crystallization (e.g., Mersmann et al., 2001) discusses both homogeneous and heterogeneous
mechanisms for initially generating (“nucleating”) crystals, but only heterogeneous nucleation
takes place here. It is the more common mechanism. Both existing “seed” crystals and other solid
surfaces such as the agitator and baffles can catalyze heterogeneous nucleation. In this case both
(seed and solid surfaces) are present even at time = 0. Either a small amount of crystals are added
(if the crystallizer was cleaned completely), or there are still crystals adhering to the baffles and
agitator from the previous batch.
The crystal size distribution (CSD) and its relation to growth parameters
Let n be the number density of crystals, defined as:
n = number density = number of crystals per total volume (the “magma” in
crystallization terminology) at a particular L (2)
n = d(N/V)/dL (3)
Then the nucleation rate B0 is often expressed as initial growth in the key linear dimension (L) per
unit time (t) times the number density of just-formed crystals (n0). The subsequent growth rate G
is expressed as dL/dt. An example of L would be the radius for a spherical crystal or the length of
needle-shaped crystal. The relation between B and G is then by definition:
B0 = n0 G (4)
where n0 is the number density for just-formed (essentially, L = 0) crystals.
The birth rate can be empirically correlated with key physical and operational parameters
by (e.g., Garside, 1985):
B0 = KB [F(geometry)] Cb Mj Nh (5)
5
where C is the supersaturation (liquid concentration of solute is excess of equilibrium solubility),
N is stirrer speed, and Mj is the jth moment of the crystal size distribution. For typical agitated
crystallizers, j and h are both ~3, and the geometry function is:
F(geometry) = p Ds5/V (6)
where p is propeller pitch, Ds is stirrer diameter, and V is liquid volume.
The crystal growth rate is primarily a function of supersaturation, and is usually correlated
as:
G = kg Cg (7)
The function G can also be written in terms of series mass transfer and kinetic (reaction at the
interface) resistances (McCabe et al., 2005), as is standard in theories of simultaneous mass
transfer - reaction.
The powers b and g are system specific. The ratio of the two, b/g, is often called the
“relative kinetic order”, i. Because B0 and G both depend upon C, if C is constant at constant
T, N, geometry etc., then B0 and G can be related:
B0 = KR Gi (8)
These equations (5)-(11) strictly apply only to a special type of crystallizer, a “MSMPR”
(Mixed Suspension, Mixed Product Removal) crystallizer. In an MSMPR, both the liquid and
solid phases are perfectly mixed. It is analogous to the “Continuous Stirred Tank Reactor” in
chemical reactor design. Industrial crystallizers seldom (if ever) approach MSMPR behavior, but
the concept is useful in bench- and pilot-scale units, in part because it provides an easy way to
estimate key parameters such as G and B0.
Note that the power “i” in these correlations usually varies between 2 and 6.
How a CSD for an MSMPR crystallizer can be obtained from the General Population Balance
Because the number density (n) is a non-normalized probability density function with
respect to L, then n dL/(n dL) represents the fraction of crystals at any particular L to L+dL. Let
this fraction be called . Then a mass balance on the fraction in any control volume gives:
Amount of accumulated = + flow of in
– flow of out
+ generated per time by birth
+ gained per time by growth
– lost per time by growth.
This type of mass balance, where the conserved quantity is a fraction (a “probability”) is called a
“population balance”, often the “General Population Balance” model. The population balance is
needed here because we wish to find the number density n (or itself), provided by the solution
of this infinite set of equations, one equation for each fraction.
The last two terms in the General Population Balance give (for all except the L = 0
fraction): -(G’ ), where G’ is the normalized growth function (made dimensionless with respect
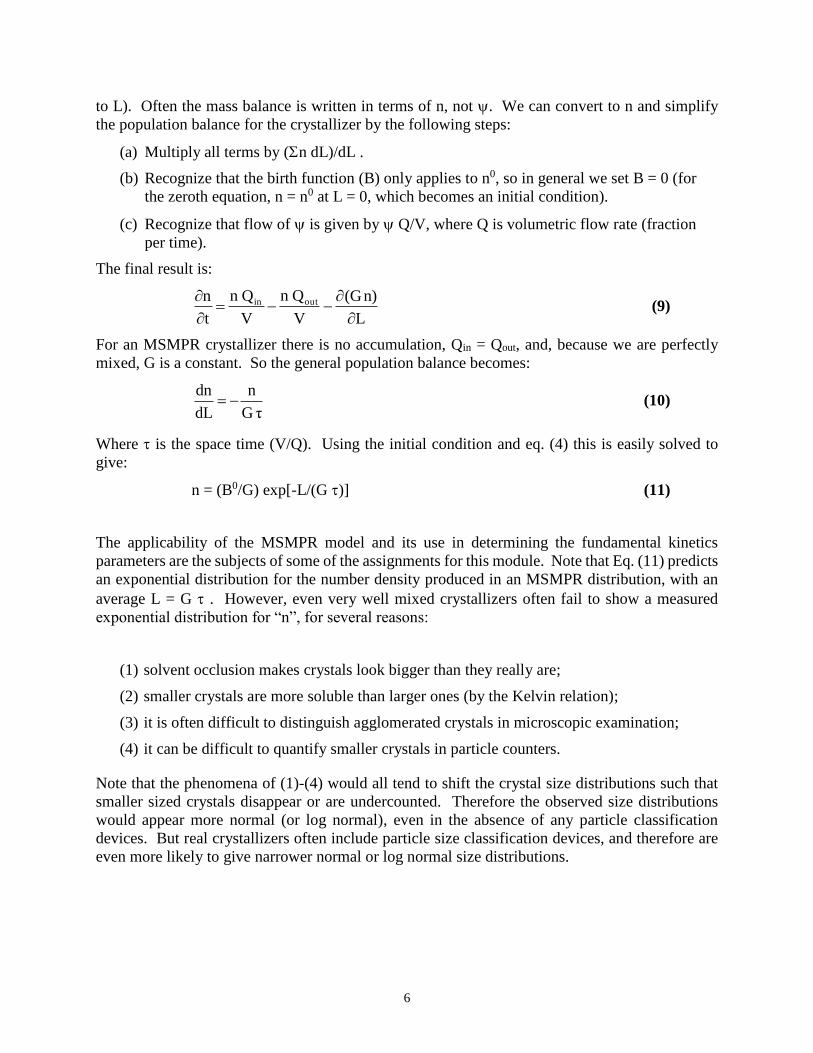
6
to L). Often the mass balance is written in terms of n, not . We can convert to n and simplify
the population balance for the crystallizer by the following steps:
(a) Multiply all terms by (n dL)/dL .
(b) Recognize that the birth function (B) only applies to n0, so in general we set B = 0 (for
the zeroth equation, n = n0 at L = 0, which becomes an initial condition).
(c) Recognize that flow of is given by Q/V, where Q is volumetric flow rate (fraction
per time).
The final result is:
L
n)(G
V
Qn
V
Qn
t
n outin
(9)
For an MSMPR crystallizer there is no accumulation, Qin = Qout, and, because we are perfectly
mixed, G is a constant. So the general population balance becomes:
τG
n
dL
dn (10)
Where is the space time (V/Q). Using the initial condition and eq. (4) this is easily solved to
give:
n = (B0/G) exp[-L/(G )] (11)
The applicability of the MSMPR model and its use in determining the fundamental kinetics
parameters are the subjects of some of the assignments for this module. Note that Eq. (11) predicts
an exponential distribution for the number density produced in an MSMPR distribution, with an
average L = G . However, even very well mixed crystallizers often fail to show a measured
exponential distribution for “n”, for several reasons:
(1) solvent occlusion makes crystals look bigger than they really are;
(2) smaller crystals are more soluble than larger ones (by the Kelvin relation);
(3) it is often difficult to distinguish agglomerated crystals in microscopic examination;
(4) it can be difficult to quantify smaller crystals in particle counters.
Note that the phenomena of (1)-(4) would all tend to shift the crystal size distributions such that
smaller sized crystals disappear or are undercounted. Therefore the observed size distributions
would appear more normal (or log normal), even in the absence of any particle classification
devices. But real crystallizers often include particle size classification devices, and therefore are
even more likely to give narrower normal or log normal size distributions.
7
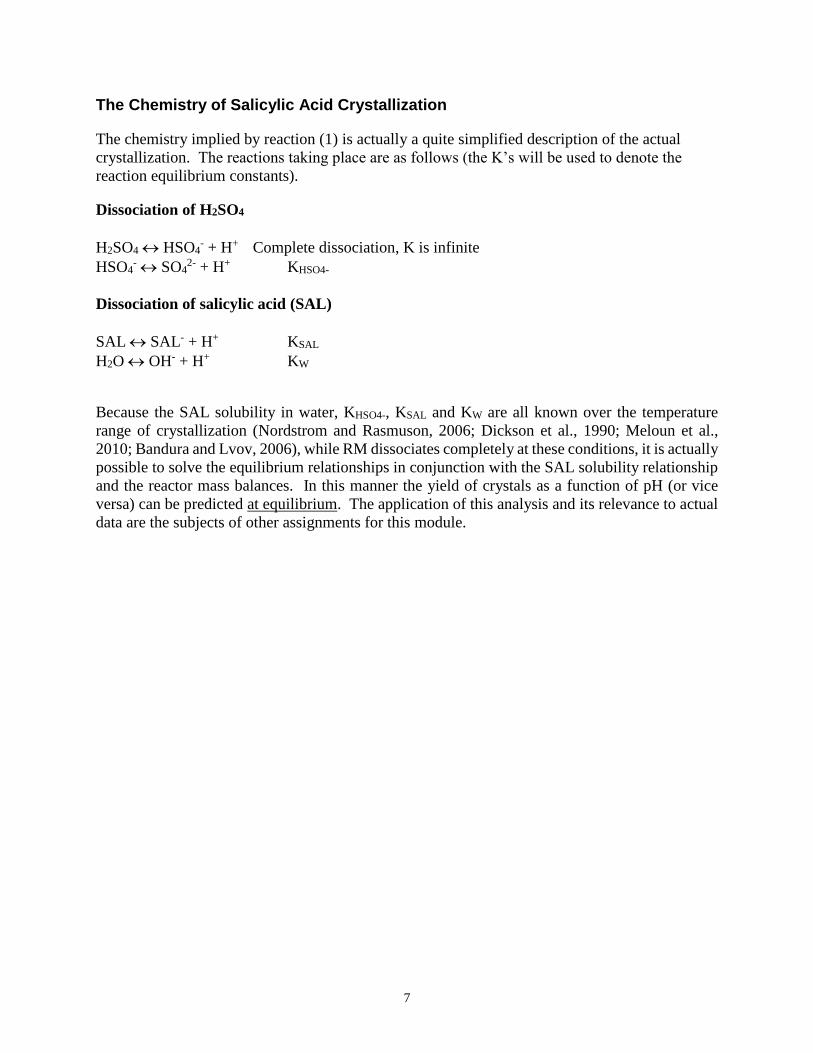
The Chemistry of Salicylic Acid Crystallization
The chemistry implied by reaction (1) is actually a quite simplified description of the actual
crystallization. The reactions taking place are as follows (the K’s will be used to denote the
reaction equilibrium constants).
Dissociation of H2SO4
H2SO4 HSO4- + H+ Complete dissociation, K is infinite
HSO4- SO4
2- + H+ KHSO4-
Dissociation of salicylic acid (SAL)
SAL SAL- + H+ KSAL
H2O OH- + H+ KW
Because the SAL solubility in water, KHSO4-, KSAL and KW are all known over the temperature
range of crystallization (Nordstrom and Rasmuson, 2006; Dickson et al., 1990; Meloun et al.,
2010; Bandura and Lvov, 2006), while RM dissociates completely at these conditions, it is actually
possible to solve the equilibrium relationships in conjunction with the SAL solubility relationship
and the reactor mass balances. In this manner the yield of crystals as a function of pH (or vice
versa) can be predicted at equilibrium. The application of this analysis and its relevance to actual
data are the subjects of other assignments for this module.
8
References
A.V. Bandura and S.N. Lvov, J. Phys. Chem. Ref. Data, 35, 15-30 (2006).
P. Barrett, Chem. Eng. Progr., August 2003, pp. 26-32.
A.G. Dickson, D.J. Weselowski, D.A. Palmer and R.E. Mesmer, J. Phys. Chem., 94, 7978-7985
(1990).
R. Franck, R. David, J. Villermaux and J.P. Klein, Chem. Eng. Sci., 43, 69-77 (1988).
J. Garside, Chem. Eng. Sci., 40, 3-26 (1985).
W.J. Genck, Chem. Eng. Progr., Oct. 2004, pp. 26-32.
H. Gron, A. Borissova and K.J. Roberts, Ind. Eng. Chem. Res., 42, 198-206 (2003).
K. Hussain, G. Thorsen and D. Malthe-Sorenssen, Chem. Eng. Sci., 56, 2295-2304 (2001).
Y. Kim, S. Haam, Y.G. Shul, W.-S. Kim, J.K. Jung, H.-C. Eun and K.-K. Koo, Ind. Eng. Chem.
Res., 42, 883-889 (2003).
F. Lewiner, G. Fevotte, J.P. Klein and F. Puel, Ind. Eng. Chem. Res., 41, 1321-1328 (2002).
W.L. McCabe, J.C. Smith, J.C., and P. Harriott, “Unit Operations of Chemical Engineering”, 7th
Ed., McGraw-Hill, New York, 2005, Ch. 27.
M. Meloun, S. Bordovska, and L. Galla, SRX Pharma., 527013 (2010).
A. Mersmann, C. Heyer and A. Eble, “Activated Nucleation”, in “Crystal Technology Handbook”
2md Ed. (A. Mersmann, Ed.), CRC Press, Boca Raton, 2001, Ch. 2.
F.L. Nordstrom and A.C. Rasmuson, J. Chem. Eng. Data, 51, 1668-1671 (2006).
K.D. Samant and L. O’Young, Chem. Eng. Progr., Oct. 2006, pp. 28-37.
S. Takamatsu and D.D.Y. Ryu, Biotechnol. Bioeng., 32, 184-191 (1988).
F. Wang and K.A. Berglund, Ind. Eng. Chem. Res., 39, 2101-2104 (2000).
C. Wibowo, L. O’Young and K.M. Ng, Chem. Eng. Progr., Jan. 2004, pp. 30-39.
9
ESRL 11 – Biological pH Swing Crystallization
LABORATORY ASSIGNMENT #1
For the crystallization of salicylic acid (S) from sodium salicylate (RM), we will examine the
kinetics of crystallization as a function of feed flow rate, at constant agitation speed and
temperature. Averaged data for flow rate, temperature, pH, average crystal length, salicylic acid
(crystal) concentration, and salicylate ion (dissolved) concentration are given in the Excel file
“Salicylic Crystallization Template”, sheet #1. The data were taken by two separate groups at
different times of the year.
For each run, assuming the reactor behaves as an MSMPR crystallizer, determine the following.
(1) Compute the residence time, growth rate function G, amount of supersaturation in the
aqueous phase C, birth function B0, and the crystal yield on both a product and a feed basis.
Define yield on a feed basis as:
fedsalicylatemols
productcrystalmolsY 1
And on a product basis as:
productsalicylatedissolvedmolsproductcrystalmols
productcrystalmolsY
2
Determine the % error in the mass balance on salicylate.
(2) What might the differences in Y1 and Y2, and the % error in the mass balances, suggest
about possible measurement errors in the system? Possible human errors?
(3) From the growth rate function G estimate the power “g” in Eq. (7). Do this individually
for both data sets. From the birth and growth rate functions estimate the power “i” in Eq. (8). Do
this individually for both data sets. Franck et al. report a power “g” of ~3 and “i” of ~6 for this
system (Franck et al., 1988) using highly sterile conditions. What do your values suggest about
these two data sets (i.e., what factors might be influencing the growth and birth functions that have
not been accounted for)? Could the measured pH values help in making this determination? How?
(4) When students tried to position a UV probe to measure dissolved salicylate ion
concentration in the working reactor (as a test, even though such absorbances would be outside the
Beer-Lambert Law range for the aqueous salicylate ion), they found that the absorbance
continually increased. Why? When they took slurry samples (for gravimetric analysis) from
within the reactor instead of from the exit line, they found better closure for the mass balance, as
long as the sample was of sufficient size and was taken not too close to a baffle. Why?
10
LABORATORY ASSIGNMENT #2
For the crystallization of salicylic acid (S) from sodium salicylate (RM), we will examine the
kinetics of crystallization as a function of feed flow rate, at constant agitation speed and
temperature. Averaged data for flow rate, temperature, pH, average crystal length, salicylic acid
(crystal) concentration, and salicylate ion (dissolved) concentration are given in the Excel file
“Salicylic Crystallization Template”, sheet #2. The data were taken by two separate groups at
different times of the year.
For each run, assuming the reactor behaves as an MSMPR crystallizer, determine the following.
(1) Compute the residence time, growth rate function G, amount of supersaturation in the
aqueous phase C, birth function B0, and the crystal yield on a product basis. Define yield as:
productsalicylatedissolvedmolsproductcrystalmols
productcrystalmolsY
Determine the % error in the mass balance on salicylate.
(2) If your calculations for C and Y do not follow the expected pattern, what are possible
causes? You might want to try some parametric variation of the following experimental quantities
(i.e., move them up/down by say 10% and look at how the calculated results change): RM feed
concentration; both feed rates; C of RM; C of SAL (crystals). Based on these results, if you were
asked which of these is the most likely measurement error, which would it be for the CRYST3
data? For the CRYST1 data?
(3) Particle length data for needle-shaped crystals (taken with an optical microscope) are
shown for run CRYST3 in the Excel file “Salicylic Crystallization Template”, sheet #3. Using
these data, determine the crystal size density function:
n = d(N/V)/dL
To do this you must use the zeroth moment of the CSD to get the volume “V” of the crystals. The
“V” is determined such that the zeroth moment of the distribution matches the molar density of
SAL, because the sample includes crystals only. In other words:
LdLd
V
Nd
SALM )(
11
Compute the first and second moments of the CSD, the standard deviation and average of crystal
size from the raw data, and the average L on both a length basis (first moment/zeroth moment) and
a surface area basis (second moment/first moment). Note that the average L on a length basis
should be close to the average using the raw microscope data, assuming your calculation of the
CSD is OK.
Use whatever numerical methods you are familiar with in order to perform the necessary
differentiation and integrations.
(4) Prepare a histogram of the three CSDs. Using this graph and the results from (3), discuss:
(a) whether the CSDs are of the expected form; (b) whether these results follow the expected trends
with respect to flow rate. If they don’t, speculate as to why not. To aid your determination, regress
the CSD function (Eq. (8), but skip the 1st point) and plot the data and the regressed function, and
use the regressed function to compute G, which can be compared to the G computed from the
average only. What does this comparison tell you?
12
Other Exercises
(1) Show how the equation for the average of L is computed from the exponential probability
density function (Eq. 11). Explain how you could use these values to determine how closely the
exponential distribution is actually followed in experimental results of the type shown in the Excel
file, “Salicylic Crystallization Template”, sheet #1. Is the expected variation with respect to flow
rate for the average L actually followed by the data of CRYST3 and CRYST2?
(2) How much heat (kJ) must be added or removed per kg of crystal product for a typical
crystallization (say, RUN3 of the CRYST1 data set in the Excel file, “Salicylic Crystallization
Template”, sheet #2). The NIST Chemistry Webbook (http://webbook.nist.gov/chemistry/) gives
the following thermodynamic data:
Hr = -118.4 kJ/mol for the crystallization as in Eq. (1) at 298 K, but all products liquid phase
Hfusion (SAL) = 25 kJ/mol at 298 K
Cp (SAL) = 160 J/(molK)
Cp (Na2SO4) = 130 J/(molK)
Approximations: Assume no heat losses to atmosphere, and neglect the enthalpies of the small
amounts of residual NaSAL and H2SO4 (just lump them with water).
Examining the data of CRYST1, what does your calculation suggest as to what conditions this
crystallizer should be operated at, economically? Explain.
(3) For aqueous salicylate, the CRC Handbook (63rd Ed., 1982-83) gives the log of the molar
absorptivity (log ) as ~3.6 for its peak near 300 nm. Using this value and the Beer-Lambert law
for absorption spectroscopy, determine the salicylate concentration that would give an absorbance
A ~ 0.5 in the UV probe of this experiment, which has a path length of 10 mm. For an average
series of experiments (say CRYST3), by how much must the samples from the crystallizer be
diluted to give an absorbance in this range?
(4) Determine the precision of a calculation for “G” by the propagation of error analysis
(assume uncorrelated errors) for data of a single experimental run (Run 3) from CRYST2 (data in
sheet #4 of the Excel file, “Salicylic Crystallization Template”). Report the precision in %.
Which measurements are critical to the calculation of G?
Previous efforts to regress G to a theoretical model suggest that there is at least 9% error in G-
measurement for this data set. How much of this error is explainable taking into account the
precision of the underlying measurements used to find G? What might account for the remaining
error? Explain your reasoning.
Background: Any basic text on probability/statistics discusses propagation of error and how to
obtain the error (precision) associated with a function of more than one measured variable.
However, these concepts are also discussed on several websites, e.g.
13
http://www.itl.nist.gov/div898/handbook/mpc/section5/mpc55.htm
http://ipl.physics.harvard.edu/wp-uploads/2013/03/PS3_Error_Propagation_sp13.pdf
http://www.physics.ohio-state.edu/~gan/teaching/spring04/Chapter4.pdf
(5) Determine the precision of a calculation for the mass balance (IN – OUT) of salicylate by
the propagation of error analysis (assume uncorrelated errors) for data of a single experimental run
(Run 3) from CRYST2 (in sheet #4 of the Excel file, “Salicylic Crystallization Template”). Report
the precision in mols/time and then divide by the IN value to determine a relative % error in the
mass balance.
Which measurements are critical in getting a good mass balance?
Other calculations using CRYST2 have shown that the % error in the mass balance is 9-10% for
this run, with the error computed as (IN – OUT)/(IN). How much of this error is explainable taking
into account the precision of the underlying measurements used to perform the mass balance?
What might account for the remaining error (if any)? Explain your reasoning.
NOTE: See exercise (4) for background on propagation of error.
(6) Compute the pH, undissociated [SAL] and [SAL] concentrations (mol/L) assuming a
saturated solution of salicylic acid at room temperature. Assume the only ions present in the
solution are H+, SAL, and OH. According to the CRC Handbook (63rd Ed., 1982-83) and the
Sigma-Aldrich catalog (http://www.sigmaaldrich.com/united-states.html), the properties of
salicylic acid at room temperature are: solubility in water – 2.24 g/L; pKa – 2.97; MW – 138.12.
Remember to use the charge balance (electroneutrality) as a 3rd equation!
Given these results, why is it still vital, when we are performing equilibrium calculations in
salicylic acid crystallization, that we account for OH in the aqueous phase?
(7) Computer Project - Equilibrium Calculations for the Salicylic Acid Crystallization
Consider the pH-swing crystallization of salicylic acid (SAL) by reaction of aqueous sodium
salicylate (RM) with dilute sulfuric acid:
NaSAL + 0.5 H2SO4 SAL(crystal) + SAL(aq) + 0.5 Na2SO4(aq)
This equation is not balanced; under normal conditions in a crystallizer, most of the SAL ends up
as crystals. However, some will remain in solution and of this amount some will dissociate.
Na2SO4 will remain dissolved and dissociated.
If we think about what reactions must be included in the equilibrium analysis, the following should
be readily apparent.
14
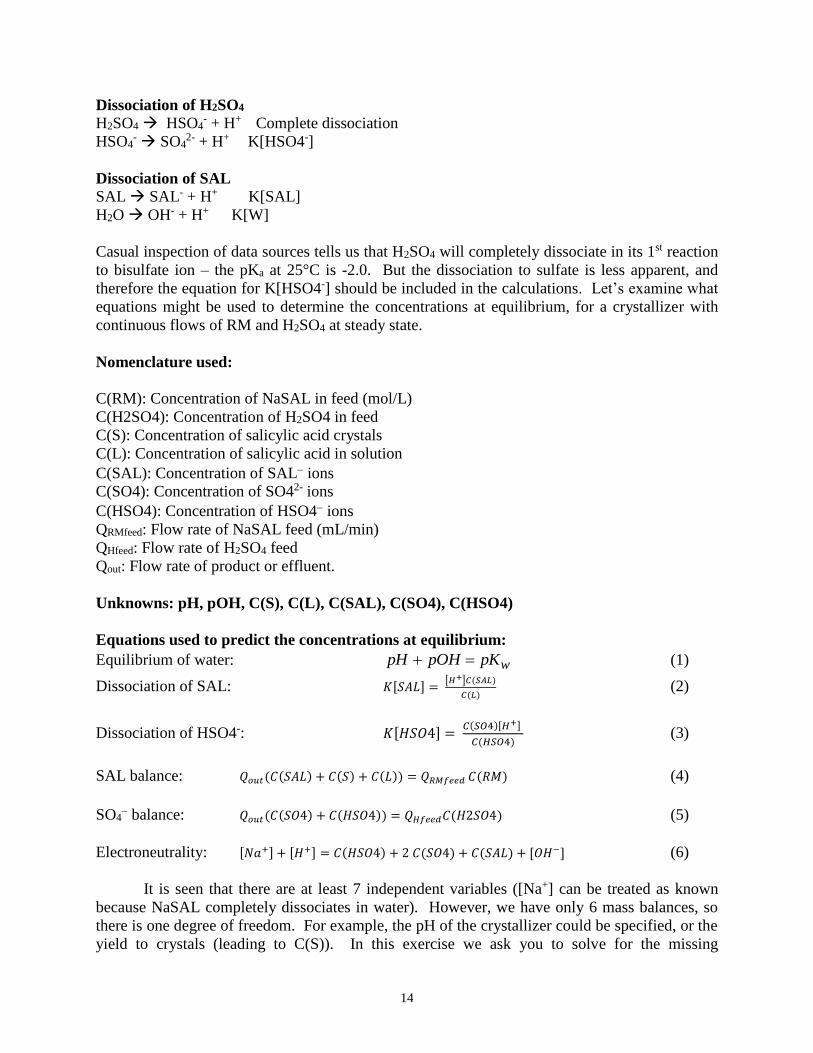
Dissociation of H2SO4
H2SO4 HSO4- + H+ Complete dissociation
HSO4- SO4
2- + H+ K[HSO4-]
Dissociation of SAL
SAL SAL- + H+ K[SAL]
H2O OH- + H+ K[W]
Casual inspection of data sources tells us that H2SO4 will completely dissociate in its 1st reaction
to bisulfate ion – the pKa at 25°C is -2.0. But the dissociation to sulfate is less apparent, and
therefore the equation for K[HSO4-] should be included in the calculations. Let’s examine what
equations might be used to determine the concentrations at equilibrium, for a crystallizer with
continuous flows of RM and H2SO4 at steady state.
Nomenclature used:
C(RM): Concentration of NaSAL in feed (mol/L)
C(H2SO4): Concentration of H2SO4 in feed
C(S): Concentration of salicylic acid crystals
C(L): Concentration of salicylic acid in solution
C(SAL): Concentration of SAL ions
C(SO4): Concentration of SO42- ions
C(HSO4): Concentration of HSO4 ions
QRMfeed: Flow rate of NaSAL feed (mL/min)
QHfeed: Flow rate of H2SO4 feed
Qout: Flow rate of product or effluent.
Unknowns: pH, pOH, C(S), C(L), C(SAL), C(SO4), C(HSO4)
Equations used to predict the concentrations at equilibrium:
Equilibrium of water: wpKpOHpH (1)
Dissociation of SAL: 𝐾[𝑆𝐴𝐿] = [𝐻+]𝐶(𝑆𝐴𝐿)
𝐶(𝐿) (2)
Dissociation of HSO4-: 𝐾[𝐻𝑆𝑂4] = 𝐶(𝑆𝑂4)[𝐻+]
𝐶(𝐻𝑆𝑂4) (3)
SAL balance: 𝑄𝑜𝑢𝑡(𝐶(𝑆𝐴𝐿) + 𝐶(𝑆) + 𝐶(𝐿)) = 𝑄𝑅𝑀𝑓𝑒𝑒𝑑 𝐶(𝑅𝑀) (4)
SO4 balance: 𝑄𝑜𝑢𝑡(𝐶(𝑆𝑂4) + 𝐶(𝐻𝑆𝑂4)) = 𝑄𝐻𝑓𝑒𝑒𝑑𝐶(𝐻2𝑆𝑂4) (5)
Electroneutrality: [𝑁𝑎+] + [𝐻+] = 𝐶(𝐻𝑆𝑂4) + 2 𝐶(𝑆𝑂4) + 𝐶(𝑆𝐴𝐿) + [𝑂𝐻−] (6)
It is seen that there are at least 7 independent variables ([Na+] can be treated as known
because NaSAL completely dissociates in water). However, we have only 6 mass balances, so
there is one degree of freedom. For example, the pH of the crystallizer could be specified, or the
yield to crystals (leading to C(S)). In this exercise we ask you to solve for the missing
15
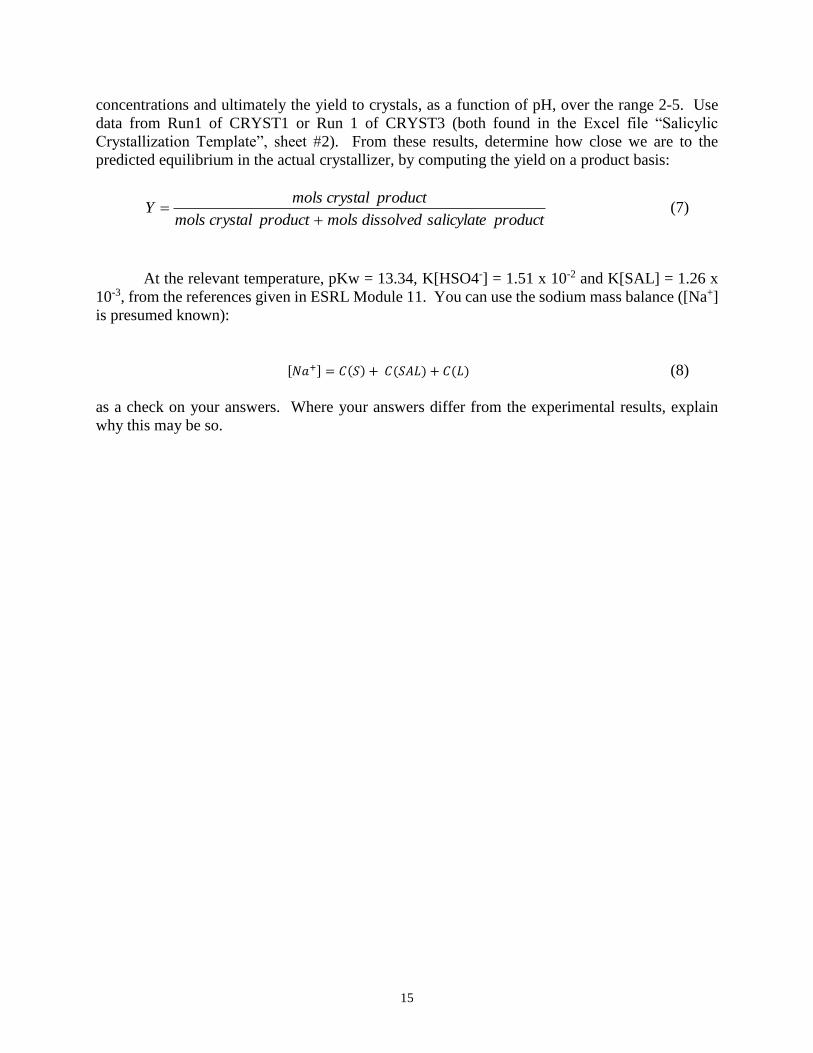
concentrations and ultimately the yield to crystals, as a function of pH, over the range 2-5. Use
data from Run1 of CRYST1 or Run 1 of CRYST3 (both found in the Excel file “Salicylic
Crystallization Template”, sheet #2). From these results, determine how close we are to the
predicted equilibrium in the actual crystallizer, by computing the yield on a product basis:
productsalicylatedissolvedmolsproductcrystalmols
productcrystalmolsY
(7)
At the relevant temperature, pKw = 13.34, K[HSO4-] = 1.51 x 10⁻² and K[SAL] = 1.26 x
10-3, from the references given in ESRL Module 11. You can use the sodium mass balance ([Na+]
is presumed known):
[𝑁𝑎+] = 𝐶(𝑆) + 𝐶(𝑆𝐴𝐿) + 𝐶(𝐿) (8)
as a check on your answers. Where your answers differ from the experimental results, explain
why this may be so.