Embed Size (px)
Citation preview

@ExcelinEd | www.ExcelinEd.org| © 2016
June 23, 2017
ESSA State Plan Summary
Summary Information from the 17 State Plans
Submitted for USED Peer Review in April 2017

@ExcelinEd | www.ExcelinEd.org| © 2016
April Submission Window: 17 States Submitted ESSA Plans for USED Peer Review
HI
ND
CO
AZ
CT
LA
MI
OR
MEVT
NJ
IL DE
TN
ESSA State Plan Submission April 2017
2
DC
MA
NV
NM

@ExcelinEd | www.ExcelinEd.org| © 2016
Key Takeaways
The Good
• Summative ratings: 14 of 17 states propose a summative rating.
• Minimum N: All 17 states use a minimum N-size of 30 or less.
• Focus on student outcomes (K-8): In 8 states, at least 70% of a K-8 school
rating is based on student outcomes.
• In Louisiana and D.C. it is 90%.
• Interventions: At least 10 states will distribute school improvement funds
through competitive grants or a combination of competitive/formula grants
The Not-so-good
• Normative growth: 10 states plan to rely exclusively on normative growth.
• Three states use normative growth in conjunction with another type of
growth.*
• 95 participation requirement: Most states generally do not plan to impose
significant consequences on schools that do not assess 95% of students.
* Normative growth models (such as value-added models and student growth percentiles) in accountability
systems provide little if any incentive to narrow achievement gaps because they do not expect low
performing students to grow more than they had in the past, nor do they hold schools accountable for
helping low-performing students advance toward proficiency or above. See Hull 2007; EdTrust 2017.

@ExcelinEd | www.ExcelinEd.org| © 2016
Goals

@ExcelinEd | www.ExcelinEd.org| © 2016
Math and ELA Goals: End Points and Terminal Years
DE ELA, 76
IL ELA, 90
LA ELA, 64
MA ELA, 81
NV ELA, 63
NJ ELA, …
NM ELA, 65ND ELA, 67
OR ELA, 80
TN ELA, 70 DE MATH, 70
IL MATH, 90
LA MATH, 57
MA MATH, 76
NV MATH, 56
NJ MATH, 80
NM MATH, 61 ND MATH, 61
OR MATH, 80
TN MATH, 65
50
55
60
65
70
75
80
85
90
95
100
2021 2022 2023 2024 2025 2026 2027 2028 2029 2030 2031 2032 2033
Perc
ent
Pro
ficie
nt
End P
oin
t
Year
Generally, states’ ELA and math goals appear ambitious, and states with longer timelines set higher goals.
5

@ExcelinEd | www.ExcelinEd.org| © 2016
Graduation Rate Goals: End Points and Terminal Year
CT, 94
DE, 92
IL, 90LA, 90 ME, 90
NV, 84
NJ, 96
NM, 85
OR, 90
TN, 95
VT, 90
80
82
84
86
88
90
92
94
96
98
100
2020 2022 2024 2026 2028 2030 2032 2034
4-Y
ear
Gra
duati
on R
ate
End P
oin
t
States’ 4-year graduation rate goals ranged from 84 to 96%, and states with longer timelines tended to set higher goals.
6

@ExcelinEd | www.ExcelinEd.org| © 2016
Summative Ratings

@ExcelinEd | www.ExcelinEd.org| © 2016
Summative Ratings
A-F, 5
Other, 9
No Summative Rating, 3
In 14 of 17 states, schools will earn summative ratings.Five states will use A-F letter grades.
8

@ExcelinEd | www.ExcelinEd.org| © 2016
Summative Ratings
Proposed summative ratings do not clearly articulate
performance of the school.
• 1 to 5 Stars
• Categories 1 to 5
• Performance Levels
• Off Target (also Red, Level 1, ); Near Target (also
Orange, Level 2, ); On Target (also Yellow, Level 3, );
Bulls Eye (also called Green, Level 4, )
• Exemplary, Commendable, Underperforming, Lowest
• Percentile Rank of Summative Scores
• Exceeds State Expectations; Meets State Expectations;
Below State Expectations; Requires Review
9

@ExcelinEd | www.ExcelinEd.org| © 2016
Minimum N-size for Accountability

@ExcelinEd | www.ExcelinEd.org| © 2016
Minimum N-size
N=10(6 states)
N=15(1)
N=16(1)
N=20(5)
N=25(1)
N=30(2)
0
5
10
15
20
25
30
35
All 17 states plan to use a minimum N-size of 30 or less for accountability purposes.
11

@ExcelinEd | www.ExcelinEd.org| © 2016
Minimum N-size
*States with lower n-sizes for reporting
30 30
25
20 20 20 20 20
1615
10 10 10 10 10 10
0
5
10
15
20
25
30
35
Min
imum
N-S
ize
13 states have a minimum N-size of 20 or less
12

@ExcelinEd | www.ExcelinEd.org| © 2016
Accountability for English Learners

@ExcelinEd | www.ExcelinEd.org| © 2016
English Learners
8
7
1
Progress on ELP assessments Both Progress and Proficiency on ELPIndicators
Proficiency on ELP assessments
Nearly half of the states will incorporate English language proficiency into their accountability systems.
14

@ExcelinEd | www.ExcelinEd.org| © 2016
English Learners
6
4
2
5
0
1
2
3
4
5
6
7
5 Years 6 Years 7 Years NA
Years
Most states expect English learners to achieve proficiency within 5 or 6 years.
15

@ExcelinEd | www.ExcelinEd.org| © 2016
Measures Used for Accountability

@ExcelinEd | www.ExcelinEd.org| © 2016
Calculating Academic Achievement
Proficiency, 7
Index, 4
Scale Scores, 2
Other, 2
Fewer than half of the states plan to measure academic achievement based on percent proficient.
17

@ExcelinEd | www.ExcelinEd.org| © 2016
Calculating Student Growth
Normative, 10Other, 2
Criterion, 2
Both, 3
Most states rely on normative student growth models, rather than growth models focused on measuring whether
students are on track for college and career readiness.
18

@ExcelinEd | www.ExcelinEd.org| © 2016
Additional Groups Included in Accountability
8
4
2 2
None Super Subgroup (HistoricallyLow Performing Subgroups)
Bottom 25% Other
Four states use a “super subgroup” which may allow one group’s performance to mask that of another group. Two states emphasize the performance of the lowest
performing students in each school.
19

@ExcelinEd | www.ExcelinEd.org| © 2016
Participation Rates
* Illinois is the only state to identify schools for either Targeted Support (TS) or Comprehensive Support (CS) for schools failing to test 95% of their students.
Improvement Plan, 7
Drop in overall rating, 4
Other, 4
Identify schools for TS or CS, 1*
States generally will not impose significant consequences on schools that do not assess 95% of students.
20

@ExcelinEd | www.ExcelinEd.org| © 2016
Weighting Proficiency and Growth

@ExcelinEd | www.ExcelinEd.org| © 2016
Weighting Proficiency and Growth: K-8
Note: Not all states reported weights
65
5045
33 33 3530
20
3122
3025 25
25
40
35
44 42 3540
5036
44 3035
30
0
10
20
30
40
50
60
70
80
90
100
In 8 of 13 states, growth and proficiency count for at least 70% of K-8 schools’ ratings.
% weight of proficiency % weight of Growth
22
@ExcelinEd | www.ExcelinEd.org| © 2016
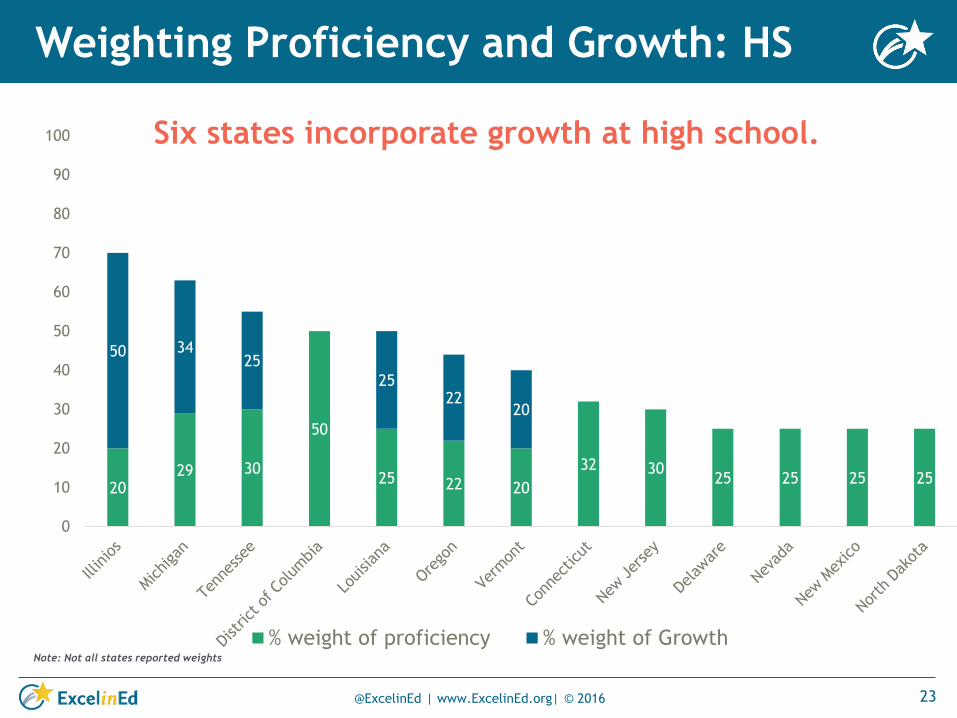
Weighting Proficiency and Growth: HS
Note: Not all states reported weights
2029 30
50
25 22 20
32 3025 25 25 25
50 3425
2522
20
0
10
20
30
40
50
60
70
80
90
100 Six states incorporate growth at high school.
% weight of proficiency % weight of Growth
23

@ExcelinEd | www.ExcelinEd.org| © 2016
Science and Social Studies

@ExcelinEd | www.ExcelinEd.org| © 2016
Inclusion of Science and Social Studies
According to initial guidance from USED, science and social studies cannot be included in
the Academic Achievement indicator. Many states included it as an Academic Achievement
indicator which was coded as “Other.”
Another academic indicator, 1 As a school quality or
student success indicator, 1
Not at all, 3
Other, 11
Science
Not at all, 13
Other, 3
Social Studies
25

@ExcelinEd | www.ExcelinEd.org| © 2016
School Quality/Students Success
Indicators

@ExcelinEd | www.ExcelinEd.org| © 2016
School Quality/Students Success Indicators
State
Abse
nte
eism
Perfo
rman
ce:
colleg
e-ready
tests
Po
stsecon
dary
credit earn
ed
CT
E
creden
tial
Course
partic
ipatio
n
Oth
er
state test
Po
stsecon
dary
enro
llmen
t
Ad
vanced
achievem
ent
Paren
t / stud
ent
survey
Particip
ation
:
colleg
e-ready
tests
Gro
wth
:lo
w
perf g
roup
Sch
oo
l
discip
line
Arizona
Colorado X
Connecticut X X X X X
Delaware X X X X
District of
Columbia
X X X
Illinois X X X X X X X
Louisiana X X X X X
Maine X
Massachusetts X X
Michigan X X X X X
Nevada X X X X X
New Jersey X
New Mexico X X X X X
North Dakota X X X X
Oregon X
Tennessee X X X X
Vermont X X X X
Total 12 10 9 9 6 3 3 2 2 1 0 0
27
Most states selected SQ/SS focused on student outcomes

@ExcelinEd | www.ExcelinEd.org| © 2016
School Quality/Students Success Indicators
Some states plan to experiment with other SQ/SS.
measuresState Other measure(s)
Arizona
Colorado Dropout rates (high school only)
Connecticut 9th grade on-track
Delaware 9th grade on-track; K-3 literacy
District of
Columbia
Alternate grad metric; Early childhood classroom program quality; Re-enrollment
Illinois 9th grade on-track; P-2 quality
Louisiana 9th grade credit accumulation
Maine Exploring other CCR indicators and a potential social emotional measure
Massachusetts Grade 9 course passing
Michigan Science and social studies, which will have to be taken out of academic achievement
indicator, may be added as SQSS indicator
Nevada 9th and 10th grade credit sufficiency
New Jersey
New Mexico Many inputs will be reviewed/revisited for 2018-2019 implementation
North Dakota community service; Attendance; College-ready requirements (including co- and extra-
curricular)
Oregon Freshman on-track; 5-year high school completion rate (percentage of students earning a
regular or modified diploma, extended diploma, GED or adult high school diploma)
Tennessee
Vermont Presidential physical fitness
28

@ExcelinEd | www.ExcelinEd.org| © 2016
Interventions in Low-performing Schools

@ExcelinEd | www.ExcelinEd.org| © 2016
Comprehensive Support for Low-Performing Schools
10
3
10
2
4
6
8
10
12
Every Three Years Every Year MI will provide at a laterdate - per plan
Num
ber
of
Sta
tes
Only 3 States will annually identify low-performing schools for comprehensive support.
30

@ExcelinEd | www.ExcelinEd.org| © 2016
School Improvement Fund Distribution
Through Competitive
Grants, 4
As Formula Funds, 3
A Combination, 6
Unclear, 4
Four states will distribute school improvement funds through competitive grants; an additional six states will distribute through a combination of competitive and formula grants.
31
@ExcelinEd | www.ExcelinEd.org| © 2016
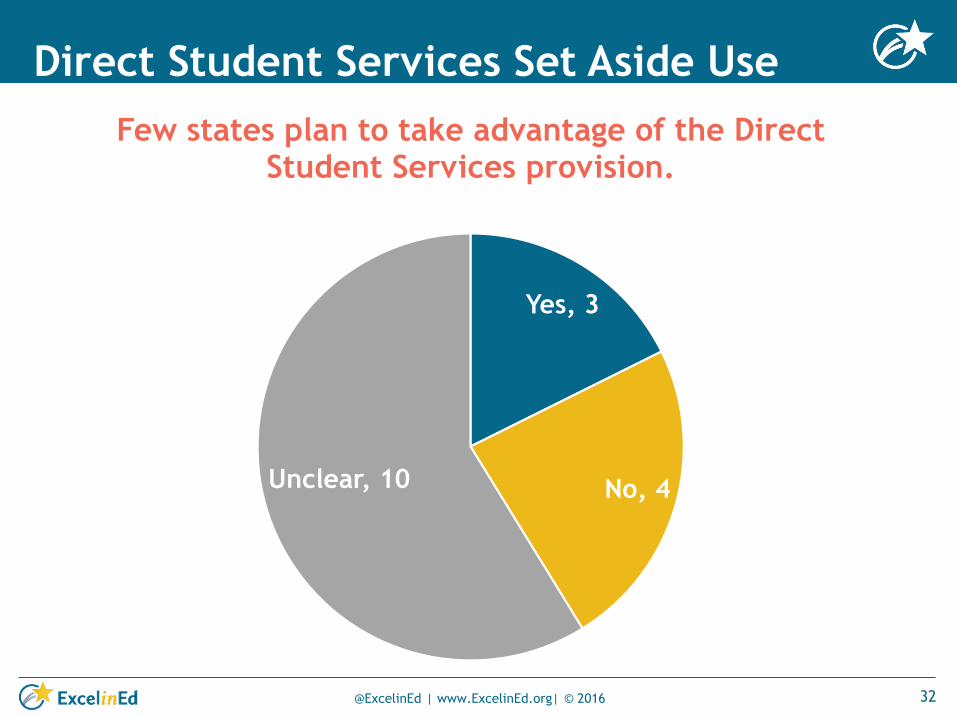
Direct Student Services Set Aside Use
Yes, 3
No, 4Unclear, 10
Few states plan to take advantage of the Direct Student Services provision.
32