Embed Size (px)
Citation preview
Essay
Driving with the Brakes On: Guido Calabresi’s Failed 1970 Automobile
Insurance Case against Safety-Device Mandates
Patrick Butler* July 6, 2006
ABSTRACT
Guido Calabresi’s book, THE COSTS OF ACCIDENTS, gives two contrasting examples which together prove that efficient decisions about car safety devices must be guided by individual costs. Part I of this essay reviews Calabresi’s demonstration that, if charged accurate insurance costs, Taney would invest in improved brakes and Marshall would not.
To show why this demonstration fails to inform debates over safety-device mandates, Part II builds a model composed of high-annual-miles Taney cars and low-annual-miles Marshall cars, which traditional insurance would not differentiate. But pooling cars driven different annual miles overwhelms safety-device savings from reduced risk per mile. Although Calabresi uncritically identifies insurance as a cost of car owning, the model shows why decisions instead must be guided by two interdependent variables that together would make insurance an operating cost. One is the continuous odometer-mile exposure unit variable for measuring individually how much each car is operated. The other is the cents-per-mile risk rate variable for measuring by category how cars are operated, e.g., driver-age and safety-device categories.
To explain why insurers shun cents-per-odometer-mile prices, Part III reviews marketing decisions to disregard categories that would raise premiums for some high-annual-miles cars. The essential first step toward redeeming Calabresi’s free-market approach to automobile accidents is to acknowledge that insurance charged as a cost of car owning produces nothing but wrong incentives for optimizing the costs of accidents.
I. CALABRESI’S CASE
In his widely-cited book THE COSTS OF ACCIDENTS: A LEGAL AND ECONOMIC ANALYSIS,1 Guido Calabresi made a compelling
* National Organization for Women; Email: [email protected] 1. GUIDO CALABRESI, THE COSTS OF ACCIDENTS: A LEGAL AND ECONOMIC
ANALYSIS (1970). (Hereinafter referred to as “THE COSTS OF ACCIDENTS.”) The continuing influence of this book was formally recognized on April 23-24, 2004 by the University of Maryland School of Law and Maryland Law Review Symposium Calabresi’s The Costs of Accidents: A Generation of Impact on Law and Scholarship, 64 MD. L. REV. 1-754 (2005)
Guido Calabresi’s Failed Automobile Insurance Case
Working Essay 752 7/6/2006
case for using automobile insurance cost as the incentive to reduce risk. The book was a pioneering work in economic analysis of law when published in 1970 and has been in print ever since. However, no subsequent law and economics study of the costs of automobile accidents has engaged with Calabresi’s argument, apparently for a reason that few academics have acknowledged. Namely, Calabresi’s book overlooks problems that result from charging for insurance, not as a cost of operating a car which is the accident-producing activity, but as a cost of owning a car. This means using a single average cost for each insurance class pool to value the annual risk produced by each car in the pool. Although this average-annual-risk valuation conforms to traditional industry practice for private passenger cars, it defeats practical application and theoretical extension of Calabresi’s insurance-incentive thesis. As support for these conclusions, I present the following analysis of Calabresi’s important economic case against government mandates for automobile safety devices.
The case contrasts the circumstances of two car owners named Taney and Marshall. Calabresi states that the “accident cost of Taney's operating an automobile can be viewed as the cost of insuring against the accident costs he causes . . . .”2 and “assumes we know the costs precisely.”3
Taney drives a car. His car causes, on the average, $200 per year in accident costs. If a different kind of brake were used in the car, this would be reduced to $100. The new kind of brake costs the equivalent of $50 per year. If the accident costs Taney causes are paid either by the state out of general taxes or by those who are injured, he has no financial incentive to put in the new brake. But if Taney has to pay, he will certainly put the new brake in. He will thus bear a new cost of $50 per year, but it will be less than the $100 per year in accident costs he will avoid. As a result, the cost of accidents to society will have been reduced by $50.4
2. THE COSTS OF ACCIDENTS at 73 n.5 (emphasis added). 3. THE COSTS OF ACCIDENTS at 73 n.5. 4. THE COSTS OF ACCIDENTS at 73-74 (footnotes omitted). The critical part
accurate insurance cost plays in this example may not yet be fully appreciated. In their recent critique John C. P. Goldberg and Benjamin C. Zipursky, Accidents of the Great Society, 64 MD. L. REV. 364 (2005) construct a modified version of this Taney-new-brakes example to illustrate Calabresi’s case for using accident costs as the basis for individual decisions about safety-devices. Id. at 377. But unlike Calabresi they call on tort law instead of insurance to impose the costs: “By charging the $200 cost of accidents to the driver, the law thereby creates a monetary incentive in the driver to change his behavior so as to save society money.” Id. Later, however, Goldberg & Zipursky do note the part insurance generally plays: “[O]ne of Calabresi’s great contributions is to point out that a large component of the manner in which tort law tends to influence conduct is dependent on its being funneled through our insurance system.” Id. at 397 (citation omitted).
2
Guido Calabresi’s Failed Automobile Insurance Case
Working Essay 752 7/6/2006
Calabresi asks if a government mandate to install the new brakes would not be better than having to rely on individual responses to insurance prices. He answers negatively by describing Marshall’s situation. In doing so he repeats the qualification that Marshall's insurance company evaluates accident costs precisely, but suggests here that the assumed accuracy may be difficult to achieve in practice.
Suppose that Marshall, who uses old-style brakes, has only $25 worth of accidents per year. It is not worth our while to force him to install the new brakes. Indeed, if he were made to install new brakes and if we can assume our measurements of costs to be accurate (a matter calling for a good deal of discussion later), forcing Marshall to install new brakes would add an unnecessary $25 to our cost burden.5
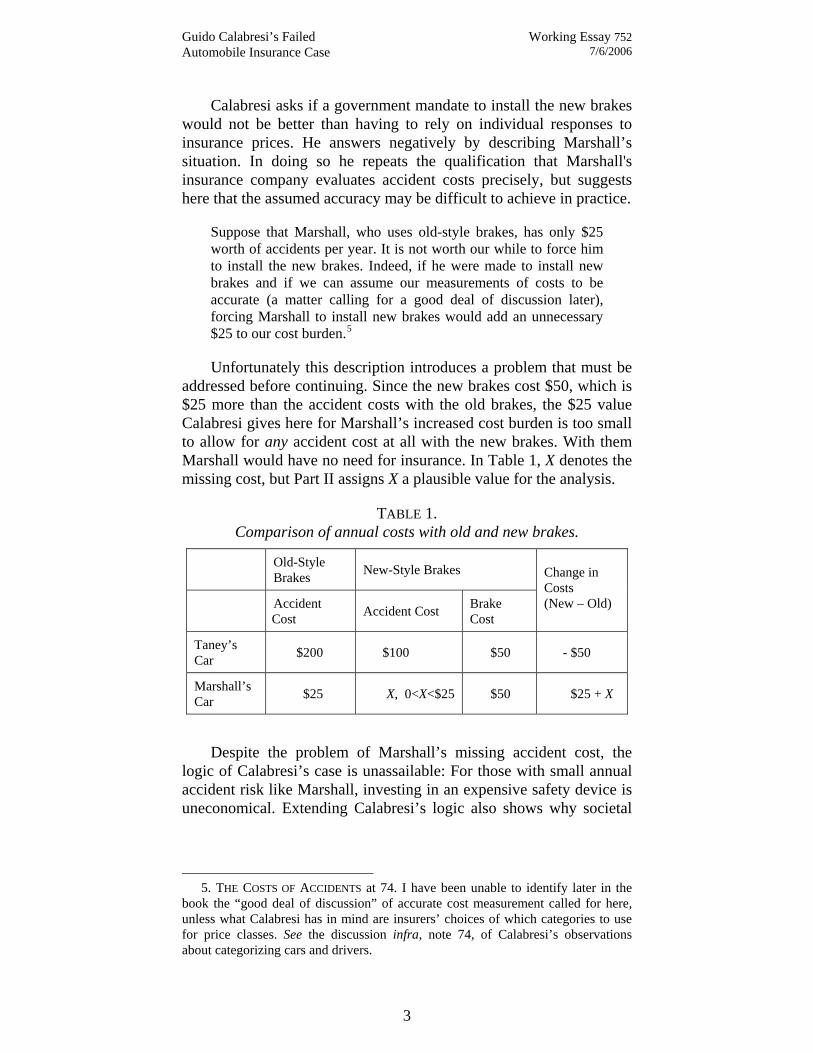
Unfortunately this description introduces a problem that must be addressed before continuing. Since the new brakes cost $50, which is $25 more than the accident costs with the old brakes, the $25 value Calabresi gives here for Marshall’s increased cost burden is too small to allow for any accident cost at all with the new brakes. With them Marshall would have no need for insurance. In Table 1, X denotes the missing cost, but Part II assigns X a plausible value for the analysis.
TABLE 1. Comparison of annual costs with old and new brakes.
Old-Style Brakes New-Style Brakes
Accident Cost Accident Cost Brake
Cost
Change in Costs (New – Old)
Taney’s Car $200 $100 $50 - $50
Marshall’s Car $25 X, 0<X<$25 $50 $25 + X
Despite the problem of Marshall’s missing accident cost, the logic of Calabresi’s case is unassailable: For those with small annual accident risk like Marshall, investing in an expensive safety device is uneconomical. Extending Calabresi’s logic also shows why societal
5. THE COSTS OF ACCIDENTS at 74. I have been unable to identify later in the
book the “good deal of discussion” of accurate cost measurement called for here, unless what Calabresi has in mind are insurers’ choices of which categories to use for price classes. See the discussion infra, note 74, of Calabresi’s observations about categorizing cars and drivers.
3
Guido Calabresi’s Failed Automobile Insurance Case
Working Essay 752 7/6/2006
versus individual cost-benefit analysis6 of mandates for investing in automobile safety devices cannot be meaningful because the aggregate benefit in savings to high-annual-risk Taneys is offset or even exceeded by the unnecessary extra cost to low-annual-risk Marshalls. As examples of the inherent indeterminacy of results, a mandate for the new style brake would appear to be marginally justified by cost-benefit analysis in a world consisting of one Taney and one Marshall (-$25+X from Table 1 above), but not justified in a world of one Taney and two Marshalls (+2X). Although forcing all those in Marshall’s situation to buy new brakes would reduce traffic accidents, the added cost of the new brakes would raise total costs. As Calabresi emphasizes throughout the book, reducing accidents and their costs cannot be the sole goal of accident law. Together with accident costs, the costs of safety devices and traffic control measures—e.g., driving more slowly has a cost—must be minimized (along with the costs of unspread losses and administration).
On the question of safety device mandates, Calabresi concludes that
[i]t will be expensive, if not impossible, to make collective decisions distinguishing the Taneys from the Marshalls. It will, in fact, be much easier if we let the distinction be made by Taney and Marshall themselves by letting them choose between paying for the accidents and paying for the new brakes.7
As Calabresi cautions, however, the case for individual choice depends critically on accurate assessment by automobile insurers of individual accident cost with and without the new brakes.
6. The cost-benefit framework of the book’s analysis was noted by Richard A.
Posner in his 1970 book review of THE COSTS OF ACCIDENTS, 37 U. CHI. L. REV. 636, 643, and repeated in his second review, Guido Calabresi’s THE COSTS OF ACCIDENTS: A Reassessment, 64 MD. L. REV. 12, 15 (2005). The connection of the Taney and Marshall examples to this framework is underscored by the second review’s singling out Chapter 5 containing these examples for its only unqualified present-tense albeit parenthetical praise.
The simplicity of Calabresi’s framework—a framework that, as I had suggested in my review, approximated cost-benefit analysis, though imperfectly—enabled law professors . . . to get their feet wet in the new field of law and economics. This was of enormous value. (The exposition of the basic economics of accident control, notably in Chapter 5 of The Costs of Accidents, is exemplary.)
Id. at 15. Posner’s special commendation of Chapter 5 makes it all the more puzzling that
after 35 years there still may be no scholarly engagement with the Chapter’s new-style-brakes examples as presented. But I invite correction because I have seen only 100 or so of the book’s 951 scholarly citations reported in Posner’s second review. Id. at 14.
7. THE COSTS OF ACCIDENTS at 74.
4
Guido Calabresi’s Failed Automobile Insurance Case
Working Essay 752 7/6/2006
The logic of the Taney and Marshall lesson apparently did not inform debates over a federal mandate for airbags, which was subsequently adopted. A source of controversy when airbags were optional was that cars equipped with airbags compared with the same model without them averaged more collision and personal injury claims per 100 vehicle-years.8 The effect on risk reduction of antilock brakes—which are still optional—as reflected by insurance claims is also confused. Industry studies comparing groups of otherwise identical cars with and without antilock brakes find no difference in the number of collision claims per 100 car years.9 Critics of government attempts to regulate vehicle safety are also skeptical about auto insurers’ capability of measuring differences in vehicle risk. For example, Mashaw and Harfst (1990) write: “The ‘market,’ after all, has its own inadequacies. Chief among them is the likelihood that rating automobiles on the basis of actual road experience will be too difficult, perhaps impossible, for insurance companies to implement.”10 This pessimistic view acknowledges insurers’ inability
8. Steven Peterson and George E. Hoffer, Auto Insurers and the Airbag:
Comment, 63 J. RISK & INS. 515 (1996). As explanations for higher numbers of collision and injury claims per 100 car years for airbag-equipped cars, the authors hypothesize that drivers of these cars either offset newly reduced risk of injury by behavioral changes (i.e., by driving more negligently), or that drivers already subject to more risk preferentially invest in airbags. Although offsetting behavioral changes probably have some effect, this Essay suggests at the end of Part II that car owners who invest in optional safety devices are apt to be already doing more driving, i.e., already producing more miles of risk annually. In this regard, Peterson and Hoffer caution at 516 that, in the insurance claim data they use, “nonvehicle factors—such as annual mileage . . . that may differ by vehicle line have not been accounted for necessarily.” (Emphasis added.) (Acknowledgements even as minimal as this that differences in annual mile averages could explain differences in insurance claims per 100 car years are rare in research literature on automobile risk and insurance, as considered further in Part III.A, infra.)
9. INS. INST. FOR HIGHWAY SAFETY, Q&A: Antilock Brakes (dated July 2005), http://www.iihs.org/safety_facts/qanda/antilock.htm. See also, Charles M. Farmer, New Evidence Concerning Fatal Crashes Of Passenger Vehicles Before And After Adding Antilock Braking Systems. 33 ACCIDENT ANALYSIS & PREVENTION 361 (2001).
10. E.g., JERRY L. MASHAW & DAVID L. HARFST in THE STRUGGLE FOR AUTO SAFETY (1990) at 242. Oddly, the reason the authors cite is not the absence of claim data on a vehicle-mile basis, but the unavailability of insurer claims experience for new models in time to affect new car buying decisions. Id. Nevertheless, just as a model’s fuel efficiency throughout its three-decade lifetime continues to affect buying and using decisions, what might be called a model’s “insurance efficiency” should also continue to affect the same two decisions.
Although Mashaw and Harfst explore (and reject) the idea that Congress might set a standard for each automobile manufacturer like the corporate average fuel efficiency standard which would require that their vehicles average less than some maximum fatal accident rate per 100 million miles (id at 233), they do not ask whether auto insurers might be able to measure a model’s claim risk at million-mile rates. In fact, this Essay argues that availability of cents-per-vehicle-mile insurance
5
Guido Calabresi’s Failed Automobile Insurance Case
Working Essay 752 7/6/2006
to supply cost-of-risk information to consumers about engaging in the risk-producing activity of driving a car.
However, in ways that the Taney and Marshall examples can help to show, the failure of auto insurance’s single cost measure (class average cost per vehicle-year) to evaluate the accident risk of individual cars within the class predictably leads to perverse economic incentives for the control of the costs of accidents.
II. MODEL SHOWING PERVERSE INCENTIVES
To see why traditional auto insurance has difficulty in evaluating safety devices, this Part first considers how the annual accident costs Calabresi assigns to Taney and Marshall might come about, and how these costs might be individually measured. Next we create a model world consisting entirely of Taney cars and Marshall cars. With a model composed of cars each of which has a defined and measurable accident cost, we apply to it the traditional insurance classification-only method of measuring an annual cost. Finally, we make investing in new style brakes an option for the Taneys and Marshalls to find out how their incentives and choices interact with the way that auto insurance would evaluate the new-brake and old-brake risk classes.
A. Measuring Individual Annual Risk
Taney's car has an odometer. When the odometer is not turning, his car is not exposed to accident risk and therefore the car is producing no part of his annual accident cost: $200 with the old brakes, $100 with the new brakes. If Taney's car were driven fewer miles per year after installation of the new brakes, then the part played by the brakes in reducing accident costs would be called into question. However, the change in Taney’s cost after installation of the new brakes only makes sense for the purpose of the example if it is specified—as Calabresi surely intended—that there is no change in how many miles his car is driven. Therefore, Taney's installation of new brakes reduces the cents-per-mile cost of his accidents—or "risk rate"—by 50 percent.
In Marshall’s case, the effect of the new brakes on his car’s risk rate per mile cannot be calculated from Calabresi’s description because the only accident cost he names is $25 per year with the old brakes. To get a plausible number for the new accident cost, the simplest assumption is that the brakes would cut the per-mile risk rate of Marshall’s car in half as they do for Taney’s car. Forcing Marshall to invest in new brakes, therefore, would reduce his accident cost to $12.50 per year. But adding this cost to the $50 for the brakes would prices is the sine-qua-non free-market means to inform individual decisions about buying new and used cars with safety-devices.
6
Guido Calabresi’s Failed Automobile Insurance Case
Working Essay 752 7/6/2006
bring the annual total to $62.50, which represents a net increase of $37.50 over the old $25 accident cost. Even though the new brakes might be assumed to cut Marshall’s risk per mile more than the 50% reduction Taney gains, it cannot be as much as 100% to cut accident cost to zero—the amount Calabresi’s $25 net increase requires. Driving a car even one mile without risk of accident and adding this risk to the annual cost of risk is just as impossible as driving it a mile without using gasoline and adding its cost to the annual cost of fuel. For the same reason, every mile an insured car is driven transfers a statistical but real cost to the car’s insurer.
Accurate conceptualization of the annual risk produced by individual cars depends on seeing practical ways to evaluate two variables: a cents-per-mile rate (the risk rate variable) and number of miles driven (the exposure variable).11 The exposure variable is already measured for Taney’s and Marshall’s cars because federal and state law backed by civil and criminal penalties requires that each mile a car is driven is permanently recorded on its odometer. Therefore miles traveled can be objectively verified.12 Values for this
11. The actuarial term of art is “exposure unit” or exposure base or medium. It
represents the unit of risk transfer and therefore the unit by which prepaid premium is earned by insurers in providing coverage. Currently prepaid premium for private passenger automobile insurance is earned by the car-day exposure unit, but premium for some commercial fleets is earned by the vehicle-mile exposure unit as registered on odometers. For a review, see Paul Dorweiler Notes on Exposure and Premium Bases, 16 PROC. CASUALTY ACTUARIAL SOC’Y 319 (1929). (Reprinted 58 PROC. CASUALTY ACTUARIAL SOC’Y 59 (1971)). Dorweiler writes: "The mileage exposure medium is superior to the car-year medium in yielding an exposure that varies with the hazard, as it responds more to the actual usage of the car," at 338. Note that Dorweiler's phrase "responds more" obscures the fact that the car-year medium does not respond at all to the actual use of the car.
12. An efficient per-mile insurance system would require odometer audits no more than once a year (mainly for totaling the miles driven by all of the cars in a pool during a time period in order to convert the total cost of the pool’s claims incurred during the period to a cents-per-mile basis) and in verifying coverage for claim settlement. Car owners would purchase miles of insurance in advance at the going cents-per-mile rate for the car’s class and driving coverages in amounts to suit individual needs and budgets. The miles purchased would be added to the odometer reading and recorded, along with the policy period, on the car’s insurance ID card. The owner would be responsible for buying more miles before the odometer limit was reached and coverage lapsed. (Exceeding the odometer limit and odometer tampering are standard coverage termination provisions in mechanical breakdown insurance contracts.) Comparisons of transaction efficiency, fraud control, and mandatory insurance enforcement with the current car-year system are contained in two reports: Patrick Butler, Operation of an Audited-Mile/Year Automobile Insurance System Under Pennsylvania Law, 1993 CASUALTY ACTUARIAL SOC’Y FORUM 307, www.casact.org/pubs/forum/93sforum/93sf307.pdf; and Patrick Butler, Why The Standard Automobile Insurance Market Breaks Down In Low-Income Zip Codes: A Per-Mile Analysis. (Unpublished report to The Texas Legislature by Texas NOW, August, 2000) at 30-35 (http://www.centspermilenow.org/633b-4522.pdf).
7
Guido Calabresi’s Failed Automobile Insurance Case
Working Essay 752 7/6/2006
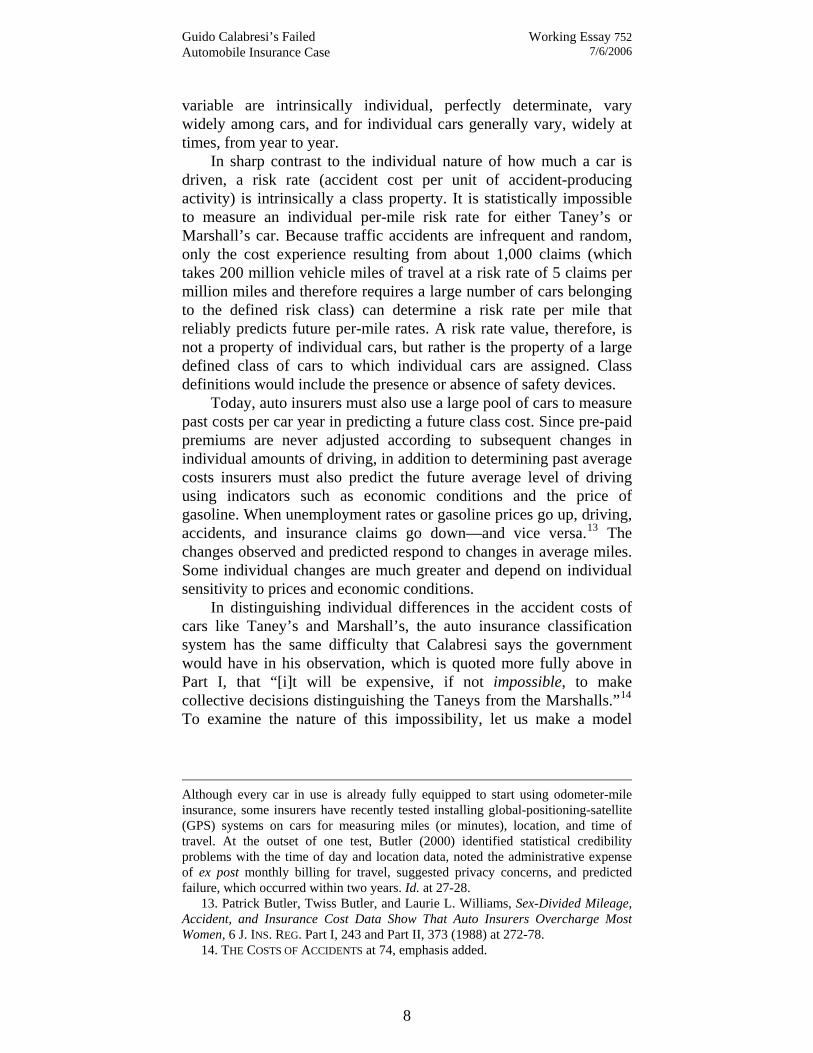
variable are intrinsically individual, perfectly determinate, vary widely among cars, and for individual cars generally vary, widely at times, from year to year.
In sharp contrast to the individual nature of how much a car is driven, a risk rate (accident cost per unit of accident-producing activity) is intrinsically a class property. It is statistically impossible to measure an individual per-mile risk rate for either Taney’s or Marshall’s car. Because traffic accidents are infrequent and random, only the cost experience resulting from about 1,000 claims (which takes 200 million vehicle miles of travel at a risk rate of 5 claims per million miles and therefore requires a large number of cars belonging to the defined risk class) can determine a risk rate per mile that reliably predicts future per-mile rates. A risk rate value, therefore, is not a property of individual cars, but rather is the property of a large defined class of cars to which individual cars are assigned. Class definitions would include the presence or absence of safety devices.
Today, auto insurers must also use a large pool of cars to measure past costs per car year in predicting a future class cost. Since pre-paid premiums are never adjusted according to subsequent changes in individual amounts of driving, in addition to determining past average costs insurers must also predict the future average level of driving using indicators such as economic conditions and the price of gasoline. When unemployment rates or gasoline prices go up, driving, accidents, and insurance claims go down—and vice versa.13 The changes observed and predicted respond to changes in average miles. Some individual changes are much greater and depend on individual sensitivity to prices and economic conditions.
In distinguishing individual differences in the accident costs of cars like Taney’s and Marshall’s, the auto insurance classification system has the same difficulty that Calabresi says the government would have in his observation, which is quoted more fully above in Part I, that “[i]t will be expensive, if not impossible, to make collective decisions distinguishing the Taneys from the Marshalls.”14 To examine the nature of this impossibility, let us make a model
Although every car in use is already fully equipped to start using odometer-mile insurance, some insurers have recently tested installing global-positioning-satellite (GPS) systems on cars for measuring miles (or minutes), location, and time of travel. At the outset of one test, Butler (2000) identified statistical credibility problems with the time of day and location data, noted the administrative expense of ex post monthly billing for travel, suggested privacy concerns, and predicted failure, which occurred within two years. Id. at 27-28.
13. Patrick Butler, Twiss Butler, and Laurie L. Williams, Sex-Divided Mileage, Accident, and Insurance Cost Data Show That Auto Insurers Overcharge Most Women, 6 J. INS. REG. Part I, 243 and Part II, 373 (1988) at 272-78.
14. THE COSTS OF ACCIDENTS at 74, emphasis added.
8
Guido Calabresi’s Failed Automobile Insurance Case
Working Essay 752 7/6/2006
consisting entirely of large numbers of Taneys and Marshalls,15 whose cars are insured under actual classification procedures and fixed pre-paid, time-period premiums.
B. Model Definition
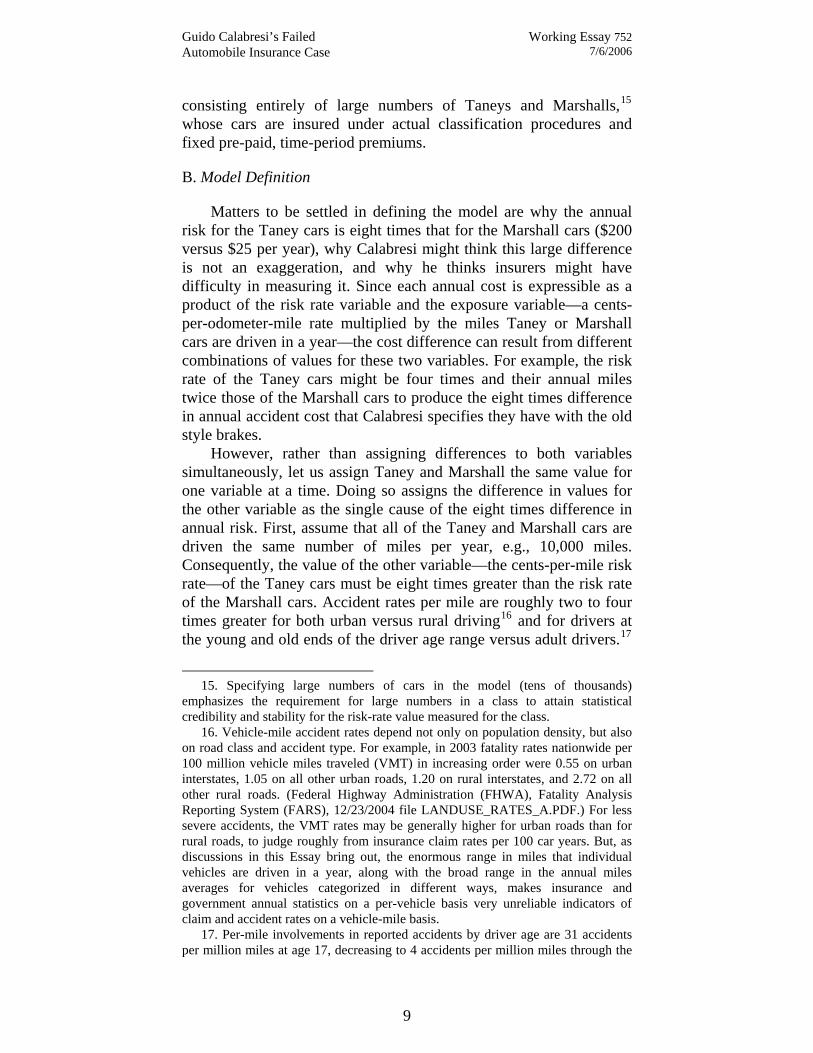
Matters to be settled in defining the model are why the annual risk for the Taney cars is eight times that for the Marshall cars ($200 versus $25 per year), why Calabresi might think this large difference is not an exaggeration, and why he thinks insurers might have difficulty in measuring it. Since each annual cost is expressible as a product of the risk rate variable and the exposure variable—a cents-per-odometer-mile rate multiplied by the miles Taney or Marshall cars are driven in a year—the cost difference can result from different combinations of values for these two variables. For example, the risk rate of the Taney cars might be four times and their annual miles twice those of the Marshall cars to produce the eight times difference in annual accident cost that Calabresi specifies they have with the old style brakes.
However, rather than assigning differences to both variables simultaneously, let us assign Taney and Marshall the same value for one variable at a time. Doing so assigns the difference in values for the other variable as the single cause of the eight times difference in annual risk. First, assume that all of the Taney and Marshall cars are driven the same number of miles per year, e.g., 10,000 miles. Consequently, the value of the other variable—the cents-per-mile risk rate—of the Taney cars must be eight times greater than the risk rate of the Marshall cars. Accident rates per mile are roughly two to four times greater for both urban versus rural driving16 and for drivers at the young and old ends of the driver age range versus adult drivers.17
15. Specifying large numbers of cars in the model (tens of thousands)
emphasizes the requirement for large numbers in a class to attain statistical credibility and stability for the risk-rate value measured for the class.
16. Vehicle-mile accident rates depend not only on population density, but also on road class and accident type. For example, in 2003 fatality rates nationwide per 100 million vehicle miles traveled (VMT) in increasing order were 0.55 on urban interstates, 1.05 on all other urban roads, 1.20 on rural interstates, and 2.72 on all other rural roads. (Federal Highway Administration (FHWA), Fatality Analysis Reporting System (FARS), 12/23/2004 file LANDUSE_RATES_A.PDF.) For less severe accidents, the VMT rates may be generally higher for urban roads than for rural roads, to judge roughly from insurance claim rates per 100 car years. But, as discussions in this Essay bring out, the enormous range in miles that individual vehicles are driven in a year, along with the broad range in the annual miles averages for vehicles categorized in different ways, makes insurance and government annual statistics on a per-vehicle basis very unreliable indicators of claim and accident rates on a vehicle-mile basis.
17. Per-mile involvements in reported accidents by driver age are 31 accidents per million miles at age 17, decreasing to 4 accidents per million miles through the
9
Guido Calabresi’s Failed Automobile Insurance Case
Working Essay 752 7/6/2006
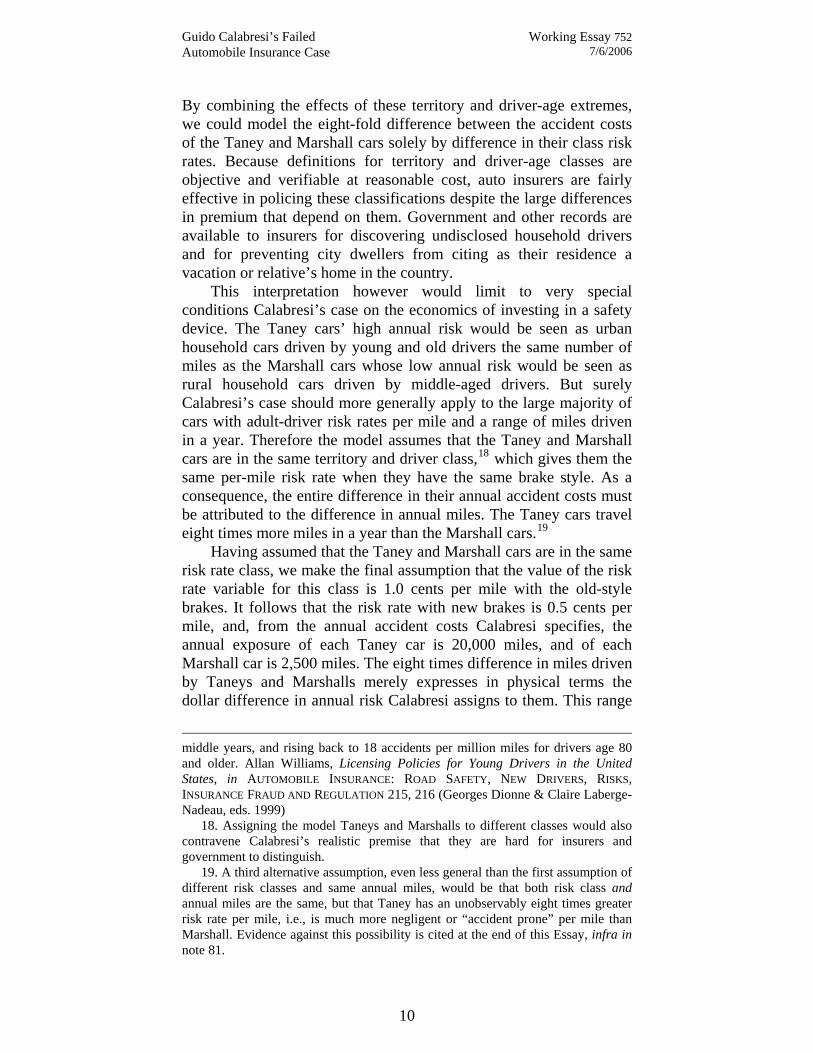
By combining the effects of these territory and driver-age extremes, we could model the eight-fold difference between the accident costs of the Taney and Marshall cars solely by difference in their class risk rates. Because definitions for territory and driver-age classes are objective and verifiable at reasonable cost, auto insurers are fairly effective in policing these classifications despite the large differences in premium that depend on them. Government and other records are available to insurers for discovering undisclosed household drivers and for preventing city dwellers from citing as their residence a vacation or relative’s home in the country.
This interpretation however would limit to very special conditions Calabresi’s case on the economics of investing in a safety device. The Taney cars’ high annual risk would be seen as urban household cars driven by young and old drivers the same number of miles as the Marshall cars whose low annual risk would be seen as rural household cars driven by middle-aged drivers. But surely Calabresi’s case should more generally apply to the large majority of cars with adult-driver risk rates per mile and a range of miles driven in a year. Therefore the model assumes that the Taney and Marshall cars are in the same territory and driver class,18 which gives them the same per-mile risk rate when they have the same brake style. As a consequence, the entire difference in their annual accident costs must be attributed to the difference in annual miles. The Taney cars travel eight times more miles in a year than the Marshall cars.19
Having assumed that the Taney and Marshall cars are in the same risk rate class, we make the final assumption that the value of the risk rate variable for this class is 1.0 cents per mile with the old-style brakes. It follows that the risk rate with new brakes is 0.5 cents per mile, and, from the annual accident costs Calabresi specifies, the annual exposure of each Taney car is 20,000 miles, and of each Marshall car is 2,500 miles. The eight times difference in miles driven by Taneys and Marshalls merely expresses in physical terms the dollar difference in annual risk Calabresi assigns to them. This range
middle years, and rising back to 18 accidents per million miles for drivers age 80 and older. Allan Williams, Licensing Policies for Young Drivers in the United States, in AUTOMOBILE INSURANCE: ROAD SAFETY, NEW DRIVERS, RISKS, INSURANCE FRAUD AND REGULATION 215, 216 (Georges Dionne & Claire Laberge-Nadeau, eds. 1999)
18. Assigning the model Taneys and Marshalls to different classes would also contravene Calabresi’s realistic premise that they are hard for insurers and government to distinguish.
19. A third alternative assumption, even less general than the first assumption of different risk classes and same annual miles, would be that both risk class and annual miles are the same, but that Taney has an unobservably eight times greater risk rate per mile, i.e., is much more negligent or “accident prone” per mile than Marshall. Evidence against this possibility is cited at the end of this Essay, infra in note 81.
10
Guido Calabresi’s Failed Automobile Insurance Case
Working Essay 752 7/6/2006
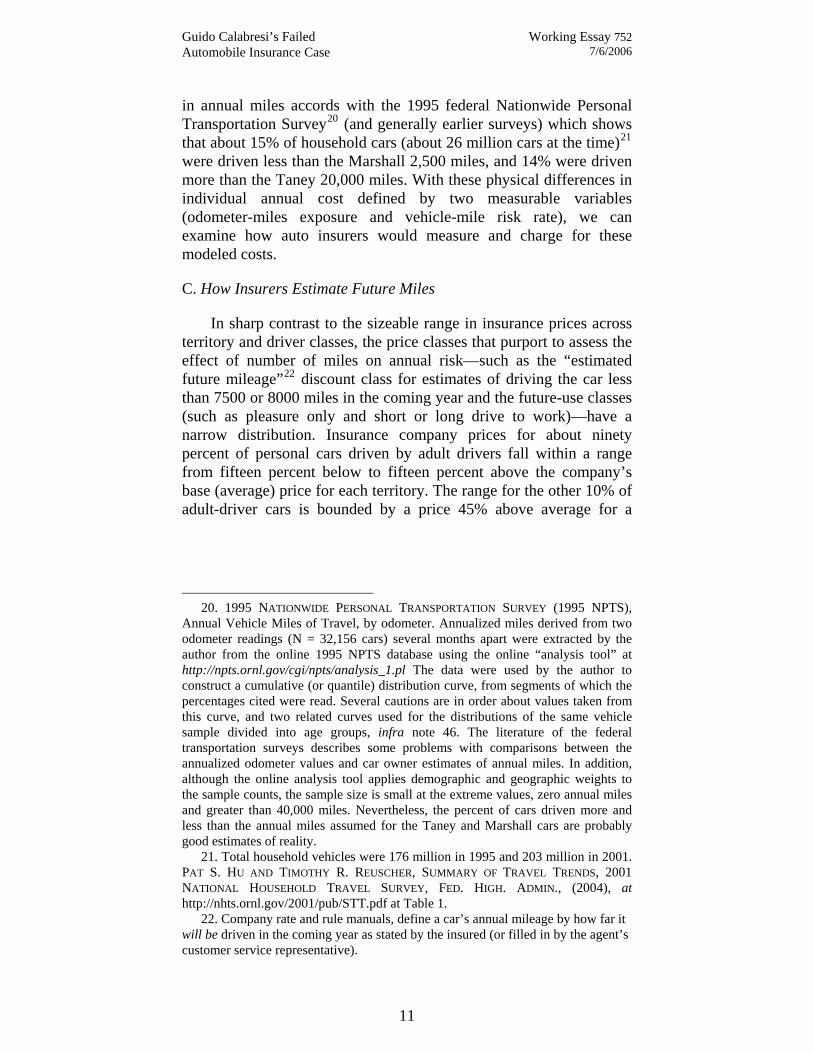
in annual miles accords with the 1995 federal Nationwide Personal Transportation Survey20 (and generally earlier surveys) which shows that about 15% of household cars (about 26 million cars at the time)21 were driven less than the Marshall 2,500 miles, and 14% were driven more than the Taney 20,000 miles. With these physical differences in individual annual cost defined by two measurable variables (odometer-miles exposure and vehicle-mile risk rate), we can examine how auto insurers would measure and charge for these modeled costs.
C. How Insurers Estimate Future Miles
In sharp contrast to the sizeable range in insurance prices across territory and driver classes, the price classes that purport to assess the effect of number of miles on annual risk—such as the “estimated future mileage”22 discount class for estimates of driving the car less than 7500 or 8000 miles in the coming year and the future-use classes (such as pleasure only and short or long drive to work)—have a narrow distribution. Insurance company prices for about ninety percent of personal cars driven by adult drivers fall within a range from fifteen percent below to fifteen percent above the company’s base (average) price for each territory. The range for the other 10% of adult-driver cars is bounded by a price 45% above average for a
20. 1995 NATIONWIDE PERSONAL TRANSPORTATION SURVEY (1995 NPTS),
Annual Vehicle Miles of Travel, by odometer. Annualized miles derived from two odometer readings (N = 32,156 cars) several months apart were extracted by the author from the online 1995 NPTS database using the online “analysis tool” at http://npts.ornl.gov/cgi/npts/analysis_1.pl The data were used by the author to construct a cumulative (or quantile) distribution curve, from segments of which the percentages cited were read. Several cautions are in order about values taken from this curve, and two related curves used for the distributions of the same vehicle sample divided into age groups, infra note 46. The literature of the federal transportation surveys describes some problems with comparisons between the annualized odometer values and car owner estimates of annual miles. In addition, although the online analysis tool applies demographic and geographic weights to the sample counts, the sample size is small at the extreme values, zero annual miles and greater than 40,000 miles. Nevertheless, the percent of cars driven more and less than the annual miles assumed for the Taney and Marshall cars are probably good estimates of reality.
21. Total household vehicles were 176 million in 1995 and 203 million in 2001. PAT S. HU AND TIMOTHY R. REUSCHER, SUMMARY OF TRAVEL TRENDS, 2001 NATIONAL HOUSEHOLD TRAVEL SURVEY, FED. HIGH. ADMIN., (2004), at http://nhts.ornl.gov/2001/pub/STT.pdf at Table 1.
22. Company rate and rule manuals, define a car’s annual mileage by how far it will be driven in the coming year as stated by the insured (or filled in by the agent’s customer service representative).
11
Guido Calabresi’s Failed Automobile Insurance Case
Working Essay 752 7/6/2006
single business-use car and 40% below average for multiple farm-use cars on one policy.23
Auto insurers enforce the low-future-mileage discount largely by bluff. They may request odometer readings on application and renewal forms, and allow car owners to assume mistakenly that miles already driven affect a future premium amount and that the odometer is subject to audit. At the end of the policy year, insurers make no premium adjustment regardless of how many or few miles a car actually was driven.24 If a recession causes overall driving and claim levels to drop, some insurers credit renewal premiums (on a state by state basis) with a fixed percent—usually 5% to 20%—of the previous semiannual premium paid. The company however makes no attempt to determine which cars were actually driven less and which were not.25 Insurers affirm to regulators that any discount larger than a token amount makes it even harder for companies to control the awarding of discounts by agents as sales inducement and customer retention tools.26 Because these discounts are divorced from odometer
23. The Adult-class (overwhelmingly unisex) distributions for five major insurers representing half the Pennsylvania private passenger cars are presented in Butler et al., supra note 13 at 375, 379-80. Distributions of cars in insurance company “class plans” are normally considered proprietary and not available outside of the company. In the mid-1980s, however, in response to a Pennsylvania Insurance Department order to assess the effects of changing from about 75% unisex rating of cars to 100%, companies made their current class-plan populations available to the department (and public). (Class Plans are company or rate bureau rules for classifying cars by driver age and sex, car use, etc. In principle the relative cost experience of each class supplies a multiplier to adjust the base premium of each rating territory. In practice class relativities are altered, i.e., “tempered,” to meet regulatory restrictions and to serve marketing plans.)
24. When an insurer gets information that requires reclassification of a car, the new rate, whether an increase or decrease from the old rate, only applies to premium prepaid and earned from that day forward. No retrospective charges or credits are made. Presumably this applies even when a new young driver is not disclosed for months and, as a consequence, the insurer misses collecting hundreds of dollars in premium for coverage already provided. On the other hand, if a car is idled for months because it is inoperative or its driver is ill, standard practice is to make no refund after the fact. This second situation would not occur with cents-per-mile premiums because the insurer would only earn premium for driving coverages as the car’s odometer turns.
25. Actually, varying the percent refunds among policyholders in some states is a prohibited distinction or discrimination. E.g., Tex Ins. Code of 1951, Ch. 5, Arts. 5.08, 5.09. Special refunds to military sent overseas are excepted, id.
26. These and similar observations are documented by Butler et al., supra note 13, which is based on stipulated plaintiffs’ exhibits and trial testimony by seven actuarial and one economics experts for five defendant companies in the lawsuit before the Pennsylvania Insurance Department in 1986-87, Pennsylvania NOW v. State Farm, Docket No. R86-9-6 (alleging in the main violation of the state Casualty & Surety Rate Regulatory Act and the state Equal Rights Amendment, ERA, by refusal to use the odometer-mile exposure unit resulting in targeting and overcharging six NOW members and women as a class), and appeal (Reproduced Record, Commonwealth Court of Pennsylvania, No. 1276 C.D. 1987 & No. 376
12
Guido Calabresi’s Failed Automobile Insurance Case
Working Essay 752 7/6/2006
miles actually driven, there is little loss in rigor and considerable gain in reality by assuming that insurers—as Calabresi suggests—are not able to distinguish Taneys and Marshalls from each other. In the model, therefore, the high-annual-miles Taney cars and low-annual-miles Marshall cars are assumed to be indistinguishable by insurers and so are charged the same class price.
D. How Insurers Measure Car Safety
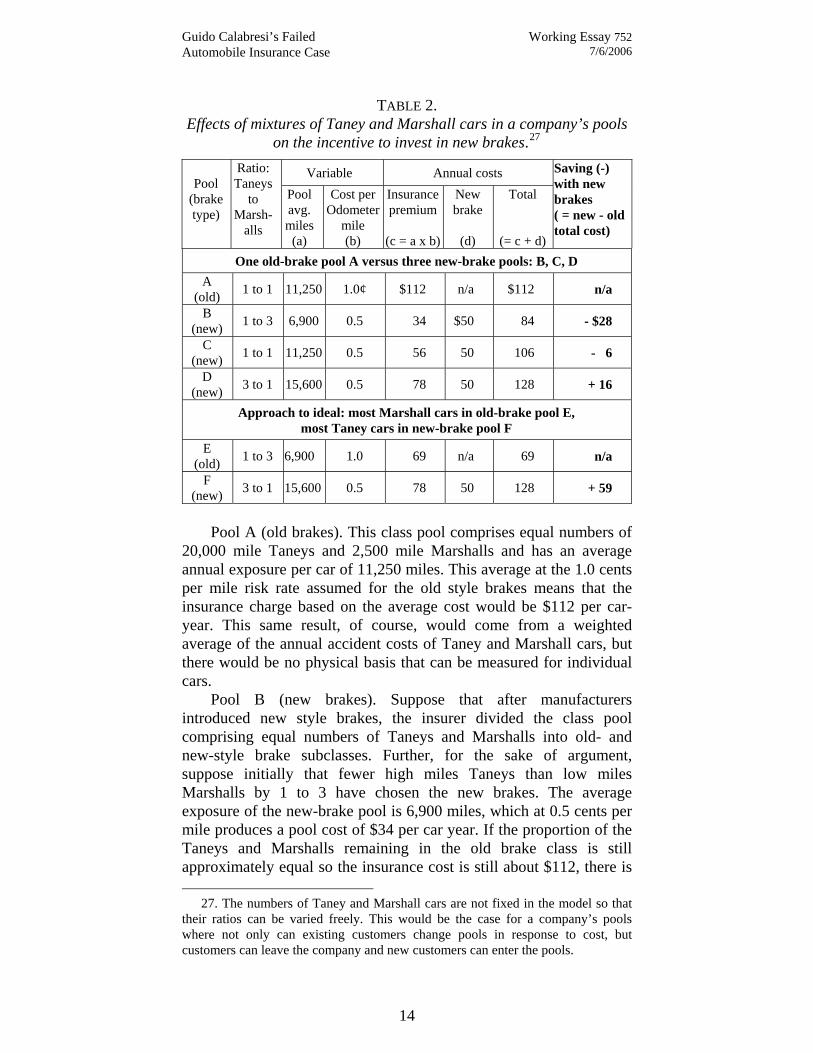
In our model world composed entirely of Taney and Marshall cars—in large numbers for statistical credibility—the cost per car year insurance companies would measure depends on two risk pool variables: brake type and the average odometer miles per year. The pool’s average miles in turn depends critically on its ratio of Taney to Marshall cars. Table 2 shows the effects on the annual cost per car for a number of hypothetical pools of one company. (Each pool is keyed by a letter to the paragraphs discussing it.)
C.D. 1988, on file with author) Pa. Nat. Org. for Women v. Ins. Dept., 551 A2d. 1162 (Pa. Cmwlth. 1988) (aff’d Insurance Commissioner’s adjudication denying the allegations).
The Commonwealth Court’s opinion cites an issue which was not introduced by any party at trial—plaintiffs or defendants—and was first raised in the Insurance Commissioner’s adjudication. The Court states “we agree with the Commissioner that, by providing for certain discounts in their merit factor rating, the intervenor insurance companies have given all the consideration that is due to mileage as a factor” (id. at 1166, emphasis added). Plaintiffs did not raise the merit-factor-rating issue at trial for the reasons of its minor effect (5%-7% maximum real discount) on the claim-free cars in a pool paid for by large (50%-150%) increases on the few cars in the pool whose claims are simply an inevitable random statistical realization of the total risk produced mile by mile by all of the cars in the pool. The discount and surcharge sizes are simply the mechanical effect of cars adding different numbers of miles to the pools while claims are counted on a car-year basis. See Patrick Butler & Twiss Butler, Driver Record: A Political Red Herring That Reveals the Basic Flaw in Automobile Insurance Pricing, 8 J. INS. REG. 200 (1989).
13
Guido Calabresi’s Failed Automobile Insurance Case
Working Essay 752 7/6/2006
TABLE 2. Effects of mixtures of Taney and Marshall cars in a company’s pools
on the incentive to invest in new brakes.27
Variable Annual costs Pool
(brake type)
Ratio: Taneys
to Marsh-
alls
Pool avg. miles
(a)
Cost per Odometer
mile (b)
Insurance premium
(c = a x b)
New brake
(d)
Total
(= c + d)
Saving (-) with new brakes ( = new - old total cost)
One old-brake pool A versus three new-brake pools: B, C, D A
(old) 1 to 1 11,250 1.0¢ $112 n/a $112 n/a
B (new) 1 to 3 6,900 0.5 34 $50 84 - $28
C (new) 1 to 1 11,250 0.5 56 50 106 - 6
D (new) 3 to 1 15,600 0.5 78 50 128 + 16
Approach to ideal: most Marshall cars in old-brake pool E, most Taney cars in new-brake pool F
E (old) 1 to 3 6,900 1.0 69 n/a 69 n/a
F (new) 3 to 1 15,600 0.5 78 50 128 + 59
Pool A (old brakes). This class pool comprises equal numbers of
20,000 mile Taneys and 2,500 mile Marshalls and has an average annual exposure per car of 11,250 miles. This average at the 1.0 cents per mile risk rate assumed for the old style brakes means that the insurance charge based on the average cost would be $112 per car-year. This same result, of course, would come from a weighted average of the annual accident costs of Taney and Marshall cars, but there would be no physical basis that can be measured for individual cars.
Pool B (new brakes). Suppose that after manufacturers introduced new style brakes, the insurer divided the class pool comprising equal numbers of Taneys and Marshalls into old- and new-style brake subclasses. Further, for the sake of argument, suppose initially that fewer high miles Taneys than low miles Marshalls by 1 to 3 have chosen the new brakes. The average exposure of the new-brake pool is 6,900 miles, which at 0.5 cents per mile produces a pool cost of $34 per car year. If the proportion of the Taneys and Marshalls remaining in the old brake class is still approximately equal so the insurance cost is still about $112, there is
27. The numbers of Taney and Marshall cars are not fixed in the model so that their ratios can be varied freely. This would be the case for a company’s pools where not only can existing customers change pools in response to cost, but customers can leave the company and new customers can enter the pools.
14
Guido Calabresi’s Failed Automobile Insurance Case
Working Essay 752 7/6/2006
an insurance savings of $78 per year or, with the $50 annual cost of the brakes themselves, a net financial incentive to buy the new brakes of $28. Of course this incentive for investing in the new style brakes would appeal to Taney car owners as well as to Marshall car owners.
Pool C (new brakes). But if initially equal numbers (1 to 1 ratio) of Taneys and Marshalls had invested in the new brakes, the new-brake subclass insurance cost would be $56 per car year (0.5 cents per mile times the class average 11,250 miles). For Taney and Marshall cars still with old brakes and paying $112 insurance per year, the financial incentive to install new brakes would be an insurance saving of $56 offset by $50 for the brakes resulting in a net saving of $6 per year. Obviously, as the proportion of Taney to Marshall cars increases in the new brake subclass, the incentive to invest in new brakes decreases.
Pool D (new brakes). Recall, however, that Calabresi’s economically desirable choice is that more (or all) Taneys buy the new brakes and fewer Marshalls (or none) buy them. Assume that an approach to the optimal selection occurs and that the ratio of cars in the new brake class pool becomes 3 Taneys to 1 Marshall. Then the average annual exposure of the class pool becomes 15,600 miles per car and the accident cost at 0.5 cents per mile is $78. Adding the $50 cost of the brakes brings the total cost to $128, or, compared with the $112 per year paid by Taneys and Marshalls in the old brake class, a net $16 disincentive for installing the new brakes.
Pool E (old brakes) versus Pool F (new brakes). Moreover, as if this $16 disincentive to the economically desirable choice of new brakes for Taney car owners were not discouraging enough, consider what happens to the composition of the old brake class pool and its $112 price as more Taneys than Marshalls continue to buy the new brakes and leave the old brake class. Assume that as the Taney cars come to predominate over Marshall cars by 3 to 1 in the new brake class (which shows an insurance cost of $78 per car as in the previous paragraph), concurrently the Marshall cars come to predominate over the Taney cars by 3 to 1 in the old brake class. Thereby the average exposure of the old brake class pool drops from 11,200 miles to 6,900 miles per car. With this decrease in average miles for the old brakes subclass, even at 1.0 cents per mile, the cost the insurer measures for the subclass decreases from $112 to $69 per car year. Then the $9 increase in annual insurance cost from $69 to $78 on installation of the new brakes makes them seem to be a failure at reducing risk. Adding the annual cost of the new brakes brings the total disincentive to buying them to $59 per year. The more nearly Calabresi’s efficient solution of all Taneys and no Marshalls installing the new brakes is approached, the larger the financial penalty for buying them becomes.
Although Taneys and Marshalls have the same financial incentives or disincentives to buy new brakes, we can predict whether
15
Guido Calabresi’s Failed Automobile Insurance Case
Working Essay 752 7/6/2006
cars driven high annual miles or low annual miles will predominate in the new brake class by taking note of economic conditions involved in owning and operating a car. In the model, the specified difference between Taney and Marshall cars is a difference in annual miles of risk production. Even though this results in little or no difference in premiums, each year Taneys must spend about eight times more than Marshalls on gasoline and maintenance. Miles of travel and car value are usually normal goods: the quantities individuals demand rise with income.28 When expensive safety devices are optional, the buyers of cars who take the option (like Taneys) would also tend to drive more than those car buyers (like Marshalls) who do not take the option. Therefore, when costs are compared between classes on a car year basis, as insurers do, the effect of the device on reducing the per-mile risk rate will be offset or even overwhelmed by the greater miles of risk transferred to insurers, albeit at a lower cents-per-mile rate, by the cars in the safety device sub-class.
Before leaving Table 2, it is worth noting that charging for insurance as a cost of car owning has the effect of degrading sharp differences in annual risk produced by individual cars. The range in actual annual risk as defined by the model from $12.50 for Marshall’s miles with new brakes to $200 for Taney’s miles with the old brakes is 16 times. But it is only about three times with the mixtures of Taney and Marshall cars in the pools, from $34 to $112 annual premium. The extreme flattening of differences by the current classification-only system obviously stems from disregarding the differences in miles of risk that individual cars, identically classified, produce in a year.
III. MENTAL BARRIERS TO EVALUATING INDIVIDUAL RISK
Although insurers’ assumed failure to distinguish Marshall cars from Taney cars in the model leads to higher social costs, the benefits to the Taneys compared to their actual insurance cost of $200 or $100 clearly show in Table 2 (page 14 above). In each pool, the cost of the insurance subsidy to Taney cars is paid by the excess of the pool’s premium over the actual Marshall insurance cost of $25 or $12.50 per car year. By failing to distinguish them, insurers favor the Taney type of customers whose cars produce relatively large amounts of accident risk annually over the Marshall type of customers whose cars produce relatively small amounts of accident risk annually. Over the years the same kind of favoritism has been exhibited by insurers in decisions
28. With rising income, miles of long distance travel by car can become an
inferior good to air travel. Similarly, access to more expensive housing, for example in inner suburbs, can reduce miles of commuting by car. But demand for cars and car value seems less likely to decrease with rising income.
16
Guido Calabresi’s Failed Automobile Insurance Case
Working Essay 752 7/6/2006
about which cost-correlated categories to use for pricing, and which not to use.
A. Explanations for Pricing Decisions
Usual explanations for auto insurers’ choices of pricing categories identify two forces, theoretically opposed, to which insurers are subject. One is price competition which presumably compels insurers to classify and price separately each category of cars that shows a marked difference in average annual cost,29 and the other is price regulation which impedes use of some these categories.30 As a number of examples make clear, however, in deciding which correlations can be used in pricing and which must not be used—and not discussed—insurers, legislators, and regulators all tend in the long run to respond alike to the same consumer constituencies.
Currently, the question of insurers not-using potential pricing categories despite cost differences is an issue with sport utility vehicles (SUVs). In a law and economics study of the effects on risk of the increasing proportion of SUVs and pickup trucks on the road, Michelle White notes the failure of liability insurers to charge for the greater risk in an accident of injury and death that these vehicles impose on occupants of cars than cars impose on occupants of SUVs and pickup trucks.31 Although as reasons for lack of cost pressure by liability insurance against owning SUVs and pickup trucks, White cites no-fault insurance, no mandatory liability insurance, and low mandatory liability insurance limits,32 she also cites reporter Keith Bradsher’s book criticizing SUVs,33 which (in White’s words)
29. E.g., J. David Cummins, Property-Liability Insurance Price Deregulation: The Last Bastion?, in DEREGULATING PROPERTY-LIABILITY INSURANCE (J. David Cummins, ed. 2001) 1, 9 describes how competition induces insurers to use more price categories.
[I]n the 1950s . . . independent insurers such as State Farm and Allstate began more aggressive price competition. These companies used . . . more refined classification systems than the bureau firms, enabling them to ‘skim the cream’ by capturing drivers with the most desirable underwriting characteristics, who were overpriced at bureau rates.
This description implies that price competition keeps insurers from disregarding sub-categories of customers who are overpriced.
30. E.g., Posner in his second review, supra note 6, at 23 criticizes Calabresi on this point because he “fails to consider the degree to which government regulation of liability insurance impedes efforts by insurers to base liability insurance premiums on risk-related factors.”
31. Michelle J. White in The ‘Arms Race’ on American Roads: The Effect of Sport Utility Vehicles and Pickup Trucks on Traffic Safety, 47 J.L. & ECON. 333, 351-52 (2004).
32. Id. 33. KEITH BRADSHER, HIGH AND MIGHTY: SUVS—THE WORLD’S MOST
DANGEROUS VEHICLES AND HOW THEY GOT THAT WAY, ch. 10 (2002).
17
Guido Calabresi’s Failed Automobile Insurance Case
Working Essay 752 7/6/2006
“argues that insurance companies are loath to raise rates on SUV owners because they are more affluent and politically well connected than owners of cars.”34
Although disregard for the above-average cost of liability claims incurred by SUVs is now being given press attention, such attention has yet to be given to decades of disregarding the above-average number of liability claims produced by newer cars. According to the description in Daniel McNamara’s insurance textbook chapter,35 in the early 1960s, prompted by insurers’ belief that drivers of older cars are more negligent than average,36 the industry studied the correlation of annual claims with car age. However, the study found just the opposite relationship to insurers’ belief. Newer cars in fact produce more liability claims per 100 car years than older cars do.37 In response to this finding, however, insurers did not increase liability prices for newer cars as they certainly had planned to do for older cars, but decided instead to disregard the results.38 The long-term
34. White, supra note 31, at 352 n.34. The most telling support for Bradsher’s argument is not in his book, but what insurers say in Keith Bradsher Backlash on Insurance: Sport Utility Fans Resist Higher Rates, N.Y. TIMES, March 15, 1998, at 10Bu.
Since the first reports five months ago of the industry's intentions [to raise liability rates for SUVs], sport utility owners have bombarded insurers with letters, denounced them on Internet message boards and castigated them on talk radio shows. Conversely, drivers of cars and mini-vans who would benefit from lower liability rates have said little.
The outcry has left insurers reluctant to make quick changes to their auto liability rates. ''If there is some political will to do this then we might change our minds, but right now our folks are running scared,'' said an official at a large insurer who spoke on the condition of anonymity.
To judge from subsequent trade and other press reports, adjustments by vehicle type for both liability and personal injury protection (PIP) coverages have been spotty with small net changes to total premium. The minimal effect of vehicle type on premiums is confirmed by the 2005 State Farm manual for New Jersey (effective Feb. 1, 2005). (CD-pdf copy on file with author.)
35. Daniel J. McNamara, Discrimination in Property-Liability Insurance Pricing, in ISSUES IN INSURANCE 1, 47 (Everett D. Randall ed., 4th Ed. 1987). The chapter by McNamara is in a Chartered Property-Casualty Underwriter (CPCU) textbook. He writes with authority as an industry leader, lawyer, actuary, and former president of both the Casualty Actuarial Society and the American Academy of Actuaries, and, at the time of writing, was employed as president of the industry rating bureau (Insurance Services Office) successor to the bureau that did the study he describes.
36. That this erroneous belief is not so unspeakable as to be distracting is shown by Calabresi’s use of it as a hypothetical fact: “[W]hen costs are put on cars . . . most of the burden ends up on cars more than ten years old, with the result that they are almost priced out of the market and accident costs are reduced drastically . . . .” THE COSTS OF ACCIDENTS at 154.
37. McNamara, supra note 35, at 47. 38. Id. The interpretation here of the textbook description is based on this
sentence: “[A] 1963-1964 study . . . showed, contrary to the prevailing belief at
18
Guido Calabresi’s Failed Automobile Insurance Case
Working Essay 752 7/6/2006
shifting of the above-average liability costs of new cars onto old cars lends historical support to Bradsher’s argument39 that insurers are influenced by the economic and political strength40 of the owners of newer cars versus owners of older cars.
McNamara gives two reasons for disregarding insurance correlations. One, which can only refer to the interests of more influential customers, is that “the use of statistics should be leavened with a liberal dose of common sense.”41 McNamara’s other reason applies specifically to disregarding the greater number of liability claims produced by newer cars. He explains that “[t]his fact was not reflected in the rating system because no reasonable relationship between the age of the automobiles and the likelihood of an accident
that time, that newer automobiles had a higher frequency [i.e., number per 100 insured car years] of accidents leading to liability claims than the frequency associated with older automobiles.” Id. (emphasis added). The special study was necessary because car age never has been a price category for liability insurance so that liability claim statistics are not routinely categorized by car age. Since such a special study involves substantial cost, insurers would not have undertaken it without expecting to act on their belief. Had the belief proven to be true, insurers certainly would have categorized liability claims by car age, with the intent of lowering prices below average for new cars and raising them above average for old cars.
39. Bradsher, supra note 34 and accompanying text. 40. E.g., the political strength of constituents who regularly rent cars (and also
generally drive newer cars) is demonstrated by the Minnesota legislature’s mandate that starting in 1989 insurers must pay under property damage liability coverage (PDL, which usually has no deductible) for any “liability” to the rental company for damage that Minnesota policyholders do to cars they have rented in any state. (For residents of all states—as an accommodation to policyholders who rent cars—insurers usually cover damage, less deductible, renters do to the cars they rent under the collision and comprehensive coverages on cars in the renter’s household.) The contracts that car rental companies use in Minnesota must state: “Under Minnesota law, a personal automobile insurance policy issued in Minnesota must cover the rental of this motor vehicle against damage to the vehicle and against loss of use of the vehicle.” MINN. STAT. § 2004, ch. 65B.49, subd. 5a at (f), emphasis added. (Note that this provision does not apply to residents of other states when renting a car in Minnesota.)
This mandate transfers the first-party risk of damage to a car rented in any state by a Minnesota policyholder back home to third-party liability pools containing the cars (old and new undifferentiated) of all Minnesotans. Furthermore, recognizing the likely higher value of rental cars than the state’s required minimum $10,000 PDL coverage, the law also mandates that: “In all cases where the plan's property damage liability coverage is less than $35,000, the coverage available under the subdivision must be $35,000.” Id. at (a).
When car rental companies in Maryland proposed an arrangement with a similar cost-shifting effect, the auto insurance industry objected that it “[f]orces Maryland drivers who do not or cannot afford to rent cars to subsidize the cost of claims for those who do rent cars.” Gen. Assemb. Md. Report of The Task Force to Examine Liability Insurance on Rental Vehicles Pursuant to SB 604 of 1996, 10 (Dec. 1996).
41. McNamara, supra note 35, at 47.
19
Guido Calabresi’s Failed Automobile Insurance Case
Working Essay 752 7/6/2006
leading to a liability claim could be established.”42 Even in writing about the study more than twenty years later, McNamara still does not suggest any reason why cars average fewer liability claims per 100 car years as they get older. Apparently, studied blindness43 to the common sense explanation that cars are driven less as they get older44 must be necessary for preservation of the traditional car-year exposure unit and its insurance subsidies to owners of high-annual-miles cars.45 Also necessary to survival of the car-year insurance system is the theory—contradicted by the equal liability insurance prices charged to insure old and new cars—that to gain a competitive price advantage insurers will follow claim statistics.
Nonetheless, categorizing cars by age would be using the category averages as proxy odometers, when the use of real odometers is called for. Despite the large spread in annual mile averages represented by car-age categories, federal surveys show that several million late model cars are only driven a few thousand miles a year while even more older cars are still driven above average miles.46
Car age is not the only major classification insurers have decided to not to use that favors one group of car owners at the expense of another. Men at every age average more miles of driving and proportionately more state-reported accident involvements than
42. Id. 43. The ignoring by auto insurers of individual amounts of accident-producing
activity is paralleled by the public’s blindness as potential jurors to amounts of driving and other activity in evaluating accident records. W. Kip Viscusi and Richard J. Zeckhauser, The Denominator Blindness Effect: Accident Frequencies and the Misjudgment of Recklessness, 6 AM. L. & ECON. REV. 72 (2004). But auto insurers by excluding odometer miles exposure from the denominator of their price structure provide continual authoritative revalidation for the public of the denominator blindness bias that the article recommends eliminating. Id. at 72.
44. Common sense is well supported by federal travel surveys. E.g., comparing the first with the most recent survey of households, the average annual miles per vehicle for 1969 and 2001 was, respectively, 15,700 and 14,892 miles for cars zero to 2 years old and 6,500 and 7,863 miles for cars 10 or more years old, HU & REUSCHER, supra note 21, at Table 22.
45. To deny the existence of subsidies from older to newer cars while accepting the facts that cars are driven less as they get older and pay the same insurance prices per car year, means believing on some unexplained basis that drivers of older cars are much more negligent on a cents-per-mile basis to offset the reduced miles their cars are driven.
46. For example, in a 1995 survey using annualized miles from two odometer readings several months apart, among the household cars extrapolated to be driven less than Marshall’s 2,500 annual miles are nearly 5% of the cars zero to two years old, and 31% of the cars ten or more years old. Similarly among the cars driven more than Taney’s 20,000 annual miles are 8% of the cars ten or more years old, and 21% of the cars zero to two years old. Percentages were read from car-age-group cumulative distribution curves by odometer miles constructed as described supra note 20.
20
Guido Calabresi’s Failed Automobile Insurance Case
Working Essay 752 7/6/2006
women the same age. However, by adjusting the driver age and marital status definitions of price classes, insurers confine pricing by driver sex to a minority of cars.47 Even where such pricing has regulatory approval in all but six states,48 insurers disregard driver sex for three out of four cars by assigning a large majority of cars to the Adult (unisex) classes. That this anomaly continues to be unquestioned shows widespread deference to men as a car owner constituency at the expense of women car owners.
Where insurers do use driver sex, the price classes serve as proxy odometers for the average annual miles of cars categorized by driver age, sex, and marital status.49 But pricing of any or all cars by driver sex is as wildly inaccurate for individual cars as pricing by car age would be.50 In separate distributions of men and women drivers by annual miles and by annual accident involvement probabilities, the miles and probabilities of a sizeable minority of men drivers are less than the averages for women drivers, and concurrently a somewhat smaller minority of women drive more and have a greater probability of accidents than men’s average miles and accident probability.51
47. Butler et al., supra note 13, at 251. In recent years some insurers claim to be
doing more pricing by driver sex over age 30. But the nation’s largest auto insurer, State Farm, is not among them, to judge from class definitions and prices in its current Pennsylvania and New Jersey rate & rule manuals (both effective Feb. 1, 2005). (CD-pdf copies on file with author.)
48. The six states that prohibit the pricing of car insurance by driver sex are Massachusetts, Pennsylvania, North Carolina, Michigan, Montana, and Hawaii. Except for Michigan and North Carolina, the prohibitions were made with reference to the state’s Equal Rights Amendment (ERA). Montana prohibits the use of sex in all lines of insurance, but in the other states the prohibition applies only to auto insurance, which leaves insurers free to discriminate by sex, the state ERA notwithstanding, in medical expense, disability income, life, and old age (annuities) insurance. Title VII protects women in all states from insurance sex discrimination only when the insurance is sponsored by employers of 15 or more.
49. Insurers do not admit to this now, but in 1966, before young men in the 1970s under newly-adopted state ERAs began to challenge pricing car insurance by driver sex, a company officer stated at an industry meeting: “Sex is a way of measuring mileage. . . . The young female . . . is obviously a better insurance risk than her male counterpart if only because her use of the car is substantially less than her male counterpart.” Butler et al., supra note 13, at 256 n. 27.
50. The distribution of cars by annual miles is positively skewed because from three-fifths to two-thirds of cars are driven less than average, overall and for different car age groups. (1995 NPTS age group and overall average miles from Hu & Reuscher, supra note 21, at Table 22. These averages were applied to the cumulative curve distributions of cars by annualized odometer miles constructed as described, supra note 20.) Moreover, using a single annual-miles average to fit all of the cars in a category (individually spread from some at exactly zero to 115,000 annual miles—the most the survey records) because the average may be accurate for a few of them is nearly as irrational as using a stopped clock to tell time because it is accurate twice a day.
51. Butler et al., supra note 13, at 395-401.
21
Guido Calabresi’s Failed Automobile Insurance Case
Working Essay 752 7/6/2006
Finally, if insurers decide not to use some proxy-odometer categories in deference to favored constituencies, then it is logical to expect insurers to use other proxy-odometer categories when the constituencies affected are not so favored. This is true for residents of low income zip codes whose insured cars produce more claims per 100 car years than produced by cars from nearby zip codes.52 As is the case with newer cars and men’s cars, categories producing more claims per 100 car years are evidencing more miles per car. Even though low-income drivers average less driving, the insured cars they share must be driven more than average to account for more than average claims per 100 car years.53 However, unlike the treatment of newer cars and adult men’s cars, insurers do not disregard the differences in claims and therefore do not merge the claims from low-income zip codes with the claims from neighboring zip codes.
When lawmakers and regulators ask why the cars of owners who live in low income zip codes and why the cars of owners who show other signs of needing to economize54 all produce more claims per 100 insured car years, the insurance industry will not suggest any explanation. The industry also specifically denies the existence of
52. E.g., urban area zip codes in Missouri that contain higher black (and
concurrently lower-income) populations average 8.25 liability claims per 100 insured car years which is 36% more than the 6.06 claims averaged by car owners living in the other urban area zip codes. Scott Harrington and Greg Niehaus, Race, Redlining, and Automobile Insurance Prices, 71 J. BUSINESS 439, 454 (1998).
53. The basis for the sharing-insured-cars explanation was described in 1968 by the co-winner of the 1996 Nobel Prize in Economics (for other studies), William Vickrey. In enumerating obvious economic harms caused by charging for insurance as a cost of owning a car, he includes these two: “The premium structure thus has the general effect of promoting excessive use of a given stock of cars and undue stinting on the ownership of cars.” William Vickrey, Automobile Accidents, Tort Law, Externalities, and Insurance: An Economist's Critique, 33 L. & CONTEMP. PROBS. 464, 471 (1968). Although Vickrey notes the harm to the automobile industry (at 471-72), neither he nor any other economist identifies the apparently not-so-obvious harmful feedback effects the insurance price structure must have on some of the prices themselves.
The first theoretical description of how stinting on ownership and excessive use of a given stock of cars produce high insurance prices in low income zip codes was published in a report to the Texas Legislature by Butler in 2000, supra note 12, at 18-19. Drivers who want to economize on automobile insurance buy less of it. Since the purchase unit is a car year (divisible into car days), these drivers first take less-driven, marginal cars out of insurance pools and then they share cars kept insured. But each action constitutes adverse selection against the pools: first by taking more premium than miles out of them, and then by adding miles without premium to them. When insurers react by increasing the price per car in what they call hard-to-serve areas, it can set off an upward spiral of average miles per insured car, claims per 100 insured cars, and the per-car price of insurance.
54. E.g., car owners that have a low military rank, a low credit score, or no prior insurance (allowed car’s insurance to lapse).
22
Guido Calabresi’s Failed Automobile Insurance Case
Working Essay 752 7/6/2006
high-risk drivers as an explanation.55 Although a few researchers have sought an explanation,56 others simply use terms for these high-price-insurance categories that imply that drivers are the reason for more claims per 100 car years. But using names that blame drivers such as “high-cost drivers,” “high-risk drivers,” “bad drivers,” and “reckless drivers” to refer to insurance classes of cars57 that average more claims is tautological, if not unjust and defamatory, and contributes nothing positive to an explanation.
The fact remains that insurers in deciding to use some categories which serve as proxy odometers and not to use others without explanation that could serve equally well as proxy odometers is consistent with the industry’s decision to maintain without explanation the vehicle-year as the exposure unit for personal cars. But researchers are neither constrained by the marketing decisions of insurers nor by unrealistic beliefs58 held by drivers about the
55. This denial was a problem in 2003 for the Texas Senate. It was seeking to
make a distinction between standard market companies and the non-standard, county mutual companies that serve low-income zip codes and what legislators presume to be the high risk drivers in them. In a hearing the committee chairman asked the insurance commissioner for help.
Senator Fraser: “We have had a lot of discussion about in county mutuals of what is defined as a high-risk driver. . . . [C]an the department come up with a definition of high risk?” Commissioner Montemayor: “We can certainly work on something . . . .” Senator Fraser: “The industry is saying it is impossible to define it.” . . . . Commissioner Montemayor: “. . . I think theoretically from a rate setting point, you simply group like risks together and sort of try to rate them in that category. So in theory . . . there's no such thing as a truly high-risk driver . . . .”
Hearing on an Act Relating To Automobile And Residential Property Insurance Rate Regulation. Hearing on SB 14, Senate Comm. on Bus. & Com., 78th TEX. LEGIS. R.S., Feb. 13, 2003. (Transcript by author from on-line video archive http://www.senate.state.tx.us/ram/archive/2003/feb/021303BusComPM.ram at 1:03 to 1:07)
56. Harrington & Niehaus, supra note 52, conclude that “percent minority population is correlated with omitted variables that increase claim costs." Id. at 441. However, they do not suggest what the omitted variables could be and do not mention what would seem to be leading alternative candidates, driver negligence or average miles per car.
In regard to an average miles explanation for 36% more liability claims per 100 car years for low income zip codes (id. at 454), if we suppose that the cars in the other zip codes average 10,000 miles per year, then an average of 13,600 miles would account for the entire difference.
57. The “high risk driver” is a car not a driver. 58. A large majority of drivers believe that they are more skilled or more careful
than average. The belief is not shaken by citations or accidents according to Patricia Delhomme, Comparing One’s Driving With Others’: Assessment of Abilities and Frequency of Offences. Evidence For a Superior Conformity of Self-Bias?, 23 ACCIDENT ANALYSIS & PREVENTION, 493, 503 (1991). This cognitive illusion is
23
Guido Calabresi’s Failed Automobile Insurance Case
Working Essay 752 7/6/2006
irrelevancy of measuring vehicle miles of risk production. Scholarship has no need to avoid engaging with the explanation—which has no non-invidious alternative—for why some insurance categories otherwise inexplicably produce more claims per 100 car years than others: the cars comprising the more-claims categories also average more miles per year.
B. Disregarding the Cost of Car Owning Insurance Reality
Scholars continue to imply that auto insurance is a cost of driving by not being explicit about its being a cost that impinges only on car owning.59 But in The Costs of Accidents, Calabresi is clear that automobile insurance is a cost of owning a car, and accepts the fact without criticizing it.60 In Chapter 5 leading up to the new brakes examples61 he describes a hypothetical situation the result of which absolutely depends on insurance being a cost of car owning.
probably reinforced by the insurance advertisements that promise “good rates for good drivers” and then deliver lower prices to large numbers of new customers.
59. A recent example is the argument made in STEVEN SHAVELL, FOUNDATIONS OF ECONOMIC ANALYSIS OF LAW (2004) at 279 that a liability insurance requirement for drivers of cars “would improve incentives to . . . moderate activity levels . . . .” But implications that the cost of insurance causes less driving are not true in the same sense that the cost of gasoline causes less driving. Since the cost of insurance impinges only on car owning, it can reduce driving only to the extent that sharing cars reduces their availability and to the extent that insurance as a heavy fixed tax on car owning reduces income available to pay for gasoline and other operating expenses.
60. In a few places, however, Calabresi inexplicably implies that liability insurance is a cost of driving. For example, he states that “[u]nder the current system, driving costs depend much more on the likelihood of imposing injuries on third parties . . . .” THE COSTS OF ACCIDENTS at 9 (emphasis added).
In a later work on automobile accident costs Calabresi does not acknowledge that insurance is charged as a cost of car owning and instead calls it a “cost of driving” in Calabresi, First Party, Third Party, and Product Liability Systems: Can Economic Analysis of Law Tell Us Anything About Them? 69 IOWA L.REV. 833, 836-37 (1984).
61. Recall that Chapter 5 was recently endorsed by Richard Posner, supra note 5, as an exemplary “exposition of the basic economics of accident control . . . .”
24
Guido Calabresi’s Failed Automobile Insurance Case
Working Essay 752 7/6/2006
If the cost of all automobile accidents were suddenly to be paid out of a general social insurance fund, the expense of owning a car would be a good deal lower than it is now since people would no longer have to worry about buying insurance. The result would be that some people would buy more cars. . . . [T]hey might be people who could only afford a second car so long as no added insurance was involved. In any case, the demand for cars would increase, and so would the number of cars produced. Indeed, the effect on car purchases would be much the same as if the government suddenly chose to pay the cost of steel used by automobile manufacturers and to raise the money out of general taxes.62
Despite this car-owning-cost example, however, Calabresi goes on in Chapter 5 to imply that to be effective as an incentive to control accident costs auto insurance must be a cost of operating a car. But if this were true, the situation described above—suddenly government pays the cost of all automobile accidents—would have a completely different result. With insurance no longer an operating expense, rather than buying more cars, some people would do more driving. The demand for miles would increase. The effect on driving would be much the same as if the government suddenly chose to pay the cost of gasoline out of general taxes. In fact, Calabresi earlier in Chapter 5 actually makes the point that more driving that would result if gasoline production were subsidized.63
These contrasting results confirm that auto insurance now furnishes incentives affecting only one kind of decision—about buying and keeping cars.64 For accidents in general, however, Calabresi states that free market insurance, or general deterrence, must provide incentives to reduce accident costs in two ways.
62. THE COSTS OF ACCIDENTS at 71, emphasis added and footnotes omitted.
These observations about the effect of insurance on car ownership parallel those made earlier by Vickrey, supra note 53, about the premium structure causing “undue stinting on the ownership of cars.”
63. Id. at 70 note 2. He notes the effect of subsidizing another cost of driving even if driving bears its share of the costs of accidents. “[I]f the petroleum industry were subsidized, we might have too much driving . . . .”
64. In another example Calabresi describes how insurance can determine the number of cars a household owns. Taney will buy a second car if he lives in Sparta where car insurance is not needed because all accident costs are paid from general taxes. But a second car will cost too much if he lives in Athens where the costs of car accidents are paid for by insurance charged as a cost of car owning. Id. at 70-71.
25
Guido Calabresi’s Failed Automobile Insurance Case
Working Essay 752 7/6/2006
The first and more obvious one is that [general deterrence] creates incentives to engage in safer activities. . . . The degree of the shift will depend on the relative difference in accident costs and on how good a substitute the safer activity is. Whatever the shift, however, it will reduce accident costs, since a safer activity will to some degree have been substituted for a dangerous one.
The second and perhaps more important way general deterrence reduces accident costs is that it encourages us to make activities safer.65
Applied to automobile accidents, the first way to reduce accident costs would be sometimes to use good substitutes for driving that are safer activities such as commuting by rail or traveling long distance by airplane. The unacknowledged problem for the incentive to do this, however, is that so long as the car is owned and insured, driving it less makes no difference to the annual cost of insuring it.66 Therefore, traditional automobile insurance is incapable of providing any incentive to shift some travel to other modes.67 As noted above, reclassification of a car from the long-drive-to-work class to the pleasure-only class provides only nominal discounts.68
Calabresi illustrates the second way to reduce accident costs—making activities safer—with the examples of Taney’s and Marshall’s decisions about new-style brakes. In fact, the modeling of these decisions in Part II above shows that incentives for both ways of reducing accident costs are needed: driving the car fewer miles and investing in better brakes. But as the model demonstrates, each way
65. THE COSTS OF ACCIDENTS at 73. The Taney’s new brakes example quoted supra text at note 4 closely follows this introduction.
66. This criticism of auto insurance premiums as lacking an incentive bearing on how much to drive was made earlier by Oliver E Williamson., Douglas G. Olson, & August Ralston, 1967, Externalities, Insurance, and Disability Analysis, 34 ECONOMICA 235, 248 (“[T]he auto insurance premium . . . acts as a lump-sum rather than a marginal tax.”), and simultaneously by William Vickrey in 1968, supra note 53, at 470 (Rates “provide incentives that are largely inappropriate at the margins where decisions are actually made as to . . . whether to make a given trip by car.”) Both of these works are listed in THE COSTS OF ACCIDENTS at 20 n.3 as recent significant articles by economists dealing with the problems of accidents, but are not discussed further. Nothing expressing such a fundamental criticism of auto insurance—no marginal charge for the risk unavoidably produced with each vehicle-mile traveled—seems to have been written since by economists until Aaron Edlin, Per-Mile Premiums for Auto Insurance, in ECONOMICS FOR AN IMPERFECT WORLD 53 (Richard Arnott et al. eds., 2003). However, the criticism was developed independently as the basis for a lawsuit filed against auto insurers in 1986 for their refusal to use the odometer-mile exposure unit for personal cars. From this perspective the criticism has been published in insurance regulation and actuarial journals beginning in 1988 by Butler et al., supra note 13.
67. Of course, not all substitute modes for car travel involve safer activities on the basis of cents-per-mile risk. A shift to bicycle commuting might increase accident costs per mile and overall.
68. See supra text accompanying note 23.
26
Guido Calabresi’s Failed Automobile Insurance Case
Working Essay 752 7/6/2006
would require its own decision variable. First, an exposure unit variable measuring individual values is necessary to provide the incentive to drive an individually efficient number of miles. Second, a class risk-rate variable must price the cost per mile to inform ownership decisions about safety devices and vehicle types.69 Although Calabresi above judges that the first variable is more
69. Calabresi introduces the issue of vehicle type early in THE COSTS OF
ACCIDENTS at 9. He describes the effect on the insurance cost of owning different types of cars as a consequence of changing from a third party insurance system to a first party system:
[I]nsurance would be cheaper for owners of the Juggernaut Eight, which is likely to crush all that comes in contact with it but leave its passengers unhurt, or owners of the Safety Six, which has many expensive devices to protect the riders, and more expensive for owners of the Foreign Fly, which barely scratches what it hits but is likely to collapse on contact with a Juggernaut.
But attempting under either system to value risk as a function of vehicle type on an annual basis cannot provide any but degraded incentives (at best) to affect vehicle choice because each car owner actually has two interdependent decisions to make, not just the kind of vehicle but also how much it will be driven. For example, by analogy to the Part II model above, Marshalls would produce less total annual risk (third plus first party) by driving high-risk-rate Juggernaut Eights only 2,500 miles than Taneys would produce by driving low-risk-rate Safety Sixes or Foreign Flys 20,000 miles.
Under an odometer-mile insurance system, high cents-per-mile prices (or “low risk efficiency”) would affect car buying decisions the way low fuel efficiency always has. Marshalls might purchase heavy old Juggernaut Eights with poor risk and fuel efficiencies because these characteristics make them cheap cars to buy, and low miles of use will keep insurance and gasoline expenditures low.
Finally, with respect to third-party versus first-party insurance systems to pay for bodily injuries, Mashaw & Harsft, supra note Error! Bookmark not defined., at 218-19, blame the predominance of third party insurance for dulling incentives to buy passenger-protective safety devices like airbags, whereas White, supra note 31 at 350-52, blames first party insurance for dulling third party liability insurance incentives against buying heavy cars. Several scholars have suggested that the first versus third party dilemma might be solved by dividing the injury costs of each accident among the cars involved (and their insurers). E.g., Calabresi in The Decision for Accidents: An Approach to Nonfault Allocation of Accident Costs, 78 HARV. L. REV. 713, 740 (1965) suggests that “[t]he cost of each accident might be divided pro rata among the activities involved and then cumulated for each activity.” (Emphasis added.) Although in this earlier article Calabresi does not discuss the insurability of different activities, accumulating claim costs by the pools to which vehicles are assigned is what traditional insurance has always done to set car-year prices. But accumulating costs over a time period is not enough to evaluate the risks of using different types of vehicles. The total miles driven in the same time period to produce those pooled costs must also be accumulated to calculate risk rates on a cents-per-mile basis. The analysis of this Essay shows that the solution to the dilemma of Juggernaut Eights versus Safety Sixes versus Foreign Flys (not to mention each of them versus trucks and motorcycles) absolutely depends on being able to compare costs by vehicle type and other risk categories on a cents-per-odometer-mile basis.
27
Guido Calabresi’s Failed Automobile Insurance Case
Working Essay 752 7/6/2006
obvious and that the second may be more important, in fact they perform inseparable interdependent functions for measuring the risk produced by operating an automobile. Neither variable can function without the other and both are essential for assessing individual cost.70 Today in effect each class’s annual premium rate is based on the product of the measurable but now unmeasured class averages of these two variables: (the class’s cents-per-mile risk rate) times (the class’s average annual miles per car). But merged, as insurers do, this product of two averages can only inform decisions about whether or not to own and insure a car.
The general practice of viewing driving risk from a traditional insurance perspective as a lump-sum cost of car ownership71 is what probably led to overlooking Marshall’s accident cost in the new-style-brakes example. Because Calabresi specifies Taney’s reduced risk as
70. Williamson et al., supra note 66, at 247-48, also conclude that the failure of
auto insurance premiums to vary with the amount of accident-producing activity impairs incentives to invest in safety devices. As a remedy, however, they recommend government safety-device mandates (id. at 248), which Calabresi’s Marshall example shows would increase individual and social costs.
71. By working with lump sum valuations, law and economics textbooks tend to merge the effects of miles of driving (activity level) with the per-mile effects of alleged care (care level) into single values. For example, A. MITCHELL POLINSKY, AN INTRODUCTION TO LAW AND ECONOMICS (3rd Edition, 2003) at 52 values three levels of care and two amounts of miles as six categories of accident cost ranging in discrete steps from $20 to $130.
But the need for a separate measure of miles has also been recognized in textbooks. ROBERT COOTER AND THOMAS ULEN, LAW AND ECONOMICS (4th Edition, 2004) at 333 assumes that liability law can influence care (but does not specify a per-mile measure of the effects of care on risk), and also identifies the need to influence activity level, suggesting two alternatives:
To hit two policy targets, two controls are usually required, just as two stones are usually needed to hit two birds. Thus, an additional control variable from outside liability law may be needed to control activity levels. For example, the number of miles driven by motorists can be influenced by a gasoline tax or an insurance policy whose premiums increase with the number of miles driven.
Although both ways to control activity levels—through the gasoline-gallon or the odometer-mile—were listed in 1929 by Dorweiler, supra note 11 at 338, as possible alternative exposure units to the car-year unit for automobile insurance, they differ profoundly in ability to value driving risk. The cents-per-odometer-mile charge would vary according to the car’s risk category and coverage. But unless each car was identified at the pump, an insurance tax would be a single value, e.g., $1.05 per gallon. There would be no price incentive for choosing safer vehicles (except crudely, or perversely, with fuel efficiency). In sum, an insurance tax on gasoline would exchange today’s categories-only, no-exposure-measure system for an equally perverse exposure-measure-only, no-categories system. Or, in terms of the two birds analogy above, instead of supplying the two stones needed, the current one-size-fits-all stone simply would be exchanged for a different one-size-fits-all stone.
28
Guido Calabresi’s Failed Automobile Insurance Case
Working Essay 752 7/6/2006
“$100 per year in accident costs he will avoid,”72 it may seem that Marshall with the same new brakes will be able to avoid his entire $25 per year in accident costs with the old brakes. However, this kind of misperception would be prevented by seeing an improvement in vehicle safety in engineering terms as lowering the cost of risk per mile and also by seeing that risk and its cost is produced at a measurable rate with each mile driven.
C. Calabresi’s “Organized Activity” Criterion
The potential of insurance cost to affect decisions plays a key role in Calabresi’s analysis of how to allocate the costs of accidents involving cars and pedestrians. Although the following passage refers to insurance costs that “affect behavior,” it does not mean the ex post premium surcharge for being at fault in an accident, the threat of which is supposed to affect behavior by deterring faulty driving. Calabresi means that insurance cost should be able to affect decisions about how much—as well as how, e.g., by vehicle type—to engage in risk producing activities like walking and driving.
[T]he fault system’s concentration on whether the particular pedestrian or driver could avoid the accident most cheaply ignores the fact that because of insurance, neither will actually bear the accident costs. And the breadth of the insurance categories that will actually bear the costs and therefore affect behavior depends not only on the difference in accident-cost causing potential of the members of the category, but also on the cost of differentiating these members into subcategories and selling insurance to such differentiated groups. This in turn depends on whether the loss is placed on an organized activity such as driving or on an unorganized activity such as walking . . . .73
In this passage, Calabresi distinguishes between activities that are organized—presumably like driving—so that they can be specifically insured as such and unorganized activities like walking that can only be insured as part of the overall cost of health insurance. The distinction is critical because the cost of health insurance cannot be brought to bear at all on day-to-day decisions on whether or not to walk, or even whether to make the trip at all.
Although he does not discuss what it is that makes driving organized and insurable and walking not, Calabresi gives examples that emphasize the feasibility of categorizing drivers and cars.
72. THE COSTS OF ACCIDENTS at 74. 73. THE COSTS OF ACCIDENTS at 248. Emphasis added.
29
Guido Calabresi’s Failed Automobile Insurance Case
Working Essay 752 7/6/2006
In theory, if the cost of [car-pedestrian] accidents is put on drivers, insurance rates will reflect not only the difference in accident-proneness of different categories of drivers (teen-age drivers, city drivers, extra-mileage drivers, etc.), but also the safety of the cars they drive (old cars, cars with special brakes, cars with seat belts, etc.). . . . In practice, however, the decision to put such accident costs on drivers makes any substantial categorization by type of car too expensive . . . .74
With its focus on drivers, however, Calabresi’s description differs from auto insurance practice in which the car, and not each of its drivers, is the entity classified and therefore the entity to which premiums and claim costs attach. Before coverage begins, the insurer assigns the car to a class pool according to both car and driver criteria.75 However, the cost of a subsequent claim paid under the coverage is assigned to the car’s class pool whether or not the driver who was driving when the claim was incurred is the driver whose
74. THE COSTS OF ACCIDENTS at 105-06. Calabresi is correct that
categorization cannot be done to any degree desired, but expense is not the problem so long as categories are objective, verifiable, and make sense to car owners. In fact, the limit to the number of insurance categories is the rapid decrease in year to year statistical stability of thinly occupied insurance accounting cells as the number of cells increases rapidly with number of categories, regardless of the mix of driver and car categories used. If each of the six kinds of category suggested in the quotation is binary (teen or not-teen driver, old or new car, etc.), the number of cells increases by the power of two with each kind, 8 cells for the driver and car categories separately, or 64 cells for the combined categories. Lack of stability over time from trying to use too many categories is a major constraint for actuaries who describe it as: “You can slice the cake this way, or you can slice it that way, but if you slice it this way and that way, what do you get? Crumbs.” The credibility limitation to the degree of insurance sub-classification was given a textbook discussion for the law literature by C. Robert Morris, "Enterprise Liability and the Actuarial process: The Insignificance of Foresight," 70 Yale L. J. 554, 563 (1961).
When the various classes of risk are so finely subdivided, the amount of a particular enterprise's experience in each class can become so small that the law of averages can no longer be applied to it. One robin does not make a summer, and five paid claims do not indicate much about the level of risk. In the language of actuaries, it is no longer "credible."
Morris also notes that “[i]n the automobile liability field . . . it is considered necessary to have experience involving at least 1084 losses before the experience can be judged completely credible. A lesser amount of experience is not totally useless, but is weighed according to a sliding scale.” Id. Morris points out that fifty percent credibility requires 271 claims.
75. Under insurers’ traditional classification rules, the household car with the largest base premium (e.g., $800) has the household driver with the largest multiplier (e.g., 1.5 for a young occasional driver) applied to it. The car with the next largest base premium (e.g., $400) has the next highest multiplier applied (e.g., 0.85 for an adult driver), and so on through all of the cars on the policy. However, some insurers alter these assignment rules to lessen their impact, or may offer alternative arrangements such as Named Driver Exclusion riders where legal.
30
Guido Calabresi’s Failed Automobile Insurance Case
Working Essay 752 7/6/2006
characteristics determined the car’s classification.76 Finally, the premium rate for each class refers not to the driver-year exposure unit but to the car-year unit.
Instead of the car-year exposure unit, however, insurers might just as well have chosen the driver-year unit. Drivers are licensed and have verifiable characteristics that can be used to define price classes such as some of those Calabresi suggests: teen-age drivers and city-resident drivers. (But “extra-[future]-mileage drivers” and cars cannot form objective, enforceable insurance price classes.) Just as driver characteristics serve to define car classes, car characteristics could be used to define driver classes using the driver-year as exposure unit.77 In fact, because pedestrians can be classified variously as teen-age pedestrians and city-resident pedestrians, pedestrians although not licensed to walk are nearly as well organized entities by the classification feasibility criterion as drivers and cars. But amenability to categorization is not a sufficient condition to make a risk-producing activity specifically insurable.
In order that insurance cost can affect decisions, a necessary condition is individual recording of the amount of accident-producing activity. A city teen-age pedestrian who walks 500 miles has produced twice as much risk of car-pedestrian accidents, all else made equal by classification, as a city teen-age pedestrian who walks half that distance. Similarly a city driver who drives one or several cars a total 10,000 miles produces twice as much car-pedestrian accident risk as the city driver who drives half the distance. However, neither pedestrians nor drivers wear odometers to record the amounts of their activity. Therefore neither walking nor driving various cars can be made specifically-insurable organized activities.
76. Claims from occasional sources such as collision damage done to a rental
car being driven by a household driver are also paid (less deductible) and charged to a household car’s insurance pool, along with claims representing excess liability coverage on rented or borrowed cars. For an example of a legislative mandate to assign the cost of damage done to a rented car to the liability insurance pool of the renting driver’s own car, see supra note 40.
77. Proposals to insure the driver instead of the car appear occasionally. For example, pursuant to Pennsylvania Act 6 of 1990, Section 29, the Joint State Government Commission in 1991 produced its “Insure-the-Driver Program” study. (Copy is on file with author.) The study notes adverse effects on insurance cost in households with more drivers than cars and on “licensed drivers who rarely or never drive, such as people who . . . want to be authorized to drive in case of an emergency.” Id. at 36. However, the study also notes the current analogous predicament of households with licensed cars rarely or never driven.
Just as state mandatory insurance requirements now have trouble accommodating significant numbers of cars that are not driven for months, mandatory insurance for drivers would encounter similar administrative and enforcement problems with the licensed drivers who do not drive for months, or never drive.
31
Guido Calabresi’s Failed Automobile Insurance Case
Working Essay 752 7/6/2006
But, like Taney’s car, each car has an odometer. Of the many activities that produce automobile accident risk, the only one whose amount is already measured and recorded is that of operating a specific car. While a specific car is the entity that insurers currently insure, they disregard its odometer and charge for the average cost of the full time activity of owning the car. Although owning a car can be insured for the risk that operating the car produces, simply owning the car does not produce any accident risk. An insurer’s categorical information about an insured car and its drivers provides no information about how much the car is operated. As it currently stands with auto insurance charged as a cost of owning a car, no activity involved in automobile accidents meets Calabresi’s “organized activity” criterion.
D. Conclusion
THE COSTS OF ACCIDENTS presents a vision of insurance costs that accurately guide individual “decisions for accidents.”78 This free-market (or “general deterrence”) approach is one of the two approaches Calabresi describes for the control of accident costs. The other is the collective (or “specific deterrence”) approach which aspires to control the costs of accidents through the political process.79 An example of the collective approach is mandating that Taneys and Marshalls with presumably indistinguishable cars invest in the new-style brakes. Calabresi’s unsung case against such collective decisions is his demonstration that, although the safety-device mandate would reduce driving risk and thus accident costs, it would increase society’s (and Marshall’s) total costs.
As the alternative to the collective approach, Calabresi describes the logic of the free-market, general deterrence approach.
General deterrence implies that accident costs would be treated as one of the many costs we face whenever we do anything. Since we cannot have everything we want, individually or as a society, whenever we choose one thing we give up others. General deterrence attempts to force individuals to consider accident costs in choosing among activities. The problem is getting the best combination of choices available. The general deterrence approach would let the free market or price system tally the choices.80
78. THE COSTS OF ACCIDENTS at 68. Calabresi implies that each decision to
engage in an accident-risk-producing activity like operating a car is actually a statistical decision for accidents. This meaning is made entirely clear in Calabresi The Decision for Accidents, supra note 69, at 716-21.
79. Calabresi explains that “[t]he collective decisions are enforced by penalties on those who violate them.” THE COSTS OF ACCIDENTS at 69.
80. Id.
32
Guido Calabresi’s Failed Automobile Insurance Case
Working Essay 752 7/6/2006
In the context of traffic accident costs, the barrier to the free-market tallying of choices which this Essay identifies is that traditional auto insurance does not measure the cost of individual risk.81 Therefore, the first step in redeeming Calabresi’s vision that decisions need to be guided by accurate insurance cost is the acknowledgement that today’s auto insurance charged as an expense of owning a car produces no information on the risk of operating a car, and nothing but wrong incentives for optimizing the costs of accidents.
81. Some readers might object that this Essay unjustly faults insurers for not
accomplishing the impossible task of evaluating individual differences in negligence. Recall that the model in Part II assumes that the entire difference in the annual accident costs Calabresi assigns to the Taney and Marshall cars ($200 versus $25) is due to an eight times difference in annual miles (all else, like driver age and regional geography, made equal by classification). But if the cars were assumed to be driven the same annual miles, the entire difference could be attributed to an eight times difference in their negligence rates per mile. (Taney might be unobservably “accident prone” and Marshall not.) Formally, this alternative assumption has equal status with the adopted assumption because annual accident cost is expressible as the product of observable annual odometer miles times a cents-per-mile risk (or negligence) rate. But recent analysis of the long-established insurance fact that fault is predictively irrelevant comes down strongly on the side of an individually-observable difference in annual miles as an assumption that conforms with reality while it conflicts with reality to assume that intrinsically-unobservable individual differences in per-mile negligence rates are revealed through accident history. See, Patrick Butler, 2005, Proof That Auto Insurance Pricing by Accident Record Predicts Miles Not Negligence: Fault Is Predictively Irrelevant (working paper #753, January 2005).
33